


Abstract
Healthcare service providers face recurrent systemic disruptions (e.g., pandemics, reimbursement delays, supply shortages, and regulatory shocks), yet firm-level resilience monitoring remains underdeveloped due to limited explainability and weak out-of-time validation in prior work. We develop an explainable machine learning pipeline to predict firm-level financial resilience (a financial health/robustness proxy) for outpatient healthcare providers. Using annual data for 2600 Romanian firms (Nomenclature of Economic Activities - NACE 8622) over 2014–2023, resilience is operationalised as an ordered three-class label derived from a Principal Component Analysis (PCA)-based composite score built from eight capital structure and asset composition ratios, with train-only frozen thresholds and a strict anti-leakage protocol. We evaluate multinomial logistic regression (baseline), Random Forest (RF), and HistGradientBoosting (HGB) (primary) on a prospective 2023 hold-out using Accuracy, Balanced Accuracy, and Macro-F1, with bootstrap uncertainty for key contrasts. The primary model achieves Balanced Accuracy = 0.943 and Macro-F1 = 0.944 in 2023, outperforming the linear baseline and RF; errors concentrated between adjacent classes. Model-faithful permutation importance on HGB highlights working-capital disciplines (receivables, cash, inventory, asset structure), while RF–SHAPley Additive Explanations (SHAP) is used only for auxiliary pattern exploration and stability checks, with Individual Conditional Expectation (ICE)/Partial Dependency Plot (PDP) confirming key nonlinear regimes on HGB. Overall, the results support governance-ready, interpretable resilience monitoring while maintaining a clear separation between predictive explanations and causal claims.
1. Introduction
Global healthcare systems have been increasingly exposed to systemic disruptions, ranging from pandemics and international instability to supply shortages, financial stress, and regulatory pressure. These shocks have revealed structural vulnerabilities not only in healthcare supply chains but also at the firm level, where pecuniary fragility, operational rigidity, and sustainability challenges may seriously undermine service continuity [1]. In this context, organisational resilience has become a central concept to understand how healthcare service providers can anticipate, absorb, and recover from adverse events while continuing essential functions [2]. In this study, we use firm-level financial strength as the target variable. It is a financial proxy derived from accounting indicators, obtained through Principal Component Analysis (PCA), discretised into three classes using train-only quartile-based cut-offs (P25/P75) computed on the training set and applied unchanged to 2023. We do not directly assess service continuity or operational recovery times.
Traditionally, resilience inside healthcare and related service sectors has been assessed using linear financial indicators, qualitative frameworks, or descriptive scorecards. While such approaches provide useful benchmarks, they commonly do not capture the nonlinear, interactive, and changing nature of resilience mechanisms, especially when financial, operational, and sustainability dimensions interact. Recent research increasingly argues that resilience cannot be understood as a purely financial construct, but rather as a multidimensional phenomenon closely linked to environmental and social performance, regulatory compliance, and long-term adaptability [3,4].
Parallel to this conceptual shift, advances in artificial intelligence (AI) and machine learning (ML) have opened new possibilities for resilience analysis. Ensemble learning methods, such as Random Forest (RF) and Gradient Boosting, have demonstrated relevance to resilience performance in complex decision environments, including healthcare, supply chains, and risk management. These models pertain to resilience in handling large-scale data, nonlinear relationships, and heterogeneous firm behaviour [5]. Nonetheless, their adoption in healthcare-related decision-making remains disputed due to concerns about transparency, accountability, and trust.
This tension has fuelled a continuing debate in the literature between predictive accuracy and explainability. While black-box ML models often outperform traditional econometric approaches, their limited interpretability poses challenges in regulated and high-risk domains such as healthcare. As a response, Explainable Artificial Intelligence (XAI) has arisen as an important research direction, striving to make complex ML models transparent, interpretable, and usable for decision support. Feature attribution techniques, such as SHAP (SHAPley Additive Explanations) and permutation importance, are increasingly used to bridge the gap between predictive performance and interpretability.
Existing firm-level resilience and financial distress studies typically fall into three modelling families. Parametric/econometric models (e.g., linear or logistic specifications) offer transparency, stable inference, and straightforward governance, but they often underfit heterogeneous tabular data by imposing linearity and limited interaction structure, which can miss threshold and regime effects common in financial indicators. Nonparametric ensemble models (e.g., RF and Gradient Boosting) capture nonlinearities and high-order interactions and tend to achieve stronger predictive performance, but they are frequently criticised for limited interpretability and fragile conclusions when targets are constructed from the same accounting domain as the predictors. Post hoc XAI methods (e.g., permutation importance, SHAP) improve auditability, yet explanations can be sensitive to multicollinearity and distribution shift and must be evaluated for stability and fidelity. Consequently, prior studies often trade off either predictive validity (insufficient out-of-time testing) or interpretability (insufficiently validated explanations), motivating the present work’s emphasis on strict temporal validation, anti-leakage target construction, and robust explanation summaries.
Despite these advances, several gaps remain. First, empirical studies that integrate financial, operational, and sustainability indicators into ML-based resilience models remain scarce, particularly at the firm level. Second, healthcare service providers, unlike manufacturing or transport firms, are underrepresented in resilience assessment, even though they operate in highly regulated, socially critical environments. Third, many existing studies either prioritise predictive performance without addressing explainability or focus on interpretability, lacking detailed validation under realistic forecasting scenarios.
In line with this background, this study proposes a hybrid machine learning and explainable AI system to predict firm-level financial resilience in healthcare services. Using firm-level data from Romanian companies operating in specialised medical activities, the study combines ensemble ML models with strict anti-data-leakage protocols and out-of-time validation. Resilience is operationalised as a categorical outcome, allowing strong classification into low-, medium-, and high-resilience profiles. To guarantee transparency and practical relevance, the predictive systems are complemented with XAI techniques that identify key financial and sustainability-related drivers and disclose nonlinear and interaction effects.
This study aims to develop and validate an explainable machine learning framework to predict firm-level resilience regarding healthcare services using an out-of-time evaluation design. We pursue the following objectives:
- Define and validate a firm-level financial-resilience construct suitable for early warning in outpatient healthcare services.
- Quantify out-of-time predictive accuracy relative to a transparent linear baseline, to establish whether the approach is decision-useful under realistic timing.
- Identify the most informative domains, like working capital, capital structure, profitability, and sustainability, and describe how they relate to higher vs. lower resilience profiles.
- Check robustness and governance readiness by verifying that the main signals are stable and consistent across explanation summaries.
- Translate findings into managerial implications regarding monitoring and early intervention at the firm level in healthcare services.
The main contributions of this research are threefold. First, it demonstrates that ensemble ML models outperform linear baselines by a significant margin in predicting healthcare resilience. Second, it offers empirical evidence that working-capital structures are central, nonlinear drivers of resilience, and environmental performance indicators are informative, with mixed incremental gains. Third, it shows how explainable AI techniques can transform black-box predictions into practical insights, thereby supporting the deployment of trustworthy, responsible AI in healthcare decision-making. Overall, the study illustrates the promise of explainable machine learning frameworks for resilience monitoring and decision support in healthcare services, with relevant methodological and practical contributions to AI, sustainability, and healthcare management.
The paper starts with Section 2, which reviews the literature on healthcare resilience, machine learning, and explainable AI. Section 3 details the data, target operationalisation, modelling pipeline, validation, and explainability setup. Section 4 reports predictive performance, global importance, and SHAP-based analyses. Section 5 discusses implications and limitations. Section 6 concludes with the main findings and contributions to the literature and healthcare management.
2. Literature Review
2.1. Resilience and Sustainability in Healthcare Services
This study centres on firm-level healthcare services (Nomenclature of Economic Activities—NACE 8622, outpatient units), yet draws on the healthcare supply chain literature as a mechanistic lens rather than as the object of analysis. Outpatient providers depend on upstream procurement (pharmaceuticals, disposables), inventory policies, and payer receivables cycles, all of which shape working-capital discipline and capital structure, the very domains reflected in our predictors (inventory/TA, receivables/TA, cash, debt structure). So we adapt supply chain resilience constructs (exposure, buffering, recovery) to a firm-level financial setting. Importantly, our outcome is financial resilience (a PCA-based proxy); we do not directly measure service continuity or operational uptime.
Supply chain resilience has emerged as an important research theme, particularly in healthcare sectors, where disruptions can have severe economic, operational, and social consequences [1,5,6]. Resilience is generally defined as a system’s capacity to anticipate, absorb, adapt to, and recover from disruptions while sustaining core functions and performance levels. In healthcare and pharmaceutical contexts, resilience is progressively seen as inseparable from sustainability, given compliance pressures, ethical responsibilities, and the essential nature of healthcare services.
Recent systematic reviews emphasise that healthcare supply chains exhibit clear vulnerability patterns due to demand uncertainty, regulatory constraints, perishable inventory, and life-critical service requirements [7,8]. While early resilience studies relied primarily on linear financial indicators and qualitative evaluations, contemporary research emphasises the need for data-driven, multidimensional approaches that integrate financial, operational, and sustainability-related factors [9].
The literature further indicates that firms with stronger sustainability profiles, particularly in environmental and resource-efficiency dimensions, tend to show greater adaptive capacity and faster recovery following disruptions. However, empirical evidence remains fragmented, and healthcare service providers are underrepresented in firm-level quantitative resilience studies, particularly those that apply specialised analytical techniques.
2.2. Machine Learning for Resilience and Risk Assessment
The increasing complexity of supply chains has sped up the adoption of machine learning (ML) methods for resilience assessment, risk prediction, and decision support. Compared with traditional econometric and rule-based approaches, ML models are better suited to modelling nonlinear relationships, high-order interactions, and threshold effects commonly observed in financial and operational data.
Recent reviews confirm the excellent predictive performance of ensemble algorithms, such as RF, Gradient Boosting, and related boosting algorithms, in supply chain and healthcare applications [10,11,12,13]. These models are especially effective in multiclass classification problems and within environments characterised by heterogeneous firm behaviour and data imbalance.
In post-crisis and post-pandemic contexts, ML techniques have been shown to improve anticipatory capabilities, enhance recovery planning, and support scenario-based decision-making [6,14]. Nevertheless, the widespread adoption of ML in healthcare and sustainability-oriented domains remains limited by concerns about transparency, explainability, and regulatory compliance [15].
2.3. Explainable Artificial Intelligence: Concepts and Taxonomies
Explainable Artificial Intelligence (XAI) has arisen as a response to the opacity of complex ML models. XAI aims to make model behaviour understandable to human stakeholders without substantially compromising predictive accuracy. Foundational surveys emphasise that interpretability is a multidimensional concept, encompassing transparency, fidelity, stability, and usability, rather than a single measurable property [16,17,18].
Comprehensive taxonomies distinguish among model-specific and model-agnostic approaches, local and global explanations, and post hoc versus intrinsically interpretable models [19]. Among these, feature attribution techniques (such as SHAP, permutation importance, and Local Interpretable Model-agnostic Explanations—LIME) have become prominent for their usefulness in complex ensemble models and structured tabular data [10,20]. The literature often cites SHAP as a well-founded attribution method, given its axiomatic roots in cooperative game theory and its ability for both local and global explanations [16,17].
2.4. Feature Attribution and Interpretation in Structured Data
In structured, firm-level datasets, feature-attribution methods are especially useful for uncovering nonlinear and interaction effects, as well as decision thresholds. Studies focusing on industrial, financial, and healthcare datasets illustrate that SHAP dependence and interaction plots enable in-depth exploration of how specific variables influence model outputs over different regimes [15].
However, several limitations are also reported. Attribution methods may be unstable under multicollinearity and sensitive to shifts in data distribution, leading to misleading interpretations if applied uncritically [21,22]. Consequently, recent research recommends combining multiple explainability methods to triangulate results and increase robustness.
In resilience and sustainability contexts, where decision-makers require actionable insights rather than purely descriptive explanations, the ability to link feature significance to operational and financial levers is particularly critical.
2.5. Evaluation Measures for Explainable AI
While XAI methods have advanced rapidly, their evaluation remains an open research challenge [23,24]. Traditional predictive performance measures, including Accuracy or F1-score, are insufficient to assess explanation quality. As a result, a growing body of literature focuses on defining and systematising evaluation measures for XAI.
Systematic reviews identify multiple evaluation paradigms, including functionality-grounded, human-grounded, and application-grounded approaches [25]. Functionality-grounded metrics assess properties such as fidelity, stability, robustness, and completeness without human involvement, rendering them appropriate for large-scale empirical studies [21,26].
Recent contributions further argue that the proliferation of XAI metrics may lead to redundancy and ambiguity, advocating parsimonious, context-specific metric selection [23,24,27]. The literature converges on three requirements for explanation quality in high-risk tabular settings: fidelity (explanations must reflect the model’s actual reliance), stability (explanations should be reproducible under plausible resampling), and parsimony (compact, decision-useful artefacts with a clear global-vs-local role). We adopt these requirements as design criteria, their concrete implementation being described in Section 3.
2.6. XAI in Healthcare and Sustainability-Oriented Decision-Making
In healthcare and sustainability-oriented settings, explainability is a practical requirement for auditability and decision justification, especially when models support managerial or policy decisions under regulatory scrutiny (e.g., the General Data Protection Regulation—GDPR) [28,29]. In sustainability research, XAI helps relate financial, environmental, and social indicators to performance and resilience outcomes, improving the actionability of ML outputs by highlighting trade-offs between economic robustness and sustainability objectives [4]. These constraints motivate our emphasis on model-faithful global summaries and robustness checks, as described in Section 3.
2.7. Research Gap and Positioning of the Present Study
To synthesise representative recent work at the intersection of healthcare resilience, ML-based prediction, and explainable AI, Table 1 summarises selected studies and highlights recurrent methodological gaps. This synthesis motivates the positioning and design choices of the present study.
Table 1.
Representative recent studies on healthcare/supply chain resilience, ML-based risk/resilience prediction, and explainable AI, highlighting common validation and explainability gaps addressed by the present work.
As summarised in Table 1, the reviewed literature indicates three persistent gaps: (i) few firm-level studies integrate financial and sustainability indicators into a unified ML-based resilience framework; (ii) healthcare service providers remain underrepresented relative to manufacturing/logistics contexts; and (iii) although XAI evaluation is increasingly discussed, it is rarely operationalised in applied resilience work.
To address these gaps, we propose and validate an explainable modelling pipeline for outpatient healthcare firms (NACE 8622) that (a) uses a transparent, PCA-derived resilience proxy with strict anti-leakage rules and frozen train-only thresholds, (b) adopts out-of-time evaluation on a prospective 2023 hold-out with uncertainty reporting for key contrasts, and (c) delivers governance-ready explanations by combining model-faithful global importance on the primary model with stability/robustness checks and targeted nonlinear validation (ICE/PDP where relevant).
3. Materials and Methods
3.1. Data and Methods
3.1.1. Learning Objective and Optimisation
This study adopts a machine learning-centric research design aimed at predicting firm-level financial resilience in healthcare service systems. Given the complex, nonlinear, and interactive nature of financial and managerial dynamics in healthcare, classical linear models are used only as benchmarks. At the same time, the core analytical contribution relies on tree-based machine learning algorithms and explainable AI techniques.
We compile a ten-year firm-level panel dataset from the Romanian Ministry of Finance, using publicly available annual financial statements for entities classified under NACE 8622. The dataset covers 2600 firms over 2014–2023, yielding 26,000 firm-year observations (Table 2). The unit of analysis is the firm-year, with all variables aggregated at the annual level to reduce short-term volatility. Source variables include income statement and balance sheet aggregates (e.g., turnover, gross/net profit, revenues, expenses, liabilities and equity, share capital, property and equipment, current/total assets, inventory, receivables, cash and cash equivalents, liabilities, and provisions), as well as operational proxies (employees) from which we derive standard financial ratios and composite sustainability scores (financial/social/environmental dimensions). The ordered three-class resilience class (low/medium/high) is defined using train-only quartile-based cut-offs applied to the PCA score, as detailed later.
Table 2.
Dataset coverage, diversity, and data-quality summary.
The panel spans a full decade and captures substantial heterogeneity in firm scale and financial structure. Figure 1 summarises the temporal coverage and annual class composition, while Figure 2 illustrates firm-size dispersion (turnover, assets, employees), highlighting sample heterogeneity.
Figure 1.
Temporal coverage (a) and class composition by year (b).
Figure 2.
Firm-size dispersion for turnover (a), total assets (b) and employees (c).
The methodological model follows a sequential process consisting of data preparation, resilience classification, feature selection under strict anti-leakage rules, supervised machine learning modelling, out-of-time validation, and model explainability analysis. Guided by the principles in Section 2.5 and Section 2.6, we implement the framework as follows:
- Target and anti-leakage: Resilience is an ordered three-class outcome from a PCA-based composite score, with train-only quartile cut-offs (2014–2022) frozen for 2023.
- Primary model and faithful global explanations: The primary predictor is HGB, explained using permutation importance for governance-ready global signals.
- Pattern exploration and robustness: RF-SHAP is used for nonlinear/interaction pattern exploration, with key effects validated on HGB (ICE/PDP where relevant) and agreement quantified via Spearman and Jaccard@k.
We quantify explanation stability using Spearman rank correlation (global rankings), Jaccard@k overlap (k = 5, 10) for top features, and Kendall’s W for domain-level concordance. Local–global alignment is reported as the share of cases in which the top-1 local driver falls within the global top-k. Implementation details (PCA, thresholds, model training/validation, plots) are provided in the subsequent subsections.
The empirical analysis is based on a firm-level dataset covering Romanian companies operating in specialised medical activities (NACE 8622). The dataset contains annual-aggregated observations over the period 2014–2023, reducing short-term volatility and improving the stability of machine learning predictions. Available variables include:
- Financial performance indicators (turnover, revenues, expenses, profits);
- Balance sheet structure variables (assets, liabilities, provisions, liquidity);
- Operational indicators (number of employees, inventories);
- Composite financial, social, and environmental sustainability scores.
The construction of the sustainability score follows [4,5], which integrate financial, social, and environmental dimensions into a composite index, with justifications for materiality and discussions of robustness/weighting (equal vs. PCA-based). For full reproducibility, Appendix A details the indicator definitions, data sources, and the complete standardisation/aggregation pipeline used to construct the sustainability score. This paper presents these principles combined and adapted to the healthcare sector (CAEN 8622), as follows: (i) we kept the logic of the scores by dimensions and aggregation from similar works, (ii) we used frozen scaling on the training set (train-only) for temporal comparability, (iii) we clearly documented the mapping of the researched indicators.
Thus, we use three pillars: financial (40%), social (30%), and environmental (30%). The higher weight for the financial component indicates its role as an enabler of the transition (an argument found in both sources). It is kept to preserve uniformity and comparability, with sensitivity analyses reported separately. We Winsorise the inputs at 1%/99% per train, impute the median gaps per train, standardise and map the indicators to [0, 1] using the CDF estimated per train, and apply the same “frozen” transformations to 2023 (anti-leakage). The score of each dimension is the weighted average of the sub-indicators (equal weights in the basic specification), and the total score is the weighted average of the three dimensions. To ensure comparability across years and firms, all transformations (Winsorization, standardisation, CDF/alternative weights) are calibrated exclusively on the train (≤2022) and applied as such to 2023; we do not re-centre on the test. We report Δ-mean/Δ-sd 2023 vs. train as a calibration check.
Firm-level financial resilience is operationalised as a categorical variable (resilience class) with three ordered levels, namely low, medium, and high. Here, financial resilience is used as an operational proxy of firm financial robustness/health derived from annual financial statements. It does not represent shock-defined resilience (i.e., absorption and recovery after an exogenous event), which we explicitly discuss as a limitation. The resilience classes are derived ex ante from a composite resilience score constructed by PCA of standardised financial ratios, more exactly, Fixed Asset Ratio (RFA), Inventory Ratio (RI), Current Asset Ratio (RCA), Receivable Ratio (RR), Equity/Total Debt Ratio (REL), Total Debt/Total Asset Ratio (RDA), Return on Sales (ROS), and Debt/Equity Ratio (RDE) [5]. The score is then discretised into three ordered classes using train-only cut-offs. Liquidity and solvency are excluded from PCA inputs by design and may be used as features. This reduces direct circularity between explanatory variables and labels; however, the possibility of an indirect (proxy) reconstruction of the label from observational accounting data cannot be completely ruled out.
We compute a firm-level PCA-based resilience proxy from eight standardised financial ratios capturing asset composition, working-capital structure, leverage/capital structure, and profitability. For readability, the full ratio definitions are provided in Appendix B. PCA is used exclusively for target operationalisation, i.e., to construct a single composite financial resilience proxy score from eight accounting ratios. Importantly, PCA is not used for dimensionality reduction of the predictors, nor for feature elimination/selection. All predictive models are trained on a separate set of explanatory variables, while the PCA inputs are excluded from the feature set to reduce direct leakage.
The PCA workflow followed in the paper includes the following stages:
- Compute raw financial ratios per firm-year;
- Standardise train-global (compute μ, σ on 2014–2022, apply the same to 2023);
- Fit PCA on train (2014–2022) using the train-global z-scores;
- Compute the resilience score on train and 2023 with the same loadings (signs aligned so that a higher score means more resilient);
- Derivation of firm-level thresholds (train) by calculating for each firm the resilience score for 2014–2022 and determining T1 = P25 and T2 = P75 (inclusive limits);
- Labelling firm-year observations with frozen thresholds with low/medium/high classification using T1/T2, and the same thresholds are applied unchanged for 2023.
As a note, in our approach, motivated by the fact that the thresholds are derived from a firm-level distribution, but are applied to a firm-year panel, the class weights in the training set are not mechanically constrained to exactly 25%/50%/25%. Thus, in Table 3, we present the number of firm-year observations (n) and the corresponding weight (%) under this definition.
Table 3.
Resilience classes under frozen train-only P25/P75 thresholds (firm-year counts).
In the working dataset, financial ratios are standardised using the training set (2014–2022), and a PCA is fitted to the same data, using train-global means and standard deviations (μ, σ estimated on 2014–2022), with parameters frozen and applied unchanged to 2023 (no within-year scaling). The component signs are aligned such that higher values indicate greater resilience. The composite resilience score is a variance-weighted sum of the first six principal components (cumulative explained variance 89.7%), with component signs aligned so that higher values indicate higher resilience. We retain the fewest components necessary to exceed a high cumulative variance threshold (approximately 90%) to preserve most of the information from the eight ratios while avoiding negligible-noise components. The score is discretised into three ordered classes using train-only quartile-based cut-offs, frozen for 2023 to prevent label drift and information leakage, namely low if score ≤ T1, medium if T1 < score ≤ T2, and high if score > T2, where the training-set thresholds are T1 = −0.154254 and T2 = 0.165890. The thresholds are frozen and applied unchanged to the 2023 test set to prevent information leakage (Table 3). Using quartiles or k-means (k = 3) on the training distribution yields qualitatively similar class rankings.
To ensure methodological rigour and prevent circularity, neither the resilience score nor the variables used to construct it are included as predictors in the machine learning models. A strict anti-data-leakage protocol is implemented. The following variables are excluded from the feature set:
- The resilience score as well as the resilience class,
- Main components (PC1–PC8),
- Standardised z-score variables,
- All financial ratios directly used in the PCA-based resilience construction (e.g., Return on Assets—ROA, Return on Assets—ROE, RFA, RCA, leverage and return ratios),
- Firm identifiers and industry codes.
This protocol is designed to reduce the risk that performance reflects a mechanical reconstruction of the target variable. However, residual proxy leakage remains a potential limitation.
To ensure comparability across years and prevent information leakage into the 2023 hold-out, all preprocessing transformations are calibrated on the training period (2014–2022) and applied unchanged to 2023 (“frozen” preprocessing). Specifically, we Winsorise numeric inputs at the 1%/99% levels (train-calibrated), impute missing values using train medians, and standardise/map indicators using train-estimated parameters (including CDF-based mapping to [0, 1] for composite scores).
For data transformation and imputation, categorical variables (e.g., sustainability classes) are encoded using one-hot encoding. All numerical variables are converted to numeric format, and missing values are imputed using median imputation based on the training sample, a strong strategy suitable for uneven financial data.
We evaluate out-of-time generalisation on a prospective 2023 hold-out. Predictors and outcomes are contemporaneous at the firm-year level. Relatedly, the results pertain to prospective generalisation rather than operational early warning. The primary evaluation metric is Balanced Accuracy on the 2023 hold-out, complemented by overall Accuracy plus Macro-F1. Class-level Precision/Recall/F1 are reported in the Results section, and confusion matrices are reported in Figure 3. We assess the incremental value of adding sustainability information by comparing a financial and Environmental, Social and Governance (ESG) specification against a financial-only counterpart on the 2023 hold-out and report effect sizes with bootstrap uncertainty. We interpret the results descriptively (without a prespecified minimum effect size).
Figure 3.
Confusion matrix for (a) Random Forest model and (b) HistGradientBoosting model.
In addition to point estimates, we quantify sampling uncertainty of the main performance contrasts using a nonparametric bootstrap on the 2023 hold-out (resampling firm-years with replacement). We report 95% bootstrap confidence intervals for (i) the incremental value of adding ESG information (ΔBalanced Accuracy, ΔMacro-F1), (ii) model contrasts (HGB vs. LR/RF), and (iii) stability diagnostics of global explanations (rank correlation/top-k overlap). This complements the out-of-time split by expressing how sensitive performance and key explanatory summaries are to finite-sample variability in the unseen year.
The practical utility of the model is assessed through a strict out-of-time split: the model is trained on 2014–2022 (n = 23,400) and evaluated once on the unseen 2023 hold-out (n = 2600), which simulates prospective deployment to future annual statements.
3.1.2. Model-Specific Training Procedures
We consider a supervised learning problem with observations , where denotes the feature vector for firm i, and is the resilience class (low/medium/high). The goal is to learn a predictor that outputs class probabilities for .
For probabilistic classifiers, we optimise the empirical risk under the multiclass cross-entropy (log-loss):
Optionally with regularisation (e.g., ) such that the final objective is .
Related to machine learning models, two reference models are estimated for comparison:
- Multinomial logistic regression, representing linear classification;
- Random Forest classifier, representing a strong ensemble-based machine learning benchmark.
The multinomial logistic regression baseline was fitted without standardisation, and the results were qualitatively unchanged when StandardScaler was applied. These models provide reference points for evaluating the added value of boosting-based approaches. In multinomial logistic regression, the unknown parameter set is , with and . The model defines
Parameters are learned by minimising using numerical optimisation (e.g., (stochastic) gradient-based methods or quasi-Newton solvers).
where is the learning rate.
For Random Forest, the unknowns are the ensemble structure: the set of trees , their split variables, thresholds, and leaf predictions (estimated from training samples reaching each leaf). RF does not optimise a single global differentiable objective; instead, each tree is built greedily by locally optimising a split criterion. At each node, the split (j,s) is selected to maximise impurity reduction:
where is an impurity measure (e.g., Gini or entropy) and , are the left/right subsets induced by threshold s on feature j. Trees are trained on bootstrap samples; at each split, only a random subset of features is considered. The final prediction aggregates tree outputs by majority vote or averaged class probabilities:
For Gradient Boosting, the unknowns are the sequence of base learners (regression trees) and their leaf values; the model is an additive function:
where is the learning rate.
The ensemble is trained to minimise the multiclass log-loss (deviance). At iteration m, the negative gradient of the loss w.r.t. current scores defines pseudo-residuals. Each new tree is fitted to approximate the negative gradient:
And the model is updated as
The histogram-based implementation discretises continuous features into bins to accelerate split search, while preserving the same stage-wise optimisation principle.
The primary predictive model is a GB Classifier, selected for its ability to detect nonlinear effects and interaction terms, handle heterogeneous feature patterns, and achieve strong predictive performance on tabular financial data. Class imbalance is addressed by class-weighted sampling during training. All models were tuned within 2014–2022 using expanding-window (rolling-origin) validation with annual validation slices (2019–2022) (Table 4). The selection metric was balanced accuracy (tie-break: Macro-F1). We used a randomised search over predefined ranges (100 candidates per model, fixed seed) and enabled early stopping for HGB. The best configuration (mean inner-CV score) was refit on 2014–2022 and evaluated once in 2023 (out-of-time). Class imbalance was handled via class-weighted losses (where applicable). All stochastic procedures use a fixed random seed (random_state = 42) to ensure replicability.
Table 4.
Selected hyperparameters and settings for all models (refit on 2014–2022, tested on 2023).
The primary predictive model is HGB, selected for its ability to capture nonlinear effects and interactions on heterogeneous tabular data; class imbalance is handled via class-weighted losses/sample weights. Global variable importance for the winner model (HGB) is obtained via permutation importance on the 2023 hold-out, while Tree-SHAP is computed on a Random Forest auxiliary model to triangulate explanations at low computational cost. In addition, we compute SHAP on an RF treated explicitly as an auxiliary explainability model (not the best model), since tree-SHAP is efficient and mature, providing both global (mean SHAP) and local (observation-level) explanations. Convergence between global importances on HGB and SHAP values on RF is used as a robustness check of the explanatory mechanisms.
Permutation importance is used as the primary global explanation for HGB because it directly measures the sensitivity of the trained HGB predictor to feature perturbations on the 2023 hold-out (i.e., it is faithful to the deployed model). In contrast, SHAP values are computed on an auxiliary RF and therefore explain only the RF’s predictive power. To avoid over-claiming, we restrict RF-SHAP to a supplementary role: (i) providing local, observation-level attributions and dependency/interaction visualisations for the RF; and (ii) serving as a cross-model stability diagnostic by quantifying the concordance between HGB permutation rankings and RF-SHAP rankings (Spearman ρ and Jaccard@k overlap; reported in the Results section). Agreement is interpreted as robustness of the dominant signals, not as equivalence of decision logic across models. This design choice improves transparency and usability in healthcare decision-making contexts by clearly separating model-faithful global explanations (HGB permutation importance) from supplementary local diagnostics (RF-SHAP).
For the boosting model, permutation-based predictor importance is used to identify the most influential predictors of resilience’s classification. This approach identifies financial, operational, and sustainability-related drivers that particularly contribute to resilience outcomes, thereby supporting explainable AI-based decision support [30].
The proposed methodology illustrates how explainable machine learning models, combined with rigorous leakage prevention and temporal validation, can yield reliable, actionable insights into healthcare system resilience. By prioritising forecasting precision, interpretability, and real-life applicability, the framework underpins prospective, out-of-time monitoring mechanisms and data-informed managerial decision-making in complex service systems.
3.2. Research Hypotheses
Grounded in prior literature and our study’s positioning at the intersection of healthcare, finance, and predictive analytics, we state concept-level hypotheses that emphasise directional relationships and comparative relevance. Operational tests are described in Section 3.
H1.
Firms with stronger financial buffers and disciplined working-capital structures tend to show increased firm-level financial resilience.
Prior analyses consistently identify liquidity, solvency, asset structure, and working-capital management as core determinants of firm-level financial resilience, particularly in healthcare and pharmaceutical supply chains characterised by high uncertainty and operational rigidity [7,11,14]. Accordingly, firms with more ample financial buffers are expected to display greater resilience.
H2.
Sustainability in environmental performance is positively associated with financial resilience; the magnitude of its contribution is expected to be context-dependent.
Recent studies argue that sustainability-related practices increase adaptive capacity, resource access, and sustained stability, especially in regulated and socially essential sectors such as healthcare [8,9]. Environmental performance, in particular, is increasingly associated with resilience to systemic shocks.
H3.
The relationships between key drivers and resilience are nonlinear, with plausible diminishing returns and threshold effects.
Linear modelling approaches may fail to detect complex relationships involving diminishing returns, plateau effects, or risk thresholds. Prior literature points out the suitability of ensemble ML models and explainability techniques for identifying such nonlinear patterns in financial and operational data [15,16,31].
H4.
Flexible, interaction-aware classifiers are expected to outperform transparent linear baselines for resilience classification under prospective, out-of-time evaluation.
Ensemble algorithms such as RF and Gradient Boosting are widely recognised for their excellent predictive performance on complex, high-dimensional, and unbalanced datasets, including healthcare and supply chain applications [11,12].
H5.
Global and local explanation summaries provide stable, governance-ready knowledge of domain-level drivers (e.g., working capital, capital structure, sustainability).
The adoption of ML in healthcare and sustainability-oriented contexts hinges crucially on model transparency and explainability. XAI methods such as SHAP and permutation importance provide actionable insights into model behaviour and support the deployment of trustworthy AI [16,25,27].
H6.
Models that combine financial and sustainability information offer incremental predictive value over financial-only specifications, conditional on data quality and context.
Recent frameworks emphasise the requirement for integrated resilience–sustainability analytics, arguing that financial indicators alone are insufficient to capture systemic soundness in medical systems [8,32].
4. Results
4.1. Predictive Performance of Machine Learning Models
The predictive performance of the evaluated models was assessed using an out-of-time validation strategy, with data from 2014 to 2022 used for training and observations from 2023 reserved for testing. Three models were compared, more exactly: a multinomial logistic regression (baseline linear model), an RF classifier, and an HGB classifier. Class proportions in train/test reflect the frozen-quartile rule applied to the PCA-based score built from the first six components (89.7% variance). Thresholds T1 = −0.154254 and T2 = 0.165890 are fixed from the training distribution.
Table 5 provides a complete audit trail of out-of-time performance across models. Balanced Accuracy, our primary metric, confirms the boosting model’s superiority, with Macro-F1 and Accuracy consistent with this ranking.
Table 5.
Out-of-time (2023) performance among models.
Table 6 reports a sensitivity check for indirect proxy leakage by removing liquidity/solvency and other balance sheet proxies that could partially reconstruct the PCA-derived outcome. Performance decreases from Spec A to Spec B by ΔBA and ΔMacro-F1, suggesting that proxy-like contemporary accounting indicators carry a non-trivial share of predictive signal; nevertheless, the reduced model retains meaningful discrimination on the 2023 hold-out.
Table 6.
Sensitivity analysis for indirect proxy-leakage risk (primary HGB model; 2023 hold-out).
Class-wise results in Table 7 show that misclassifications concentrate between adjacent classes, in accordance with the ordinal nature of the target and the confusion-matrix patterns reported in Figure 3.
Table 7.
Class-wise Precision/Recall/F1 (2023 hold-out).
The findings show a substantial performance gap between linear and nonlinear machine learning approaches. While logistic regression achieves acceptable performance, ensemble-based models notably outperform it, verifying the presence of nonlinear and interaction effects in healthcare resilience dynamics.
In particular, the HGB model obtains the highest predictive accuracy (Accuracy = 0.944, Balanced Accuracy = 0.943, Macro-F1 = 0.943), followed by the RF classifier (Balanced Accuracy = 0.917). These results suggest that boosting-based approaches tend to perform better for resilience classification in complex service systems.
4.2. Confusion Matrix Analysis
Figure 3 compares the confusion matrices for the two ensemble classifiers: (a) Random Forest (counts) and (b) HGB (row-normalised). In both cases, misclassifications occur predominantly between adjacent resilience classes (medium–high, medium–low), whereas extreme confusions (low predicted as high, or the reverse) are rare. This pattern indicates that the models preserve the target’s ordinal structure rather than producing random errors.
Compared with the RF baseline, the HGB matrix exhibits a cleaner diagonal and higher per-class recall, particularly for medium and high firms, with only small residual spillovers into neighbouring classes. This improvement is consistent with the Balanced Accuracy results, reported in Table 5 and Table 7, and supports HGB as the best-performing model for the 2023 hold-out.
From an applied perspective, the scarcity of extreme mistakes and the strong recall on the high and low categories are especially valuable for prospective risk-monitoring workflows in healthcare services, where prioritisation frequently depends on correctly flagging the tails of the resilience distribution.
4.3. Global Feature Significance: Random Forest Along with Gradient Boosting
Figure 4 reports the global variable importance derived from the RF model, where the bars show the relative contribution of predictors (e.g., receivables, cash and cash equivalents, Environmental Score, liquidity, inventory, property and equipment), supporting the importance pattern noted for the best model.
Figure 4.
Top predictors—Random Forest (auxiliary explainability model).
Figure 5 displays the permutation importance for the primary model (HGB), where the decrease in balanced accuracy after feature permutation highlights dominant predictors (receivables, cash and cash equivalents, Environmental Score, inventory, liquidity, property and equipment, current/total assets).
Figure 5.
Permutation importance—HistGradientBoosting.
Both approaches yield highly consistent predictor rankings, thereby strengthening the robustness of the findings. Across models, the most influential variables are receivables, cash and cash equivalents, Environmental Score, inventory, liquidity, property and equipment, and current and total assets. The dominance of receivables and cash-related variables signals the importance of working-capital management as a core mechanism of resilience in healthcare organisations. Moreover, the Environmental Score ranks highly in global summaries. Given the small and statistically uncertain incremental gains vs. financial-only features, we interpret this as an informational association rather than a structural linkage.
4.4. Explainable AI Analysis Using SHAP Values
To investigate the contributions of variables and potential interactions, we compute TreeSHAP on an auxiliary Random Forest to obtain complementary global and local attributions for the RF model. These SHAP results are not intended to explain HGB. Instead, they are used (a) to visualise local contribution patterns and potential nonlinearities/interactions in a model where TreeSHAP is computationally mature, and (b) to test whether the dominant global drivers identified for HGB via permutation importance remain prominent in an alternative, high-performing tree ensemble. Specifically, we report cross-model concordance between HGB permutation importances and RF mean |SHAP| rankings (Spearman ρ and Jaccard@k), interpreting this concordance as evidence of robustness of the main signals rather than a guarantee of identical decision mechanisms. To explicitly address fidelity, we confirm the main nonlinear regimes suggested by RF–SHAP on the primary HGB using model-faithful ICE/Partial Dependency Plot (PDP) (reported in Section 4.5), rather than treating RF attributions as a surrogate for the HGB decision function.
Figure 6 displays the mean absolute SHAP values computed on the auxiliary RF, reported per resilience class. Results confirm the central role of receivables, cash, and cash equivalents, and the Environmental Score, with stable ranking across classes. The relative stability of feature significance across classes indicates a structural rather than class-specific influence of these variables.
Figure 6.
Mean SHAP values per resilience class—Random Forest (auxiliary).
4.5. Nonlinear Effects and Threshold Behaviour
Because the dependence/interaction plots are computed on the auxiliary RF, they should be interpreted as exploratory patterns for that model; we treat them as hypotheses about nonlinearities that require confirmation on HGB (e.g., via ICE/PDP for HGB) and/or additional data.
Figure 7 reports RF–SHAP dependence plots for three key drivers. Each dot represents one firm-year observation; the x-axis shows the observed feature value, while the y-axis shows its SHAP attribution (positive values increase the model’s probability of the high-resilience class in the auxiliary RF; negative values decrease it). The smoothed curve summarises the average direction and nonlinearity of the association.
Figure 7.
RF–SHAP dependence plots (auxiliary model) illustrating nonlinear regimes. Each point is a firm-year (2023 hold-out), the x-axis is the feature value, and the y-axis is the SHAP contribution to the predicted probability of the high-resilience class. The smoothed trend highlights (a) diminishing returns for liquidity, (b) diminishing returns for solvency, and (c) a threshold-like pattern for Environmental Score.
The key insights are: (i) Liquidity exhibits diminishing marginal returns: increases from low to moderate liquidity correspond to clear positive contributions, whereas further increases yield progressively smaller gains (a plateau). This suggests that “more liquidity” is beneficial mainly up to a practical buffer zone. (ii) Solvency shows a similar stabilising pattern: moving from weak solvency to moderate solvency improves the predicted resilience, but very high solvency yields limited additional gains. (iii) Environmental Score displays a threshold-like regime: contributions remain modest at low to intermediate values but rise noticeably beyond a mid-range region and then stabilise. In operational terms, the model distinguishes between minimal compliance and more mature environmental performance, with the latter associated with higher resilience classification. Because these curves are computed on the auxiliary RF, we treat them as exploratory nonlinear patterns; Figure 8 confirms the same qualitative regimes on the primary HGB model using model-faithful ICE/PDP.
Figure 8.
Model-faithful confirmation on the primary HistGradientBoosting model (HGB): Individual Conditional Expectation (ICE) (thin lines) and Partial Dependency Plot (PDP) (thick line) for (a) Environmental Score, (b) liquidity, and (c) solvency, showing the relationship with the predicted probability of the high-resilience class on the 2023 hold-out. The different colours of the ICE curves are used only for visual separation and do not encode additional categories; the thick (blue) line represents the PDP (average effect).
These nonlinear patterns explain why linear models are unable to capture resilience dynamics and justify the use of advanced machine learning techniques.
Because the dependence plots in Figure 7 are computed on the auxiliary RF, we additionally confirm the key nonlinear patterns on the primary model using model-faithful ICE/PDP summaries. Figure 8 reports HGB ICE (individual profiles) overlaid with the corresponding PDP for Environmental Score, liquidity, and solvency on the 2023 hold-out. The HGB curves reproduce the qualitative behaviours suggested by RF-SHAP: (i) a threshold-like regime for Environmental Score and (ii) diminishing marginal returns for liquidity and solvency, with most misclassification risk concentrated around intermediate ranges. This cross-model agreement strengthens the robustness of the interpretation while preserving a clear separation between predictive explanations and causal claims.
4.6. Interaction Effects
SHAP interaction values on the auxiliary RF reveal interactions among financial variables and time dynamics. These support a context-dependent, non-additive structure of resilience drivers (Figure 9).
Figure 9.
SHAP interaction effects—Random Forest (auxiliary robustness).
Overall, the results show that:
- Machine learning models markedly outperform linear approaches in predicting healthcare resilience
- Boosting-based algorithms provide the highest predictive accuracy and stability.
- Working-capital structure emerges as a key, nonlinear, driver of resilience.
- Environmental sustainability appears informative in importance rankings, but has mixed, but statistically unsupported, incremental predictive value in 2023.
- Explainable AI techniques uncover threshold and interaction effects that are invisible to standard models.
We find consistent evidence for the adoption of explainable machine learning frameworks used in healthcare resilience monitoring and decision support.
To synthesise the main empirical results and their operational tests for hypotheses H1–H6, Table 8 reports effect sizes for the 2023 hold-out, together with 95% bootstrap confidence intervals.
Table 8.
Operational hypothesis tests (effect sizes; 95% bootstrap CI) on the 2023 hold-out.
For H6, the financial and ESG specification shows small, statistically insignificant gains relative to financial-only in 2023. We, thus, characterise the evidence as suggestive rather than confirmatory.
On balance, the evidence points to the superiority of HGB relative to baseline ensembles on the primary metric, shows stable explanatory signals across permutation and SHAP, and provides mixed evidence for the incremental contribution of the Environmental Score in this setting.
5. Discussion
We develop and evaluate an explainable machine learning framework designed to predict firm-level resilience regarding healthcare services. This evidence provides strong evidence that resilience classification in healthcare is driven through a fusion of financial buffers and sustainability-related signals, and that these relationships are markedly nonlinear. The boosting-based model attained substantially higher predictive performance than both the linear baseline and the bagging-based ensemble, suggesting that flexible, interaction-aware learning algorithms more effectively capture mechanisms of healthcare resilience. We deliberately separated the performance model (HGB) from the auxiliary interpretation model (RF and SHAP). The concordance between the importance of HGB and the SHAP values in RF suggests the robustness of the explanatory mechanisms, decreasing the risk of overinterpretation induced by a single algorithm. The explainability analysis additionally enabled a transparent interpretation of the main drivers, supporting the practical usability of the proposed model in decision support settings [16,17].
With respect to Hypothesis H1, across models and explainability outputs, working capital and financial buffer indicators (most notably receivables, cash holdings, liquidity, and asset structure proxies) emerged as among the most influential predictors of resilience. This is consistent with the wider resilience literature, which emphasises the role of liquidity and financial adaptability as shock absorbers, particularly in healthcare supply systems where operational steadiness is critical, and disruptions possess immediate service implications [7,33]. It is also consistent with the perspective that analytics-based risk/resilience analysis in supply chain contexts commonly highlight financial structure as a core latent driver of susceptibility and recovery capacity [11,14].
From a healthcare management standpoint, the prominence of receivables and cash is intuitive: delayed payments, reimbursement mechanisms, and billing cycles can directly constrain the ability to maintain staffing, procure essential resources, and sustain service delivery under stress. These results reinforce the practical implication that resilience monitoring should consider working-capital management not as an accounting detail, but as a tactical resilience capability.
Beyond predictive accuracy, the explainability results clarify which financial and operational levers the model uses to distinguish resilient from fragile firm-years. In particular, the model-faithful permutation importance on the primary HGB (Figure 5) consistently prioritises working-capital disciplines, especially receivables, cash and cash equivalents, and inventory, as well as asset structure indicators and liquidity. These signals are actionable in outpatient healthcare services because they map directly to reimbursement timing, billing cycles, and short-term financing constraints that affect staffing stability, procurement capacity, and service continuity under stress.
At a more granular level, the auxiliary RF–SHAP analysis (Figure 6 and Figure 7) provides case-level auditing cues and helps communicate why a given firm-year is classified as low/medium/high resilience. Importantly, these attributions are used as supplementary diagnostics rather than as explanations of the deployed HGB model; we therefore interpret them as pattern exploration and triangulation. The reported cross-model agreement between HGB permutation rankings and RF mean |SHAP| rankings (Spearman ρ and Jaccard@k, Table 8) is interpreted as robustness of the dominant drivers, not as equivalence of decision logic across models.
For deployment, these explainability artefacts support a governance-ready workflow: (i) global monitoring of top drivers (permutation importance) to guide which indicators should be routinely reviewed; (ii) targeted local auditing for flagged firm-years to support justification and prioritisation; and (iii) periodic stability checks (rank concordance and out-of-time revalidation) to detect when explanation patterns drift. Finally, we emphasise that feature importance and SHAP attributions quantify predictive associations rather than causal effects; correlated accounting indicators may share attribution credit, and explanation stability may change under distribution shift. Accordingly, the model is intended as an early monitoring and prioritisation tool, with its outputs to be interpreted alongside domain expertise and contextual information.
Related to Hypothesis H2, the results suggest that the relationship is best described as nonlinear rather than uniformly linear. The Environmental Score appears near the top of global rankings, indicating informational relevance. However, when we remove ESG from the feature set, the incremental improvement is slight and statistically uncertain on the 2023 hold-out. We therefore interpret the association as positive but modest, with mixed evidence for incremental value this year (no causal claims). This finding complements the growing literature arguing that sustainability is progressively integrated into resilience along with risk governance, especially in regulated and socially essential sectors [8,9]. It also corresponds to resilience–sustainability integration frameworks, which conceptualise sustainability as a long-term capacity builder rather than a peripheral objective [32].
One reading is that limited environmental compliance is insufficient to generate resilience advantages. In contrast, more mature environmental practices (e.g., energy efficiency, resource optimisation, structured ESG) correlate with better operational discipline and access to resources, accordingly improving stability under stress. Importantly, these results do not imply causality but provide consistent evidence that environmental performance is informationally relevant to resilience classification, a point widely emphasised in the interpretive analysis literature, which warns against confusing explanatory patterns with causal mechanisms [16,25].
Consistent with Hypothesis H3, the performance gap between the linear baseline and the ensemble models suggests that linear specifications likely miss key nonlinear effects and interactions. SHAP dependence plots additionally indicate diminishing returns or plateau effects for liquidity and solvency, consistent with nonlinear economic behaviour in which additional buffers yield smaller marginal gains within resilience beyond a certain point.
This matches closely with XAI and explainability research, which show that feature attribution methods can uncover nonlinear regimes and interaction schemes in complex models, effects that remain invisible in linear or purely parametric techniques [15,31]. The empirical relevance of threshold behaviour also supports the argument that resilience monitoring systems should not rely solely on linear ratios and fixed “one-size-fits-all” rules, but rather incorporate flexible, explainable prediction tools.
The results show a consistent ranking consistent with Hypothesis H4, boosting-based classification performs best, followed by RF, whereas logistic regression performs worst. This outcome is consistent with systematic evidence that ensemble learning models surpass linear baselines in predictive healthcare analytics and complex risk/resilience tasks due to their ability to represent nonlinear effects and feature associations [11,12].
Beyond metric improvements, the patterns in the confusion matrix are also informative. Misclassifications occur predominantly between adjacent resilience classes, indicating that the models capture the ordinal structure pertaining to resilience rather than producing erratic predictions. This pattern is valuable for prospective monitoring use cases in which distinguishing extreme-risk states is more critical than marginal class boundaries.
The successful use of permutation importance and SHAP-based interpretation to identify robust drivers and characterise nonlinear effects correlates with Hypothesis H5. This supports the growing consensus that explainability is essential for the adoption of ML in high-risk domains, where decision-makers require explainability and justifiability [16,17]. Human-centred evaluation research also indicates that explainability increases perceived trust and utility, especially when explanations are stable, coherent, and consistent with user needs [29,34].
At the same time, the literature cautions that the quality of explanations should be assessed carefully rather than treated as self-evident. Recent articles emphasise the proliferation of XAI evaluation measures and argue for parsimonious, context-specific choices [21,27]. In this respect, the present study’s explainability strategy is defensible, so that permutation importance provides stable global interpretability. At the same time, SHAP dependence plots capture local nonlinear behaviours in key variables, yielding a balanced and replicable XAI toolkit.
Adding sustainability information suggested by Hypothesis H6, especially the Environmental Score, yields small optimistic point estimates on the 2023 hold-out, but the 95% CIs span zero (ΔBalanced Accuracy = +0.001; ΔMacro-F1 = +0.002). So, we characterise the incremental contribution of ESG as weak/mixed evidence rather than confirmatory [8,32]. Adding ESG to financial features yields small, statistically insignificant gains relative to a financial-only specification. The consistently high ranking of the Environmental Score suggests conditional importance, whereas the ablation results show redundancy with financial covariates in this sample. Overall, evidence is mixed/suggestive rather than confirmatory.
Across importance analyses, Environmental Score often ranks among the top predictors, yet its incremental predictive gain in the ESG ablation is small and statistically uncertain. This apparent tension can arise when an environmental proxy is conditionally informative but redundant with correlated financial covariates (e.g., asset structure, provisions, leverage/liquidity), so that its contribution is largely absorbed once the broader accounting context is taken into account. Moreover, the environmental pillar is constructed from proxies (fixed-asset intensity and provisions scaled by liabilities), and prior work notes that this environmental dimension can show low cross-sectional variation under limited ESG disclosure, remaining useful mainly for comparative ranking rather than large incremental predictive gains. Finally, environmental investments and provisioning may affect resilience with longer lags (multi-year horizon); therefore, a single-year out-of-time evaluation (2023) may underestimate longer-term predictive contributions. Future work will test lagged ESG formulations and multi-year rolling windows to assess delayed effects and reduce collinearity-driven redundancy.
A careful interpretation is consistent with the literature. While sustainability can act as an enabling condition for resilience, its measurable contribution depends on sector-specific materiality, data quality, and the operationalisation of sustainability indicators [9]. Using the 2023 hold-out, we conducted an ablation comparing financial-only vs. financial and ESG specifications (Table 8), which shows small and statistically uncertain gains. Subsequent work should extend this analysis with additional years and lagged predictors, examine alternative ESG constructions, and test broader ablation scopes that remove correlated financial covariates to probe redundancy [25,27].
These outcomes have practical consequences for resilience monitoring and early-warning systems in healthcare services. First, the central role of cash, receivables, and liquidity suggests that resilience policies should prioritise working-capital discipline and management of the reimbursement cycle. Second, sustainability in environmental management appears to function as a durability enabler with nonlinear effects, implying that “minimum compliance” strategies may offer limited resilience benefits compared to more mature sustainability practices. Third, the strong predictive performance, combined with explainability, supports the feasibility of AI-assisted decision support tools that remain transparent enough for managerial adoption and regulatory scrutiny [16,29].
Several limitations should be acknowledged. First, our evidence is based on a single national setting (Romania) and one healthcare activity class (NACE 8622, namely specialised outpatient medical units). Consequently, external validity is limited: healthcare financing and reimbursement cycles, regulatory compliance burdens, provider payment delays, and accounting/reporting practices differ materially across countries and may alter both the feature distributions and the mapping between predictors and resilience classes. Therefore, the reported performance and importance patterns should be interpreted as context-specific to the Romanian outpatient segment rather than as universal determinants of healthcare resilience.
Second, while XAI improves interpretability, the explanations continue to be descriptive and should not be interpreted causally without additional identification strategies [20,25]. Third, although out-of-time validation improves realism, model stability facing structural breaks or major policy transitions remains an open question. Although SHAP is trained on an auxiliary model (RF) rather than on the HGB, the agreement with the HGB importances and dependence plots supports the validity of the conclusions. Residual sensitivity to the auxiliary model specification remains possible. Because predictors are contemporaneous with the outcome, our setup does not constitute an operational early-warning system; such a system would require lagged predictors and reporting-lag assumptions.
Prediction performance in financial resilience monitoring is affected by multiple uncertainty sources: (i) data uncertainty (measurement error, accounting practices, reporting delays, missingness), (ii) sampling uncertainty due to finite firm-year samples, and (iii) distribution shift (structural breaks, policy changes, reimbursement regimes, or shocks that alter the joint distribution of features and outcomes). Our design mitigates these factors by using frozen preprocessing calibrated on 2014–2022, an out-of-time evaluation on the unseen 2023 year, and bootstrap confidence intervals for key contrasts (Table 5). Nevertheless, performance may degrade under real-time deployment if covariate or concept drift occurs (e.g., new reimbursement rules or accounting changes). For operational use, the pipeline should be complemented with drift monitoring (feature distribution checks), periodic recalibration, and uncertainty-aware decision thresholds (e.g., flagging only high-confidence “Low”/”High” cases while routing ambiguous cases for review) [35]. Future work can also incorporate prediction sets via conformal methods and multi-year rolling updates to improve robustness under evolving uncertainty.
A key distinction is between parametric models, which specify a fixed functional form with a finite-dimensional parameter vector (e.g., multinomial logistic regression), and nonparametric or highly flexible machine learning models (e.g., tree ensembles) that adapt their complexity to the data. Parametric multidimensional models are often preferred when the goal is mechanistic understanding and long-term interpretability under uncertainty; for example, Tutsoy et al. [36] extend a multi-input–multi-output parametric framework by explicitly modelling unknown uncertainties in pandemic dynamics, enabling structured interpretation of uncertainty components and stable parameter learning across contexts. In contrast, our objective is to evaluate prospective classification accuracy on heterogeneous firm-level tabular data, where nonlinearities and interactions are prominent; hence, we adopt nonparametric ensembles as primary predictors and maintain a parametric baseline (logistic regression) as an interpretable reference point. In future work, hybrid strategies could combine parametric structure (to encode domain constraints or dynamics) with nonparametric components (to capture residual nonlinearities), potentially improving stability under regime changes while retaining high predictive accuracy.
Our outcome is a PCA-derived financial resilience proxy constructed from eight accounting ratios, discretised using train-only thresholds. Although we enforce a strict anti-leakage protocol by excluding the resilience score/class, PCs, z-scores, and all PCA input ratios from the predictor set, the remaining accounting aggregates and derived indicators may still act as indirect proxies for the same underlying balance sheet structure (e.g., liquidity/solvency or closely related working-capital components). Therefore, part of the model’s high predictive performance may reflect its ability to reconstruct the proxy label from correlated contemporary signals rather than capturing a distinct “resilience mechanism under external shocks”. We consequently interpret the results as predictive monitoring of a transparent financial proxy rather than as causal evidence of resilience drivers.
The current modelling setup uses contemporaneous firm-year predictors to classify resilience in the same period. This design is appropriate for understanding associations and for retrospective monitoring, but it does not constitute a strictly operational “early warning system”, which requires forecasting resilience at time t using information available at t − 1 (or earlier). Therefore, the reported performance should be interpreted as same-year classification rather than forward-looking prediction. A key future direction is to construct a forward-looking model using lagged predictors only (e.g., Xt−1 to Yt), evaluated with rolling-origin validation and potentially multi-horizon forecasts (t + 1, t + 2), to better reflect reporting delays and real-world decision-making.
To construct a more robust resilience measure, future work should anchor the outcome in exogenous shocks (e.g., pandemic periods, major policy/reimbursement changes) and define resilience as the ability to absorb and recover from shocks (e.g., revenue/profitability declines and recovery speed). Operationally, this can be implemented by (i) defining a shock window and measuring post-shock performance relative to a pre-shock baseline, and/or (ii) predicting next-year resilience using lagged predictors only (t − 1), explicitly reflecting reporting delays and reducing contemporaneous circularity.
Subsequent work should examine the framework in other healthcare segments, incorporate higher-frequency indicators where available, test transferability over countries, and evaluate the stability of explanations using standardised XAI evaluation dimensions such as fidelity and toughness [21,27,30]. Additionally, integrating variables related to digital technology adoption could further link the results to healthcare supply chain resilience frameworks, emphasising digital enablers [7].
6. Conclusions
This study promotes firm-level resilience assessment in healthcare by coupling a transparent target construction (PCA-based score with train-only quartile-based thresholds) with a temporally realistic evaluation (2014–2022 train; 2023 out-of-time test). Methodologically, we show that boosting-based classifiers capture nonlinear effects and interaction effects that elude linear specifications. At the same time, an asymmetric XAI design (permutation importance on the winner model (HGB) and Tree-SHAP on an auxiliary RF) yields convergent global signals and stable local patterns. Together, these components provide a replicable blueprint that balances predictive performance with comprehensibility in high-stakes tabular settings.
Findings point to working-capital disciplines, like receivables, cash holdings, inventory, and balance sheet structure as primary levers for resilience, with environmental performance acting as a nonlinear enabler beyond intermediate levels. For managers, this supports risk-monitoring dashboards that track class-wise recall and prioritise tail risks (low/high) while monitoring liquidity/solvency thresholds. For public policy, the results motivate procurement and reimbursement policies that reduce payment delays and incentivise mature environmental practices as part of sectoral resilience programmes, the XAI artefacts (global rankings, dependence plots) making such decisions auditable and regulator-ready.
The analysis uses annual, firm-level data from a single country and NACE segment (8622), which may constrain external validity. Explanations are descriptive rather than causal and may be sensitive to multicollinearity and changes in distribution. SHAP was computed on an auxiliary RF rather than on HGB, even though the signals align. While out-of-time evaluation improves realism, robustness amid structural breaks or political shocks remains only partially assessed. Accordingly, RF-SHAP explains RF, not HGB. It is employed solely as a triangulation proxy, and no exact HGB attributions are claimed.
A primary future direction is comparative validation across countries and healthcare sub-sectors (e.g., outpatient vs. inpatient providers, diagnostic services, pharmacies, long-term care). This includes (i) cross-country transfer tests (train in one country, test in another), (ii) domain adaptation/recalibration under different reimbursement and regulatory regimes, and (iii) multi-task or hierarchical models that jointly learn shared drivers while allowing country- and sub-sector-specific effects. Causal designs (e.g., quasi-experimental or IV-enhanced ML) could probe mechanisms behind environmental thresholds and diminishing returns in liquidity/solvency. Finally, embedding the pipeline into a governance-ready early-warning tool, with code/data artefacts, reproducible figures, and standardised reporting, would facilitate operational adoption and policy experimentation.
Author Contributions
Conceptualisation, L.M.-D., C.-E.G.-I., O.-M.B., D.F. and A.T.; methodology, L.M.-D., C.-E.G.-I., O.-M.B., D.-M.N., D.-T.A., D.F. and A.T.; software, L.M.-D., C.-E.G.-I. and A.T.; validation, L.M.-D., C.-E.G.-I., O.-M.B., D.-M.N. and A.T.; formal analysis, L.M.-D., C.-E.G.-I., D.-M.N., D.-T.A., D.F. and A.T.; investigation, L.M.-D., C.-E.G.-I., O.-M.B., D.-M.N. and A.T.; resources, L.M.-D., C.-E.G.-I., O.-M.B., D.-M.N., D.-T.A., D.F. and A.T.; data curation, L.M.-D., C.-E.G.-I., O.-M.B., D.-M.N., D.-T.A., D.F. and A.T.; writing—original draft preparation, L.M.-D., C.-E.G.-I., O.-M.B., D.-M.N., D.-T.A., D.F. and A.T.; writing—review and editing, L.M.-D., C.-E.G.-I., O.-M.B., D.-M.N., D.-T.A., D.F. and A.T.; visualisation, L.M.-D., C.-E.G.-I., O.-M.B., D.-M.N., D.-T.A., D.F. and A.T.; supervision, L.M.-D. and A.T.; project administration, L.M.-D. and A.T. All authors have read and agreed to the published version of the manuscript.
Funding
This research received no external funding.
Data Availability Statement
The annual financial statements used are publicly available through the Romanian Ministry of Finance. The processed dataset (cleaning rules and derived variables) and analysis code can be made available by the authors upon reasonable request.
Acknowledgments
The authors declare that they used IBM SPSS Statistics (v.26), Python (v.3.10) and the Analyse-it extension (v.6.12.2) for statistical analyses. Grammarly was used for English language checking (language assistance, no content generation). Consensus and SciSpace were used to support literature searching and organisation. All interpretations, methodological decisions, and conclusions belong exclusively to the authors, who assume responsibility for the accuracy and integrity of the content.
Conflicts of Interest
The authors declare no conflicts of interest.
Abbreviations
The following abbreviations are used in this manuscript:
| AI | Artificial Intelligence |
| ESG | Environmental, Social and Governance |
| GDPR | General Data Protection Regulation |
| HGB | HistGradientBoosting |
| ICE | Individual Conditional Expectation (plots) |
| LIME | Local Interpretable Model-agnostic Explanations |
| ML | Machine Learning |
| NACE | Nomenclature of Economic Activities |
| PC | Principal Component |
| PCA | Principal Component Analysis |
| PDP | Partial Dependency Plot |
| RCA | Current Asset Ratio |
| RDA | Total Debt/Total Asset Ratio |
| RDE | Debt/Equity Ratio |
| REL | Equity/Total Debt Ratio |
| RF | Random Forest |
| RFA | Fixed-Asset Ratio |
| RI | Inventory Ratio |
| ROA | Return on Assets |
| ROE | Return on Equity |
| ROS | Return on Sales |
| RR | Receivable Ratio |
| SHAP | SHapley Additive Explanations |
| XAI | Explainable Artificial Intelligence |
Appendix A
Construction of the Sustainability Score (Financial–Social–Environmental)
The sustainability score used in this paper follows two published, empirically tested frameworks that operationalise firm-level sustainability as a composite index with three pillars: financial (40%), social (30%), and environmental (30%). These pillars and their indicator choices are motivated by data availability in Romanian firm-level reporting and by the use of accounting/operational proxies when direct ESG disclosure is limited.
We adopt the same pillar structure and formulas as reported in these sources and adapt them to the healthcare sector (CAEN 8622) while preserving comparability and reproducibility.
All sustainability indicators are computed at the firm-year level from annual financial statements (balance sheets and income statements), complemented by the annual number of employees (when available in the dataset). The environmental and social pillars use proxy variables (fixed assets, provisions, employees, profit per employee), which are explicitly recommended in the cited works for contexts where granular ESG disclosures (e.g., emissions) are unavailable.
We compute three pillar-level raw scores using the published formulas:
- Financial score (40%): Integrates profitability and balance sheet strength by combining ROA and ROE (profitability), a leverage penalty through the Debt Ratio, and short- vs. long-term repayment capacity via liquidity and solvency. In this framework, higher profitability, lower leverage, and stronger liquidity/solvency translate into a higher financial pillar score.
- Social score (30%): Integrates employment scale and employee productivity (net profit per employee).
- Environmental Score (30%): Uses the share of fixed assets in total assets (proxy for long-term investment/infrastructure, including “green” assets) and provisions scaled by liabilities (proxy for preparedness for environmental financial risks).
- Total sustainability score (0–100): Weighted aggregation of the three pillars:
To ensure temporal comparability and prevent information leakage into the 2023 hold-out evaluation, we apply a train-only (“frozen”) standardisation pipeline:
- Winsorization: Each raw indicator is Winsorized at the 1st/99th percentiles estimated on the training period (≤2022).
- Imputation: Missing values are imputed using the training median of each indicator.
- Normalisation to [0, 1]: Indicators are standardised and mapped to [0, 1] using the empirical CDF calibrated on the training period; the same frozen mapping is applied unchanged until 2023.
- Aggregation: Pillar scores are computed as the (equal-weight) average of their sub-indicators (after normalisation), and the total score is computed via the 40/30/30 weights.
This protocol aligns with the “train-only calibration” principle described in the main Methods Section and ensures that the sustainability score is reproducible and comparable across years.
Table A1.
Sustainability score construction: Indicators, formulas, sources, and standardisation.
Appendix B. Financial Ratios Used for the PCA-Based Resilience Proxy
RFA = Fixed assets/Total assets
RCA = Current assets/Total assets
RI = Inventory/Total assets
RR = Receivables/Total assets
REL = Equity/Total debt
RDA = Total debt/Total assets
RDE = Total debt/Equity
ROS = Net profit/Revenues
References
- Akter, M.; Palit, S.; Hossain, K.; Hoque, M.; Shabnam, T. Optimizing Medical Supply Chain Resilience for Future Pandemics: A Data-Driven Framework Integrating Public Health Risk, Logistics Efficiency, and Predictive Analytics. J. Intell. Learn. Syst. Appl. 2025, 17, 133–148. [Google Scholar] [CrossRef]
- Sheikh, A.; Goodrich, K.; Sajja, S. AI-Powered Forecasting for Supply Chain Resilience: Applications of Logistic Regression, Random Forest, and XGBoost in the U.S. Context. Am. J. Innov. Sci. Eng. 2025, 4, 105–117. [Google Scholar] [CrossRef] [Scilit]
- Mihailă, S.; Morosan-Danila, L.; Grosu, V.; Codrean, V. The decision-making system of organisations from the perspective of environmental management. USV Ann. Econ. Public Adm. 2024, 39, 141–148. [Google Scholar]
- Morosan-Danila, L.; Grigoras-Ichim, C.-E.; Jeflea, F.V.; Filipeanu, D.; Tugui, A. Assessing the Sustainability of Construction Companies in the Digital Context: An Econometric Approach Based on Financial, Social, and Environmental Indicators. Sustainability 2025, 17, 4744. [Google Scholar] [CrossRef] [Scilit]
- Tugui, A.; Morosan-Danila, L.; Grigoras-Ichim, C.E.; Filipeanu, D. Financial and Sustainability Factors of Supply Chain Resilience: A Hybrid Econometric-ML Model. Amfiteatru Econ. 2026, 28, 144–163. [Google Scholar]
- Jahin, M.A.; Naife, S.A.; Saha, A.K.; Mridha, M.F. AI in supply chain risk assessment: A systematic literature review and bibliometric analysis. arXiv 2023, arXiv:2401.10895. [Google Scholar] [CrossRef] [Scilit]
- Furstenau, L.B.; Zani, C.; Terra, S.X.; Sott, M.K.; Choo, K.K.R.; Saurin, T.A. Resilience capabilities of healthcare supply chain and supportive digital technologies. Technol. Soc. 2022, 71, 102095. [Google Scholar] [CrossRef] [Scilit]
- Elabed, S.; Shamayleh, A.; Daghfous, A.; Angell, L. Sustainable Healthcare Supply Chain Innovations: A Systematic Literature Review. Oper. Supply Chain Manag. Int. J. 2024, 17, 295–310. [Google Scholar] [CrossRef] [Scilit]
- Al-Hourani, S.; Weraikat, D. A Systematic Review of Artificial Intelligence (AI) and Machine Learning (ML) in Pharmaceutical Supply Chain (PSC) Resilience: Current Trends and Future Directions. Sustainability 2025, 17, 6591. [Google Scholar] [CrossRef] [Scilit]
- Ali, S.; Abuhmed, T.; El-Sappagh, S.; Muhammad, K.; Alonso-Moral, J.M.; Confalonieri, R.; Guidotti, R.; Del Ser, J.; Díaz-Rodríguez, N.; Herrera, F. Explainable Artificial Intelligence (XAI): What we know and what is left to attain Trustworthy Artificial Intelligence. Inf. Fusion 2023, 99, 101805. [Google Scholar] [CrossRef] [Scilit]
- Yang, M.; Lim, M.K.; Qu, Y.; Ni, D.; Xiao, Z. Supply chain risk management with machine learning technology: A literature review and future research directions. Comput. Ind. Eng. 2023, 175, 108859. [Google Scholar] [CrossRef] [Scilit]
- Al-Nafjan, A.; Aljuhani, A.; Alshebel, A.; Alharbi, A.; Alshehri, A. Artificial Intelligence in Predictive Healthcare: A Systematic Review. J. Clin. Med. 2025, 14, 6752. [Google Scholar] [CrossRef] [Scilit] [PubMed]
- Elias, F.; Reza, M.S.; Mahmud, M.Z.; Islam, S.; Alve, S.R. Interpretable Machine Learning for Osteoporosis Risk: A Comparative Evaluation of Predictive Models and XAI Analysis. In Proceedings of the 2025 International Conference on Quantum Photonics, Artificial Intelligence, and Networking (QPAIN) 2025; IEEE: New York, NY, USA, 2025; pp. 1–6. [Google Scholar] [CrossRef] [Scilit]
- Balan, G.S.; Kumar, V.S.; Raj, S.A. Machine Learning and Artificial Intelligence Methods and Applications for Post-Crisis Supply Chain Resiliency and Recovery. Supply Chain. Anal. 2025, 10, 100121. [Google Scholar] [CrossRef] [Scilit]
- Vilone, G.; Longo, L. A quantitative evaluation of global, rule-based explanations of post-hoc, model agnostic methods. Front. Artif. Intell. 2021, 4, 717899. [Google Scholar] [CrossRef] [Scilit] [PubMed]
- Carvalho, D.V.; Pereira, E.M.; Cardoso, J.S. Machine Learning Interpretability: A Survey on Methods and Metrics. Electronics 2019, 8, 832. [Google Scholar] [CrossRef] [Scilit]
- Linardatos, P.; Papastefanopoulos, V.; Kotsiantis, S. Explainable AI: A Review of Machine Learning Interpretability Methods. Entropy 2021, 23, 18. [Google Scholar] [CrossRef] [Scilit]
- Carriero, A.; de Hond, A.; Cappers, B.; Paulavich, F.; Abeln, S.; Moons, K.; van Smeden, M. Explainable AI in healthcare: To explain, to predict, or to describe? Diagn. Progn. Res. 2025, 9, 29. [Google Scholar] [CrossRef] [Scilit]
- Nazir, M.A.; Evangelista, E.; Bukhari, S.M.S.; Sharma, R. A survey of feature attribution techniques in explainable AI: Taxonomy, analysis and comparison. Ann. Math. Comput. Sci. 2025, 28, 115–126. [Google Scholar] [CrossRef] [Scilit]
- Givisis, I.; Kalatzis, D.; Christakis, C.; Kiouvrekis, Y. Comparing Explainable AI Models: SHAP, LIME, and Their Role in Electric Field Strength Prediction over Urban Areas. Electronics 2025, 14, 4766. [Google Scholar] [CrossRef] [Scilit]
- Oblizanov, A.; Shevskaya, N.; Kazak, A.; Rudenko, M.; Dorofeeva, A. Evaluation Metrics Research for Explainable Artificial Intelligence Global Methods Using Synthetic Data. Appl. Syst. Innov. 2023, 6, 26. [Google Scholar] [CrossRef] [Scilit]
- Hwang, H.; Lee, S.; Rosenblatt, L.; Whang, S.E.; Stoyanovich, J. Explanation Multiplicity in SHAP: Characterization and Assessment. arXiv 2026, arXiv:2601.12654. [Google Scholar] [CrossRef] [Scilit]
- Dembinsky, D.; Lucieri, A.; Frolov, S.; Najjar, H.; Watanabe, K.; Dengel, A. Unifying VXAI: A Systematic Review and Framework for the Evaluation of Explainable AI. arXiv 2026, arXiv:2506.15408. [Google Scholar] [CrossRef] [Scilit]
- Grünsteidl, M.N.; Kirrane, S. An Evaluation of XAI Methods applied to Information Disorder Detection Models. Knowl.-Based Syst. 2026, 336, 115305. [Google Scholar] [CrossRef] [Scilit]
- Nauta, M.; Trienes, J.; Pathak, S.; Nguyen, E.; Peters, M.; Schmitt, Y.; Schlötterer, J.; van Keulen, M.; Seifert, C. From anecdotal evidence to quantitative evaluation methods: A systematic review on evaluating explainable AI. ACM Comput. Surv. 2023, 55, 1–42. [Google Scholar] [CrossRef] [Scilit]
- Coroama, L.; Groza, A. Evaluation Metrics in Explainable Artificial Intelligence (XAI). In Advanced Research in Technologies, Information, Innovation and Sustainability; ARTIIS 2022; Communications in Computer and Information Science 2022; Guarda, T., Portela, F., Augusto, M.F., Eds.; Springer: Cham, Switzerland, 2022; Volume 1675. [Google Scholar] [CrossRef] [Scilit]
- Pawlicki, M.; Pawlicka, A.; Uccello, F.; Szelest, S.; D’Antonio, S.; Kozik, R.; Choraś, M. Evaluating the necessity of the multiple metrics for assessing explainable AI: A critical examination. Neurocomputing 2024, 602, 128282. [Google Scholar] [CrossRef] [Scilit]
- Sadeghi, Z.; Alizadehsani, R.; Cifci, M.A.; Kausar, S.; Rehman, R.; Mahanta, P.; Bora, P.K.; Almasri, A.; Alkhawaldeh, R.S.; Hussain, S.; et al. A Brief Review of Explainable Artificial Intelligence in Healthcare. arXiv 2023, arXiv:2304.01543. [Google Scholar] [CrossRef] [Scilit]
- Kim, J.; Maathuis, H.; Sent, D. Human-centered evaluation of explainable AI applications: A systematic review. Front. Artif. Intell. 2024, 7, 1456486. [Google Scholar] [CrossRef] [Scilit]
- Tugui, A. The AI’s Ethical Limitations from the Societal Perspective: An AI Algorithms’ Limitation? In Trends in Sustainable Computing and Machine Intelligence; ICTSM 2023; Algorithms for Intelligent Systems 2024; Springer: Singapore, 2024. [Google Scholar] [CrossRef] [Scilit]
- Le, T.-T.-H.; Prihatno, A.T.; Oktian, Y.E.; Kang, H.; Kim, H. Exploring Local Explanation of Practical Industrial AI Applications: A Systematic Literature Review. Appl. Sci. 2023, 13, 5809. [Google Scholar] [CrossRef] [Scilit]
- Setyadi, A.; Pawirosumarto, S.; Damaris, A. Toward a Resilient and Sustainable Supply Chain: Operational Responses to Global Disruptions in the Post-COVID-19 Era. Sustainability 2025, 17, 6167. [Google Scholar] [CrossRef] [Scilit]
- Zamiela, C.; Hossain, N.U.I.; Jaradat, R. Enablers of resilience in the healthcare supply chain: A case study of US healthcare industry during COVID-19 pandemic. Res. Transp. Econ. 2022, 93, 101174. [Google Scholar] [CrossRef] [Scilit]
- Naveed, S.; Stevens, G.; Robin-Kern, D. An Overview of the Empirical Evaluation of Explainable AI (XAI): A Comprehensive Guideline for User-Centered Evaluation in XAI. Appl. Sci. 2024, 14, 11288. [Google Scholar] [CrossRef] [Scilit]
- Cheng, X.; Wang, T.; Zhu, D.; Ma, J. Uncertainty explanation of artificial intelligence models by SHAP. Knowl.-Based Syst. 2026, 337, 115437. [Google Scholar] [CrossRef] [Scilit]
- Tutsoy, O.; Balikci, K.; Ozdil, N.F. Unknown uncertainties in the COVID-19 pandemic: Multi-dimensional identification and mathematical modelling for the analysis and estimation of the casualties. Digit. Signal Process. 2021, 114, 103058. [Google Scholar] [CrossRef] [Scilit]
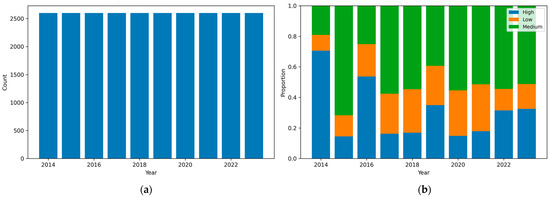
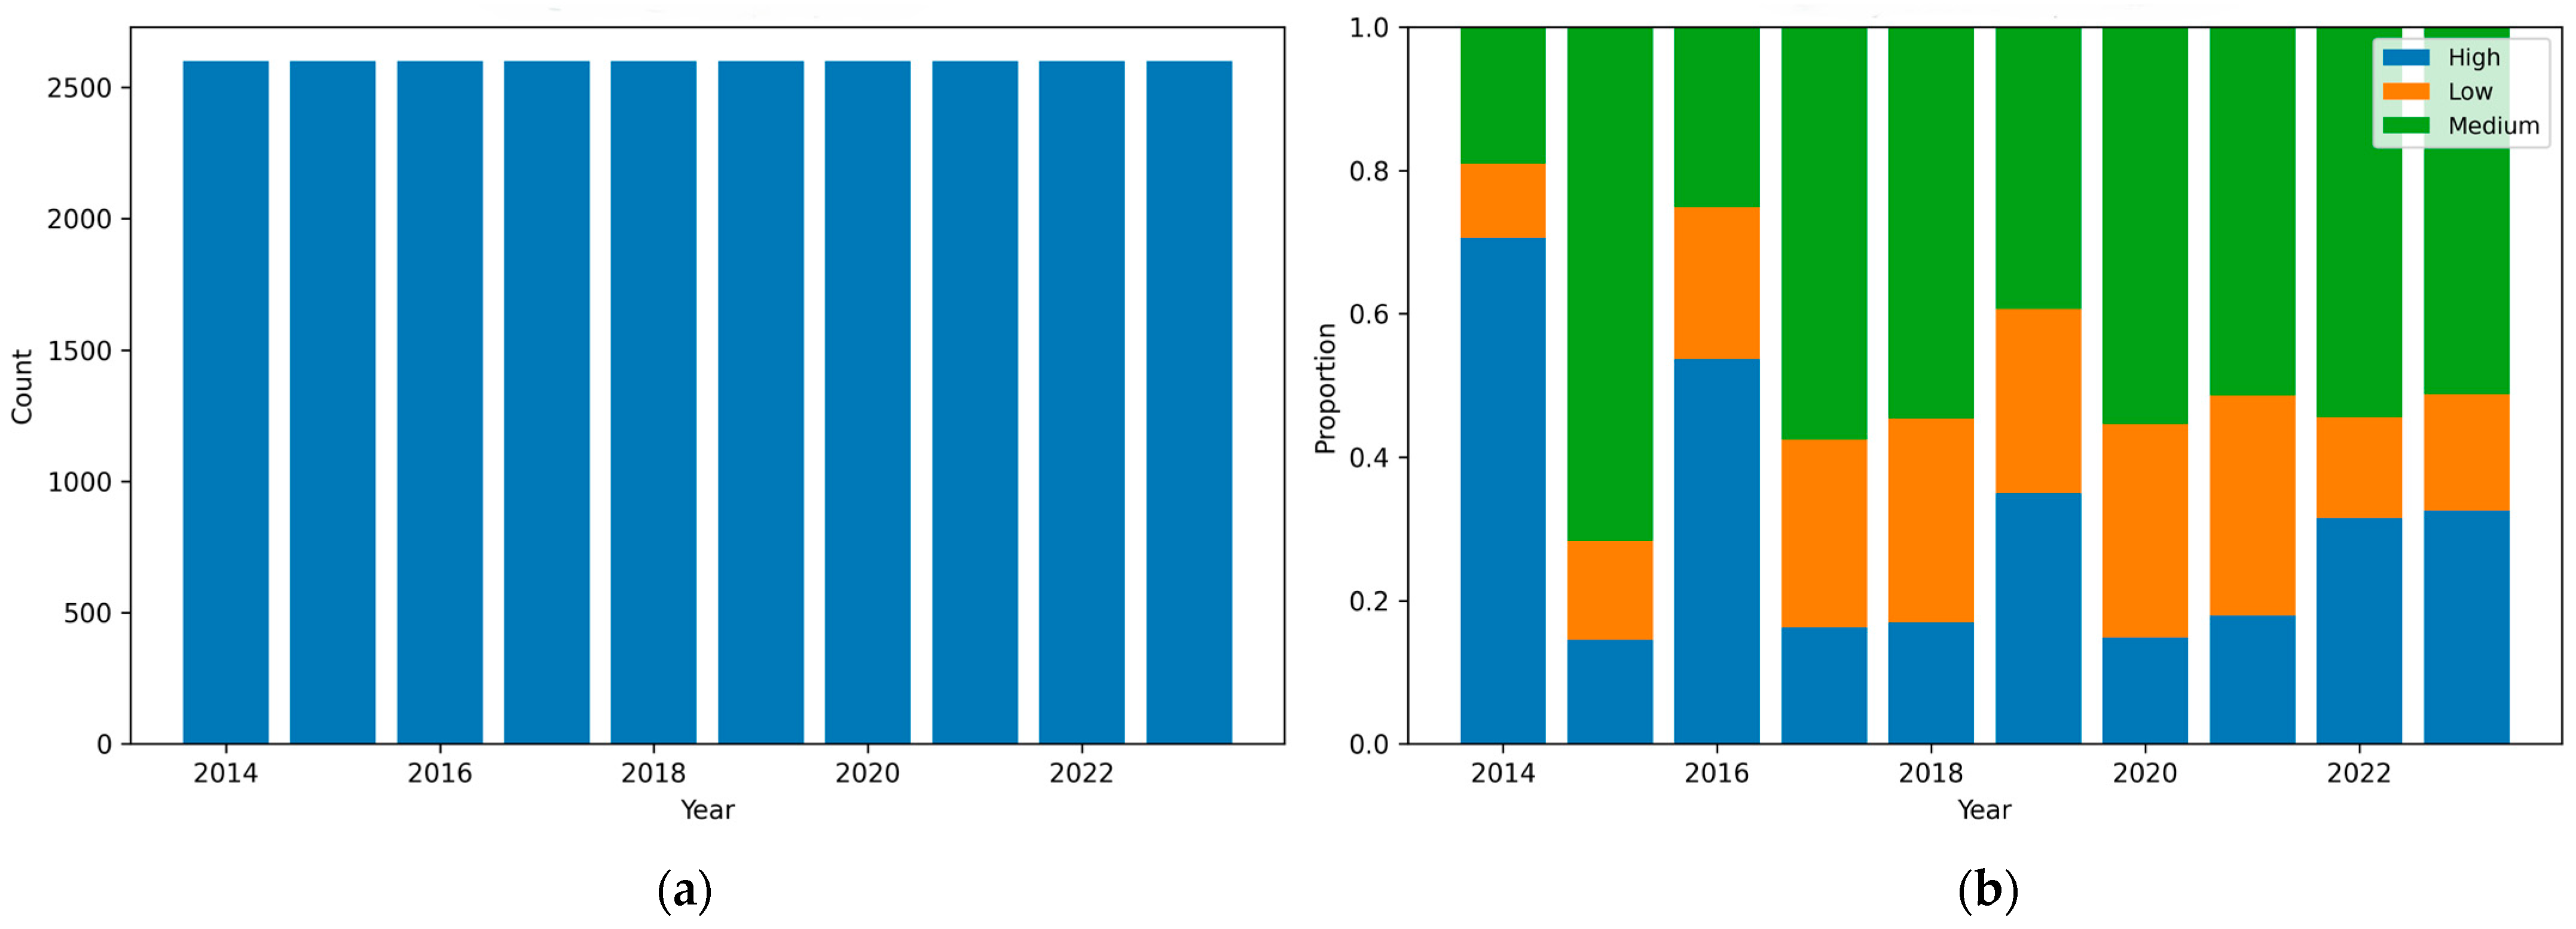
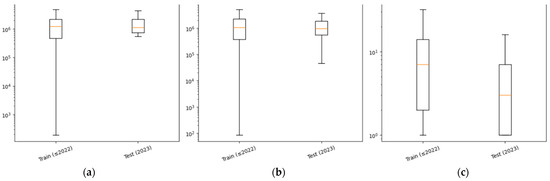
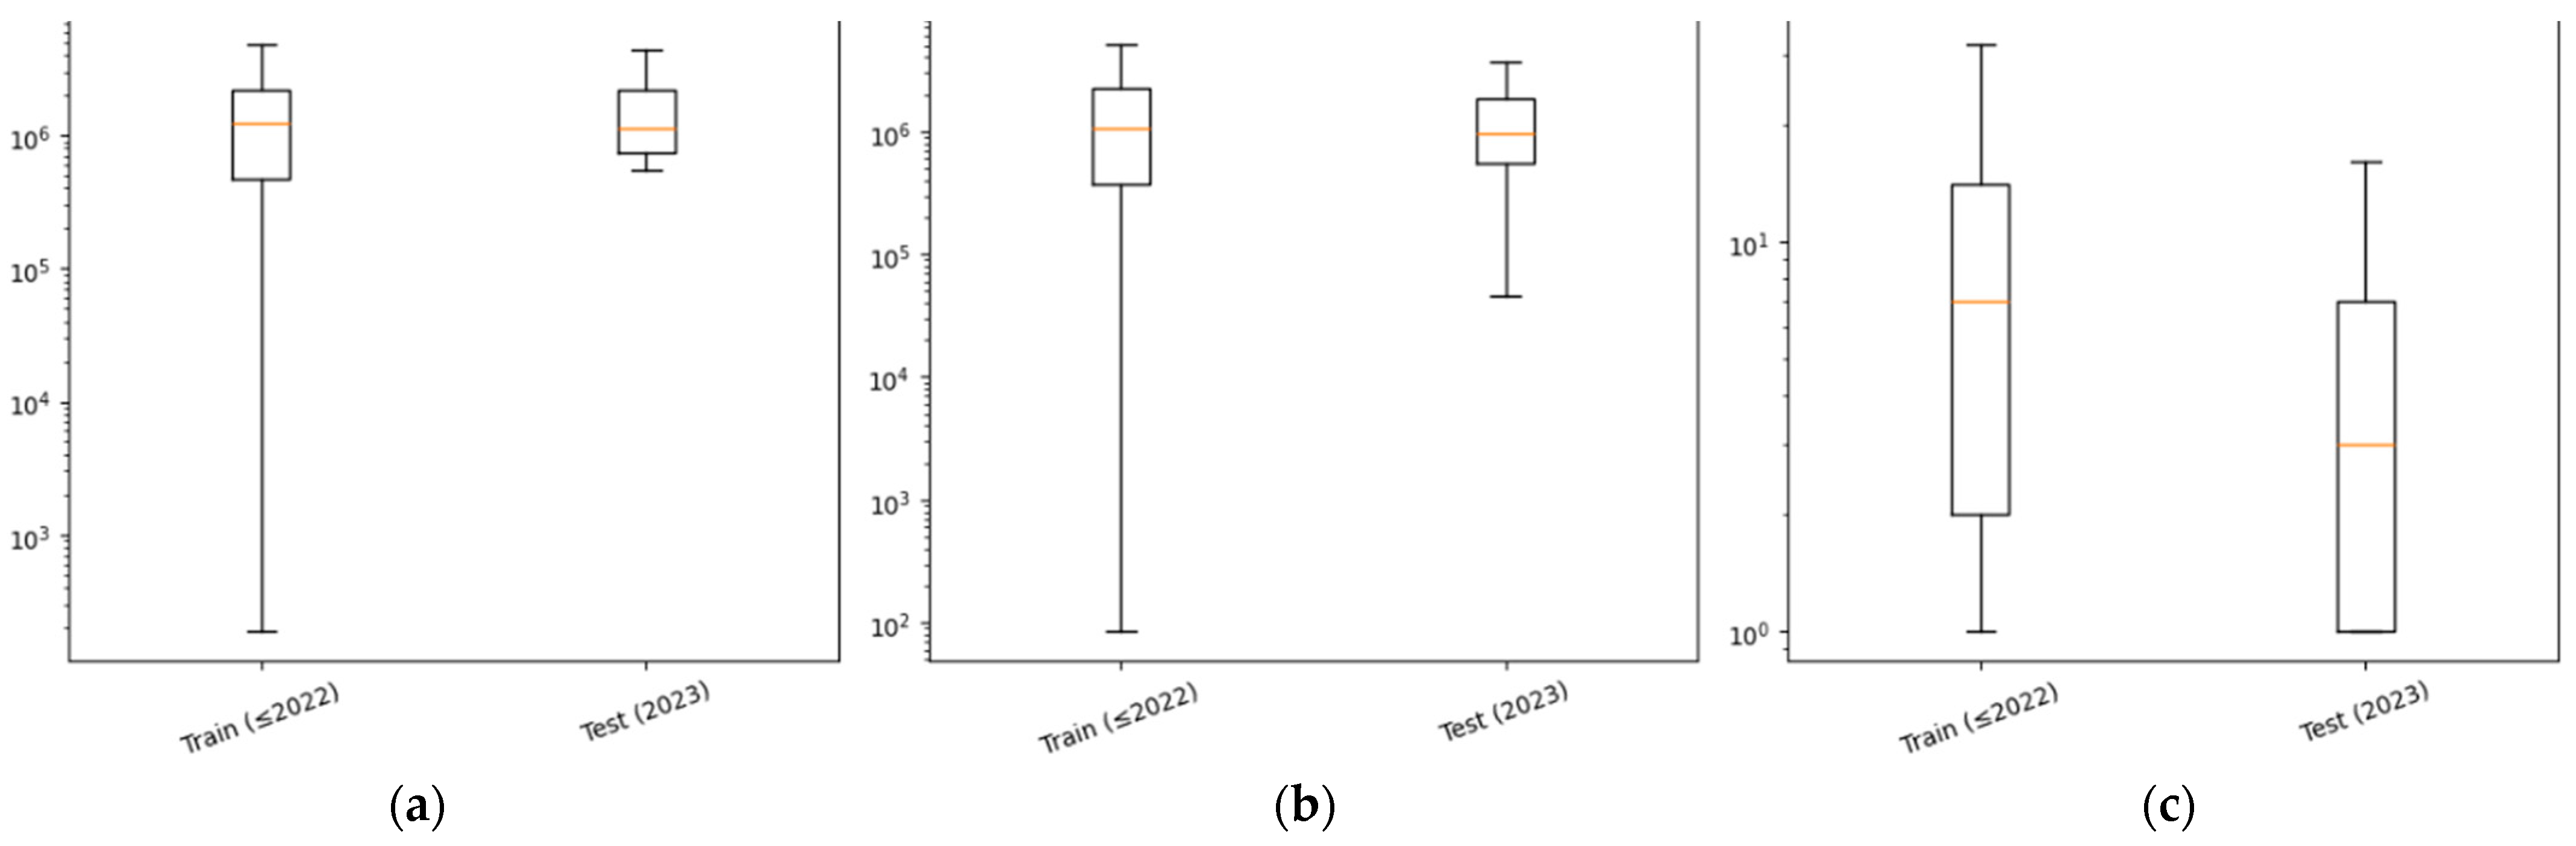
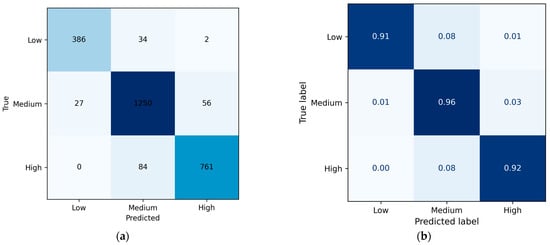
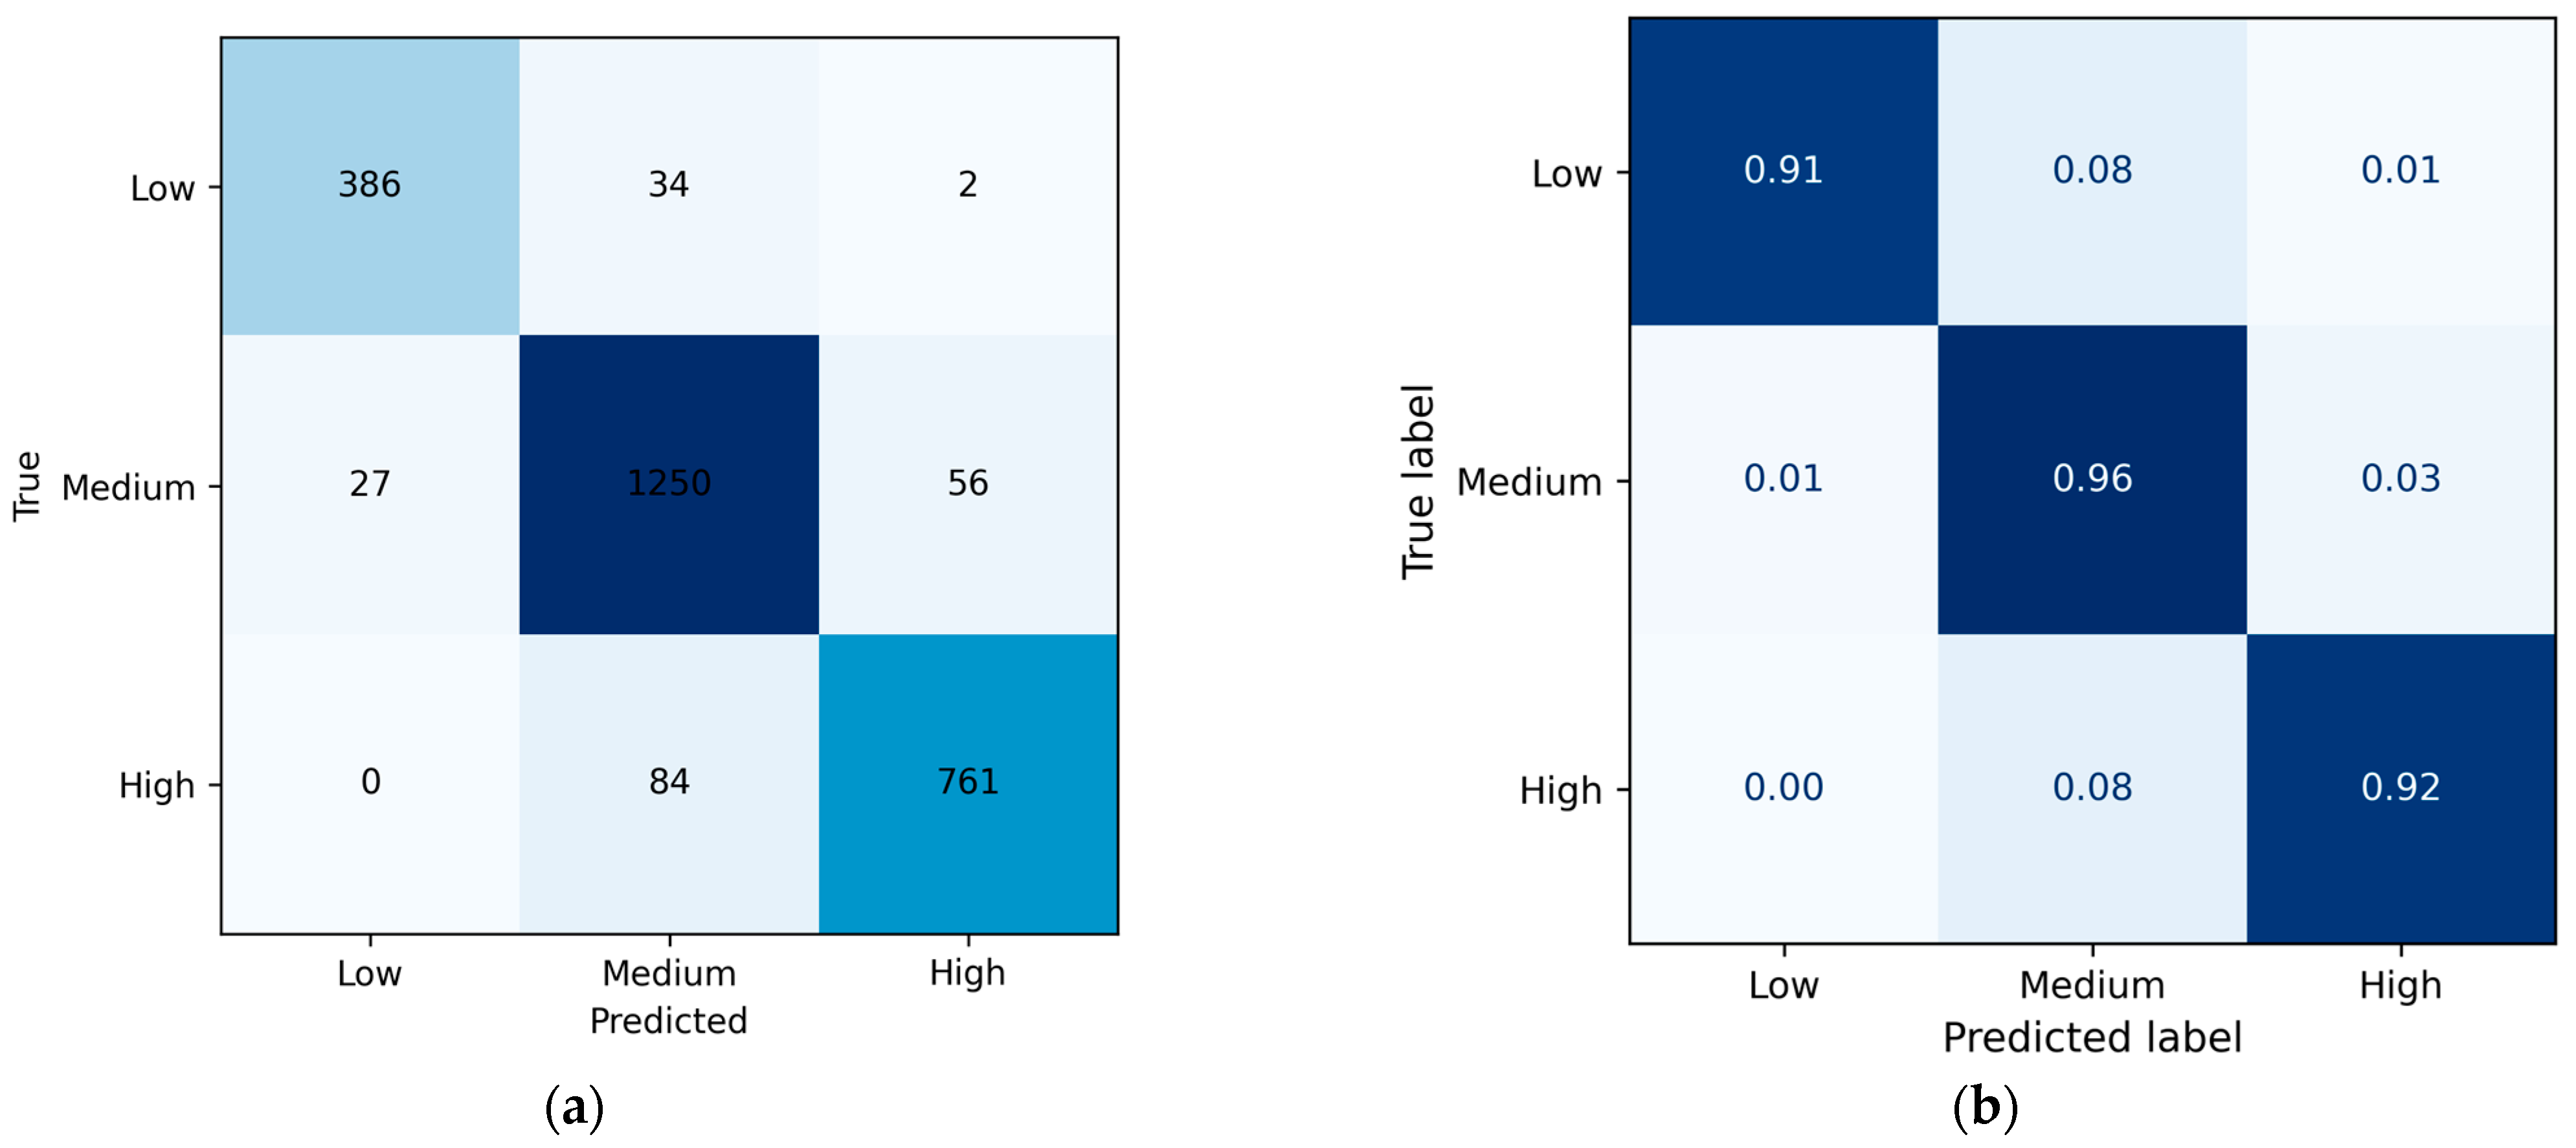
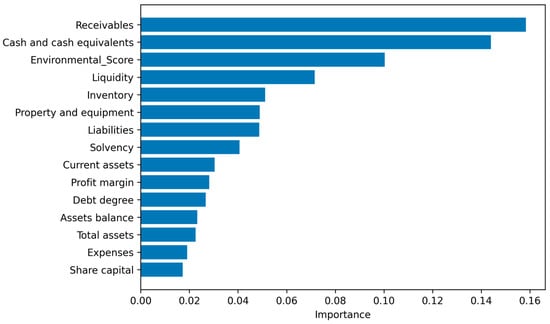
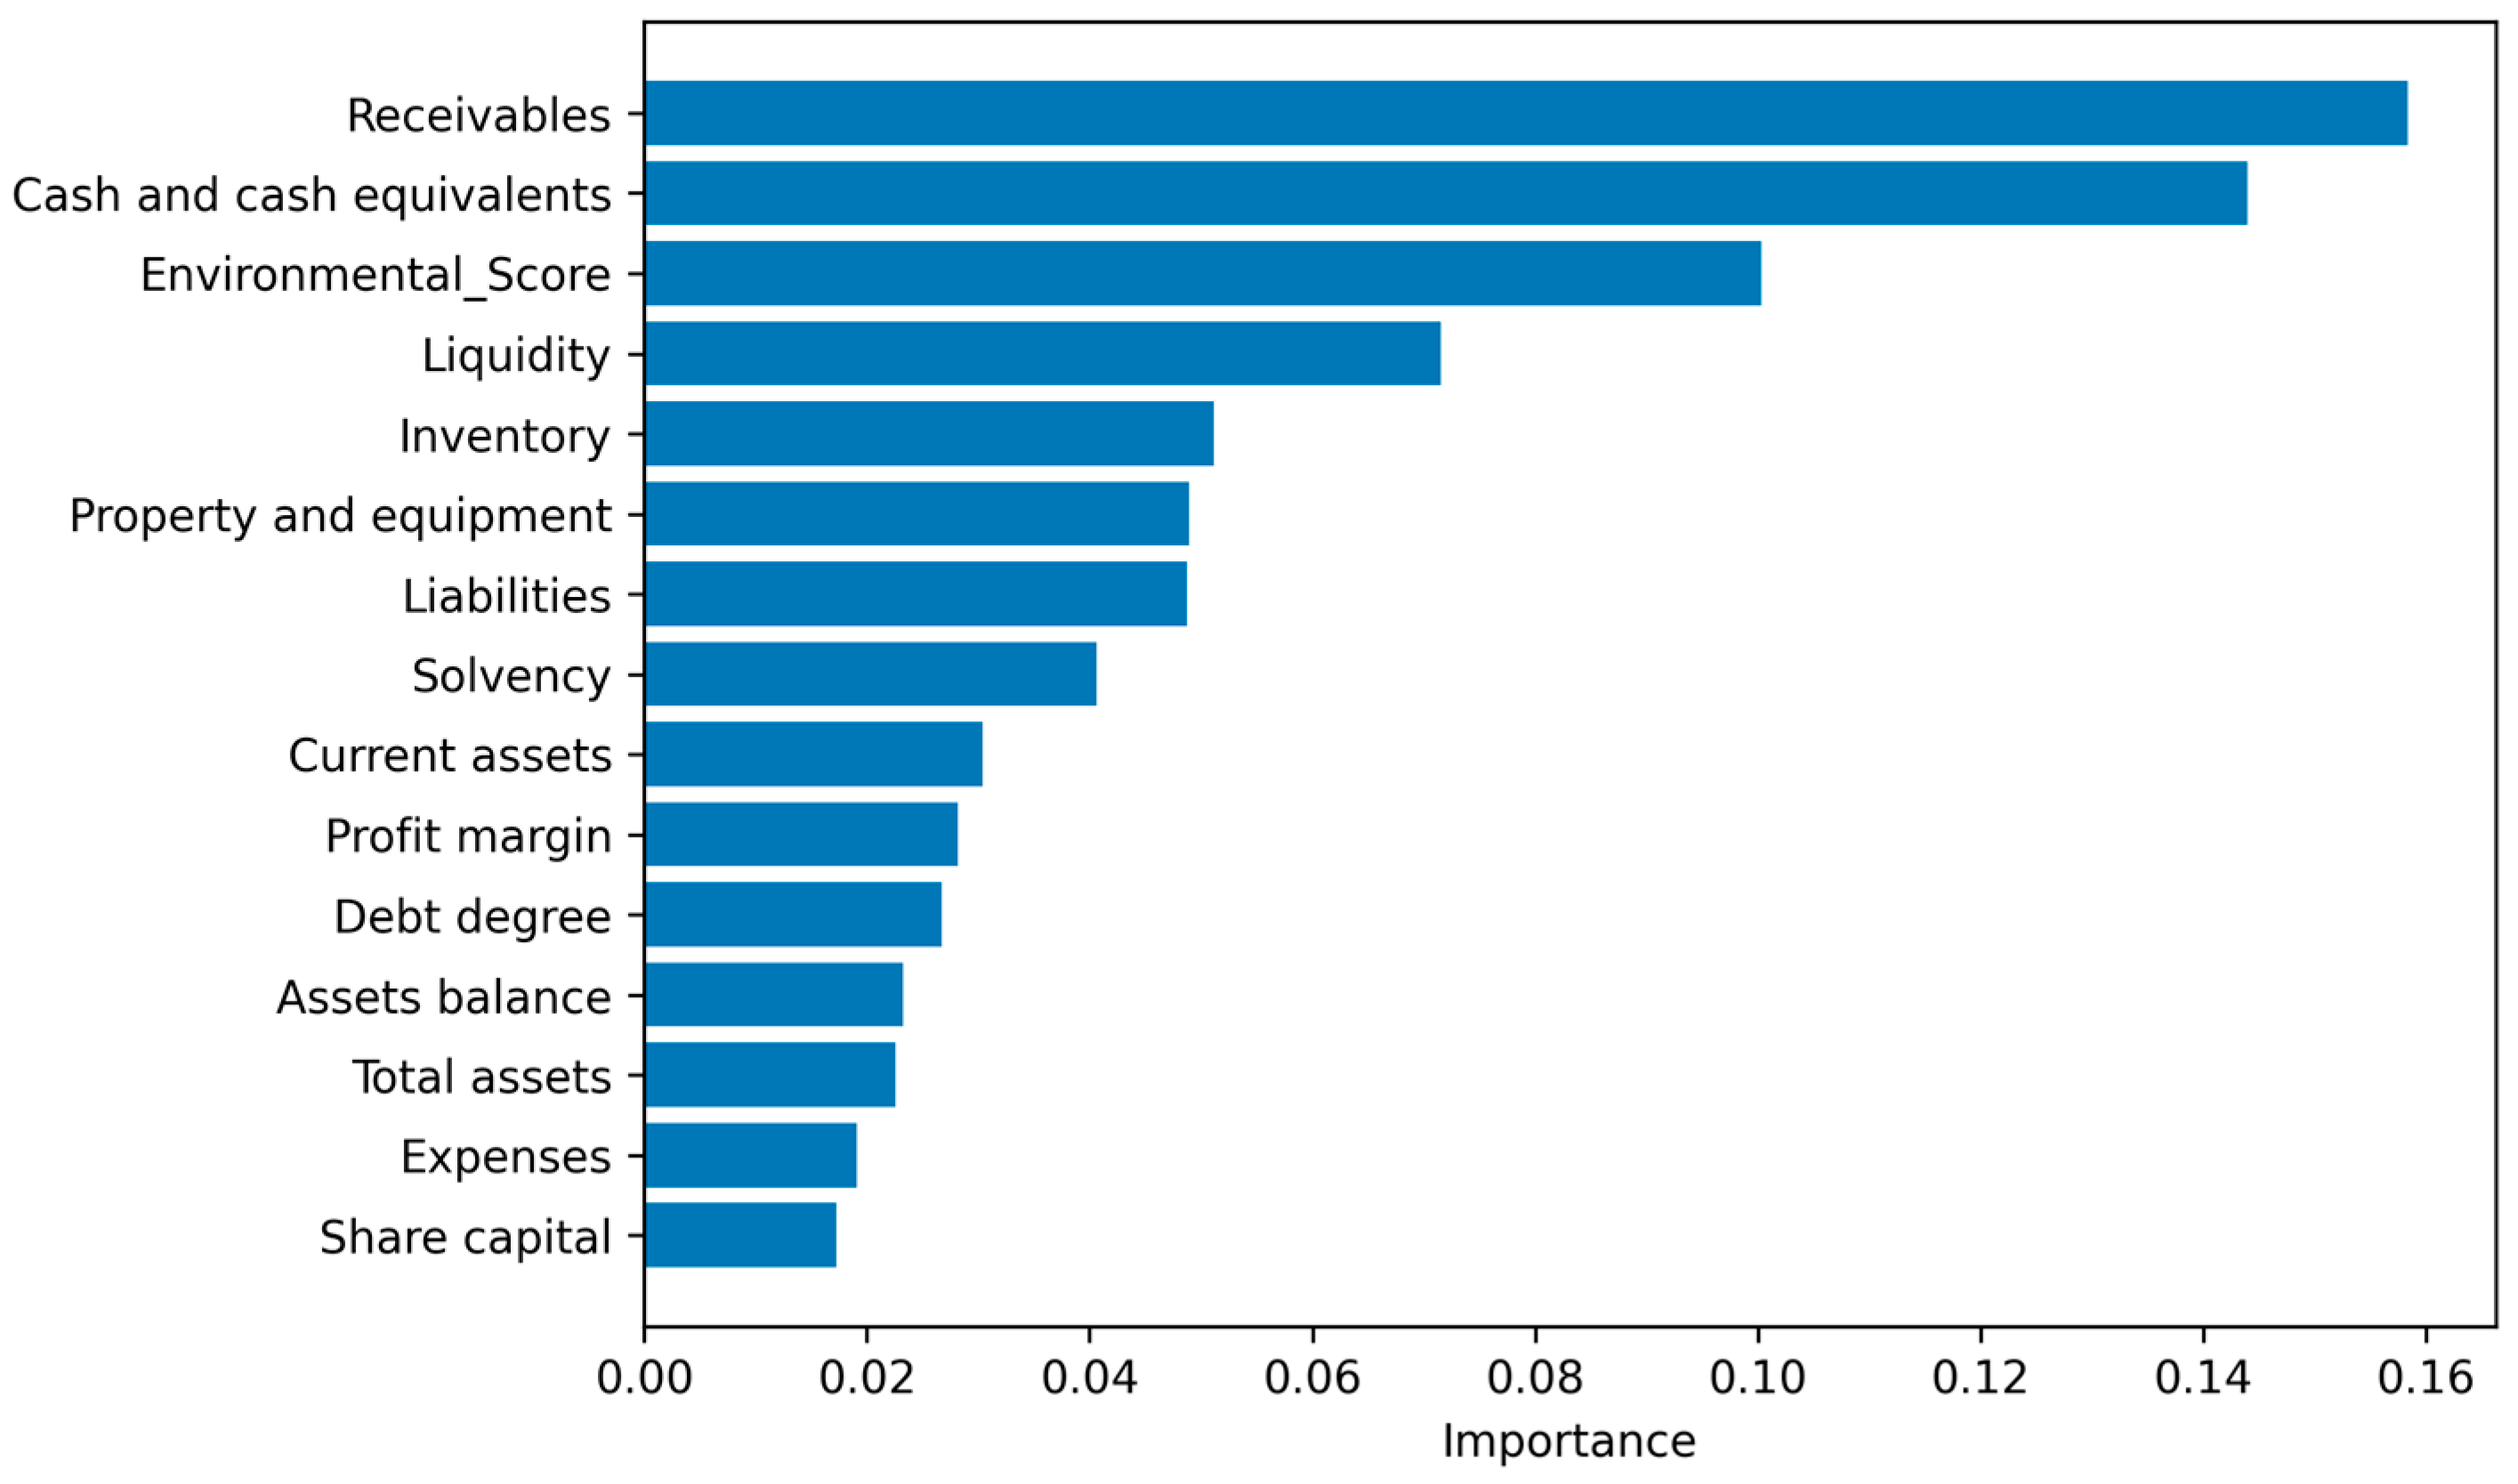
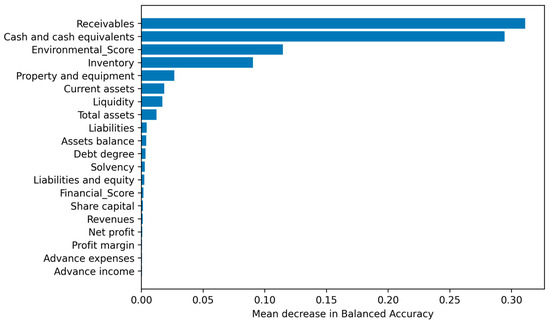
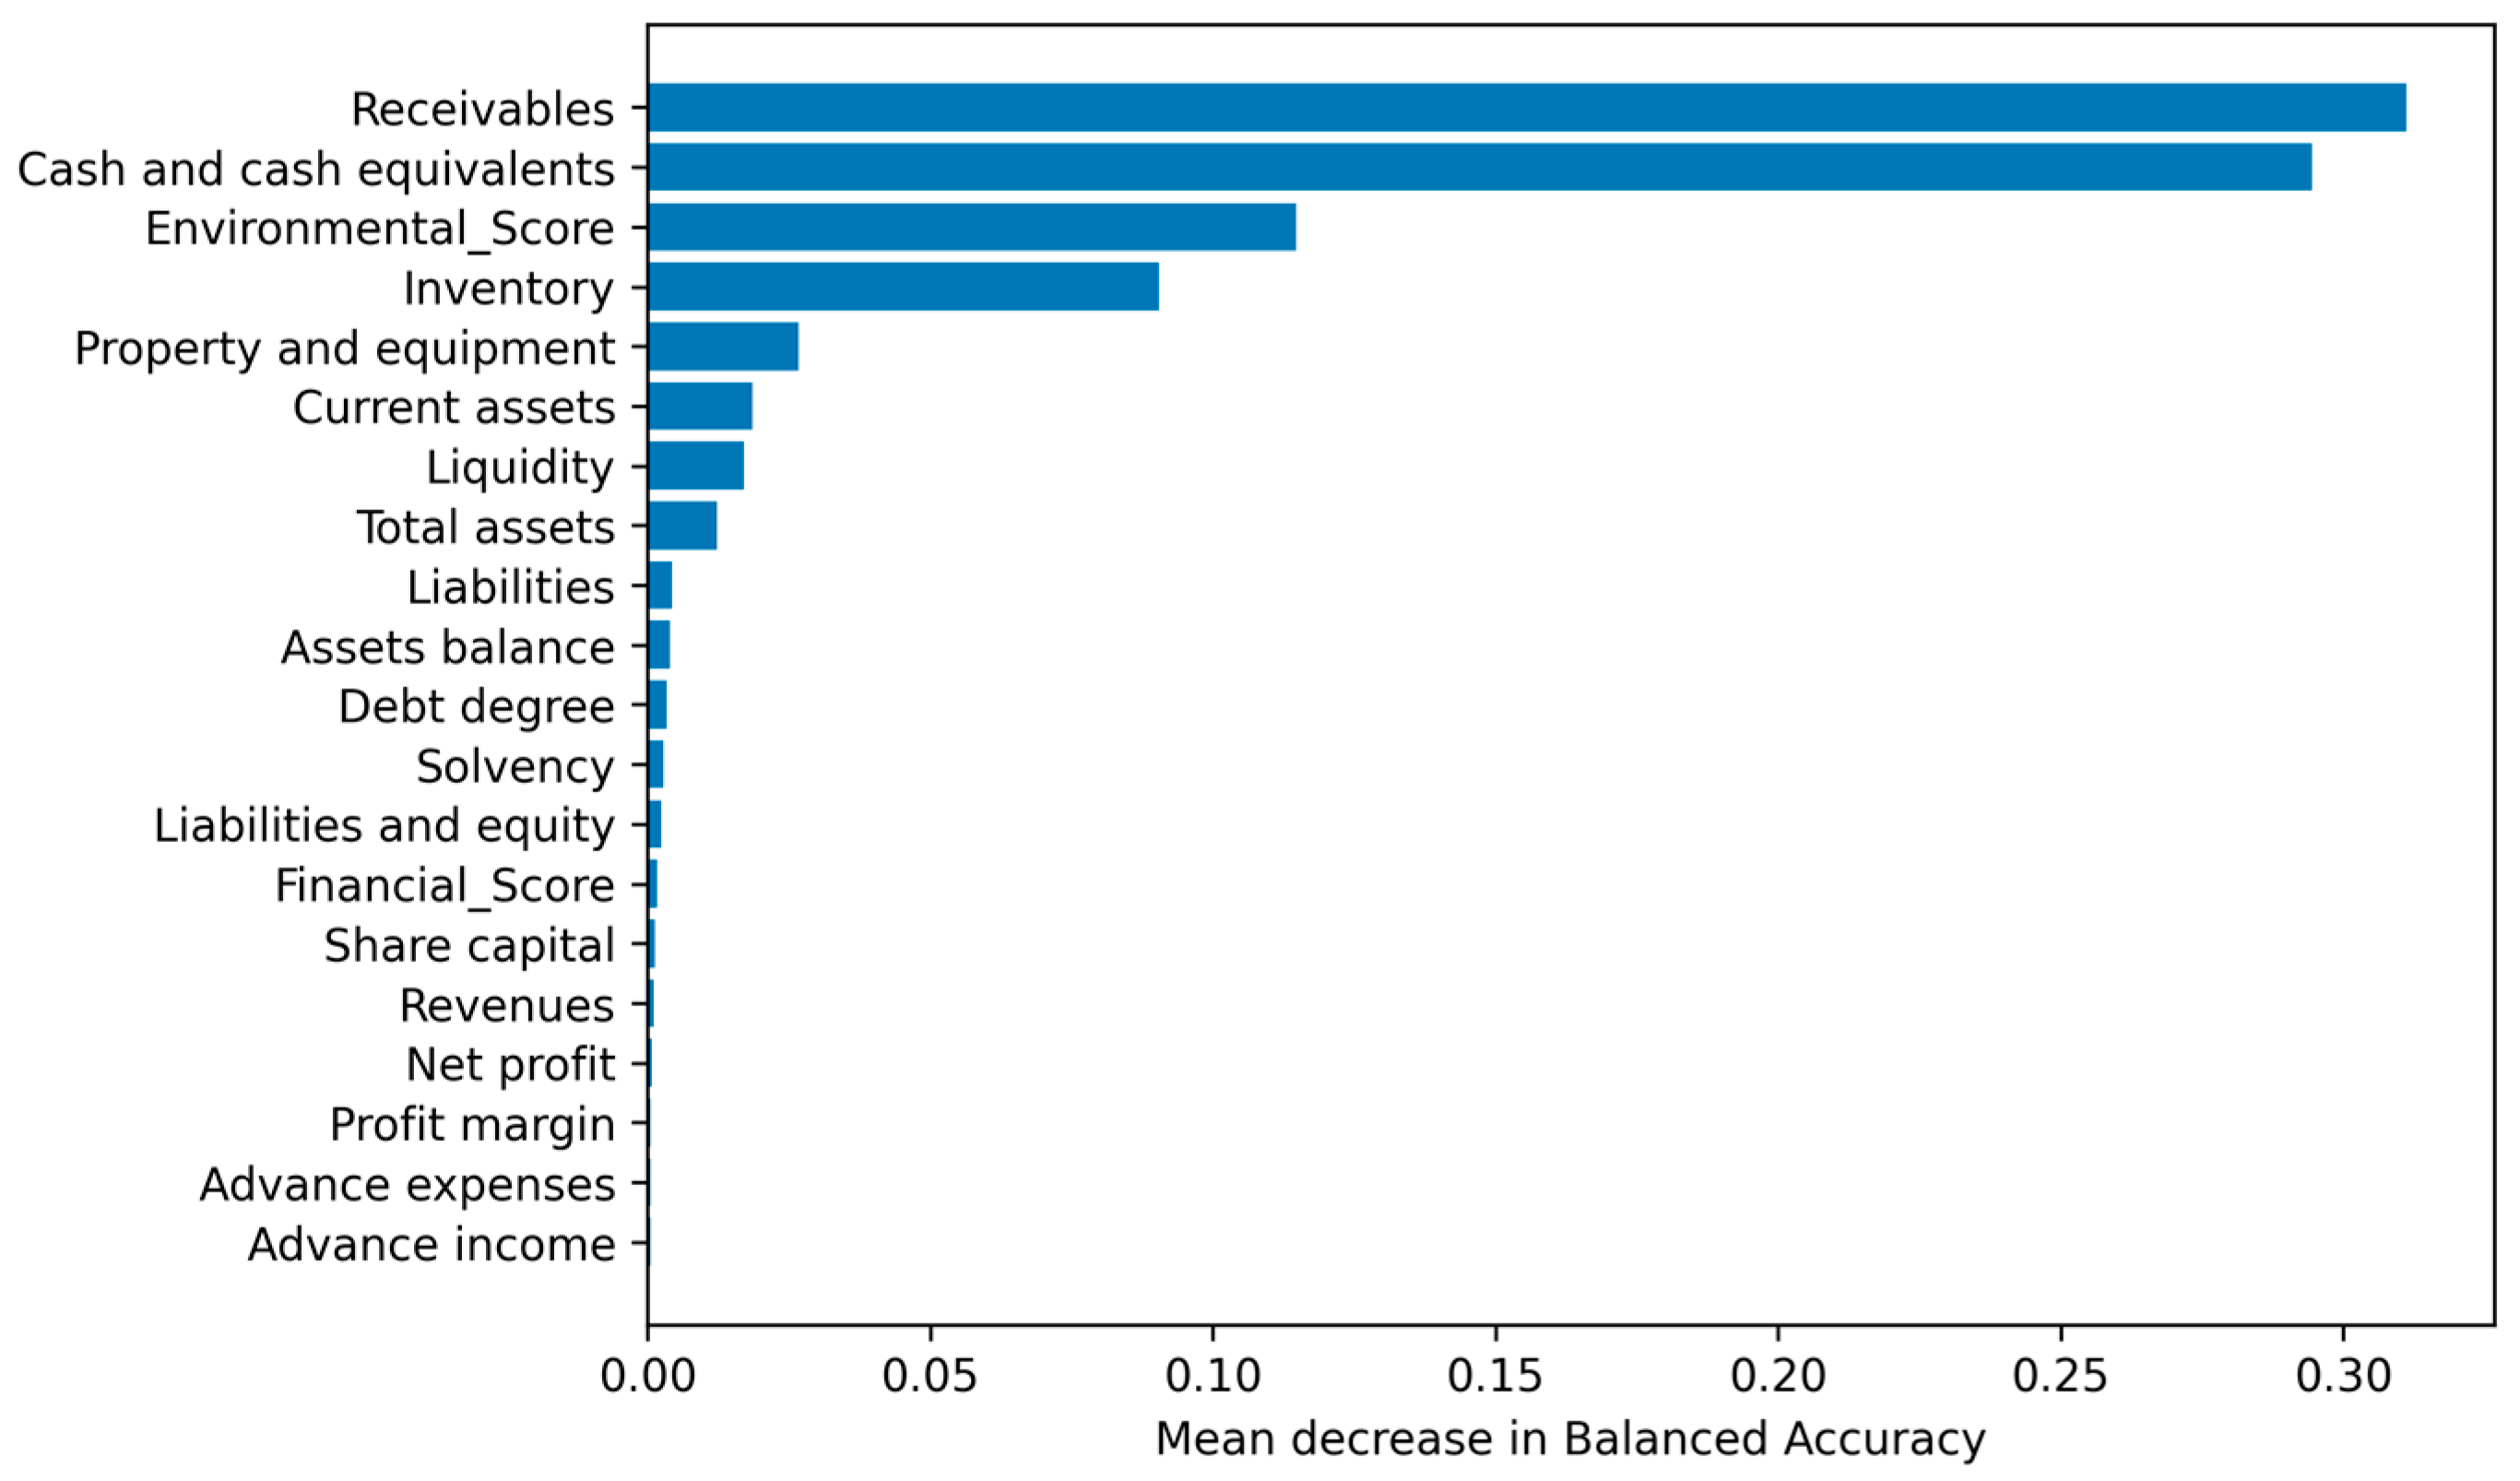
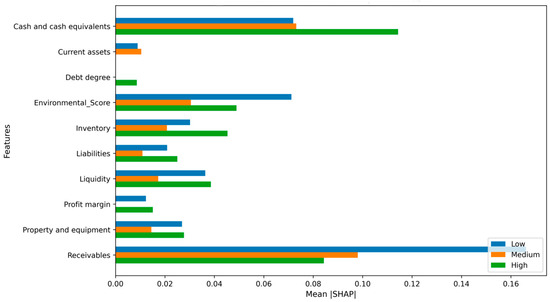
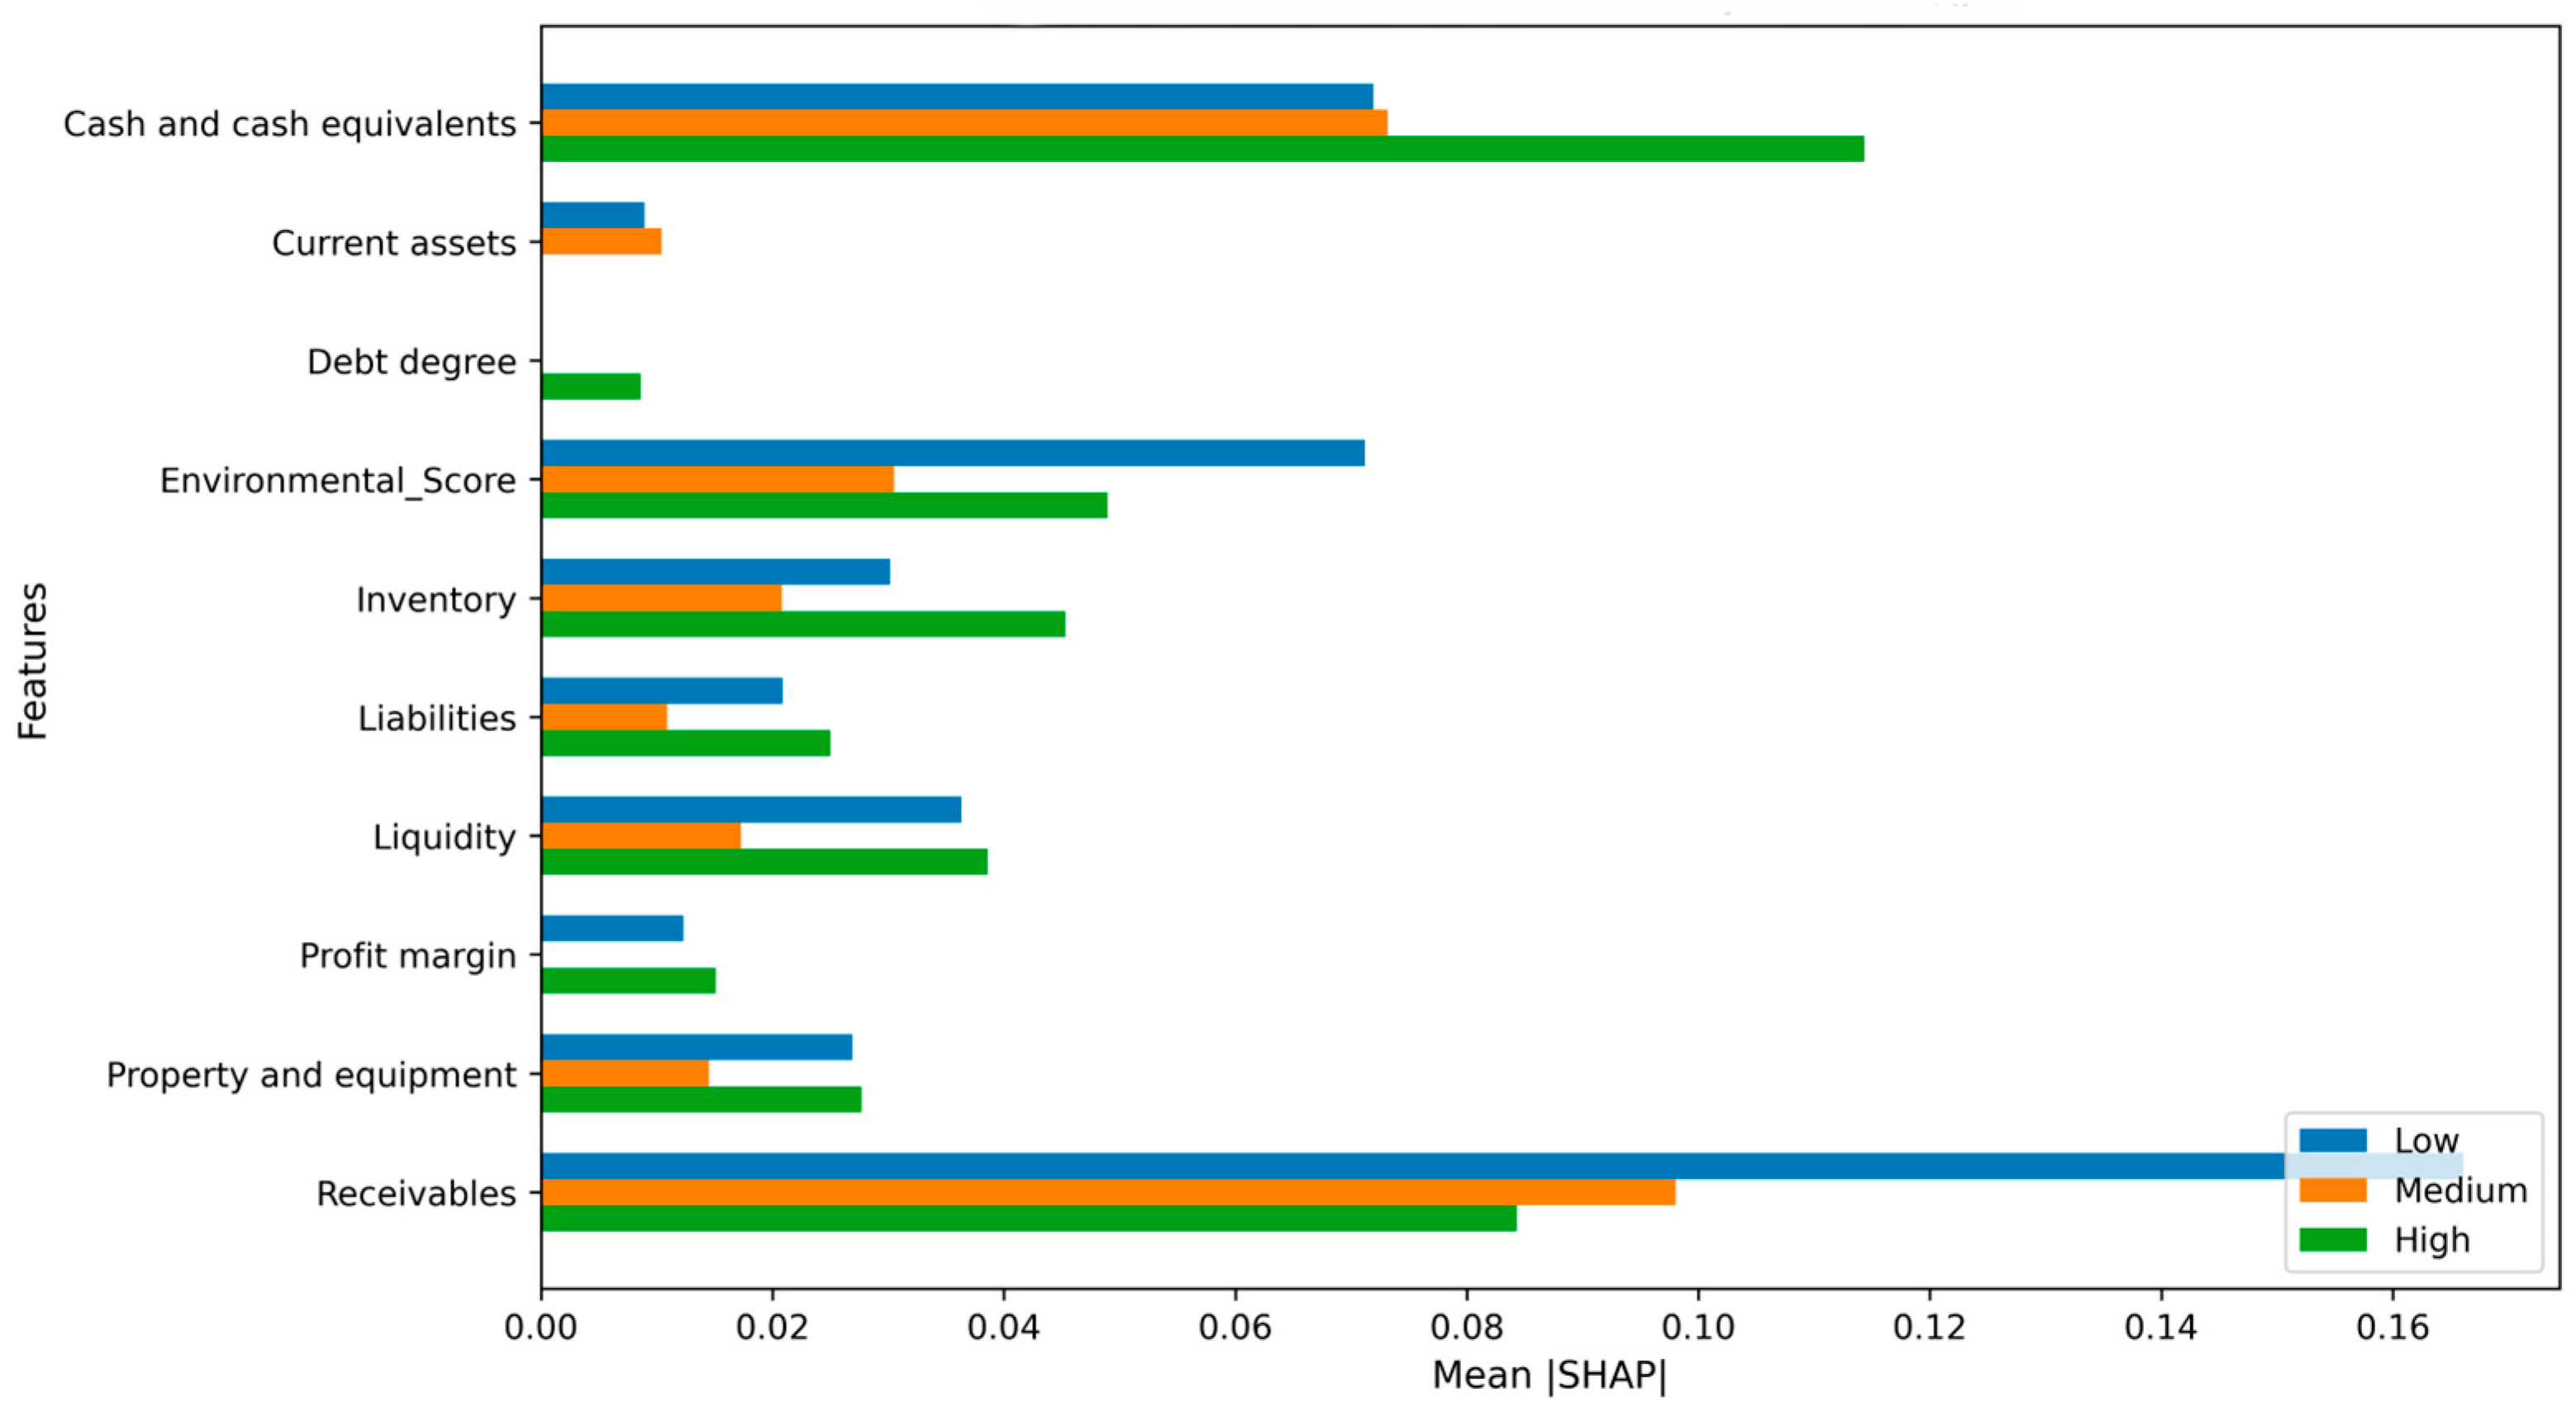
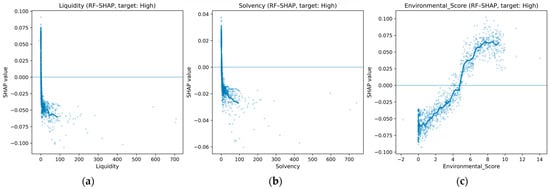
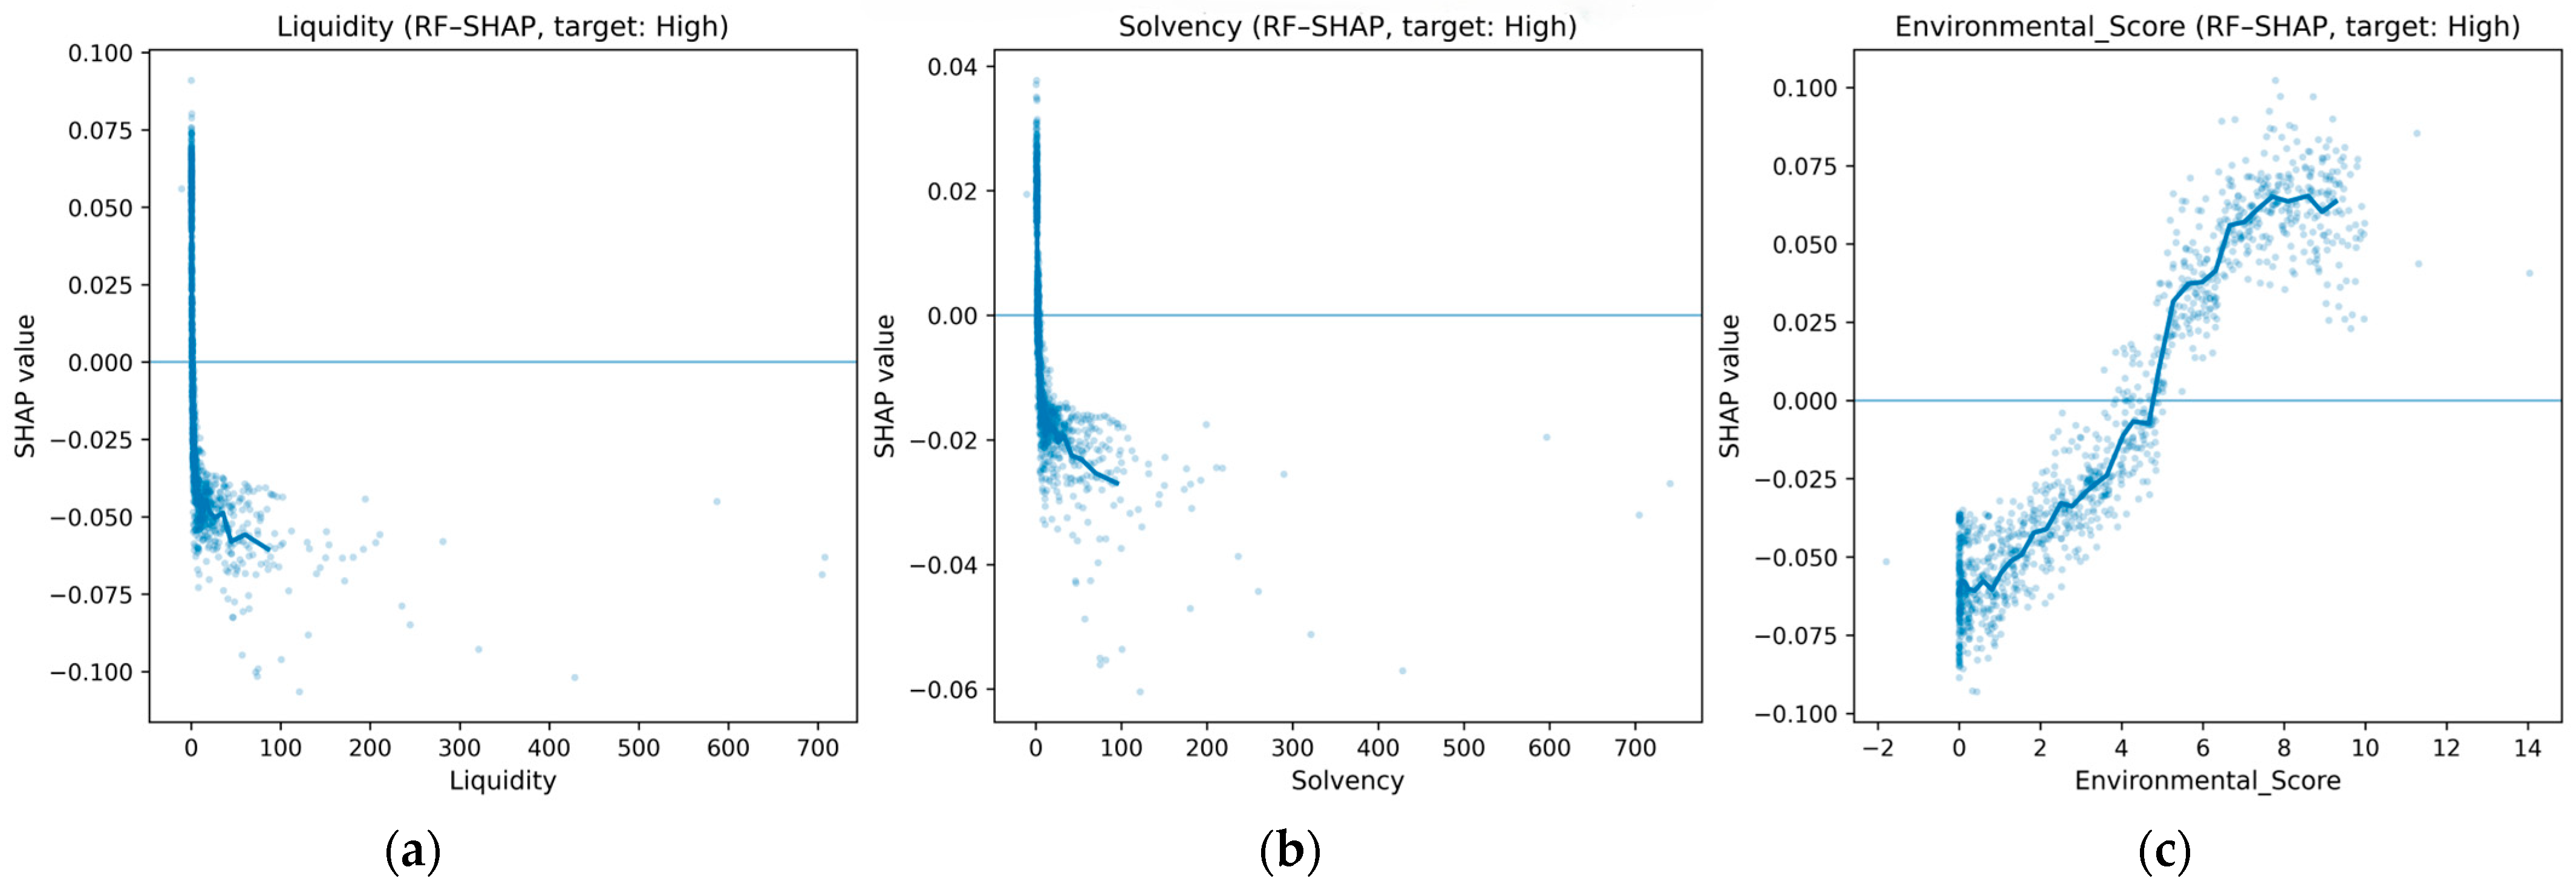
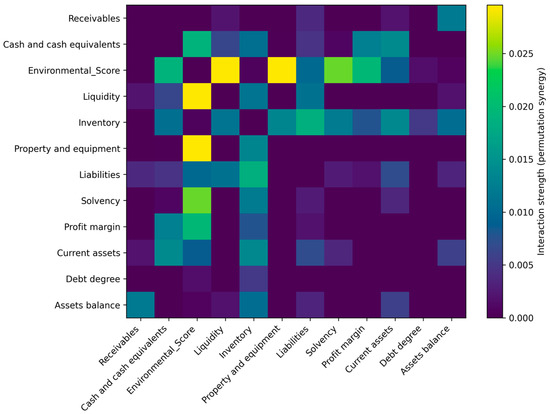
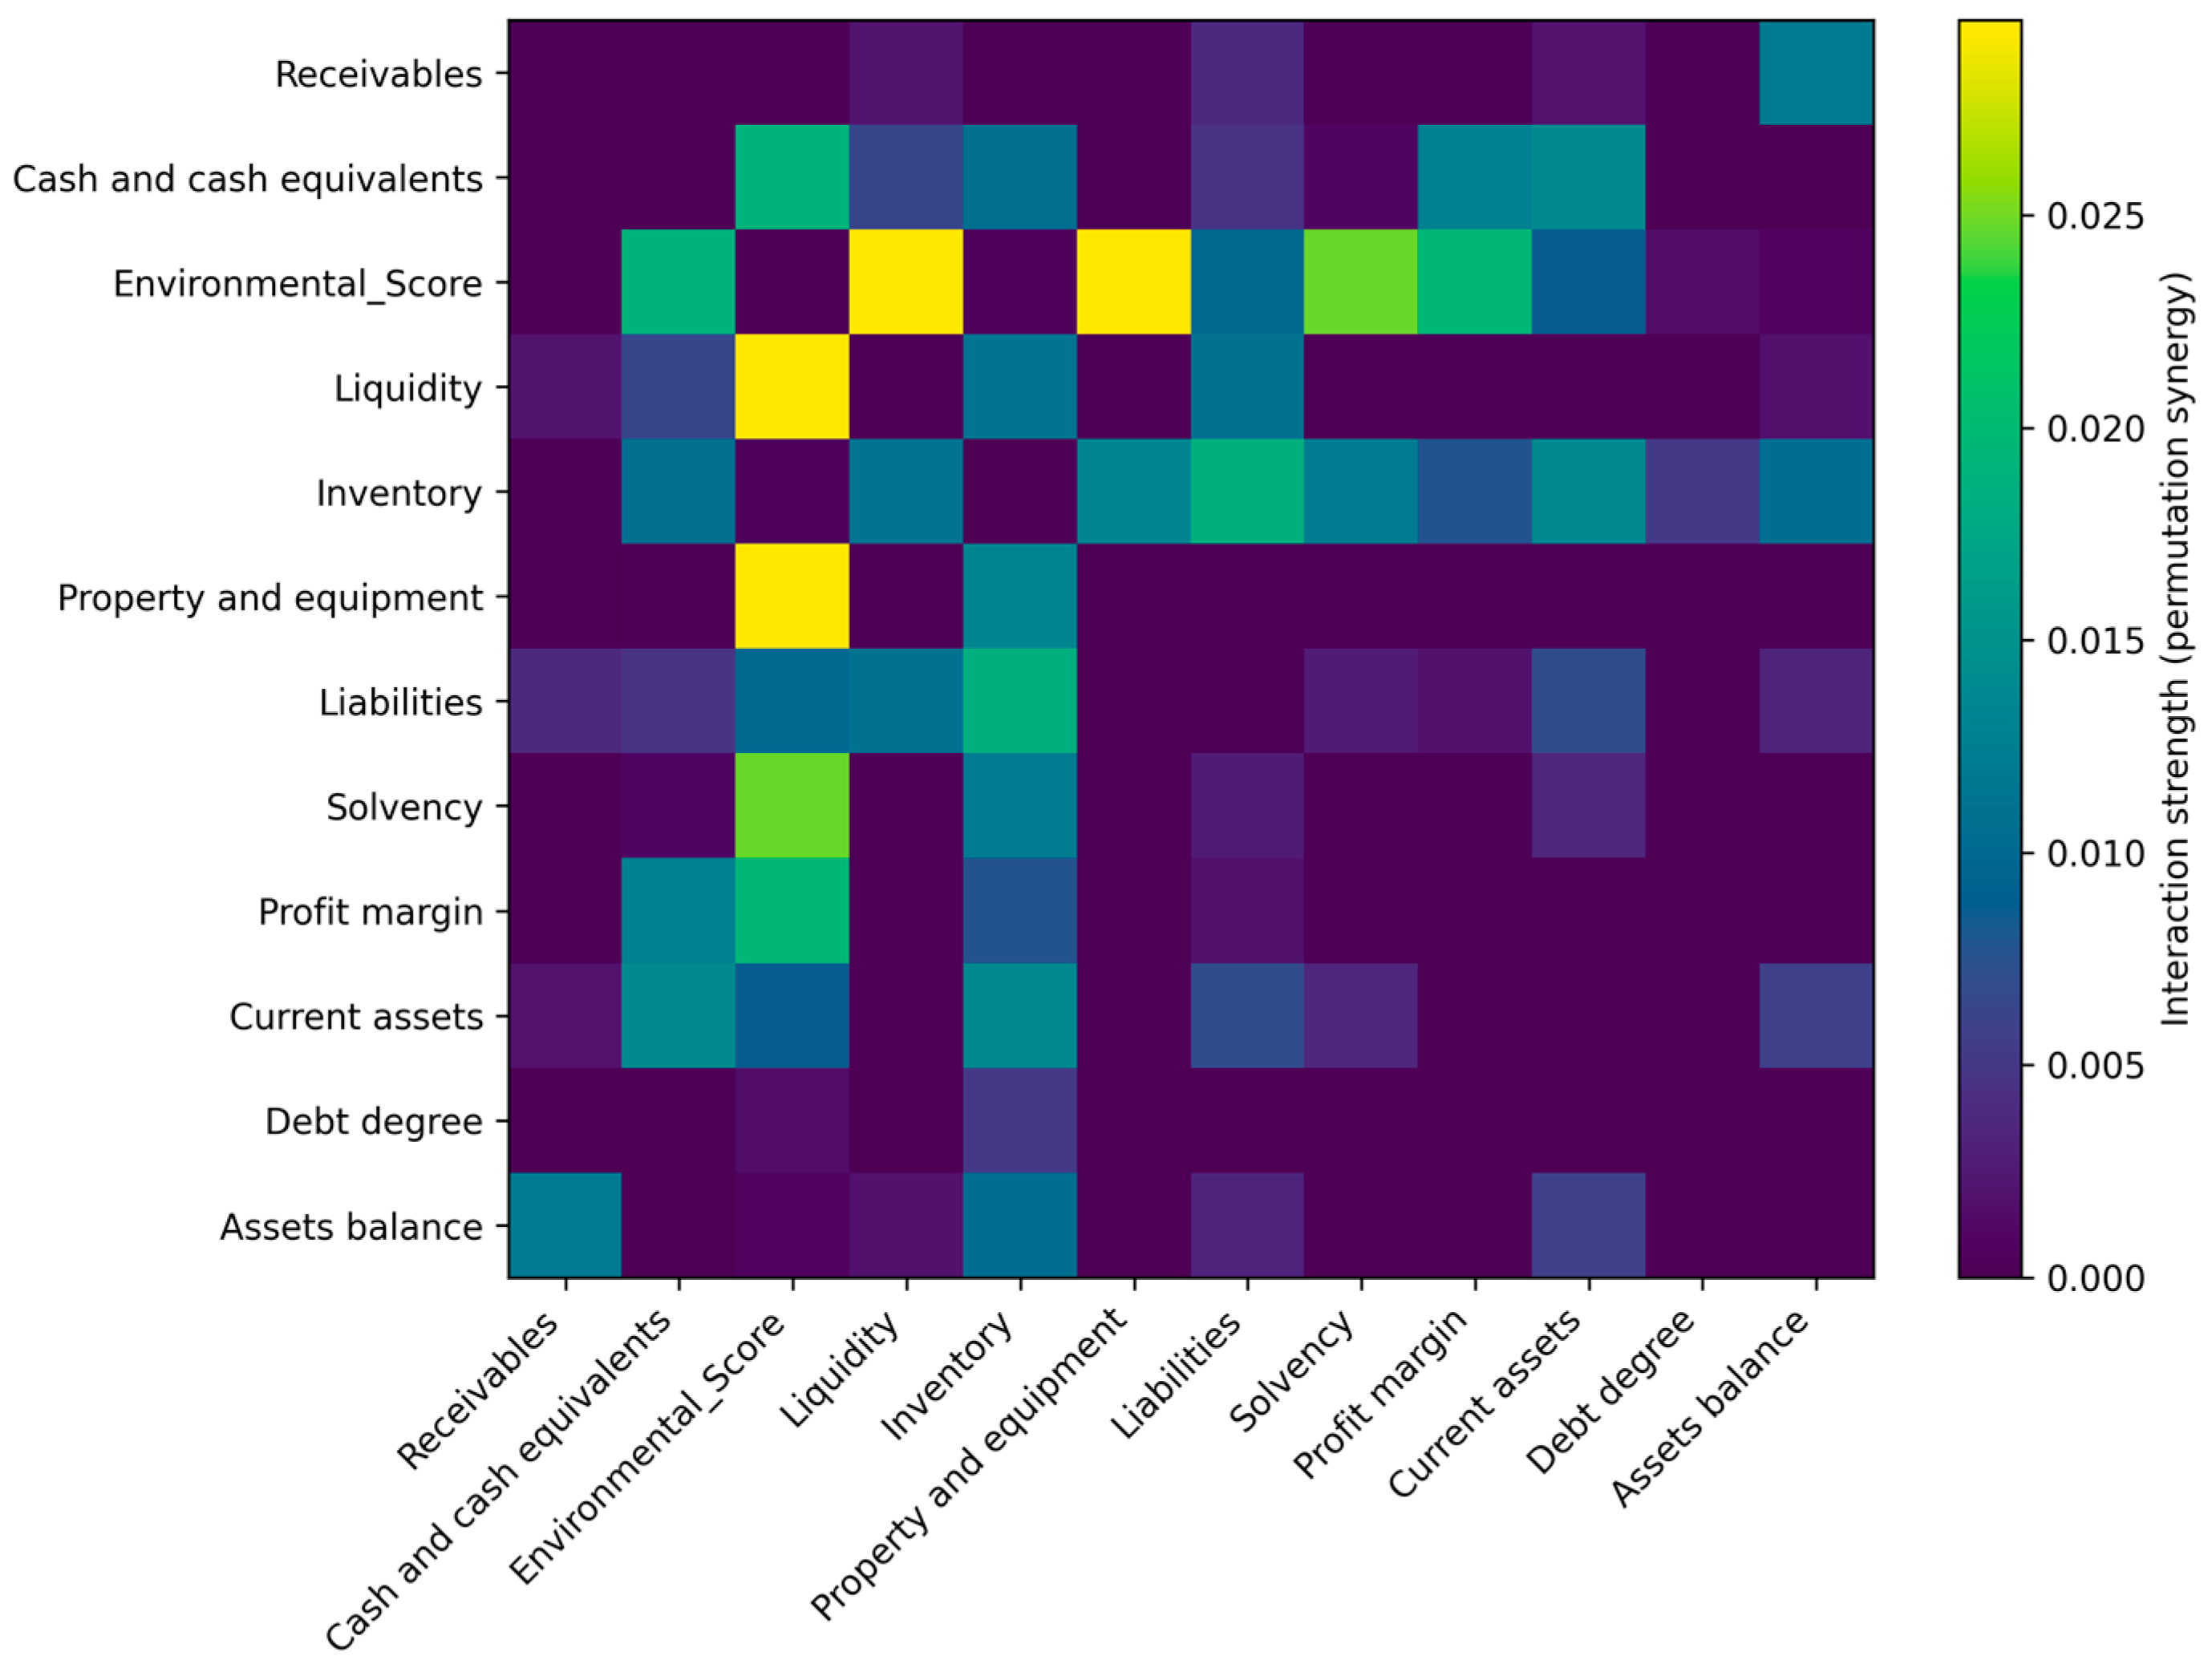
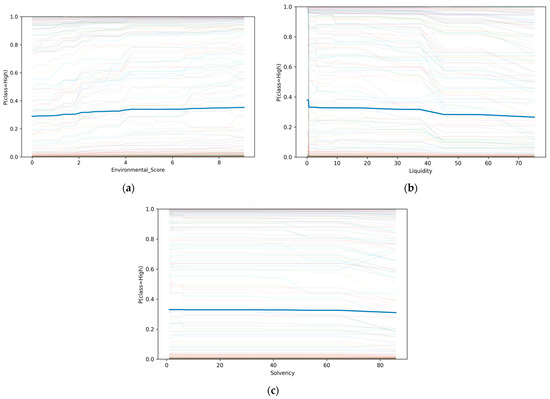
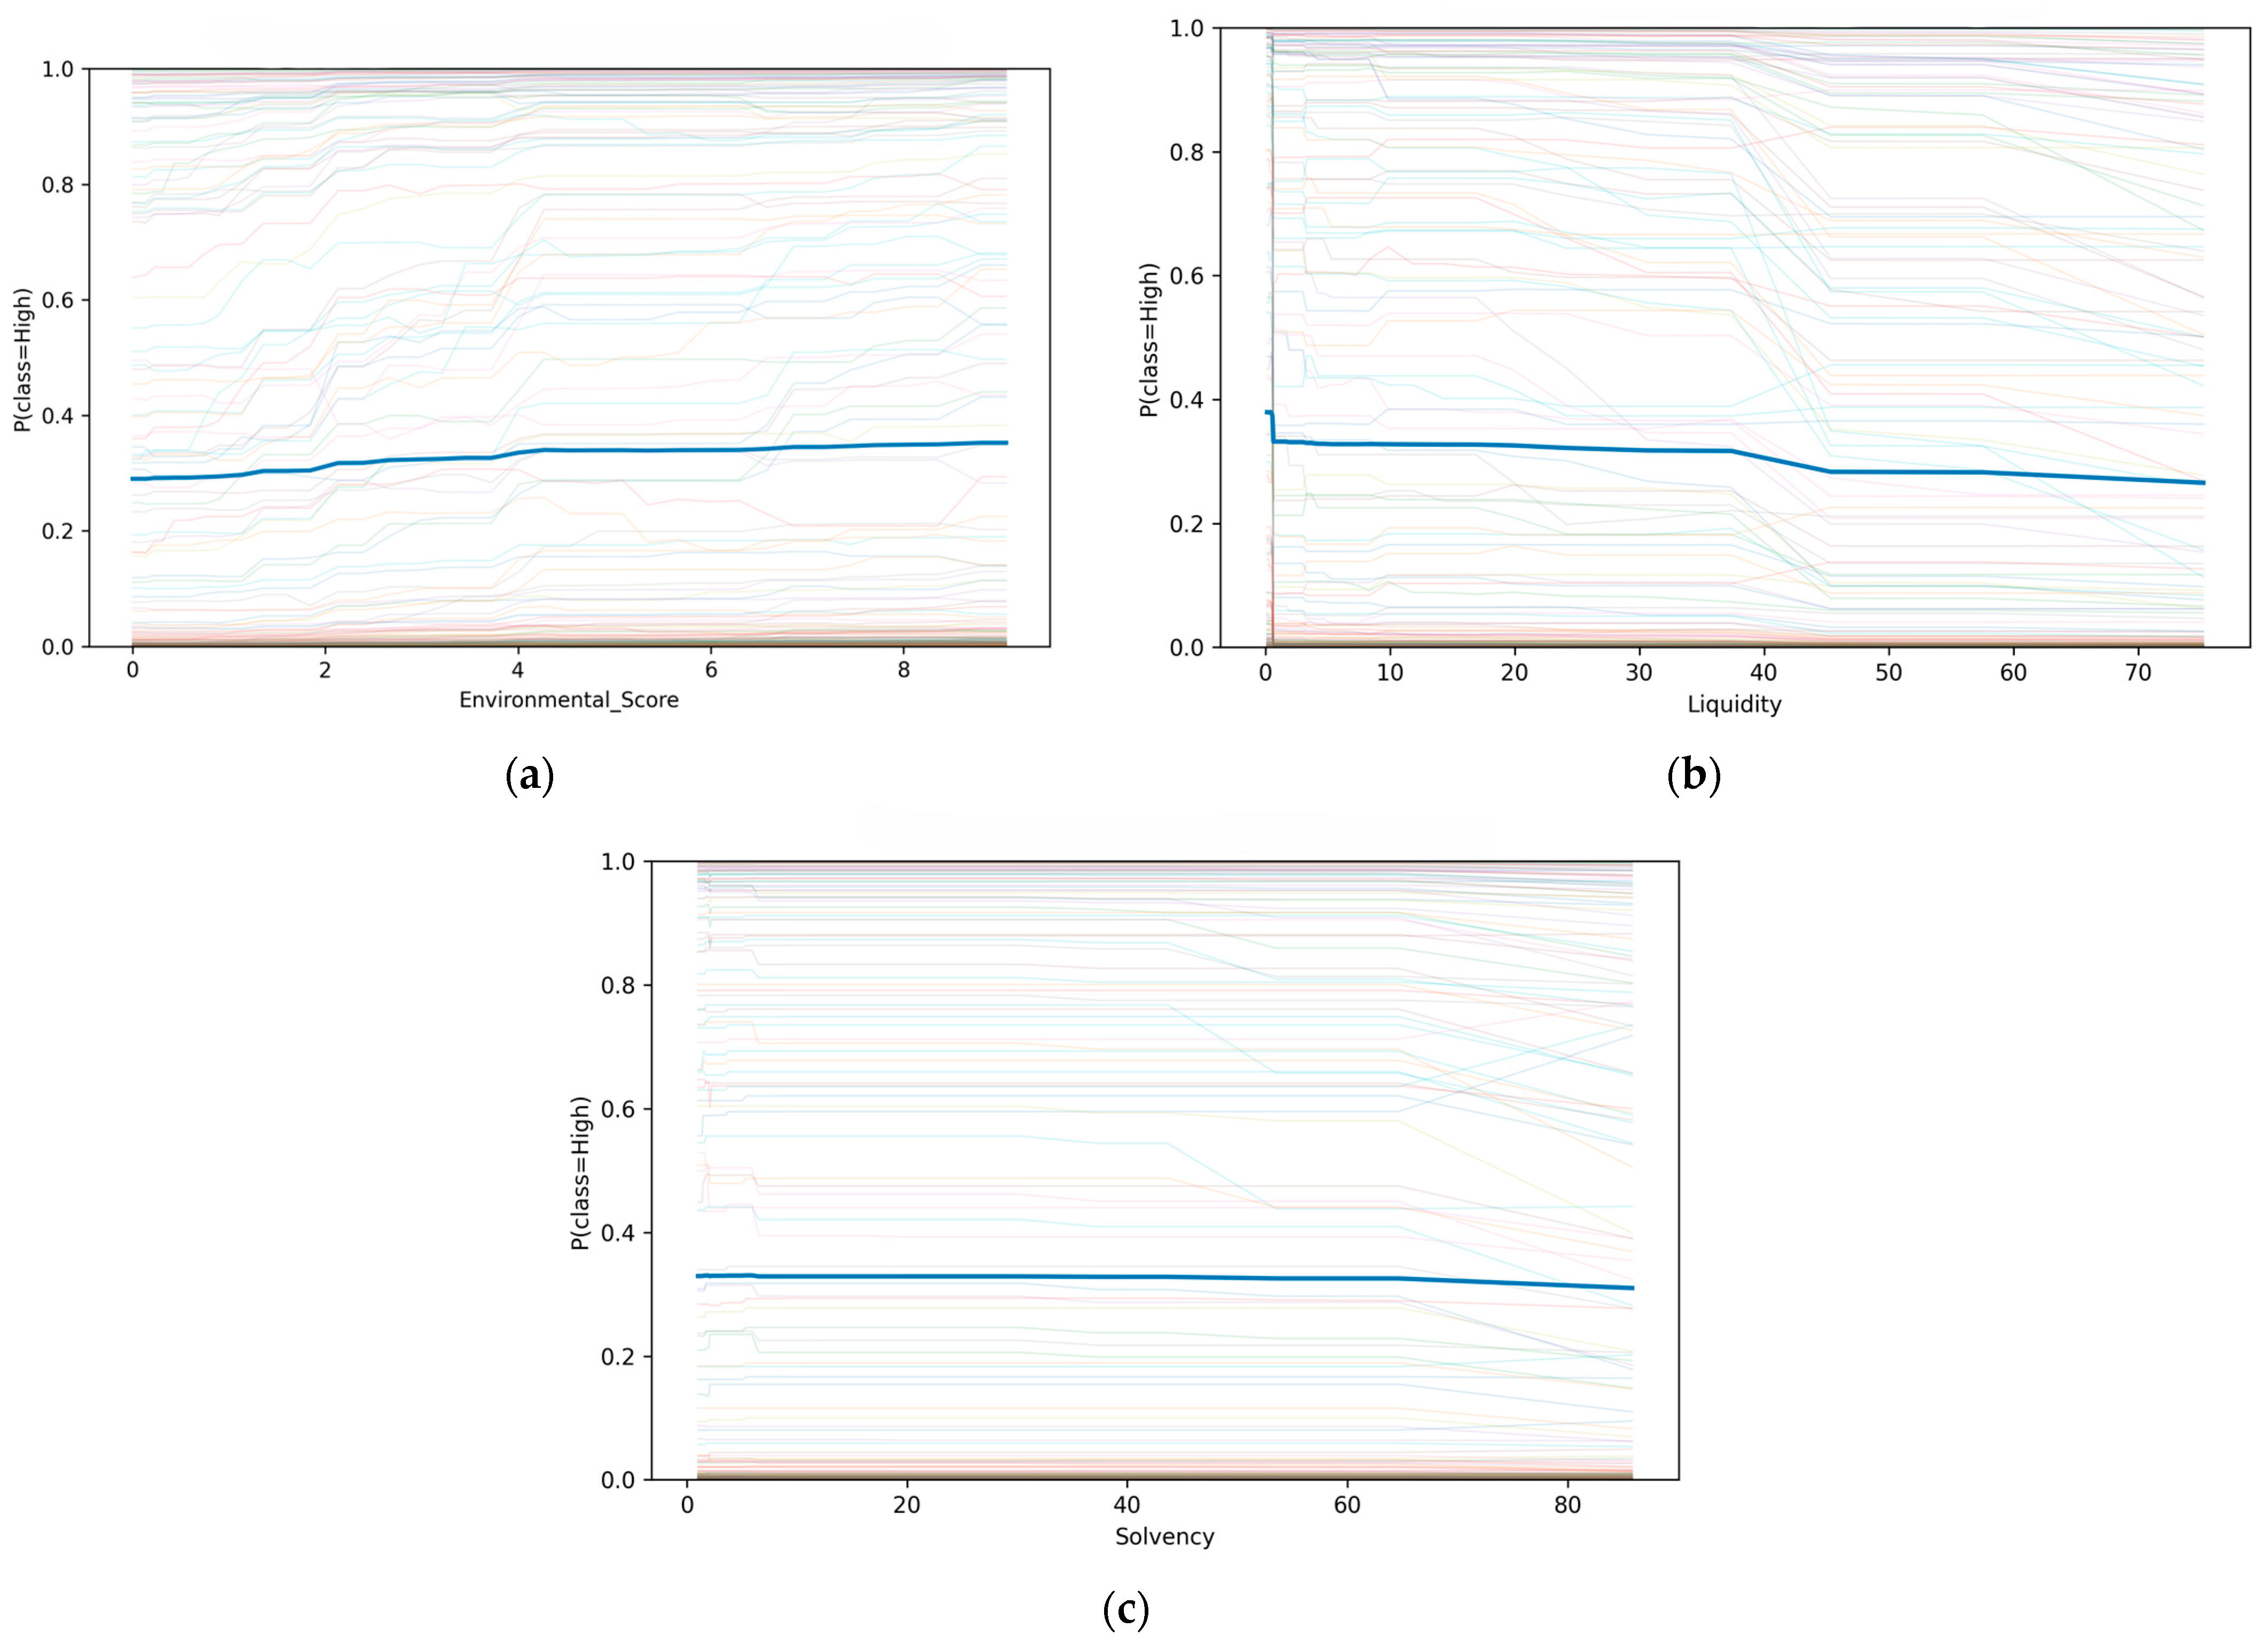

Disclaimer/Publisher’s Note: The statements, opinions and data contained in all publications are solely those of the individual author(s) and contributor(s) and not of MDPI and/or the editor(s). MDPI and/or the editor(s) disclaim responsibility for any injury to people or property resulting from any ideas, methods, instructions or products referred to in the content. |
© 2026 by the authors. Licensee MDPI, Basel, Switzerland. This article is an open access article distributed under the terms and conditions of the Creative Commons Attribution (CC BY) license.