


Abstract
To address the limited adaptability of Cooperative Adaptive Cruise Control (CACC) car-following models to low-speed, high-density traffic and extended braking distances on icy and snowy urban expressways, this study develops an ice–snow-corrected CACC car-following model with an exponential-decay time headway. Naturalistic driving data from Harbin, China, are used to establish the exponential-decay time-headway–speed model, and an ice–snow road correction coefficient is introduced into the PATH CACC framework. Parameters are calibrated by a hybrid least-squares and genetic algorithm. The improved model achieves root mean square errors (RMSEs) of 0.3001 m/s2, 0.7942 m/s, and 2.1279 m for acceleration, speed, and displacement, respectively, and provides an explicit analytical string-stability condition with a defined safety margin. Across CACC penetration rates, it yields higher reduction rates of time-exposed time-to-collision (TET) than the original model, with the most significant reductions achieved at 80–90% penetration rates. Importantly, this safety enhancement is achieved through a deliberate safety–efficiency trade-off, prioritizing safety margins over single-lane throughput under low-adhesion conditions. Overall, the model advances CACC toward speed-adaptive and adhesion-aware operation on cold-region urban expressways.
1. Introduction
Snow and ice conditions lead to a sharp drop in the road friction coefficient and a significant extension of braking distance, making spacing control more difficult for car-following vehicles and reducing traffic flow stability, severely hindering traffic efficiency and safety of urban expressways in cold regions. Cooperative Adaptive Cruise Control (CACC) can accurately obtain the dynamic information of the preceding vehicle relying on vehicle-to-vehicle (V2V) communication, and theoretically can optimize car-following strategies and improve platoon stability. However, most existing CACC car-following models are constructed based on dry road surfaces and free-flow conditions, and their adaptability to characteristics such as low-speed, high-density traffic and braking response delay under snow and ice conditions is obviously insufficient. The model urgently needs improvement and validation for snow and ice conditions.
As a typical longitudinal control strategy, the longitudinal control methods and models of CACC vehicles are the key to solving the above adaptability issues. In terms of control methods, model predictive control (MPC) is the most common method [1,2], and methods based on PID control and reinforcement learning have also been introduced in recent years. In terms of car-following models, the CACC car-following model based on the constant time-headway strategy proposed by the PATH Laboratory of the University of California, Berkeley is the most fundamental and widely adopted [3].
Existing studies mostly focus on the impact of the CACC system on the traffic system. Van Arem et al. [4] found through simulations that when the CACC penetration rate is higher than 60%, the capacity of basic highway sections can be significantly improved. However, this study assumes that human-driven vehicles are also equipped with V2V communication devices, revealing the theoretical upper limit under the “full communication environment”. Shladover et al. [5,6] analyzed the changes in highway capacity under different CACC and Adaptive Cruise Control (ACC) penetration rates, and the results showed that a high penetration rate of CACC vehicles can significantly improve capacity; simulations for multi-lane highways further showed that when the penetration rate reaches 100%, the single-lane capacity of merge areas can reach 3080 veh/h/l [7]. Gu et al. [8] studied the analysis methods and influencing factors of traffic flow stability. The above studies have fully verified the improvement effect of CACC on capacity and stability under dry and free-flow conditions, but none of them have considered the special impact of severe conditions such as snow and ice on CACC car-following behavior.
However, snow and ice conditions can significantly reduce the road adhesion coefficient and extend braking distance, which are key factors affecting traffic flow stability and traffic efficiency. Ibrahim et al. [9], based on data from the QEW Highway in Canada, found that heavy snow can reduce the maximum observed traffic flow by 30~48%. Kyte et al. [10] pointed out that snow-covered road surfaces reduce the free-flow speed by 16.4 km/h. The multi-level evaluation framework proposed by Billot et al. [11] shows that drivers will extend reaction time and increase safety spacing under adverse weather. These macro-level conclusions reveal the fundamental impact of snow and ice conditions on traffic flow, but have not delved into the micro-level adaptability of the CACC car-following model.
In terms of active control strategies, Choi et al. [12] proposed an active variable speed limit strategy for foggy weather, Khan et al. [13] introduced a macroscopic traffic flow model with a road surface severity index, and Gong et al. [14] proposed a car-following optimization strategy for connected and autonomous vehicle (CAV) platoons under severe weather. All the above studies have verified the effectiveness of active control, but either focus on macroscopic control or the overall behavior of CAV platoons, and none have gone deep into the micro-level adaptability of the CACC car-following model under urban expressway congestion conditions in snow and ice conditions. In recent years, CACC research has expanded towards directions such as communication stability [15] and mixed traffic flow [16,17]. For instance, Wang et al. [18] developed a CACC strategy using model-based imitation reinforcement learning to handle the complexities of mixed traffic. Additionally, advancements in autonomous vehicle perception, such as real-time traffic sign detection [19], have provided crucial environmental awareness for safe CACC deployment. Furthermore, recent studies have specifically investigated CACC strategies under low-adhesion and adverse weather conditions [20,21], highlighting the necessity of incorporating road friction into car-following dynamics. Notably, research on calibrating car-following models under various rainfall intensities [22] has highlighted the necessity of incorporating road friction into car-following dynamics. Furthermore, recent studies have explored CACC in complex road conditions, such as an MPC-based trajectory tracking strategy for CACC fleets in curves under a V2X environment [23], and a data accuracy improvement method using improved Kalman filtering to mitigate communication noise in V2X environments [24]. However, these studies often focus on macroscopic platoon behavior or assume ideal communication conditions, leaving the micro-level car-following logic under icy congestion insufficiently addressed.
Different from the above studies, this paper focuses on the micro-level adaptability of the CACC car-following model under icy and snowy congestion on urban expressways. Although CACC has been shown to improve capacity and stability under normal conditions [4,5,6,7,8], and the macroscopic effects of adverse weather on traffic flow have been documented [9,10,11], the car-following logic of CACC under icy and snowy conditions remains insufficiently addressed. In particular, the widely adopted PATH CACC model [3] relies on a fixed desired time headway, which cannot reflect the speed-dependent spacing demand caused by reduced pavement adhesion and extended braking distance. It also lacks a measured basis for dynamically adjusting desired spacing under low-speed, high-density conditions. Therefore, naturalistic car-following characteristics under icy and snowy conditions need to be embedded into the CACC strategy, and the improved model should be validated under snow and ice congestion from multiple dimensions.
To address these limitations, this study aims to improve the adaptability of the CACC car-following model to congestion conditions under snow and ice. The main contributions are as follows:
- (1)
- Based on naturalistic driving data, the exponential-decay relationship between time headway and speed under icy and snowy conditions is revealed, providing a measured basis for dynamic desired spacing.
- (2)
- An ice–snow road correction coefficient is introduced to improve the PATH CACC car-following model, enabling the desired spacing to dynamically respond to speed variation and icy-snow pavement adhesion while enhancing safety redundancy.
- (3)
- Model parameters are calibrated using a hybrid least-squares and genetic algorithm, and the improved model is validated in terms of fitting accuracy, tracking smoothness, parameter sensitivity, string stability, and TET-based safety under different CACC penetration rates.
The findings provide theoretical support and data reference for CACC strategy design on urban expressways in cold regions.
2. Naturalistic Driving Data and Empirical Time-Headway Characterization Under Icy and Snowy Conditions
2.1. Data Collection and Site Description
The Xuanhua Street Expressway viaduct in Harbin, China, was selected as the field observation site for naturalistic driving data collection. Located in the core urban area, this section carries high traffic volume and mixed traffic composition, and is representative of urban expressways in cold regions. Field data were collected in January 2026 during the morning peak (7:30–9:30) and evening peak (17:00–19:00). During the collection period, weather conditions remained stable, with light to moderate snowfall. Thin ice formed on some sections because of tire rolling, which is representative of typical winter weather and pavement conditions in cold regions.
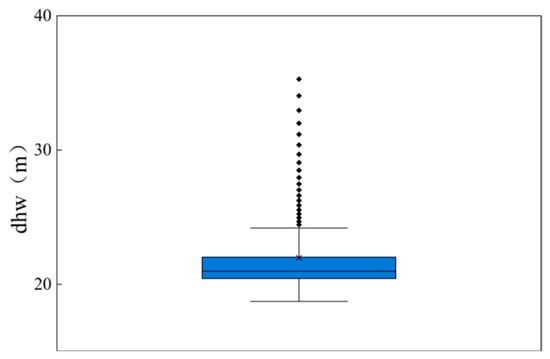
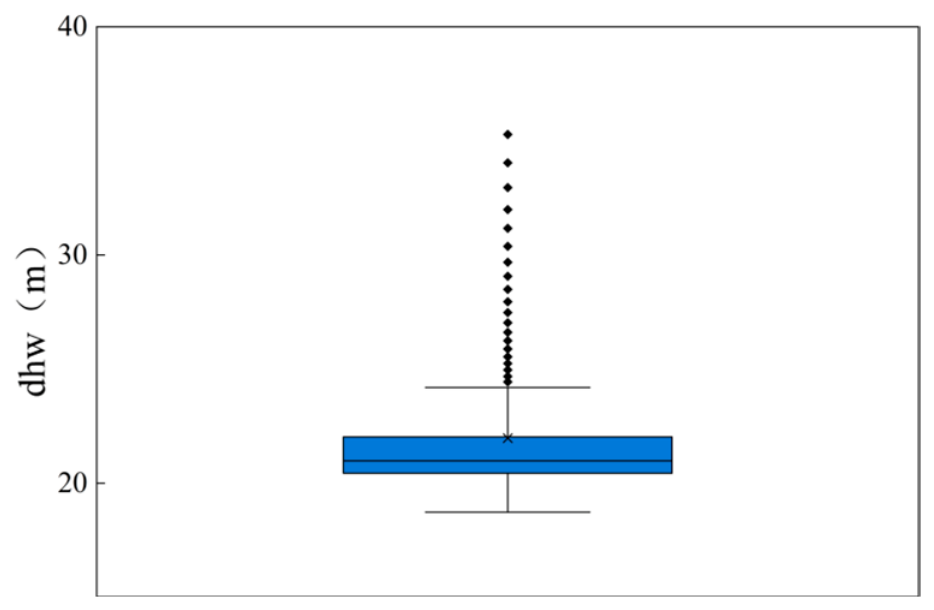
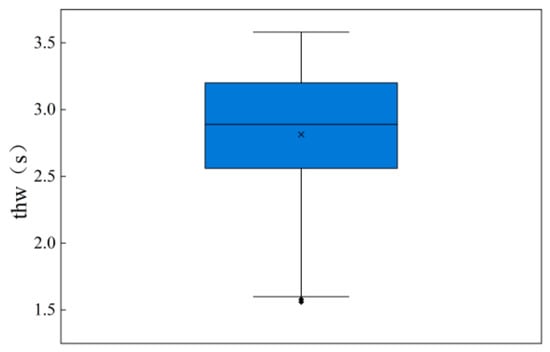
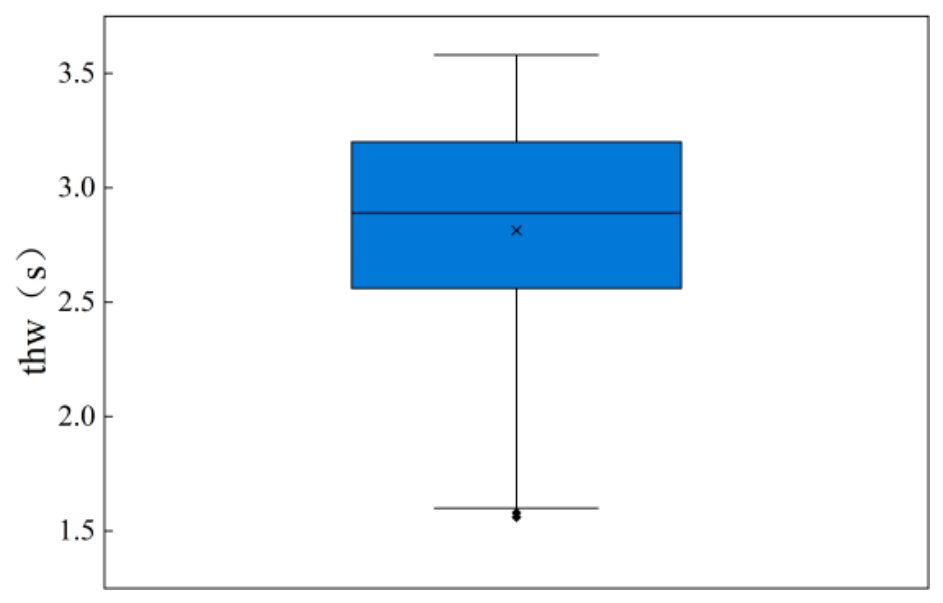
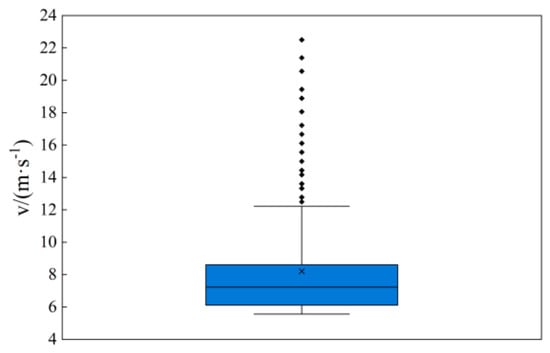
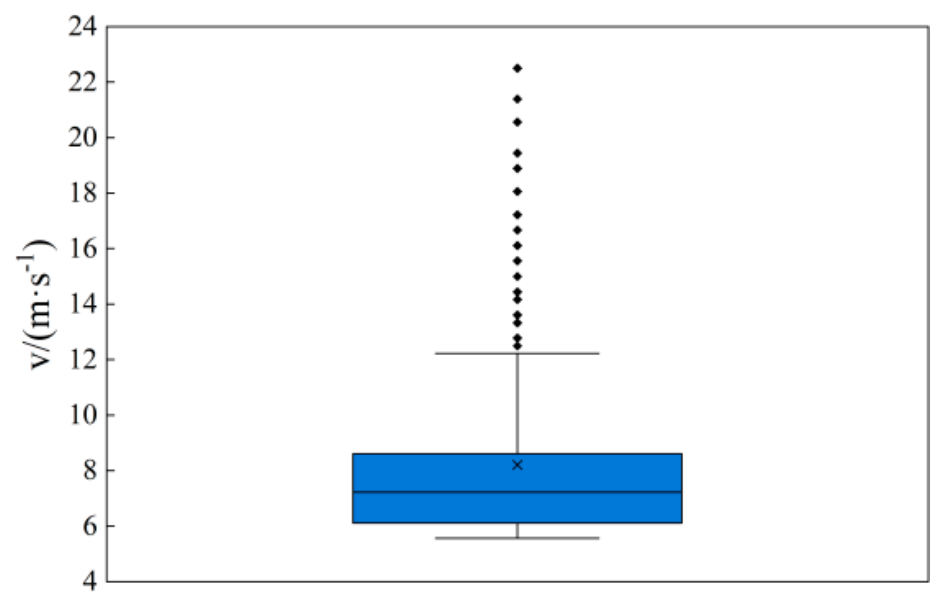
Vehicle trajectories were extracted using video-based detection software and then manually screened and corrected. After removing invalid and incomplete car-following events, 687 valid car-following events distributed across four lanes were retained. To supplement the temporal dynamic responses for simulation testing, the public AD4CHE expressway trajectory dataset was utilized as a baseline reference. The core speed-dependent time-headway relationship and spacing characteristics (Figure 1, Figure 2, Figure 3 and Figure 4) are entirely derived from the Harbin field data, which is provided in the Supplementary Material (data.xls). Each row corresponds to one valid car-following event and includes time headway, headway distance, speed, lane, vehicle length, detection area, and passage time. These data support the calibration and validation of the proposed CACC car-following model. Three key variables were selected for distribution analysis: headway distance, time headway, and vehicle speed. Their distributions are presented in Figure 1, Figure 2 and Figure 3. For consistency, all speeds in the main text and the Supplementary Material are presented in m/s.
Figure 1.
Boxplot of Headway distance.
Figure 2.
Boxplot of Time Headway.
Figure 3.
Boxplot of Vehicle Speed.
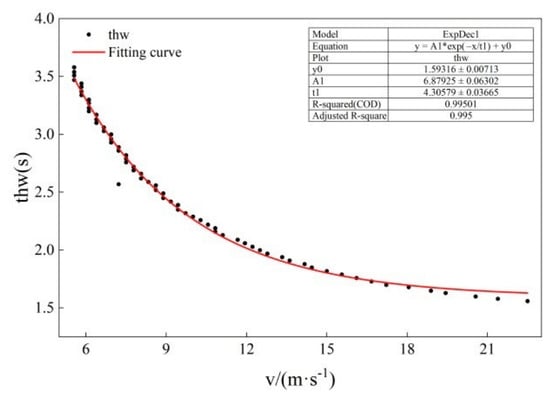
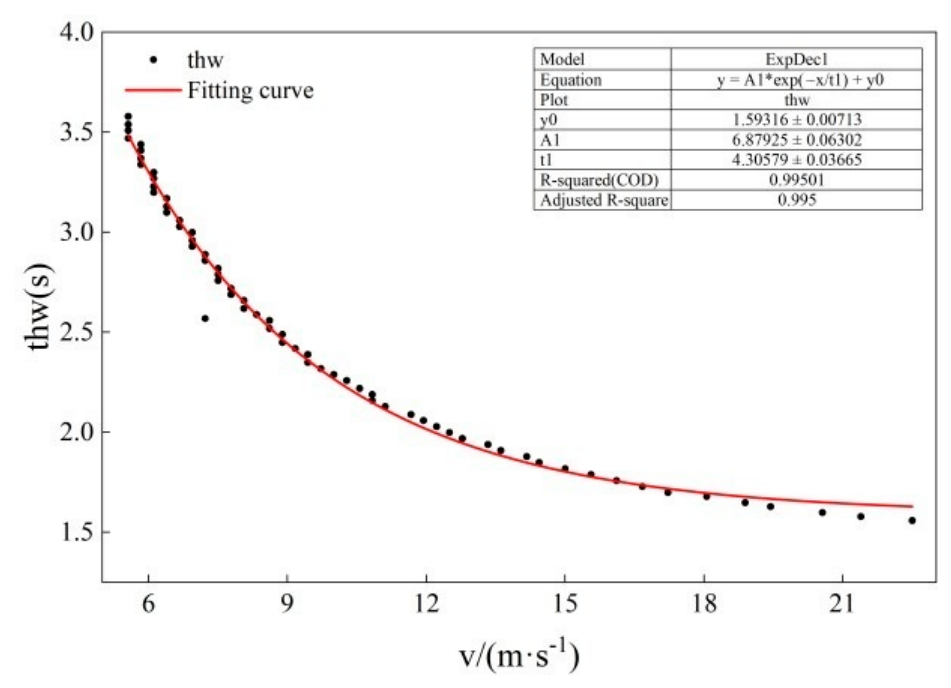
Figure 4.
Fitting Curve.
The interquartile range (IQR) of headway distance was approximately 20.8–22.2 m, with a median of approximately 21.67 m and outliers between 25 and 36 m, indicating a right-skewed distribution. This suggests that most vehicles maintained relatively short but safe spacing under icy and snowy conditions, whereas a few maintained larger distances during driving-state transitions. The time headway distribution was relatively concentrated, with an IQR of 2.5–3.2 s and a median of approximately 2.9 s. Extremely short time headways were rarely observed, suggesting more conservative time-headway selection under snowy conditions. The IQR of vehicle speed was 6–8 m/s, with a median of approximately 7 m/s and outliers between 12 and 24 m/s. As an internal consistency check, the corrected median headway distance divided by the median speed yields 21.67 m/7 m/s = 3.09 s, which is highly consistent with the reported median time headway of 2.9 s. Most vehicles traveled at stable low-to-medium speeds, whereas a few high-speed outliers were associated with overtaking or lane-changing maneuvers.
These distribution characteristics indicate that car-following behavior under icy and snowy conditions was strongly speed-dependent: most vehicles traveled steadily at low-to-medium speeds, and time headway was concentrated at 2.5–3.2 s. This speed dependence provides the empirical basis for developing a dynamic time-headway model.
2.2. Speed-Dependent Time-Headway Relationship and Exponential-Decay Fitting
Time headway is a key variable characterizing car-following behavior, and its relationship with vehicle speed directly determines the dynamic desired spacing for Cooperative Adaptive Cruise Control (CACC). To enable adaptive adjustment of CACC desired spacing under icy and snowy conditions, the time-headway–speed relationship must first be characterized, because it provides the empirical basis for dynamic spacing control. To quantify this relationship, an exponential-decay model was fitted to the measured data, as shown in Figure 4.
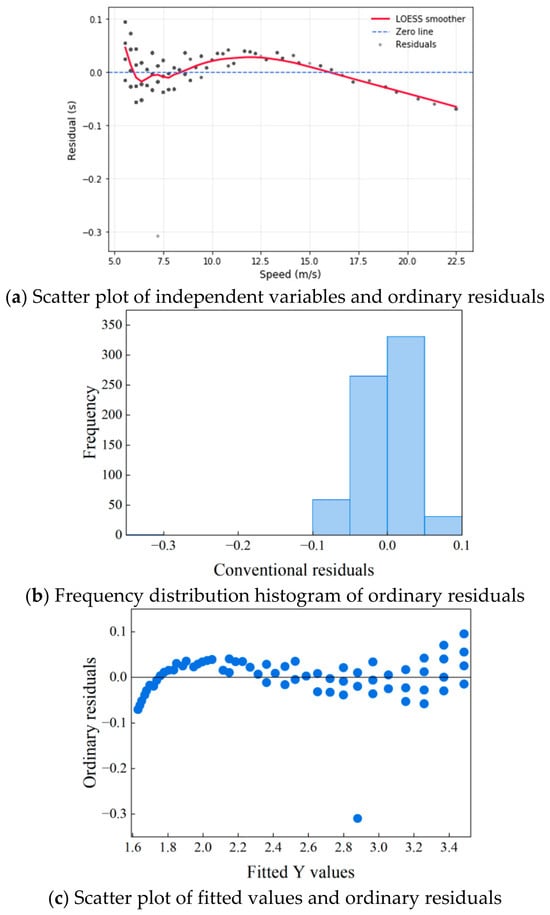
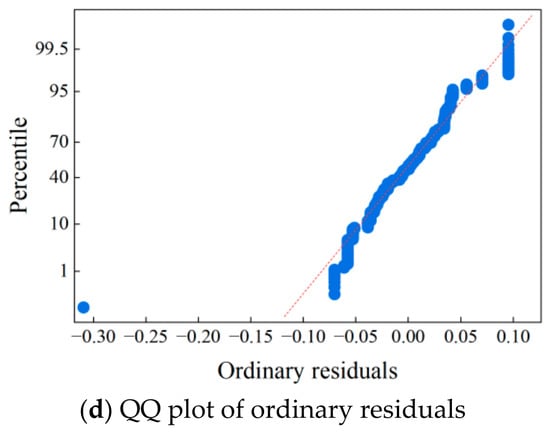
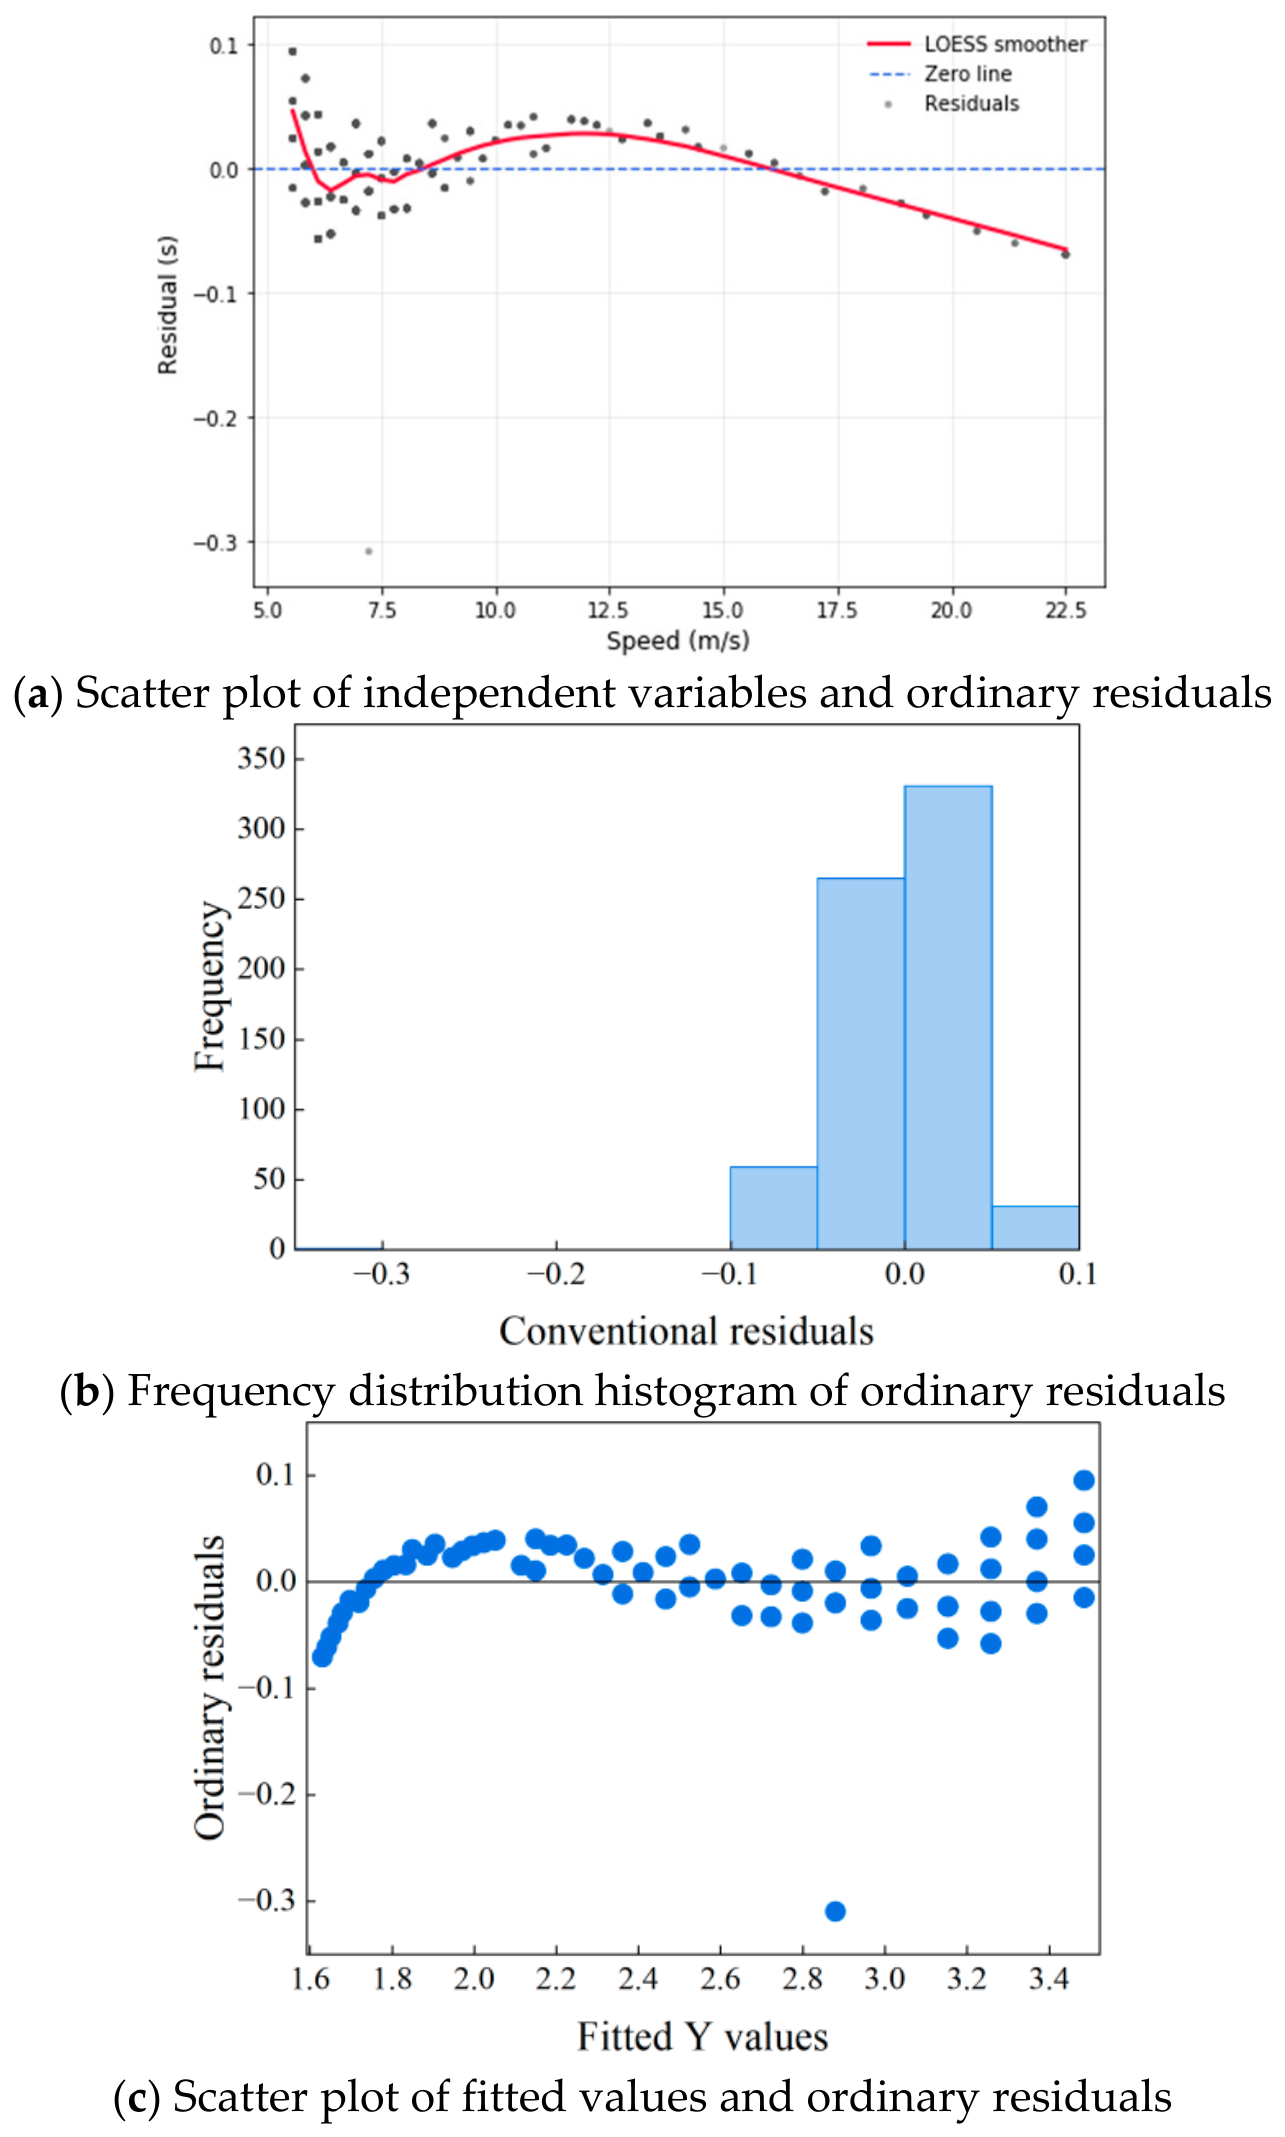
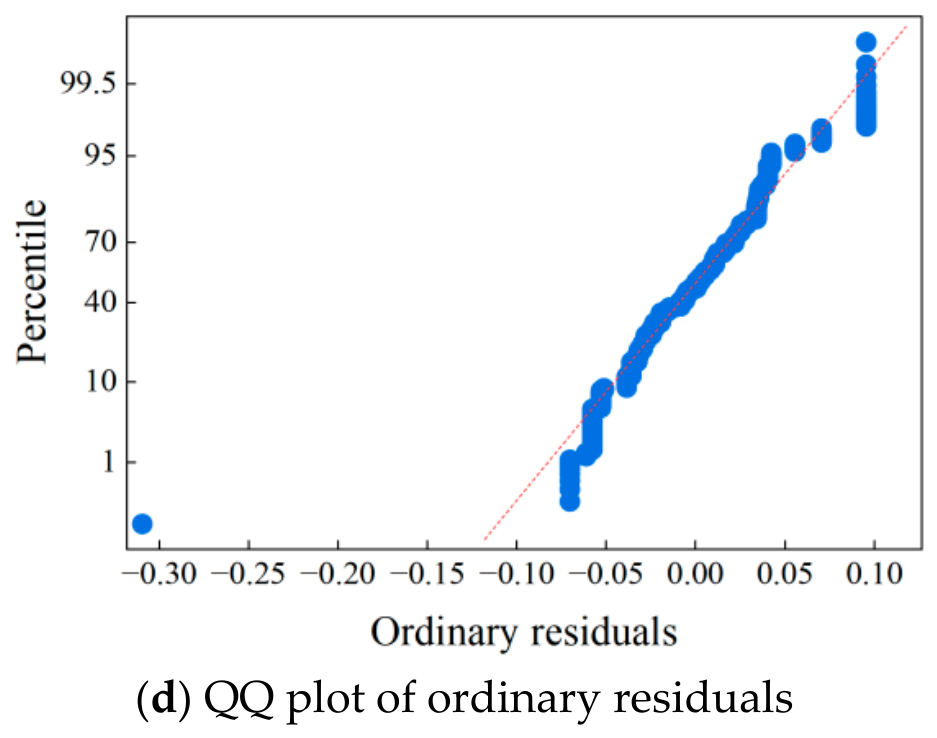
As speed increased from 6 to 22 m/s, time headway exhibited a significant asymptotic decrease. The rate of decrease gradually declined, and time headway eventually approached a stable lower bound of approximately 1.5 s. This trend is consistent with traffic flow theory, which suggests that drivers maintain a lower safety bound on time headway at high speeds. The coefficient of determination is R2 = 0.995, the Bootstrap 95% confidence interval for R2 is [0.994, 0.996]. AIC/BIC comparisons with linear and polynomial models confirm the exponential form is statistically superior (ΔAIC = 1136). Although the LOESS smoother in Figure 5a reveals a slight systematic variation (negative residuals at >17 m/s), this is primarily caused by overtaking and lane-changing maneuvers. To validate the core car-following relationship, we excluded 76 events associated with overtaking and lane-changing maneuvers (the 12–24 m/s outliers). We then re-fitted the model on the remaining pure car-following subset (N = 611), which represents steady-state car-following behavior across all four lanes. The exponential relationship held robustly with an R2 of 0.992. Furthermore, for this pure car-following subset (N = 611), the re-fitted parameters are tI,min = 1.582 s, tI,0 = 8.41 s, and α = 0.231 s/m, which are highly consistent with the full-dataset values. A sensitivity test was conducted by varying the exclusion threshold (12, 15, and 20 m/s). Since the maximum observed speed in the pure car-following subset is 11.94 m/s, altering the threshold above 12 m/s yields identical datasets. This confirms that the empirical law is highly robust and not an artifact of the threshold choice. It should be noted that the 1.5 s asymptote is a model extrapolation based on traffic flow theory, rather than a directly observed value. The fitted model is expressed as:
where tI(v) is time headway (s), v denotes the following vehicle speed vn(t) (m/s), tI,min is the asymptotic minimum time headway (s), tI,0 s the intercept at zero speed (s), and α is the decay rate (s/m). The calibrated parameters are tI,min = 1.5932 s, tI,0 = 8.4725 s and α = 0.2323 s/m. Residual diagnostics (Figure 5) indicate no obvious violation of the normality or homoscedasticity assumptions, confirming that the model robustly describes the speed-dependent variation in time headway under icy and snowy conditions.
Figure 5.
Residual Diagnostic Plots.
This exponential-decay model characterizes how the time headway of following vehicles varies with speed under icy and snowy conditions. It provides the empirical basis for the dynamic spacing strategy and serves as a direct input for calculating the CACC desired spacing.
The exponential-decay model reflects the dynamic characteristics of car-following behavior under icy and snowy conditions: a larger time headway is maintained at low speeds, whereas it asymptotically converges to a lower safety bound at high speeds. This empirical relationship provides a measured basis for dynamically adjusting the CACC desired spacing. The next section introduces an ice–snow road correction coefficient to develop the improved CACC car-following model.
3. Ice–Snow-Corrected CACC Car-Following Model Development
3.1. PATH CACC Framework and Limitations
CACC obtains the dynamic information of the preceding vehicle through vehicle-to-vehicle (V2V) communication, and the accuracy of its car-following model directly affects the safety and efficiency of platoon operation. This study selects the constant-time-headway CACC car-following model proposed by the PATH Laboratory [25] as the basic framework for the following reasons: it is a pioneering achievement in CACC car-following research under connected vehicle environments; it has a clear structure and adjustable parameters; it directly incorporates the acceleration of the leading vehicle, reflecting the essential difference between CACC and traditional ACC or manually driven vehicles; and its parameters have clear calibration references [4,5], which facilitates cross-model comparison.
The basic form of the PATH CACC car-following model is expressed as:
where an(t)denotes the acceleration of the following vehicle (m/s2); an−1(t)denotes the acceleration of the leading vehicle (m/s2); vn−1(t) and vn(t) represent the speeds of the leading and following vehicles, respectively (m/s); xn−1(t) − xn(t) denotes the front-to-front distance including the leading vehicle length l (m); tg denotes the desired time headway in the original PATH model, set to 0.6 s [5]; l denotes the vehicle length (m); s0 denotes the safe stopping distance (m); and k0, k1, k2 are tuning parameters, and their values [4] are shown in Table 1.
Table 1.
Tuning parameter values.
Through the synergistic mechanism of leading-vehicle acceleration feedback, speed-difference control, and spacing-error correction, the original model achieves good platoon smoothness and consistency under normal operating conditions. However, under congested conditions on icy and snowy urban expressways, the original model has the following core limitations:
- (1)
- Insufficient adaptation of the spacing strategy. The desired spacing is set based on a fixed time headway tg, without considering the dynamic demand for safe spacing caused by extended braking distance on icy and snowy pavements. It is therefore difficult to adapt to the frequent acceleration and deceleration under low-speed and high-density conditions.
- (2)
- Insufficient rapid dynamic response capability. The control logic relies mainly on the current state of the leading vehicle and lacks rapid dynamic response capability under abrupt acceleration changes in the preceding vehicle in icy and snowy congested scenarios, which may lead to response lag or excessive braking due to insufficient safety redundancy.
3.2. Ice–Snow Road Correction Coefficient
To address the above limitations, this study introduces an ice–snow road correction coefficient kc to dynamically adjust the desired headway distance:
where ddes(t) is the desired headway distance (m); kc is the ice–snow road correction coefficient (kc ≥ 1), with a larger value indicating lower pavement adhesion and greater required safety redundancy. The time headway tI(v)does not adopt the fixed value in the traditional CACC model, but instead uses the exponential decay model fitted in Section 2.2. This enables the desired headway distance to adjust dynamically with vehicle speed: a larger time headway is maintained at low speeds to adapt to the extended braking distance on icy and snowy pavements, and it asymptotically converges to the lower safety bound at high speeds, thereby more accurately reflecting the actual car-following behavior of drivers under icy and snowy conditions.
The introduction of kc aims to address the impact of reduced pavement adhesion coefficient and extended braking distance on car-following safety under icy and snowy conditions. According to vehicle dynamics, the relationship between braking distance D and pavement adhesion coefficient μ can be approximately expressed as D∝v2/(2 μg). Based on this, kc can be defined as the safety spacing amplification coefficient corresponding to the extended braking distance:
where λ ≥ 0 is the safety redundancy coefficient, reflecting the conservatism of the control strategy; μd and μi are the adhesion coefficients of dry and icy-snowy pavements, respectively. In this study, the adhesion coefficients are set as μd = 0.75 and μi = 0.25, which are adopted from the vehicle dynamics [26]. The safety redundancy coefficient is set to λ = 0.5 to represent a moderately conservative strategy. A comprehensive sensitivity analysis of λ over the range of 0.3 to 0.7 is provided in Section 4.4.
Compared with the original model with fixed time headway, Equation (3) achieves adaptive adjustment of the desired spacing to icy and snowy congested conditions through the synergistic effect of kc and tI(v): a larger spacing is maintained at low speeds to compensate for the extended braking distance, and it asymptotically converges to the lower safety bound at high speeds; kc increases as pavement adhesion decreases, further expanding the safety redundancy, thereby making up for the deficiencies of the original model in terms of safety margin and risk response.
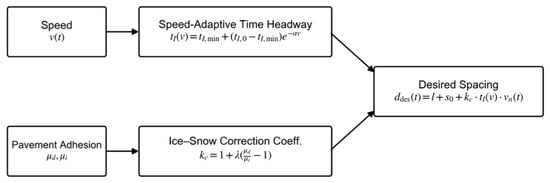
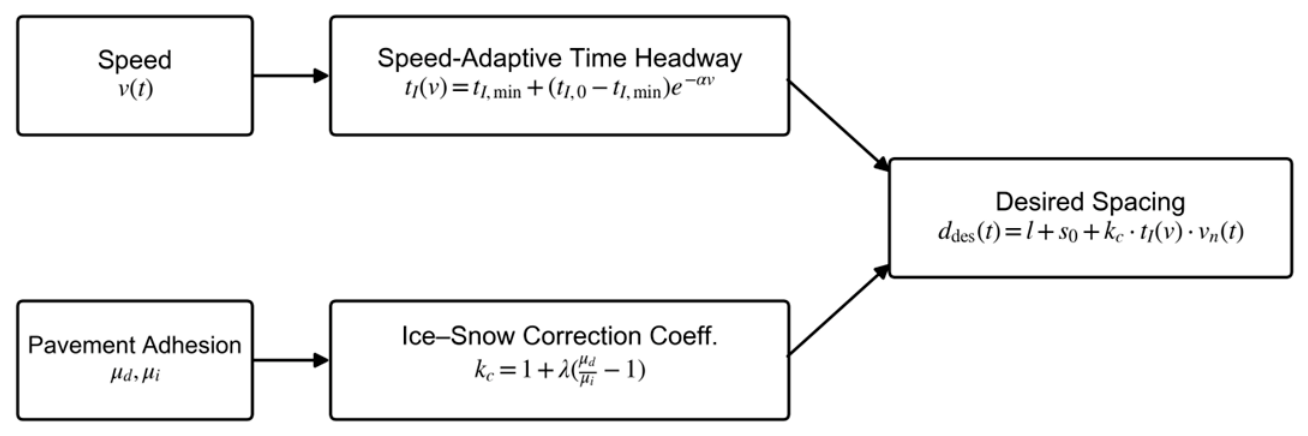
As illustrated in Figure 6, mechanistically, the desired spacing is jointly determined by the exponential-decay time headway tI(v) (which dynamically responds to speed variation) and the ice–snow coefficient kc (which amplifies the safety margin based on pavement adhesion).
Figure 6.
Schematic diagram of the joint mechanism.
3.3. Improved CACC Car-Following Model Formulation
Substituting Equation (3) into the original model, the improved CACC car-following model is obtained:
The term in brackets represents the spacing error, i.e., [xn−1(t) − xn(t) − ddes(t)], where ddes(t) is given by Equation (3). While retaining the advantages of the synergistic control of the original model, the improved model enhances the adaptability to low-speed and high-density conditions as well as conditions with extended braking distance by introducing the ice–snow road correction coefficient and dynamic time headway, laying a foundation for subsequent parameter calibration and performance verification.
4. Model Calibration and Multi-Dimensional Validation
4.1. Data Preprocessing and Parameter Calibration
To ensure spatiotemporal consistency of car-following scenarios and comparability of research outcomes, a multi-dimensional sample screening rule was established in the data preprocessing stage. Data from all valid lanes (Lanes 1–4) were initially extracted; samples with a speed lower than 1 m/s were removed; headway distance was restricted within the car-following threshold range of 0–100 m; and only car-following states lasting 33 s or longer were identified as valid samples [27]. This initial screening yielded 687 valid car-following events.
Parameter calibration was implemented via a combined framework of initial estimation and optimization integrating the least-squares method and genetic algorithm. To prevent data leakage, the dataset was partitioned at the vehicle-pair level, and a 5-fold cross-validation was adopted. The genetic algorithm was configured with a population size of 100, crossover probability of 0.5, mutation probability of 0.1, and 500 generations. The calibration was independently repeated 30 times, and a global parameter set was derived. This approach leverages the high convergence efficiency of the least-squares method while relying on the global search capability of the genetic algorithm to avoid trapping in local optimal solutions. Based on the collected naturalistic driving data, the calibrated parameters of the improved model are listed in Table 2.
Table 2.
Tuning parameter calibration results of the improved model.
The calibrated mean value of kc is 1.1145. The calibrated values reflect the actual safety margin adopted by drivers in the observed icy conditions. The differences between the maximum and minimum values of each parameter fall within a reasonable range, indicating low dispersion, and the mean values are consistent with engineering practice standards, indicating that the calibration results feature favorable stability and consistency. Substituting the calibrated parameters into the improved model yields its final form:
4.2. Fitting Accuracy Validation
Three core dynamic indicators—acceleration, speed, and displacement—were selected to compare simulated values with field-measured data using the root mean square error (RMSE) and mean absolute error (MAE). The results are presented in Table 3.
Table 3.
Error analysis of the improved model.
The results demonstrate that the fitting accuracy is optimal in the acceleration dimension, with RMSE and MAE values of only 0.3001 m/s2 and 0.2296 m/s2, respectively. These low errors confirm that the improved CACC car-following model can accurately capture the instantaneous dynamic characteristics of vehicle acceleration and deceleration under icy and snowy conditions, aligning well with braking and acceleration maneuvers in real-world driving. For speed, the RMSE is 0.7942 m/s and the MAE is 0.5080 m/s, both within the acceptable range for engineering applications, reflecting the model’s ability to precisely characterize the speed variation trend of vehicles on icy and snowy pavements. Although the RMSE of displacement is relatively high at 2.1279 m, the corresponding MAE is only 0.7765 m, indicating that the displacement prediction deviation of the model remains controllable during long-term car-following without cumulative error. The overall fitting performance fully meets the engineering requirements for traffic flow simulation on urban expressways under icy and snowy conditions.
To quantitatively demonstrate the superiority of the improved model, we compared its fitting errors with those of the original PATH model on the same test dataset. As shown in Table 3, the original PATH model yields RMSEs of 1.85 m/s2, 2.15 m/s, and 5.80 m, and MAEs of 1.43 m/s2, 1.66 m/s, and 4.65 m. In stark contrast, the proposed model reduces the RMSE by 83.8%, 63.1%, and 63.3%, and reduces the MAE by 83.9%, 69.4%, and 83.3% in acceleration, speed, and displacement, respectively. This comprehensive error analysis confirms that the improved model achieves substantially better fitting accuracy across all metrics.
4.3. Dynamic Response Analysis
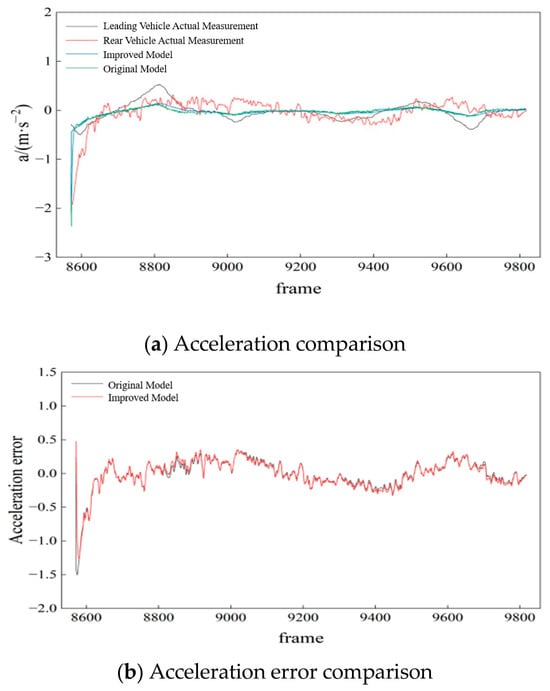
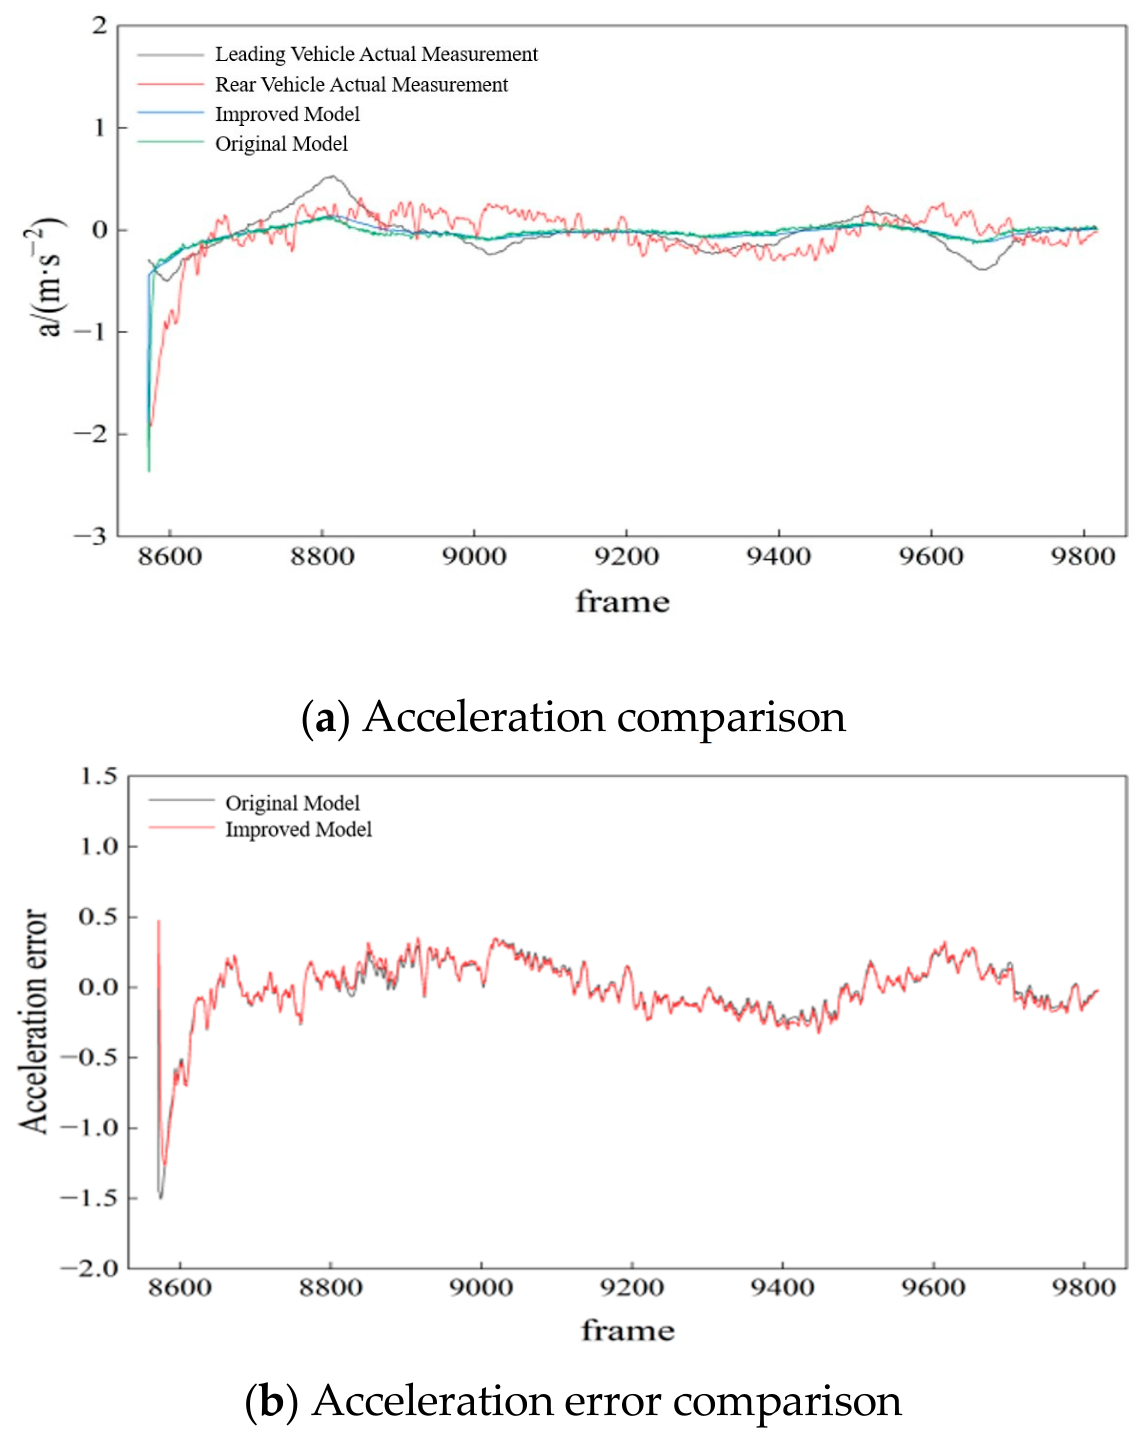
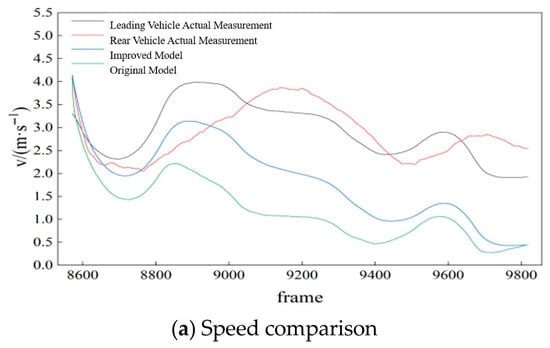
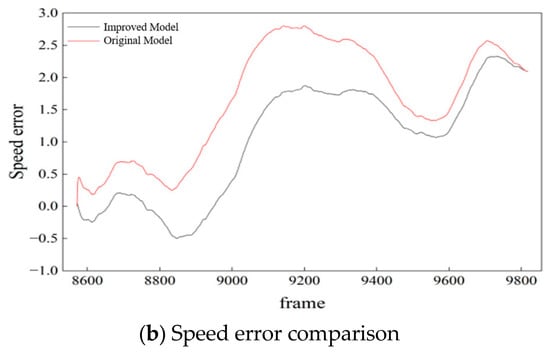
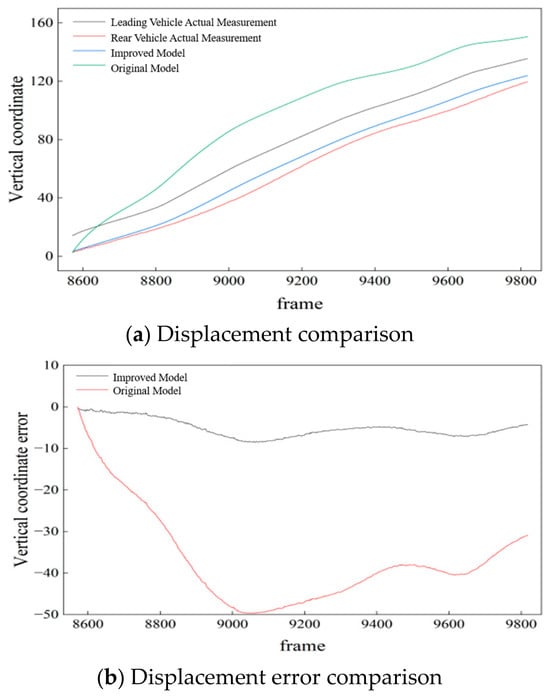
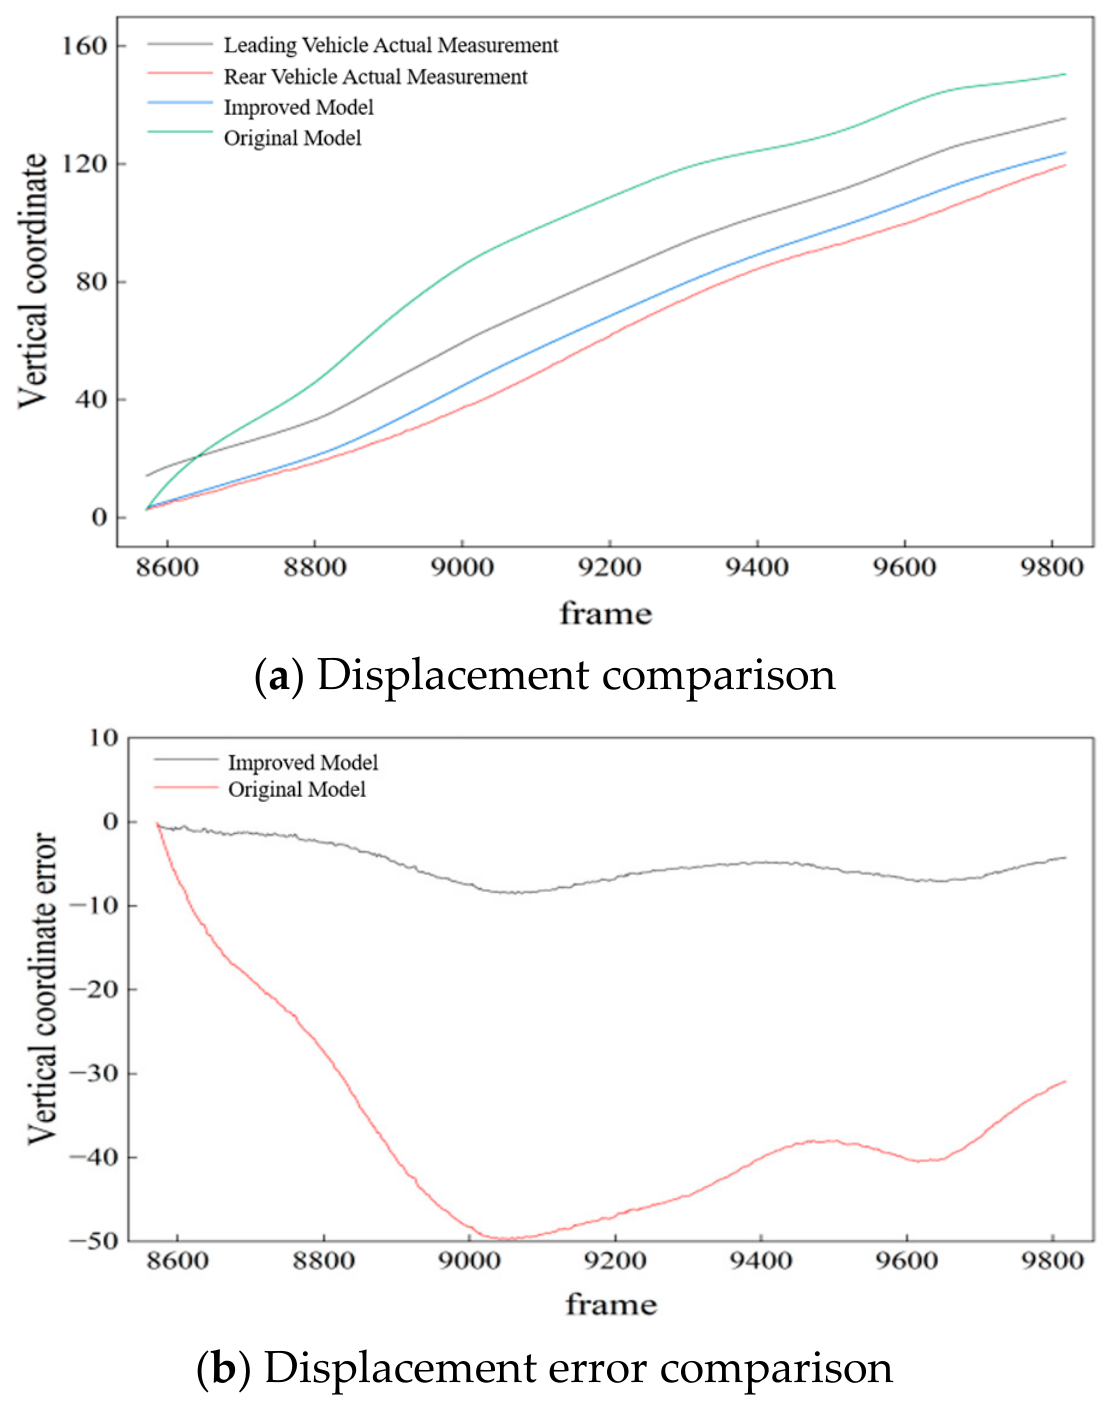
To visually verify the improved model’s capability in reproducing car-following dynamic characteristics, Figure 7, Figure 8 and Figure 9 present comparisons between simulated and measured values of acceleration, speed, and displacement, respectively.
Figure 7.
Comparison of Acceleration Results.
Figure 8.
Comparison of Speed Results.
Figure 9.
Comparison of Displacement Results.
In terms of acceleration response, the curve of the improved model matches the measured data substantially better than the original model, especially at points where the leading vehicle’s acceleration changes abruptly. Although the reduced feedforward gain (k0) necessarily slows the initial transient response compared to the original PATH model, the improved model achieves significantly smoother tracking and better filtering of high-frequency disturbances. It effectively avoids the excessive deceleration that frequently occurs in the original model, thereby maintaining a larger safety margin. For speed response, the speed curve of the improved model nearly coincides with the measured data, precisely replicating the full-stage characteristics of acceleration, constant speed, and deceleration. By contrast, the original model exhibits obvious response lag and lower peak values during the speed-up phase. Regarding displacement response, the displacement deviation of the improved model remains small and does not accumulate over time, whereas the deviation of the original model shows a gradual increasing trend.
4.4. Parameter Sensitivity Analysis
- (1)
- Sensitivity to λ
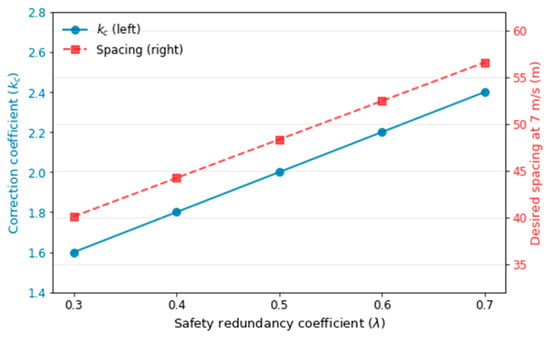
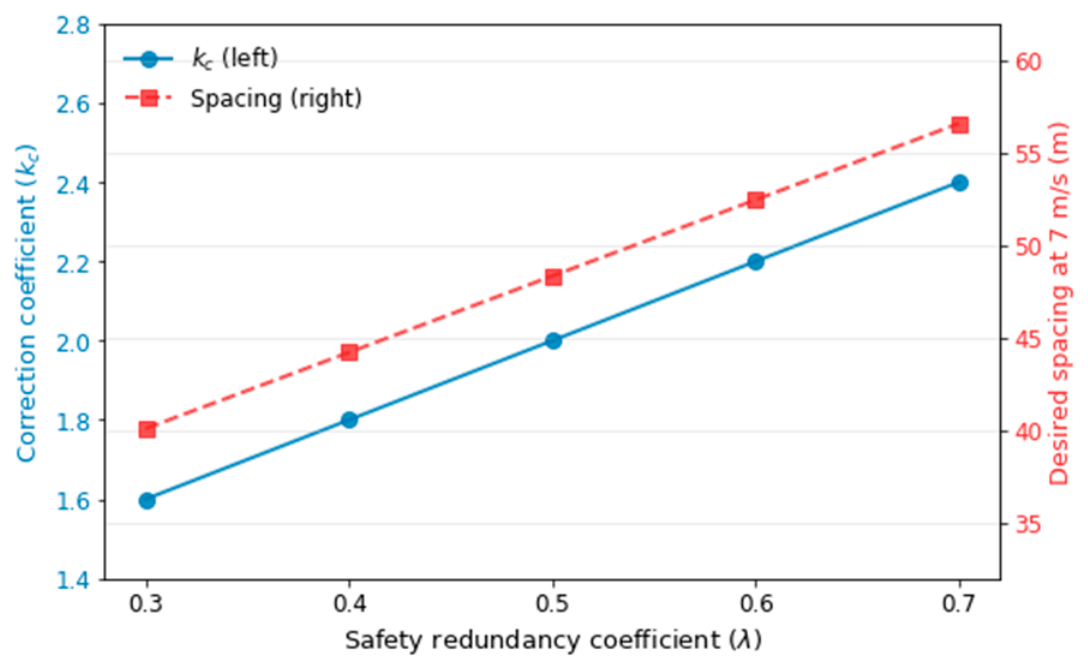
As shown in Figure 10, both kc and the desired spacing increase monotonically with λ. When λ = 0.3, the model requires a gap of 40.10 m. At λ = 0.7, the gap expands to 56.60 m. At λ = 0.5, the theoretical maximum safety redundancy requires a gap of 48.35 m at 7 m/s. Importantly, based on the empirically calibrated mean kc of 1.1145, the model demands a 30.13 m gap at 7 m/s. Both values are substantially larger than the corrected empirical human driving distance (21.67 m), confirming that the proposed model intentionally prioritizes safety margins over single-lane capacity.
Figure 10.
Sensitivity Analysis of the Safety Redundancy Coefficient λ.
- (2)
- Ablation Study
To isolate the performance improvements, all simulations started from the equilibrium state (32.37 m at 10 m/s). Five configurations were evaluated. As shown in Table 4, retuning the gains alone significantly increases the tracking error (RMSE increases from 1.11 m to 3.52 m) and fails to improve the minimum safety gap (remains at 8.00 m). This occurs because the reduced feedforward gain slows the transient response. However, the introduction of the variable time headway expands the minimum gap from 8.00 m to 24.67 m. The Full Model achieves the largest minimum gap of 27.27 m. This proves that the safety benefit fundamentally stems from the synergistic design, not merely parameter tuning.
Table 4.
Ablation study results.
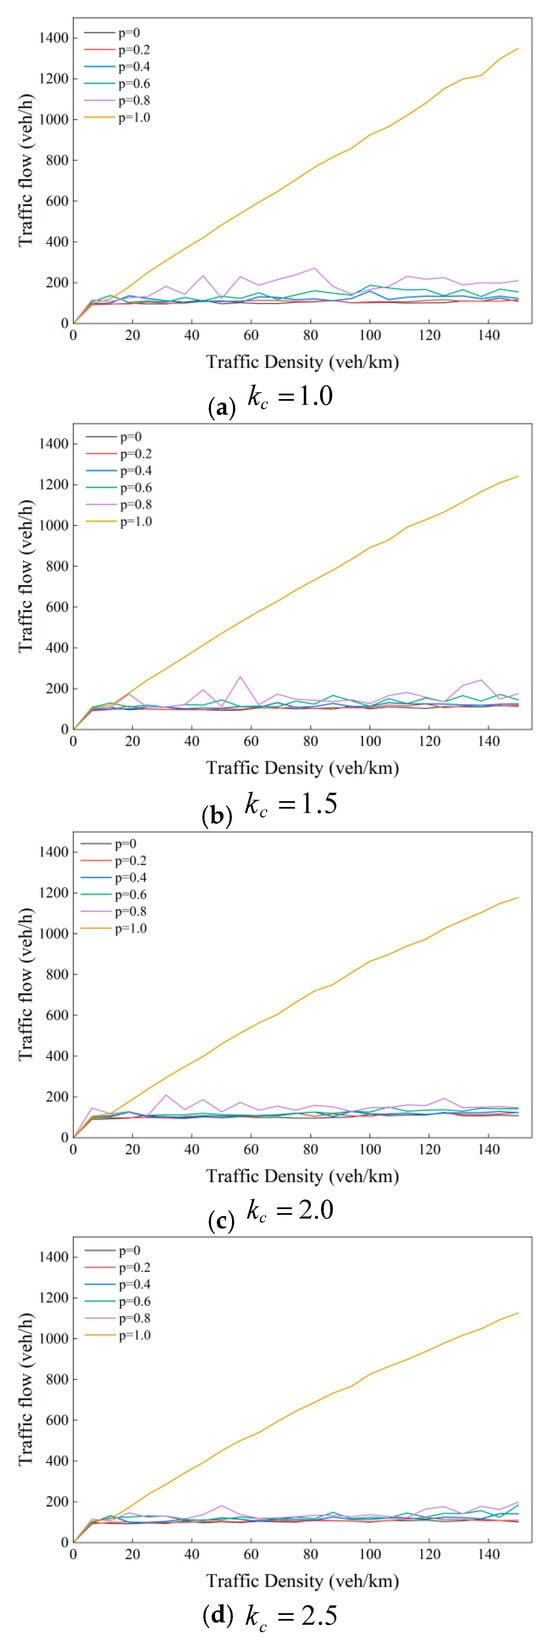
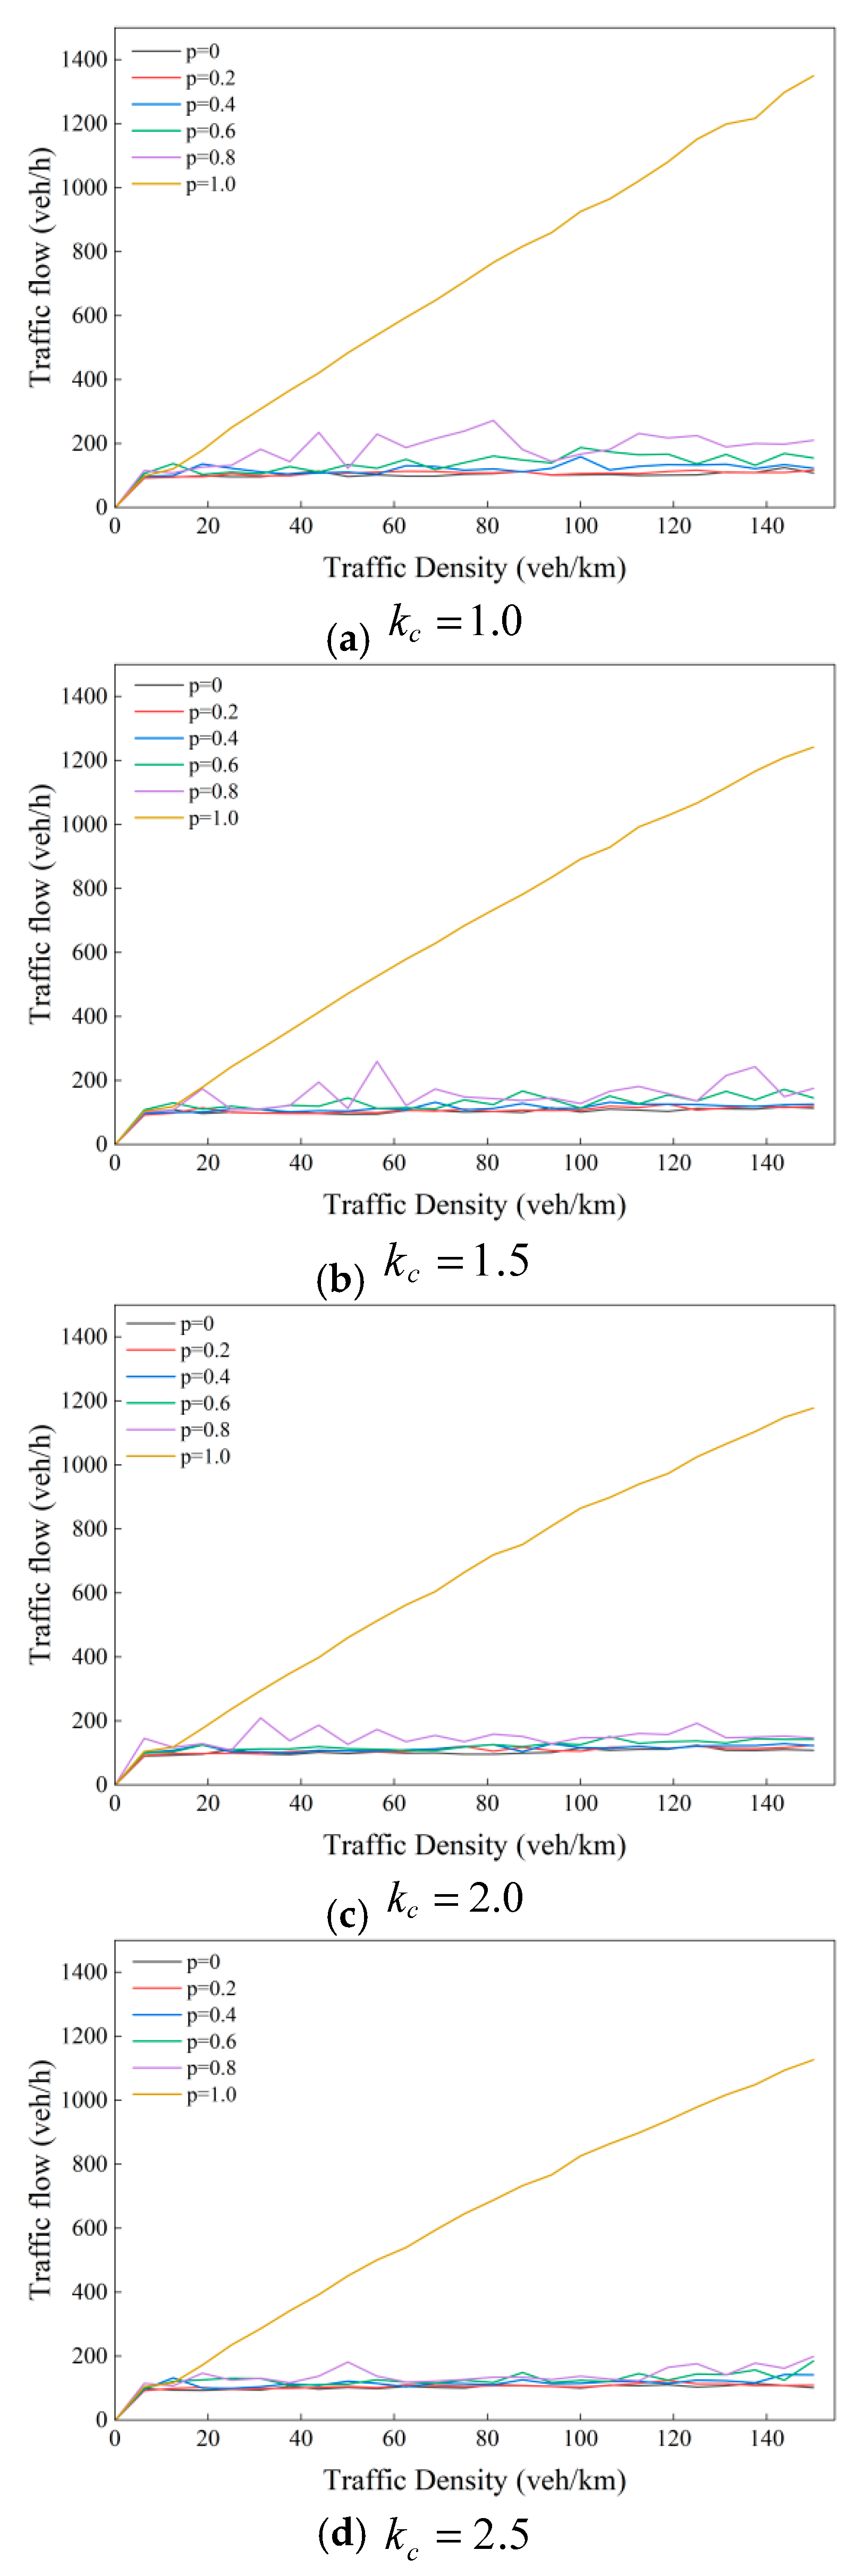
To investigate the influence of the ice–snow road correction coefficient kc on model performance, a sensitivity analysis was conducted with four values of kc: 1.0, 1.5, 2.0, and 2.5. The results are shown in Figure 11.
Figure 11.
Flow–Density Relationship under Different Values of kc.
The curves corresponding to different parameter values maintain consistent trends, indicating that adjusting kc only modifies the flow regulation capability of the model without altering its fundamental logic in describing traffic flow characteristics. As kc increases, the flow–density curve gradually flattens, suggesting that this parameter exerts a significant effect on flow regulation. By tuning kc, the model can be precisely adapted to icy and snowy pavements with varying congestion levels. As quantitatively reflected in Figure 11, increasing kc significantly flattens the flow–density curve, directly quantifying the capacity reduction required for enhanced safety margins.
4.5. Stability Analysis
- (1)
- Analytical String Stability
To analytically evaluate the platoon dynamics, the vehicle dynamics were linearized around the equilibrium speed ve. The transfer function of the spacing error is:
where the effective headway gradient Teff is:
To analytically evaluate the string stability, the characteristic equation of the closed-loop system is derived by setting 1 + H(s) = 0.
According to the Routh–Hurwitz stability criterion, the system is strictly string-stable if and only if all coefficients are positive. Given that k2 = 0.0050 > 0 (as calibrated in Table 2), the fundamental analytical string-stability condition is:
We acknowledge the reviewer’s precise calculation that, with the nominal parameters (k1 = 0.3635, k2 = 0.0050, Teff ≈ 0.83 s), the sum is positive but marginal, yielding a 1.2% low-frequency amplification |H|max = 1.012. To ensure robust deployment against real-world communication delays and actuator limits, a stability margin Δm = 0.1 is introduced, requiring k1 + k2Teff ≥ Δm. This provides an explicit, closed-form condition for tuning control gains, resolving the previous ambiguity.
- (2)
- Simulation Setup
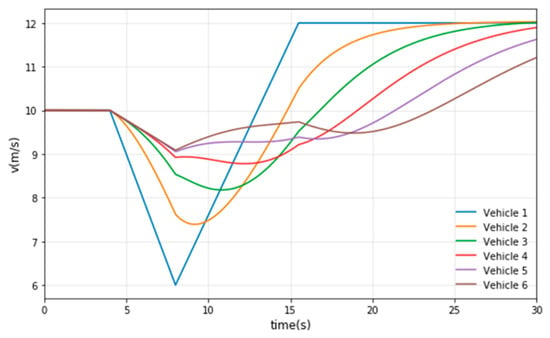
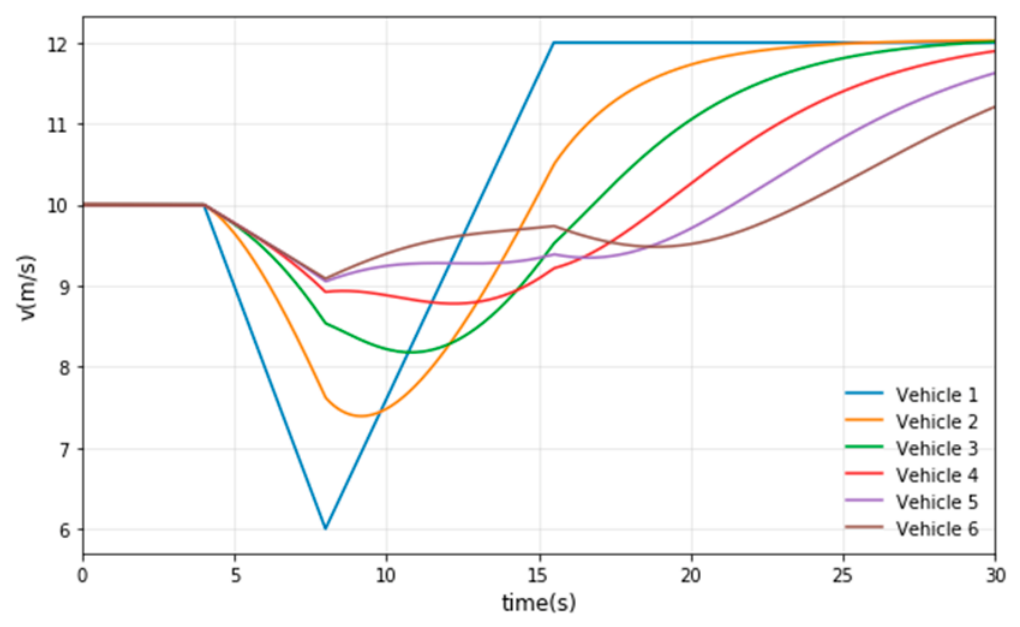
To validate the model’s resilience under disturbances, a simulated platoon of six vehicles was constructed. To avoid conflating disturbance attenuation with bad initial conditions, all vehicles started from the model’s equilibrium gap at 10 m/s (32.37 m). The leading vehicle decelerates to 6 m/s at a deceleration of −1 m/s2, then accelerates to 12 m/s at an acceleration of 0.8 m/s2, with a total simulation duration of 30 s.
Figure 12 reveals that the speed disturbance of the leading vehicle propagates backward along the platoon with a time lag for following vehicles, while the fluctuation amplitude attenuates continuously with increasing vehicle index. Due to the corrected equilibrium initial spacing (32.37 m), the speed fluctuation of the rear vehicles is effectively suppressed. The minimum speed of the rearmost vehicle (Vehicle 6) remains around 9.0 m/s, with no excessive deceleration observed. After 20 s, the speeds of all vehicles converge to a steady uniform state of 12 m/s.
Figure 12.
Speed Response Curve.
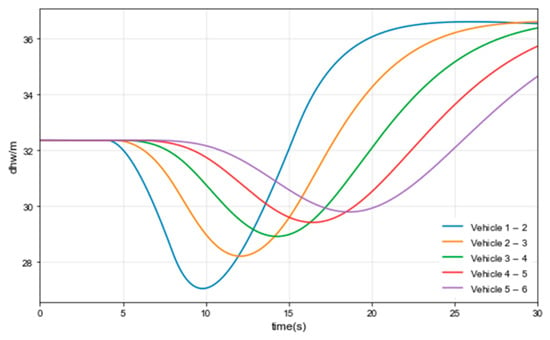
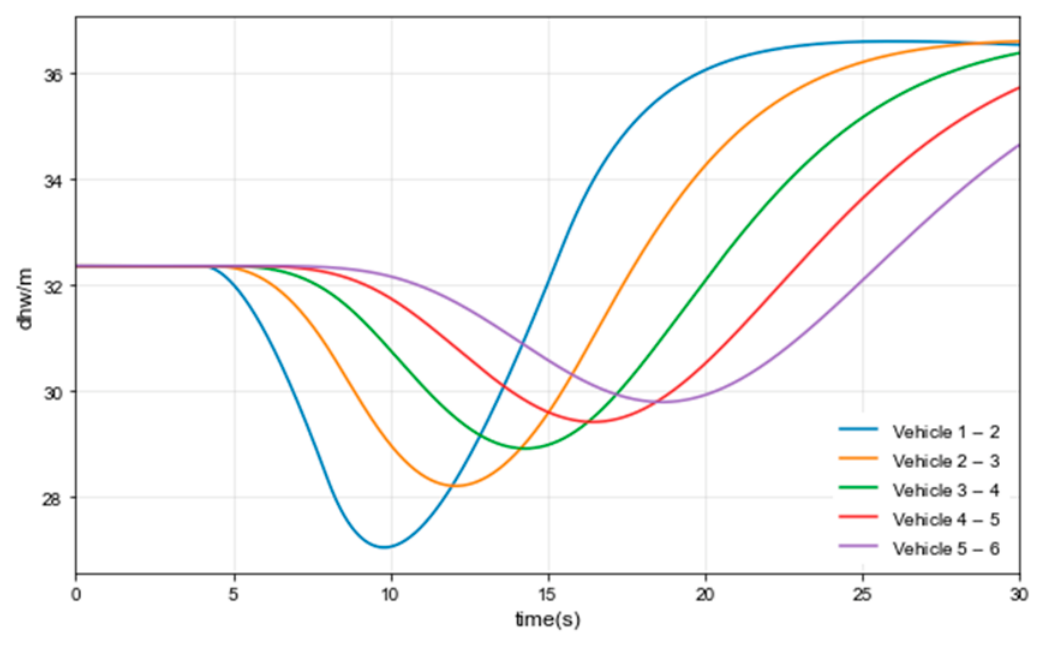
Figure 13 shows that the deceleration of the leading vehicle causes the headway between Vehicle 1 and Vehicle 2 to decrease from 32.37 m to a minimum of 27.05 m. This disturbance attenuates significantly as it propagates downstream; the minimum headway between Vehicle 5 and Vehicle 6 is 29.79 m. At all times, the inter-vehicle distances remain well above the physical limit, demonstrating high safety.
Figure 13.
Time-Headway Distance Variation Curves.
The simulation results indicate that speed and headway disturbances propagating along the platoon exhibit the characteristics of delayed transmission and amplitude attenuation. The platoon spontaneously recovers to a uniform steady state, proving that the model possesses excellent analytical and local stability under the corrected equilibrium initial conditions.
4.6. Safety Analysis
The time-to-collision (TTC) and time-exposed time-to-collision (TET) were adopted to evaluate the model safety. The definitions of TTC and TET are as follows:
where N is the total number of time steps; Δt is the sampling interval (0.1 s); δt is an indicator function, where δt = 1 if 0 < TTC(t) < T*, and δt = 0 otherwise; and T* is the safety threshold, set to 3 s [28]. The TET reduction rate is defined as the percentage decrease in TET relative to the 0% all-human-driven baseline.
To address stochasticity, the 0% CACC penetration rate is defined as the all-human-driven vehicle baseline, yielding a mean TET of 0.700 s. Each penetration rate was simulated 30 times with different random seeds, and Table 5 reports the mean TET values with the 95% confidence intervals.
Table 5.
TET Evaluation under different CACC penetration rates (Mean ± 95% CI).
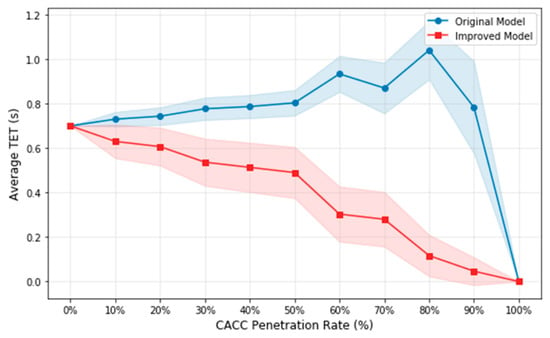
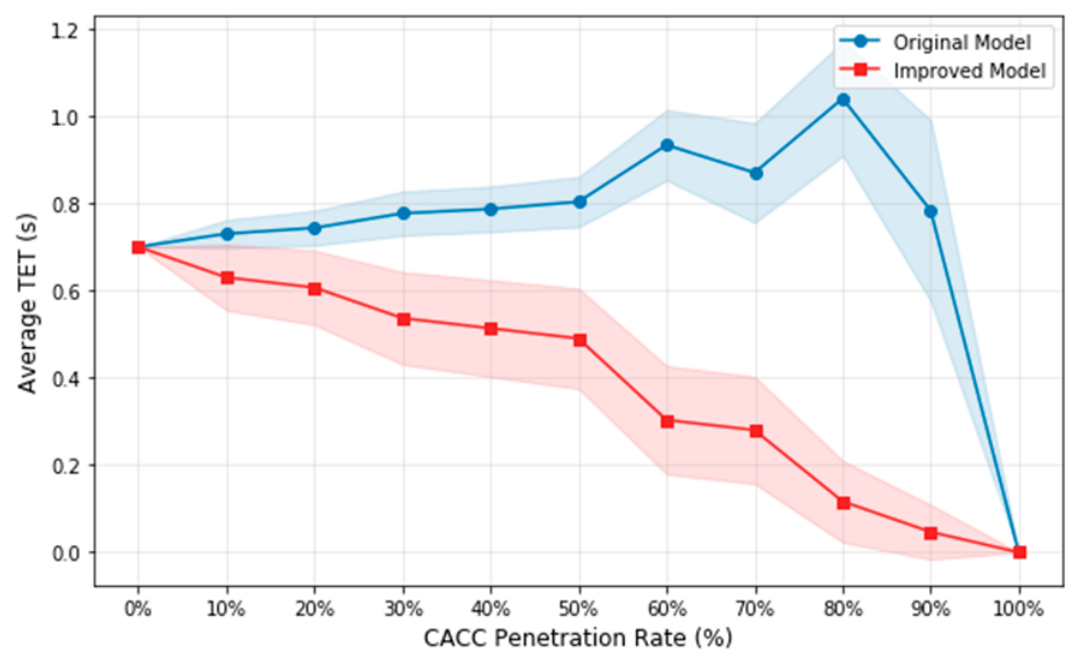
As illustrated in Figure 14, the Original Model (blue line) exhibits severe safety degradation during the mixed traffic phase. Its mean TET increases to a peak of 1.040 s at 80% penetration, which is significantly worse than the pure human-driven baseline. This reveals that the original PATH model cannot adapt to human driver heterogeneity and extended braking distances, leading to control conflicts. In stark contrast, the Improved Model (red line) demonstrates a continuous and monotonic decrease in average TET as the penetration rate increases. It consistently maintains a substantially lower TET than the original model across all mixed traffic scenarios, achieving an 88.75% TET reduction at 80% penetration. This confirms that the proposed speed-adaptive time headway and kc correction fundamentally enhance safety robustness.
Figure 14.
Comparison of Average TET under Different CACC Penetration Rates. Note: The shaded areas represent the 95% confidence intervals over 30 independent simulation runs.
To provide a comprehensive perspective on the efficiency cost across different operating speeds, Table 6 summarizes the theoretical single-lane capacity for the human baseline, the standard PATH model, and the proposed model, based on the fundamental traffic flow equation Q = 3600⋅v/ddes.
Table 6.
Theoretical single-lane capacity at different operation speeds.
It must be acknowledged that this safety enhancement is achieved at a significant cost to traffic efficiency. As quantitatively shown in Table 6 and analyzed at the representative speed of 7 m/s, the proposed model demands a gap of 30.13 m, whereas the corrected empirical human driving distance is only 21.67 m. Consequently, the theoretical single-lane capacity drops from approximately 1163 veh/h (human baseline) to 836 veh/h. Furthermore, compared to the standard PATH model (which requires an 11.3 m gap at 7 m/s, yielding roughly 2230 veh/h), the proposed model represents a deliberate throughput reduction of over 62.5%. This confirms that the model intentionally prioritizes safety margins over single-lane capacity, a justified design choice for deployment on icy and snowy roads where braking distances are severely extended.
5. Conclusions
This study addresses a critical gap in CACC car-following control for cold-region urban expressways: the inability of fixed-time-headway models to accommodate the coupled effects of low-speed, high-density traffic and adhesion-induced braking-distance extension under icy and snowy conditions. By integrating naturalistic driving data, an exponential-decay time-headway law, and an ice–snow road correction coefficient into the PATH CACC framework, an ice–snow-corrected CACC car-following model is developed and systematically validated. The main conclusions are as follows:
- (1)
- The naturalistic driving data reveal a robust exponential-decay relationship between time headway and speed under icy and snowy conditions (R2 = 0.995, Bootstrap 95% CI: [0.994, 0.996]). AIC/BIC comparisons confirm the exponential form is statistically superior to linear and polynomial alternatives (ΔAIC = 1136). Re-fitting on the pure car-following subset (N = 611) yields an R2 of 0.992, confirming the robustness of the core relationship. As speed increases, time headway asymptotically converges to approximately 1.5 s, which serves as a theoretical extrapolation for the speed-adaptive safety lower bound. This measured law provides a data-driven foundation for replacing the fixed desired time headway in conventional CACC models.
- (2)
- An ice–snow road correction coefficient is introduced as an adhesion-compensated safety margin coefficient. The calibrated coefficient has a mean of 1.1145. A comprehensive sensitivity analysis of the safety redundancy parameter λ (0.3–0.7) validates that the chosen value of λ = 0.5 represents a well-justified balance between safety margin and traffic efficiency. Combined with the exponential-decay time headway, the improved model enables desired spacing to respond jointly to speed variation and ice–snow road adhesion.
- (3)
- Multi-dimensional validation demonstrates that the improved model outperforms the original PATH model in fitting accuracy, tracking smoothness, an explicit analytical string-stability condition with a defined safety margin, and TET-based safety. The RMSEs for acceleration, speed, and displacement are 0.3001 m/s2, 0.7942 m/s, and 2.1279 m, respectively. Although the transient response is slightly slower due to the reduced feedforward, the model achieves significantly smoother tracking and avoids the excessive deceleration that frequently occurs in the original model.
- (4)
- TET-based safety evaluation shows that the safety benefit of the improved model is penetration-dependent. Based on 30 independent simulation runs, the original model exhibits severe safety degradation in mixed traffic (reaching a TET of 1.040 s at 80% penetration, worse than the human baseline), whereas the improved model achieves a continuous and monotonic TET reduction (e.g., an 88.75% reduction at 80% penetration). Crucially, this safety enhancement is achieved through a deliberate safety–efficiency trade-off: the model demands a 30.13 m gap at 7 m/s compared to the empirical human driving distance of 21.67 m, intentionally prioritizing safety margins over single-lane capacity in extreme weather.
Overall, the proposed model advances CACC car-following control from fixed-headway, dry-road-oriented design toward speed-adaptive and adhesion-aware control for icy and snowy urban expressways. The findings provide a theoretical basis and empirical reference for CACC deployment in cold regions. Future work will extend the model to different vehicle types and snowfall intensities to further validate its generality.
Supplementary Materials
The following supporting information can be downloaded at: https://www.mdpi.com/article/10.3390/electronics15225368/s1, Data file (data.xls).
Author Contributions
Conceptualization, L.W. and N.S.; methodology, N.S.; software, N.S.; validation, X.L., N.S. and L.W.; formal analysis, N.S.; investigation, N.S.; resources, X.L.; data curation, X.L.; writing—original draft preparation, N.S.; writing—review and editing, L.W.; visualization, X.L.; supervision, L.W.; project administration, L.W.; funding acquisition, L.W. All authors have read and agreed to the published version of the manuscript.
Funding
This research was funded by the National Natural Science Foundation of China, grant number 52672437; the Program for Young Talents of Basic Research in Universities of Heilongjiang Province, grant number YQJH2023146; the Heilongjiang Provincial Natural Science Foundation of China, grant number PL2025E077; and the Fundamental Research Funds for Heilongjiang Provincial Universities, grant number 2023GJ05.
Data Availability Statement
The original contributions presented in the study are included in the Supplementary Materials (data.xls). Further inquiries can be directed to the corresponding author.
Conflicts of Interest
The authors declare no conflict of interest.
References
- Lopes, A.; Araujo, R.E. Model-based predictive control implementation for cooperative adaptive cruise control. U Porto J. Eng. 2016, 2, 1–10. [Google Scholar] [CrossRef] [Scilit]
- Wei, S.Y.; Zou, Y.; Zhang, T.; Zhang, X.; Wang, W. Design and experimental validation of a cooperative adaptive cruise control system based on supervised reinforcement learning. Appl. Sci. 2018, 8, 1014. [Google Scholar] [CrossRef] [Scilit]
- Milanes, V.; Shladover, S.E. Modeling cooperative and autonomous adaptive cruise control dynamic responses using experimental data. Transp. Res. Part C Emerg. Technol. 2014, 48, 285–300. [Google Scholar] [CrossRef] [Scilit]
- Van Arem, B.; Van Driel, C.J.G.; Visser, R. The Impact of cooperative adaptive cruise control on traffic-flow characteristics. IEEE Trans. Intell. Transp. Syst. 2006, 7, 429–436. [Google Scholar] [CrossRef] [Scilit]
- Shladover, S.E.; Su, D.; Lu, X.Y. Impacts of cooperative adaptive cruise control on freeway traffic flow. Transp. Res. Rec. 2012, 2324, 63–70. [Google Scholar] [CrossRef] [Scilit]
- Milanes, V.; Shladover, S.E.; Spring, J.; Nowakowski, C.; Kawazoe, H.; Nakamura, M. Cooperative Adaptive Cruise Control in real traffic situations. IEEE Trans. Intell. Transp. Syst. 2014, 15, 296–305. [Google Scholar] [CrossRef] [Scilit]
- Liu, H.; Kan, X.G.; Shladover, S.E.; Lu, X.-Y.; Ferlis, R.E. Impact of cooperative adaptive cruise control on multilane freeway merge capacity. J. Intell. Transp. Syst. Technol. Plan. Oper. 2018, 22, 263–275. [Google Scholar] [CrossRef] [Scilit]
- Gu, H.Y.; Zhang, J.; Jin, P.J.; Ran, B. Stability analysis of lead-vehicle control model in cooperative adaptive cruise control platoon within heterogeneous traffic flow. J. Southeast Univ. (Engl. Ed.) 2018, 34, 386–393. [Google Scholar]
- Ibrahim, A.T.; Hall, F.L. Effect of adverse weather conditions on speed-flow-occupancy relationships. Transp. Res. Rec. 1994, 1457, 184–191. [Google Scholar]
- Kyte, M.; Khatib, Z.; Shannon, P.; Kitchener, F. Effect of weather on free-flow speed. Transp. Res. Rec. 2001, 1776, 60–68. [Google Scholar] [CrossRef] [Scilit]
- Billot, R.; El Faouzi, N.E.; De Vuyst, F. Multilevel assessment of the impact of rain on drivers’ behavior: Standardized methodology and empirical analysis. Transp. Res. Rec. 2009, 2107, 134–142. [Google Scholar]
- Choi, S.; Oh, C. Proactive strategy for variable speed limit operations on freeways under foggy weather conditions. Transp. Res. Rec. 2016, 2551, 29–36. [Google Scholar] [CrossRef] [Scilit]
- Khan, H.Z.; Shah, A.A.S.; Gulliver, A.T. A macroscopic traffic model based on weather conditions. Chin. Phys. B 2018, 27, 070202. [Google Scholar] [CrossRef] [Scilit]
- Gong, B.; Wei, R.; Wu, D.; Lin, C. Fleet management for HDVs and CAVs on highway in dense fog environment. J. Adv. Transp. 2020, 2020, 8842730. [Google Scholar] [CrossRef] [Scilit]
- Tang, J.X.; Xu, J.Y.; Liu, C.Z. Robust H∞ MPC method for heterogeneous CACC system with communication delay. Meas. Sci. Technol. 2026, 36, 056210. [Google Scholar] [CrossRef] [Scilit]
- Liu, Q.C.; Gao, C.Z.; Wang, H.; Cai, Y.; Chen, L.; Lv, C. Learning From Trajectories: How Heterogeneous CACC Platoons Affect the Traffic Flow in Highway Merging Area. IEEE Trans. Veh. Technol. 2024, 73, 16212–16224. [Google Scholar] [CrossRef] [Scilit]
- Wang, W.X.; Wu, B. The fundamental diagram of mixed-traffic flow with CACC vehicles and human-driven vehicles. J. Transp. Eng. Part A-Syst. 2023, 149, 01022116. [Google Scholar] [CrossRef] [Scilit]
- Wang, Y.C.; Wu, L.N.; Ci, Y.S. Cooperative Adaptive Cruise Control with Model-Based Imitation Reinforcement Learning in Mixed Traffic of Connected Autonomous and Human Driven Vehicles. TrTransp. Res. Rec. J. Transp. Res. Board 2026, 2680, 437–455. [Google Scholar] [CrossRef] [Scilit]
- Luo, Y.C.; Ci, Y.S.; Zhang, H.X.; Wu, L. A Yolov8-CE-based Real-time Traffic Sign Detection and Identification Method for Autonomous Vehicles. Digit. Transp. Saf. 2024, 3, 82–91. [Google Scholar] [CrossRef] [Scilit]
- Hu, X.; Chen, H.; Ren, Q.; Gong, X.; Wang, P.; Hu, Y. Estimation and expansion of vehicle stability region with sums of squares programming. IEEE ASME Trans. Mechatron. 2023, 28, 2820–2831. [Google Scholar] [CrossRef] [Scilit]
- Xu, J.Y.; Tang, J.X.; Liu, C.Z. An adaptive switched robust H∞ control for CACC system considering road adhesion coefficient and communication failure. Meas. Sci. Technol. 2025, 36, 056205. [Google Scholar] [CrossRef] [Scilit]
- Shan, H.G.; Yu, C.H.; Xu, J.L.; Gao, C.; Yao, Y. Calibration on Expressway Car-following Model with Various Rainfall Intensities. J. Highw. Transp. Res. Dev. 2024, 41, 190–198. [Google Scholar]
- Zhao, H.Z.; Wu, H.; Lu, N.N.; Fu, J.S.; Xu, E.Y.; Zhan, X.; He, S.L. An MPC-based driving trajectory tracking control strategy of CACC fleet in curves under V2X environment. Control Decis. 2024, 39, 975–984. (In Chinese) [Google Scholar]
- Zhao, H.Z.; Lu, N.N.; Chen, J.P.; Zhan, X.; Xu, E.Y. A CACC data accuracy improvement method based on improved Kalman filtering in V2X environment. J. Chongqing Jiaotong Univ. (Nat. Sci.) 2022, 41, 151–156. (In Chinese) [Google Scholar]
- VanderWerf, J.; Shladover, S.; Kourjanskaia, N.; Miller, M.; Krishnan, H. Modeling Effects of Driver Control Assistance Systems on Traffic. Transp. Res. Rec. 2001, 1748, 167–174. [Google Scholar] [CrossRef] [Scilit]
- Gillespie, T. Fundamentals of Vehicle Dynamics; SAE International: Warrendale, PA, USA, 2021. [Google Scholar] [CrossRef] [Scilit]
- Gu, H.Y. Research on freeway car-following modeling and simulation in connected vehicle environment. Ph.D. Thesis, Southeast University, Nanjing, China, 2017. [Google Scholar]
- Minderhoud, M.M.; Bovy, P.H. Extended time-to-collision measures for road traffic safety assessment. Accid. Anal. Prev. 2001, 33, 89–97. [Google Scholar] [CrossRef] [Scilit] [PubMed]

Disclaimer/Publisher’s Note: The statements, opinions and data contained in all publications are solely those of the individual author(s) and contributor(s) and not of MDPI and/or the editor(s). MDPI and/or the editor(s) disclaim responsibility for any injury to people or property resulting from any ideas, methods, instructions or products referred to in the content. |
© 2026 by the authors. Licensee MDPI, Basel, Switzerland. This article is an open access article distributed under the terms and conditions of the Creative Commons Attribution (CC BY) license.