


Abstract
Onboarding in software teams requires the simultaneous acquisition of technical, domain, and organisational knowledge, while the progress of new employees is often monitored through informal and “difficult-to-compare” assessments. This paper presents an integrated, metric-based model for recording and reviewing indicators specified in an onboarding plan and preliminarily examines its functional and computational feasibility using a software prototype. The research was conducted using the Design Science Research (DSR) approach, with the integrated model serving as the central research artefact incorporating selected planning and evaluation concepts from the previously developed OnMod model. The model integrates a conceptual domain model, a functional and structural specification based on the Unified Modeling Language (UML), and an operational model for measurement and score calculation. The prototype supports versioned onboarding plans, a hierarchical metric tree, four measurement specifications, two additional recording methods, periodicity, normalisation, and fixed-weight aggregation. The contribution lies in defining the links between the plan version, measurement specifications, period-specific records, and hierarchically calculated results. Demonstration and preliminary evaluation were conducted in a controlled, simulated scenario with one expert participant in a small software company. The scenario simulated two weeks of onboarding. An additional sensitivity analysis examined the effects of changes in weights and selected inputs on the same metric tree. The analytical root node score is 0.829375. For the examined endpoint combinations of local weights modified by , with the weights of the children of each node renormalised to sum to 1, the score ranges from 0.805012 to 0.857072. The preliminary evaluation shows that the specified measurement, recording, and score aggregation procedures can be executed in the prototype within a controlled scenario.
1. Introduction
1.1. Research Background
In organisational research, onboarding can generally be treated as a gradual process in which a new employee learns how to perform his or her role and becomes part of the social and organisational environment [1]. A meta-analysis of 70 independent samples identifies role clarity, self-efficacy, and social acceptance as key indicators of new employee adjustment and links them to job satisfaction, organisational commitment, work performance, and intention to stay [1]. A bibliometric analysis of 452 publications shows that the research field is fragmented and that, in addition to traditional organisational socialisation, digital, virtual, and software engineering aspects of onboarding are increasingly being distinguished [2]. Onboarding, therefore, is not just an administrative orientation or a one-time training session, but a process that takes place over a period of time and includes learning, task performance, and integration into the work environment.
In software teams, onboarding has a pronounced sociotechnical character: the new employee simultaneously learns about the code base and architecture, development tools, product domain, workflow, and ways of collaborating within the company. The findings of Ju et al.’s research indicate that initial development tasks have a broader role than just contributing to software development, as they allow the new employee to gradually acquire knowledge, develop confidence in their own work, and integrate into the team environment [3]. Support for new employees is also associated with more successful onboarding, job satisfaction, and intention to stay in the organisation [4].
The way an employee is integrated also depends on the team structure and working conditions. In agile teams, a new employee is involved through formal and informal practices, interactions, and gradual participation in the project [5], while globally distributed and legacy projects introduce additional difficulties and steps due to scattered knowledge, domain specificity, and the complexity of existing systems [6]. In remote work conditions, the onboarding process additionally depends on the availability of communication channels, support from more experienced team members, and opportunities to establish professional and social connections, as shown in a survey of 267 developers [7]. Understanding existing software also depends on how information about the program is conveyed and related to the specific tasks of the new member [8].
Existing software support covers different parts of the process. Adaptive onboarding paths support the selection and reuse of content according to the experience, technical domain, and needs of the team [9], while visualisation of architecture, structure, and code evolution can facilitate the understanding of complex systems [10]. The results of a systematic review of 32 primary studies indicate that existing solutions most often support individual process aspects of onboarding, with recommender and web-based systems being among the most common approaches [11]. At the same time, some of the problems that new members encounter are still not covered by available software solutions [11]. Studies of small software companies further emphasise the importance of structured activities, mentoring support, knowledge sharing, and adaptation to the organisational context [12,13].
1.2. Research Gap
Existing research considers individual aspects of onboarding planning, new employee adaptation, software support, and measurement [9,11,14]. Collecting measures, deriving indicators, and using results for feedback are already covered by previous solutions [14]. The OnMod model integrates participants, resources, learning objectives, methods, tasks, an onboarding plan, evaluation, and feedback [15] as interconnected elements of the onboarding process. These concepts and the plan adaptation cycle are inherited from OnMod. The problem addressed here is to define their application in a measurement system precisely: which plan version applies to a process, which inputs are admissible, which period a record belongs to, and which rules are used to derive its score.
The proposed artefact connects these elements through explicit domain relationships and processing constraints. Its contribution includes linking a process to a specific plan version, measurement configurations to records for individual periods, and those records to verifiable hierarchical results. The model operationalises selected OnMod concepts and represents the central research artefact, forming the conceptual basis of the software prototype used for demonstration and preliminary evaluation. Planning, feedback, metric hierarchies, UML, normalisation, and weighted sums are established concepts and methods. The contribution is their integration into explicit rules for recording and reviewing indicators within an assigned onboarding plan. In this paper, progress refers to the results of those configured indicators and is interpreted within the objectives and assessment conditions of that plan. The model is intended to support structured onboarding progress monitoring in real organisational settings in the software industry.
Operationalising progress also requires a clear definition of the meaning and limitations of the results obtained. In the psychometric approach, the measurement of knowledge or competence is based on the development and validation of measurement instruments [16]. In the field of software measurement, the obtained values should be interpreted in relation to the specific property being measured and predefined rules of interpretation [17]. The Goal Question Metric (GQM) further emphasises that the choice of measures should be derived from clearly defined measurement objectives [18]. For this reason, progress in this paper is treated as a set of operational indicators that are defined in the context of a specific onboarding plan.
1.3. Aim, Contributions and Research Questions
The paper aims to develop and preliminarily evaluate an integrated DSR model for structured, metric-based monitoring within a versioned onboarding plan and to implement it in a software prototype. Its preliminary evaluation examines the execution of specified functional flows, agreement between prototype and manual calculations, and the initial understandability of the configuration and displayed results through a controlled simulated scenario with one expert participant.
The contributions of this paper include: (1) a conceptual domain model that links selected OnMod concepts to plan versions, metric nodes, measurement configurations, records, and calculated results; (2) a UML functional specification with execution rules and constraints for these relationships; (3) an operational model that includes four measurement specifications, two additional recording methods, measurement periodicity, normalisation, and fixed-weight aggregation; (4) an executable prototype that connects a specific version of the onboarding plan, measurement records, and current calculated results; and (5) a preliminary evaluation of functional execution, computational agreement, and initial understandability in a controlled simulated scenario with one expert participant from a small software company. In addition, a reproducible sensitivity analysis of aggregation was conducted, metric-quality requirements were discussed, and a non-compensatory condition for critical metrics was defined.
The development and evaluation of the artefact were organised according to the principles of the DSR approach and the Design Science Research Methodology (DSRM) process [19,20]. The artefact was demonstrated and preliminarily evaluated in a controlled scenario that simulated a two-week onboarding period. The demonstration involved one software professional. A separate numerical analysis examines the same metric tree without running the prototype. These procedures provide evidence about the calculations and functional flows examined, together with initial expert feedback. The evaluation addresses these properties of the model and prototype, while the use of the resulting indicators to monitor actual employee progress requires assessment in real onboarding processes.
The following research questions (RQs) guide the study:
(RQ1): What domain concepts, relations, and constraints are needed to represent versioned onboarding plans and support metric-based progress tracking during the onboarding process in software teams?
(RQ2): What functions and business rules are needed for the system to support the management of onboarding plans and their versions, definition of metric hierarchies, the recording of measurements, and the calculation and display of results?
(RQ3): How can heterogeneous and repeated measurements be normalised and hierarchically aggregated into traceable onboarding progress results?
(RQ4): To what extent do the results generated by the software prototype correspond to the researcher’s separate manual calculation for the given input values?
(RQ5): To what extent does the software prototype implement the functional flows specified in the controlled simulated onboarding scenario?
(RQ6): How does an Onboarding Lead assess the initial practical understandability of the software prototype in a controlled and simulated onboarding scenario?
1.4. Paper Outline
The rest of the paper is organised as follows. Section 2 presents relevant research on onboarding in software teams, knowledge management, competency assessment, and software support for the onboarding process. The comparison in Section 2 distinguishes the existing functions of prior solutions from the contribution of this artefact. Section 3 describes the research design, theoretical basis, and scope of the artefact, the iterative process of its design and development, and the design of the demonstration and preliminary evaluation. Section 3 also specifies the relationship to OnMod. Section 4 presents the layers and integrated view of the conceptual domain model. Section 5 presents the functional specification of the system. Section 6 formalises the measurement specifications, recording methods, normalisation, periodicity, current record selection, and hierarchical aggregation of results. Section 6.6, Section 6.7 and Section 6.8 supplement these rules with the interpretation of aggregation, metric quality requirements, and a non-compensatory condition for critical metrics. Section 7 describes the prototype demonstration and the results of the preliminary evaluation. Section 7.8 presents numerical experiments using synthetic data. Section 8 discusses the obtained results, contributions, practical implications, and limitations of the research, and Section 9 presents conclusions and directions for future research.
2. Related Work
Onboarding in software teams involves acquiring technical and domain knowledge, becoming familiar with work practices, and gradually integrating a new member into an existing team. Initial development tasks play a broader role than just assessing productivity, as they allow the new employee to gain knowledge through practical work, develop confidence in their own abilities, and establish relationships with other team members. A study conducted at Microsoft shows that initial tasks can be assigned in different ways and that the choice of the appropriate strategy depends on the characteristics of the task, the work environment, and the needs of the new member [3]. Research on the evolution of project leader onboarding over a decade further indicates the importance of mentoring and guidance in connecting formal training, independent learning, and experience gained through work [21]. Classification of task types according to team member roles can also serve as support for more systematic analysis and planning of work in software projects [22].
The need for adaptation is particularly pronounced in hybrid and distributed software teams. Research on distributed software projects suggests that the integration of new members requires organisational support to help them become familiar with existing work practices and ways of working. In this process, the mentor plays an important role in guiding the new member, selecting appropriate tasks, and monitoring their integration into the team [23]. In a hybrid work environment, the social component of onboarding is of additional importance, that is, the way in which new software professionals establish connections with colleagues and develop a sense of belonging to the team and the organisation [24].
The diverse backgrounds and needs of new hires have prompted the development of structured and adaptable onboarding paths. Azanza et al. propose an approach that allows existing onboarding content to be reused and adapted to different employee profiles, technical areas, and team needs [9]. Their solution organises available resources and categories into a hierarchical structure from which, by applying variability mechanisms, different onboarding paths can be formed. However, the focus of this approach is on the configuration and reuse of content, rather than on quantitatively determining the degree of achievement of goals and calculating overall progress. Another type of support is considered by Padoan et al., who analyse the use of visualisation of software architecture, structure, and code evolution as a tool that can facilitate the understanding of the existing system by new members [10].
The acquisition of knowledge during onboarding is also closely related to broader knowledge management practices in software organisations. In agile development, knowledge is not transferred exclusively through formal documentation, but also through continuous communication, collaboration, iterative work, engineering practices, knowledge sharing, and application [25]. A significant part of this knowledge can remain implicit and is accessible primarily through interaction with more experienced team members. Fannoun and Kerins consider systematic recording of experiences and lessons learned as a means of supporting organisational learning and propose a software solution that can collect such content and later reuse it [26]. In an educational context, Ardimento et al. use data from the development environment and version control system to analyse the behaviour of novices and enable better informed feedback [27].
Some research considers the competencies and performance of software professionals from a broader perspective. A systematic review by Cunha et al. shows that the capabilities of individuals and teams in agile development are described through multiple groups of characteristics, including technical, social, personal and innovative aspects, and various direct and indirect indicators are used to assess them [28]. The diversity of approaches used also indicates that there is no single measurement model that would be equally applicable to all software roles and organisational contexts. The assessment of competency gaps can, for example, combine the expected level of competence with self-assessment and assessments of other participants, as was applied in a multi-organisational study of software employees [29].
Metric-based software solutions have also been applied in performance analysis during software development. Raza et al. developed the ProcessPAIR system that combines process and product measures with an expert-defined performance model to identify potential problems and patterns in work [14]. This approach shows that directly collected measures can be further processed into derived indicators and used as a basis for feedback. The collection of multiple measures, derivation of indicators, and use of results for feedback are therefore already present in previous solutions. ProcessPAIR, however, was developed primarily for performance analysis within the Personal Software Process approach in an educational environment, and not for defining and periodically monitoring learning objectives during the onboarding process. Reszka et al. propose a different approach to software project monitoring, based on linking structural, semantic, and temporal characteristics of data extracted from a software repository [30]. Here, these established principles are applied to onboarding plan versions and period-specific assessment records.
Table 1 presents the functions described in selected prior studies and the operational additions developed in this research.
Table 1.
Functions of selected prior solutions and the focus of the proposed artefact.
Compared with the planning and feedback relationships defined in OnMod [15], the proposed artefact specifies an executable measurement system with elementary metric nodes, aggregation nodes, and a root score. Each elementary node has a measurement configuration, while its records retain the assigned plan version and measurement period. The contribution is the integration of these links with rules for admissible inputs, record selection, normalisation, and recursive aggregation. This enables a displayed score to be traced to the configuration and records that produced it, supports inspection of individual requirements, and preserves the interpretation of existing records when a later plan version is created.
3. Materials and Methods
This section presents the research design, theoretical basis, development procedure, and preliminary evaluation, together with the validity limitations and ethical considerations relevant to interpreting the findings.
The research builds on the OnMod model [15] by operationalising selected model concepts in an executable measurement system. The system links a hierarchical metric structure to versioned onboarding plans, period-specific measurement records, and explicit calculation rules.
3.1. Research Design
This study follows the DSR approach, in which artefacts are developed and evaluated to address relevant practical problems. Artefact development is grounded in an identified problem and existing knowledge, while the quality and contribution of the proposed solution are supported by appropriate evaluation [19].
The DSR literature recognises constructs, models, methods, and instantiations as types of artefacts [19,31]. Within this type of taxonomy, the integrated model for metric-based onboarding progress monitoring is defined as the central DSR artefact of this study, while the software prototype serves as its executable instantiation.
In this paper, the integrated model comprises a conceptual domain model, a UML specification, and an operational model for measurement and result calculation. The conceptual model defines the relevant concepts, their interrelationships and constraints. The UML specification describes the functions and structure of the solution, while the operational model defines the rules for recording, normalising, and aggregating data. The software prototype implements these model components in executable form and is used to examine the execution of the specified rules in a controlled scenario.
DSRM was used to organise the research process. According to Peffers et al. [20], DSRM includes six interrelated activities: (1) problem identification and motivation, (2) definition of solution goals, (3) design and development, (4) demonstration, (5) evaluation, and (6) communication of results. This process framework does not imply that all activities must be carried out once or in a strictly fixed order [20]. The iterative nature of the process is particularly important in the field of software engineering (SE), because the implementation and validation of the solution can lead to a better understanding of the initial problem and further improvement of the artefact [32,33]. The results of the evaluation may indicate the need to change the requirements, model, or implementation, which is why evaluation is not viewed solely as a final check, but also as a source of feedback during development [34].
The application of DSRM in this research is shown in Figure 1. In the problem identification phase, the lack of an operational mechanism to monitor the implementation of the onboarding plan through explicitly defined, measurable, and verifiable data was considered. Based on the identified problem, solution goals and requirements were defined that determine what the artefact should represent, record, calculate, and make traceable.
Figure 1.
Application of DSRM to artefact development and evaluation (based on [20]).
In the Design and Development phase, the artefact components described above were developed. Use case diagrams show the actors, system boundaries, and functional goals. Class models formalise domain concepts through the system structure, while the measurement model defines the method of processing data collected in the prototype.
The calculations were checked against the researcher’s manual calculation, and selected functions were checked by executing them in the scenario. The understandability of the prototype was examined through feedback from the participant who had previously configured that scenario. The results of these checks were used to further improve the model, defined rules, and user interface. The iterative return to the Design and Development phase is shown in Figure 1.
RQ1–RQ3 are addressed through the domain, functional, and measurement models in Section 4, Section 5 and Section 6. RQ4-RQ6 are examined through computational comparison, functional checks, and expert feedback in Section 7. The sensitivity analysis in Section 7.8 complements RQ3.
3.2. Theoretical Basis and Artefact Scope
The domain starting point of the proposed artefact is the OnMod model, in which onboarding is described as an iterative process based on interconnected roles, resources, learning objectives, methods, tasks, evaluation, and feedback [15]. Within this model, the onboarding plan connects learning objectives with initial tasks or projects and planned evaluation points, thereby structuring the content, sequence, and method of checking the onboarding activity [15]. The evaluation results can serve as a basis for changing the objectives, applied methods, and subsequent versions of the onboarding plan, which gives the process an iterative character [15].
The artefact includes the concepts necessary to define and version a specific onboarding plan, associate it with a position and onboarding process, and organise the plan structure in a tree format containing aggregation and elementary metric nodes. Such a structure allows for recording repeated measurements and calculating progress results. Changes to the plan structure or measurement rules are implemented by creating a new working version. An already running onboarding process remains associated with the plan version assigned to it at launch, so that subsequent changes do not affect its structure, measurement configuration, or the meaning of already saved measurement records.
OnMod model concepts that are not necessary for the listed functions are not presented as independent elements of the prototype. Therefore, the software prototype does not represent a complete implementation of the OnMod model but rather operationalises the selected part of the model that is relevant for metric-based monitoring of progress during onboarding. Feedback is supported in the prototype through the display of measurement results and statuses that can serve as a basis for making decisions when creating the next version of the plan.
Newcomer adjustment comprises several distinct dimensions. Bauer et al. examine role clarity, self-efficacy, and social acceptance in relation to subsequent organisational outcomes [1]. Their more recent review also considers task mastery and the organisational context of adjustment [35]. These dimensions cannot be inferred from a single overall score. In software teams, development tasks can provide evidence relevant to technical learning [3,36], but task completion alone does not establish independent understanding, transfer of knowledge to another task, or integration into the team. In this paper, knowledge acquisition is not viewed as a directly measured psychological or psychometric construct. Instead, progress is operationalised through observable outcomes and assessments linked to specific onboarding goals. Psychometric measurement of constructs involves the use of systematically developed and validated instruments, as well as an examination of their relevant measurement properties [16]. Psychometric validation was not conducted. Task completion, error counts, rubric-based ratings, Likert-type ratings, and manual assessments are used as operational inputs whose measurement properties remain to be examined empirically.
Technical, domain, and organisational learning require different forms of evidence. Reviewing a completed solution and the explanation of the decisions made can inform the assessment of task mastery. Performing a similar task with less assistance can inform the assessment of independence. Task difficulty and mentor support must be taken into account. Domain learning requires evidence of understanding business rules and workflows, while knowledge-sharing practices provide a context for learning within the team [6,25]. These examples justify the need for separate assessment dimensions.
Role clarity concerns the understanding of responsibilities and expectations. The simulated task-clarity item used in the demonstration covers only part of this dimension. Social acceptance requires data on belonging to the team and access to support from colleagues, which the technical scenario does not measure. Completing a technical task therefore cannot serve as a measure of the entire adjustment process. Reviews of competencies also distinguish technical, social, and personal capabilities [28]. The metric tree allows these dimensions to be configured separately, but the example does not cover all of them.
Following the principles of goal-oriented measurement [18], the plan should link an assessment objective to a question, an observable indicator, and a rule for its interpretation. For example, application programming interface (API) implementation can be assessed by reviewing solution correctness, code structure, validation, and testing against rubric criteria. The number of completed tasks provides different evidence and is therefore interpreted separately. The hierarchy links indicators to plan objectives, while the weighted sum provides a combined representation. Weights represent the priorities specified during plan configuration, under the assumption of acceptable compensation discussed in Section 6.5, Section 6.6, Section 6.7 and Section 6.8.
A clear delimitation of the meaning of the obtained results is important because measurement involves not only the technical assignment of numerical values to observations, but also the precise determination of the property being measured and the rules by which the obtained values are interpreted [17]. To maintain traceability, the prototype associates a specific onboarding process and elementary metric node with the corresponding measurement specification, period, raw and normalised value, recording time, and user account that entered the data. In this way, the calculated result can be linked to the records and configuration on the basis of which it was obtained.
Compared with OnMod, this paper defines the structure and execution rules of a hierarchical metric system that connects onboarding objectives to elementary measurements and derived aggregation scores. Learning objectives and tasks are represented by configurable metric nodes and their measurement specifications. Aggregation nodes organise those metrics into assessment dimensions, and the root node combines their results for the assigned plan version. Evaluation is operationalised through period-specific records, normalisation, measurement statuses, and recursive aggregation. Access to individual results supports feedback and the configuration of the next plan version. The domain model, UML use case diagrams, business constraints, and mathematical expressions specify these relationships and their execution.
3.3. Artefact Design and Development Procedure
The starting point for development is the artefact framework defined in Section 3.2. In the following steps, a conceptual model, a UML specification, and an operational measurement model were developed, which were then implemented in a software prototype. This way of organising work puts into practice the Design and Development activities within the DSRM framework, which include defining functionality and architecture, as well as creating the artefact itself [20].
Figure 2 shows the listed steps and the feedback loops used during their refinement. Returning to the previous step allowed for the correction of observed deficiencies. In cases where a discrepancy was identified, requiring correction of basic concepts, their mutual relationships, or defined constraints, the conceptual model was also reconsidered. Engström et al. distinguish contributions related to understanding the problem, designing the solution, and its verification in software engineering [32].
Figure 2.
Iterative artefact development procedure.
In the first step, the selected concepts of the OnMod model and the established boundaries were mapped into a conceptual domain model. It defined the relevant entities, their mutual relations, cardinalities, and constraints in the areas of organisational context, planning, onboarding plan versioning, configuration and recording of measurements, and calculation of results.
In the second step, the domain concepts and identified system responsibilities were specified in UML models. Use case diagrams depict the system actors, system boundaries, and functional goals, while conceptual class diagrams formalise the static domain structure. Class models that connect domain entities, application services, computational logic, and the persistence layer are also used during implementation. Business rules are further defined in the accompanying text and a formal measurement model. UML notation is used in accordance with the UML 2.5.1 specification [37].
In the third step, an operational model for measurement and calculation of results was developed. For elementary metric nodes, measurement types, allowed ranges of input values, interpretation direction, measurement periodicity, and normalisation rules were determined, while aggregation rules were determined for higher levels of the tree. The source values are stored separately from the derived normalised results, thus enabling tracking of the calculation process. The prototype does not display a single percentage of measurement coverage, but displays a Measured, Missing, or Overdue status for each required measurement.
In the fourth step, a multi-layer software prototype was developed in which the concepts of the conceptual model are represented in the form of corresponding domain entities. Application services implement business rules and calculations; the data storage layer ensures the storage of configurations and measurement records, while the user interface enables the execution of the intended functions of this system.
Development was not conducted as a strictly one-way process. Inconsistencies identified during UML specification, measurement model development, or implementation were used as a basis for going back to previous steps and correcting concepts, constraints, or rules, which is presented with feedback loops in Figure 2. This alternation of design, implementation, and verification of solutions is consistent with the iterative nature of DSR in software engineering [32].
Traceability is maintained by associating domain concepts with use case model elements and prototype entities, functional requirements with application services and business rules, and mathematical expressions with implemented computational logic. In software development, traceability is based on establishing and maintaining links between artefacts created in different phases of development, including requirements, models, code, and tests [38].
3.4. Demonstration and Preliminary Evaluation Design in a Software Company
After the development of the artefact, a demonstration and preliminary evaluation of the software prototype were conducted. In the DSRM framework, a demonstration serves to show the application of the developed artefact in the context of a defined problem, while an evaluation examines the extent to which the achieved results correspond to the solution objectives [20]. In this work, a scenario-based demonstration and preliminary evaluation in a controlled setting were conducted. Such an approach is in line with the concept of artificial evaluation in the Framework for Evaluation in Design Science (FEDS), where the artefact is examined in controlled or simulated conditions using predefined criteria [39].
The demonstration scenario represented a two-week onboarding period for a Full-Stack .NET Developer position. The demonstration involved a software professional employed by Company A, who held the roles of Team Lead and Full-Stack .NET Developer at his workplace. In the prototype, the participant assumed the role of Onboarding Lead and configured a simulated onboarding process for a representative employee in a selected position. The scenario included data for two measurement periods and a development task that included the user interface, API, business rules, persistence, and implementation validation. The choice of this task was based on findings indicating that initial development tasks during onboarding can play a role in technical learning, gradual development of autonomy, and inclusion of the new developer in the team [3,36].
The participant, acting in the role of Onboarding Lead, configured the onboarding plan, metric tree, metric weights, measurement periodicity, and configurations. In the prototype, each measurement configuration is represented by a MeasurementPolicy entity and one corresponding specification of type MeasurementSpecification. For the purposes of demonstration, numeric, binary, Likert-type, and rubric-based measurement specifications were used in this paper, as well as two additional recording methods: manual score entry and completion recording. The scenario metrics and weights were configured by this participant for the selected position and demonstration tasks. They serve as a specific configuration for evaluating the model, rather than a validated competency framework.
A rubric-based measurement specification was used to define and describe the assessment criteria in advance. A rubric may support a more consistent application of these criteria, but its use alone does not establish the validity of the assessment or ensure the agreement between raters [40].
The task-clarity Likert-type item (M7) used in the scenario addressed the clarity of the task and the next steps. The value entered for this item was part of a simulated scenario and did not represent the participant’s personal assessment of their experience during the onboarding process. This item was included as an operational example of a clarity-related measurement. This choice was motivated by research that considered role clarity an aspect of new employee adjustment [1].
After configuring the plan, the participant ran a simulated scenario representing a two-week onboarding process. Data corresponding to the first and second periods were entered into the prototype, after which the prototype calculated the results. The participant then reviewed the results in the metric tree and the statuses of the required measurements.
The flow of the demonstration is shown in Figure 3, while the specific metrics, input values, and normalised and aggregated results are presented in Section 7.
Figure 3.
Workflow of the simulated two-week demonstration and preliminary evaluation.
Sensitivity analysis was conducted on the computational model of the tree in Section 7.2 using the synthetic inputs and baseline aggregation calculations reported in Section 7.4. The researchers retained the tree structure and elementary scores while changing the weight configuration. In the first experiment, each of the 13 local weights was multiplied by a factor of 0.90 or 1.10; in the second, by a factor of 0.80 or 1.20. For each combination, the modified weight of a child was divided by the sum of the modified weights of all children of the same parent, so that their weights again summed to 1. In each experiment, all endpoint combinations of factors were examined, and the tree score was recalculated for each combination. Weight changes of and define the configurations examined. Additional analysis examined equal weights for the children of each node, a change in the M7 rating from 4 to 3, and separate omission of the M2 and M3 records from the current period while retaining their weights.
For each configuration, the researchers compared the hierarchical calculation with the sum of the elementary scores multiplied by the effective weights defined in Section 6.6. The minimum and maximum scores and deviations from the baseline score were calculated. This procedure examines the sensitivity of the composite indicator to the specified changes in configuration and inputs [41]. The article presents the baseline data, the weight modification rule, the number of combinations examined, and the results.
3.5. Validity Considerations
The validity of the research was considered in relation to the design and scope of the DSR artefact evaluation. In the DSR approach, the evaluation should provide a basis for assessing the quality and applicability of the developed artefact in relation to the set goals and not be limited to confirming that the solution was technically implemented [19]. In this research, the evaluation had a formative role, as it was aimed at checking the implemented functions and computational consistency, and identifying opportunities for further improvement of the prototype [39].
The evaluation was conducted in a software company in Serbia using synthetic values in a scenario simulating two weeks of onboarding. This type of verification corresponds to the evaluation in controlled conditions that FEDS distinguishes from evaluation in real-world conditions [39]. The same participant configured the plan, executed the functional flows, and assessed the prototype. This dual role may lead to a more favourable assessment of his own configuration and confirmation bias. Independent expert raters and actual new employees were not included.
Construct validity indicates the extent to which the selected procedures and measures correspond to the theoretical constructs being examined in the research [42,43]. This paper examines the connection between research questions, domain concepts, metrics, calculation rules, and the functionality of the prototype itself. Traceability from input data to calculated values was established. The validity of the selected metrics for assessing knowledge, competencies, role clarity, and newcomer adjustment was not examined. They were used as operational indicators for evaluating the artefact. Numerical labels and normalisation to a common interval do not establish that the indicators measure the same construct or that differences between adjacent ratings have the same meaning. These limitations are discussed in Section 6.
The accuracy of the calculation was checked by comparing the results obtained in the prototype with a manual calculation for the same input values. The manual calculation was performed by the researcher separately from the prototype calculation; independence here refers to the calculation procedure, not to an external evaluator. The check included the tree structure and metric weights, four measurement specifications, two additional ways of recording results, normalisation rules, selection of the current record, aggregation of results, and handling of missing records.
The evaluation is limited to one participant, one position, one organisation, and one simulated two-week scenario. The scenario did not involve actual new employees or observations of their progress during onboarding. The results therefore support initial functional and computational feasibility for the scenario examined. The relevance of the displayed indicators to actual employee progress and their usefulness in assessment and feedback remain to be evaluated in practice. The applicability of the solution in other organisational contexts further depends on the choice of metrics, their weights, measurement periodicity, and rules for interpreting the results.
3.6. Ethical Considerations
An employee from Company A who works as a Team Lead and Full-Stack .NET Developer participated in the preliminary evaluation. He used the prototype in the role of Onboarding Lead, through a simulated scenario for the selected position. The evaluation was aimed at checking the functionality of the software prototype, the correctness of the calculations, and its initial understandability.
Before the start of the research, the protocol was approved by the Ethics Committee of the Technical Faculty “Mihajlo Pupin” in Zrenjanin, University of Novi Sad. The participant signed an informed consent form after being informed about the purpose of the research, the evaluation procedure, the method of data use, and confidentiality protection measures. Participation was voluntary, with the possibility of withdrawal without negative consequences, in accordance with the ethical principles for empirical research in software engineering [44].
Prototype records and notes taken during the interview were used to assess the functioning and understandability of the prototype. The company is referred to in the paper by the pseudonym “Company A”, and the identities of the participant, company, clients, or specific projects are not mentioned.
4. Conceptual Domain Model
This section presents a conceptual domain model of a system for tracking progress during onboarding using metrics. The model answers RQ1 by defining key concepts, their interrelationships, and constraints that are needed to describe the organisational context, onboarding plan, metric tree, measurement configuration, measurement record, and derived results. The starting point is the part of the OnMod model related to planning, evaluation, and feedback [15].
For better readability, the conceptual model is presented in four interconnected layers, after which it is presented as an integrated whole in Section 4.5. The first layer defines the organisational context and the participants. The second layer includes the onboarding plan, its versioning, and the hierarchy of metrics. The third layer defines measurement and measurement recording. The fourth layer connects the measurement records with the current calculated results, the recording of process extensions, and reporting. UML notation is applied in accordance with the UML 2.5.1 specification [37].
4.1. Organisational and Role Layer
The Organisational and Role Layer includes the main concepts used to represent the participants and their responsibilities in the onboarding process. As shown in Figure 4, Employee represents the general concept of an employee, while NewEmployee and OnboardingLead are its specialisations. NewEmployee represents the employee whose progress is monitored, while OnboardingLead represents the person responsible for organising, monitoring, and guiding that employee’s onboarding.
Figure 4.
Organisational context and roles.
The generalisation indicates that both specialisations belong to the common Employee concept. Those roles are not necessarily permanent, so the same employee may have different responsibilities in different onboarding processes. Each OnboardingProcess involves exactly one NewEmployee and is led by exactly one OnboardingLead. A NewEmployee may participate in multiple processes over time, while an OnboardingLead may lead multiple processes.
Each NewEmployee is assigned to one Position, while a Position may be associated with multiple new employees. The selected position provides the organisational context for proposing the appropriate onboarding plan version.
4.2. Onboarding Planning and Metric Hierarchy Layer
Figure 5 shows the extension of the Organisational and Role Layer with concepts for defining and versioning plans and forming a hierarchy of metrics. The elements marked in light blue belong to the previously presented organisational layer, while the orange elements represent concepts introduced in the Onboarding Planning and Metric Hierarchy Layer. The concepts Employee, NewEmployee, OnboardingLead, Position, and OnboardingProcess are retained to show the organisational context in which the plan is used.
Figure 5.
Plan versioning and metric hierarchy.
The central concept of the new layer is the OnboardingPlanVersion, which defines the purpose and general organisation of the goals and metrics applied during onboarding. An Onboarding Lead can configure and manage multiple onboarding plan versions.
Versioning enables controlled changes to the plan structure. When the metric hierarchy or other plan rules need to change, a new OnboardingPlanVersion is created with Draft status by cloning the previous version. It can then be edited without changing processes that use the previous version.
In the conceptual model, an OnboardingPlan can have one or more versions of the plan. Separating the plan from its versions allows for controlled changes to its structure. An OnboardingPlan represents the stable identity and purpose of the plan, while a plan version represents its specific structure that is valid at a particular point in time. Separating the plan from its version allows new configurations to be introduced without changing the meaning of records already collected.
A Position can have at most one default onboarding plan version, i.e., one specific OnboardingPlan record in the prototype, while the same version can be the default for multiple positions. This type of connection allows the system to suggest the appropriate version when starting the process, based on the NewEmployee’s position.
Each OnboardingProcess uses exactly one specific version of the onboarding plan. Creating a new version therefore does not change the structure of the processes that are already associated with the previous version.
Each plan version defines a metric tree with a starting node, i.e., the root node. A MetricNode represents a general element of a recursive hierarchy. An internal MetricNode that has child nodes has the semantic role of MetricAggregationNode, while a leaf node without child nodes has the role of ElementaryMetricNode. The starting node is also of type MetricAggregationNode and aggregates metrics for the entire onboarding plan. These roles are determined by the structural constraints of the conceptual model. Direct measurement and measurement configuration are only allowed for nodes of type ElementaryMetricNode.
All nodes in the MetricAggregationNode role apply the same weighted-sum rule with fixed weights. The weight is stored on each immediate child of the MetricNode; it must be positive, and the sum of the weights of each parent’s children must be 1. This constraint is checked before a plan version is moved from Draft to Ready. Weights remain fixed for the plan version assigned to a process. Revised weights can be configured in a new plan version without changing processes already linked to the previous version.
Each metric definition belongs to one MetricCategory. A category can contain multiple definitions and serves to group metrics according to the area to which they refer.
4.3. Measurement Configuration and Recording Layer
Figure 6 shows an extension of the previously defined conceptual model with the Measurement Configuration and Recording Layer. The elements marked in blue represent concepts introduced in the previous layers, while the orange ones are the concepts that define the way measurements are conducted and the results are recorded. With this type of extension, the hierarchical structure of the onboarding plan moves from a descriptive model to an operational structure that can be used to systematically monitor the onboarding process.
Figure 6.
Measurement configuration and recording.
The central link in Figure 6 connects the plan hierarchy to the measurement configuration. The ElementaryMetricNode is the leaf node where the direct measurement is recorded and has a single conceptual MeasurementConfiguration. In the prototype, this configuration is represented by a single MeasurementPolicy object and a single MeasurementSpecification. The MetricAggregationNode does not have a direct measurement configuration, as its result is derived through fixed-weight aggregation of its immediate child nodes.
The MeasurementConfiguration concept defines how measurement data are collected and interpreted for an ElementaryMetricNode: the periodicity and the description of the procedure belong to the MeasurementPolicy, while the type, interpretation direction, and input parameters belong to the specific MeasurementSpecification. Separating the catalogue definition of Metric from this configuration allows for the reuse of the same metric in different versions of plans, with different operationalisations.
Each conceptual MeasurementConfiguration includes one MeasurementSpecification. The abstract specification has four supported forms: NumericSpecification, BinarySpecification, LikertSpecification, and RubricSpecification. The specification defines the structure of the input data and the normalisation procedure, while the manual score and completion record are additional ways to create a MeasurementRecord.
InstrumentItem represents a single item of a multi-item Likert or rubric instrument. RubricLevelDescriptor defines the meaning of the assessment level and supports more consistent interpretation of responses. The conceptual MeasurementAnswer, implemented in the prototype as MeasurementRecordAnswer, associates a measurement record with a response to a specific item.
The result of the measurement is recorded using the MeasurementRecord entity. Each MeasurementRecord is associated with one OnboardingProcess entity and one ElementaryMetricNode entity. One OnboardingProcess can contain multiple MeasurementRecord records, while separate records can be formed for the same ElementaryMetricNode in different periods or different onboarding processes. The prototype allows at most one MeasurementRecord for the same ElementaryMetricNode and the same period within one OnboardingProcess.
Each MeasurementRecord is recorded by the OnboardingLead responsible for the associated OnboardingProcess. An OnboardingLead may record multiple MeasurementRecord entities, while each MeasurementRecord is recorded by exactly one OnboardingLead.
4.4. Analytical and Reporting Layer
Figure 7 shows the extension of the conceptual domain model with the Analytical and Reporting Layer. The elements marked in blue belong to the Organisational and Role Layer, Onboarding Planning and Metric Hierarchy Layer, and Measurement Configuration and Recording Layer, while the concepts marked in orange relate to calculating results, recording process extensions, and forming report views.
Figure 7.
Result calculation and reporting.
The central analytical concept is represented by the ComputedNodeScore entity. Each such score is related to one OnboardingProcess and one MetricNode, so a process can have a current computed score for each relevant node. In the prototype, ComputedNodeScore represents the most recently saved computed value and the time of calculation. The period index is stored in the MeasurementRecord, so this entity is not interpreted as a complete history of scores across periods.
The result of an elementary metric node is determined based on the recorded measurement in the current period, while the result of an aggregation node is obtained as the weighted sum of the results of its immediate child nodes. During recursive traversal of the metric tree, the results are propagated from the elementary metric nodes to the parent metric aggregation nodes. The result of the root node summarises the configured metric results for the plan version assigned to that process.
ProcessExtension records a change to the planned completion date of an OnboardingProcess. A process may have multiple such records, thereby preserving the history of changes to its planned completion date. Each extension is approved by exactly one OnboardingLead, while an OnboardingLead may approve multiple extensions.
The onboarding report brings together basic process data, the plan version used, the overall result of the process, the results of individual metric nodes, and the measurement statuses. It provides the final presentation of information that was produced by configuring the plan, entering records, and calculating results in the previous parts of the model.
4.5. Integrated Conceptual Domain Model
Figure 8 integrates the four layers of the conceptual domain model described in the previous subsections.
Figure 8.
Integrated view of the four layers of the conceptual domain model.
The Organisational and Role Layer comprises Employee, NewEmployee, OnboardingLead, Position, and OnboardingProcess. This layer defines the participants in the process, their responsibilities and the organisational context of a specific onboarding process. Position provides the basis for proposing an appropriate onboarding plan version.
The Onboarding Planning and Metric Hierarchy Layer of the model introduces the onboarding plan, its versions, and the metric tree. The plan version defines a specific hierarchy consisting of a root node, metric aggregation nodes, and elementary metric nodes. The nodes organise and aggregate the results, while the elementary metric nodes connect the plan structure to the definitions from the metric catalogue.
The Measurement Configuration and Recording Layer of the model operationalises elementary metric nodes with measurement periodicity and specifications. Instruments and their items define the structure of the collected data. MeasurementRecord links a recorded value to the associated OnboardingProcess, MetricNode, measurement period, and the OnboardingLead who recorded it. A MeasurementRecordAnswer links an individual response to its corresponding MeasurementRecord.
The Analytical and Reporting Layer uses recorded measurements and the associated MetricTree to calculate the current score for each MetricNode and the overall score for an OnboardingProcess. The calculated results are presented in the application, while ProcessExtension records store changes to the planned completion date, the reason for each extension, the score at the time of the extension and the OnboardingLead who approved it.
The operational additions to the OnMod concepts [15] represented in Figure 8 are: (1) plan versions associated with individual onboarding processes, preserving their measurement context; (2) a metric tree with a root node, aggregation nodes, elementary metric nodes, and constrained local weights; (3) measurement configurations and specifications attached to elementary nodes, including instrument items and rubric-level descriptions; (4) raw measurement records linked to a process, metric node, period, recording time, and recording user; (5) explicit normalisation, interpretation direction, current-record selection, and recursive aggregation producing current node scores alongside Measured, Missing, and Overdue statuses; and (6) process-extension records and reports linked to the same process and its calculated results. Together, these additions define how the selected planning and evaluation concepts are executed and how each result can be checked against its inputs.
5. Functional Specification Based on the Conceptual Domain Model
The conceptual model from Section 4 defines the static domain structure but does not itself specify the functional goals of the users and the boundaries of the system’s responsibilities. Therefore, the proposed artefact functionalities are specified by use case diagrams. They show the actors, the system boundary, and the functions required to manage the metric catalogue, positions, employee accounts, onboarding plans, and the execution of the onboarding process.
Functional requirements are derived from the conceptual model, defined roles, and business rules of the onboarding process. The following subsections first provide a system overview and then elaborate on administrative functions, plan and metric hierarchy management, and process execution with measurement recording and result display.
The model distinguishes two primary actors: the Onboarding Lead and the employee. The Onboarding Lead prepares draft plans, initiates their validation and transition to Ready status, manages the metric catalogue, employee positions and accounts, initiates and manages onboarding processes, records measurements, and reviews results. Authorisation is contextual: an employee can only access the process associated with their own user account, while the Onboarding Lead accesses functions in accordance with their role and responsibility for the process.
5.1. System-Level Use Case Overview
An overview of the system is shown in Figure 9. The Onboarding Lead accomplishes six main goals: managing the metric catalogue, managing positions, managing employee accounts, managing onboarding plans, initiating the onboarding process, and leading the onboarding process. Leading the onboarding process includes reviewing details, recording measurements, reviewing progress, changing status, extending the process, and displaying results. The employee uses a limited view to access their own process and progress.
Figure 9.
System overview of use cases.
This overview diagram serves as a navigation map for the functional specification. It does not repeat each operation but rather groups them into functional units that are presented in detail.
5.2. Metric Catalogue, Positions, and Employee Accounts
Figure 10 shows the administrative functions that provide the reference data needed to initiate the onboarding process. Managing the metric catalogue includes creating and editing categories and metrics, as well as activating or deactivating them.
Figure 10.
Management of metrics, positions, and user accounts.
Position management includes creating and editing a position, changing its active status, and assigning a default version of the onboarding plan. The default version represents the initial suggestion when starting the process, while the finally selected OnboardingPlan record is stored in the specific onboarding process.
NewEmployee account management includes creating an employee account and profile, linking the profile to a position, activating or deactivating access, and resetting the password.
5.3. Onboarding Plan Management
Figure 11 shows the life cycle of an onboarding plan. The Onboarding Lead can create a plan, edit a draft version, view the tree, create a new version, and archive the plan. The plan structure is edited by adding, editing, and removing nodes and assigning weights to immediate child nodes.
Figure 11.
Plan and metric tree management.
The measurement configuration applies only to elementary metric nodes. It includes the choice of periodicity and the corresponding numeric, binary, Likert, or rubric specification. Manual score entry and completion recording are treated as additional methods for creating measurement records, while the four measurement specifications listed are preconfigured in the plan version.
Moving a plan version from Draft to Ready requires validation. Validation checks whether the defined hierarchy of metrics forms a valid metric tree and whether every node, except the root, is connected to the appropriate metric. Each elementary metric node must have a fully defined MeasurementPolicy configuration and a corresponding specification of type MeasurementSpecification and cannot have child nodes. The weights must have positive values, and the sum of the weights of the immediately subordinate nodes of each parent node must be equal to 1. Only after successful validation can a version with Ready status be used to start a new process.
5.4. Onboarding Process, Measurements and Result Presentation
Figure 12 shows the execution part of the system. Starting the process requires selecting an employee, selecting a version in the Ready status, and defining a start date and a planned end date. If the employee’s position has a default version, the system may suggest it, but the Onboarding Lead may select another suitable version in the Ready status.
Figure 12.
Process execution, measurement recording, and result display.
Once the process is initiated, the Onboarding Lead accesses the process details, records measurements, reviews progress, updates status, and, when warranted, extends the planned process period. The general use case Record Measurement has six specialised flows: four specifications, namely numeric, binary, Likert, and rubric measurement, and two additional recording methods, namely manual score and completion record. Each entry is checked for access, process state, elementary metric node configuration, period, and allowed value domain before normalisation and storage.
The progress display initiates the calculation or loading of the current results by the nodes of the hierarchy. The display combines process identity, plan version, total result, result tree, and measurement statuses, and for elementary metric nodes it shows the comment and measurement recording time.
The employee can only view their own process, progress, and available results. In the current prototype, they do not change the plan, record measurements, or manage the status of the process.
6. Operational Measurement and Scoring Model
This section formalises the procedure by which measurement records are normalised, arranged into periods, and aggregated through a metric tree. The rules for normalisation, period-specific record selection, and weighted aggregation correspond to the implemented prototype. Section 6.6 explains effective weights, Section 6.7 discusses indicator and rating quality, and Section 6.8 defines a non-compensatory extension for critical requirements. Local weights, normalised elementary scores, and illustrative thresholds are reported to two decimal places. Effective weights use four decimal places, while aggregated scores, sensitivity ranges, and differences in aggregated scores use six. Raw ratings and counts retain their original scales, and calculations use unrounded values.
6.1. Normalisation of Heterogeneous Measurement Records
For the elementary metric node , let be the raw measurement value, and let and be the lower and upper bounds of the configured domain where . The value denotes the normalised value on the interval , and denotes the result after applying the metric direction. The notation denotes the index of the period containing time .
6.2. Normalisation and Recording Methods
6.2.1. Numeric Measurements
A numeric entry is accepted only if the condition holds. Otherwise, the entry is rejected. The accepted value is normalised using Equation (1):
The direction of the metric determines the final interpretation of the normalised value. For , the result is equal to the normalised value, while for its direction is reversed using Equation (2):
After applying the direction interpretation, a higher score indicates a more favourable value of the metric, regardless of whether the number of completed tasks or the number of errors is monitored. The original value remains saved in the measurement record.
6.2.2. Binary Measurements
A binary measurement has a value . The same interpretation direction applies as for a numeric measurement. The completion record is a way of recording a predefined binary outcome, not a separate measurement specification.
6.2.3. Likert-Type and Rubric-Based Measurements
In Likert and rubric instruments, denotes the response to item of the elementary metric node , denotes its weight, and denotes the number of items. If the weights are configured, they are all positive and sum to 1. If they are not configured, is set and the arithmetic mean is obtained. The raw mean and its normalisation are determined by Equation (3), after which the direction from Equation (2) is applied:
Each response records the rating for a Likert-type item or the level assigned to a rubric criterion. A multi-item instrument is used in this paper as the operational input of the prototype. Calculating averages and linearly normalising ratings assume equal intervals between adjacent levels. This assumption has not been empirically examined for the instruments used in the demonstration. Individual responses and level descriptions are therefore retained as a basis for interpreting the aggregated score.
6.2.4. Manual Score and Completion Record
Manual score entry and completion recording are additional recording methods. In manual entry, the user in the Onboarding Lead role enters a normalised value , with a mandatory justification, while the system stores the user’s identifier (ID) and the time of entry. A completion record uses a predefined positive binary outcome and justification to confirm the completion of the activity.
6.3. Measurement Periodicity and Record Selection
The period is determined relative to the process start date . For an elementary metric node , the current period index depends on the configured periodicity. The timestamp measuredAt determines the period to which the record belongs, while the current time t determines the period for which the result is displayed:
For a one-time measurement, the period index is 0. For daily and weekly periodicity, the number of whole days from the start of the process is used, and for monthly periodicity, the calendar difference in years and months is used. For the current display, the record from the current period is used, while earlier records remain available in the entry history. The status is Measured when a current record exists for the current period; otherwise, it is Missing or Overdue when the record does not exist, depending on the current period and the planned duration of the process.
6.4. Hierarchical Score Aggregation
For the elementary metric node , the system searches for a record belonging to the current period . The record selected for the current period is used for the elementary metric node. The result of the node is the value derived from that record after normalisation and application of the interpretation direction. If a matching record does not exist, 0 is used in the calculation. The zero in this case represents the calculation rule for the missing record, not the employee’s recorded rating.
For an aggregation node with a set of immediate child nodes , the result is calculated as the weighted sum of their results. The weights of the immediate child nodes are positive, sum to 1, and the total result of the process is equal to the result of the root node:
Aggregation is applied recursively from the elementary metric nodes to the root node. A missing record thus affects the result with a value of 0, while the status of the elementary metric node remains visible for separate interpretation.
6.5. Result Presentation and Interpretation
The results view in the prototype includes basic data about the onboarding process, the total score, and the results tree. For each elementary metric node, the metric name, status, normalised score, comment, and measurement time are displayed. MeasurementRecord stores the identifier of the UserAccount that recorded the measurement.
Weighted aggregation is compensatory, meaning that if one node’s score is high, it can offset the low score of another node. Applying this rule assumes acceptable compensation between the requirements of the specific plan. For this reason, the overall score is interpreted together with the scores and statuses of the individual elementary metric nodes. The Missing and Overdue statuses remain visible even when the missing record contributes 0 to the calculation.
6.6. Effective Weights and Interpretation of Compensation
The effective weight of an elementary metric equals the product of the local weights along the path from the root node to that metric. The overall score can therefore also be calculated as the sum of the elementary scores multiplied by their effective weights. For the tree in Section 7.2, in the order M1-M9 in Section 7.3, the effective weights are 0.0900, 0.1100, 0.1800, 0.1200, 0.1375, 0.1125, 0.0750, 0.1000 and 0.0750. They sum to 1. With the configuration unchanged, a change of in one elementary score changes the overall score by the product of its effective weight and . Equal local weights do not necessarily produce equal effective weights: the influence of an elementary metric also depends on its position in the tree.
Additive aggregation allows compensation between the included dimensions [41]. Its use requires a justification of which plan requirements may be offset by results for other requirements. The completion record and overall manual assessment in the demonstration may partly cover work already assessed using technical rubrics. Such overlap may include the same evidence more than once in the sum and should therefore be checked when selecting indicators and weights. Record availability is considered separately from the recorded score, because a missing record makes a zero contribution under the existing aggregation rule.
6.7. Metric Quality and Rating Reliability
For each metric, the assessment objective should be linked to the evidence collected and the interpretation rule [16,18]. The specification should state the unit or response-level descriptions, task conditions, permitted assistance, measurement time, and rater. A content review determines whether the indicators cover the relevant requirements of the position and whether any indicators are redundant. For example, the number of completed tasks depends on their difficulty, the number of corrections depends on the scope of the code review, and completion confirmation depends on the assistance received. Normalisation to [0, 1] enables a common calculation, while the appropriateness of these indicators for assessing learning and competencies is examined separately.
Manual and rubric-based ratings are susceptible to excessive leniency or severity, halo effects, and differences in the interpretation of criteria. The rationale for a rating and the identity of the rater allow the record to be reviewed, but do not eliminate these sources of bias. Clear level descriptions, examples of assessed work, and rater preparation can improve consistency in applying a rubric [40]. Calibration would involve independently rating the same work, discussing disagreements, refining unclear descriptions, and repeating the assessment. The rubrics were not calibrated in the evaluation presented.
The study did not collect a set of employee work samples independently assessed by multiple raters or repeated measurements for estimating test–retest reliability. Consequently, statistics for inter-rater agreement and scale reliability were not calculated. Examining these properties requires appropriate empirical measurements and a procedure selected according to the scale type and intended use of the results. If a multi-item scale is used to measure a single psychological construct, its dimensionality and other measurement properties must also be examined [16].
The metric tree combines operational indicators for different plan objectives. Its nodes are not interchangeable items of a single psychometric scale. The internal consistency of an individual instrument, where applicable, is therefore examined separately from the justification of the overall indicator. For the overall indicator the coverage of objectives, indicator selection, weights, and permitted compensation must be justified.
6.8. A Non-Compensatory Condition for Critical Metrics
Compensation may be inappropriate when a metric represents a mandatory requirement, such as a minimum security criterion or a task that must be completed before independent work. For such requirements, a model extension is proposed: when defining a plan version, a set of critical elementary metrics is selected, and each is assigned a minimum acceptable normalised score , with both endpoints included. The selection of metrics and minimum scores is justified by the requirements of the position and remains unchanged during a process associated with that plan version. For metric , denotes the selected current-period record, and its normalised score after applying the direction of interpretation. If no record exists, . The binary condition equals 1 when every critical metric has such a record and a score of at least , and 0 otherwise, as defined in Equation (7).
If no critical metric is selected in the plan version, K is empty and the condition is considered satisfied. When a critical metric record is missing, the condition is not satisfied because of insufficient evidence. When a record exists but the score is below the minimum, the condition is not satisfied because of the recorded score. The rule distinguishes these two cases. The weighted sum continues to be calculated using the existing rule. In the proposed extension, meeting the completion criteria requires both reaching the overall threshold and satisfying ; the Onboarding Lead makes the final decision. In an illustrative example, an average API rating for M3 of 1.75 on a 1–4 rubric produces a normalised score of 0.25. If all other scores equal 1.00, the weights in Section 7.2 produce an overall score of 0.865000. This reaches the illustrative overall threshold of 0.80, but does not reach the API minimum of 0.60. The example illustrates how a mandatory requirement is checked independently of the overall sum.
The extension is defined at the model level. Applying it in the prototype requires adding configuration for critical metrics and minimum scores, checking the condition , and displaying the outcome of that check separately. Implementation and evaluation of the extension, including the justification of thresholds for a specific position, are planned as the next research step.
7. Prototype Demonstration and Preliminary Evaluation in a Software Company
7.1. Evaluation Context
The demonstration involved one expert from a company referred to by the pseudonym Company A. The participant is a Team Lead and Full-Stack .NET Developer, and in the prototype, he had the role of Onboarding Lead. He configured and tested a realistic but simulated onboarding scenario for a typical employee. The scenario represented the first two weeks of onboarding for a hypothetical employee.
The company name, participant identity, and other potentially identifying information are not disclosed, in accordance with approved ethical procedures, signed informed consent, and confidentiality agreements. The demonstration tested the functional and computational feasibility of the prototype in a controlled scenario, not its impact on actual employee outcomes.
7.2. Selected Position and Onboarding Plan
The Full-Stack .NET Developer position was chosen for the demonstration, as it encompasses backend development in a .NET environment, integration with the user interface, and a team development workflow. The configured version of the plan represents the initial part of a broader onboarding process and a scenario that simulates a two-week period. The metric tree and demonstration weights were defined by the participant in the role of Onboarding Lead to verify the aggregation. In Figure 13, the root node is shown in grey, nodes of type MetricAggregationNode in orange, and nodes of type ElementaryMetricNode in light blue. The root node applies the same aggregation rule as the other aggregation nodes. The weights are shown on the links and indicate the contribution of the child node to the result of the immediate parent node. The identifiers M1-M9 are used consistently for the metrics in the tree and in the measurement specifications and records presented in Section 7.3 and Section 7.4. The root node has no weight because it has no parent node.
Figure 13.
Metric tree and weights in the demonstration.
7.3. Metric Hierarchy and Measurement Configuration
The measurement configurations, periodicity, and interpretation direction for each elementary metric node are shown in Table 2. Each metric aggregation node aggregates the results of its immediate child nodes using a weighted sum with fixed weights, where the weights sum to 1.00. Direct measurements are recorded only at elementary metric nodes. The scenario uses all four supported measurement specifications and two additional recording methods to exercise all input methods supported by the prototype.
Table 2.
Measurement specifications and recording modes in the demonstration scenario.
Table 2 shows different data sources that can be included in the same hierarchy, and their results are mapped to a common numerical interval from 0 to 1 for aggregation. This common scale does not establish equivalence of the underlying constructs. The rubric measurement for the elementary metric node “ASP.NET Core API Implementation Quality” covers correctness, code structure, validation, and testing, while the rubric for “Frontend User Flow Implementation Quality” covers functionality, interface consistency, error handling, and usability. In both cases, level 1 indicates that the criterion is not met, and level 4 indicates independent fulfilment without significant corrections.
7.4. Recorded Measurements and Calculated Results
Table 3 shows selected synthetic records entered during the demonstration. They are used to check normalisation and aggregation, and are not an assessment of an actual new employee or of the participant. All listed records belong to the current period and have the status Measured.
Table 3.
Measurement records, normalised scores, and statuses in the demonstration scenario.
The values in Table 3 were calculated by the software prototype using the formulas in Section 6. Based on the normalised results, Table 4 shows the weighted aggregation from the elementary metric nodes to the aggregation nodes and the root node. The parent–child structure and link weights in Figure 13 determine the calculation paths in Table 4, while the normalised results of the elementary metric nodes come from Table 3.
Table 4.
Hierarchical aggregation of metric-node scores to the root score.
The root score summarises the configured indicators for the demonstrated plan and measurement period. Its interpretation depends on the selected metrics, their assessment criteria, and the available records. Due to the compensatory nature of the weighted sum, it is interpreted together with the scores of the metric aggregation nodes and the elementary metric nodes, as well as the measurement statuses, as a high score in one area can offset a low score in another.
7.5. Functional Verification of the Prototype
Functional verification was conducted by executing key flows within the same two-week scenario. The evidence in the table refers to the behaviour of the prototype in controlled test cases. The results of executing the key functional flows are shown in Table 5. Computational correctness for the selected inputs was checked by the researcher using separate manual calculation of the normalised and aggregated values presented in Table 3 and Table 4.
Table 5.
Functional verification of the prototype in the demonstration scenario.
The results presented in Table 5 confirm that the specified functional flows were executed in a controlled scenario. This type of verification demonstrates the functional and computational feasibility of the software prototype for the given test cases.
7.6. Participant Feedback
After the demonstration, a semi-structured interview was conducted with the participant who had the role of Onboarding Lead during the evaluation. The five open-ended questions prepared in advance and presented in Table 6 formed the basis of the interview. During the interview, follow-up questions were asked when a response required clarification, elaboration, or a concrete example. Because these prompts depended on the participant’s preceding answer, they were not fixed in advance or treated as additional core questions. This flexible use of the guide is consistent with semi-structured interviewing [45].
Table 6.
Interview questions and summaries of participant responses.
The interview lasted approximately 60 min and was not audio-recorded. The researcher took notes on paper and on a computer during the interview. Table 6 contains summaries of the researcher’s notes rather than verbatim quotations from the participant. Given that the interview involved one participant and that a full transcript was not produced, the responses were used as descriptive qualitative feedback to contextualise the functional and computational results, and they were not subjected to formal coding or thematic analysis.
The responses in Table 6 highlight three practical observations from the participant. First, the plan and metric tree were considered realistic for initial technical activities, but the participant recommended that long-term use also address domain knowledge and gradual development of employee autonomy. Second, the participant emphasised that assessment quality depends on precise rubrics and a shared interpretation of the criteria among Onboarding Leads. Third, the participant recommended that the result view provide trends, change history, and more prominent indications of low scores and Missing and Overdue statuses. These findings are reported as descriptive qualitative feedback from one expert participant, rather than themes obtained through formal thematic analysis.
7.7. Integrated Evaluation Findings
The evaluation results are combined according to the property examined. The researcher’s manual calculation checks agreement between the normalisation and aggregation calculations and the prototype results. Executing functional flows checks system behaviour in selected cases. The interview provides feedback on the understandability of the configuration and result display. These data are used to interpret the findings in Section 8.1 [46]. The sensitivity analysis in Section 7.8 additionally examines the behaviour of the computational model.
7.8. Sensitivity Analysis of the Demonstration Metric Tree
Table 7 presents the sensitivity analysis results for the tree in Figure 13. The baseline score was obtained from the inputs in Table 3 and the calculations in Table 4, without rounding intermediate results. The weight modification experiments followed the procedure in Section 3.4. In the experiments involving a rating change or record omission, all weights remained at their baseline values.
Table 7.
Sensitivity analysis results.
In the experiment with factors of 0.80 and 1.20, the maximum absolute deviation from the baseline score is 0.027697, or approximately 2.77 percentage points on the normalised scale. The scores for the configurations examined range from 0.805012 to 0.857072. Sensitivity is therefore interpreted in relation to the specific tree, its inputs, and the magnitude of the weight changes. If a decision threshold were within this range, a change in configuration could also change the conclusion about whether the threshold had been reached.
Reducing the M7 task-clarity rating from 4 to 3 changes its normalised score from 0.75 to 0.50 and the overall score from 0.829375 to 0.810625. The difference of −0.018750 equals the product of the change of −0.25 and the effective weight of 0.0750. Omitting the current-period M3 record reduces the sum by 0.135000, because its baseline score of 0.75, with an effective weight of 0.1800, is replaced by a zero contribution. For M2, the corresponding reduction is 0.082500. These experiments show separately the effects of a change in a recorded rating and of a missing record.
These experiments make the influence of the configured hierarchy on the overall score explicit. They quantify how changes in local weights affect the root score and show the distinct consequences of a lower recorded rating and a missing current-period record. This adds reproducible numerical evidence about the behaviour of the specified aggregation model to the functional checks of the prototype.
8. Discussion
8.1. Interpretation of Findings and Answers to the Research Questions
The results presented in Section 4, Section 5, Section 6 and Section 7 show how selected onboarding plan concepts can be represented and executed in an integrated DSR artefact. The prototype links measurement records to their plan version and period, applies the specified normalisation and aggregation rules, and displays the resulting hierarchy. The evaluation establishes agreement with the manual calculations and successful execution of the selected functional flows for the demonstration inputs. The interview adds one expert’s assessment of the configuration and displayed results.
In relation to RQ1, the conceptual model highlights a tree with a root node, aggregation nodes and elementary metric nodes, a versioned plan, position, configurations and measurement records, periods, statuses and derived results. Associating a running process with a specific plan version preserves the context of already collected records, while separating raw from normalised values allows for verification of calculations. Textual mapping further clarifies where a domain concept is not implemented by a separate class in this prototype.
The answer to RQ2 consists of functionalities for creating a draft plan, validating it and moving it to Ready status, defining the hierarchy and weights, configuring the four measurement specifications, starting the process, supporting the six input flows, and displaying the results and statuses. The business rules require positive weights that sum to 1 for the children of each parent node and restrict direct measurement to elementary metric nodes. The functional verification in Table 5 shows that these flows are implemented in the software prototype for the tested scenario.
In relation to RQ3, it was shown that the values obtained using numeric, binary, Likert and rubric specifications, as well as the manual score and completion record, can be mapped to a common normalised interval while preserving the raw value and the direction of interpretation. Table 3 presents the raw values and their corresponding normalised scores, while Table 4 shows the recursive weighted aggregation of the results up to the root node. The common scale allows for their computational combination but does not in itself mean that different indicators measure the same construct or have the same measurement quality. The resulting values therefore remain operational indicators defined in the context of a specific onboarding plan [16,17]. Section 7.8 presents the effects of weights and selected input changes on the overall score.
In relation to RQ4, the prototype results agree with the researcher’s separate manual calculation for the same demonstration inputs. Table 3 and Table 4 present the normalisation and aggregation calculations on which the comparison is based. The sensitivity analysis in Table 7 complements this finding by showing the behaviour of the computational model when the configuration and inputs change.
In relation to RQ5, the functional check shows that all the tested flows of plan configuration, process initiation, measurement recording, period and status determination, normalisation, aggregation and result display were successfully executed. This provides evidence of functional feasibility for that scenario, without claiming complete verification of the implementation.
In relation to RQ6, feedback from one expert participant indicates the initial practical understandability of the plan structure, measurement status and hierarchical results, as well as the potential relevance of the display for periodic onboarding reviews. The same expert had previously configured the scenario. His statements therefore constitute an initial subjective assessment that does not establish usefulness or usability for other raters, teams, or actual new employees.
8.2. Model and Implementation Contribution
The main contribution of this paper is the operationalisation of a selected part of the OnMod model into an integrated model that includes a conceptual domain model, a UML-based functional and structural specification, and an operational measurement model, with an executable software prototype as its instantiation. The contribution beyond OnMod is a hierarchical measurement system that distinguishes elementary and aggregation nodes and binds them to a plan version, measurement configurations, period-specific raw records, and explicit calculation rules. Section 2 and Section 3.2 distinguish these additions from the inherited plan adaptation cycle. In this way, the domain model, processing rules, and their executable implementation are linked within a single solution, which is in line with the broader understanding of artefact types in Design Science research [19,31].
Compared with research on adaptive onboarding paths [9], the artefact focuses on the measurement context and calculation provenance for the assigned plan version. Linking multiple measures and providing feedback are already present in software measurement systems [14]. The contribution lies in specifying their interrelationships for onboarding monitoring. The evaluation supports preliminary feasibility in the scenario examined. Practical development tasks can support knowledge acquisition, gradual independence, and integration of a new member into the team [3,36]. For research on these activities, the model provides an explicit representation of the indicators selected for a plan, the conditions under which they are recorded, and the rules used to combine their results. This makes the assumptions behind a displayed score available for examination alongside the learning and adjustment processes discussed in Section 3.2.
An implementation contribution is a consistent link between a specific version of a plan, an elementary metric node, a specification, a raw record, a period, the user account that recorded the measurement, and the current calculated result. This traceability makes the inputs and rules behind a displayed result available for inspection. For example, an OnboardingLead can inspect the underlying node scores, statuses, and measurement records before discussing a low root score with an employee. This illustrates the intended use of traceability.
8.3. Practical Implications
The intended use is to configure an onboarding plan for a position and review its recorded indicators at planned assessment points. The Onboarding Lead can inspect low scores and missing records before discussing the relevant work with the employee. The role can be assigned to a team leader, mentor, human resources (HR) specialist, or another person who is responsible for managing the onboarding process.
The participant identified trend displays, a history of plan and measurement changes, comparison of processes for the same position, reminders, and easier selection of results for discussions with the employee as priorities for wider use. Rubrics, Likert items, and manual scores require clear instructions and shared interpretation of assessment criteria among Onboarding Leads; without these, differences in ratings may reflect differences between raters rather than actual differences in employee progress.
Explicit assessment criteria, admissible input ranges, and weights fixed for the assigned plan version provide a common assessment framework intended to limit ad hoc scoring decisions. For identical selected records and the same plan configuration, the specified calculation rules produce the same result. Whether this framework improves agreement between two raters requires empirical evaluation with independently assessed work.
The system should therefore be used as support for assessment and feedback, and not as an automatic mechanism for ranking employees. Weights, specifications, scale limits, periodicity and rules of interpretation must be documented and periodically checked in the organisational context in which the plan is implemented.
8.4. Limitations
The evaluation was limited to one software company, one participant, one position, and one simulated two-week scenario. The participant both defined the plan and tested the prototype, while the onboarding process was simulated for a typical employee with scenario data. This dual role may have favoured a positive assessment of the configured solution. There is also a risk of confirmation bias. No independent rater or comparison group was included. Differences between multiple Onboarding Leads, the reactions of actual new employees, and longitudinal changes in actual employee progress were not examined, limiting transferability to other settings. The metrics, weights, and rubrics from the scenario have not been validated as a general instrument for measuring knowledge or competencies. Agreement between the researcher’s separate manual calculation and the prototype calculations supports computational agreement for the given input values but does not establish the validity or reliability of the indicators in other teams. Verification by the researcher may retain assumptions shared by the model and its implementation. Interview summaries rely on the researcher’s notes, so omissions or interpretive bias cannot be ruled out. The study did not examine whether the displayed indicators correspond to changes observed in actual employee work or help Onboarding Leads identify support needs during onboarding.
Rubric calibration, inter-rater agreement, test–retest reliability, and the measurement properties of multi-item scales were not examined. The sensitivity analysis ranges describe the results of numerical experiments and are not confidence intervals. In addition, PassThreshold and ExtendThreshold are stored in the plan, but do not currently trigger an automatic decision on completion or extension. These decisions remain with the Onboarding Lead. Performance under large numbers of concurrent processes and the adequacy of security controls for production use were not evaluated. Evaluation in actual onboarding processes should examine how indicator changes relate to observed work, how Onboarding Leads interpret those changes, and whether the results inform useful feedback or support decisions across positions and organisations.
9. Conclusion and Future Work
This study developed an integrated DSR model and an executable prototype for recording and reviewing the indicators specified in a versioned onboarding plan. Building on OnMod, the contribution is an explicit link between the assigned plan version, measurement specifications, period-specific records, and hierarchical score calculation. The controlled demonstration showed that the selected functional flows could be executed and that the prototype scores agreed with the researcher’s separate manual calculations. The sensitivity experiments quantified how changes in weights and selected inputs affected the score for the configured tree. Feedback from one expert identified understandable aspects of the configuration and display, together with priorities for further development. A non-compensatory model extension for critical requirements is also defined. These findings support the functional and computational feasibility of the model in the scenario examined. For onboarding research, linking each result to its plan and source records makes the selected indicators and interpretation rules explicit. Its usefulness for monitoring actual employee progress requires evaluation during real onboarding processes.
Future research should apply the prototype during actual onboarding processes involving multiple new employees and Onboarding Leads across multiple teams and organisations. Recorded indicators should be compared with independently assessed work and documented observations of task understanding and increasing independence. Evaluation should also examine how Onboarding Leads use the results to identify support needs, discuss progress, and review subsequent work. This requires examining the intended meaning of the indicators, agreement between raters, and usability during repeated assessment. Applying the non-compensatory condition for critical metrics requires implementation, justification of thresholds, and a separate evaluation. Planned improvements to the prototype include trend visualisation, plan and measurement change history, cross-process comparison, reminders, and alerts for low scores and measurements with Missing or Overdue status.
Author Contributions
Conceptualization, I.V.; Methodology, I.V. and Z.S.; Software, I.V.; Validation, I.V. and Z.S.; Formal analysis, I.V., Z.S. and D.D.; Investigation, I.V., T.M. and V.A.; Resources, I.V. and Z.S.; Data Curation, I.V., Z.S. and D.D.; Writing—Original Draft Preparation, I.V. and Z.S.; Writing—Review and Editing, I.V., Z.S., D.D., T.M. and V.A.; Visualization, I.V. and T.M.; Supervision, Z.S. and D.D.; Project Administration, I.V. and Z.S. All authors have read and agreed to the published version of the manuscript.
Funding
This research received no external funding.
Institutional Review Board Statement
The study was conducted in accordance with the Code of Academic Integrity of the University of Novi Sad and was approved by the Ethics Committee of the Technical Faculty “Mihajlo Pupin” in Zrenjanin, University of Novi Sad (approval no. 01-913, dated 12 May 2026).
Informed Consent Statement
Written informed consent to participate in the study and to publish the anonymised results was obtained from the participant.
Data Availability Statement
All data supporting the findings of this study, including the simulated scenario inputs, metric configurations, and calculated results, are included in the article. Further inquiries can be directed to the corresponding author.
Conflicts of Interest
The authors declare no conflicts of interest.
Abbreviations
The following abbreviations are used in this manuscript:
| API | Application Programming Interface |
| DSR | Design Science Research |
| DSRM | Design Science Research Methodology |
| FEDS | Framework for Evaluation in Design Science |
| GQM | Goal Question Metric |
| HR | Human Resources |
| ID | Identifier |
| RQ | Research Question |
| SE | Software Engineering |
| UML | Unified Modeling Language |
References
- Bauer, T.N.; Bodner, T.; Erdogan, B.; Truxillo, D.M.; Tucker, J.S. Newcomer adjustment during organizational socialization: A meta-analytic review of antecedents, outcomes, and methods. J. Appl. Psychol. 2007, 92, 707–721. [Google Scholar] [CrossRef] [Scilit] [PubMed]
- Didion, E.; Perello-Marin, M.R.; Catala-Perez, D.; Ambrosius, U. Mapping the organizational socialization and onboarding literature: A bibliometric analysis of the field. Cogent Bus. Manag. 2024, 11, 2337957. [Google Scholar] [CrossRef] [Scilit]
- Ju, A.; Sajnani, H.; Kelly, S.; Herzig, K. A case study of onboarding in software teams: Tasks and strategies. In Proceedings of the 2021 IEEE/ACM 43rd International Conference on Software Engineering (ICSE), Madrid, Spain (Virtual Conference), 25–28 May 2021; pp. 613–623. [Google Scholar] [CrossRef] [Scilit]
- Sharma, G.G.; Stol, K.-J. Exploring onboarding success, organizational fit, and turnover intention of software professionals. J. Syst. Softw. 2020, 159, 110442. [Google Scholar] [CrossRef] [Scilit]
- Gregory, P.; Strode, D.E.; AlQaisi, R.; Sharp, H.; Barroca, L. Onboarding: How newcomers integrate into an agile project team. In Agile Processes in Software Engineering and Extreme Programming; Stray, V., Hoda, R., Paasivaara, M., Kruchten, P., Eds.; Lecture Notes in Business Information Processing; Springer: Cham, Switzerland, 2020; Volume 383, pp. 20–36. [Google Scholar] [CrossRef] [Scilit]
- Britto, R.; Cruzes, D.S.; Smite, D.; Sablis, A. Onboarding software developers and teams in three globally distributed legacy projects: A multi-case study. J. Softw. Evol. Process 2018, 30, e1921. [Google Scholar] [CrossRef] [Scilit]
- Rodeghero, P.; Zimmermann, T.; Houck, B.; Ford, D. Please turn your cameras on: Remote onboarding of software developers during a pandemic. In Proceedings of the 2021 IEEE/ACM 43rd International Conference on Software Engineering: Software Engineering in Practice (ICSE-SEIP), Madrid, Spain (virtual conference), 25–28 May 2021; pp. 41–50. [Google Scholar] [CrossRef] [Scilit]
- Yates, R.; Power, N.; Buckley, J. Characterizing the transfer of program comprehension in onboarding: An information-push perspective. Empir. Softw. Eng. 2020, 25, 940–995. [Google Scholar] [CrossRef] [Scilit]
- Azanza, M.; Irastorza, A.; Pérez Lamancha, B.; Larrañaga, N. Managing variability in software onboarding roadmaps: An industrial case study. In Proceedings of the 29th ACM International Systems and Software Product Line Conference—Volume A (SPLC-A ’25), A Coruña, Spain, 1–5 September 2025; pp. 230–235. [Google Scholar] [CrossRef] [Scilit]
- Padoan, F.; de Souza Santos, R.; Medeiros, R.P. Charting a path to efficient onboarding: The role of software visualization. In Proceedings of the 2024 IEEE/ACM 17th International Conference on Cooperative and Human Aspects of Software Engineering (CHASE), Lisbon, Portugal, 14–15 April 2024; pp. 133–143. [Google Scholar] [CrossRef] [Scilit]
- Santos, I.; Felizardo, K.R.; Steinmacher, I.; Gerosa, M.A. Software solutions for newcomers’ onboarding in software projects: A systematic literature review. Inf. Softw. Technol. 2025, 177, 107568. [Google Scholar] [CrossRef] [Scilit]
- Gaborov, M.; Vecstejn, I.; Stojanov, Z.; Kavalic, M.; Gluvakov, V. Onboarding in a small software company: A thematic analysis. Southeast Eur. Rev. Bus. Econ. 2025, 6, 26–40. [Google Scholar] [CrossRef] [Scilit]
- Gluvakov, V.; Kavalić, M.; Gaborov, M.; Vecštejn, I.; Stojanov, Ž. Onboarding in small software enterprises: Practical recommendations from a qualitative case study. J. Eng. Manag. Compet. 2025, 15, 16–31. [Google Scholar] [CrossRef] [Scilit]
- Raza, M.; Faria, J.P.; Salazar, R. Assisting software engineering students in analyzing their performance in software development. Softw. Qual. J. 2019, 27, 1209–1237. [Google Scholar] [CrossRef] [Scilit]
- Vecstejn, I.; Stojanov, Z.; Kavalic, M.; Gluvakov, V.; Amizic, V. Validation and refinement of an experience-based onboarding model for the IT industry through multivocal literature review. Appl. Sci. 2025, 15, 10672. [Google Scholar] [CrossRef] [Scilit]
- Graziotin, D.; Lenberg, P.; Feldt, R.; Wagner, S. Psychometrics in behavioral software engineering: A methodological introduction with guidelines. ACM Trans. Softw. Eng. Methodol. 2022, 31, 7. [Google Scholar] [CrossRef] [Scilit]
- Ralph, P.; Kuutila, M.; Arif, H.; Ayoola, B. Teaching software metrology: The science of measurement for software engineering. In Handbook on Teaching Empirical Software Engineering; Mendez, D., Avgeriou, P., Kalinowski, M., Ali, N.B., Eds.; Springer: Cham, Switzerland, 2024; pp. 101–154. [Google Scholar] [CrossRef] [Scilit]
- Basili, V.R.; Heidrich, J.; Lindvall, M.; Münch, J.; Regardie, M.; Rombach, D.; Seaman, C.; Trendowicz, A. GQM+Strategies: A comprehensive methodology for aligning business strategies with software measurement. In Proceedings of the DASMA Software Metric Congress (MetriKon 2007), Kaiserslautern, Germany, 15–16 November 2007; pp. 253–266. [Google Scholar]
- Hevner, A.R.; March, S.T.; Park, J.; Ram, S. Design science in information systems research. MIS Q. 2004, 28, 75–105. [Google Scholar] [CrossRef] [Scilit]
- Peffers, K.; Tuunanen, T.; Rothenberger, M.A.; Chatterjee, S. A design science research methodology for information systems research. J. Manag. Inf. Syst. 2007, 24, 45–77. [Google Scholar] [CrossRef] [Scilit]
- Lima, R.R.; Fernandes, C.d.E.; Lima, E.; Castro, R.G.; Oran, A.C. A decade of evolution in project leaders onboarding process at a global software company: A case study. In Proceedings of the XXXVIII Simpósio Brasileiro de Engenharia de Software (SBES), Curitiba, Brazil, 30 September–4 October 2024; pp. 466–475. [Google Scholar] [CrossRef] [Scilit]
- Wysocki, W.; Miciuła, I.; Mastalerz, M. Classification of task types in software development projects. Electronics 2022, 11, 3827. [Google Scholar] [CrossRef] [Scilit]
- Moe, N.B.; Stray, V.; Goplen, M.R. Studying onboarding in distributed software teams: A case study and guidelines. In Proceedings of the 24th International Conference on Evaluation and Assessment in Software Engineering (EASE), Trondheim, Norway, 15–17 April 2020; pp. 150–159. [Google Scholar] [CrossRef] [Scilit]
- Stol, K.-J.; Stray, V.; Moe, N.B.; Sporsem, T. Onboarding software professionals in a hybrid world. IEEE Trans. Softw. Eng. 2026, 52, 2383–2409. [Google Scholar] [CrossRef] [Scilit]
- Khalil, C.; Khalil, S. Exploring knowledge management in agile software development organizations. Int. Entrep. Manag. J. 2020, 16, 555–569. [Google Scholar] [CrossRef] [Scilit]
- Fannoun, S.; Kerins, J. Towards organisational learning enhancement: Assessing software engineering practice. Learn. Organ. 2019, 26, 44–59. [Google Scholar] [CrossRef] [Scilit]
- Ardimento, P.; Bernardi, M.L.; Cimitile, M.; Redavid, D.; Ferilli, S. Understanding coding behavior: An incremental process mining approach. Electronics 2022, 11, 389. [Google Scholar] [CrossRef] [Scilit]
- Cunha, F.; Perkusich, M.; Guimaraes, E.; Santos, R.; Rique, T.; Albuquerque, D.; Perkusich, A.; Almeida, H.; Costa Gorgonio, K. An insight into the capabilities of professionals and teams in agile software development: An update of the systematic literature review. J. Commun. Softw. Syst. 2024, 20, 99–112. [Google Scholar] [CrossRef] [Scilit]
- Colomo-Palacios, R.; Casado-Lumbreras, C.; Soto-Acosta, P.; García-Peñalvo, F.J.; Tovar-Caro, E. Competence gaps in software personnel: A multi-organizational study. Comput. Hum. Behav. 2013, 29, 456–461. [Google Scholar] [CrossRef] [Scilit]
- Reszka, Ł.; Sosnowski, J.; Dobrzyński, B. Enhancing software project monitoring with multidimensional data repository mining. Electronics 2023, 12, 3774. [Google Scholar] [CrossRef] [Scilit]
- March, S.T.; Smith, G.F. Design and natural science research on information technology. Decis. Support Syst. 1995, 15, 251–266. [Google Scholar] [CrossRef] [Scilit]
- Engström, E.; Storey, M.-A.; Runeson, P.; Höst, M.; Baldassarre, M.T. How software engineering research aligns with design science: A review. Empir. Softw. Eng. 2020, 25, 2630–2660. [Google Scholar] [CrossRef] [Scilit]
- Wieringa, R.J. Design Science Methodology for Information Systems and Software Engineering; Springer: Berlin/Heidelberg, Germany, 2014. [Google Scholar] [CrossRef] [Scilit]
- Sonnenberg, C.; vom Brocke, J. Evaluations in the science of the artificial—Reconsidering the build-evaluate pattern in design science research. In Design Science Research in Information Systems. Advances in Theory and Practice; Peffers, K., Rothenberger, M., Kuechler, B., Eds.; Lecture Notes in Computer Science; Springer: Berlin/Heidelberg, Germany, 2012; Volume 7286, pp. 381–397. [Google Scholar] [CrossRef] [Scilit]
- Bauer, T.N.; Erdogan, B.; Ellis, A.M.; Truxillo, D.M.; Brady, G.M.; Bodner, T. New Horizons for Newcomer Organizational Socialization: A Review, Meta-Analysis, and Future Research Directions. J. Manag. 2025, 51, 344–382. [Google Scholar] [CrossRef] [Scilit]
- Buchan, J.; MacDonell, S.G.; Yang, J. Effective team onboarding in agile software development: Techniques and goals. In Proceedings of the 2019 ACM/IEEE International Symposium on Empirical Software Engineering and Measurement (ESEM), Porto de Galinhas, Brazil, 19–20 September 2019; pp. 1–11. [Google Scholar] [CrossRef] [Scilit]
- Object Management Group. OMG Unified Modeling Language (OMG UML), Version 2.5.1. 2017. Available online: https://www.omg.org/spec/UML/2.5.1 (accessed on 12 June 2026).
- Guo, J.L.C.; Steghöfer, J.-P.; Vogelsang, A.; Cleland-Huang, J. Natural language processing for requirements traceability. In Handbook on Natural Language Processing for Requirements Engineering; Ferrari, A., Ginde, G., Eds.; Springer: Cham, Switzerland, 2025; pp. 89–116. [Google Scholar] [CrossRef] [Scilit]
- Venable, J.; Pries-Heje, J.; Baskerville, R. FEDS: A framework for evaluation in design science research. Eur. J. Inf. Syst. 2016, 25, 77–89. [Google Scholar] [CrossRef] [Scilit]
- Jönsson, A.; Svingby, G. The use of scoring rubrics: Reliability, validity and educational consequences. Educ. Res. Rev. 2007, 2, 130–144. [Google Scholar] [CrossRef] [Scilit]
- OECD; European Union; European Commission; Joint Research Centre. Handbook on Constructing Composite Indicators: Methodology and User Guide; OECD Publishing: Paris, France, 2008. [Google Scholar] [CrossRef] [Scilit]
- Shadish, W.R.; Cook, T.D.; Campbell, D.T. Experimental and Quasi-Experimental Designs for Generalized Causal Inference; Houghton Mifflin: Boston, MA, USA, 2002. [Google Scholar]
- Wohlin, C.; Runeson, P.; Höst, M.; Ohlsson, M.C.; Regnell, B.; Wesslén, A. Experimentation in Software Engineering; Springer: Berlin/Heidelberg, Germany, 2012. [Google Scholar] [CrossRef] [Scilit]
- Singer, J.; Vinson, N.G. Ethical issues in empirical studies of software engineering. IEEE Trans. Softw. Eng. 2002, 28, 1171–1180. [Google Scholar] [CrossRef] [Scilit]
- Kallio, H.; Pietilä, A.-M.; Johnson, M.; Kangasniemi, M. Systematic methodological review: Developing a framework for a qualitative semi-structured interview guide. J. Adv. Nurs. 2016, 72, 2954–2965. [Google Scholar] [CrossRef] [Scilit] [PubMed]
- Runeson, P.; Höst, M. Guidelines for conducting and reporting case study research in software engineering. Empir. Softw. Eng. 2009, 14, 131–164. [Google Scholar] [CrossRef] [Scilit]
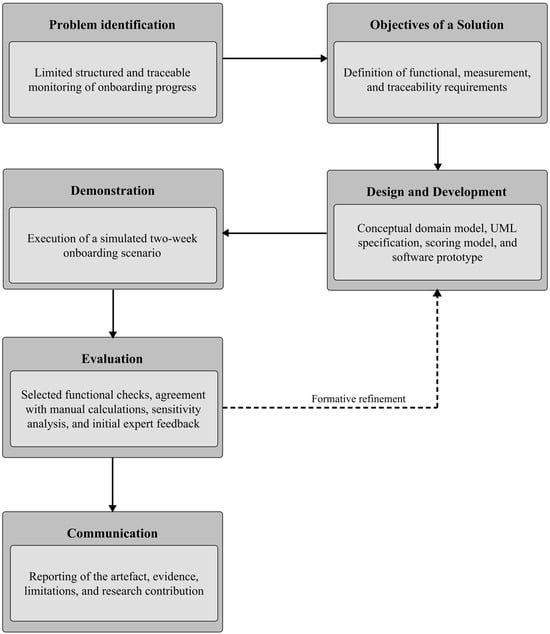
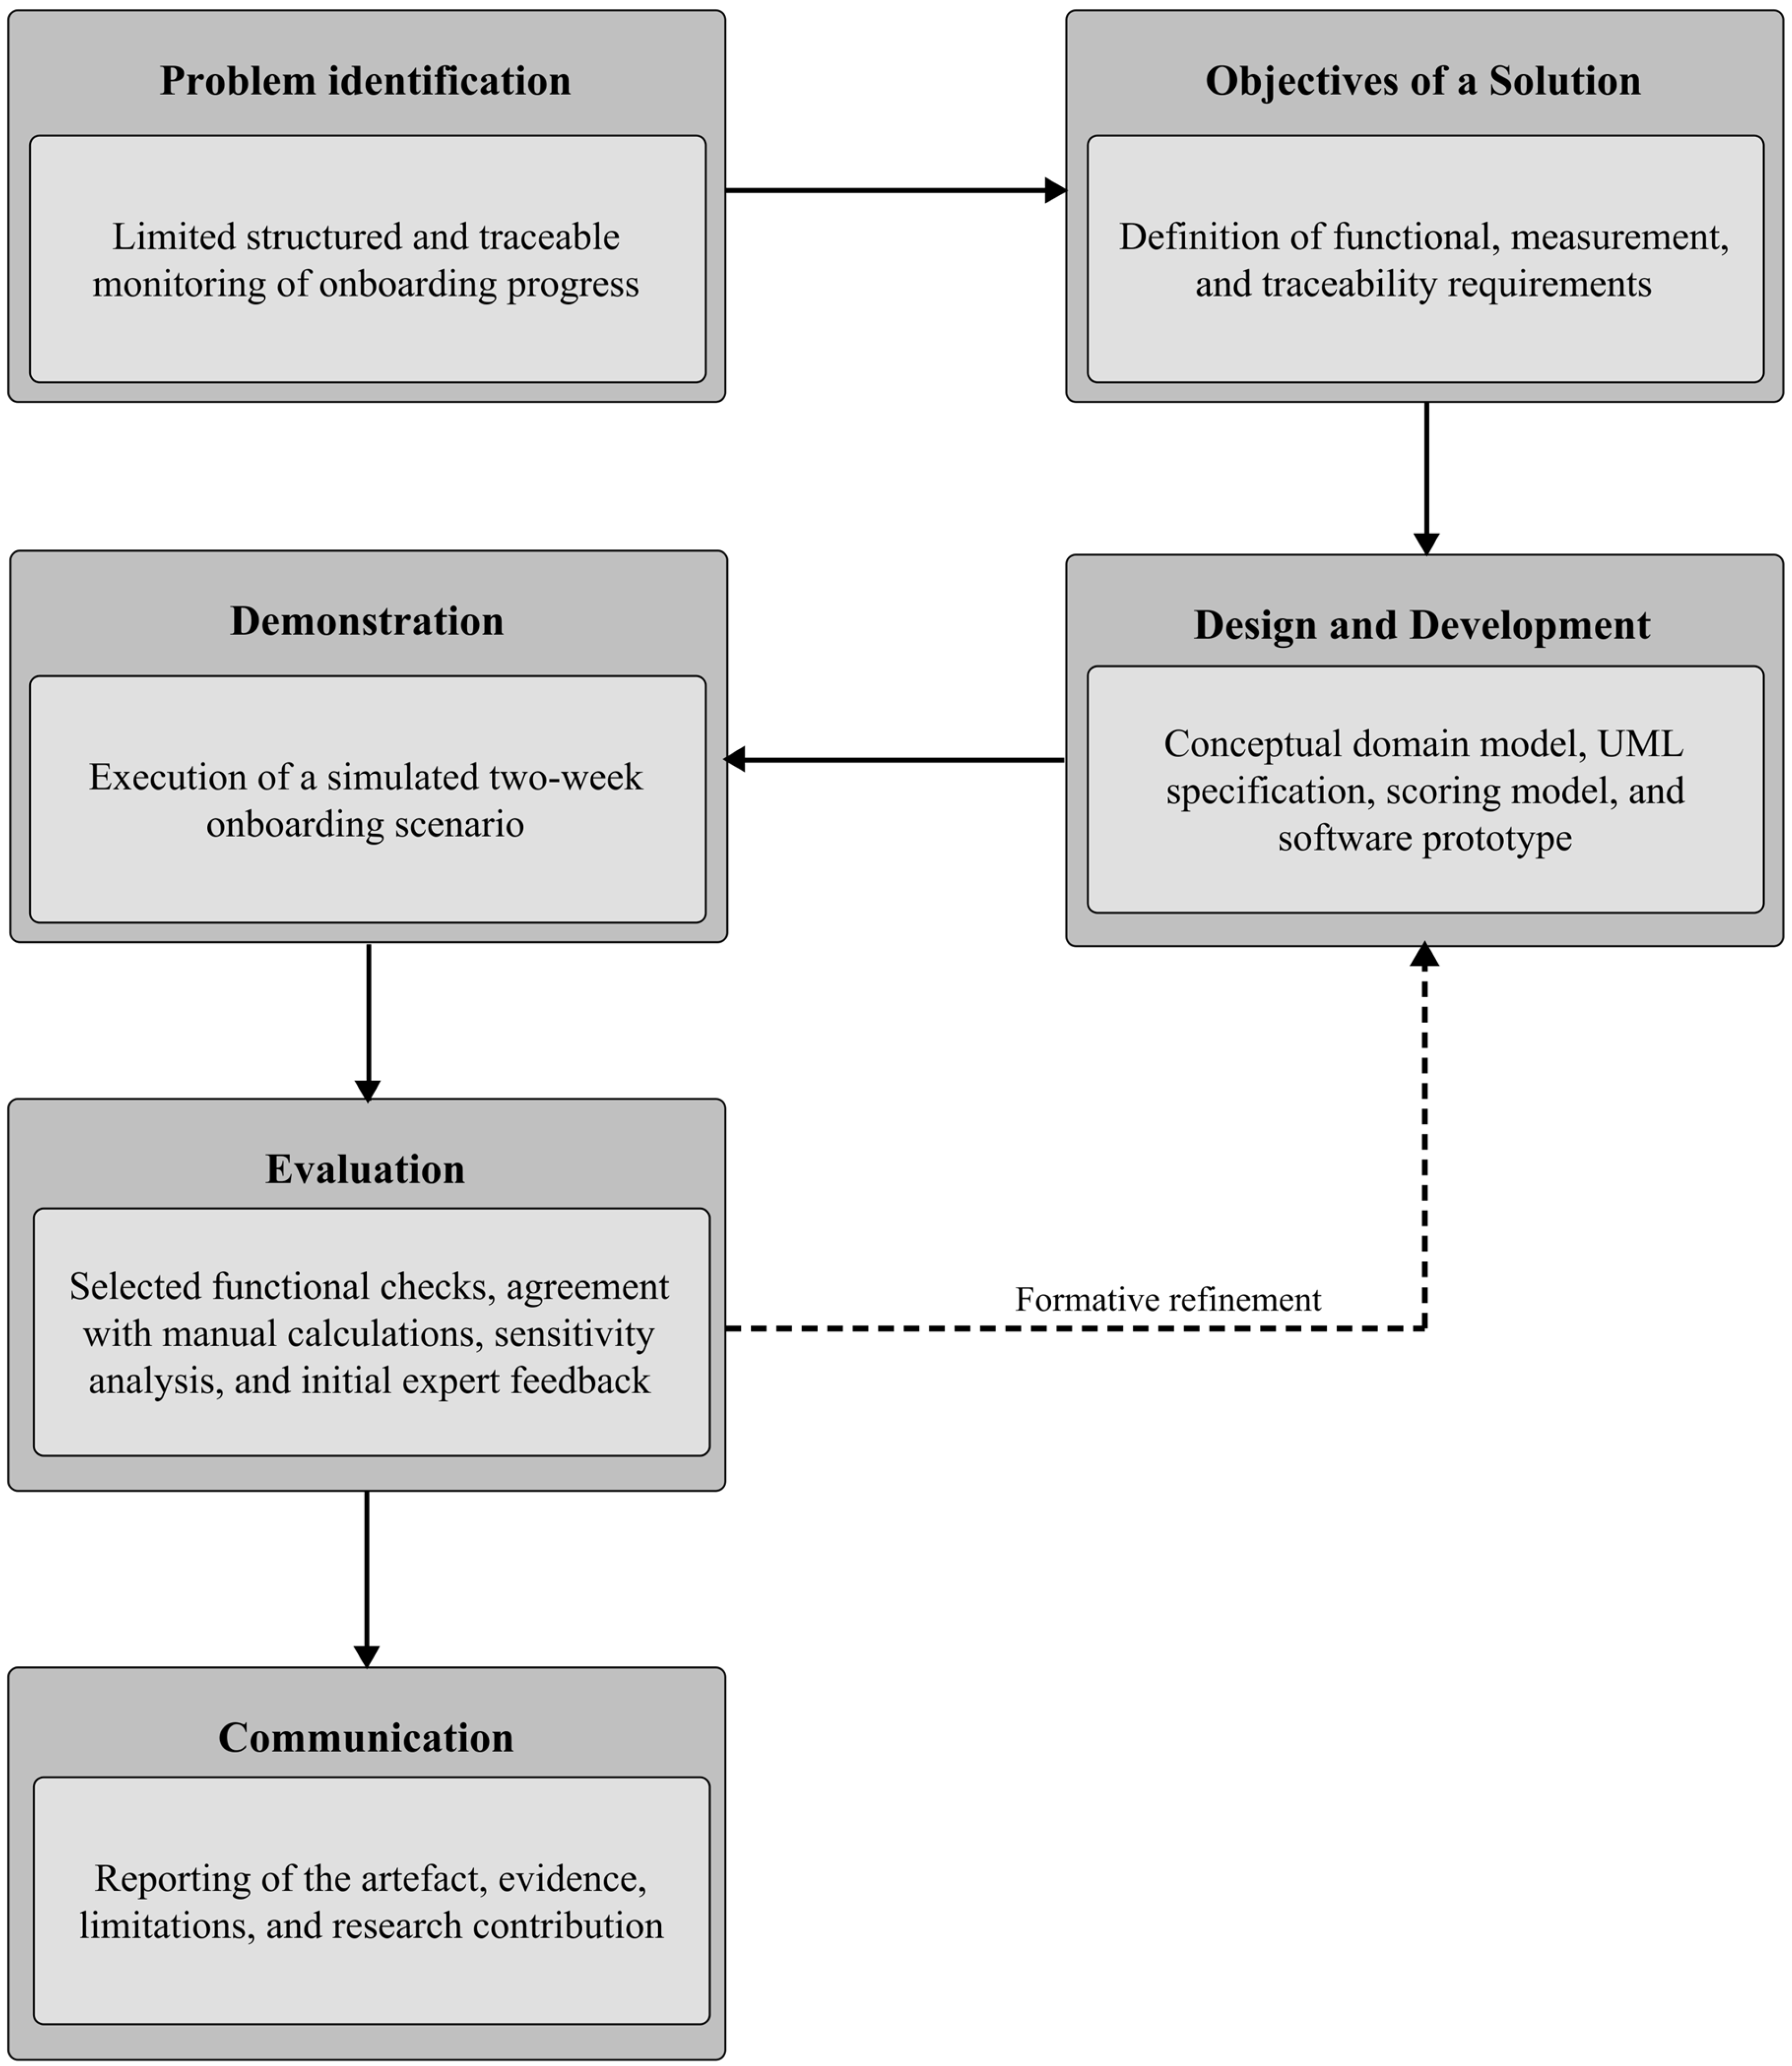
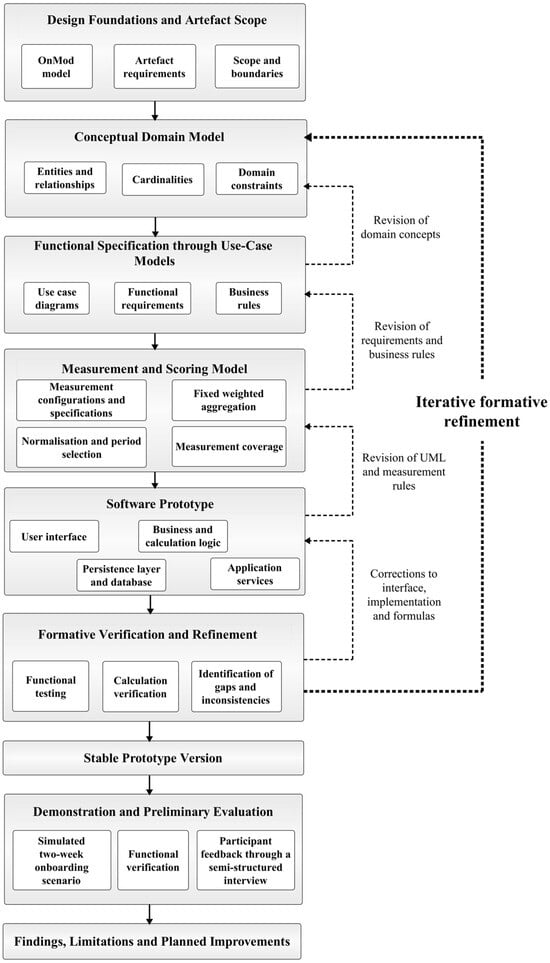
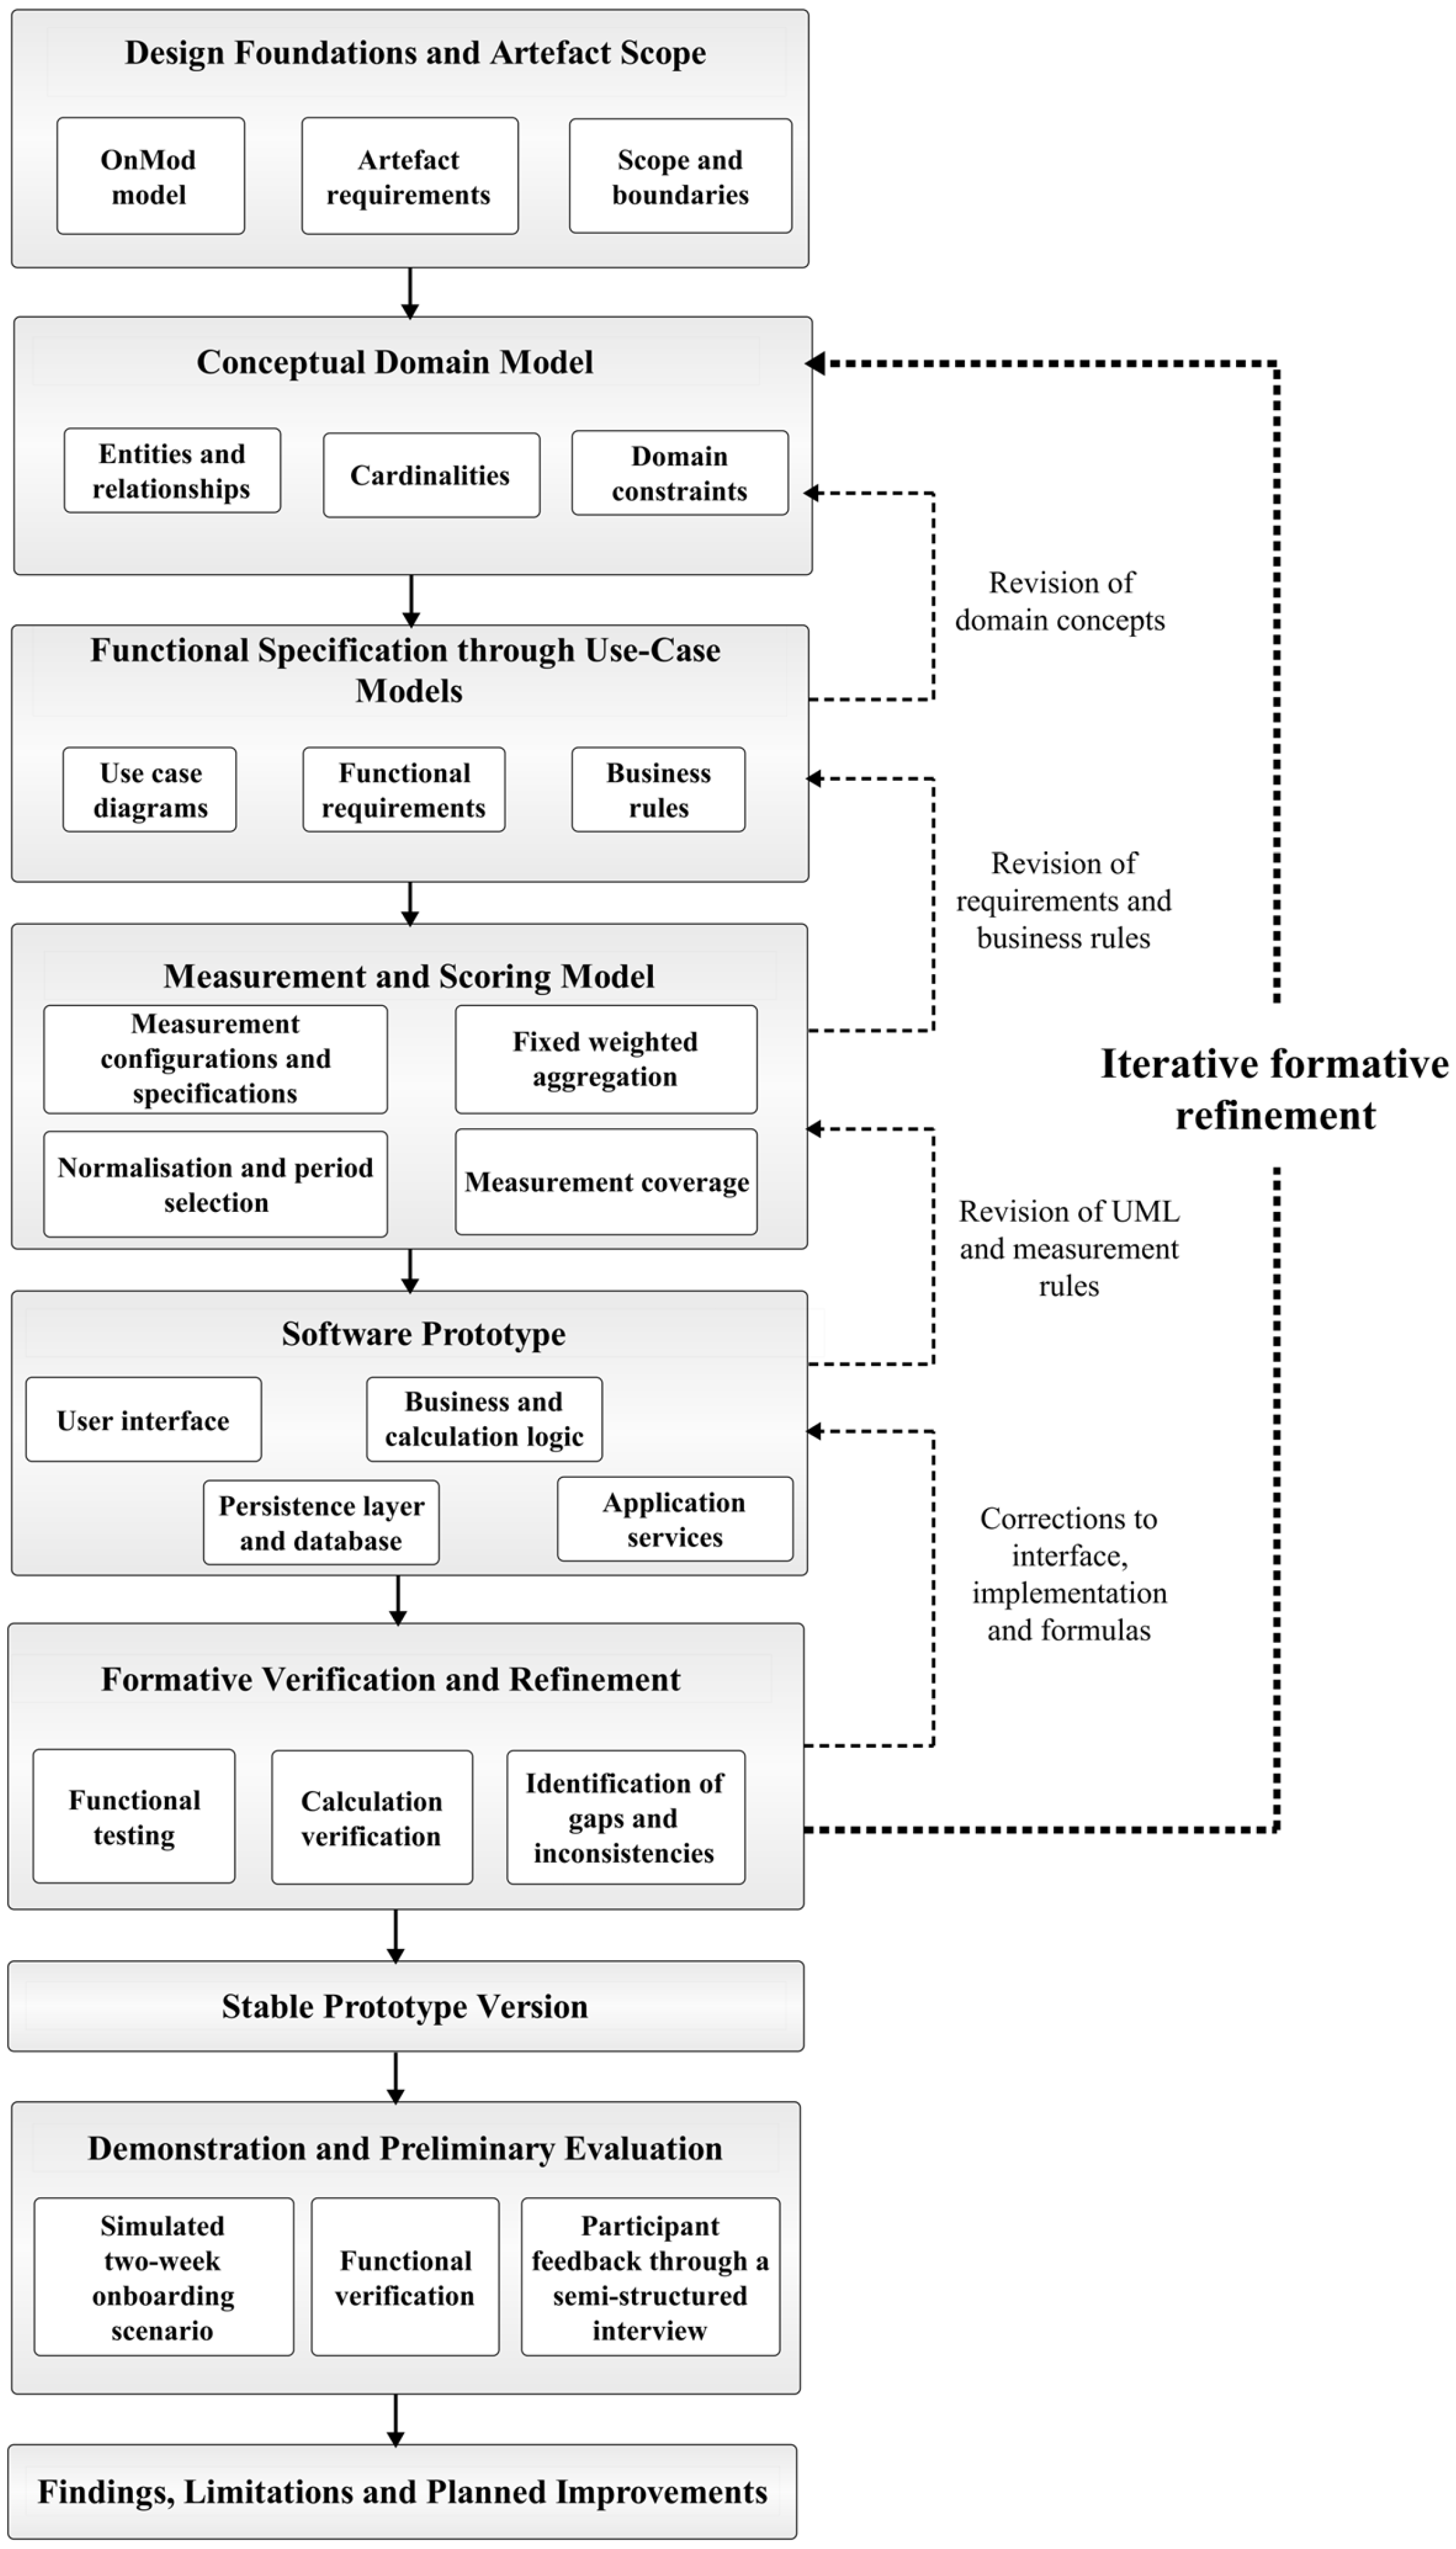
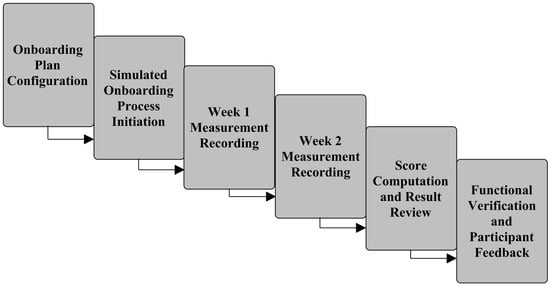
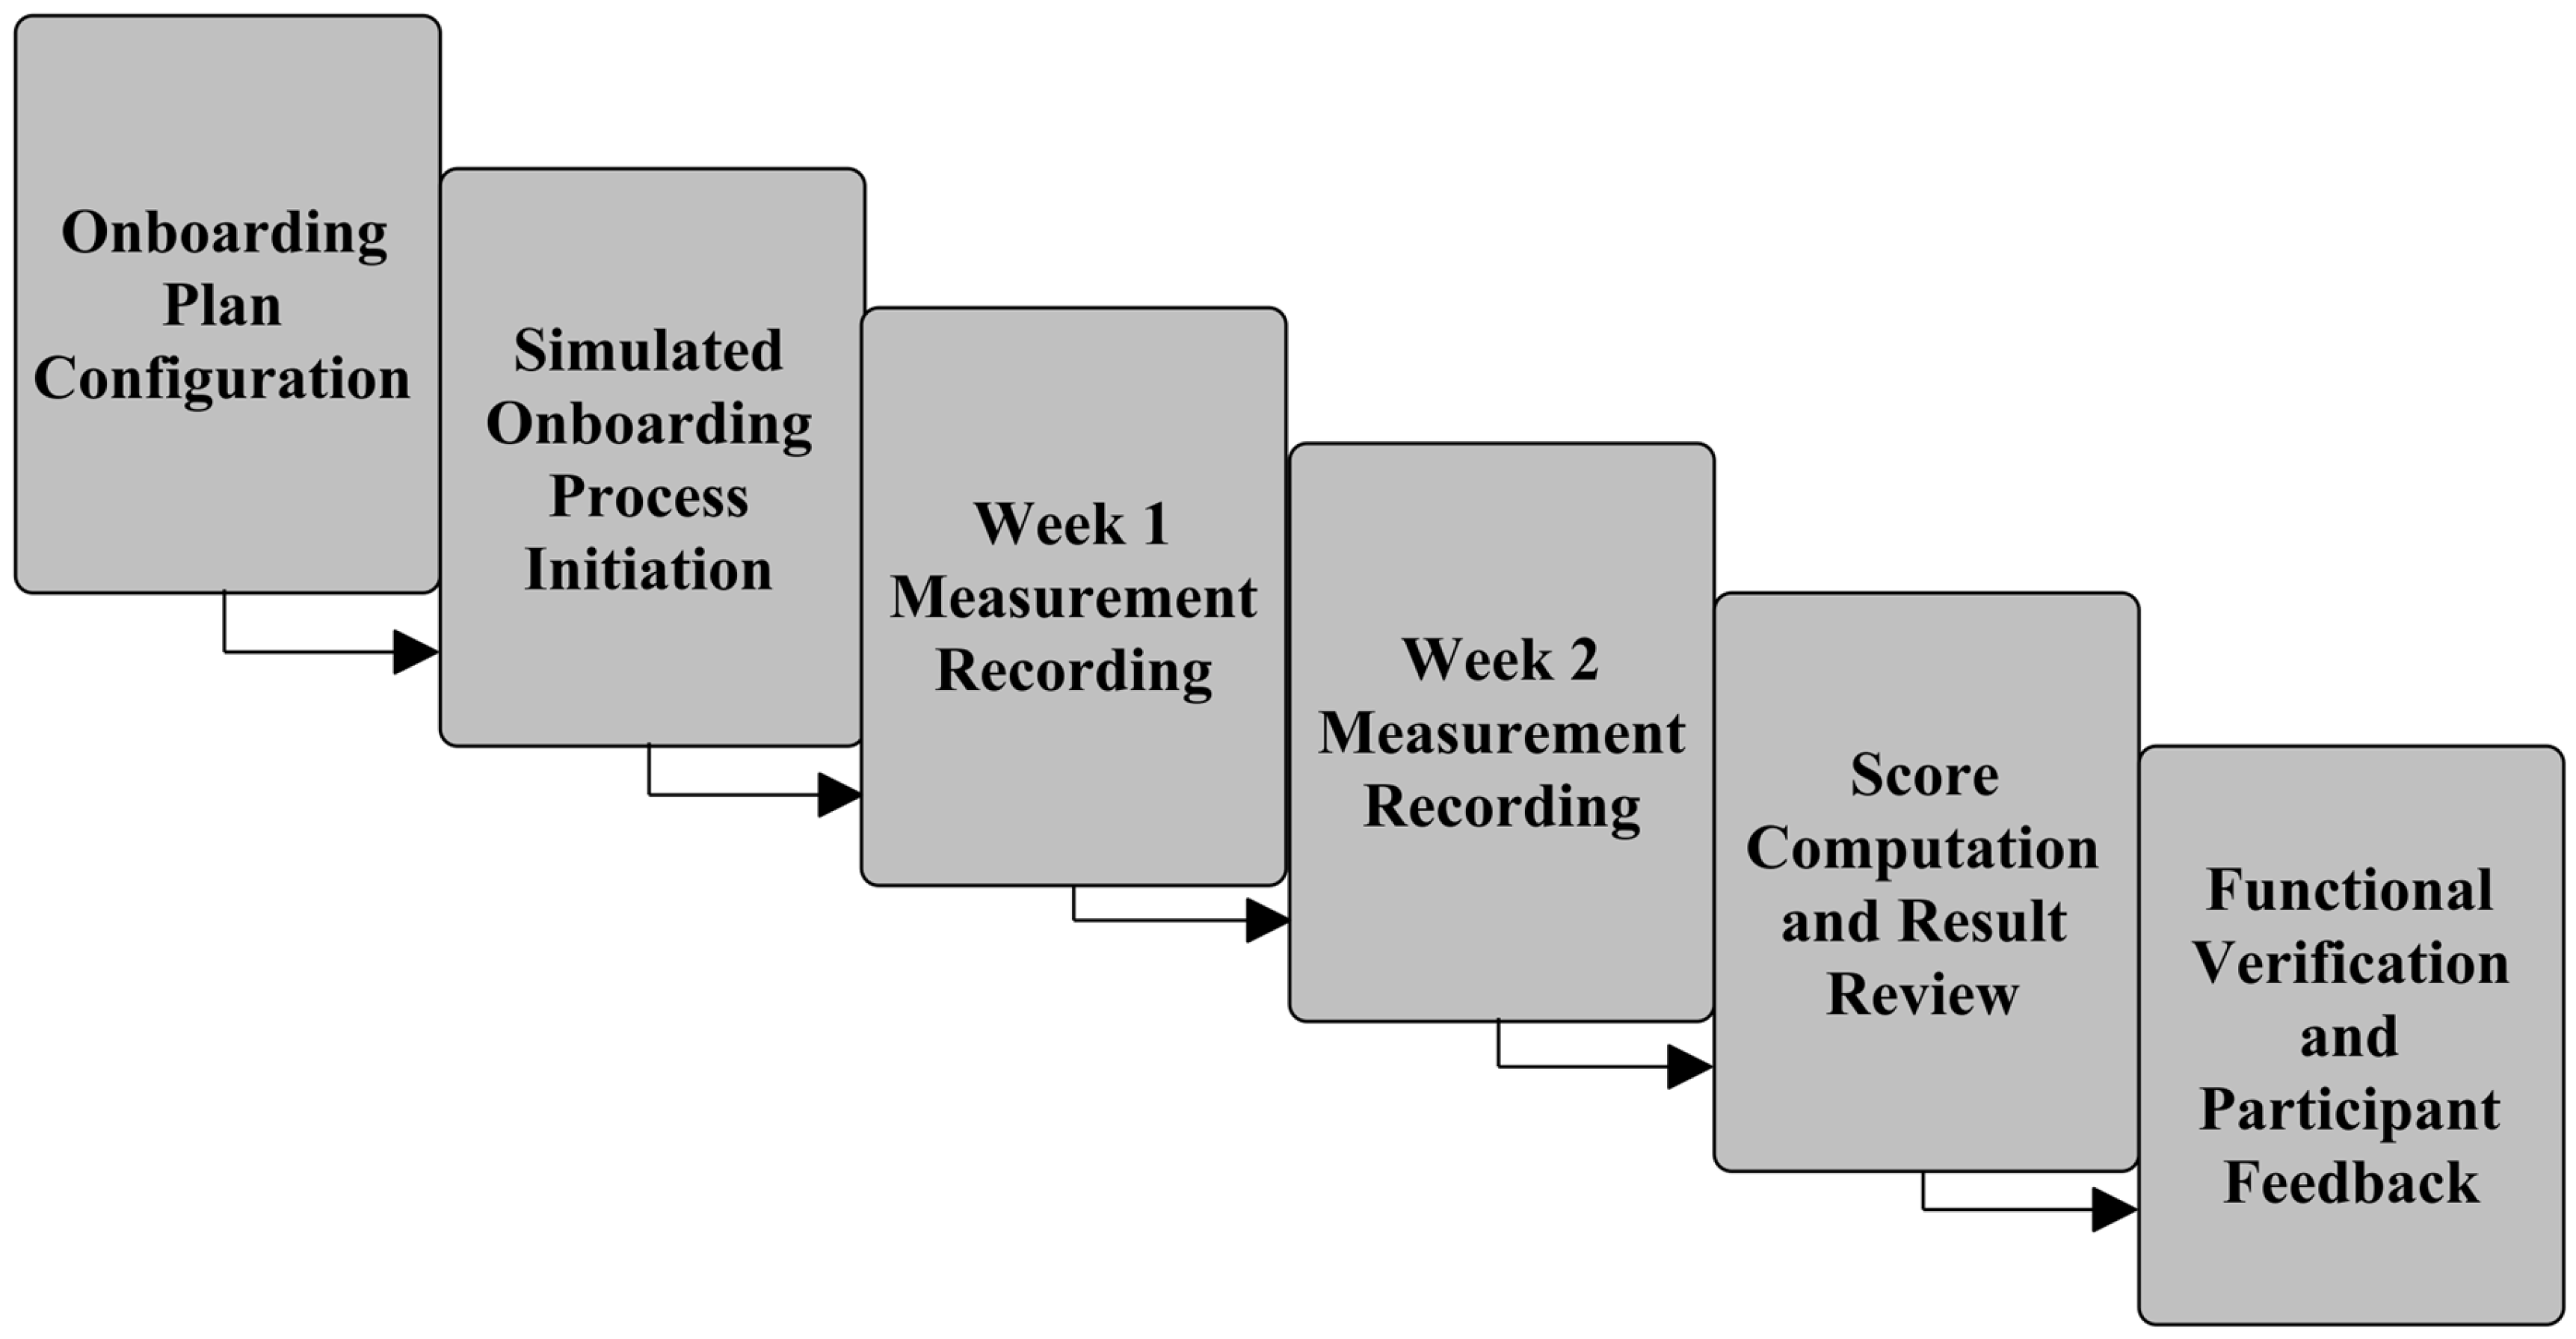
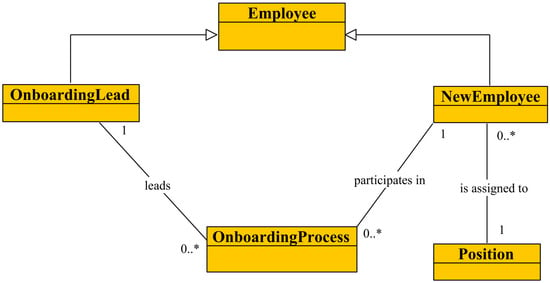
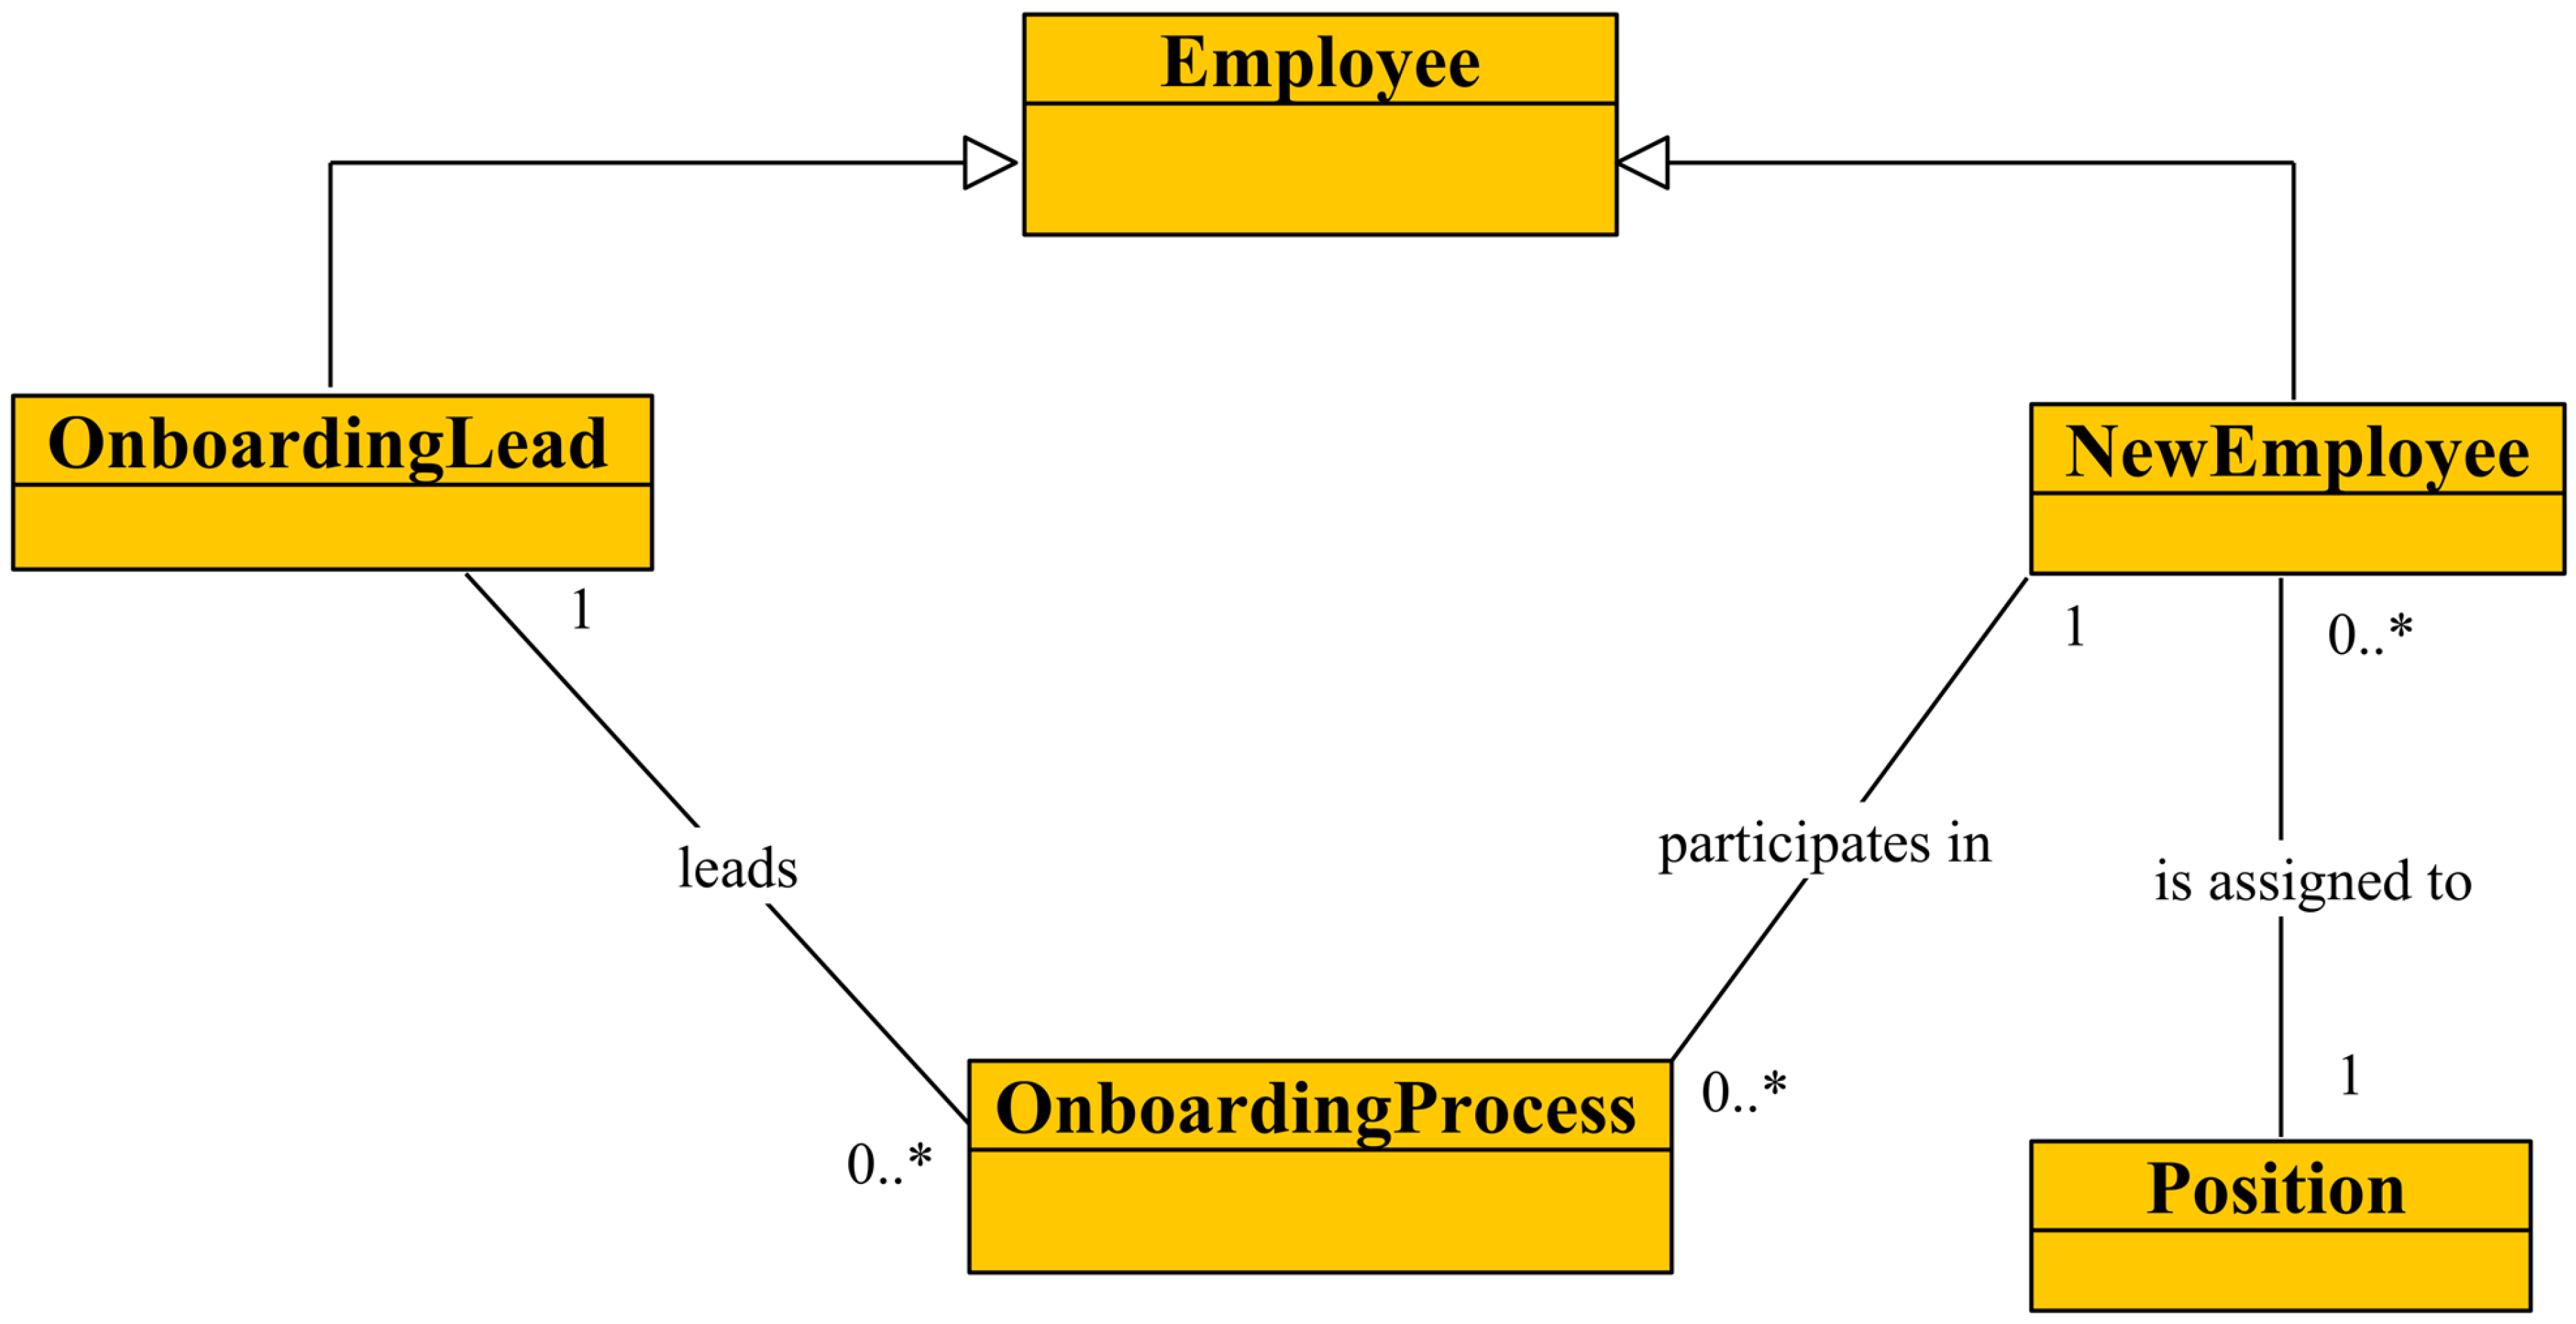
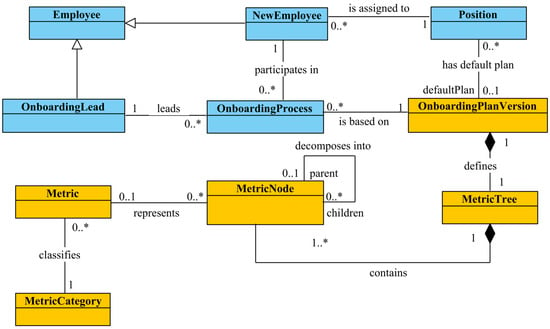
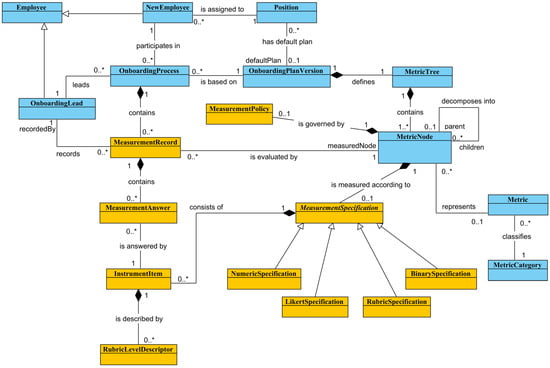
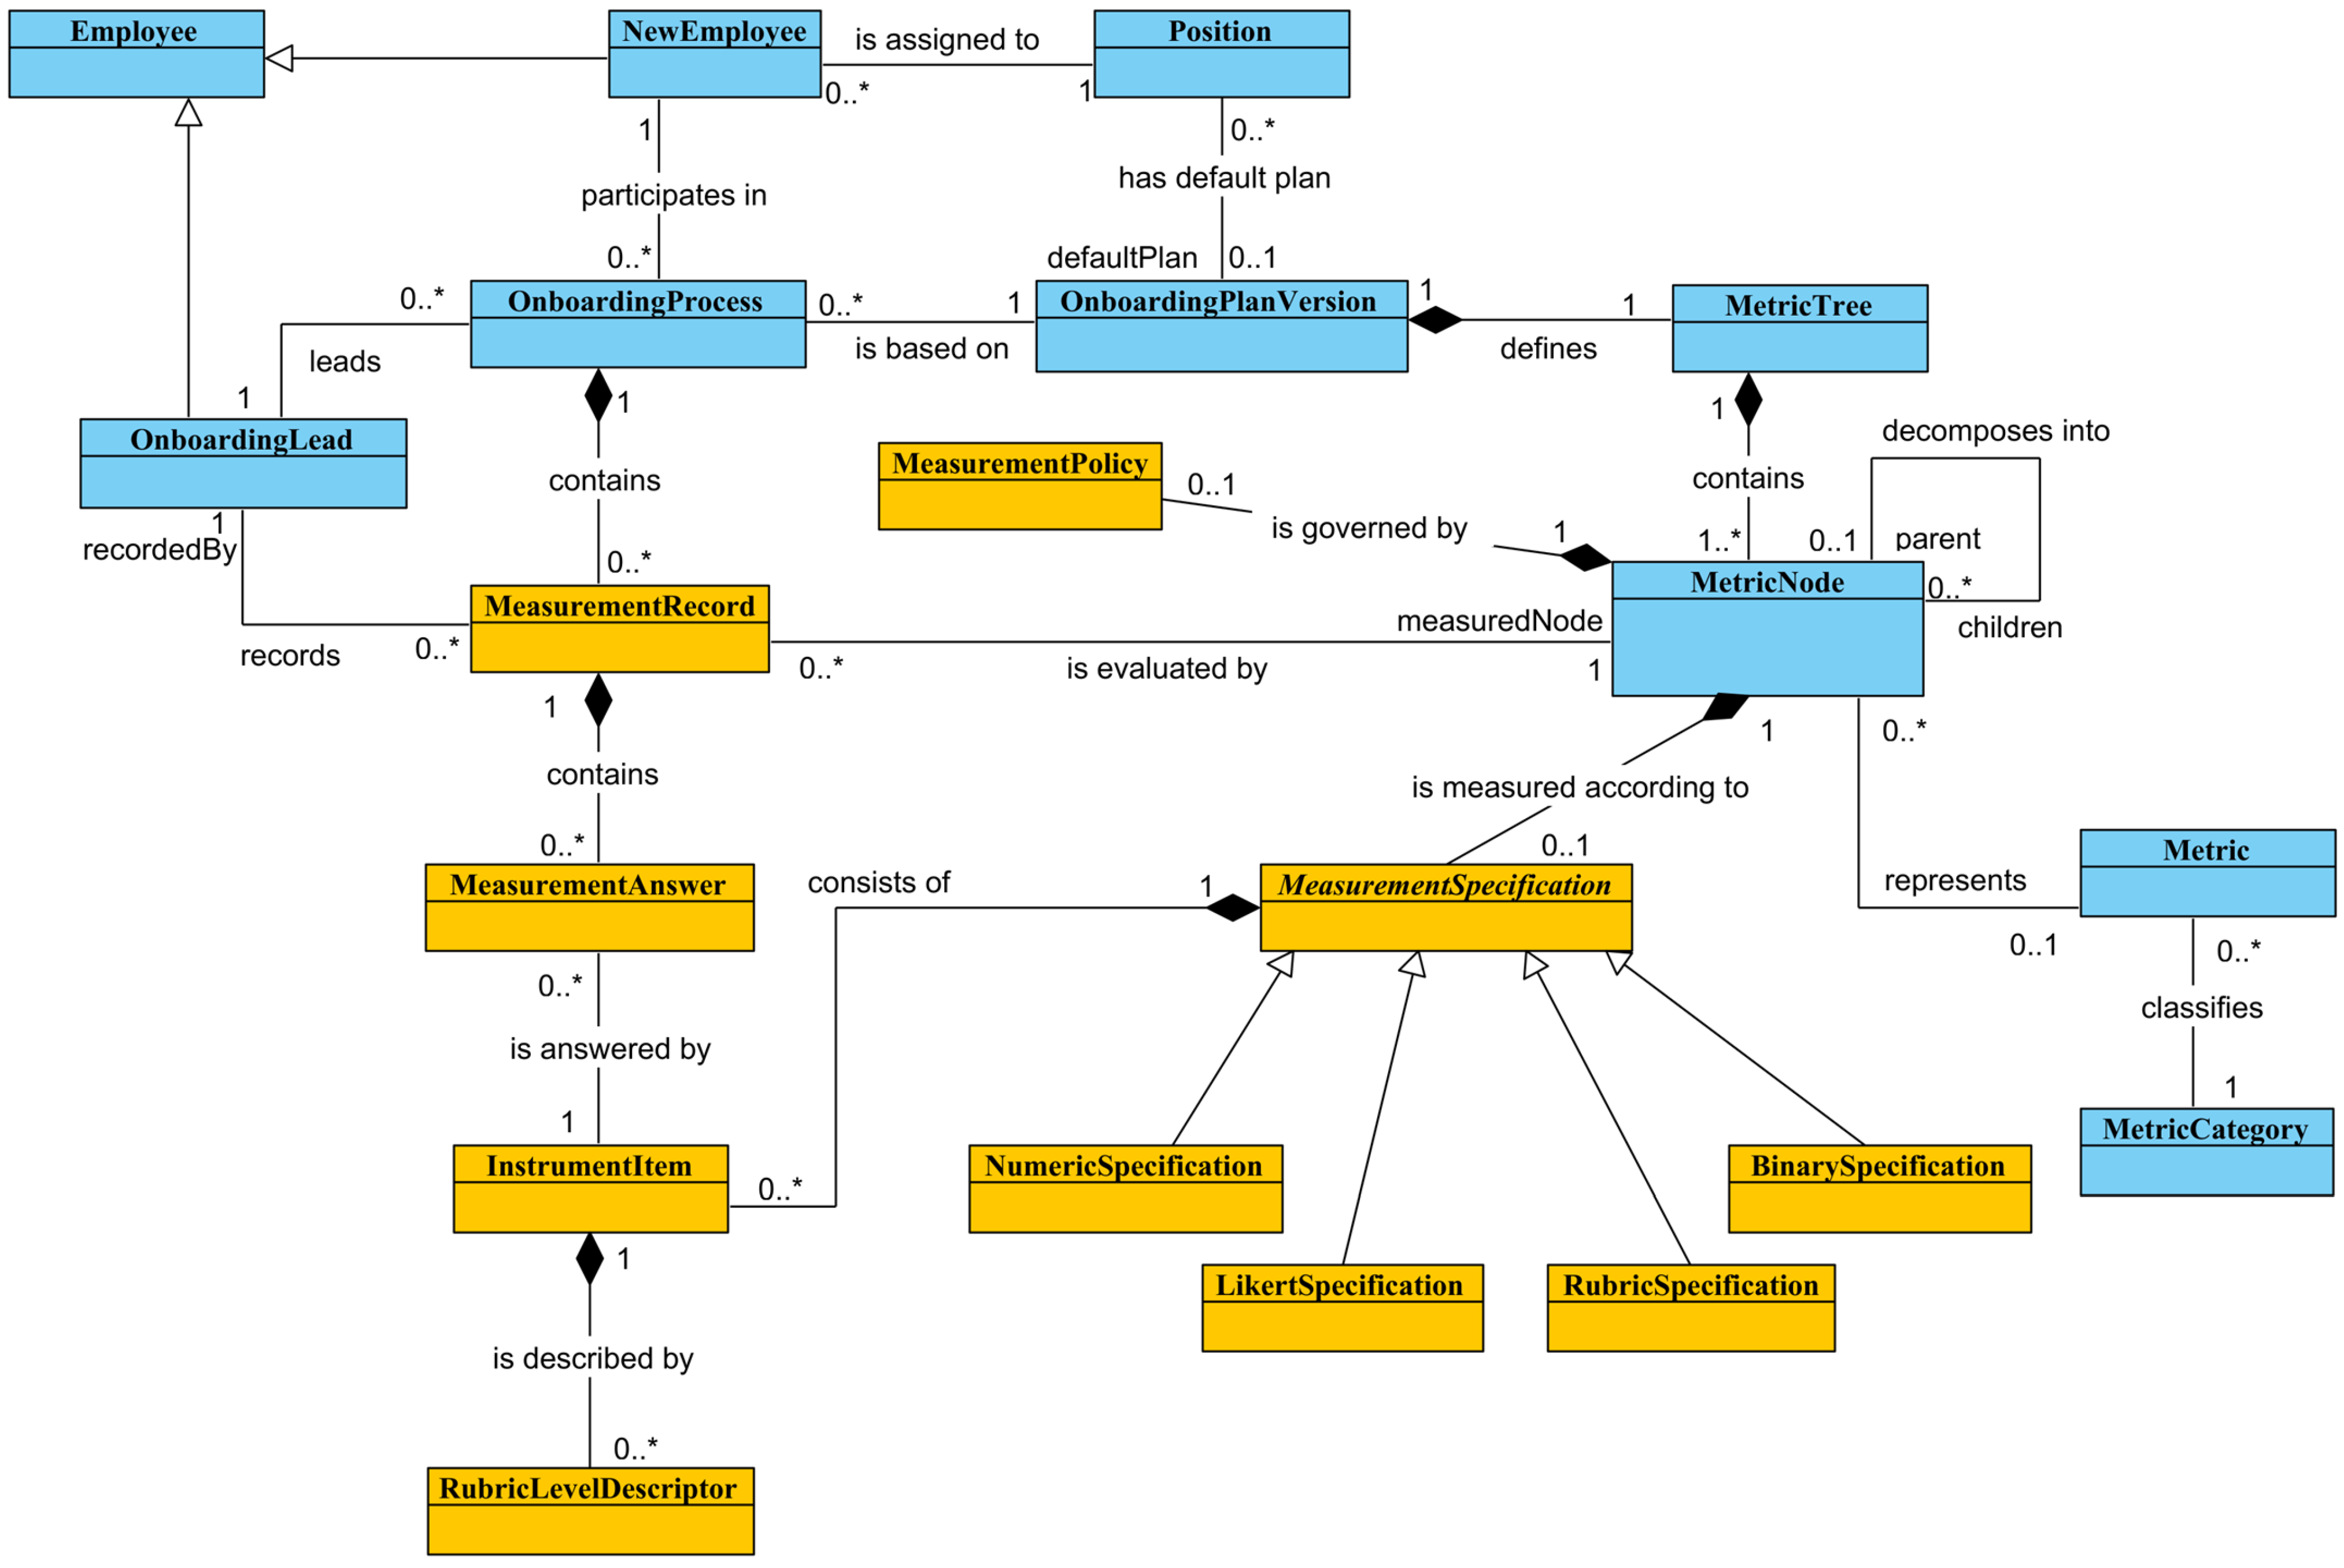
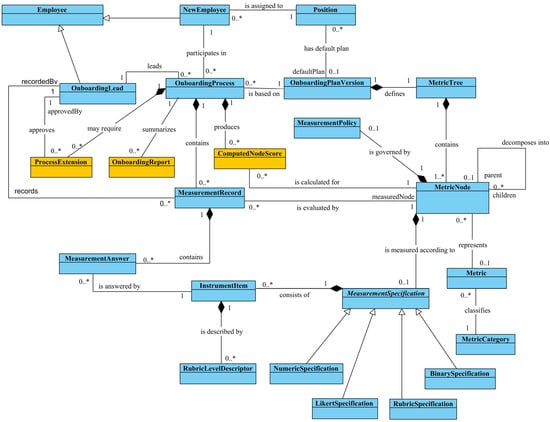
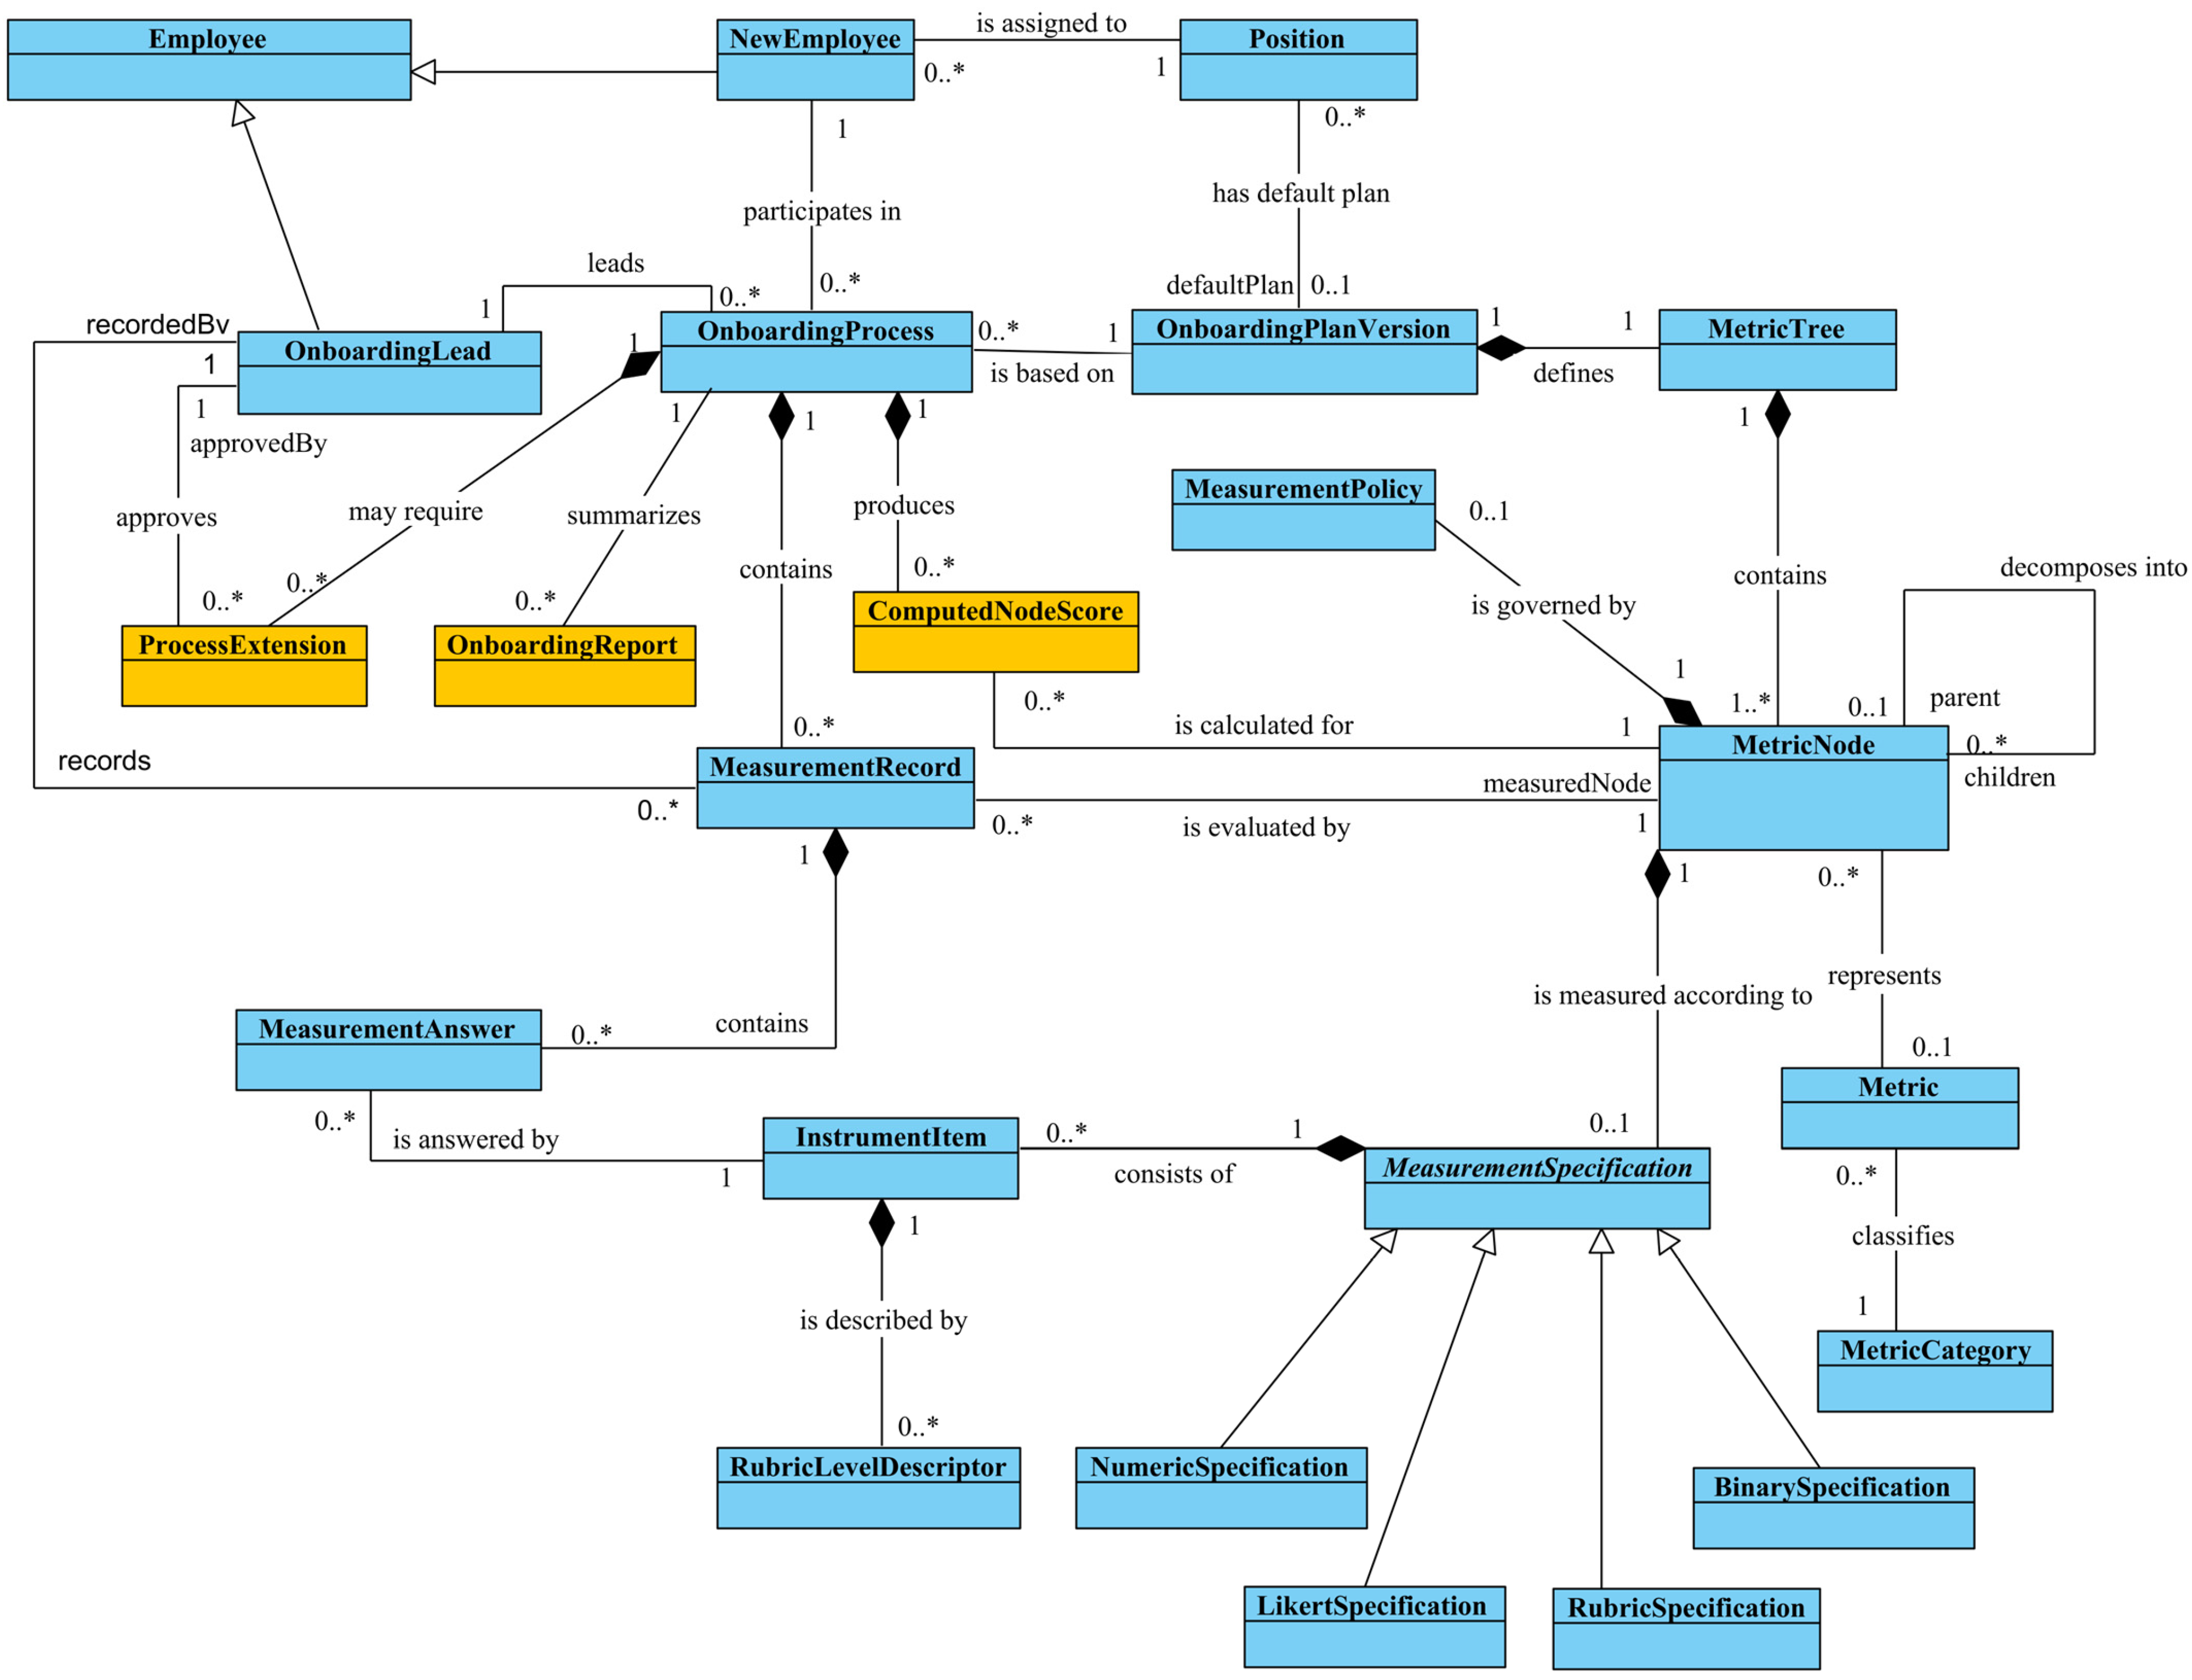
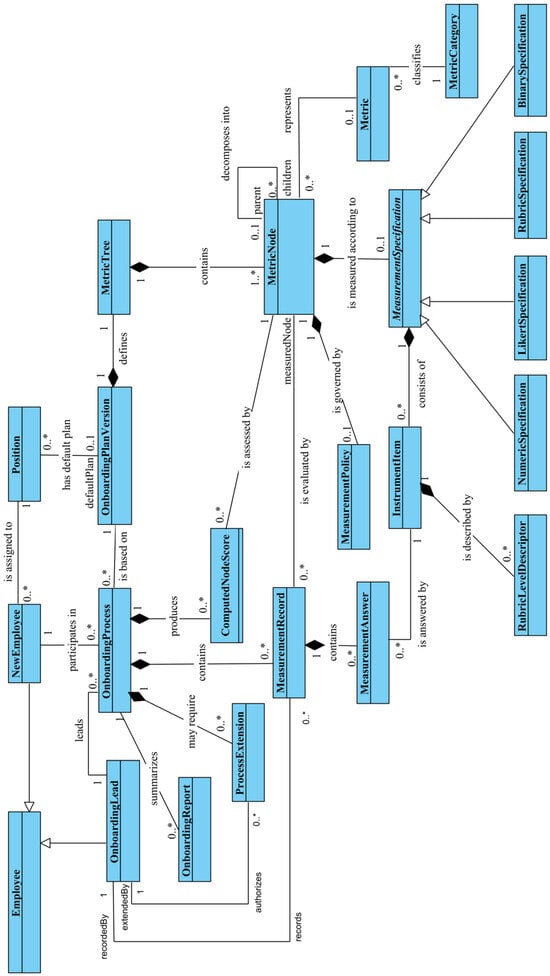
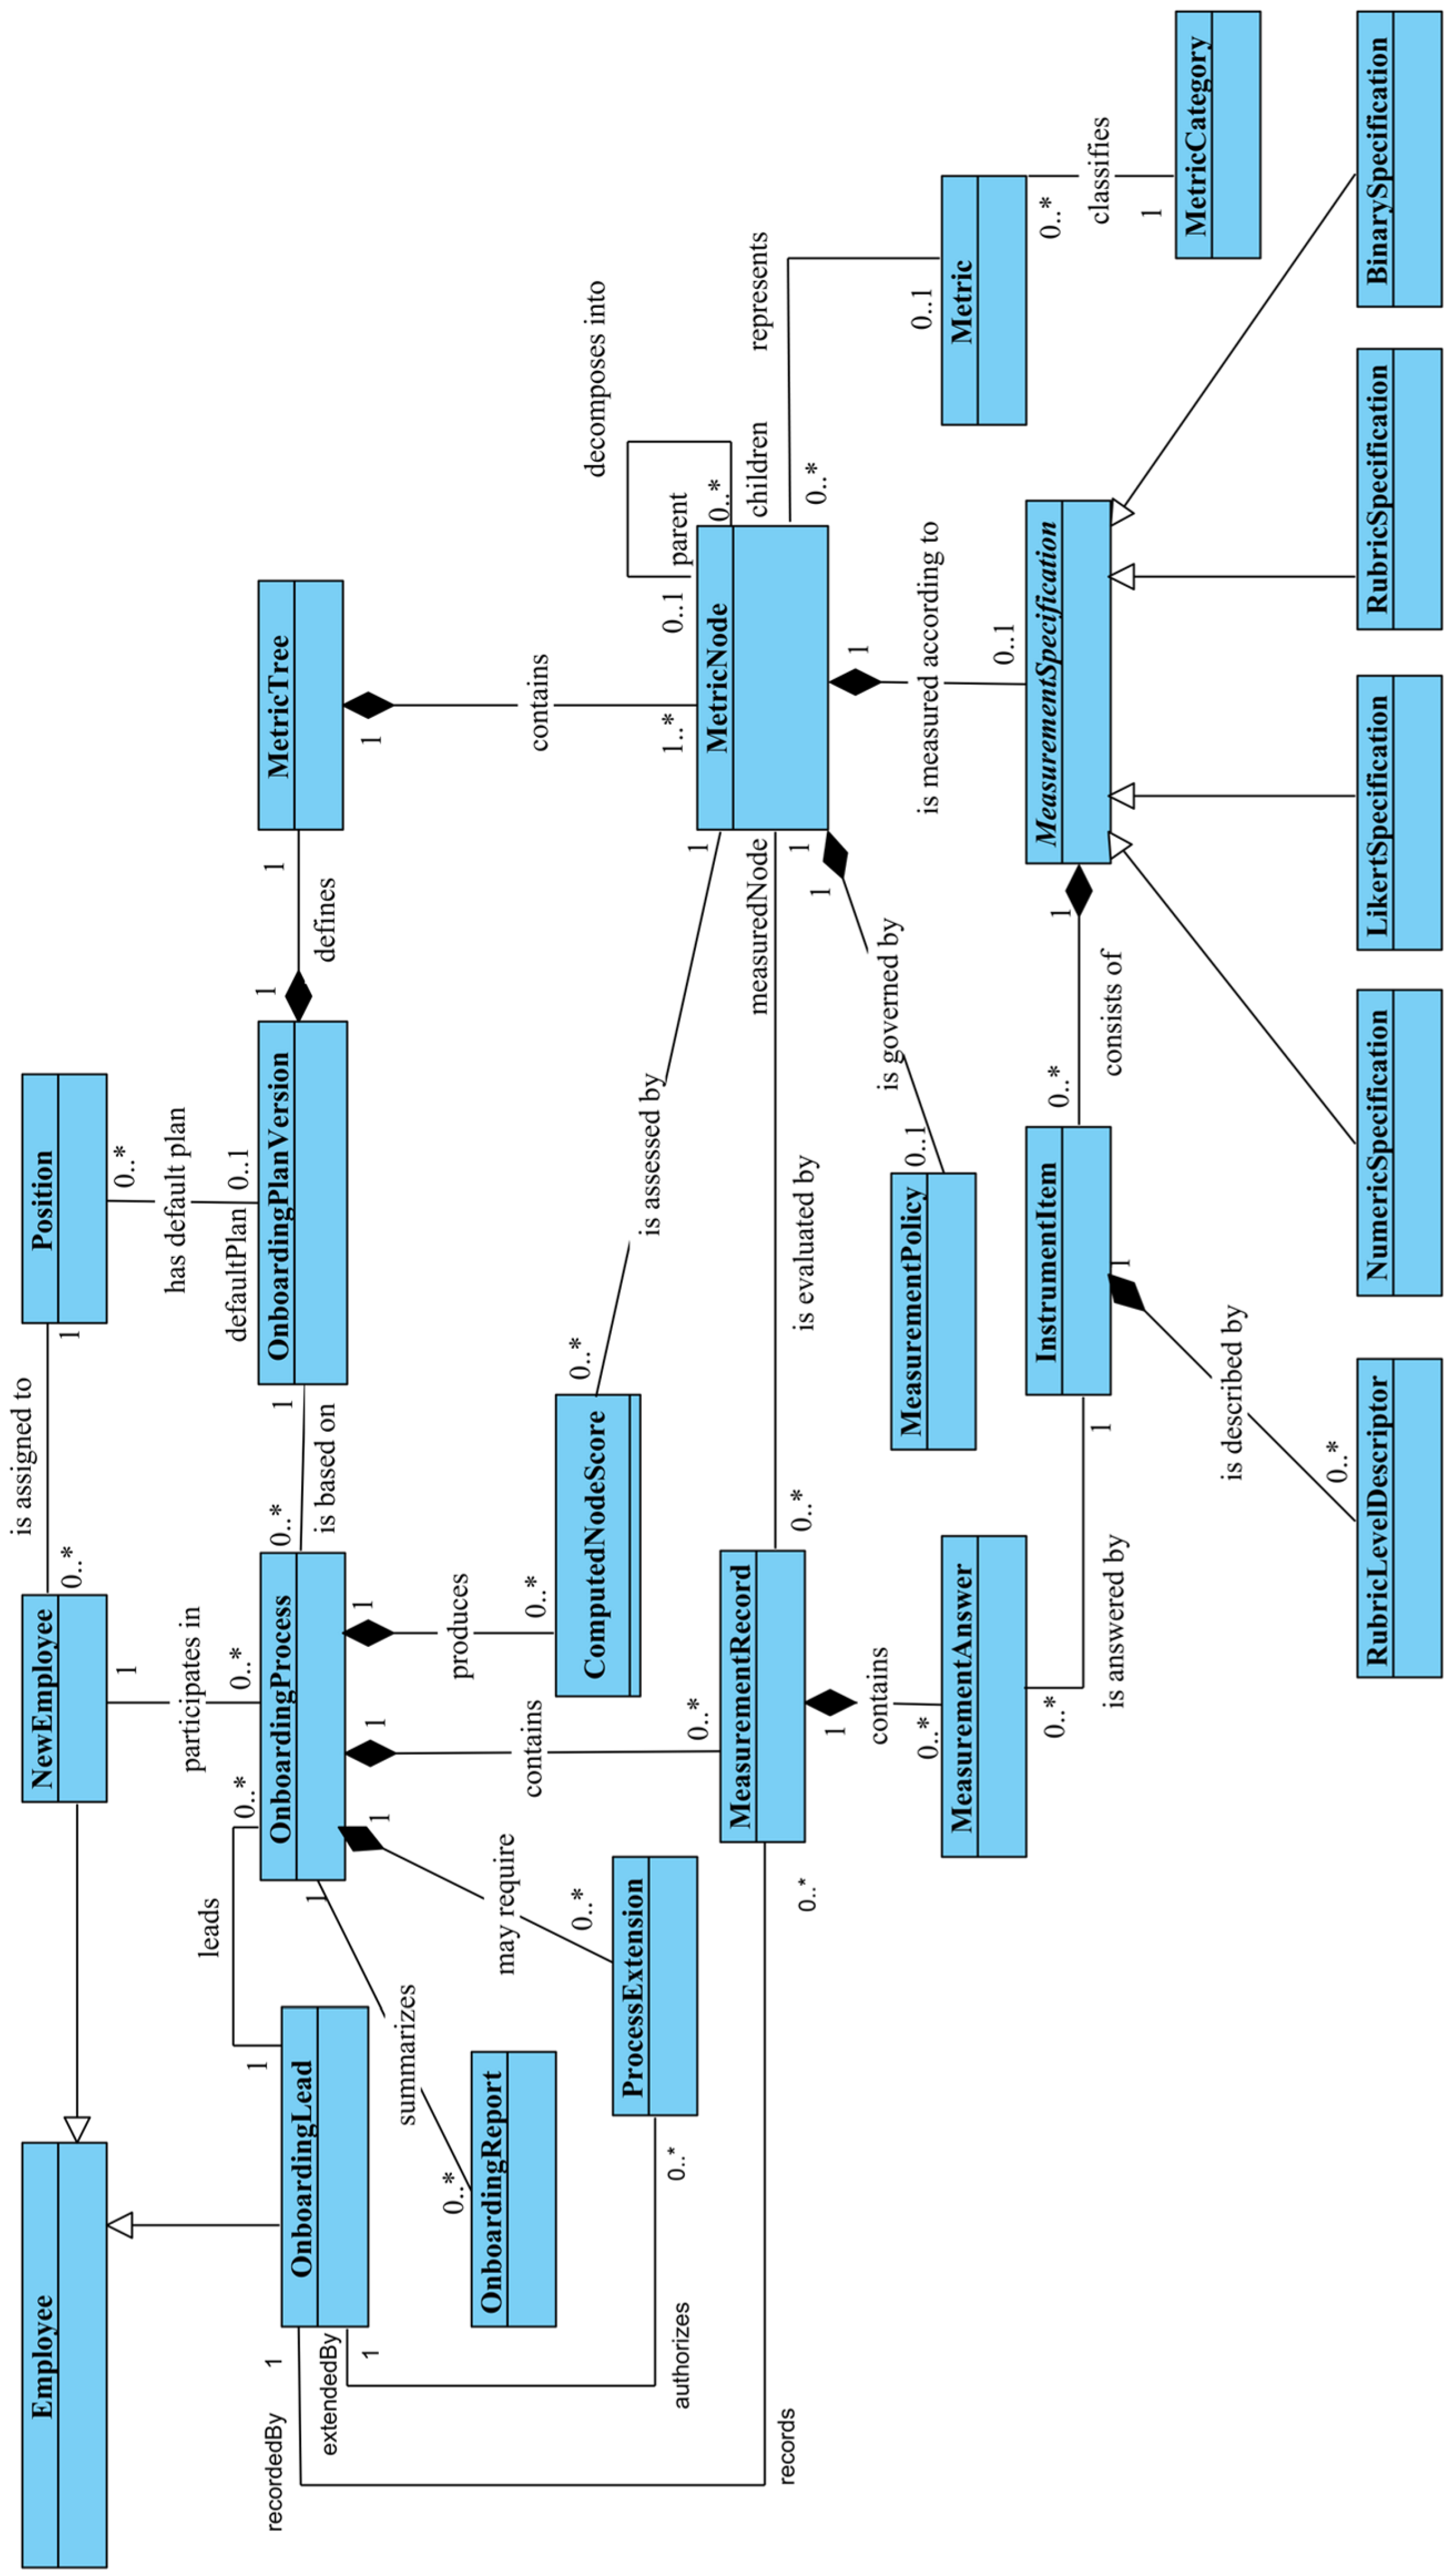
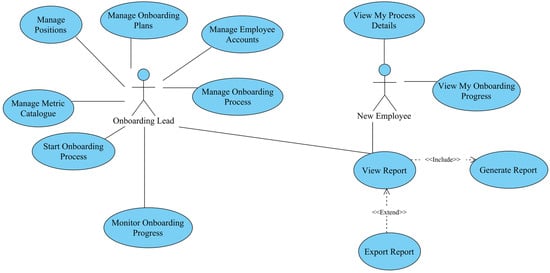
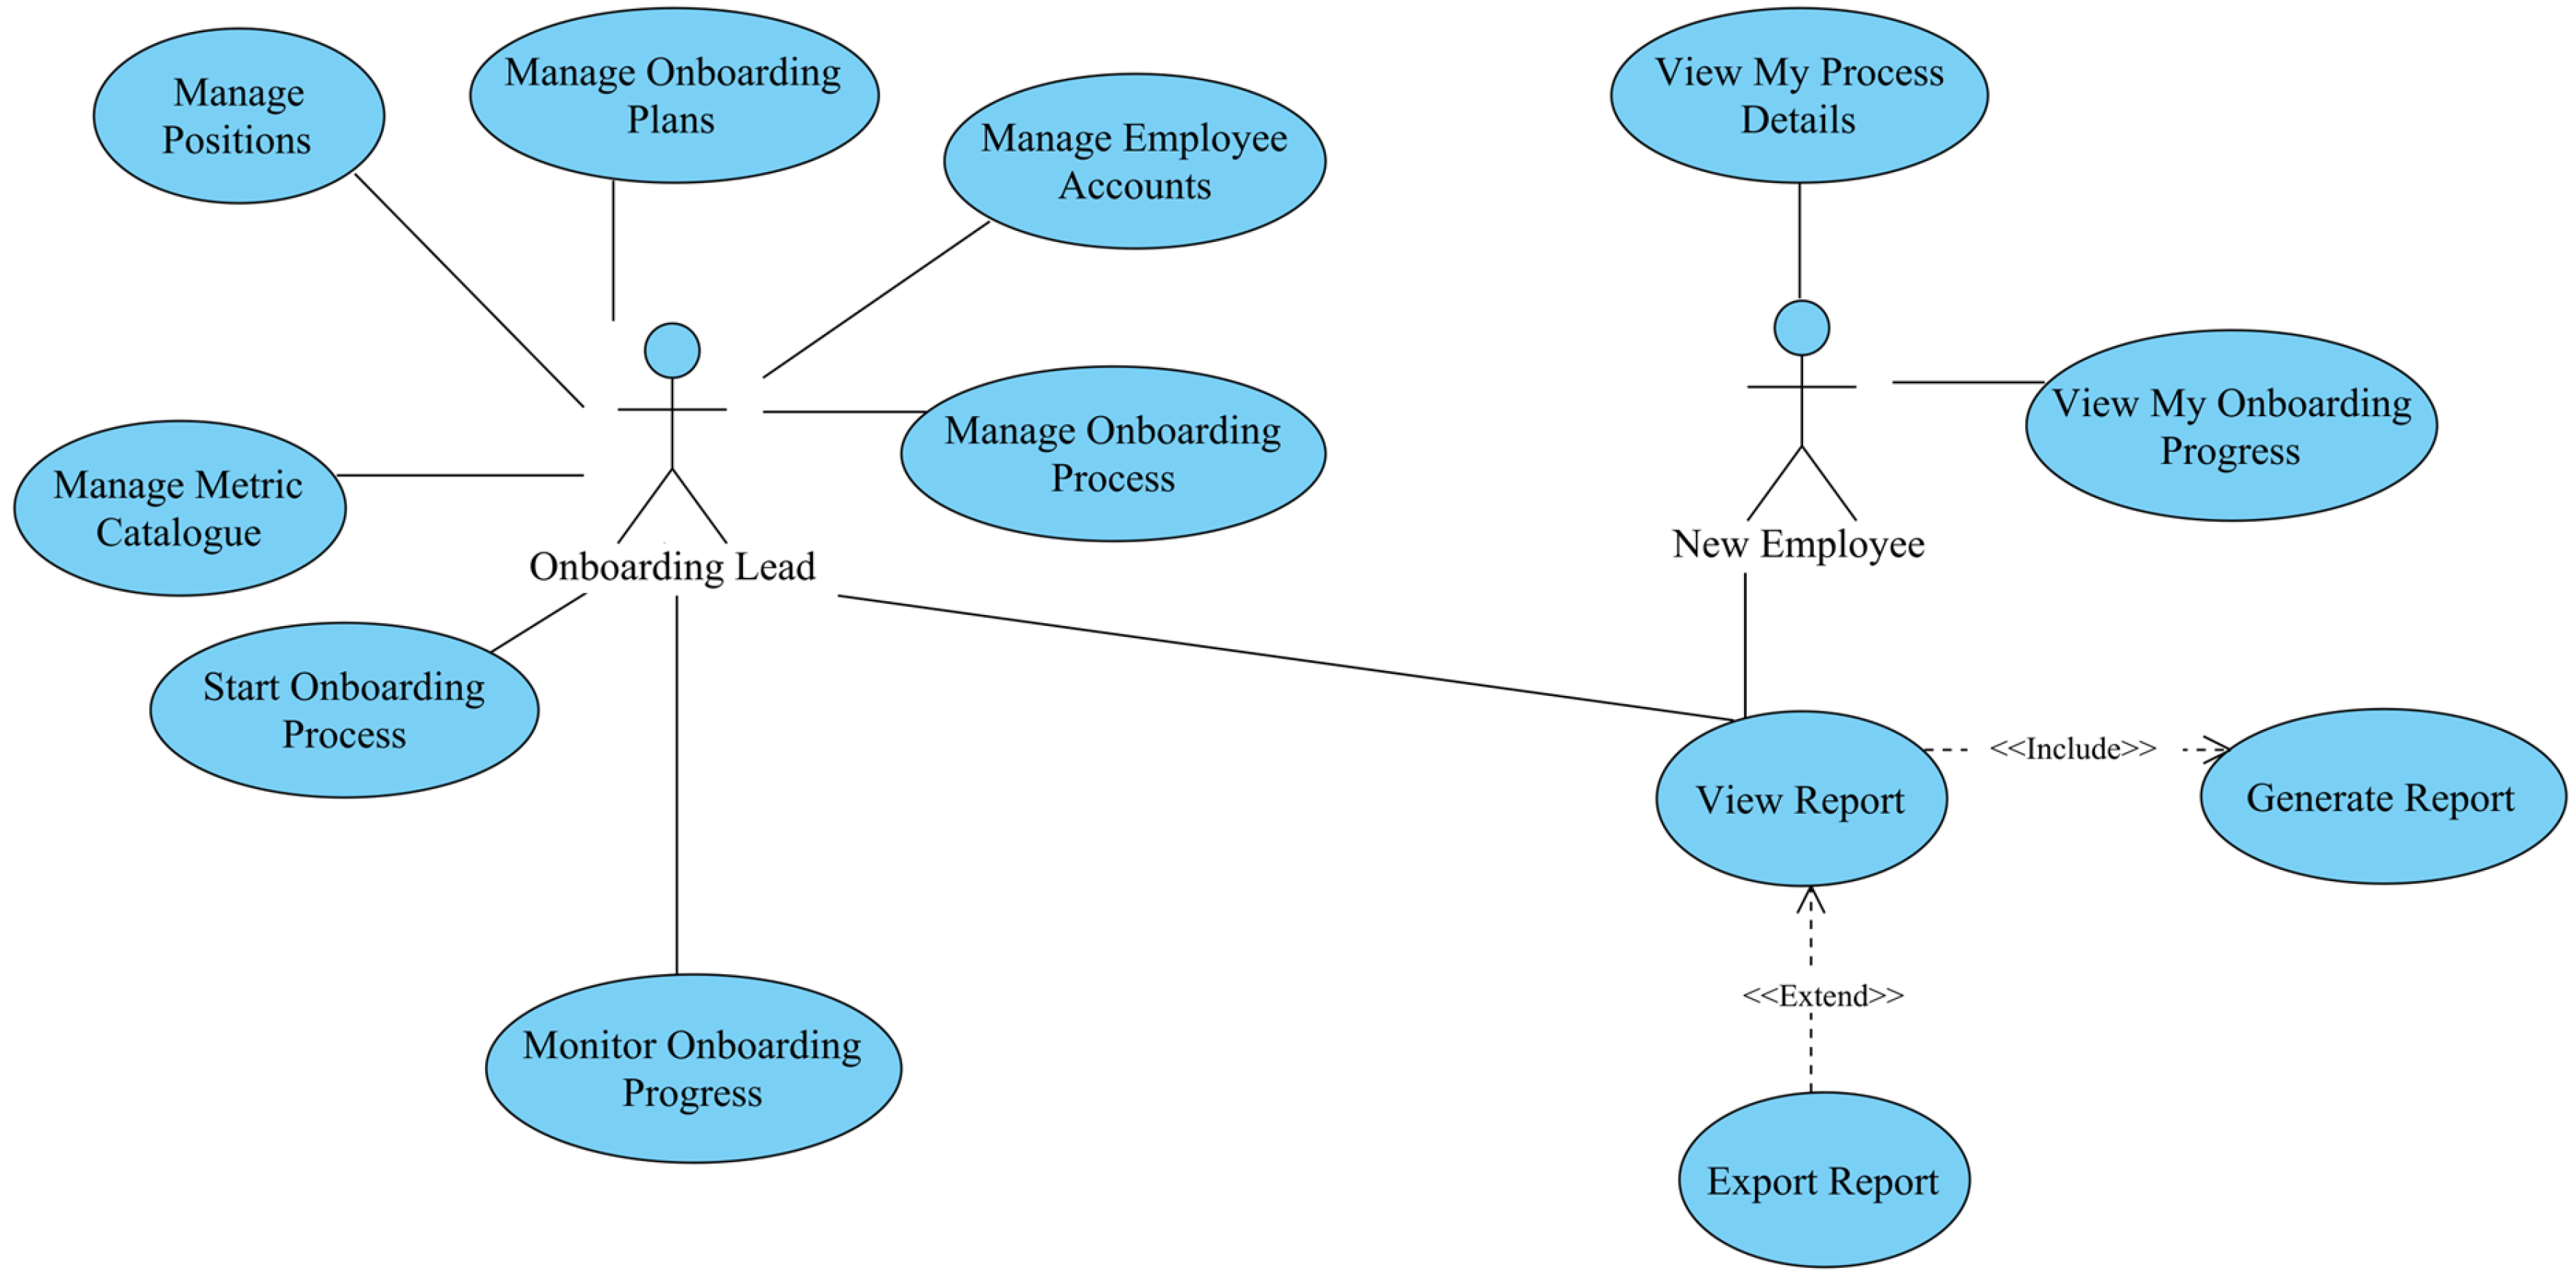
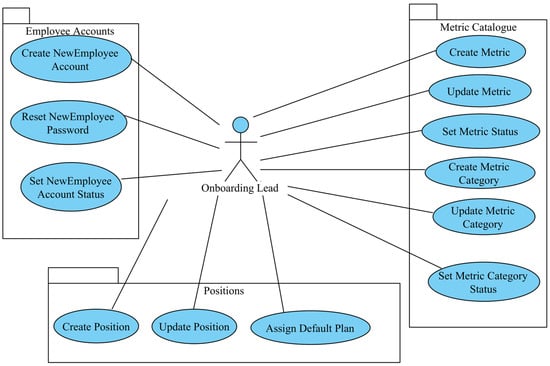
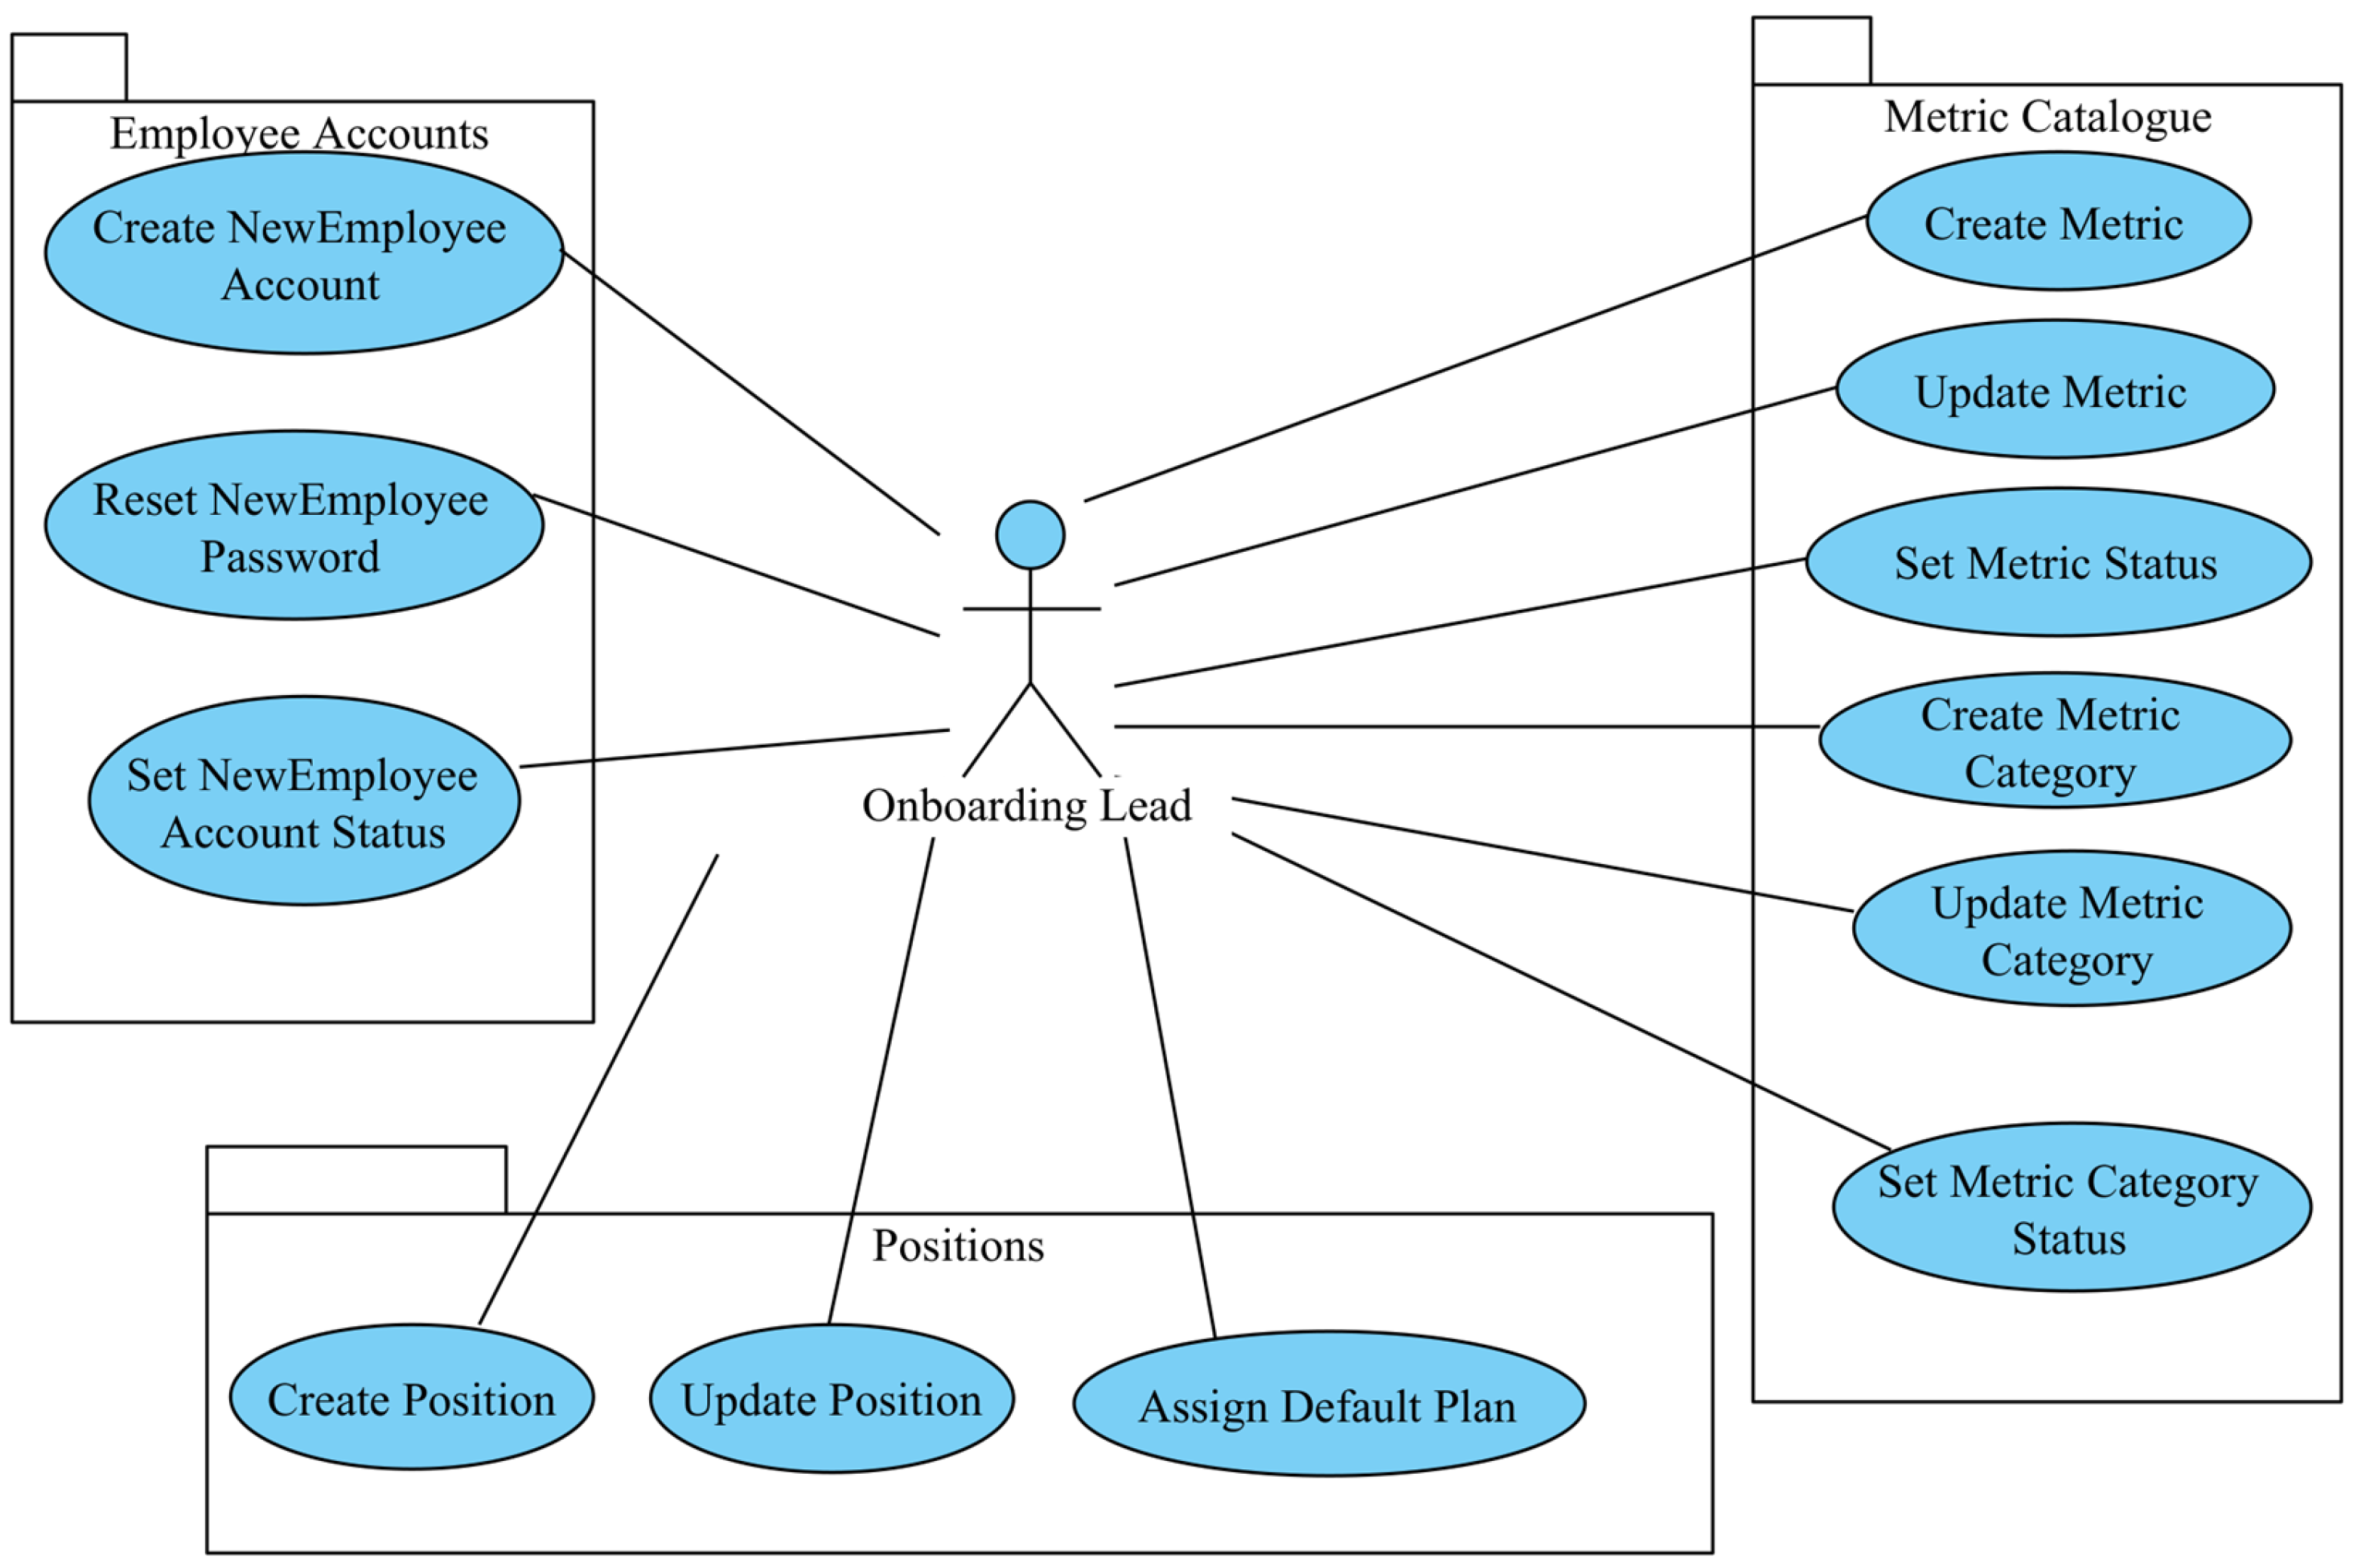
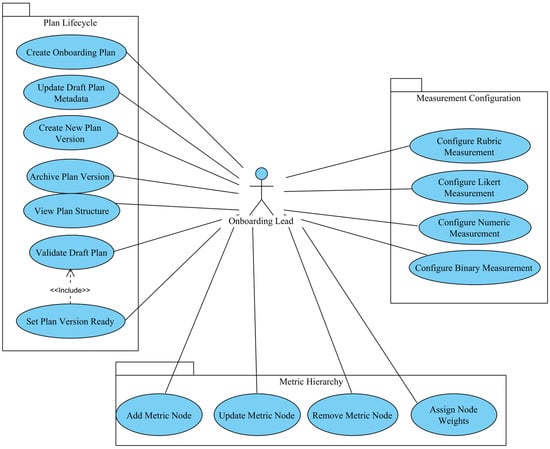
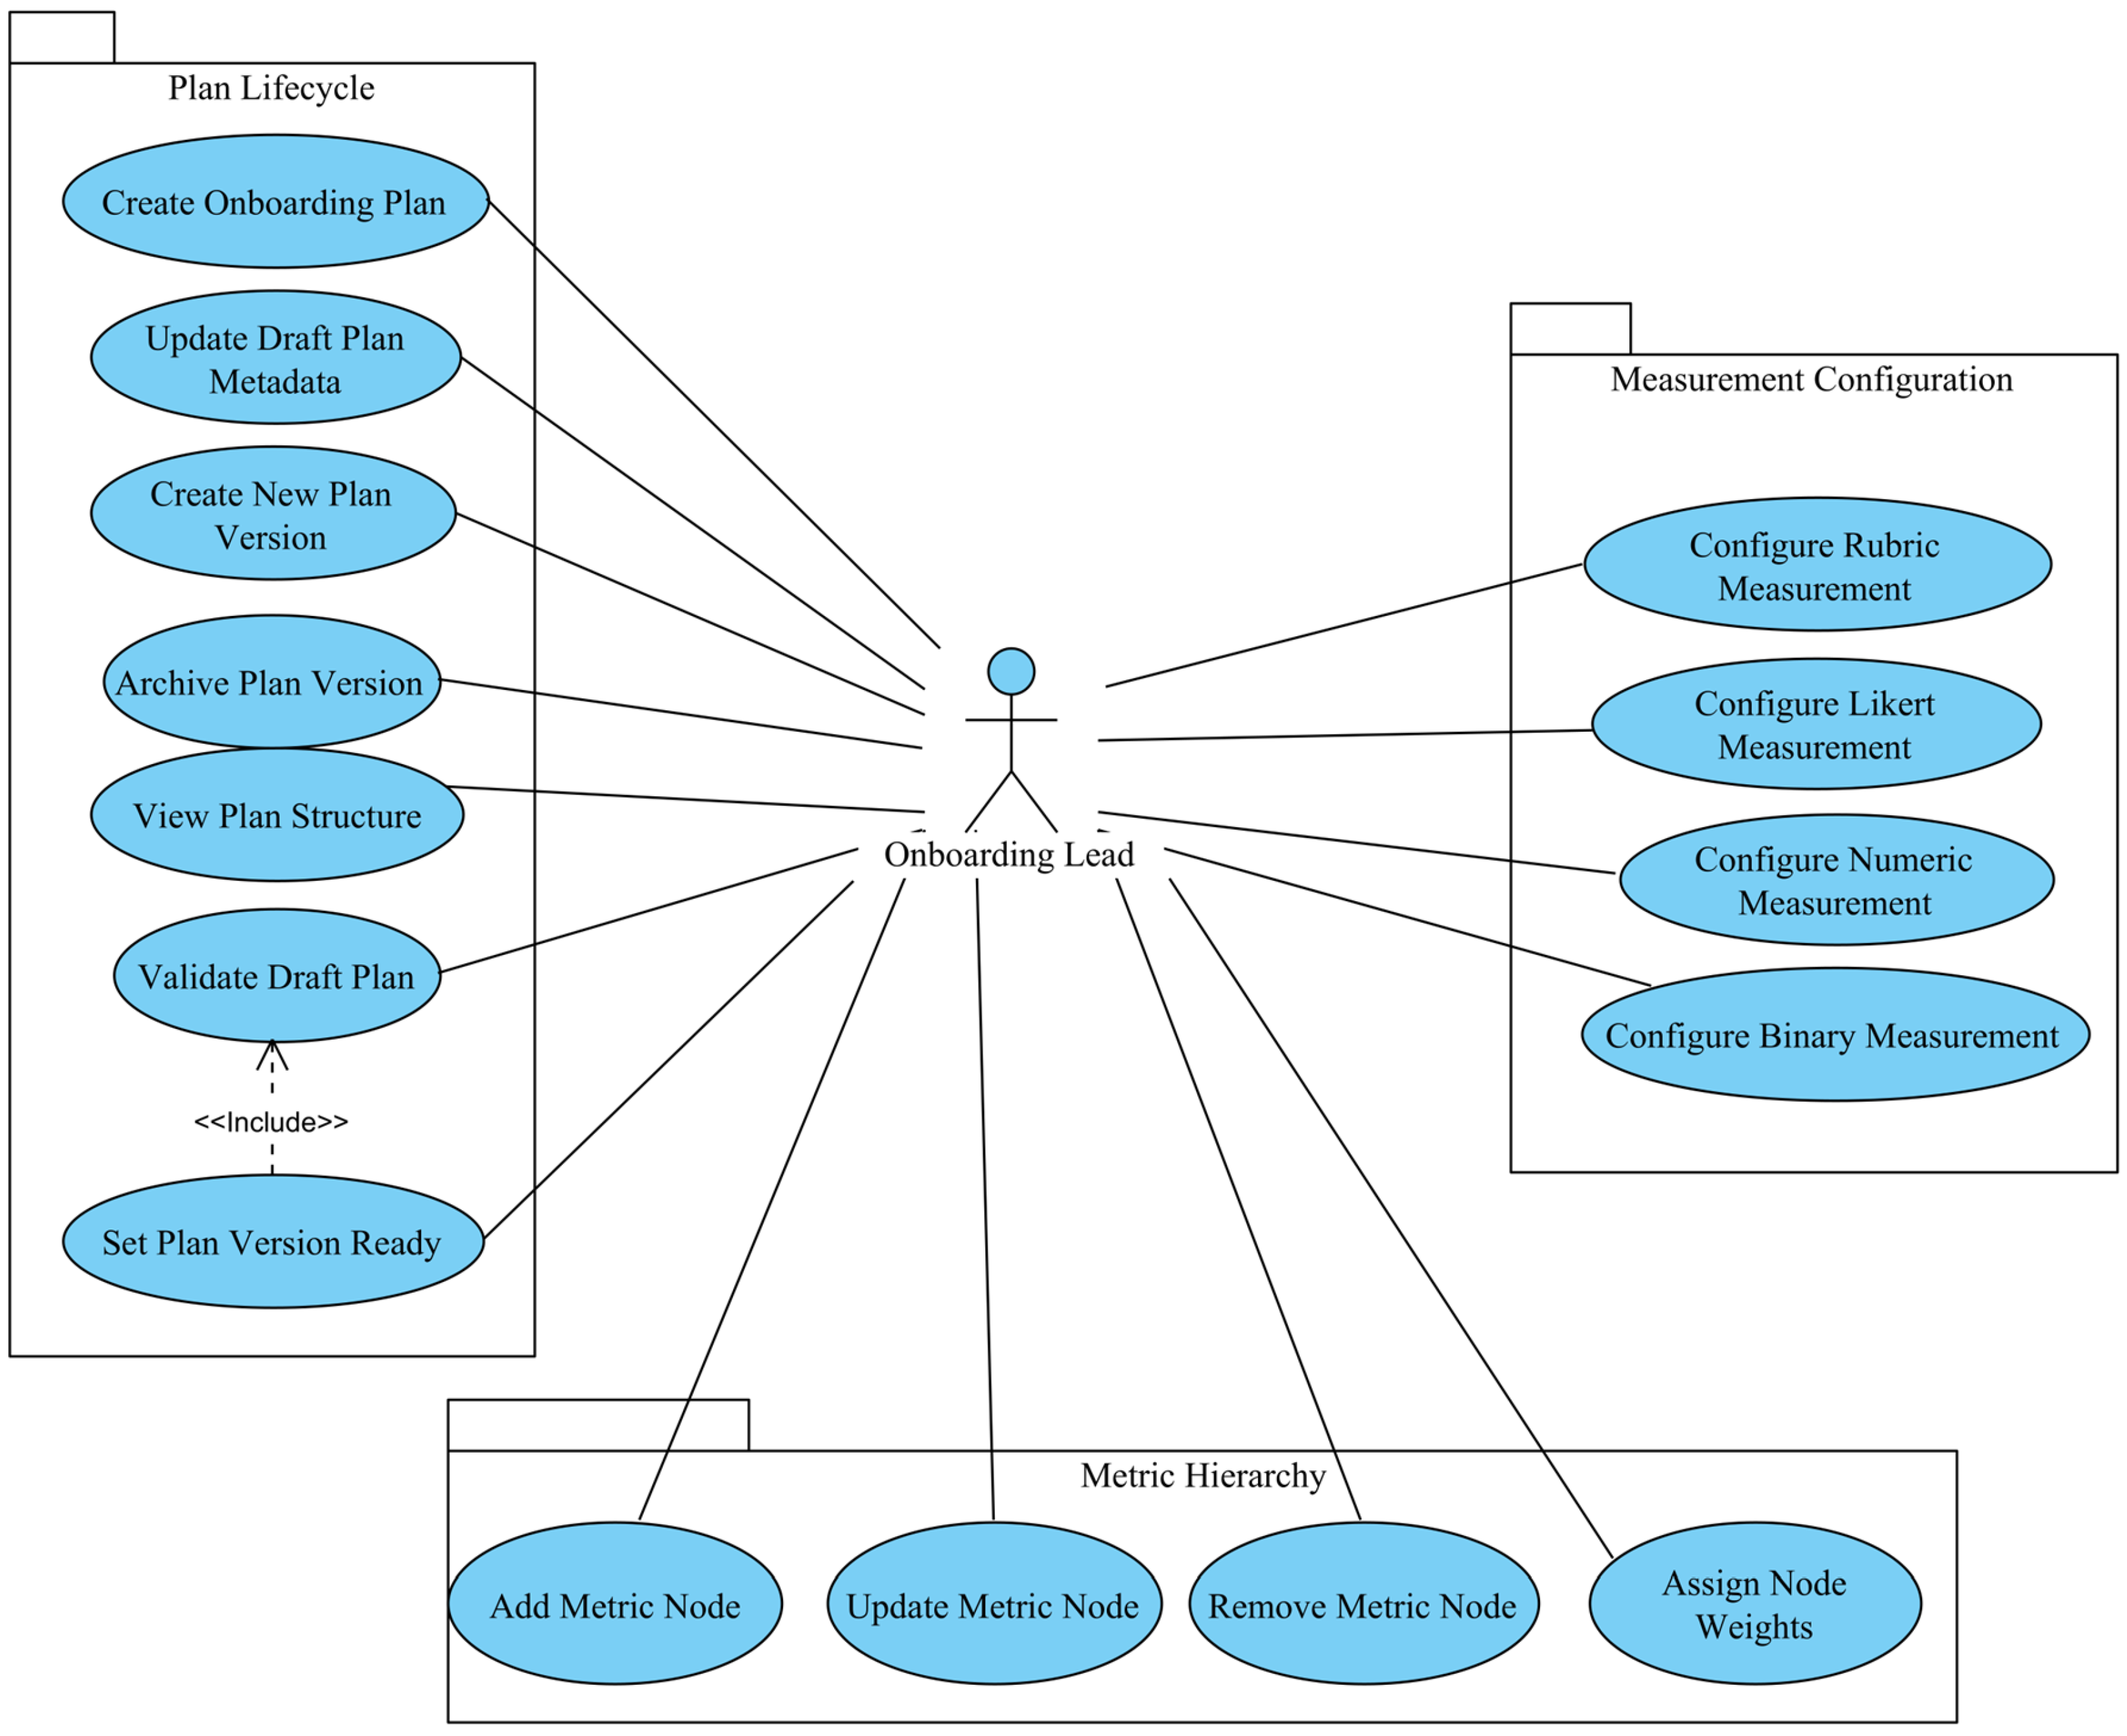
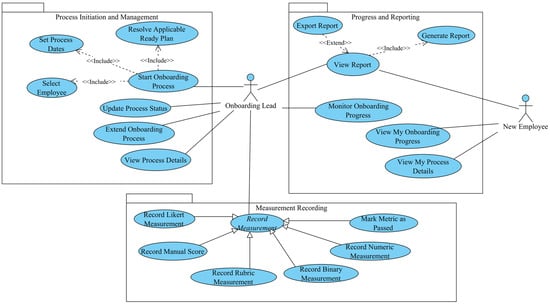
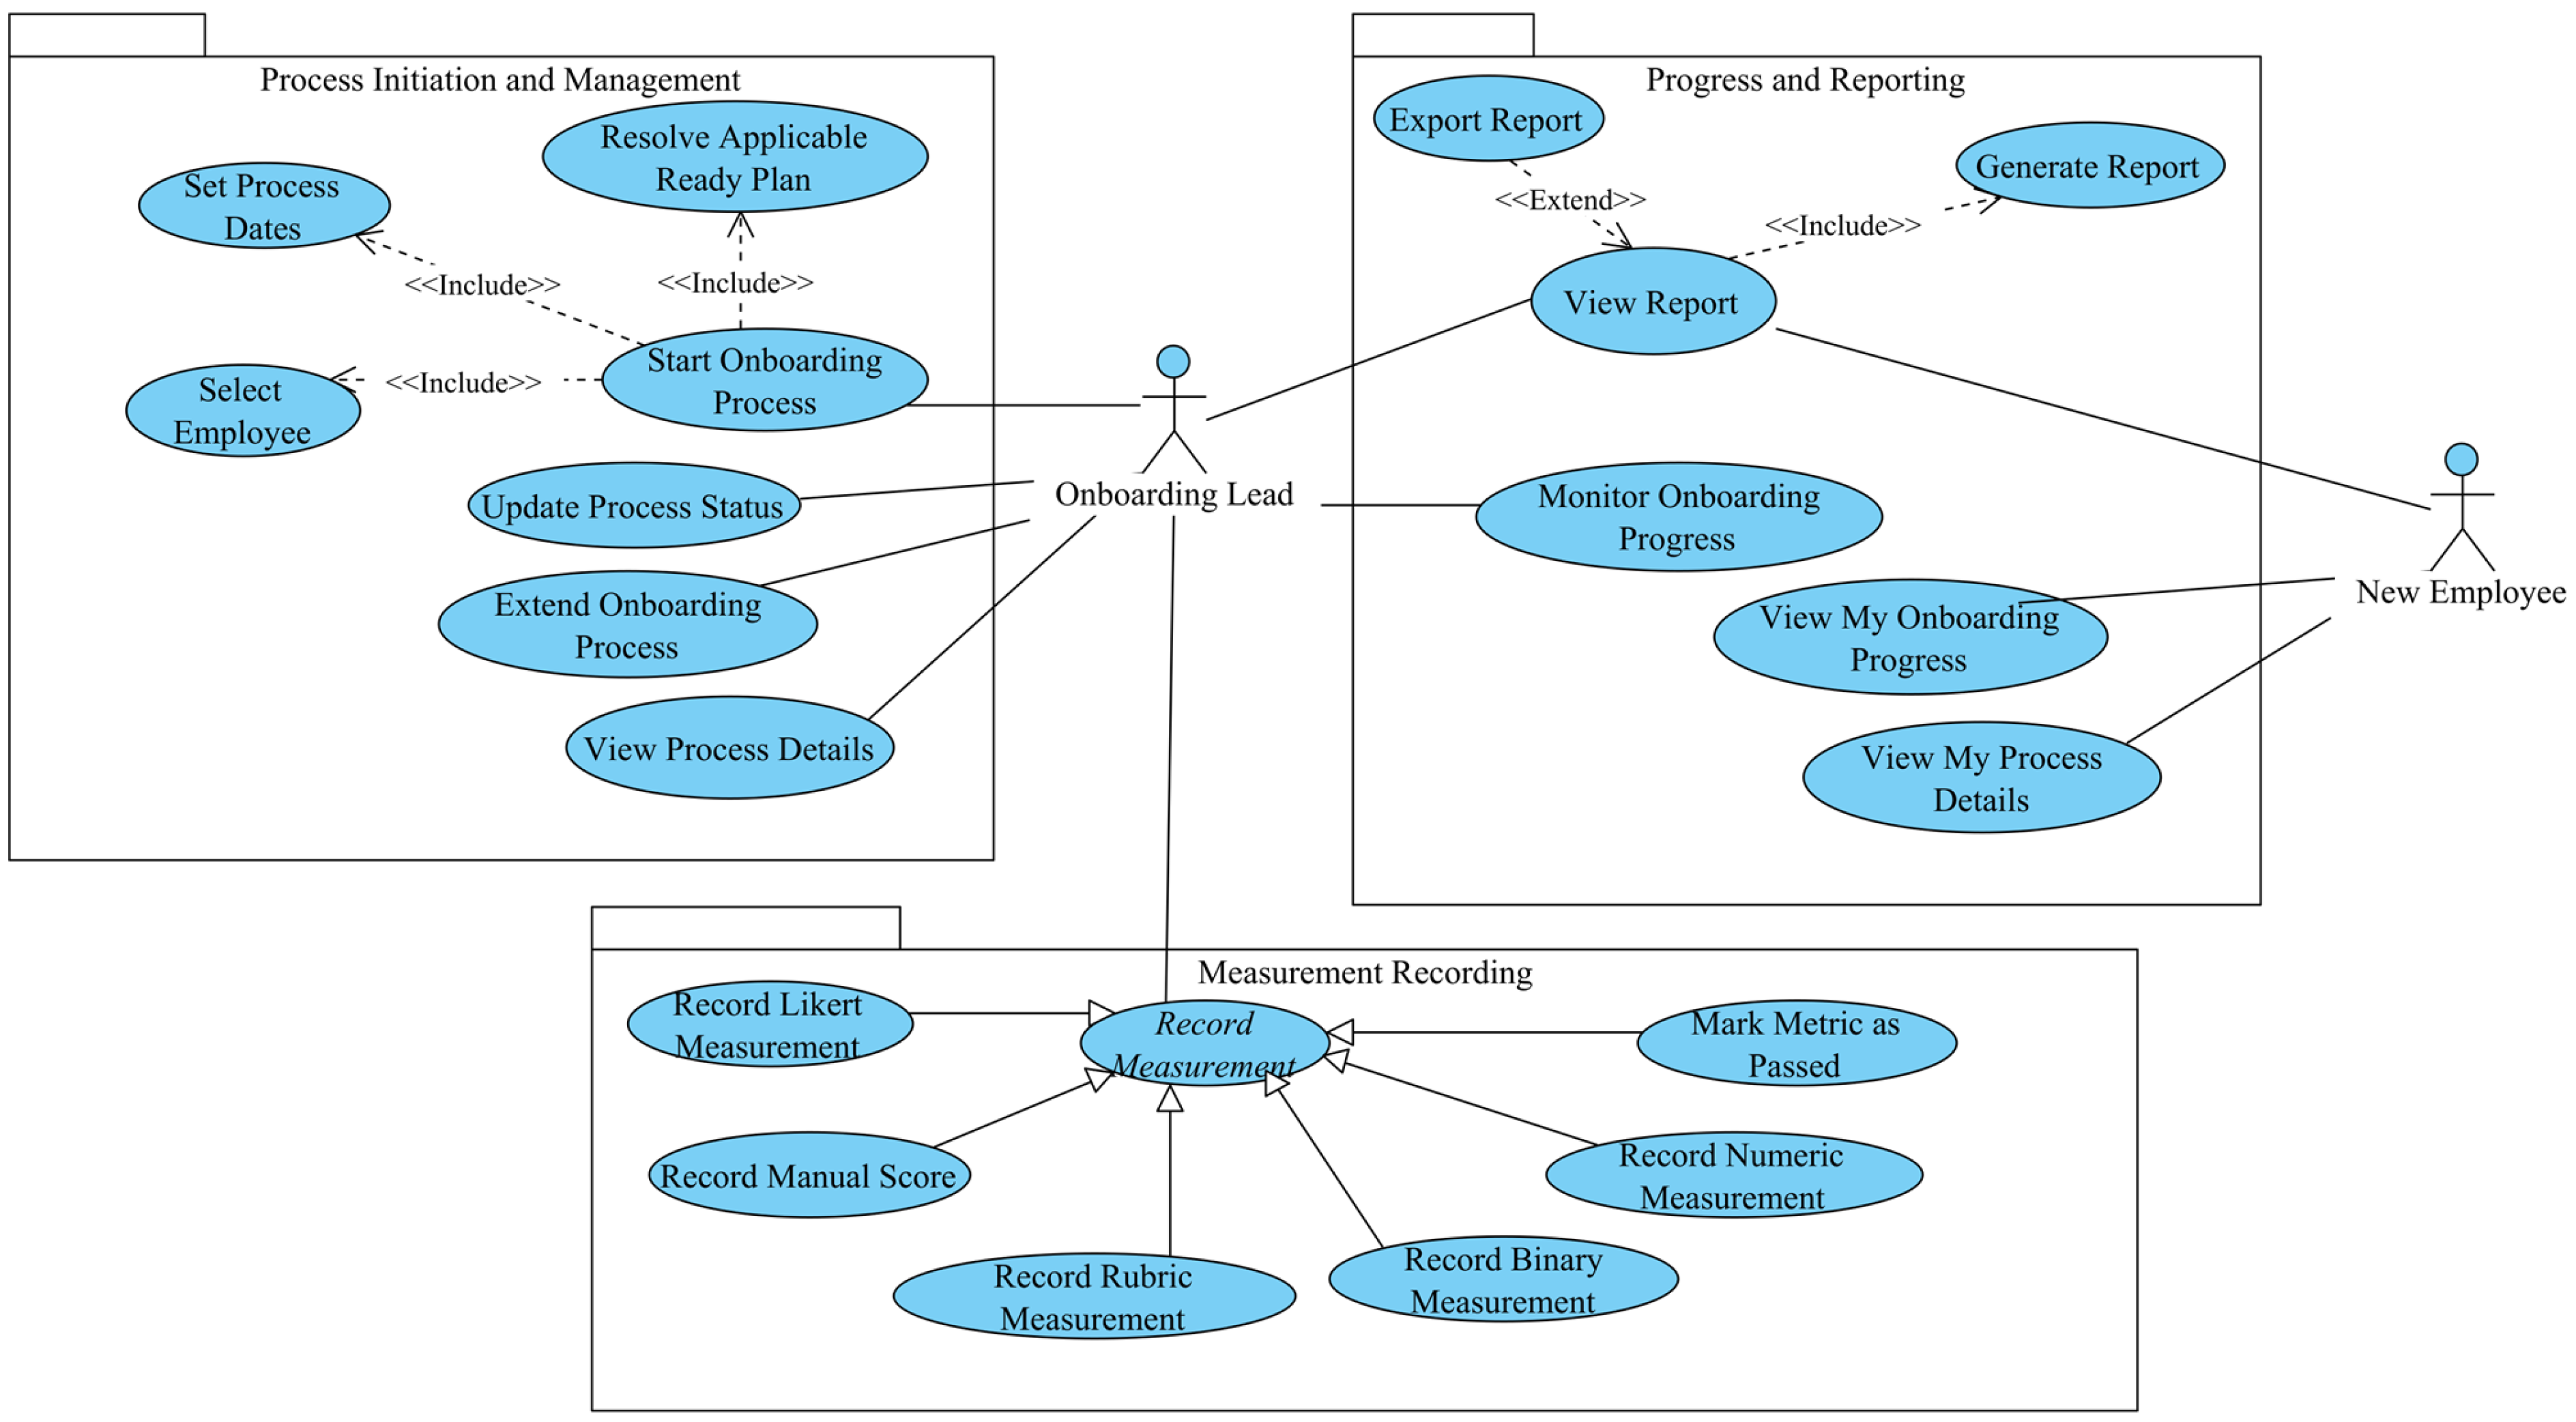
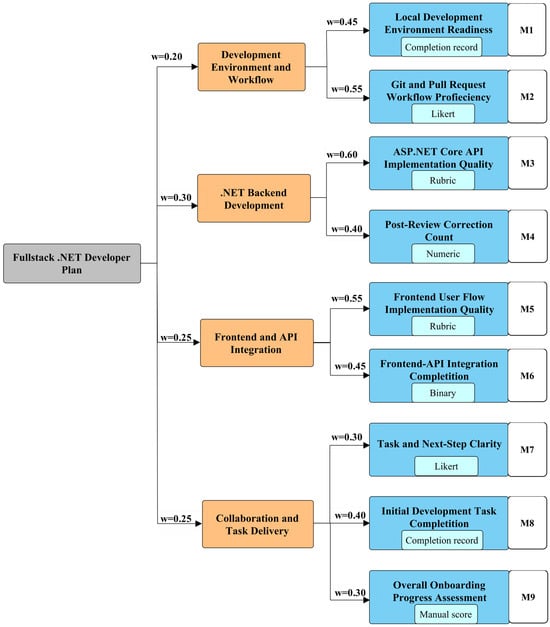
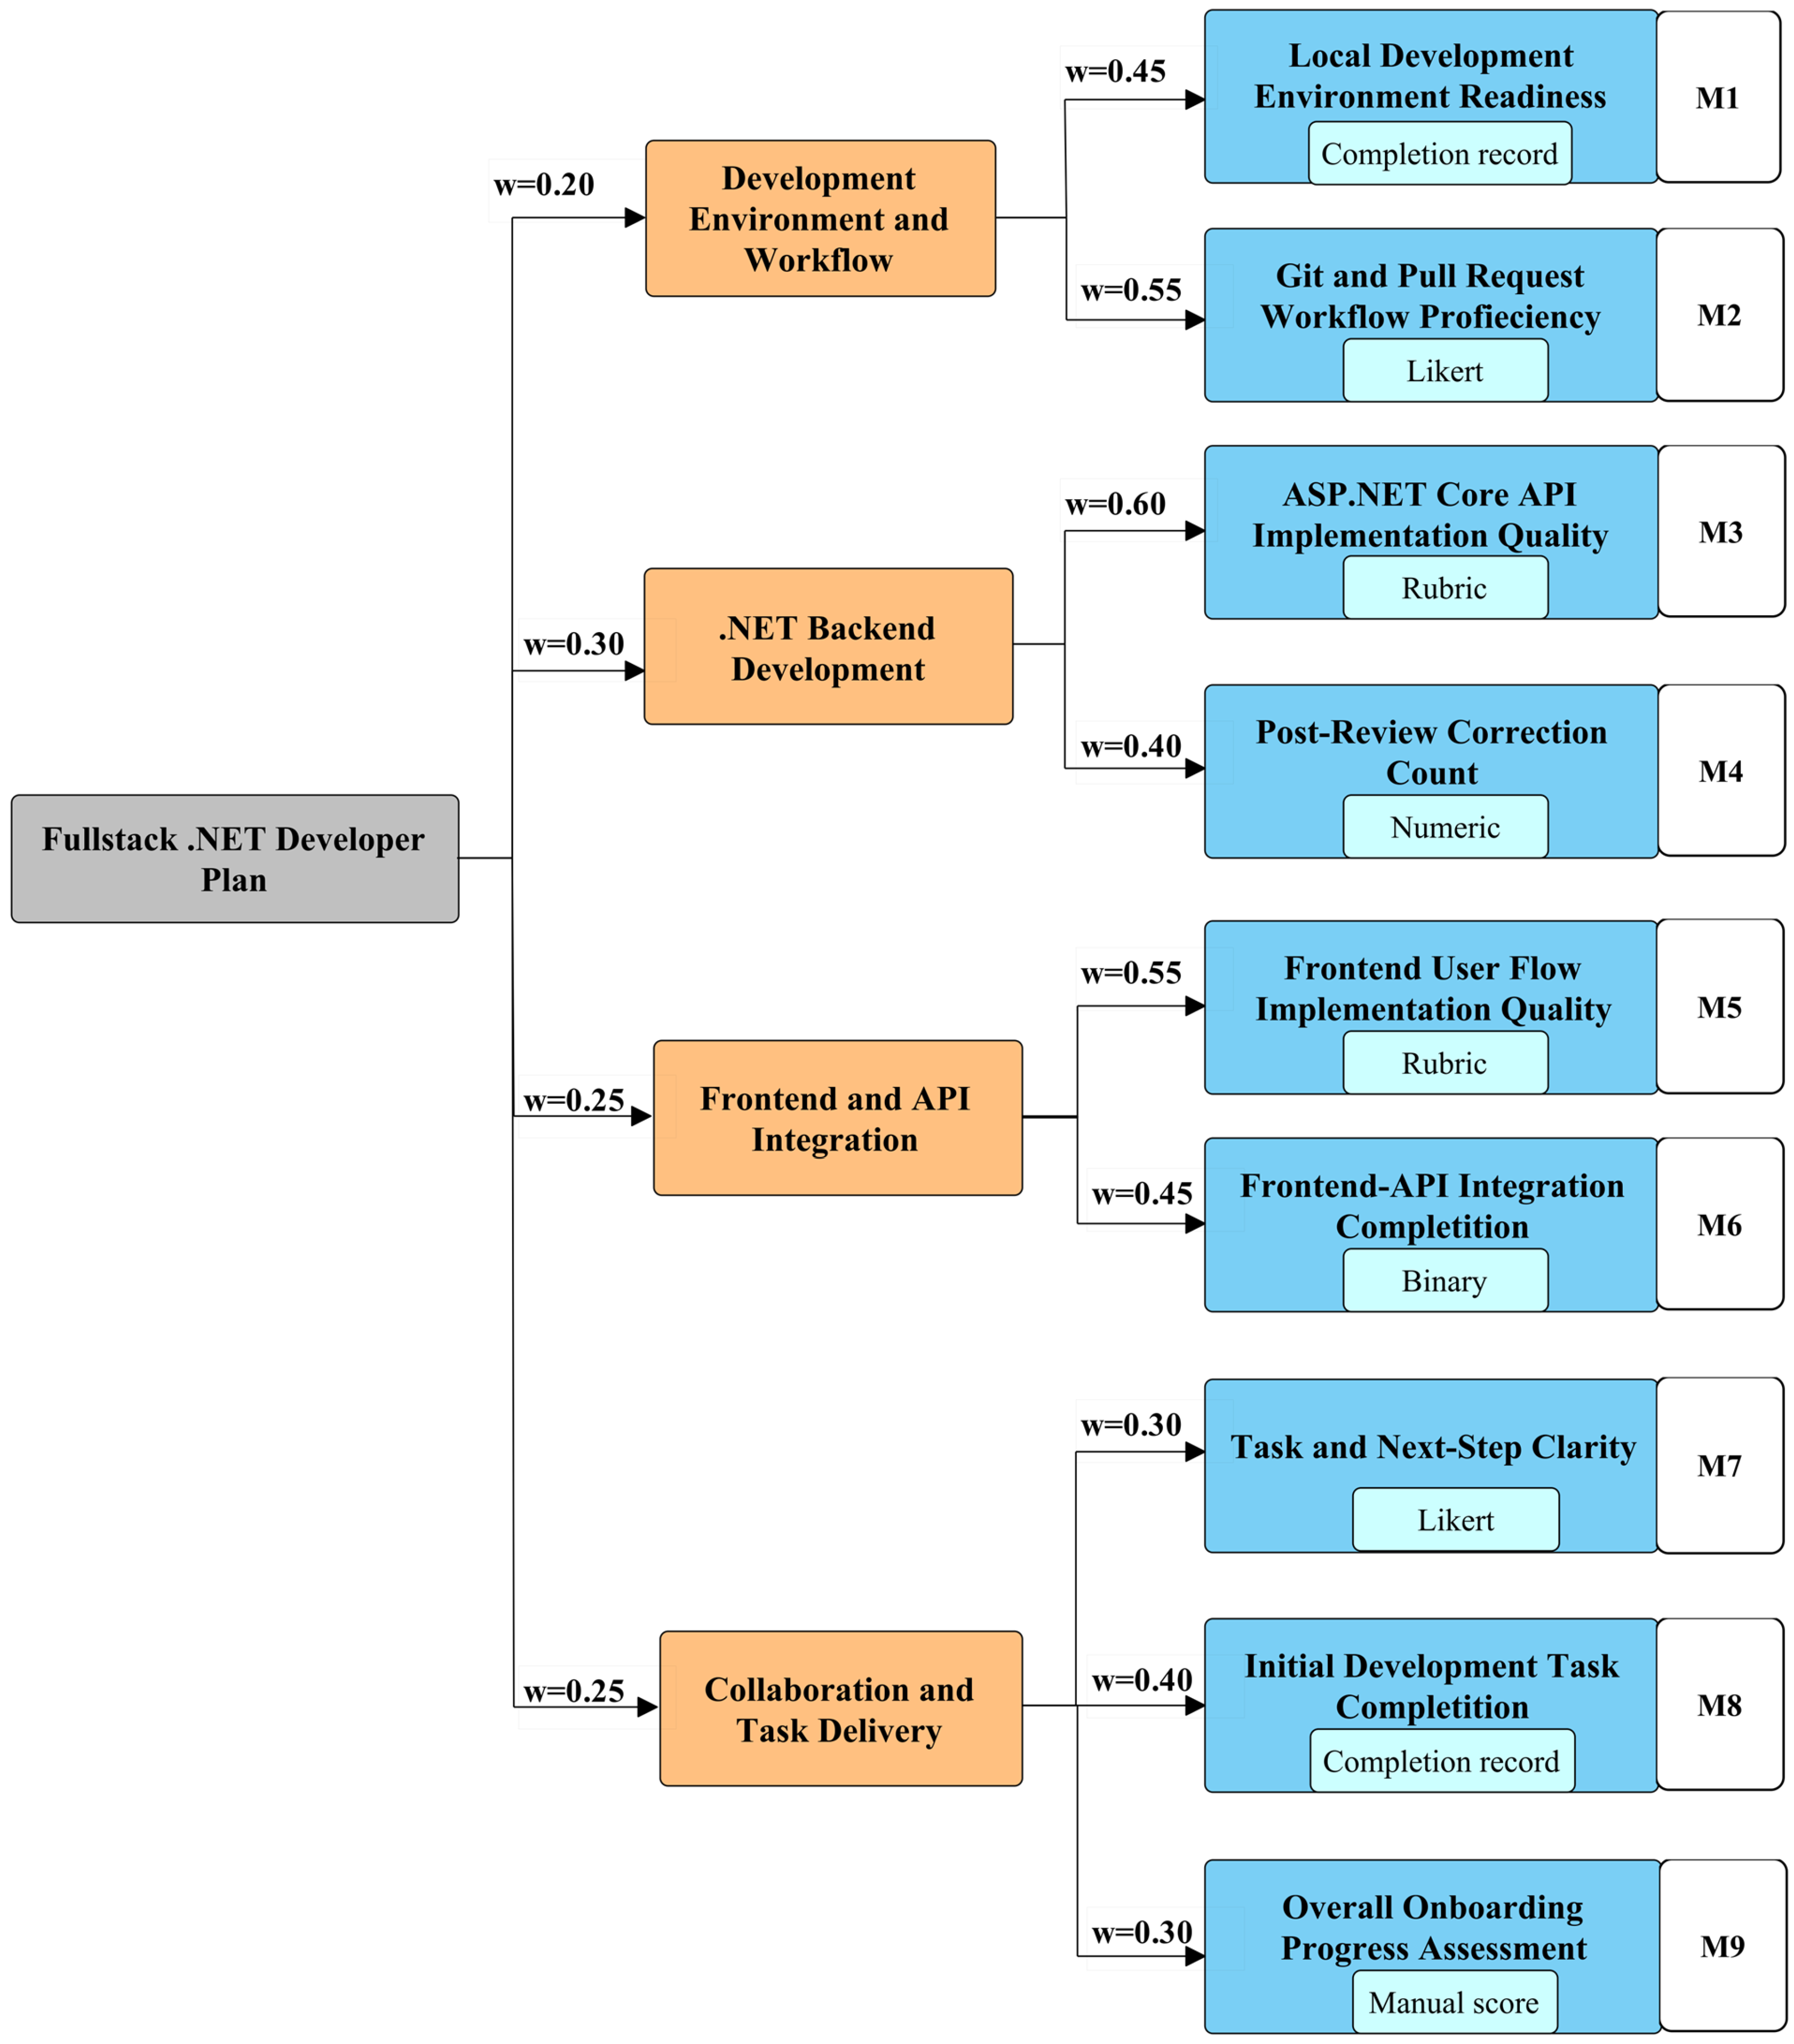

Disclaimer/Publisher’s Note: The statements, opinions and data contained in all publications are solely those of the individual author(s) and contributor(s) and not of MDPI and/or the editor(s). MDPI and/or the editor(s) disclaim responsibility for any injury to people or property resulting from any ideas, methods, instructions or products referred to in the content. |
© 2026 by the authors. Licensee MDPI, Basel, Switzerland. This article is an open access article distributed under the terms and conditions of the Creative Commons Attribution (CC BY) license.