


Abstract
Aim: Accurate assessment of human hydration status is crucial for maintaining physiological homeostasis and optimising performance. Traditional assessment methods require invasive blood sampling or time-consuming laboratory procedures for urine analysis. This study explores whether intermittent inferior vena cava (IVC) ultrasound (US) measurements respond to exercise-associated body mass loss and subsequent water intake. Methods: A cohort of 33 healthy young adults (17 females, 16 males) underwent a controlled experimental protocol comprising moderate-intensity exercise to induce dehydration, followed by a rehydration phase. Longitudinal US scans of the IVC were acquired at 10-min intervals during dehydration (five times) and at 2-min intervals after rehydration (three times). Quantitative physiological parameters, IVC diameter (D), caval index (CI), cardiac caval index (CCI), and respiratory caval index (RCI), were extracted from US data. Body mass was recorded at each dehydration sub-phase, with equivalent water volumes administered during rehydration to match mass loss. Results: At the group level, IVC diameter was lower after 10 min of exercise than at baseline and higher 4 min after water intake than at the end of exercise (both p < 0.01). Moreover, a Random Forest (RF) classifier achieved 76% leave-one-out accuracy in categorising subjects according to rehydration rate, utilising biometric data and IVC features obtained at the 10-min dehydration checkpoint. Conclusion: This investigation demonstrates that IVC US imaging offers a promising, non-invasive methodology for rapid hydration assessment. If validated in an extended cohort, it could have significant implications for personalised monitoring in sports medicine.
1. Introduction
Hydration represents a critical physiological condition that governs thermoregulation, cardiovascular function, and performance optimisation [1,2,3,4]. In this regard, water, which constitutes 50–75% of adult body mass, is distributed between the intracellular (65%) and extracellular (35%) compartments, with the latter further divided into intra- (20%) and extra-vascular (80%) portions. In particular, plasma, which comprises 90% water, serves as the primary medium for thermoregulatory cooling during exercise, highlighting its essential role in maintaining physiological homeostasis [5]. The balance of the body’s water faces significant challenges during physical exercise. During intense activity in hot and humid conditions, sweat loss can approach 3 L h−1 [6]. This substantial fluid depletion necessitates precise hydration management to prevent a cascade of adverse effects: cardiovascular strain, hyperthermia, performance decrements, cognitive impairment, and potentially life-threatening complications [1,2,7,8,9,10,11,12].
The implications in sport performance of suboptimal hydration status are well documented. Hypohydration demonstrably impairs physical capabilities across multiple domains, with meta-analytical evidence indicating reductions of approximately 2% in strength, 3% in power, and 10% in high-intensity endurance capacity [13,14]. A significant reduction in both muscle strength (5.5 ± 1.0%, mean and standard deviation (STD), respectively) and aerobic power (5.8 ± 2.3%) due to hydration deregulation has been documented [15]. Under heat stress conditions (ambient temperature > 30 °C), dehydration representing 2–7% of body mass impairs endurance performance by 7–60% [9]. Meta-analysis reveals that dehydration-induced cognitive impairments become significant when body mass loss exceeds 2% [11,16]. To attenuate the deleterious effects of dehydration on endurance capacity, fluid replacement protocols should aim to maintain fluid losses below 2% of body mass, which is typically achievable by fluid intake rates of approximately 1 L h−1 or lower [9,17].
Despite its physiological significance, current hydration assessment paradigms remain problematic. These methods predominantly employ invasive, laboratory-dependent techniques that require blood and urine analysis, underscoring the pressing need for fast and non-invasive methodologies [1,7,10,18]. The Weight-Urine-Thirst (WUT) protocol represents one approach to self-monitoring hydration status [8]. The latter uses a tripartite assessment framework: acute body mass reduction (>0.5– kg), increased urine chromacity, and increased perception of thirst. Euhydration is compromised when two or more indicators manifest, requiring strategic fluid and electrolyte intervention [8,19,20]. Although the WUT methodology offers a pragmatic alternative when sophisticated physiological assessments remain inaccessible, it exhibits substantive limitations. Its protocol provides only retrospective information on hydration rather than continuous physiological monitoring during exercise and recovery. Furthermore, the inherent subjectivity in the assessment of chromacity and the interpretation of thirst introduces methodological variability that compromises the precision of the measurement. These constraints highlight the need for more objective, real-time, non-invasive hydration monitoring solutions [7].
Ultrasound (US) imaging of the inferior vena cava (IVC) presents a compelling opportunity to address these limitations through real-time hydration monitoring because its diameter may respond to exercise-related haemodynamic changes and fluid intake. The IVC, which returns blood from the sub-diaphragmatic regions, accounts for approximately 80% of the total venous return to the heart. It shows measurable diameter fluctuations that potentially reflect dynamic changes in hydration status. Its use is well established in the clinical assessment of patients’ hydration status [21], but it has rarely been investigated in sports-related applications [22,23]. Given the important role of the IVC mentioned above, this paper aims to investigate whether the dynamic morphological plasticity of the IVC can reflect hydration perturbations during the execution of moderate-intensity exercise. We hypothesise that the diameter of the IVC can change during the exercise and water-intake protocol, and its tracking could provide a real-time estimation of participants’ hydration status, with superior temporal resolution compared to the conventional methodologies mentioned above. Furthermore, we explore the possibility that dehydration-phase vascular dynamics may contain predictive signatures regarding individual rehydration efficiency, a finding with profound implications for personalised hydration strategies in both clinical and performance contexts. It is worth mentioning that this work significantly extends our previous research in this domain [24].
2. Materials and Methods
A total of 33 healthy participants were enrolled (mean ± STD, years old, body mass kg, height m, 17 females and 16 males). To ensure that the volunteers were in the most homogeneous conditions possible, they were asked to consume at least 2 litres of water and refrain from smoking and drinking alcohol the day before the experiment. Participants were instructed to present themselves in a fasting state for a minimum of 2 h to prevent excessive blood flow to the digestive organs located near the IVC. The study was conducted in accordance with the Declaration of Helsinki, and all participants signed an informed consent form before the beginning of the experiment. The study protocol was approved by the Ethical Committee of Politecnico di Torino (Approval number: 41392/2024).
To simulate a moderate-intensity physical activity scenario, we asked the participants to run on a Reharunner 02 treadmill (Chinesport S.p.A., Udine, Italy). The acquisitions were conducted in a laboratory with thermoneutral conditions, with temperature ranging from 19 to 25 °C and relative humidity between 20 and 50% (temperature and relative humidity were measured with ThermoPro TP49, temperature resolution ±0.5 °C, humidity resolution ±3%). Participants’ mass was measured using a high-resolution body mass scale (G&GPSE-150, resolution of 20 g). During the mass measurements, participants did not wear their shoes. US videos were acquired using the MicrUs Ext-1H system with a C5-2R60S-3 convex probe (Telemed Medical Systems s.r.l., Milano, Italy), at a frame rate of fps (mean ± SD). The frequency range was 2–5 MHz, and the imaging depth ranged from 120 to 180 mm. The MicrUs Ext-1H was connected via USB to a Dell XPS workstation (Dell Technologies Inc., Round Rock, TX, USA) equipped with an Intel i7-8850 processor (2.6 GHz) and 32 GB RAM. ECHO WAVE II (version 4.3.0) was used for US system management and data acquisition. Heart rate was continuously monitored via chest strap.
2.1. Experimental Protocol
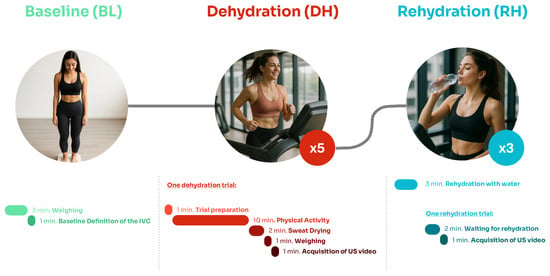
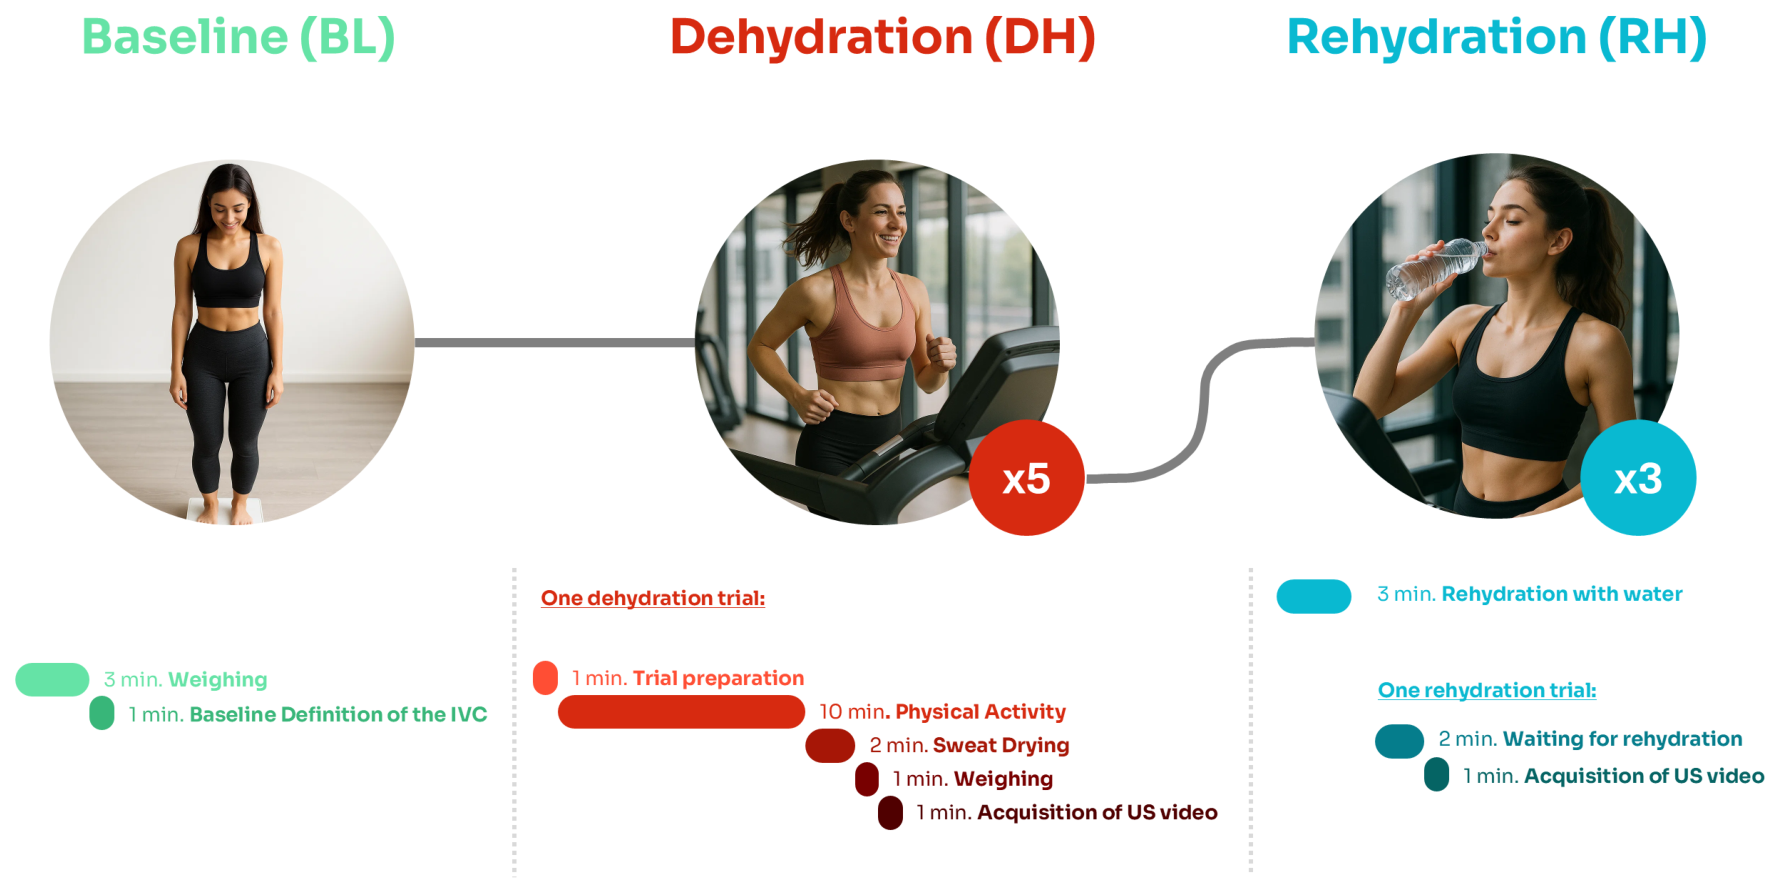
Participants underwent an experimental protocol to acquire US videos of the IVC before and after moderate-intensity activity. Subjects wore standard athletic attire consisting of a T-shirt and shorts throughout the study. The experimental protocol is shown in Figure 1 and comprised three distinct phases: baseline (BL), dehydration (DH), and rehydration (RH).
Figure 1.
Experimental protocol. The procedure encompasses three sequential phases: (1) baseline (BL); (2) dehydration (DH), consisting of five iterative cycles (10-min controlled physical exertion followed by physiological measurements); and (3) rehydration phase (RH) with three standardised fluid replenishment intervals. Each component includes precise temporal parameters and methodological specifications, with ultrasonographic data acquisition at specific transition points. The total protocol duration was approximately 90 min.
During BL, the body mass of the participants was recorded, along with US videos of the IVC in the longitudinal plane. The first US videos served as a comparative reference for subsequent measurements for each subject. All US acquisitions were performed using a subxiphoid approach, with subjects lying supine on a medical examination couch during normal respiratory cycles. The DH phase started with a preparatory step, which allowed participants to remove residual US gel from the previous session. They then completed a structured 10-min treadmill exercise, set at a 10% incline and a velocity of 5 km h−1. Upon completion, participants dried their sweat using a towel before undergoing a mass reassessment and additional US acquisition. This sequence was repeated five times. At the beginning of the RH phase, participants drank water equivalent to their measured mass loss from the preceding phases. This calculation assumed that the observed mass reduction was entirely attributable to fluid loss via perspiration, as participants maintained consistent clothing and abstained from restroom use throughout the protocol. Following fluid intake, US imaging was performed at three time points at 2-min intervals. US data were collected during the final 30 s of the 1-min measurement period, after participants had stabilised in the supine position. Participants remained seated between acquisitions to minimise possible haemodynamic redistribution that could compromise the precision of the measurement.
2.2. IVC Diameter Evaluation
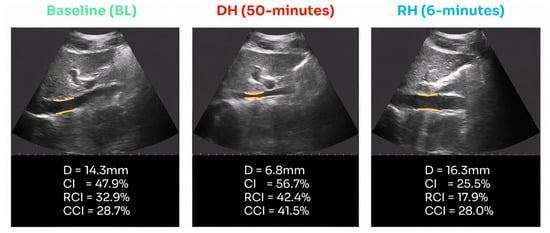
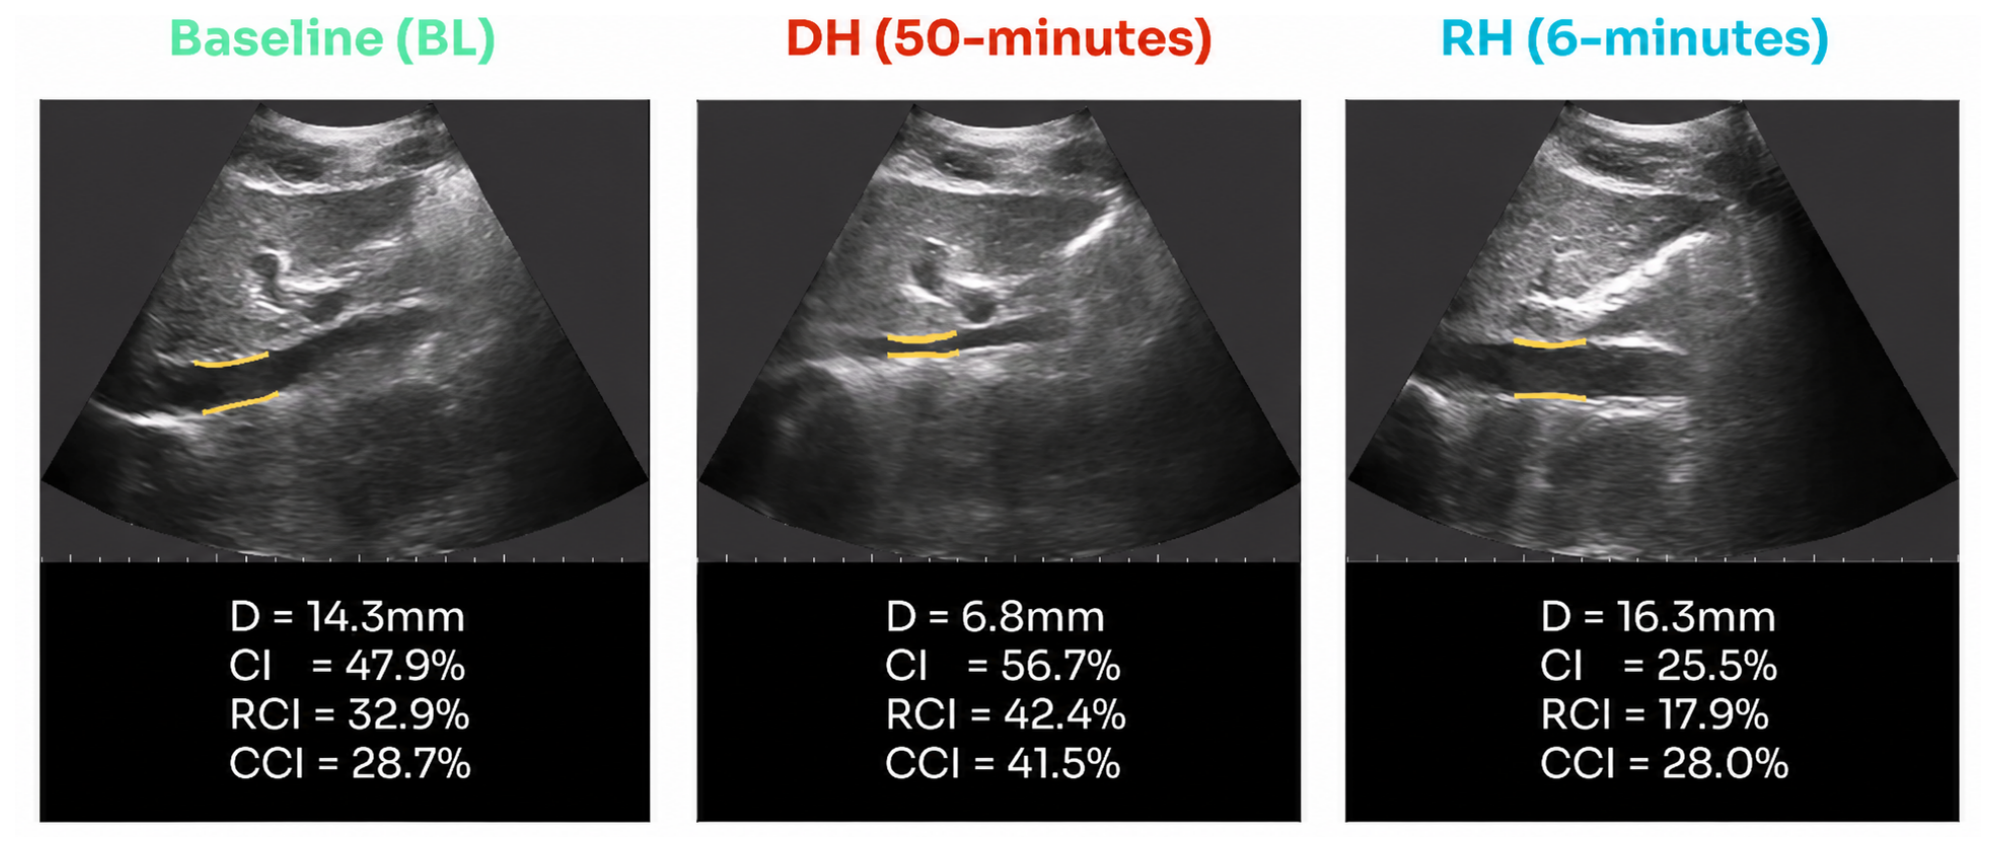
US imaging was used to characterise the dynamic behaviour of the IVC. The analysis was conducted using proprietary software developed by VIPER s.r.l. (Turin, Italy), which enables automated vessel segmentation; the reader is referred to [25,26] for further details on the algorithm implementation. The software facilitates real-time extraction of the IVC diameter for each video frame while continuously tracking a fixed vascular region to minimise drift artefacts that could affect measurement precision [27,28], as shown in Figure 2.
Figure 2.
Representative US assessment of IVC dynamics across experimental phases of subject 26. For each phase, BL, DH (50 min) and RH (6 min) longitudinal US images are shown. Mean values of IVC diameter D, caval index , respiratory caval index , and cardiac caval index were extracted from the segmented region demarcated by the yellow borders.
IVC boundaries were delineated by sampling across 21 intersecting directions, ensuring robust edge estimation. The extracted diameters were subsequently averaged to obtain a single resilient diameter value (D) per frame.
From the temporal series of D, both respiratory and cardiac modulations were derived. The respiratory diameter component () was computed via empirical mode decomposition, considering the first intrinsic mode function. The cardiac component () was subsequently extracted by subtracting from the initially estimated diameter and adding a constant C (mean diameter) to avoid negative values:
2.3. Collapsibility Indexes
The caval index () is a typical parameter used to assess the haemodynamic status of patients [21,29]. It is defined as the ratio of the range of the IVC size to its maximum. Here, it was estimated as the difference between the interpolated maxima and minima of the vessel diameter divided by the interpolated maxima:
where is the interpolation of the maxima of the diameter over time and is the interpolation of the minima. By interpolating maxima and minima, it was possible to estimate for each frame more robustly [21].
The same formula can also be applied to and to obtain the respiratory and cardiac caval index ( and , respectively) [21]. These indexes provide valuable insights into the collapsibility of the IVC.
2.4. Repeatability of IVC Diameter Measurement
To assess the repeatability of US videos and diameter measurements, a separate test was implemented in which the IVC was analysed in resting conditions. Participants remained in a supine position for 10 min to facilitate blood redistribution and ensure stabilisation of venous diameter across repeated measurements. Subsequently, four consecutive US videos of the IVC were acquired in long-axis view and processed.
Repeatability analysis was conducted on 11 subjects who were not included in the primary dataset. For each video, the median diameter was extracted, and the STD of the four median values per subject was calculated [30,31]. Furthermore, the intraclass correlation coefficient (ICC) was calculated as a measure of consistency, based on two key statistical parameters: the mean square between subjects () and the mean square within subjects (), defined as:
where i indicates the subject, N the total number of subjects, k the number of observations, the mean diameter, the global mean diameter, and the measurement of the diameter for observation j of subject i.
2.5. Rehydration Time Evaluation
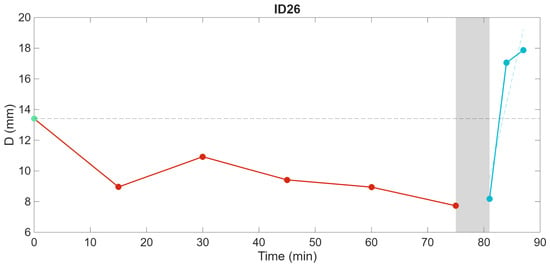
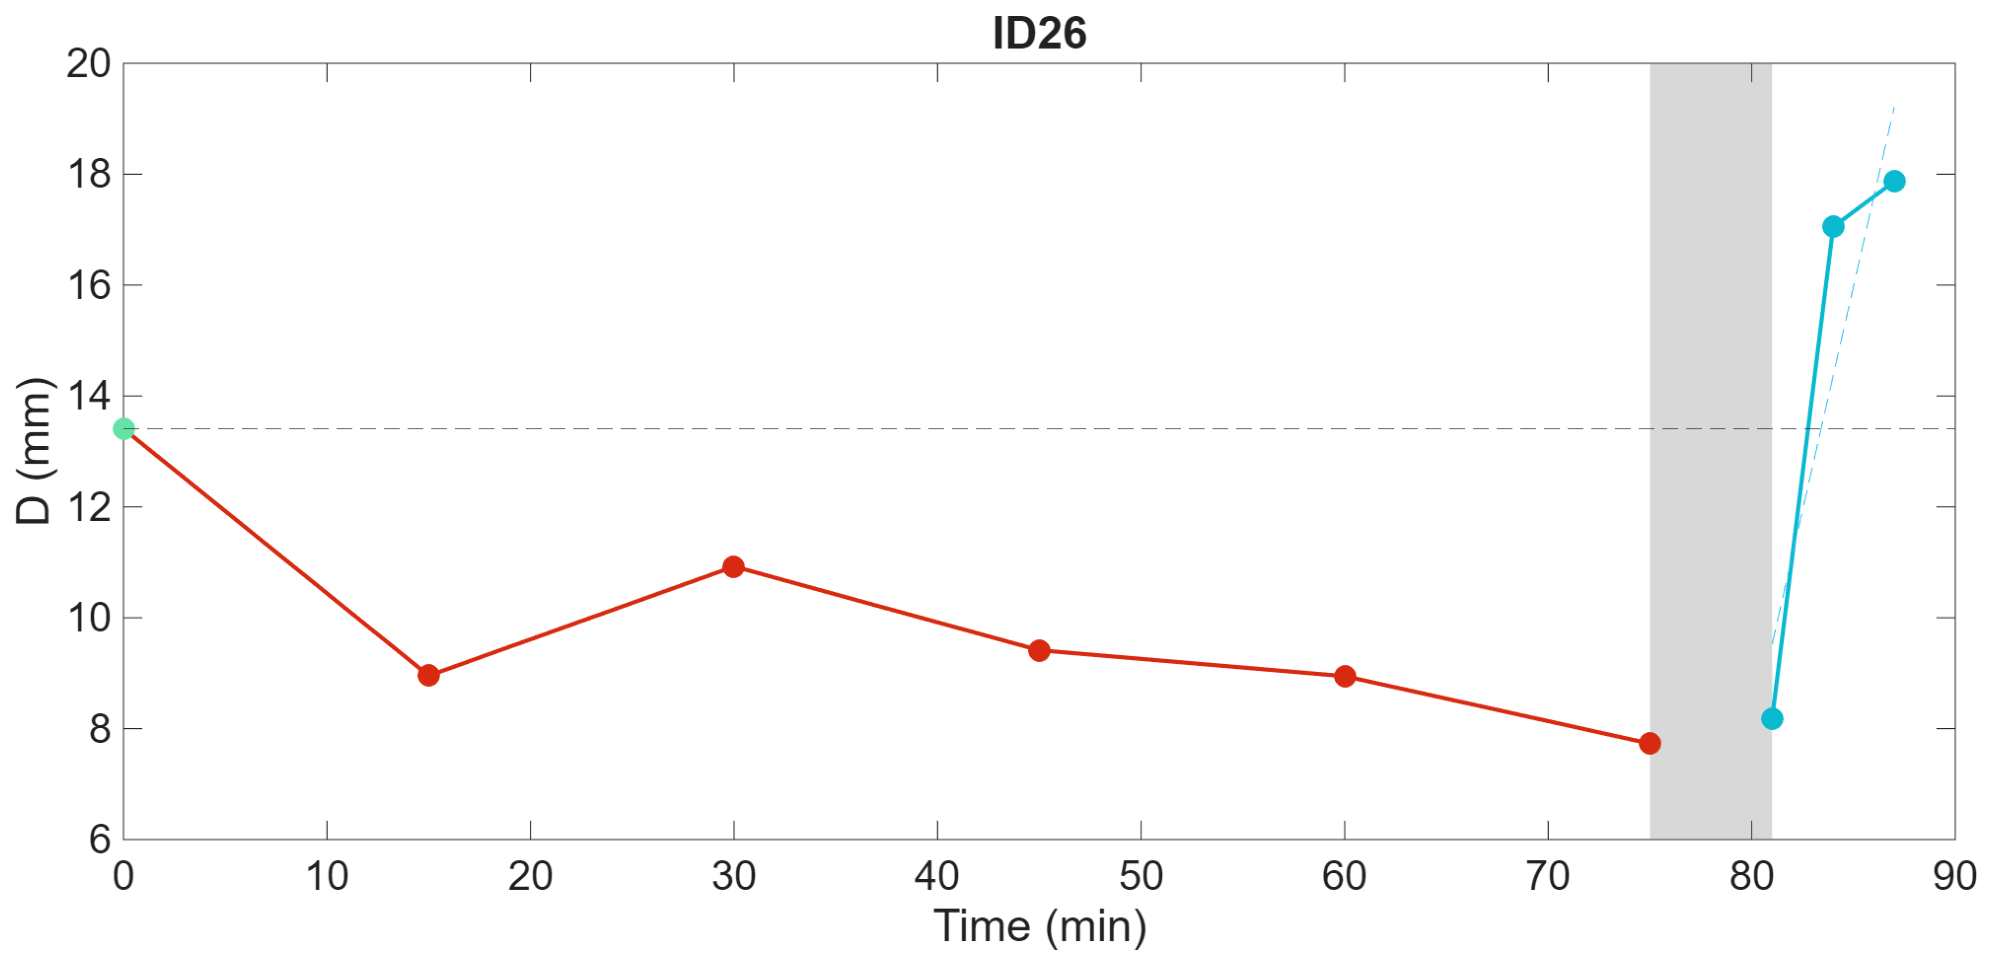
We stratified subjects into two equally sized groups based on rehydration response time, defined as the time required for the IVC diameter to return to BL values. We estimated individual rehydration times by linearly interpolating sequential IVC diameter measurements during the RH phase, with the time at which the interpolation crosses the baseline IVC diameter representing rehydration completion. An example is shown in Figure 3. In the cases in which the IVC diameter did not return to BL values within 6 min, linear extrapolation was applied.
Figure 3.
Temporal variation of IVC diameter returning to baseline values over time for subject 26 (24 years old, body mass 73.56 kg, height 1.79 m). The x-axis represents time (minutes), whereas the y-axis depicts the diameter (millimetres). The transition phase is marked by a shaded region, highlighting the shift from DH to RH.
We used a random forest (RF) ensemble learning method consisting of 200 decision trees for the classification task. The RF algorithm was selected due to its robustness against overfitting and its ability to handle high-dimensional data without feature scaling [32]. To train the RF, the following variables were used: body mass, D, minimum D, maximum D, , , , mean heart rate (HR), and body mass index (BMI). The method was implemented in MATLAB® (R2025a, MathWorks, Inc., Natick, MA, USA), and validated with a leave-one-out cross-validation.
2.6. Statistical Analysis
Statistical analyses were performed using MATLAB® (R2025a, MathWorks, Inc., Natick, MA, USA). To assess differences between protocol phases, a one-way repeated-measures ANOVA was conducted on log-transformed data to account for potential deviations from normality. Sphericity was evaluated using Mauchly’s test, and the normality of residuals was assessed with the Lilliefors test. When sphericity was violated, the Greenhouse–Geisser correction was applied. Significant effects revealed by the ANOVA were followed by post hoc pairwise comparisons using paired t-tests. When data distributions deviated from normality, paired comparisons were conducted using the Wilcoxon signed-rank test. p-values were adjusted for multiple comparisons using the Holm-Bonferroni method. For all analyses, the significance level () was set at 0.05.
3. Results
3.1. Dehydration and Rehydration Analysis
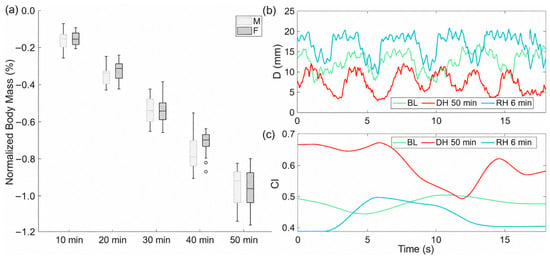
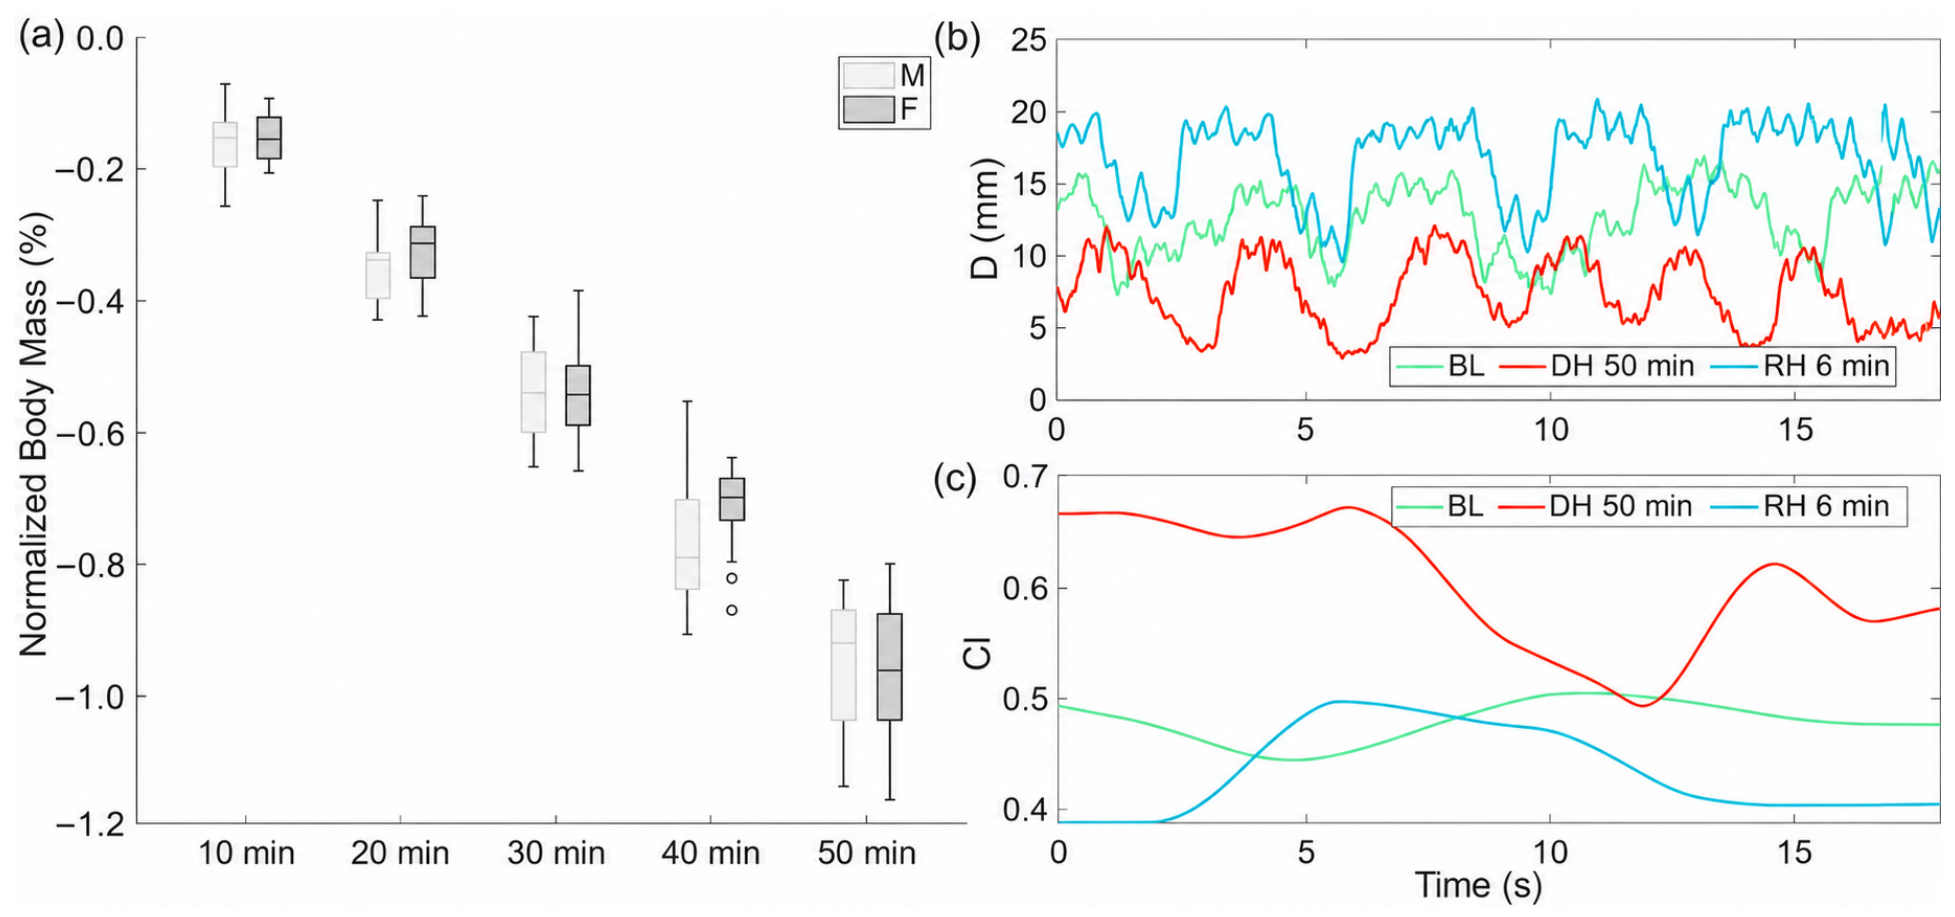
As expected, participants showed mass loss during the DH phase (see Figure 4a). Absolute mass loss ranged from 0.5 to 0.7 kg across participants, corresponding to approximately 500–700 mL of fluid loss. After 50 min from the start of the experiment, participants showed a reduction in mass between and %, suggesting that the chosen experimental protocol was able to reproduce the water loss that typically occurs with moderate physical activity [9,33]. No significant difference in mass loss was observed between men and women (Mann–Whitney U test, ; Figure 4a).
Figure 4.
(a) Sex-stratified (M = male, F = female) analysis of progressive mass loss (percentage change from baseline) during sequential dehydration intervals (10, 20, 30, 40, and 50 min). (b) Representative US-derived D measurements from a single participant (ID 26) across experimental conditions: BL, DH at 50 min (peak dehydration), and RH at 6 min. Mean D values for each condition are presented in the adjacent panel to facilitate comparative analysis. (c) Corresponding quantification demonstrating respiratory-induced variations in IVC dimensions across identical experimental conditions.
Temporal fluctuations in D and are shown in Figure 4b,c, presenting exemplary data from participant 26. Figure 4b illustrates D measurements captured over an 18-s acquisition window during three discrete physiological states: BL, DH at 50 min (maximal dehydration), and RH at 6 min (maximal rehydration). Similarly, Figure 4c depicts the parallel temporal evolution of values under identical experimental conditions.
As hypothesised, maximal dehydration induced a significant reduction in D from baseline, with restoration observed during maximal rehydration. This pattern of IVC size reflects the expected intravascular volume depletion following fluid loss and subsequent reconstitution during rehydration. Concomitantly, exhibited reciprocal behaviour, with elevated values during dehydration and subsequent attenuation during rehydration compared to baseline measurements. These observations are consistent with established physiological principles: reduced intravascular volume increases cardio-respiratory-induced vascular collapsibility, whereas volume restoration mitigates this mechanical phenomenon [34].
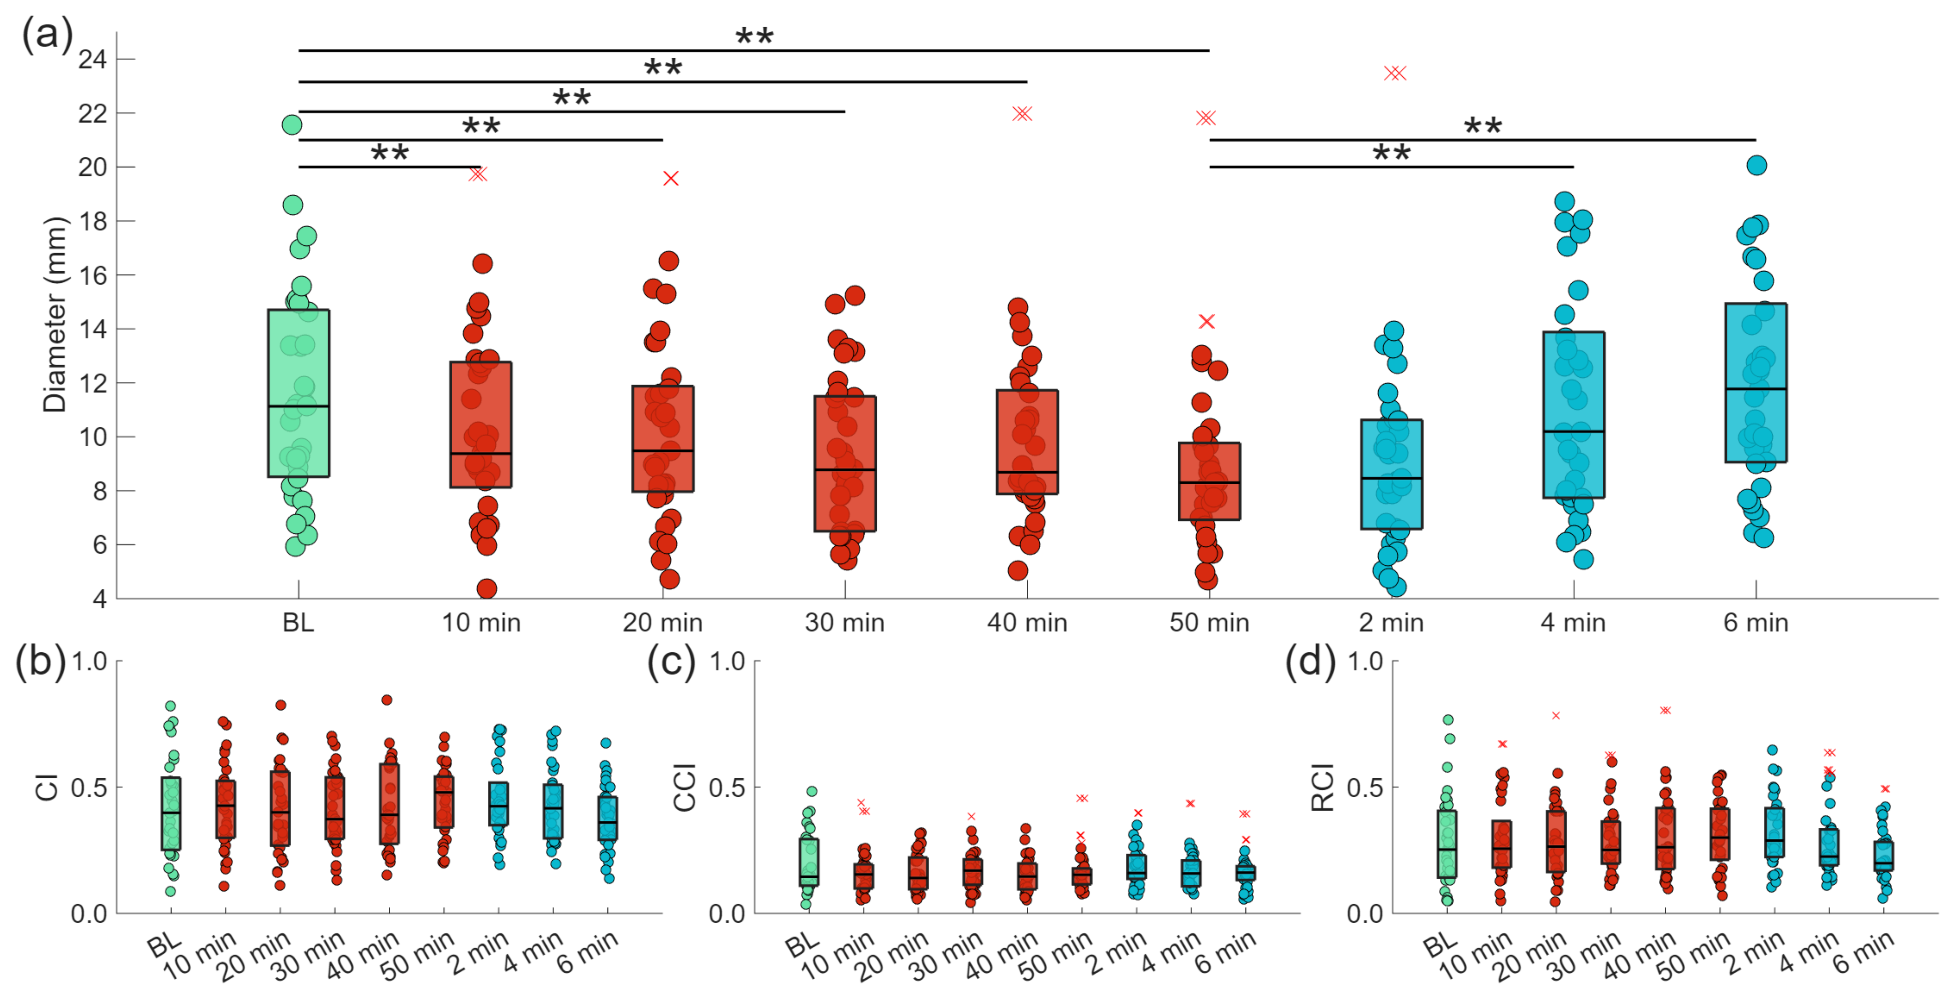
The previous analysis was then extended to all participants by estimating the median diameters and during each phase of the protocol. Results are reported in Figure 5, which investigates in different panels D, , and , respectively.
Figure 5.
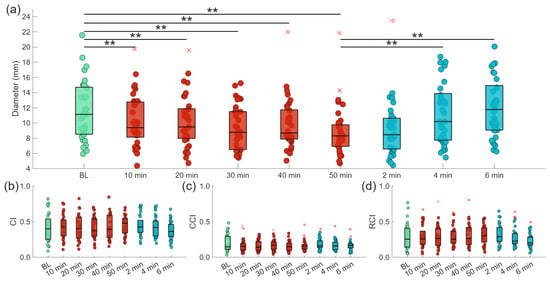
(a) Temporal evolution of the IVC diameter across experimental phases: BL (green), DH (red) at 10, 20, 30, 40, and 50 min, and RH (blue) at 2, 4, and 6 min. Statistically significant differences are indicated with ** for . (b–d) depict changes in , and , respectively. Outliers are indicated by red crosses.
Sphericity in the data was respected, so no correction was applied. A significant effect of time was obtained for D (). With particular reference to Figure 5a, it is possible to appreciate the decreasing trend in the DH phase for the median diameters from baseline, with significant differences starting from 10 min (). Concerning the RH phase, the results indicate that, after 4 min from water intake, the median diameter of the IVC was significantly different () compared to the 50-min condition (dehydration). Furthermore, at the 4-min mark, the statistical difference from baseline disappeared, suggesting that D returned to values similar to BL. Paired comparisons were conducted across all sub-phases, and all reported p-values are adjusted for multiple comparisons (Holm-Bonferroni).
Concerning , and , whose dynamics are represented in Figure 5b–d, no statistical differences were detected across any phase of the protocol.
3.2. Prediction of the Time of Rehydration
The dichotomisation threshold was established at 12 min, a convenient whole-minute value close to the sample median of the estimated time for IVC diameter to return to baseline, with Group 1 () exhibiting rapid RH (<12 min) and Group 2 () demonstrating prolonged RH (≥12 min). The mean RH time across all participants was min. Leveraging the comprehensive feature set described in the Section 2, we employed an RF classification algorithm to distinguish between Group 1 (fast rehydration) and Group 2 (slow rehydration) subjects. The initial model achieved an accuracy of 60.6%.
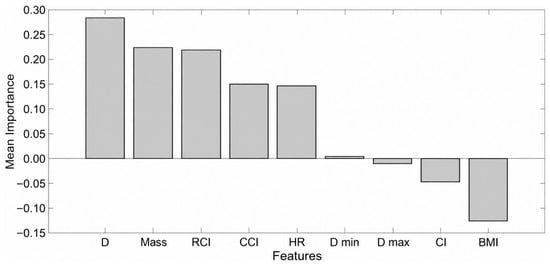
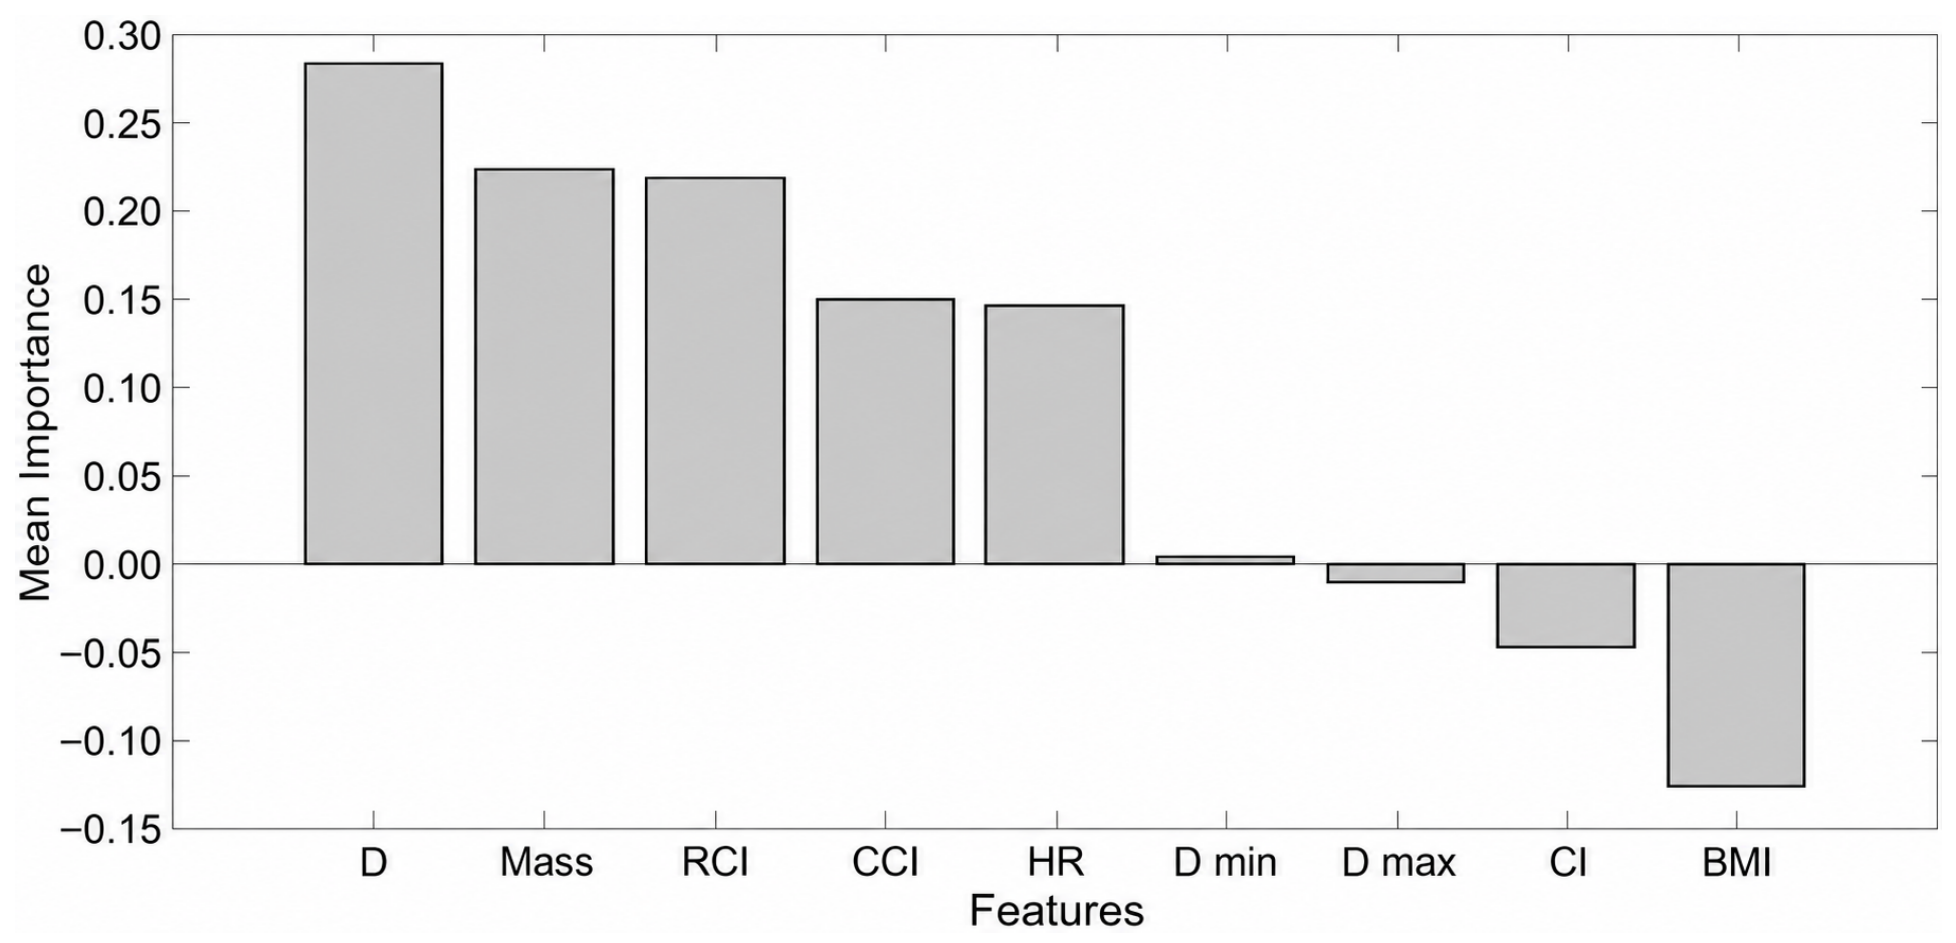
Feature importance analysis (Figure 6) enabled systematic optimisation of the input feature set through data-driven selection criteria. Five features demonstrated mean importance values exceeding zero: D, body mass, , and HR. Using only these five highest-ranking features yielded substantial improvement in classification performance, achieving 75.8% accuracy using data acquired exclusively during the initial 10-min dehydration phase.
Figure 6.
Mean importance scores from the RF classifier showing D as the most relevant feature, followed by normalised body mass and .
This enhanced model demonstrated robust discriminatory capacity with balanced performance metrics: Group 1 classification achieved 76.5% sensitivity and 75.0% specificity, while Group 2 exhibited complementary performance characteristics with 75.0% sensitivity and 76.5% specificity.
Incorporating additional parameters derived from the 20-min time point resulted in a slight decrease in performance, reducing accuracy to 72.7%. Moreover, extending the feature set to include data from the 30, 40, and 50-min marks caused classification accuracy to decrease to 66.7%.
3.3. Repeatability
The repeatability analysis showed that the operator achieved a mean STD of 0.94 mm on the dataset and an ICC of 0.95, with a 95% confidence interval of 0.94–0.98.
4. Discussion
Hydration status monitoring represents an essential procedure for maintaining optimal performance in athletic populations, as significant performance degradation occurs when body mass loss exceeds 2% [9]. While body mass assessment provides a practical estimate of net fluid loss, it cannot reveal how this loss affects fluid distribution or its specific hemodynamic impact. During exercise, the depletion of the intravascular compartment (rather than total body water loss) is the primary driver of cardiovascular strain and impaired thermoregulation. Currently, there is no non-invasive, real-time technique available for assessing this critical intravascular dynamic in athletes. Therefore, in this work, we investigated a novel approach to estimate hydration and monitor its direct cardiovascular impact during moderate exercise through US videos of the IVC.
Our findings indicate that D is the US-derived measure with the clearest group-level change under dynamic exercise conditions, whereas no statistically significant differences were detected for , , or across the protocol phases (however, this finding does not establish that these indices remained unchanged).
Results are consistent with previous studies investigating similar conditions, but with less frequent US video acquisitions [22,23,35]. As shown in Figure 5, this stability likely reflects the inherent difficulty of quantifying these sensitive parameters during active exercise, which involves substantial physiological perturbations. Exercise-induced cardiovascular stress, elevated heart rate, increased respiratory effort, and altered venous return dynamics fundamentally influence vascular collapsibility patterns independently of hydration status. Combined with inter-individual variability in sweating rate [5] and cardiorespiratory responses, these alterations may mask the established relationship between collapsibility indices and fluid balance validated in clinical populations under stationary conditions.
Furthermore, exercise-induced fluid homeostasis involves complex gastrointestinal and circulatory interactions. During sustained activity, the proximal small intestine absorbs approximately 550 mL h−1, about 50% of typical hourly fluid intake and 86% of average hourly sweat loss [36]. Increases in plasma osmolality during dehydration result from intramuscular fluid sequestration and hypotonic sweat loss, whereas elevated plasma potassium derives from skeletal muscle efflux [36].
Previous research has demonstrated that ingested water begins appearing in plasma within 5 min, with complete absorption occurring within 75–120 min [18]. Consistent with these findings, linear extrapolation estimated that D returns to baseline at min. During the RH phase, D exhibits significant differences from the maximal DH condition as early as 4 min post-ingestion, showing a short-term change in IVC diameter after water intake suggesting a rapid vascular rehydration that precedes complete fluid equilibration.
A pivotal innovation in our methodology was the integration of machine learning for personalised hydration prediction. The RF classifier achieved 75.8% accuracy in forecasting the rehydration class using body mass, D, , and HR from the initial 10-min dehydration phase. Including data from later time points reduced accuracy, suggesting that extended observation only contribute to overfit training data. These findings underscore the predictive strength of early-phase dehydration measurements and suggest that later time points may contribute redundant or non-informative features to the classification task. Our machine-learning analysis reveals important nuances: the RF algorithm ranked and as the third and fourth most important features for rehydration class prediction. Despite the lack of statistically significant changes in these indices between the two groups (with the exception of body mass), this suggests that they still encode valuable physiological information, which can be detected through advanced computational analysis decoding non-linear interactions with other features. The relationship between vascular collapsibility and hydration status during exercise may thus require sophisticated pattern recognition to uncover predictive signals in multidimensional datasets. These results provide preliminary support for the feasibility of developing individualised hydration protocols based on vascular response patterns and temporal features, although further controlled studies are needed to validate inter-individual IVC responses against independent measures of hydration status.
The temporal dynamics of D during dehydration offer mechanistic insights into fluid balance regulation. As illustrated in Figure 5, D exhibits a biphasic response pattern: a significant reduction during the initial 10-min dehydration interval (median reduction: 15.7%), followed by a markedly attenuated rate of change during successive dehydration phases (2.0% ± 3.0%). This profile aligns with physiological models of exercise-induced hypohydration described in [36,37]. The pronounced initial reduction reflects immediate compensatory vascular adaptations to fluid redistribution, primarily through plasma volume contraction and haemodynamic stabilisation. Quantitative analyses show that plasma volume typically decreases by 10–12% within 20 min of moderate-intensity exercise, then stabilises around 10% during continued exertion [36]. This contraction results from increased hydrostatic pressure driving fluid into active muscle and hypotonic fluid loss through perspiration. Our US observations directly document dynamic changes in IVC diameter across the exercise and water-intake phases, supporting its value as a non-invasive indicator of acute vascular responses to these interventions.
Notably, our low-intensity protocol conducted under thermoneutral conditions was designed to avoid excessive physiological stress, which may have contributed to the magnitude of the observed asymmetry. This methodological consideration suggests that the regulatory mechanisms we documented represent baseline homeostatic adaptations rather than responses to severe physiological challenges, thereby providing insight into normal fluid balance dynamics.
A limitation of this study is that the dehydration level that was achieved (approximately 1% body mass loss) may not represent more severe dehydration scenarios. Future studies should investigate IVC responses to greater fluid deficits. A further limitation is that body mass loss was used as a proxy for fluid loss without an independent hydration reference, such as plasma osmolality, urine specific gravity, or haematocrit-derived plasma volume changes, preventing direct validation of the accuracy of ultrasound-based hydration assessment. Our analysis reveals that matching water intake to exercise-related body-mass loss did not uniformly coincide with a return of IVC diameter to baseline during the 6-min observation period. The estimated time to return to baseline (15.33 ± 13.20 min) suggests that serial IVC measurements capture acute vascular dynamics that cannot be inferred from body-mass loss alone. Notice that an additional limitation concerns the estimated time for IVC diameter to return to baseline. Measurements after water intake were obtained only at 2, 4, and 6 min; therefore, the reported return times were estimated from these measurements rather than observed directly. Estimates extending beyond the 6-min observation period require extrapolation and should not be interpreted as evidence of complete rehydration. Future studies should extend the monitoring period and compare IVC measurements with independent measures of hydration status.
Posture changes between exercise (upright) and measurement (supine) may influence IVC dimensions. Future studies should investigate the acute effects of postural transition on IVC measurements. To ensure methodological rigour, we conducted a test–retest repeatability assessment. An ICC greater than 0.9 confirmed the consistency of the measurement. Semi-automated IVC segmentation further minimised user variability and improved reproducibility (as documented in [21]).
In conclusion, our findings demonstrate the importance of US-based hydration assessment, suggesting the extension of its potential to improve sports performance in addition to well-established clinical applications. With further technological integration and miniaturisation, this methodology has the potential to provide a practical, non-invasive means of tracking vascular responses and, following validation against independent hydration measures, inform individualised hydration strategies in sports physiology and selected clinical settings.
Future Perspectives
Our findings support further evaluation of IVC diameter as a potential indicator of exercise-related vascular changes, enabling individualised strategies based on subject-specific responses. While this study demonstrates the feasibility of US-based hydration monitoring, the current methodology requires controlled laboratory conditions and trained personnel. Future work should focus on developing portable, field-deployable systems. Moreover, future investigations should validate this US-based approach across diverse populations and sport-specific cohorts to assess generalisability and performance optimisation potential. Notably, recent advances in skin-mounted US devices facilitate continuous, real-time monitoring with reduced positional variability [38,39]. However, fidelity in signal acquisition during physical activity requires systematic validation.
The integration of these ultrasonographic tools with machine-learning algorithms holds significant potential for advancing fluid management across multiple domains, including endurance sports performance optimisation, as well as the management of fluid-sensitive pathological conditions such as heart failure and renal insufficiency. Further development of portable ultrasound and validation of predictive models could extend this approach beyond episodic assessments, enabling more frequent, individualised monitoring of vascular responses and helping to inform tailored hydration strategies in sports and selected clinical settings.
5. Conclusions
This study presents a novel and non-invasive approach for tracking exercise-associated vascular responses through US imaging of the IVC, complementing conventional hydration measures such as body-mass change and urine indices. By integrating US-derived physiological measurements, including diameter and collapsibility indices, this approach characterises IVC dynamics over the course of a controlled exercise and water-intake protocol. The findings indicate that IVC diameter decreased relative to baseline after 10 min of exercise and increased relative to the end-of-exercise value four minutes after water intake (both ).
Furthermore, a preliminary RF classifier yielded 75.8% leave-one-out accuracy in grouping participants by their estimated time for IVC diameter to return to baseline. This suggests that early IVC measurements, together with biometric features, may help characterise differences in individual vascular responses. In a separate same-operator assessment, repeated IVC measurements showed high repeatability (ICC = 0.95), supporting the consistency of the measurements under standardised conditions.
Overall, US imaging of the IVC offers a promising, non-invasive way to monitor short-term vascular responses, complementing body-mass-based estimates with repeated information on IVC dynamics. With extended monitoring after water intake and validation against independent hydration measures in larger and more diverse cohorts, this approach could help inform individualised hydration assessment in sports medicine and selected clinical settings.
Author Contributions
Conceptualisation, P.P. and L.M.; methodology, P.P., M.R., U.M. and A.M.; software, P.P. and U.M.; validation, M.R. and A.M.; formal analysis, P.P.; investigation, M.R., U.M. and A.M.; resources, L.M. and P.B.; data curation, P.P.; writing—original draft preparation, P.P.; writing—review and editing, L.M. and P.B.; supervision, L.M.; project administration, L.M.; funding acquisition, L.M. All authors have read and agreed to the published version of the manuscript.
Funding
This research received no external funding.
Institutional Review Board Statement
The study was conducted in accordance with the Declaration of Helsinki and approved by the Ethical Committee of Politecnico di Torino (Approval number: 41392/2024).
Informed Consent Statement
Informed consent was obtained from all subjects involved in the study.
Data Availability Statement
The data presented in this study are available on reasonable request from the corresponding author.
Acknowledgments
The contribution of the team of VIPER s.r.l. was greatly appreciated.
Conflicts of Interest
P.P., P.B. and L.M. are co-founders of VIPER s.r.l., which developed the proprietary software used for IVC segmentation. The remaining authors declare no conflict of interest.
Abbreviations
The following abbreviations are used in this manuscript:
| BL | Baseline |
| BMI | Body Mass Index |
| CCI | Cardiac Caval Index |
| CI | Caval Index |
| DH | Dehydration |
| HR | Heart Rate |
| ICC | Intraclass Correlation Coefficient |
| IVC | Inferior Vena Cava |
| RCI | Respiratory Caval Index |
| RF | Random Forest |
| RH | Rehydration |
| STD | Standard Deviation |
| US | Ultrasound |
| WUT | Weight-Urine-Thirst |
References
- Rowlands, D.S.; Kopetschny, B.H.; Badenhorst, C.E. The hydrating effects of hypertonic, isotonic and hypotonic sports drinks and waters on central hydration during continuous exercise: A systematic meta-analysis and perspective. Sports Med. 2022, 52, 349–375. [Google Scholar] [CrossRef] [Scilit]
- Cheuvront, S.N.; Kenefick, R.W. Dehydration: Physiology, assessment, and performance effects. Compr. Physiol. 2014, 4, 257–285. [Google Scholar] [CrossRef] [Scilit]
- Periard, J.D.; Travers, G.J.S.; Racinais, S.; Sawka, M.N. Cardiovascular adaptations supporting human exercise-heat acclimation. Auton. Neurosci. 2016, 196, 52–62. [Google Scholar] [CrossRef] [Scilit]
- Hellsten, Y.; Nyberg, M. Cardiovascular adaptations to exercise training. Compr. Physiol. 2015, 6, 1–32. [Google Scholar] [CrossRef] [Scilit]
- Baker, L.B. Sweating rate and sweat sodium concentration in athletes: A review of methodology and intra/interindividual variability. Sports Med. 2017, 47, 111–128. [Google Scholar] [CrossRef] [Scilit]
- Baker, L.B.; Barnes, K.A.; Anderson, M.L.; Passe, D.H.; Stofan, J.R. Normative data for regional sweat sodium concentration and whole-body sweating rate in athletes. J. Sports Sci. 2016, 34, 358–368. [Google Scholar] [CrossRef] [Scilit]
- Maughan, R.J.; Shirreffs, S.M. Dehydration and rehydration in competitive sport. Scand. J. Med. Sci. Sports 2010, 20, 40–47. [Google Scholar] [CrossRef] [Scilit]
- Casa, D.J.; Cheuvront, S.N.; Galloway, S.D.; Shirreffs, S.M. Fluid needs for training, competition, and recovery in track-and-field athletes. Int. J. Sport Nutr. Exerc. Metab. 2019, 29, 175–180. [Google Scholar] [CrossRef] [Scilit]
- Cheuvront, S.N.; Carter, R., III; Sawka, M.N. Fluid balance and endurance exercise performance. Curr. Sports Med. Rep. 2003, 2, 202–208. [Google Scholar] [CrossRef] [Scilit]
- Peden, D.L.; Funnell, M.P.; Reynolds, K.M.; Kenefick, R.W.; Cheuvront, S.N.; Mears, S.A.; James, L.J. Post-exercise rehydration: Comparing the efficacy of three commercial oral rehydration solutions. Front. Sports Act. Living 2023, 5, 1158167. [Google Scholar] [CrossRef] [Scilit]
- Wittbrodt, M.T.; Millard-Stafford, M. Dehydration impairs cognitive performance: A meta-analysis. Med. Sci. Sports Exerc. 2018, 50, 2360–2368. [Google Scholar] [CrossRef] [Scilit]
- Leiper, J.B. Intestinal water absorption: Implications for the formulation of rehydration solutions. Int. J. Sports Med. 1998, 19, S129–S132. [Google Scholar] [CrossRef] [Scilit]
- Judelson, D.A.; Maresh, C.M.; Anderson, J.M.; Armstrong, L.E.; Casa, D.J.; Kraemer, W.J.; Volek, J.S. Hydration and muscular performance: Does fluid balance affect strength, power and high-intensity endurance? Sports Med. 2007, 37, 907–921. [Google Scholar] [CrossRef] [Scilit]
- Armstrong, L.E. Assessing hydration status: The elusive gold standard. J. Am. Coll. Nutr. 2007, 26, 575S–584S. [Google Scholar] [CrossRef] [Scilit]
- Savoie, F.-A.; Kenefick, R.W.; Ely, B.R.; Cheuvront, S.N.; Goulet, E.D.B. Effect of hypohydration on muscle endurance, strength, anaerobic power and capacity and vertical jumping ability: A meta-analysis. Sports Med. 2015, 45, 1207–1227. [Google Scholar] [CrossRef] [Scilit]
- Grandjean, A.C.; Grandjean, N.R. Dehydration and cognitive performance. J. Am. Coll. Nutr. 2007, 26, 549S–554S. [Google Scholar] [CrossRef] [Scilit]
- Robinson, B.E.; Weber, H. Dehydration despite drinking: Beyond the BUN/Creatinine ratio. J. Am. Med. Dir. Assoc. 2004, 5, S67–S71. [Google Scholar] [CrossRef] [Scilit]
- Péronnet, F.; Mignault, D.; du Souich, P.; Vergne, S.; Le Bellego, L.; Jimenez, L.; Rabasa-Lhoret, R. Pharmacokinetic analysis of absorption, distribution and disappearance of ingested water labeled with D2O in humans. Eur. J. Appl. Physiol. 2012, 112, 2213–2222. [Google Scholar] [CrossRef] [Scilit]
- Louden, J.D. Regulation of fluid and electrolyte balance. Anaesth. Intensive Care Med. 2015, 16, 278–285. [Google Scholar] [CrossRef] [Scilit]
- Knapl, B. Hydration and physical activity. Res. Investig. Sports Med. 2021, 7, 649–653. [Google Scholar] [CrossRef] [Scilit]
- Policastro, P.; Mesin, L. Processing ultrasound scans of the inferior vena cava: Techniques and applications. Bioengineering 2023, 10, 1076. [Google Scholar] [CrossRef] [Scilit]
- Waterbrook, A.L.; Shah, A.; Jannicky, E.; Stolz, U.; Cohen, R.P.; Gross, A.; Adhikari, S. Sonographic inferior vena cava measurements to assess hydration status in college football players during preseason camp. J. Ultrasound Med. 2015, 34, 239–245. [Google Scholar] [CrossRef] [Scilit]
- Ragaisyte, E.; Bardauskiene, L.; Zelbiene, E.; Darginavicius, L.; Zemaityte, E.; Jasinskas, N.; Stasaitis, K. Evaluation of volume status in a prehospital setting by ultrasonographic measurement of inferior vena cava and aorta diameters. Turk. J. Emerg. Med. 2018, 18, 152–157. [Google Scholar] [CrossRef] [Scilit]
- Policastro, P.; Raggi, M.; Macrì, U.; Mattana, A.; Mesin, L. Dehydration and rehydration monitoring through ultrasound imaging of the inferior vena cava. In Proceedings of the GNB2025, Palermo, Italy, 18–20 June 2025; pp. 1–4. [Google Scholar]
- Mesin, L.; Pasquero, P.; Roatta, S. Tracking and monitoring pulsatility of a portion of inferior vena cava from ultrasound imaging in long axis. Ultrasound Med. Biol. 2019, 45, 1338–1343. [Google Scholar] [CrossRef] [Scilit]
- Mesin, L.; Pasquero, P.; Roatta, S. Multi-directional assessment of respiratory and cardiac pulsatility of the inferior vena cava from ultrasound imaging in short axis. Ultrasound Med. Biol. 2020, 46, 3475–3482. [Google Scholar] [CrossRef] [Scilit]
- Policastro, P.; Mesin, L. Estimation of inferior vena cava size from ultrasound imaging in X-plane. Electronics 2024, 13, 3406. [Google Scholar] [CrossRef] [Scilit]
- Policastro, P.; Ermini, L.; Civera, S.; Albani, S.; Musumeci, G.; Roatta, S.; Mesin, L. Effect of respirophasic displacement of the inferior vena cava on size measurement in 2-D ultrasound imaging. Ultrasound Med. Biol. 2024, 50, 1785–1792. [Google Scholar] [CrossRef] [Scilit]
- Shi, R.; Monnet, X.; Teboul, J.-L. Parameters of fluid responsiveness. Curr. Opin. Crit. Care 2020, 26, 319–326. [Google Scholar] [CrossRef] [Scilit]
- Blanca, D.; Schwarz, E.C.; Olgers, T.J.; ter Avest, E.; Azizi, N.; Bouma, H.R.; Ter Maaten, J.C. Intra- and inter-observer variability of point of care ultrasound measurements to evaluate haemodynamic parameters in healthy volunteers. Ultrasound J. 2023, 15, 22. [Google Scholar] [CrossRef] [Scilit]
- Bosio, S.; Barba, M.; Vigna, A.; Cola, A.; De Vicari, D.; Costa, C.; Volontè, S.; Frigerio, M. A novel method for the measurement of the vaginal wall thickness by transvaginal ultrasound: A study of inter- and intra-observer reliability. Medicina 2024, 60, 370. [Google Scholar] [CrossRef] [Scilit]
- Amaratunga, D.; Cabrera, J.; Lee, Y.-S. Enriched random forests. Bioinformatics 2008, 24, 2010–2014. [Google Scholar] [CrossRef] [Scilit]
- Veniamakis, E.; Kaplanis, G.; Voulgaris, P.; Nikolaidis, P.T. Effects of sodium intake on health and performance in endurance and ultra-endurance sports. Int. J. Environ. Res. Public Health 2022, 19, 3651. [Google Scholar] [CrossRef] [Scilit]
- Kaptein, M.J.; Kaptein, E.M. Inferior Vena Cava collapsibility index: Clinical validation and application for assessment of relative intravascular volume. Adv. Chronic Kidney Dis. 2021, 28, 218–226. [Google Scholar] [CrossRef] [Scilit]
- Cheuvront, S.; Sawka, M. Hydration assessment of athletes. Sports Sci. Exch. 2005, 18, 97. [Google Scholar]
- Gisolfi, C.V.; Lambert, G.P.; Summers, R.W. Intestinal fluid absorption during exercise: Role of sport drink osmolality and [Na+]. Med. Sci. Sports Exerc. 2001, 33, 907–915. [Google Scholar] [CrossRef] [Scilit]
- Gisolfi, C.V.; Summers, R.W.; Lambert, G.P.; Xia, T. Effect of beverage osmolality on intestinal fluid absorption during exercise. J. Appl. Physiol. 1998, 85, 1941–1948. [Google Scholar] [CrossRef] [Scilit]
- Du, W.; Zhang, L.; Suh, E.; Lin, D.; Marcus, C.; Ozkan, L.; Ahuja, A.; Fernandez, S.; Shuvo, I.I.; Sadat, D.; et al. Conformable ultrasound breast patch for deep tissue scanning and imaging. Sci. Adv. 2023, 9, eadh5325. [Google Scholar] [CrossRef] [Scilit]
- Lin, M.; Zhang, Z.; Gao, X.; Bian, Y.; Wu, R.S.; Park, G.; Lou, Z.; Zhang, Z.; Xu, X.; Chen, X.; et al. A fully integrated wearable ultrasound system to monitor deep tissues in moving subjects. Nat. Biotechnol. 2024, 42, 448–457. [Google Scholar] [CrossRef] [Scilit]
Disclaimer/Publisher’s Note: The statements, opinions and data contained in all publications are solely those of the individual author(s) and contributor(s) and not of MDPI and/or the editor(s). MDPI and/or the editor(s) disclaim responsibility for any injury to people or property resulting from any ideas, methods, instructions or products referred to in the content. |
© 2026 by the authors. Licensee MDPI, Basel, Switzerland. This article is an open access article distributed under the terms and conditions of the Creative Commons Attribution (CC BY) license.