


Abstract
The rapid expansion of utility-scale and commercial photovoltaic (PV) plants demands high-efficiency predictive and proactive maintenance schemes to safeguard operational availability and minimize degradation losses. Photovoltaic generators are subject to progressive mechanical, thermal, and electrical stressors that lead to cell microcracks, solder fatigue, active bypass diode failures, and localized hotspots. This article presents a rigorous systematic literature review conducted under the Preferred Reporting Items for Systematic Reviews and Meta-Analyses (PRISMA 2020) statement. The review critically synthesizes the integration of machine learning and deep learning models with three primary physical diagnostic modalities: current–voltage (I-V) curve tracing, infrared thermography (terrestrial and aerial, aIRT), and optical luminescence (electroluminescence, EL, and photoluminescence, PL), alongside cross-cutting low-cost Internet of Things (IoT) and Unmanned Aerial Vehicle (UAV) acquisition platforms. From an initial identification of 299 records in the Scopus database, a structured multi-stage screening and quality assessment pipeline resulted in the definitive inclusion of 39 primary empirical research studies published between 2022 and 2025 (with active tracking extending through early 2026). This review establishes a formal four-pillar quality assessment framework (evaluating experimental rigor, methodological transparency, component disaggregation, and reproducibility) and carries out a multidimensional synthesis across diagnostic accuracy, computational complexity, inference latency, inspection throughput, and operational invasiveness. The findings reveal that while single-modality aerial thermography provides unmatched spatial screening speeds (5–10 h for a 4 MW plant), it remains blind to non-dissipative microscopic fractures and exhibits ambiguity between temporary shading and internal cell degradation. Conversely, modular online I-V tracing and aerial EL deliver definitive electrical quantification and sub-cellular resolution, respectively, but face severe throughput and operational invasiveness constraints. Furthermore, this review formalizes a structured four-paradigm taxonomy of multimodal fusion (early, intermediate, late, and hierarchical) and evaluates practical engineering deployment bottlenecks—including legacy inverter topology constraints, communication bandwidth limits, algorithmic domain shift across emerging cell architectures (PERC, TOPCon, HJT, and bifacials), and outdoor thermal metrological uncertainty. Finally, an actionable technological roadmap and conceptual architectural blueprint toward automated multimodal digital twins are outlined alongside an explicit analysis of review limitations.
1. Introduction
The accelerated decarbonization of global electrical grids has positioned solar photovoltaic (PV) energy as the preeminent, most rapidly expanding renewable technology worldwide [1,2]. The cumulative global solar capacity has surpassed 1.5 TW, driven by competitive levelized costs of electricity (LCOE), aggressive international climate mandates, and industrial scaling led by China—which accounts for over 80% of global module production capacity and the world’s largest operational utility-scale installations [2]. However, the geographic ubiquity and long-term outdoor exposure of utility-scale and distributed PV plants subject solar modules to severe cyclic environmental and operational stresses over their 25-to-30-year design lifespans [3]. Atmospheric phenomena such as thermal cycling, mechanical deflection from wind and hail, ultraviolet irradiation, and moisture ingress induce progressive degradation modes. These include polymeric encapsulant delamination, sub-visible silicon wafer microcracking, solder ribbon fatigue, potential-induced degradation (PID), and localized solder joint oxidation [4]. If unaddressed, localized defects trigger current mismatches, activate bypass diodes in non-designed continuous modes, and generate high-temperature hotspots that precipitate accelerated power degradation and create latent fire hazards in large arrays [5].
Under these operating imperatives, traditional maintenance paradigms based on periodic visual walk-throughs and reactive corrective repairs are operationally inadequate and economically unviable for multi-megawatt installations [6]. Consequently, the photovoltaic industry is undergoing a paradigm shift toward automated predictive and proactive maintenance schemes. This transformation is driven by the convergence of two foundational technological vectors:
- Autonomous Multi-Sensory Data Acquisition Platforms:
- Advanced Computer Vision and Machine Learning (ML) Models: Deep neural networks—most notably single-stage object detectors (YOLO variants), semantic segmentation architectures (U-Net, DeepLab), and supervised contrastive classifiers—are increasingly embedded directly onto edge computational platforms or integrated into cloud analytics to autonomously identify, classify, and geolocate anomalies without manual human interpretation [7].
Despite the proliferation of machine learning literature dedicated to PV defect classification, recent academic publications suffer from a pronounced methodological disconnect. Earlier literature surveys have typically evaluated single technologies in isolation—focusing exclusively on aerial thermographic computer vision [5], specialized laboratory luminescence setups, or conventional centralized SCADA electrical curve tracers [7,8]. However, real-world field maintenance requires an integrated understanding of how complementary physical diagnostic modalities (electrical, thermal, and optical) interact with edge computational platforms and open-source hardware architectures under real industrial engineering constraints. Crucially, the literature has frequently grouped multimodal sensor integration without systematically categorizing the underlying fusion paradigms, while practical plant-level constraints—such as legacy inverter circuit topologies, wireless telemetry bottlenecks in remote environments, economic cost–benefit trade-offs across installation capacities, and out-of-distribution domain shift—remain insufficiently addressed.
To bridge this critical knowledge gap, this systematic literature review provides a unified, methodologically rigorous synthesis of state-of-the-art research (2022–2025, tracking through 2026). The review is guided by three explicit, pre-defined Research Questions (RQs):
- RQ1 (Algorithmic Portability and Performance): Which machine learning and deep learning architectures provide the optimal trade-off between diagnostic accuracy, computational footprint, and inference latency when deployed on resource-constrained UAV payloads and low-cost IoT edge hardware?
- RQ2 (Physical Modality Specificity and Operational Throughput): How do electrical (I-V curve tracing), thermal (terrestrial and aerial infrared thermography), and optical (electroluminescence and photoluminescence) diagnostic modalities compare regarding defect specificity, inspection speed, operational invasiveness, and environmental sensitivity?
- RQ3 (Engineering Constraints, Generalization, and Digital Twin Roadmap): What are the core hardware, telemetric, and operational domain shift bottlenecks hindering industrial deployment across next-generation PV cells, how are multimodal fusion paradigms categorized, and what constitutes the actionable conceptual roadmap toward scalable digital twins in operating PV plants?
In addressing these questions, this review explicitly delineates the primary empirical evidence corpus (comprising 39 field-validated studies) from secondary reviews and contextual benchmark literature to avoid evidence double-counting.
The remainder of this article is structured as follows: Section 2 describes the systematic review methodology following the PRISMA 2020 statement, formalizing the search equation, eligibility criteria across AI tasks, the 4-pillar quality assessment rubric with weighting justification, multi-tier sensitivity analysis with Leave-One-Pillar-Out (LOPO) testing, and corpus representativeness. Section 3 systematically analyzes the 39 primary studies, structured into electrical, thermal, and optical diagnostics, edge machine learning models, low-cost IoT implementations, a formal four-paradigm taxonomy of multimodal fusion, and quantitative benchmarking addressing methodological heterogeneity. Section 4 presents the master comparative framework with normative citations, analyzes operational trade-offs and capacity-dependent cost scaling, details practical industrial engineering constraints (inverter topologies, bandwidth), evaluates domain shift with empirical literature evidence, outlines the conceptual digital twin roadmap, and formalizes review limitations. Finally, Section 5 outlines the primary conclusions and actionable guidelines.
2. Systematic Review Methodology
This systematic review was planned, executed, and documented in strict compliance with the Preferred Reporting Items for Systematic Reviews and Meta-Analyses (PRISMA 2020) statement [9]. The standardized PRISMA framework guarantees methodological transparency, independent auditability, and scientific reproducibility across all phases of literature identification, screening, quality assessment, and data synthesis.
2.1. Search Strategy and Primary Data Source Justification
To ensure comprehensive bibliographic retrieval of high-impact, peer-reviewed literature at the intersection of solar energy engineering, sensor hardware, and applied artificial intelligence, Scopus was selected as the principal primary scientific database for query execution. The methodological selection of a single curated bibliographic database is grounded in established scientometric analyses [10,11]. Scopus provides exhaustive indexing coverage across the premier academic publishers in energy, electrical engineering, and computer science—encompassing IEEE Xplore, Elsevier (ScienceDirect), SpringerLink, MDPI, Wiley, and Taylor and Francis [10]. By querying Scopus via its Advanced Search API, the complete population of indexed Q1 and Q2 peer-reviewed literature was retrieved under a single standardized indexing schema, avoiding cross-database record formatting discrepancies and citation deduplication artifacts.
The global prominence of Chinese research in solar photovoltaics warrants specific methodological consideration. China represents more than 80% of global PV manufacturing and operates the world’s largest multi-GW installations. In this review, high-impact research from Chinese institutions is thoroughly captured through Scopus, which indexes the international English-language journals and proceedings of leading Chinese universities and research institutes (e.g., across IEEE, Elsevier, Springer Nature, Wiley, and MDPI, as well as specialized titles such as Frontiers in Energy and Solar Energy). Indeed, 33.3% of the included primary empirical studies ( of 39) originate directly from Chinese research teams and test sites. Concurrently, regional databases such as the China National Knowledge Infrastructure (CNKI) were considered. However, the CNKI repository predominantly indexes monolingual Chinese-language literature without standardized English PRISMA-compliant reporting or peer-review metadata accessible for independent international replication. Furthermore, technical guidelines from China have been codified in authoritative national standards, such as GB/T 39857-2021 [12] for UAV-based infrared thermography defect inspection, which aligns with international standards such as IEC TS 62446-3:2017 [13]. While Chinese-language articles indexed exclusively in CNKI are excluded by our language and database filters (as acknowledged in Section 4.8), the representative vanguard of Chinese empirical research is comprehensively integrated within our corpus.
Nevertheless, the potential selection bias arising from the reliance on a single primary database is explicitly recognized. Regional journals not indexed in major bibliographic indices, non-English literature, and proprietary industrial technical reports are inherently excluded by this search design. To mitigate this limitation, the primary database search was supplemented by forward and backward citation chaining (snowballing) from seminal publications and authoritative international normative reports (e.g., IEA-PVPS and IEC).
The search query was structured around three core conceptual facets combined via Boolean operators.
- Application Domain: Solar photovoltaic plants, commercial arrays, and PV modules.
- Diagnostic Modalities and Physical Principles: Fault detection, defect diagnosis, I-V curves, infrared thermography, electroluminescence, photoluminescence, and condition monitoring.
- Enabling Hardware and Algorithmic Technologies: Machine learning, deep learning, computer vision, convolutional neural networks, YOLO, Unmanned Aerial Vehicles (UAVs, drones), Internet of Things (IoT), and open-source embedded microcontrollers (ESP32, Arduino, Raspberry Pi).
The automated systematic search was formally executed via the Scopus API script on 2 June 2026 ( records), retrieving literature published between 2022 and 2026. To ensure absolute temporal currency prior to submission, prospective query monitoring was maintained through August 2026. Full bibliographic metadata—including titles, abstracts, author keywords, indexed keywords, publication year, and source titles—were exported into structured CSV and BibTeX formats for screening.
2.2. Eligibility Criteria and Screening Process
The eligibility criteria were structured using the formalized PICOS (Population, Intervention, Comparator, Outcomes, Study Design) framework, as detailed in Table 1.
Table 1.
PICOS framework defining inclusion and exclusion criteria for literature eligibility.
Given the multi-task nature of artificial intelligence applied across photovoltaic condition monitoring, eligibility and quantitative benchmarking required standardizing performance metrics across four distinct computational problem formulations:
- Image Classification Tasks (Module/Cell Level): Evaluated via accuracy, precision, recall, and class-balanced F1-score to assess discrete fault categorization.
- Object Detection Tasks (Aerial Bounding-Box Localization): Standardized via Mean Average Precision at IoU threshold 0.5 () and the COCO standard comprehensive metric [0.5:0.95], alongside bounding-box Intersection over Union (IoU).
- Semantic Segmentation Tasks (Pixel-Level Delineation): Standardized via mean IoU (mIoU) and Dice coefficient/F1-score for tracing fine microcracks and active cell boundaries.
- Time-Series and Curve Regression Tasks (Electrical Tracing): Standardized via Root Mean Square Error (RMSE), Mean Absolute Error (MAE), and Coefficient of Determination () for electrical parameter extraction.
- This task-stratified metric standardization prevents methodologically unsound direct aggregation across fundamentally disparate mathematical objectives.
The study selection followed a four-stage sequential pipeline in accordance with PRISMA 2020 guidelines:
- Phase 1: Identification. Initial query execution yielded a total of bibliographic records across the three thematic facets (Topic 1: 100 records; Topic 2: 99 records; Topic 3: 100 records). Prior to screening, records were removed: exact duplicate records resulting from cross-thematic overlap, and non-eligible records (automated exclusion of records lacking abstracts, non-generator power system studies, or conference summaries).
- Phase 2: Screening. Two authors (A.F.V.G. and V.A.G.) independently evaluated the remaining unique bibliographic records based on titles and abstracts. A total of records were excluded due to irrelevance: generic microgrid/grid-connection studies without PV fault focus (), purely theoretical simulations lacking experimental PV validation (), and short technical notes (). Inter-reviewer agreement at this stage was measured using Cohen’s kappa coefficient, yielding , indicating strong concordance.
- Phase 3: Eligibility (Full-Text Assessment). The full texts of the remaining candidate articles were retrieved and subjected to comprehensive independent evaluation by the two reviewers. A total of articles were excluded with documented justifications (inter-reviewer agreement ; disputes adjudicated by third author L.H.C.). Table 2 details the excluded articles and specific rationale.Table 2. List of articles excluded following full-text evaluation with specific exclusion rationales ().
- Phase 4: Inclusion. A final corpus of primary empirical research studies satisfied all inclusion requirements and was consolidated for qualitative synthesis and quantitative benchmarking.
Figure 1 illustrates the complete PRISMA 2020 study selection flowchart.
Figure 1.
PRISMA 2020 flow diagram illustrating the identification, screening, eligibility, and inclusion phases for the 39-study empirical evidence corpus.
2.3. Operationalized Four-Pillar Study Quality Assessment Framework
To guarantee methodological rigor and prevent qualitative bias, all 48 candidate full-text articles were evaluated against an operationalized four-pillar Quality Assessment (QA) protocol. Each pillar evaluates an essential attribute of scientific validity in applied photovoltaic diagnosis, scored on an objective 3-point ordinal scale (, , ):
- Pillar 1: Experimental Field Validation Rigor (P1).
- -
- Score 2: Validated on operational commercial/utility-scale solar plants or dynamic outdoor test benches under natural irradiance and ambient environmental conditions.
- -
- Score 1: Tested on small-scale indoor test benches under artificial solar simulators or controlled outdoor conditions with limited sample sizes.
- -
- Score 0: Evaluated strictly on numerical simulations or synthetic datasets without physical hardware measurements.
- Pillar 2: Methodological Transparency and Quantitative Metrics (P2).
- -
- Score 2: Explicitly reports comprehensive standardized quantitative performance metrics (accuracy, precision, recall, F1-score, mAP, IoU, RMSE, or confusion matrix) with clear cross-validation or holdout test protocols.
- -
- Score 1: Reports partial or single-metric performance (e.g., global accuracy only) without confusion matrices, precision/recall breakdown, or confidence intervals.
- -
- Score 0: Relies on qualitative visual inspections or subjective descriptive claims without numerical benchmarking.
- Pillar 3: Component-Level Spatial Disaggregation (P3).
- -
- Score 2: Demonstrates granular defect localization at the individual sub-module, single cell, or string level.
- -
- Score 1: Locates anomalies at the gross PV table or combiner-box level without isolating individual modules or specific cells.
- -
- Score 0: Macro-level plant or central inverter output detection only, incapable of spatial disaggregation.
- Pillar 4: Technological Maturity and Reproducibility (P4).
- -
- Score 2: Provides complete disclosure of AI algorithmic architectures, sensor technical specifications (resolution, spectral band, noise), hardware microcontrollers, communication protocols, and flight parameters.
- -
- Score 1: Discloses algorithmic models or sensor types generically without specific parameters, source code, or reproducibility details.
- -
- Score 0: Proprietary black-box algorithms or undisclosed commercial systems precluding independent replication.
The cumulative QA score ranges from 0 to 8 points. The four pillars are assigned equal weights ( for , allocating 2 points per pillar). In systematic review epistemology, symmetric weighting is crucial to avoid compensatory distortion: an asymmetric weighting schema (e.g., heavily weighting empirical field testing while discounting algorithmic reproducibility) would allow proprietary black-box studies lacking hyperparameters or sensor specifications to enter the synthesis. The inclusion threshold was set at points (≥75%), governed by a mandatory non-compensatory veto rule: any candidate study receiving a score of 0 in any single pillar is categorically excluded. This ensures that every study included in the final corpus satisfies minimum standards across real-world outdoor verification (), standardized quantitative performance reporting (), spatial component localization (), and technical parameter disclosure (). Quality scoring was conducted independently by two reviewers, achieving an inter-rater weighted Cohen’s kappa of . Disagreements were reconciled through consensus.
2.4. Sensitivity Analysis of Methodological Quality
To evaluate whether the systematic review findings are sensitive to study quality cutoffs or specific inclusion thresholds, a multidimensional sensitivity analysis was conducted. First, the 39 included primary studies were stratified into three granular quality tiers:
- Maximum-Rigor Tier (, studies, 38.5%): Studies achieving full satisfaction across all four pillars: verified outdoor operational validation, full multi-metric reporting, granular sub-module/cell localization, and complete reproducibility disclosures.
- Substantial-Rigor Tier (, studies, 33.3%): Studies fulfilling three pillars completely and partially satisfying one pillar (most commonly reporting single-metric evaluations or partial hyperparameter disclosures).
- Threshold-Rigor Tier (, studies, 28.2%): Studies meeting the non-compensatory minimum threshold across all dimensions but possessing minor limitations in sample diversity or code availability.
Second, a Leave-One-Pillar-Out (LOPO) sensitivity analysis was executed by systematically recalculating study eligibility under the hypothetical omission of each individual quality pillar ( through ). As summarized in Table 3, core technological and algorithmic conclusions demonstrate remarkable invariance across quality tiers and LOPO perturbations.
Table 3.
Methodological quality sensitivity analysis across stratified QA tiers and Leave-One-Pillar-Out (LOPO) perturbations.
Specifically, lightweight edge detectors (YOLOv5/v7/v8) consistently achieve Mean Average Precision in the 91–96% band regardless of quality tier, confirming that high algorithmic performance is not an artifact of permissive experimental designs. Similarly, the four-to-five-fold scanning throughput advantage of aerial thermography over electroluminescence and the vulnerability of deep vision models to out-of-distribution domain shift are reported consistently across all subsets. These findings confirm high methodological stability against study quality scoring.
2.5. Corpus Representativeness and Multidimensional Distribution
The resulting corpus of 39 included primary empirical studies represents a comprehensive sample of modern research. Recency is a defining feature of the corpus: 61.5% of the included literature (24 out of 39 studies) was published during the 2024–2025 period (including early 2026 indexations), capturing recent developments in edge computing, embedded AI, and autonomous UAV operations.
To establish representativeness beyond publication recency, Figure 2 quantifies the distribution of the 39 studies across five fundamental operational dimensions:
Figure 2.
Comprehensive overview of photovoltaic diagnostic techniques, physical spectrums, enabling IoT/UAV technologies, and representative corpus breakdown.
- Diagnostic Modality: Electrical I-V curve analysis accounts for 17.9% (), Infrared Thermography (aIRT and ground-based) represents 30.8% (), Optical Luminescence (EL/PL) comprises 15.4% (), and Edge AI/IoT/Multimodal Fusion comprises 35.9% ().
- Photovoltaic Cell Technology: Monocrystalline silicon (mono-Si) dominates with 53.8% (), followed by polycrystalline silicon (poly-Si) at 30.8% (), and emerging architectures (bifacial, heterojunction HJT, and thin-film) at 15.4% ().
- Plant Scale & Operational Setting: Utility-scale installations (>1 MW) represent 43.6% (), commercial and industrial rooftop installations account for 25.6% (), and outdoor experimental test benches represent 30.8% ().
- Validation Environment: Operational outdoor field environments comprise 76.9% () of all studies, while controlled outdoor experimental platforms represent 23.1% ().
- Geographical Diversity: The experimental test sites span Europe (46.2%, notably Spain, Italy, Germany, and Poland), Asia (33.3%, predominantly China [] and India), the Americas (12.8%, USA and Brazil), and North Africa (7.7%, Morocco). The substantial representation of research from China reflects its industrial prominence in solar module manufacturing and utility-scale deployment, providing leading empirical contributions in UAV object detection (e.g., Wang et al. [23]) and electroluminescence segmentation (e.g., Tang et al. [24,25]).
3. Diagnostic Techniques and Enabling Technologies in Photovoltaic Systems
This section delivers an in-depth, structured synthesis of the 39 primary empirical research studies, organized across four functional categories: electrical I-V tracing, thermal infrared thermography, optical luminescence, and the integration of machine learning with low-cost IoT platforms.
3.1. Electrical Diagnosis Through I-V Curve Analysis
Current–voltage (I-V) curve tracing constitutes the gold standard for quantitative electrical characterization in PV systems. The resulting curve reflects the aggregate semiconductor junction behavior under ambient irradiance (G) and operating temperature (T). Characteristic electrical features—short-circuit current (), open-circuit voltage (), maximum power point (), fill factor (), series resistance (), and shunt resistance ()—serve as physical indicators of specific degradation mechanisms.
Historically, I-V curve acquisition required manual intervention: technicians physically disconnected strings or individual modules to interface bulky commercial curve tracers. This offline procedure halts electricity generation, incurs severe labor costs, and precludes continuous monitoring in utility-scale fields. Recent literature focuses on developing online, inline, and low-cost modular tracers capable of extracting I-V curves without operational disruption.
Hardware advancements are exemplified by De Riso et al. [26], who designed a modular inline electronic tracer integrated directly into a PV module embedded within a series string. The system temporarily sweeps the operational trajectory using a capacitive load circuit and MOSFET switch, transmitting extracted current and voltage profiles through power line communication (PLC) or wireless links. Chen et al. [27] demonstrated a self-powered wireless online I-V tracer deployed at the individual module level. By harvesting power directly from the PV module during normal operation and utilizing an ultra-low-power wireless protocol, the system performs autonomous module-level sweeps without external battery packs. Similarly, Morales-Aragonés et al. [28] validated low-cost open electronics utilizing ESP32 microcontrollers and solid-state switching, achieving I-V curve tracing at a fraction of commercial equipment costs.
In parallel, algorithmic processing of I-V curves has evolved from empirical thresholding to machine learning classification. Hussain et al. [29] implemented a fuzzy logic architecture analyzing the mathematical trajectory and slope of the I-V trend line, effectively separating uniform environmental degradation from non-uniform partial shading. Zhang et al. [30] formulated a data-driven method for string current mismatch faults, extracting statistical inflection points and first-order derivatives from I-V curves to train regressors capable of distinguishing between localized soiling and irreversible cell wear. Supervised machine learning models—including Support Vector Machines (SVMs), K-Nearest Neighbors (KNNs), and Naive Bayes—were deployed by Emamian et al. [31] within an IoT cloud framework to automate multiclass defect identification. De Souza Silva et al. [32] trained supervised classifiers on real operational data to detect active bypass diode conduction and localized shunt defects. Furthermore, Almas et al. [33] established a long-term predictive degradation model correlating electrical I-V wear parameters with visible physical weathering.
Table 4 summarizes the primary research studies evaluating electrical I-V curve diagnosis.
Table 4.
Systematic synthesis of primary studies on electrical diagnosis via I-V curve characterization ().
3.2. Thermal Diagnosis by Aerial and Terrestrial Infrared Thermography (IRT)
Long-Wave Infrared (LWIR, 8–14 m) thermography provides a non-contact method for inspecting operating solar generators. Defective solar cells exhibit localized dissipation of uncollected electrical energy as heat, creating distinct thermal signatures: localized hotspots (cell cracks, solder defects), multi-cell cluster heating (delamination, severe shunts), string open circuits, and overheated bypass diodes.
Integrating radiometric LWIR sensors onto Unmanned Aerial Vehicles (UAVs) enables the rapid scanning of extensive solar farms. However, outdoor aerial thermography is constrained by strict environmental and operating boundary conditions. In accordance with the international technical specification IEC TS 62446-3:2017 [13], reliable thermal inspections mandate an in-plane solar irradiance under clear-sky conditions to ensure sufficient thermal gradient generation ( between normal and defective cells). Furthermore, ambient wind speed must not exceed 4 m/s, as forced convective cooling flattens thermal gradients and produces false negatives.
Vergura [6,34] conducted rigorous sensitivity investigations into the influence of environmental and flight variables on UAV thermography. The author demonstrated that elevated wind velocities and non-perpendicular optical view angles (> off-nadir) induce substantial measurement distortions due to surface emissivity changes and specular reflections of cold sky radiation. To reconcile the trade-off between aerial scanning speed and diagnostic precision, Álvarez-Tey and García-López [35] proposed a standardized two-stage inspection protocol: an initial rapid aerial survey (aIRT) at high flight altitude ( m) for rapid anomaly geolocation, followed by ground-based terrestrial thermal inspection at close range and variable incidence angles to definitively identify defect root causes.
Geospatial precision during aerial inspections has been enhanced through the integration of Real-Time Kinematic (RTK) positioning. Segovia Ramírez et al. [36] deployed RTK-equipped UAVs to acquire thermal orthomosaics with sub-decimetric spatial positioning error (<5 cm), enabling automated historical registration and multi-temporal tracking of individual module thermal degradation over successive seasons. Cipriani et al. [37] coupled aerial thermal thermography with Particle Swarm Optimization (PSO) heuristic algorithms to mathematically estimate the single-diode equivalent circuit loss parameters of overheated modules in utility-scale installations. Esposito et al. [38] demonstrated non-invasive thermographic methodologies to evaluate thermal degradation profiles across operating multi-MW plants. Jeffrey Kuo et al. [39] deployed dual-sensor (RGB and IRT) UAV platforms to achieve fully automated anomaly detection, classification, and GPS coordinates extraction across large-scale arrays.
Table 5 synthesizes the primary research studies focused on infrared thermography.
Table 5.
Systematic synthesis of primary studies on infrared thermography diagnosis ().
3.3. Optical Diagnosis by Electroluminescence (EL) and Photoluminescence (PL)
Electroluminescence (EL) and photoluminescence (PL) are cold optical emission diagnostic techniques. Unlike thermography, which measures thermal blackbody emission in the LWIR spectrum due to heat dissipation, luminescence captures radiative recombination of excess charge carriers in the semiconductor junction. In silicon PV cells, this radiative band-to-band recombination emits photons in the Short-Wave Infrared (SWIR) spectrum, exhibiting a characteristic emission peak around 1150 nm. Because the local luminescence intensity is directly proportional to minority carrier diffusion length and junction voltage, cracks that electrically isolate cell fragments appear dark (zero luminescence). EL and PL reveal sub-visible microscopic defects: silicon microcracks, busbar disconnections, finger breaks, and potential-induced degradation (PID) before they manifest as thermal hotspots.
EL requires external forward electrical current injection, whereas PL utilizes high-intensity optical excitation (lasers or LED arrays) to excite charge carriers without electrical contact. In the field, EL has historically been restricted to dark rooms or manual nocturnal audits. The luminescence emission intensity is four to six orders of magnitude weaker than direct sunlight, making daytime outdoor detection challenging. Capturing daylight EL requires complex lock-in modulation techniques, bandpass optical filtering, and multi-frame averaging, which slows inspection throughput [40,41].
To transition EL from manual audits to scalable outdoor operations, Hernández Callejo et al. [42] developed an outdoor aerial inspection methodology. A high-sensitivity cooled InGaAs/CMOS SWIR camera is mounted on a UAV, synchronized with bidirectional solar inverters that inject reverse current into entire strings at night. This setup enables rapid nocturnal aerial scanning without requiring module disconnections. However, as analyzed by Del Prado Santamaría et al. [41], aerial EL throughput is substantially lower than thermography: inspecting a 4 MW plant requires 20–40 flight hours for EL compared to 5–10 h for aIRT, due to camera exposure times ( ms) and the necessity of static drone hovering to avoid motion blur.
In photoluminescence, Ling et al. [43] demonstrated deep convolutional neural networks applied directly to solar cell PL imagery, accurately classifying PID and non-radiative carrier recombination losses. In automated EL image screening, Tang et al. [24] implemented an edge–cloud computing architecture utilizing semantic segmentation to autonomously trace and quantify linear silicon microcracks in high-resolution EL orthomosaics. Tang et al. [44] optimized deep convolutional networks using Transfer Learning (ResNet and VGG backbones), achieving high accuracy in multiclass classification of wafer metallurgical defects and finger breakages. Furthermore, Tradacete-Ágreda et al. [45] developed a specialized IoT hardware module capable of switching strings between normal operational generation and dark forward-bias injection, enabling self-diagnostic nocturnal EL image capture.
Table 6 summarizes the primary research studies focused on optical luminescence diagnostics.
Table 6.
Systematic synthesis of primary studies on optical luminescence (EL/PL) diagnosis ().
3.4. Integration of Machine Learning and Low-Cost IoT Monitoring Platforms
The scalability and economic feasibility of modern PV condition monitoring rest upon the integration of machine learning algorithms with decentralized edge hardware and IoT platforms.
3.4.1. Machine Learning and Deep Learning Models
Computer vision models applied to aerial imagery have evolved from two-stage architectures (Faster R-CNN) to optimized single-stage detectors and semantic segmentation networks. Wang et al. [23] introduced a lightweight YOLO architecture incorporating joint distance-IoU metrics, optimized for real-time inference aboard resource-constrained UAV onboard computers (NVIDIA Jetson Nano). Starzyński et al. [46] deployed single-stage YOLO networks to concurrently classify physical surface anomalies (glass fracture, localized soiling) and thermal hotspots in aerial video streams.
For tasks requiring the spatial delineation of thermal anomalies, modified U-Net encoder–decoder architectures have been deployed by Shen et al. [47] and Zefri et al. [48]. These models isolate individual PV modules from complex background terrain (such as rocky soil, sand, and vegetation), eliminating background noise that distorts cell temperature extraction. Rocha et al. [49] developed an integrated multidefect segmentation and classification tool for large-scale plants, achieving accurate boundary delineation across diverse defect topologies.
To overcome spectral ambiguity in single-modality thermal imagery, multimodal sensor fusion has gained prominence. Rather than merely combining heterogeneous datasets ad-hoc, the reviewed literature can be synthesized into a formal four-paradigm taxonomy of multimodal fusion in photovoltaic diagnostics:
- Paradigm 1: Early Fusion (Data/Pixel-Level Fusion): In this paradigm, raw 2D image matrices from aligned spectral channels (e.g., RGB visible and LWIR radiometric thermal channels) are directly concatenated into a composite multi-channel tensor (such as a four-channel tensor ) prior to entering the initial convolutional layers. Advantages: Enables deep neural networks to extract joint cross-spectral feature representations and shared spatial edge gradients from the earliest receptive fields, maintaining a single unified model backbone. Disadvantages: Highly vulnerable to optical parallax and spatial misalignment between adjacent UAV cameras; mandates strict sub-pixel geometric registration and microsecond shutter synchronization. Future Directions: Real-time dynamic homography estimation aboard UAV companion computers using lightweight Spatial Transformer Networks (STNs).
- Paradigm 2: Intermediate Fusion (Feature-Level/Latent Space Fusion): Distinct sensory modalities are processed through independent, modality-specific feature extractors (e.g., a ResNet backbone for RGB, a dedicated CNN for LWIR, and a 1D-CNN for electrical I-V curves). The resulting intermediate latent feature vectors are subsequently fused in deep feature space via Cross-Attention mechanisms, Feature Pyramid Networks (FPN), or dense tensor concatenation before passing to prediction heads. Advantages: Highly resilient to minor spatial offsets and differing optical resolutions; allows the neural network to dynamically weight spectral contributions according to signal-to-noise quality (e.g., attenuating RGB features under dense cast shadows). Disadvantages: Substantially elevated computational footprint and parameter count resulting from running multiple parallel backbones simultaneously; requires large volumes of paired multi-sensory training data. Future Directions: Sparse Cross-Attention Vision Transformers (ViTs) and knowledge distillation schemes to compress multi-backbone intermediate models onto embedded GPU nodes.
- Paradigm 3: Late Fusion (Decision-Level/Ensemble Fusion): Each sensory modality is processed by an entirely autonomous detection or classification pipeline. The independent prediction scores, bounding boxes, or condition vectors are subsequently integrated at the decision layer via rule-based consensus, Bayesian networks, fuzzy inference systems, or Dempster–Shafer evidence theory (e.g., Hong et al. [50], Zhang et al. [51]). Advantages: Maximum architectural modularity; complete hardware fault tolerance (the monitoring pipeline remains operational if a sensor drops offline); directly accommodates asynchronous data captured across disjoint platforms (e.g., continuous fixed I-V tracers combined with periodic drone thermography). Disadvantages: Discards rich sub-pixel spatial cross-correlations; struggles to resolve diagnostic ambiguity when individual classifiers output conflicting low-confidence hypotheses. Future Directions: Probabilistic causal graphical networks incorporating module degradation physics and historical operational context to adjudicate conflicting decision outputs.
- Paradigm 4: Hierarchical Spatiotemporal Staged Fusion (Digital Twin Paradigm): A multi-scale operational deployment strategy that decouples sensing across space and time. Low-cost IoT sensor nodes or inverter SCADA channels provide continuous electrical condition screening; when an electrical degradation threshold is breached, an automated RTK-guided aerial thermography survey is dispatched to localize macro-thermal anomalies; if thermal patterns indicate ambiguous sub-visible cracking, targeted nocturnal electroluminescence imaging is scheduled exclusively on the flagged strings. Advantages: Delivers optimal operational efficiency across multi-gigawatt installations; minimizes flight hours and inspection costs while capturing >95% of critical failure modes. Disadvantages: Demands complex centralized data lake architectures, automated work-order dispatch engines, and spatiotemporal database orchestration. Future Directions: Edge-to-cloud automated orchestrators integrating edge micro-diagnostics with spatial asset management information systems (GIS).
Table 7 summarizes the operational mechanisms, advantages, drawbacks, and computational characteristics of these four multimodal fusion paradigms.
Table 7.
Taxonomic classification and comparative trade-offs of multimodal diagnostic fusion paradigms in photovoltaic condition monitoring.
In spatial reconstruction, Structure from Motion (SfM) photogrammetry has automated field orthomosaic generation. Hernández-López et al. [52] developed the SunMap platform, which stitches thousands of aerial thermal frames into georeferenced 3D point clouds. Bommes et al. [53] integrated SfM with deep learning to track module identity across aerial video sequences. Bommes et al. [54] formulated a Supervised Contrastive Learning framework with ResNet-34 backbones, establishing feature representations invariant to environmental irradiance fluctuations. Ying et al. [55] introduced an Anchor Points algorithm to compensate for drone vibration and thermal video drift, while Barraz et al. [56] implemented domain generalization techniques to enable thermal segmentation models to transfer across distinct climatic zones without retraining.
3.4.2. IoT Platforms and Open-Source Low-Cost Monitoring Systems
Decentralized hardware platforms have democratized PV surveillance. Ochoa et al. [57] developed an open-source diagnostic node pairing a low-cost thermopile array with an ESP32 microcontroller. By running lightweight edge routines (OpenCV C++), the system provides continuous string-level hotspot detection at hardware costs under USD 100, contrasted with industrial radiometric camera systems costing upwards of USD 15,000.
In distributed communications, Tang et al. [25] implemented an edge intelligence IoT infrastructure that performs in situ pre-filtering of high-resolution luminescence images at combiner boxes, transmitting only compressed defect regions and alerts to cloud servers, thereby reducing wireless channel bandwidth by 85%. Segovia Ramírez and García Márquez [58,59] designed an IoT platform integrating SCADA time series with periodic UAV thermal orthomosaics. Using multi-layer artificial neural networks, their system automates work order dispatch and predicts multi-year degradation trajectories. Ramirez et al. [60] validated a hybrid IoT platform deploying machine learning to track predictive maintenance in multi-MW commercial facilities.
Table 8 synthesizes the primary studies dedicated to Machine Learning, Edge AI, and IoT platforms.
Table 8.
Systematic synthesis of primary studies on Machine Learning, Edge AI, and IoT monitoring platforms ().
3.5. Systematic Quantitative Performance Comparison and Methodological Heterogeneity
A primary objective of this review is to quantitatively contrast the diagnostic performance, model complexity, and computational latency of machine learning models across the reviewed corpus. Table 9 compiles reported performance metrics, dataset characteristics, algorithmic backbones, target hardware, and inference speeds across representative primary studies.
Table 9.
Systematic quantitative benchmarking of machine learning and deep learning models across primary studies.
Despite the high reported individual accuracies (>90%), direct meta-analytic statistical pooling across studies is methodologically restricted. This limitation stems from severe benchmark heterogeneity across four fundamental vectors.
- Non-Standardized Defect Taxonomies: Existing studies employ conflicting classification nomenclatures. For instance, some authors group all thermal anomalies under a single binary class (“Hotspot” vs. “Normal”), whereas others enforce fine-grained 10-class distinctions (isolated sub-cell hotspot, multi-cell bypass heating, string open circuit, delamination, snail trails, and physical soiling). A model distinguishing 10 complex fault classes with 90% accuracy possesses exponentially higher discriminative capacity than a binary classifier reporting 95% accuracy on an easy thresholding task.
- Sensor Discrepancies and Ground Sampling Distance (GSD): Aerial thermal datasets exhibit wide variations in spatial resolution, ranging from high-resolution GSD (<1.5 cm/pixel at 15 m flight altitude) to coarse GSD (>8 cm/pixel at 60 m flight altitude), fundamentally altering small-object feature extraction.
- Absence of Standardized Public Benchmarks: Unlike general computer vision datasets (ImageNet, COCO), the photovoltaic sector lacks universal, open-source, multi-technology benchmark datasets. Most models are trained on localized private datasets collected under proprietary protocols.
- Validation Protocol Discrepancies: Few studies conduct true out-of-distribution external cross-dataset validation; the vast majority evaluate performance using random train/test splits derived from the exact same solar park and flight session, leading to overly optimistic accuracy metrics.
The methodological impossibility of executing a classical meta-analytic effect-size pooling across the reported literature is governed by three foundational statistical barriers:
- (a)
- Non-Equivalent Computational Task Objectives: The primary studies solve mathematically non-comparable problem formulations. There is no valid statistical weighting that can combine the discrete classification accuracy of I-V curves (e.g., de Souza Silva et al. [32] reporting 98.2% accuracy via Random Forest) with bounding-box object detection Mean Average Precision (e.g., Wang et al. [23] reporting 94.2% mAP@0.5) or pixel-wise semantic segmentation Intersection over Union (e.g., Tang et al. [24] reporting 88.4% IoU). Each metric optimizes fundamentally disparate loss functions and decision boundaries.
- (b)
- Extreme Operational Class Imbalance: In operating utility-scale PV plants, defective cells or modules account for less than 1% of the total observed module population. Under such acute skewness, global accuracy is an inherently deceptive metric: a trivial majority-class classifier predicting “healthy module” for every sample yields accuracy while exhibiting zero diagnostic utility. Without universal disclosure of confusion matrices, class-specific Precision–Recall curves, or balanced F1-scores, naive accuracy pooling produces misleading conclusions.
- (c)
- Cross-Frame Data Leakage in Private Datasets: The pervasive reliance on private datasets evaluated via random 80/20 train/test splits represents the single largest obstacle to industrial technology transfer. In typical aerial UAV surveys, video sequences or overlapping still frames are recorded with ≥70% forward and lateral overlap. When images from the same flight are randomly partitioned, near-identical adjacent frames of the exact same PV tables appear simultaneously in the training and testing sets. Consequently, models memorize site-specific backgrounds, constant solar zenith angles, fixed module mounting tilts, and identical soil albedos rather than learning robust, invariant defect physics. While this artificial correlation boosts reported in-distribution test scores above 95%, accuracy deteriorates precipitously when models are deployed out-of-distribution (OOD) in commercial plants.
To establish a pathway toward reproducible benchmarking and valid cross-study meta-analyses, the photovoltaic AI research community requires a minimal four-pillar standardization protocol:
- Normative Defect Nomenclature: Alignment with the international technical specification IEC TS 62446-3:2017 [13], which formalizes six primary thermal anomaly classes: single-cell hotspot, multi-cell patch heating, string open circuit, activated bypass diode, localized soiling/shading, and physical mechanical fracture.
- Standardized Spatial GSD Bounds: Enforcing flight parameters that guarantee for macroscopic module-level screening and for sub-cellular crack characterization.
- Universal Multi-Metric Reporting: Mandating the simultaneous disclosure of class-stratified Precision, Recall, and F1-scores, supplemented in object detection by the complete COCO standard [0.5:0.95] rather than solitary scores.
- Spatially Disjoint Blind Validation: Prohibiting intra-flight random partitioning and enforcing leave-one-park-out (LOPO) cross-validation, where testing sets originate strictly from independent solar farms with distinct terrains and installation geometries.
Furthermore, defining acceptable benchmark heterogeneity in photovoltaic AI systems differs fundamentally from general computer vision benchmarks (e.g., COCO or ImageNet). In general computer vision, illumination, viewpoint, and background clutter are unbounded. In contrast, photovoltaic diagnostics operate under deterministic physical constraints that enable explicit, physics-informed data normalization prior to inference:
- Radiometric Thermal Normalization: Apparent surface temperature differences () between normal and overheated cells are dynamically modulated by instantaneous plane-of-array irradiance () and convective wind cooling (). To permit valid cross-site benchmarking, thermal signatures should be normalized to standard testing conditions (, low wind) via:where is the convective thermal dissipation coefficient derived from empirical wind tunnel calibrations.
- Geometric Angle Standardization: Specular glint from the cold sky is minimized by restricting camera optical axes to near-nadir orientations (). Imposing these physical bounds establishes a bounded, reproducible evaluation domain that allows meaningful algorithmic comparisons across heterogeneous datasets.
4. Critical Discussion and Future Challenges
The commercial deployment of intelligent diagnostic systems in operating solar PV plants requires reconciling physical hardware limitations with computer vision capabilities.
4.1. Master Comparative Framework: Physical Modalities vs. Enabling Platforms
A central finding of this systematic review is that no single diagnostic modality represents a universal condition monitoring solution. As summarized in Table 10, diagnostic technologies are structured into two functional tiers: Primary Physical Diagnostic Modalities and Cross-Cutting Enabling Computational Platforms.
Table 10.
Comprehensive operational and technical comparison of photovoltaic diagnostic modalities and computational platforms.
The operational values and standard operating bounds reported in Table 10 are derived from normative standards and peer-reviewed field validations:
- Environmental Thresholds: The minimum solar irradiance and maximum wind velocity are standardized by IEC TS 62446-3:2017 [13] and confirmed by Vergura [6,34].
- Inspection Throughput: The baseline throughput comparison (5–10 h for aIRT vs. 20–40 h for aerial EL per 4 MW plant capacity) is established by the International Energy Agency report IEA-PVPS T13-10:2018 [40] and field-tested by Del Prado Santamaría et al. [41].
- Hardware Cost Classifications: Evaluated based on open-source prototypes (<USD 100 for ESP32/sensor nodes [28,57]) versus commercial radiometric UAV cameras (USD 8000–20,000) and specialized InGaAs cooled SWIR cameras (>USD 25,000).
It should be emphasized that these performance metrics exhibit contextual uncertainty: throughput fluctuates based on drone flight altitude, ground sampling distance (GSD), camera sensor pitch, array pitch, and terrain elevation.
4.2. Critical Trade-Off Analysis: Spatial Resolution, Throughput, and Invasiveness
The diagnostic matrix in Table 10 exhibits fundamental operational trade-offs that dictate field deployment strategies:
- Throughput vs. Spatial Resolution: Aerial infrared thermography (aIRT) provides the highest scanning throughput, surveying gigawatt-scale portfolios within days. However, aIRT operates at macroscopic resolution (), detecting anomalies only after significant ohmic or recombination dissipation occurs. Sub-visible structural defects—such as incipient Mode A hairline microcracks parallel to busbars and early solder fatigue that do not immediately dissipate heat—remain completely undetectable in thermal spectra. Conversely, optical luminescence (EL/PL) achieves sub-millimeter microscopic resolution (<0.5 mm), exposing latent silicon fractures; however, it requires long exposure times and static hovering, resulting in a fourfold reduction in scanning throughput (20–40 h per 4 MW) [41].
- Electrical Quantification vs. Spatial Localization: Modular I-V curve tracing quantitatively isolates real electrical power degradation, string series resistance decay, and bypass diode conduction without requiring optical line of sight. Nevertheless, electrical tracing is spatially unlocalized: an abnormal I-V curve indicates that a string is degraded, but cannot resolve which specific cell, interconnect, or module is malfunctioning.
4.2.1. Hierarchical Sequential Screening Protocol (Tiered Screening)
To balance throughput, diagnostic depth, and operational expenditure, utility-scale photovoltaic maintenance requires a structured, three-tier sequential screening protocol:
- Tier 1—Continuous In Situ Electrical Telemetry (Zero Incremental O&M Cost): Distributed IoT sensor nodes or smart inverters continuously monitor DC string voltages, currents, and periodic I-V sweeps under operating sunlight. Telemetry algorithms detect localized power anomalies, string mismatches, and impedance drifts, flagging suspect strings within the supervisory control and data acquisition (SCADA) system without dispatching field personnel.
- Tier 2—Macro-Level Autonomous Aerial Thermography (High Throughput): Once electrical anomalies are flagged (or during scheduled semi-annual plant audits), an autonomous RTK-guided UAV equipped with dual radiometric thermal (LWIR) and high-resolution RGB cameras surveys the flagged blocks at 5–10 h per 4 MW. Edge AI detectors rapidly locate macroscopic hotspots, active bypass diodes, and severe soiling, filtering out optical false positives via visible-band cross-referencing.
- Tier 3—Micro-Level Targeted Optical Luminescence (High Resolution, Selective Dispatch): Nocturnal aerial electroluminescence (EL) or terrestrial photoluminescence (PL) is strictly reserved for the subset of modules exhibiting unresolved power losses or undergoing formal warranty dispute audits. By confining low-throughput EL scanning to less than 2–5% of the plant capacity, operators maximize defect visibility while preventing prohibitive O&M labor expenses.
4.2.2. Defect Risk Tolerance and Acceptable Missed-Detection Probability
The economic justification for multi-tier inspection depends on the acceptable probability of missed defects (-risk) across distinct lifecycle phases:
- Routine Operational O&M (): During routine commercial operation, an undetected Mode A hairline microcrack (isolated crack without immediate electrical disconnection or hotspot dissipation) represents an acceptable operational risk. Its instantaneous impact on the Levelized Cost of Electricity (LCOE) is virtually negligible until cyclic thermal fatigue causes physical cell fragmentation. Deploying exhaustive nocturnal EL across entire GW-scale fleets solely to capture non-dissipative microcracks is economically unviable.
- Commissioning, Asset Transfer, and Warranty Audits (): In contrast, during plant commissioning, transfer-of-custody transactions, or manufacturer warranty litigation following severe hailstorms, risk tolerance decreases drastically. A missed defect may lead to long-term asset devaluation or catastrophic fire risk. In these high-stakes scenarios, strict quality covenants mandate , economically justifying exhaustive Tier 3 EL surveys.
4.2.3. Economic Scaling: Distributed Rooftops vs. Utility-Scale Farms
Asset scale fundamentally dictates the optimal diagnostic investment:
- Distributed Generation (<1 MW): For residential and small commercial rooftop arrays, the capital expenditure of automated drone fleets and high-resolution thermal/EL payloads exceeds the net present value of recovered energy yields. In this segment, low-cost open-source IoT string monitoring combined with handheld thermography represents the only cost-effective configuration.
- Utility-Scale Power Plants (>10–50 MW): Conversely, for multi-megawatt facilities, the capital investment in autonomous RTK-UAV docks and edge AI workflows is rapidly amortized across gigawatt-hour annual production. Here, even a 0.5% recovery in plant availability delivers financial returns exceeding system deployment costs within 12–18 months.
4.3. Operational Domain Shift and Generalization Across Next-Generation PV Cells
A critical vulnerability identified across computer vision models applied to PV diagnosis is the operational domain shift. The majority of published deep learning detectors (YOLO variants, U-Net) are trained on homogeneous datasets acquired under specific local environments and for conventional single-glass monocrystalline PERC modules. When these models are evaluated across diverse climatic zones, changing terrain albedos, or emerging module technologies, diagnostic accuracy experiences severe degradation. For instance, Barraz et al. [56] documented performance drops of 15–25% in mAP when transferring standard thermal models across contrasting environmental domains without domain adaptation. Similarly, Bommes et al. [53,54] demonstrated that unsupervised or contrastive feature representations degrade significantly when deployed across solar farms with different camera viewing angles, array spacings, or ground reflections. Investigations by Su et al. [64] and Pierdicca et al. [65] confirmed that adversarial domain adaptation and robust synthetic augmentation are mandatory to bridge the distribution gap between source training domains and real-world industrial installations.
The physical mechanisms underlying this domain shift are multifaceted:
- Ground Albedo and Soil Variations: Ground albedo varies from arid desert sand () to dark volcanic soil, gravel, or green agricultural cover (). In aerial imagery, high-albedo backgrounds elevate background contrast and induce severe specular glint at module edges, triggering spurious false-positive bounding-box activations in standard convolutional detectors.
- Single-Axis Tracker Dynamics: In utility-scale tracking systems, modules dynamically tilt throughout the day, altering camera perspective angles, aspect ratios, and radiometric reflections relative to the UAV’s flight vector.
- Bifacial Module Architectures: Bifacial photovoltaic modules absorb diffuse and reflected irradiance on their rear glass surfaces. The resulting rear-side irradiance variations generate non-uniform back-surface thermal gradients, altering front-surface heat dissipation and confounding conventional single-side thermal defect signatures.
- Advanced Cell Metallurgies (TOPCon, HJT, and Tandem Architectures): Emerging cell designs introduce physical characteristics that deviate markedly from standard PERC cells. Tunnel Oxide Passivated Contact (TOPCon) and Heterojunction (HJT) cells utilize ultra-thin silicon wafers (130–150 m vs. 180 m in PERC), denser multi-busbar (16BB) or busbarless wire-mesh metallization, and lower temperature coefficients ( for TOPCon/HJT vs. for PERC). Consequently, localized current crowding in TOPCon/HJT generates lower thermal differentials (), while their electroluminescence emission spectra exhibit distinct band-to-band recombination dynamics. Without retraining or physics-informed domain adaptation, legacy AI models trained on PERC datasets exhibit elevated false-negative rates on next-generation installations.
- Mitigating domain shift requires future research to adopt domain generalization techniques, unsupervised domain adaptation (UDA) [64], vision transformers (ViTs), and physics-informed synthetic image generation via generative adversarial networks (GANs).
4.4. Practical Engineering Implementation: Inverter Topologies, Industrial Telemetry, and Economic Scalability
Bridging the gap between laboratory artificial intelligence models and operating industrial photovoltaic installations introduces severe electrical and communication engineering constraints that are rarely addressed in computer vision literature:
4.4.1. Inverter Topologies and Nocturnal Electroluminescence Power Injection
Performing aerial or terrestrial electroluminescence (EL) in the field requires driving a continuous forward-bias current (typically 10% to 100% of short-circuit current ) through the PV strings in reverse polarity under complete darkness. The practical execution of this excitation depends entirely on plant inverter topology:
- String Inverter Architectures: In modern decentralized plants utilizing string inverters (50–250 kW), strings are directly connected to independent MPPT trackers. However, standard commercial inverters are unidirectional grid-tied converters designed strictly to export DC power to the AC grid. Injecting reverse current requires specialized inverters with integrated four-quadrant bidirectional DC-DC conversion capabilities, or automated switching contactors that disconnect the inverter bridge at night and connect a dedicated DC power supply. Attempting nocturnal EL without galvanic isolation risks damaging inverter semiconductor switches (IGBTs/MOSFETs).
- Central Inverter Architectures: In utility-scale plants utilizing multi-megawatt central inverters (1–3.3 MW), dozens of strings are paralleled inside DC combiner boxes before entering the central inverter. Reverse-biasing an entire central inverter block requires massive external power supplies (several hundred kilowatts) and introduces severe safety hazards due to circulating currents between parallel strings with mismatched impedances. Consequently, central inverter plants require motorized DC disconnects at individual combiner boxes or labor-intensive manual string disconnection, severely limiting nocturnal EL throughput and elevating operational costs.
4.4.2. MPPT Tracking Interruption vs. Curve Sweep Frequency Trade-Off
In inline electrical monitoring, acquiring high-resolution I-V characteristic curves requires temporarily sweeping the string voltage from short circuit () to open circuit (), temporarily forcing the string off its Maximum Power Point (MPP). While an individual capacitive or electronic sweep takes only 50–100 ms, continuous high-frequency sweeping (e.g., executing sweeps every 60 s across hundreds of strings) causes measurable annual energy yield losses ( of total plant generation). To eliminate unnecessary yield penalties, industrial implementations must employ event-triggered I-V tracing: IoT nodes monitor high-speed DC string current and voltage at the operating point () continuously; a full I-V curve sweep is triggered only when persistent electrical mismatch or localized impedance drift exceeds a statistical threshold (≥3).
4.4.3. Industrial Telemetry Bandwidth and Edge Compression
In remote utility-scale solar farms spanning hundreds of hectares, cellular coverage is frequently constrained, and wireless communication backhauls rely on low-power wide-area networks (LPWAN), primarily LoRaWAN (offering operational bandwidths of only 0.3–50 kbps per channel) or narrow-band IoT (NB-IoT). Transmitting uncompressed high-frequency electrical waveforms (thousands of data points) or streaming 4K radiometric UAV video directly over LPWAN channels is technically impossible and causes immediate channel saturation. To overcome this communication bottleneck, edge intelligence serves as a critical compression engine:
- Parametric Electrical Reduction: Rather than uploading full raw I-V curve arrays, edge-embedded microcontrollers (e.g., ESP32 or STM32) execute onboard single-diode model curve fitting, extracting and transmitting only five physical lumped parameters (photocurrent , reverse saturation current , series resistance , shunt resistance , and ideality factor n), alongside discrete operating points (). This reduces data payload size by over 98% (from ≈10 kB to <200 bytes per curve).
- Aerial Vision Edge Filtering: Onboard UAV companion computers (e.g., NVIDIA Jetson Orin Nano) execute real-time YOLO object detection directly on the thermal video stream. Instead of transmitting gigabytes of raw orthomosaic video, the edge processor transmits only lightweight JSON alert packets containing georeferenced bounding-box coordinates, IEC defect classifications, and cropped anomaly thumbnails. This slashes wireless data transmission requirements by >95%, ensuring compatibility with low-bandwidth industrial telemetry backhauls.
4.4.4. Economic Scalability and Industrial Payback Analysis
To provide an actionable investment framework for plant asset managers, Table 11 synthesizes the capital expenditure (CAPEX), operational expenditure (OPEX), and estimated payback horizons for diagnostic technology deployment across three representative photovoltaic asset scales.
Table 11.
Economic scalability and cost–benefit trade-offs of diagnostic deployments across photovoltaic plant scales.
4.5. Metrological and Environmental Standardization in Outdoor Inspections
Quantitative interpretation of outdoor aerial thermography remains limited by environmental variability. Natural variations in ambient wind speed induce convective heat transfer that flattens apparent temperature differentials (), while atmospheric humidity attenuates LWIR transmission [34]. Furthermore, solar reflection glint at shallow camera angles creates false-positive hotspot detections.
To overcome these metrological limitations, international standardization must formalize real-time analytical correction models. Dynamic environmental telemetry (in-plane irradiance, ultrasonic anemometer wind vectors, ambient temperature, relative humidity) collected concurrently by onboard UAV sensors or ground stations must be integrated into automated radiometric compensation equations.
4.6. Edge Intelligence vs. Cloud Computing Deployment Trade-Offs
The deployment of diagnostic algorithms involves a strategic choice between centralized cloud architectures and onboard edge computing:
- Cloud Architectures: Centralized cloud servers provide unlimited computational capacity, supporting massive vision transformers and complex multivariable aggregations [31]. However, uploading raw 4K video or radiometric orthomosaics from remote multi-MW plants incurs prohibitive cellular/satellite data costs, latency delays, and network bandwidth saturation.
- Edge Computing: Running lightweight deep models (pruned YOLO, Quantized MobileNet) onboard embedded microcontrollers (ESP32, STM32) or UAV companion computers (NVIDIA Jetson) enables real-time inferencing (30–60 FPS) directly during flight [23,57]. This permits immediate in situ defect tagging and limits telemetry to uploading lightweight alarm coordinates and metadata, reducing communication bandwidth by over 80% [25].
4.7. Conceptual Roadmap Toward Multimodal Digital Twins: Architectural Reference and Orchestration Bottlenecks
The diagnostic ambiguities inherent to individual sensing modalities indicate that single-sensor condition monitoring is insufficient for automated plant management. As demonstrated by Hong et al. [50] and Zhang et al. [51], fusing visible (RGB) and infrared (IRT) data eliminates false alarms caused by surface dust, bird drop shadows, and transient cloud cover.
In this context, the development of Photovoltaic Digital Twins represents an ambitious conceptual frontier. However, rather than viewing digital twins as an immediately deployable, off-the-shelf commercial reality, the state-of-the-art literature indicates that they must be understood as a conceptual architectural reference blueprint and long-term technology roadmap. An end-to-end multimodal digital twin envisions the continuous integration of three complementary operational layers:
- Continuous Operational Electrical Layer: In situ open-source IoT nodes capturing real-time high-frequency I-V curves, DC string currents, and temperatures.
- Periodic Aerial Thermal Orthomosaic Layer: RTK-guided autonomous UAV flights providing sub-decimetric georeferenced macroscopic hotspot mapping.
- Targeted Microscopic Optical Luminescence Layer: Scheduled nocturnal aerial EL or terrestrial PL sweeps targeted specifically at strings flagged by electrical and thermal anomalies.
Despite the theoretical elegance of this three-layer hierarchy, realizing an operational digital twin in commercial utility-scale solar farms currently faces severe software and architectural bottlenecks:
- Heterogeneous Data Model Alignment: Photovoltaic plants lack a universal, standardized semantic data ontology. SCADA systems log discrete time-series electrical data using vendor-proprietary protocols (Modbus, DNP3, IEC 60870-5-104), whereas drone inspections output spatial rasters and vector shapefiles, and laboratory EL systems generate uncalibrated 16-bit TIFF images. Aligning these asynchronous, multi-resolution data streams into a coherent spatiotemporal database requires non-trivial extract–transform–load (ETL) data pipelines.
- Spatiotemporal Registration Latency: Dynamic environmental variations (cloud transients, temperature swings) occur on second-scale intervals, whereas aerial orthomosaics represent multi-hour static snapshots. Fusing high-frequency electrical transients with static aerial rasters requires advanced state estimation and temporal interpolation algorithms that remain active areas of research.
- Lack of Standardized Inverter-to-Drone APIs: Industrial inverters and commercial UAV flight planning systems currently operate in strict technological silos. Autonomous closed-loop maintenance—wherein an inverter alarm automatically commands a drone-in-a-box to launch and inspect a specific string—requires open, standardized industrial APIs that have not yet been ratified by international standards bodies.
- Cyber-Physical Security Boundaries: Interfacing autonomous aerial robotics with grid-connected utility-scale power infrastructure introduces critical cyber-physical security vulnerabilities. Edge-to-cloud telemetry pipelines must comply with stringent critical infrastructure cybersecurity standards (e.g., NERC CIP, IEC 62443), imposing strict encryption, authentication, and air-gapping requirements that complicate plug-and-play digital twin deployments.
4.8. Methodological Limitations of This Systematic Review
To ensure academic transparency and contextualize the findings of this systematic review, several inherent methodological limitations must be explicitly acknowledged:
- Database Indexing Boundaries and Language Delimitation: The primary search protocol was executed strictly within the Scopus bibliographic database for peer-reviewed English-language articles. While Scopus provides comprehensive coverage of high-impact photovoltaic and computer vision literature [11], it inherently omits specialized regional databases, most notably the China National Knowledge Infrastructure (CNKI). Although Chinese institutional research is strongly represented in our corpus (accounting for 33.3% of included studies, ), Chinese-language domestic journals and industry technical reports were excluded due to indexing constraints and language filtering.
- Rapid Algorithmic Obsolescence: The computer vision and deep learning domains evolve at an extraordinary pace. Object detection architectures (e.g., YOLO variants) have transitioned across multiple architectural generations (from YOLOv5 to YOLOv11) within a three-year window. While this review captures the foundational paradigms and comparative benchmarks established between 2022 and 2025, specific neural backbone iterations will inevitably be superseded by newer transformer and vision-language architectures.
- Scarcity of Standardized Public Benchmark Datasets: A substantial proportion of primary studies evaluated their models on private, proprietary datasets acquired at single geographic sites. This pervasive reliance on private data limits absolute cross-study reproducibility and precludes formal statistical meta-analyses, as model performance cannot be decoupled from site-specific flight altitudes, camera hardware, and environmental conditions.
- Limited Field Operational Data on Emerging Cell Technologies: The vast majority of empirical studies published during the 2022–2025 review window evaluated conventional p-type PERC monocrystalline or polycrystalline modules. Next-generation technologies—including n-type TOPCon, Heterojunction (HJT), back-contact (BC), and perovskite–silicon tandem modules—have only entered mass commercial deployment recently. Consequently, peer-reviewed empirical datasets detailing the long-term field degradation signatures and AI diagnostic performance on these advanced cell architectures remain scarce in the current literature.
5. Conclusions
This systematic literature review has synthesized the state of the art (2022–2025) regarding the integration of machine learning and deep learning models with electrical (I-V), thermal (aIRT), and optical (EL/PL) diagnostic modalities, alongside enabling low-cost IoT and UAV platforms. Based on the rigorous synthesis of the 39 included primary empirical studies, the principal conclusions are summarized as follows:
- Demonstrated Physical–Electrical Multimodal Synergy: Quantitative electrical diagnosis via inline modular I-V curve tracing indispensably complements visual screening from infrared thermography and electroluminescence. While aerial thermography geolocates macroscopic thermal anomalies at high scanning throughput (5–10 h per 4 MW), it remains blind to non-dissipative microcracks and susceptible to temporary shading false alarms. Fusing electrical telemetry, infrared thermography, and visible-band imagery provides the only robust path to unequivocally isolate defect root causes and eliminate false positives.
- Hierarchical Sequential Screening Protocol: To reconcile diagnostic precision with economic reality, utility-scale maintenance should adopt a three-tier screening protocol: Level 1 continuous in situ IoT/inverter monitoring flags degraded strings at zero incremental labor cost; Level 2 autonomous RTK-guided UAV thermography rapidly geolocates macroscopic hotspots across the flagged capacity; and Level 3 microscopic electroluminescence or photoluminescence is selectively dispatched only to the small fraction (<2–5%) of modules exhibiting unresolved power loss or warranty disputes.
- Geospatial Precision via RTK-Equipped UAVs: Integrating Real-Time Kinematic (RTK) positioning onto autonomous aerial platforms reduces spatial georeferencing error to sub-decimetric levels (<5 cm). This centimetric fidelity enables the automated temporal registration of historical thermal orthomosaics, transforming inspections into unattended multi-temporal workflows that track degradation progression module-by-module.
- High-Efficiency Edge Intelligence and Telemetry Compression: Deep learning architectures optimized for embedded deployment—most notably lightweight YOLO object detectors and modified U-Net segmenters—achieve real-time inference speeds (30–60 FPS) on embedded hardware (NVIDIA Jetson, Raspberry Pi). Deploying edge intelligence directly aboard UAVs and combiner boxes compresses raw data payloads by >95%, transmitting lightweight JSON alarms and single-diode model parameters over constrained industrial LPWAN (LoRaWAN/NB-IoT) channels.
- Technological Democratization via Open-Source Hardware: The empirical validation of decentralized diagnostic prototypes based on low-cost microcontrollers (ESP32) and open sensors confirms the feasibility of deploying continuous string surveillance networks at costs below USD 100 per node, opening advanced predictive maintenance to small and medium-scale installations.
- Actionable Industrial and Standardization Roadmap: To achieve full industrial maturity, the solar diagnostic community must resolve four critical challenges: (a) formulating domain generalization techniques to counter 15–25% accuracy drops across emerging cell architectures (bifacial, TOPCon, HJT); (b) formalizing international metrological correction standards for outdoor thermal data under dynamic wind and irradiance conditions; (c) curating open, multi-technology benchmark datasets to advance reproducible AI research; and (d) developing standardized APIs and semantic ontologies to transition multimodal digital twins from conceptual architectural blueprints into interoperable commercial tools.
Author Contributions
Conceptualization, A.F.V.G. and L.H.C.; methodology, A.F.V.G., V.A.G. and L.H.C.; software, A.F.V.G. and M.J.C.C.; validation, V.A.G., M.J.S.J., A.L.Z.L. and C.A.U.G.; formal analysis, A.F.V.G., A.R.P. and L.H.C.; investigation, A.F.V.G., V.A.G. and M.J.C.C.; data curation, A.F.V.G. and C.A.U.G.; writing—original draft preparation, A.F.V.G. and L.H.C.; writing—review and editing, V.A.G., M.J.S.J., A.L.Z.L., A.R.P. and L.H.C.; visualization, A.F.V.G. and M.J.C.C.; supervision, L.H.C.; project administration, L.H.C.; funding acquisition, L.H.C. All authors have read and agreed to the published version of the manuscript.
Funding
This research was supported by the Ministry of Science, Innovation, and Universities of Spain through the “Plan Estatal de Investigación Científica, Técnica y de Innovación” (Project ID: PID2023-148369OB-C43). Funding from the European Social Fund Plus (ESF+), the Operational Programme of Castilla y León, and the regional government Junta de Castilla y León through the Consejería de Educación is gratefully acknowledged.
Institutional Review Board Statement
Not applicable.
Informed Consent Statement
Not applicable.
Data Availability Statement
Data sharing is not applicable to this article as no new primary empirical datasets were created. All analyzed data are derived from the published literature cited in the text.
Conflicts of Interest
The authors declare no conflict of interest. The funders had no role in the design of the study; in the collection, analyses, or interpretation of data; in the writing of the manuscript; or in the decision to publish the results.
Abbreviations
The following abbreviations are used in this manuscript:
| AI | Artificial Intelligence |
| aIRT | Aerial Infrared Thermography |
| ANN | Artificial Neural Network |
| CNN | Convolutional Neural Network |
| DL | Deep Learning |
| EL | Electroluminescence |
| FF | Fill Factor |
| GAN | Generative Adversarial Network |
| GSD | Ground Sampling Distance |
| HJT | Heterojunction Technology |
| InGaAs | Indium Gallium Arsenide |
| IoT | Internet of Things |
| IoU | Intersection over Union |
| IRT | Infrared Thermography |
| I-V | Current–Voltage |
| KNN | K-Nearest Neighbors |
| LCOE | Levelized Cost of Electricity |
| LOPO | Leave-One-Park-Out |
| LoRaWAN | Long-Range Wide-Area Network |
| LPWAN | Low-Power Wide-Area Network |
| LWIR | Long-Wave Infrared |
| mAP | Mean Average Precision |
| ML | Machine Learning |
| MOSFET | Metal–Oxide–Semiconductor Field-Effect Transistor |
| MPPT | Maximum Power Point Tracking |
| NB-IoT | Narrow-Band Internet of Things |
| PERC | Passivated Emitter and Rear Cell |
| PID | Potential-Induced Degradation |
| PLC | Power Line Communication |
| PL | Photoluminescence |
| PRISMA | Preferred Reporting Items for Systematic Reviews and Meta-Analyses |
| PSO | Particle Swarm Optimization |
| PV | Photovoltaic |
| QA | Quality Assessment |
| RGB | Red–Green–Blue (Visible Spectrum) |
| RMSE | Root Mean Square Error |
| RTK | Real-Time Kinematic |
| SCADA | Supervisory Control and Data Acquisition |
| SfM | Structure from Motion |
| SVM | Support Vector Machine |
| SWIR | Short-Wave Infrared |
| TOPCon | Tunnel Oxide Passivated Contact |
| UAV | Unmanned Aerial Vehicle |
| UDA | Unsupervised Domain Adaptation |
| ViT | Vision Transformer |
| YOLO | You Only Look Once |
References
- International Renewable Energy Agency. World Energy Transitions Outlook 2023: 1.5 °C Pathway; Technical Report; IRENA: Abu Dhabi, United Arab Emirates, 2023; Available online: https://www.irena.org/Publications/2023/Jun/World-Energy-Transitions-Outlook-2023 (accessed on 12 October 2026).
- International Energy Agency Photovoltaic Power Systems Programme. Trends in Photovoltaic Applications 2023. Technical Report Report IEA-PVPS T1-44:2023, IEA-PVPS, 2023. Available online: https://iea-pvps.org/trends_reports/trends-2023/ (accessed on 12 October 2026).
- Jordan, D.C.; Kurtz, S.R. Photovoltaic Degradation Rates—An Analytical Review. Prog. Photovolt. Res. Appl. 2011, 21, 12–29. [Google Scholar] [CrossRef] [Scilit]
- Tang, W.; Yang, Q.; Dai, Z.; Yan, W. Module defect detection and diagnosis for intelligent maintenance of solar photovoltaic plants: Techniques, systems and perspectives. Energy 2024, 297, 131222. [Google Scholar] [CrossRef] [Scilit]
- de Oliveira, A.K.V.; Aghaei, M.; Rüther, R. Automatic Inspection of Photovoltaic Power Plants Using Aerial Infrared Thermography: A Review. Energies 2022, 15, 2055. [Google Scholar] [CrossRef] [Scilit]
- Vergura, S. Unmanned Aerial Vehicle for Infrared Inspection of Photovoltaic Modules. Renew. Energy Power Qual. J. 2024, 20, 621–624. [Google Scholar] [CrossRef] [Scilit]
- Meribout, M. Sensor Systems for Solar Plant Monitoring. IEEE Trans. Instrum. Meas. 2023, 72, 9502016. [Google Scholar] [CrossRef] [Scilit]
- Meribout, M.; Kumar Tiwari, V.; Pablo Peña Herrera, J.; Najeeb Mahfoudh Awadh Baobaid, A. Solar panel inspection techniques and prospects. Measurement 2023, 209, 112466. [Google Scholar] [CrossRef] [Scilit]
- Page, M.J.; McKenzie, J.E.; Bossuyt, P.M.; Boutron, I.; Hoffmann, T.C.; Mulrow, C.D.; Shamseer, L.; Tetzlaff, J.M.; Akl, E.A.; Brennan, S.E.; et al. The PRISMA 2020 statement: An updated guideline for reporting systematic reviews. BMJ 2021, 372, n71. [Google Scholar] [CrossRef] [Scilit] [PubMed]
- Baas, J.; Schotten, M.; Plume, A.; Côt’e, G.; Karimi, R. Scopus as a curated, high-quality bibliometric data source for academic research in quantitative science studies. Quant. Sci. Stud. 2020, 1, 377–386. [Google Scholar] [CrossRef] [Scilit]
- Martín-Martín, A.; Orduna-Malea, E.; Thelwall, M.; López-Cózar, E.D. Google Scholar, Web of Science, and Scopus: A systematic comparison of citations in 252 subject categories. J. Inf. 2018, 12, 1160–1177. [Google Scholar] [CrossRef] [Scilit]
- GB/T 39857-2021; Technical Specification for Infrared Thermography Defect Detection of Photovoltaic Modules Using Unmanned Aerial Vehicles. National Standard of the People’s Republic of China: Beijing, China, 2021. Available online: https://openstd.samr.gov.cn/bzgk/gb/newGbInfo?hcno=83906F85C7D095B5ECBC82F9960241A3 (accessed on 12 October 2026).
- IEC TS 62446-3:2017; Photovoltaic (PV) Systems—Requirements for Testing, Documentation and Maintenance—Part 3: Photovoltaic Modules and Plants—Outdoor Infrared Thermography. International Electrotechnical Commission: Geneva, Switzerland, 2017. Available online: https://webstore.iec.ch/publication/28628 (accessed on 12 October 2026).
- Roumpakias, E.; Stamatelos, A. Health Monitoring and Fault Detection in Photovoltaic Systems in Central Greece Using Artificial Neural Networks. Appl. Sci. 2022, 12, 12016. [Google Scholar] [CrossRef] [Scilit]
- Dolara, A.; Niccolai, A.; Grimaccia, F. Photovoltaic Plant State-of-Health Estimation by Means of UAV and Electric Measurements. In Proceedings of the 2023 IEEE International Conference on Environment and Electrical Engineering and 2023 IEEE Industrial and Commercial Power Systems Europe (EEEIC/I&CPS Europe), Madrid, Spain, 6–9 June 2023; pp. 1–6. [Google Scholar] [CrossRef] [Scilit]
- Sarwat, A.; McCluskey, P.; Mazumder, S.K.; Russell, M.; Roy, S.; Tufail, S.; Dharmasena, S.; Stevenson, A. Reliability Assessment of Grid Connected Solar Inverters in 1.4 MW PV Plant from Anomalous Classified Real Field Data. In Proceedings of the 2022 North American Power Symposium (NAPS), Salt Lake City, UT, USA, 9–11 October 2022; pp. 1–6. [Google Scholar] [CrossRef] [Scilit]
- Wang, Y.; Xu, J.; Xu, F.; Deng, L.; Jin, C.; Bao, W.; Xie, Y. Contactless Diagnosis Method and Unsupervised Learning for Panel-Level Photovoltaic Plant Operation and Maintenance. IEEE Access 2024, 12, 174808–174817. [Google Scholar] [CrossRef] [Scilit]
- Chokr, B.; Chatti, N.; Charki, A.; Lemenand, T.; Hammoud, M. Feature Extraction-Reduction and Machine Learning for Fault Diagnosis in PV Panels. Sol. Energy 2023, 262, 111918. [Google Scholar] [CrossRef] [Scilit]
- Nguimfack Ndongmo, J.d.D.; Kentsa Zana, K. Development of a Simplified Data Acquisition Kit for PV Systems in Africa. E3S Web Conf. 2022, 354, 02001. [Google Scholar] [CrossRef] [Scilit]
- Bossi, S.; Blasi, L.; Cupertino, G.; dell’Erba, R.; Cipollini, A.; De Vito, S.; Santoro, M.; Di Francia, G.; Tina, G.M. Floating Photovoltaic Plant Monitoring: A Review of Requirements and Feasible Technologies. Sustainability 2024, 16, 8367. [Google Scholar] [CrossRef] [Scilit]
- Ying, Y.; Ying, P.; Men, H.; Joo, Y.H. Image Registration Based Fault Localization in Panoramas of Mountain-Mounted PV Plants. Sol. Energy 2023, 256, 16–31. [Google Scholar] [CrossRef] [Scilit]
- Laguna, G.; Moreno, P.; Cipriano, J.; Mor, G.; Gabaldón, E.; Luna, A. Detection of Abnormal Photovoltaic Systems’ Operation with Minimum Data Requirements Based on Recursive Least Squares Algorithms. Sol. Energy 2024, 274, 112556. [Google Scholar] [CrossRef] [Scilit]
- Wang, D.; Yan, P.; Yao, C.; Xiao, B.; Zhao, W.; Zhu, R. A lightweight joint metric detection approach on YOLO for hot spots in photovoltaic modules. J. Renew. Sustain. Energy 2024, 16, 053503. [Google Scholar] [CrossRef] [Scilit]
- Tang, W.; Yang, Q.; Hu, X.; Yan, W. Deep learning-based linear defects detection system for large-scale photovoltaic plants based on an edge-cloud computing infrastructure. Sol. Energy 2022, 231, 527–535. [Google Scholar] [CrossRef] [Scilit]
- Tang, W.; Yang, Q.; Hu, X.; Yan, W. Edge Intelligence for Smart EL Images Defects Detection of PV Plants in the IoT-Based Inspection System. IEEE Internet Things J. 2023, 10, 3047–3056. [Google Scholar] [CrossRef] [Scilit]
- De Riso, M.; Guerriero, P.; Matacena, I.; Daliento, S. A tool providing I-V curve and IS analysis of a PV module embedded in a string. In Proceedings of the 2023 8th International Conference on Smart and Sustainable Technologies (SpliTech); IEEE: New York City, NY, USA, 2023; pp. 1–6. [Google Scholar] [CrossRef] [Scilit]
- Chen, Z.; Zheng, H.; Zhong, S.; Yang, J.; Wu, L.; Cheng, S.; Lin, P.; Long, C.; Jiang, L. Development of a self-powered wireless I-V tracer for online inspection and modelling of individual photovoltaic modules. Sol. Energy 2026, 303, 114097. [Google Scholar] [CrossRef] [Scilit]
- Morales-Aragonés, J.I.; Gallardo-Saavedra, S.; Alonso Gómez, V.; Sánchez-Pacheco, F.J.; González, M.A.; Martínez, O.; Muñoz-García, M.A.; Alonso-García, M.d.C.; Hernández Callejo, L. Low-Cost Electronics for Online I-V Tracing at Photovoltaic Module Level: Development of Two Strategies and Comparison between Them. Electronics 2021, 10, 671. [Google Scholar] [CrossRef] [Scilit]
- Hussain, I.; Khalil, I.; Islam, A.; Ahsan, M.; Iqbal, T.; Chowdhury, M.; Techato, K.; Ullah, N. Unified Fuzzy Logic Based Approach for Detection and Classification of PV Faults Using I-V Trend Line. Energies 2022, 15, 5106. [Google Scholar] [CrossRef] [Scilit]
- Zhang, Z.; Ma, M.; Ma, W.; Zhang, R.; Wang, J. A data-driven photovoltaic string current mismatch fault diagnosis method based on I-V curve. Microelectron. Reliab. 2022, 138, 114705. [Google Scholar] [CrossRef] [Scilit]
- Emamian, M.; Eskandari, A.; Aghaei, M.; Nedaei, A.; Sizkouhi, A.M.; Milimonfared, J. Cloud Computing and IoT Based Intelligent Monitoring System for Photovoltaic Plants Using Machine Learning Techniques. Energies 2022, 15, 3014. [Google Scholar] [CrossRef] [Scilit]
- de Souza Silva, J.L.; Mahmoudi, E.; Carvalho, R.R.M.; dos Santos Barros, T.A. Classification of anomalies in photovoltaic systems using supervised machine learning techniques and real data. Energy Rep. 2024, 11, 4642–4656. [Google Scholar] [CrossRef] [Scilit]
- Almas; Sundaram, S.; Dwivedi, U. Predictive analysis of power degradation rate in solar PV systems emphasizing hot spots and visual effects-based failure modes. Renew. Energy 2024, 228, 120684. [Google Scholar] [CrossRef] [Scilit]
- Vergura, S. Criticalities of the Outdoor Infrared Inspection of Photovoltaic Modules by Means of Drones. Energies 2022, 15, 5086. [Google Scholar] [CrossRef] [Scilit]
- Álvarez Tey, G.; García-López, C. Strategy Based on Two Stages for IR Thermographic Inspections of Photovoltaic Plants. Appl. Sci. 2022, 12, 6331. [Google Scholar] [CrossRef] [Scilit]
- Segovia Ramírez, I.; Parra Chaparro, J.R.; García Márquez, F.P. Unmanned aerial vehicle integrated real time kinematic in infrared inspection of photovoltaic panels. Measurement 2022, 188, 110536. [Google Scholar] [CrossRef] [Scilit]
- Cipriani, G.; Di Dio, V.; Favuzza, S.; Mascellino, G.; Massaro, F.; Ruffino, S.; Zizzo, G. Fault Diagnosis On Photovoltaic Modules By Thermographic Analysis with Drone Support. In Proceedings of the 2023 Asia Meeting on Environment and Electrical Engineering (EEE-AM); IEEE: New York City, NY, USA, 2023; pp. 1–6. [Google Scholar] [CrossRef] [Scilit]
- Esposito, M.; Calegari, R.; Guerreiro Marques, J.; Mesbahi, O.; Tlemcani, M. Usage of non-invasive technique to diagnose a photovoltaic plant. Energy Sources Part A Recover. Util. Environ. Eff. 2024, 46, 32–61. [Google Scholar] [CrossRef] [Scilit]
- Jeffrey Kuo, C.F.; Chen, S.H.; Huang, C.Y. Automatic detection, classification and localization of defects in large photovoltaic plants using unmanned aerial vehicles (UAV) based infrared (IR) and RGB imaging. Energy Convers. Manag. 2023, 276, 116495. [Google Scholar] [CrossRef] [Scilit]
- Jahn, U.; Herz, M.; Köntges, M.; Parlevliet, D.; Paggi, M.; Tsanakas, I.; Stein, J.S.; Berger, K.A.; Ranta, S.; French, R.H.; et al. Review on Infrared and Electroluminescence Imaging for PV Field Applications; Technical Report Report IEA-PVPS T13-10:2018; IEA Photovoltaic Power Systems Programme: Federal, Australia, 2018; Available online: https://iea-pvps.org/wp-content/uploads/2020/01/Review_on_IR_and_EL_Imaging_for_PV_Field_Applications_by_Task_13.pdf (accessed on 12 October 2026).
- Del Prado Santamaría, R.; dos Reis Benatto, G.A.; Hass, T.K.; Morino, L.; Poulsen, P.B.; Spataru, S.V. Challenges of Aerial Drone Electroluminescence in Solar Photovoltaic Field Inspections. In Proceedings of the 40th European Photovoltaic Solar Energy Conference and Exhibition, Lisbon, Portugal, 18–22 September 2023; p. 020403. [Google Scholar] [CrossRef]
- Hernández Callejo, L.; Gallardo-Saavedra, S.; Morales-Aragonés, J.I.; Alonso Gómez, V.; Plaza, A.R.; Martínez, D.F. Methodology for Inspection of Defects in Photovoltaic Plants by Drone and Electroluminescence. In Smart Cities; Springer International Publishing: Cham, Switzerland, 2022; pp. 3–14. [Google Scholar] [CrossRef] [Scilit]
- Ling, H.; Liu, M.; Fang, Y. Deep Edge-Based Fault Detection for Solar Panels. Sensors 2024, 24, 5348. [Google Scholar] [CrossRef] [Scilit] [PubMed]
- Tang, W.; Yang, Q.; Yan, W. Deep Learning-Based Algorithm for Multi-Type Defects Detection in Solar Cells with Aerial EL Images for Photovoltaic Plants. Comput. Model. Eng. Sci. 2022, 130, 1423–1439. [Google Scholar] [CrossRef] [Scilit]
- Tradacete-Ágreda, M.; Santiso-Gómez, E.; Rodríguez-Sánchez, F.J.; Hueros-Barrios, P.J.; Jiménez-Calvo, J.A.; Santos-Pérez, C. High-performance IoT Module for real-time control and self-diagnose PV panels under working daylight and dark electroluminescence conditions. Internet Things 2024, 25, 101006. [Google Scholar] [CrossRef] [Scilit]
- Starzyński, J.; Zawadzki, P.; Harańczyk, D. Machine Learning in Solar Plants Inspection Automation. Energies 2022, 15, 5966. [Google Scholar] [CrossRef] [Scilit]
- Shen, Y.; Fan, T.; Lai, G.; Na, Z.; Liu, H.; Wang, Z.; Wang, Y.; Jiao, Y.; Chen, X.; Lou, Z.; et al. Modified U-Net based photovoltaic array extraction from complex scene in aerial infrared thermal imagery. Sol. Energy 2022, 240, 90–103. [Google Scholar] [CrossRef] [Scilit]
- Zefri, Y.; Sebari, I.; Hajji, H.; Aniba, G. An Encoder-Decoder U-Net Based Model for Overheated Photovoltaic Modules Extraction from Orthorectified Remotely Sensed Thermal Infrared UAV Imagery. In Proceedings of the 2022 IEEE Mediterranean and Middle-East Geoscience and Remote Sensing Symposium (M2GARSS); IEEE: New York City, NY, USA, 2022; pp. 25–28. [Google Scholar] [CrossRef] [Scilit]
- Rocha, D.; Alves, J.; Lopes, V.; Teixeira, J.P.; Fernandes, P.A.; Costa, M.; Morais, M.; Salome, P.M.P. Multidefect Detection Tool for Large-Scale PV Plants: Segmentation and Classification. IEEE J. Photovolt. 2023, 13, 291–295. [Google Scholar] [CrossRef] [Scilit]
- Hong, F.; Song, J.; Meng, H.; Wang, R.; Fang, F.; Zhang, G. A novel framework on intelligent detection for module defects of PV plant combining the visible and infrared images. Sol. Energy 2022, 236, 406–416. [Google Scholar] [CrossRef] [Scilit]
- Zhang, Z.; Cao, Y.; Yang, Q. Defect Detection and Classification of Photovoltaic Modules Based on Image Fusion Analysis. In Proceedings of the 2022 IEEE 6th Conference on Energy Internet and Energy System Integration (EI2); IEEE: New York City, NY, USA, 2022; pp. 2460–2465. [Google Scholar] [CrossRef] [Scilit]
- Hernández-López, D.; de Oña, E.R.; Moreno, M.A.; González-Aguilera, D. SunMap: Towards Unattended Maintenance of Photovoltaic Plants Using Drone Photogrammetry. Drones 2023, 7, 129. [Google Scholar] [CrossRef] [Scilit]
- Bommes, L.; Buerhop-Lutz, C.; Pickel, T.; Hauch, J.; Brabec, C.; Marius Peters, I. Georeferencing of photovoltaic modules from aerial infrared videos using structure-from-motion. Prog. Photovolt. Res. Appl. 2022, 30, 1122–1135. [Google Scholar] [CrossRef] [Scilit]
- Bommes, L.; Hoffmann, M.; Buerhop-Lutz, C.; Pickel, T.; Hauch, J.; Brabec, C.; Maier, A.; Marius Peters, I. Anomaly detection in IR images of PV modules using supervised contrastive learning. Prog. Photovolt. Res. Appl. 2022, 30, 597–614. [Google Scholar] [CrossRef] [Scilit]
- Ying, Y.; Qi, Y.; Rong, L.; Men, H.; Joo, Y.H. Anchor Points Based Accurate Fault Locating in Large-Scale Photovoltaic Plants via Aerial Infrared Videos. IEEE J. Photovolt. 2022, 12, 437–443. [Google Scholar] [CrossRef] [Scilit]
- Barraz, Z.; Sebari, I.; Ait El Kadi, K.; Lamrini, N.; Ait Abdelmoula, I. One to segment them All: A Data-based Domain Generalization approach for Solar Module segmentation using Thermal UAV Images. In Proceedings of the 2024 10th International Conference on Control, Decision and Information Technologies (CoDIT); IEEE: New York City, NY, USA, 2024; pp. 1751–1755. [Google Scholar] [CrossRef] [Scilit]
- Ochoa, J.; García, E.; Quiles, E.; Correcher, A. Redundant Fault Diagnosis for Photovoltaic Systems Based on an IRT Low-Cost Sensor. Sensors 2023, 23, 1314. [Google Scholar] [CrossRef] [Scilit] [PubMed]
- Segovia Ramírez, I.; García Márquez, F.P. Machine Learning for Fault Detection and Diagnosis of Large Photovoltaic Plants Through Internet of Things Platform. SN Comput. Sci. 2023, 5, 8. [Google Scholar] [CrossRef] [Scilit]
- Segovia Ramirez, I.; Pedro García Márquez, F. Internet of Things Platform for Photovoltaic Maintenance Management: Combination of Supervisory Control and Data Acquisition System and Aerial Thermal Images. E3S Web Conf. 2023, 409, 04014. [Google Scholar] [CrossRef] [Scilit]
- Ramirez, I.S.; Munoz Del Rio, A.; Garcia Marquez, F.P. IoT Platform Combined with Machine Learning Techniques for Fault Detection and Diagnosis of Large Photovoltaic Plants. In Proceedings of the 2022 3rd International Conference on Computing, Analytics and Networks (ICAN); IEEE: New York City, NY, USA, 2022; pp. 1–6. [Google Scholar] [CrossRef] [Scilit]
- Kumar, V.; Maheshwari, P. Advanced analytics on IV curves and electroluminescence images of photovoltaic modules using machine learning algorithms. Prog. Photovolt. Res. Appl. 2021, 30, 880–888. [Google Scholar] [CrossRef] [Scilit]
- IEC 60904-1:2020; Photovoltaic Devices—Part 1: Measurement of Photovoltaic Current-Voltage Characteristics. IEC: Geneva, Switzerland, 2020. Available online: https://webstore.iec.ch/publication/32004 (accessed on 12 October 2026).
- IEC TS 60904-13:2018; Photovoltaic Devices—Part 13: Electroluminescence of Photovoltaic Modules. IEC: Geneva, Switzerland, 2018. Available online: https://webstore.iec.ch/publication/26703 (accessed on 12 October 2026).
- Su, B.; Zhou, Z.; Chen, H. PVEL-AD: A Large-Scale Open-World Dataset for Photovoltaic Cell Anomaly Detection. IEEE Trans. Ind. Inform. 2023, 19, 404–413. [Google Scholar] [CrossRef] [Scilit]
- Pierdicca, R.; Paolanti, M.; Felicetti, A.; Piccinini, F.; Zingaretti, P. Automatic Faults Detection of Photovoltaic Farms: SolAIr, a Deep Learning-Based System for Thermal Images. Energies 2020, 13, 6496. [Google Scholar] [CrossRef] [Scilit]
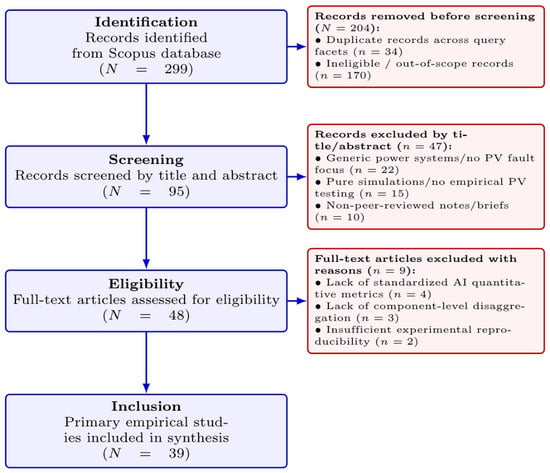
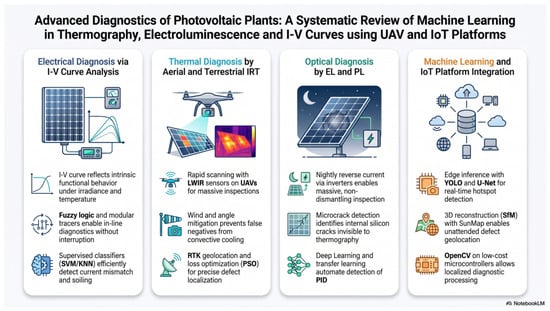
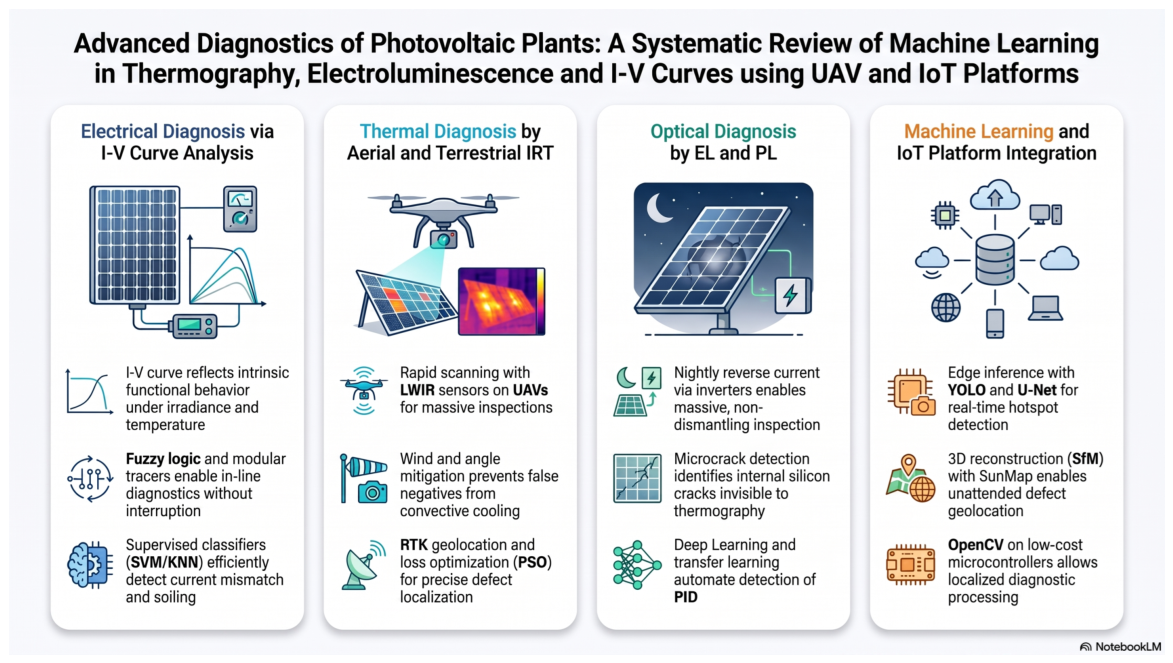

Disclaimer/Publisher’s Note: The statements, opinions and data contained in all publications are solely those of the individual author(s) and contributor(s) and not of MDPI and/or the editor(s). MDPI and/or the editor(s) disclaim responsibility for any injury to people or property resulting from any ideas, methods, instructions or products referred to in the content. |
© 2026 by the authors. Licensee MDPI, Basel, Switzerland. This article is an open access article distributed under the terms and conditions of the Creative Commons Attribution (CC BY) license.