


Abstract
Biometric authentication is increasingly deployed on devices with limited enrollment data, computation, and storage, yet classifier comparisons are still commonly reported as single-point accuracies obtained on data-rich benchmarks. This paper presents a constraint-aware empirical evaluation of five lightweight classifier families for biometric verification—k-nearest neighbors (k-NN), linear discriminant analysis (LDA), a standardized deviation threshold rule, a linear support vector machine (SVM), and a shallow multilayer perceptron (MLP)—rather than proposing a new classifier. On the CMU keystroke dynamics benchmark, a session-disjoint protocol (enrollment on sessions 1–6, verification on sessions 7–8) varies the enrollment size (N = 10, 50, 200) against a fixed held-out test set, controls the genuine-to-impostor ratio, selects every hyperparameter on training-only validation splits, and reports the receiver operating characteristic (ROC)-interpolated equal error rate (EER) with subject-level 95% confidence intervals across 51 subjects. Linear SVM achieves the lowest mean EER at every enrollment size (10.5%, 8.6%, and 8.0%). The gaps among SVM, LDA, and k-NN narrow markedly as enrollment grows; at N = 200, k-NN differs significantly from neither LDA nor SVM, and the LDA–SVM difference, though statistically significant, is only 0.41 percentage points. The evaluated shallow MLP is especially sensitive to the smallest enrollment setting (26.7% EER at N = 10). In a secondary ORL face verification case study (N = 5, repeated splits, 40 subjects), LDA on standardized raw pixels reaches a 1.47% mean EER, and a predefined 40-component PCA yields no improvement; a dimensionality sensitivity analysis shows that PCA-40 captures 81.21% of the training set variance on average, and that performance improves substantially through approximately 40–80 components, with relatively small changes thereafter. On the desktop CPU test platform, 99th-percentile single-query latency stays below 0.7 ms for every configuration, although isolated larger observations preclude a hard-real-time guarantee; together with serialized deployment-bundle sizes, these measurements make the accuracy–latency–storage trade-offs explicit. Overall, the findings characterize constraint-dependent trade-offs for the evaluated datasets and configurations rather than identifying a universally superior classifier.
1. Introduction
Biometric authentication increasingly runs on devices with limited enrollment data, computation, and storage—smartphones, wearables, and embedded access-control terminals that must authenticate locally and quickly. Three constraints dominate this setting. Enrollment is typically small because a user cannot reasonably provide hundreds of samples during setup; inference must complete within a practical latency budget; and storage for per-user templates and models is often limited. Because these conditions differ sharply from the data-rich, offline benchmarks on which classifiers are usually compared, behavior observed with abundant training data need not carry over when only a few tens of enrollment samples are available.
A second issue, especially for behavioral biometrics, is temporal (session) shift. Traits such as keystroke timing are captured across enrollment and authentication sessions separated in time, and a subject’s behavior can drift between sessions. A protocol that partitions samples at random, ignoring session boundaries, may place samples from the same session on both sides of the training/test split, and can therefore yield estimates that do not reflect the realistic enroll-now-authenticate-later setting, in which authentication occurs during sessions never seen at enrollment.
Much recent biometric research has centered on deep learned representations, which perform strongly when large, diverse training sets are available [1,2]. That line of work addresses a different question from the one studied here. When per-user enrollment is scarce and the feature representation is fixed, the pertinent question is how the performance and deployment trade-offs of lightweight classifier families vary with enrollment, class balance, latency, and storage constraints. Edge-oriented models and compact hybrid architectures occupy a related, resource-conscious design space [3,4]; the present study, however, deliberately isolates the classifier rather than introducing or comparing learned feature representations.
This study therefore evaluates five lightweight classifier families—k-nearest neighbors (k-NN), linear discriminant analysis (LDA), a standardized deviation threshold rule, a linear support vector machine (SVM), and a shallow multilayer perceptron (MLP)—while holding the feature representation and evaluation framework fixed. We do not frame the comparison as “classical versus machine learning,” because k-NN, LDA, and SVM are all machine learning methods; the meaningful contrast is between lightweight non-neural classifiers and a shallow neural baseline applied to the same handcrafted features. Two modalities are used: the CMU keystroke dynamics benchmark [5] as the primary evaluation and the ORL face database [6] as a secondary case study in a structurally different modality.
The experimental design targets several methodological pitfalls known to distort classifier comparisons—data leakage, tuning on test data, class imbalance, and treating repeated random runs as independent observations [7,8]. For CMU, the primary protocol separates enrollment and verification sessions, uses a fixed held-out test set with nested enrollment sizes (N = 10, 50, 200), and treats class balance as a distinct experimental factor. All hyperparameters and preprocessing statistics are estimated from training data only. Verification is measured with a receiver operating characteristic (ROC)-interpolated equal error rate (EER) alongside fixed operating points, and statistical inference is carried out at the subject level across the 51 participants rather than treating random seeds as independent samples.
Under this session-disjoint CMU protocol, linear SVM attains the lowest mean EER at every enrollment size, falling from 10.5% at N = 10 to 8.0% at N = 200. The gaps among SVM, LDA, and k-NN shrink substantially as enrollment grows: at N = 200, k-NN differs significantly from neither LDA nor SVM after Holm correction, and the LDA–SVM difference, though statistically significant, is small in absolute terms. By contrast, the evaluated shallow MLP is highly sensitive to scarce enrollment, reaching a 26.7% mean EER at N = 10 before improving substantially with more data. A separate class balance control then tests whether these enrollment-dependent effects can be explained simply by the changing genuine-to-impostor training ratio.
The ORL face verification case study provides a secondary examination under a revised N = 5 repeated-split protocol with subject-level inference across 40 identities. For k-NN and LDA, standardized raw pixels are compared with a predefined 40-component principal component analysis (PCA) representation. To check whether the predefined dimensionality drives the conclusions, a sensitivity analysis additionally evaluates PCA with 10, 20, 40, 80, and 150 components, fitting PCA only on the training partition and using the sweep to characterize explained variance and the EER rather than to select a dimensionality from test performance. The predefined PCA-40 representation captures 81.21% of the training set variance on average, with little variation across the repeated splits (standard deviation (SD) = 0.203 percentage points), and performance improves substantially through approximately 40–80 components, with relatively small changes thereafter.
Beyond verification accuracy, this study characterizes computational costs through single-query CPU latency and serialized deployment-bundle size. Latency is reported as the mean, P50, P95, P99, and observed-maximum values rather than interpreted as a hard-real-time guarantee, and serialized model and preprocessing artifacts are reported as a storage-size proxy rather than as runtime memory. Together, these measurements give an empirical picture of the accuracy–latency–storage trade-offs across the evaluated configurations.
The contribution of this work is thus not a new classifier or representation but a controlled, constraint-indexed empirical evaluation of lightweight classifier behavior. It combines session-aware evaluation, fixed-test-set enrollment scaling, explicit class balance controls, training-only hyperparameter and preprocessing selection, subject-level inference, a cross-modality case study with a PCA dimensionality sensitivity analysis, and deployment-oriented latency and storage measurements. The findings are meant to characterize how the evaluated families behave under specific resource and enrollment constraints, not to establish a universal classifier ranking.
The remainder of this paper is organized as follows. Section 2 reviews related work. Section 3 describes the datasets, preprocessing, classifier families, constraint protocols, statistical methodology, and implementation. Section 4 presents the CMU and ORL results together with the latency and deployment-size measurements. Section 5 discusses the trade-offs, scope, and limitations. Section 6 reports the computational repeatability re-execution, and Section 7 concludes.
2. Related Work
Killourhy and Maxion [5] introduced the CMU keystroke dynamics benchmark and compared a range of anomaly detection algorithms for fixed-password keystroke verification. They found that simple distance-based detectors were competitive with more elaborate methods—their Euclidean-distance detector reached about 16.9% EER—and that detector rankings were sensitive to how scores were normalized across users. Their study framed keystroke verification chiefly as one-class anomaly detection; the present work instead evaluates supervised one-vs-rest verification on the same benchmark under explicit enrollment size, session separation, and class balance controls.
The ORL face database, introduced by Samaria and Harter [6], contains 40 subjects with 10 images each. Its small per-subject sample count makes it a natural testbed for small-enrollment comparisons, although, as Section 3.8 notes, it is ill-suited to protocols that leave only a couple of genuine test images per subject.
Jain, Ross, and Prabhakar [9] provide the standard framework for biometric evaluation, including the false-accept/false-reject trade-offs and the equal error rate as a single-number summary used throughout this paper. On the classifier side, Duda, Hart, and Stork [10] give the classical statistical treatment of k-NN and LDA, including the singular within-class scatter that arises when the number of samples per class is smaller than the feature dimensionality; Vapnik [11] establishes the margin-maximization principle behind the linear SVM; and Belhumeur, Hespanha, and Kriegman [12] compare Eigenfaces and Fisherfaces, showing that a PCA projection before LDA can both resolve the singular-scatter condition and change discriminative performance. Our ORL analysis revisits that pipeline question under subject-level inference, contrasting a default solver LDA that needs no explicit PCA front-end with a predefined PCA representation.
More broadly, keystroke and face biometrics have increasingly incorporated deep, learned representations. The IEEE BigData 2023 Keystroke Verification Challenge reported global EERs as low as approximately 3.3% with neural architectures on large-scale databases [1], and continuous-authentication systems now exploit richer sensing such as RGB-D image sequences [2]. Such results demonstrate the effectiveness of learned representations when substantial training data are available while motivating separate studies of the scarce-enrollment regime considered here, where per-user enrollment data are limited. Surveys of on-device artificial intelligence document a move toward models designed for resource-constrained deployment [3], and compact hybrids such as EdgeEar pair lightweight convolutional and transformer components with efficient inference for edge biometrics [4], occupying a middle ground between traditional lightweight classifiers and larger deep architectures.
Recent work further illustrates the diversity of evaluation settings used in keystroke authentication. Risto and Graven introduced a fixed-text dataset containing multiple passwords and evaluated statistical and k-NN-based authentication approaches, emphasizing password characteristics and realistic attack attempts [13]. Budžys et al. evaluated a deep learning and data fusion approach across the CMU, KeyRecs, and GREYC-NISLAB datasets, explicitly examining cross-dataset applicability [14]. A recent comprehensive survey by Shadman et al. further documents the substantial variation in keystroke datasets, feature representations, authentication algorithms, and evaluation practices across the literature [15]. These studies provide important complementary evidence, but they address different experimental questions from the present work, which specifically varies the enrollment size while controlling session separation, class balance, statistical inference, and deployment-oriented measurements.
Finally, the machine learning community has increasingly recognized that data leakage, tuning on test data, and single-run point estimates can undermine reported comparisons. Kapoor and Narayanan trace reproducibility problems partly to data leakage [7], and current reporting guidance favors distributions over repeated runs rather than best-case numbers [8]. The session-disjoint protocol, validation-only tuning, subject-level inference, and computational-repeatability re-execution used here respond directly to that guidance. Methodologically, Manin et al. [16] provide a recent example of a PCA–classifier pipeline evaluated using cross-validation with explicit reporting of experimental variability. Although their application concerns spectroscopic authentication rather than biometrics, it provides a relevant methodological precedent for transparent PCA-based preprocessing and variability reporting. Table 1 compares representative related studies with the present work with respect to these experimental factors.
Table 1.
Comparison of representative related studies with respect to the experimental factors emphasized in the present work. An unreported factor does not imply a methodological deficiency; rather, the comparison illustrates how session handling, enrollment constraints, class balance, computational measurements, and statistical inference vary across evaluation protocols.
3. Methodology
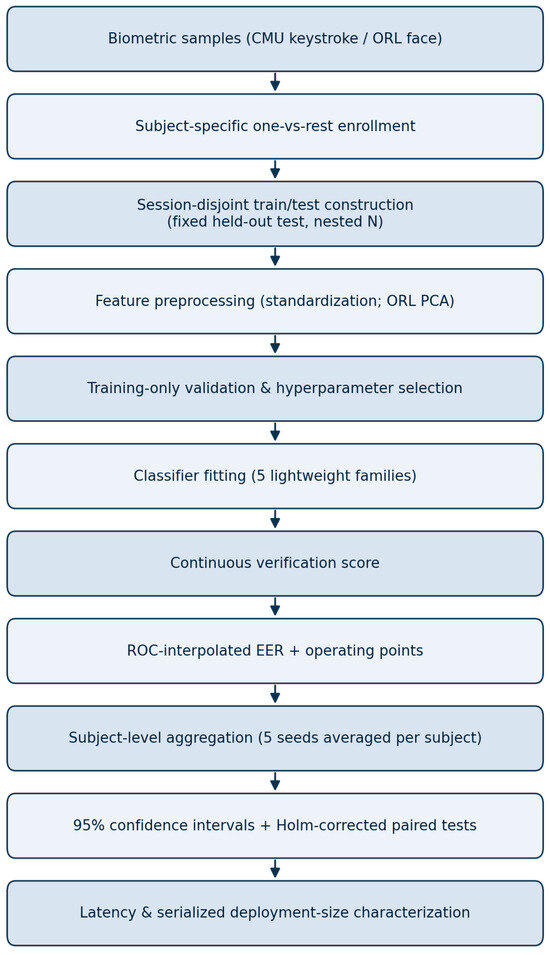
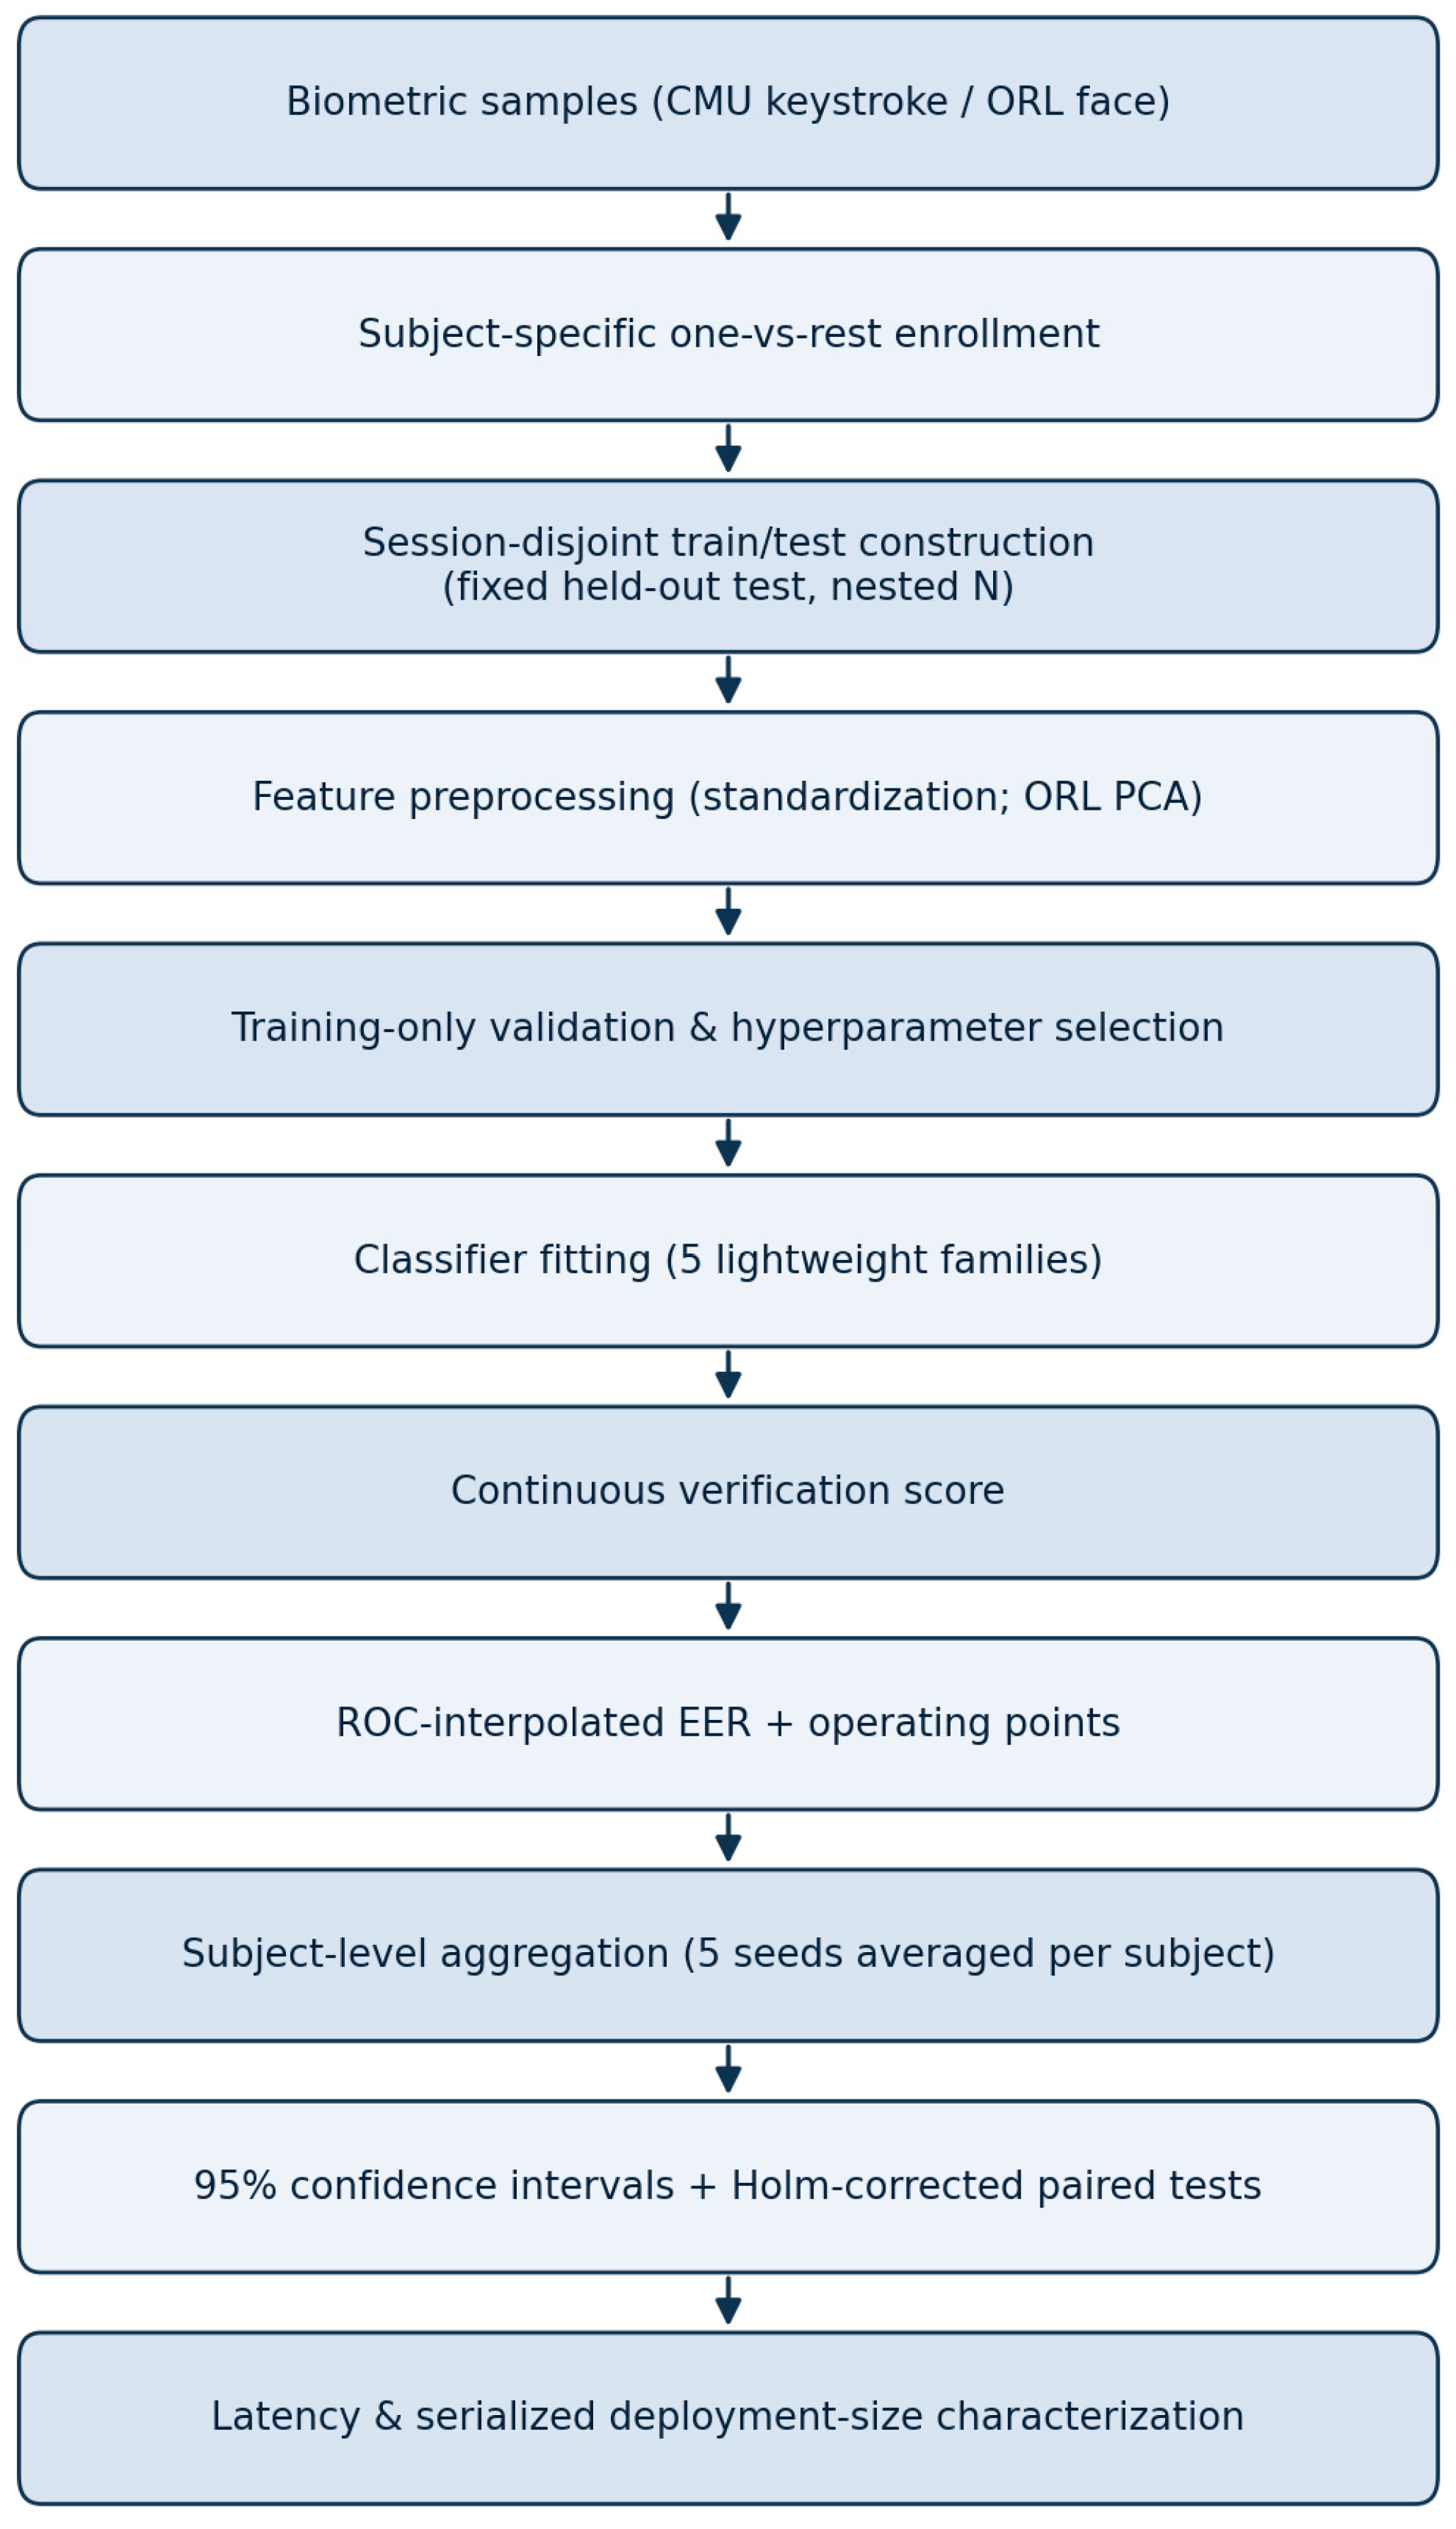
Figure 1 summarizes the end-to-end evaluation pipeline used throughout this study.
Figure 1.
End-to-end evaluation pipeline: from biometric samples through session-disjoint train/test construction, training-only validation and hyperparameter selection, continuous scoring, ROC-interpolated EER, subject-level aggregation, and latency and deployment-size characterization.
3.1. Datasets
The primary dataset is the CMU keystroke dynamics benchmark [5], comprising 51 subjects who each typed a fixed ten-character password (“.tie5Roanl”) repeatedly across eight time-separated sessions, with 50 repetitions per session (400 per subject). Each repetition is described by 31 timing features—per-key hold times, key-down-to-key-down latencies, and key-up-to-key-down latencies. The recorded session structure (sessionIndex 1–8) was used directly to build the session-disjoint protocol of Section 3.4.
The secondary dataset is the ORL (AT&T) face database [6]: 40 subjects with 10 grayscale images each (400 images total) at 92 × 112 pixels, varying in pose, expression, and lighting. Each image is treated as a 10,304-dimensional pixel vector. ORL serves as a supporting case study (Section 3.8) rather than a second broad benchmark.
3.2. Preprocessing
For CMU, the 31 timing features are standardized to zero mean and unit variance per feature. During hyperparameter selection, the standardization parameters are estimated from the inner-training partition alone and applied to the corresponding validation partition; once a configuration is selected, standardization is refit on the full enrollment/training set before final evaluation on the held-out test set. Validation and test samples therefore never contribute to the standardization statistics used to train a given model.
For ORL, pixel intensities are standardized using training-only statistics. The primary comparison uses two representations: (i) standardized raw pixels and (ii) a predefined 40-component PCA projection, fit on the training partition only and applied to the corresponding test images without refitting. The 40-component choice is fixed in advance and is never selected from test performance. A separate dimensionality sensitivity analysis evaluates 10, 20, 40, 80, and 150 components under the same N = 5 repeated-split protocol; for each split and dimensionality, standardization and PCA are fit on the training partition only, and cumulative explained variance and subject-level EER are recorded. The sweep characterizes sensitivity to dimensionality and is not used to replace the predefined PCA-40 primary condition. This training-only PCA fitting and explicit reporting of explained-variance consistency and dimensionality sensitivity follows the transparent PCA-based preprocessing precedent of Manin et al. [16], who apply a comparable PCA–classifier pipeline with cross-validation and reported experimental variability in a spectroscopic authentication context.
3.3. Classifier Families
Five classifier families are evaluated. Throughout, “family” denotes the classifier type; where a family is instantiated at several hyperparameter values (for example, k-NN at k ∈ {1, 3, 5, 7}), these are configurations within the family, not separate classifiers. The paper therefore reports five classifier families rather than a fixed count of individual configurations.
K-nearest neighbors (k-NN) with Euclidean distance: The neighborhood size k is a selected hyperparameter (Section 3.6). The verification score is the fraction of the k nearest neighbors belonging to the genuine class.
Linear discriminant analysis (LDA): By using scikit-learn’s default singular-value-decomposition (SVD) solver, this produces a valid discriminant, even when the within-class scatter matrix is singular, avoiding the failure mode noted by Duda et al. [10] without requiring an explicit PCA front-end. The score is the genuine-class posterior probability.
Threshold rule: A lightweight per-feature template. The mean μj and standard deviation σj of each feature j are estimated from the genuine training samples, and the score of a query x over all d features is the negative mean absolute z-score.
s(x) = −(1/d) Σj=1d|(xj − μj)/σj|
Therefore, higher scores indicate greater similarity to the enrolled user. This continuous score yields a full ROC and EER, and uses no threshold multiplier fitted on evaluation data.
Linear support vector machine (SVM): The regularization strength C is a selected hyperparameter, and the score is the signed distance to the decision boundary.
Shallow multilayer perceptron (MLP) with a single hidden layer, ReLU activations, and the Adam optimizer: The hidden-layer width and L2 penalty are selected hyperparameters. The score is the genuine-class posterior probability, averaged over three independent weight initializations (Section 3.6).
All five families receive the same handcrafted feature inputs—the 31 CMU timing features, or standardized/PCA-projected ORL pixels; none is given a learned representation. The comparison is thus between non-neural lightweight classifiers and a shallow neural baseline on identical features, not between classical methods and representation-learning systems.
3.4. CMU Constraint Protocol
Verification is posed per subject as a one-vs-rest task: The enrolled subject is the genuine class, and samples from the remaining 50 subjects form the impostor class. This formulation directly represents biometric verification as a genuine-versus-impostor decision.
Primary split (session-disjoint): Enrollment/training samples come from sessions 1–6, and the genuine test set comes from the held-out sessions 7–8. This mirrors realistic enroll-now-authenticate-later use, where enrollment and authentication occur at different times.
Fixed held-out test set with nested enrollment: For each subject and seed, the genuine test set (100 samples from sessions 7–8) is held fixed while the genuine training set of size N is drawn as a nested subset, N = 10 ⊂ 50 ⊂ 200, from sessions 1–6. Because the test set is invariant to N, differences across enrollment sizes are not confounded with changes in the test data.
Impostor sets and class balance control: In the primary fixed-impostor condition, impostor training draws 2 samples from each of the other 50 subjects (100 samples), and impostor testing draws 5 from each (250 samples), independent of N. Since varying N under a fixed impostor count also changes the genuine-to-impostor training ratio, a balanced control condition is additionally run in which the total impostor-training count is matched to N. Comparing the two conditions separates the effect of enrollment size from that of class ratio.
The impostor protocol was fixed a priori to provide broad impostor-subject coverage while limiting the contribution of any single impostor identity to training. Specifically, two samples from each of the 50 impostor subjects yield 100 training impostor samples distributed across many identities, whereas five held-out samples from each impostor are retained to provide a larger and more stable impostor test set. This design keeps the impostor construction identical across classifiers and enrollment conditions. The class balance control described above evaluates sensitivity to the number of impostor training samples; however, it does not test sensitivity to alternative selections or compositions of impostor identities. Consequently, robustness to different impostor pools is not claimed here and remains an important direction for future evaluation.
Random-split control: As a sensitivity check, the whole protocol is repeated with a subject-level random split—a fixed random genuine test set with nested random training subsets—that ignores session boundaries. The session-disjoint condition is the primary analysis; the random split is reported only to quantify the effect of ignoring session structure.
3.5. Evaluation Metrics
For each subject and configuration, every test sample receives a continuous verification score (Section 3.3). The equal error rate (EER)—the operating point where the false accept rate (FAR) equals the false reject rate (FRR)—is obtained by ROC interpolation: an ROC curve is built from the pooled genuine and impostor scores, and the FAR = FRR crossing is located by linear interpolation between adjacent ROC vertices. Two operating points are also reported: FAR at FRR = 1% and FRR at FAR = 1%.
3.6. Hyperparameter Selection
Hyperparameters are chosen from predefined, compact, classifier-appropriate grids using an inner stratified validation split of the training data; the test set is never used for selection. The grids are k ∈ {1, 3, 5, 7} for k-NN, C ∈ {0.01, 0.1, 1, 10, 100} for the linear SVM, and, for the MLP, a hidden-layer width ∈ {32, 64, 128} with L2 penalty α ∈ {10−4, 10−3, 10−2}. LDA (default SVD solver) and the threshold rule have no tunable classifier hyperparameters. The grids differ in size and are not presented as an equal-sized search; each is a compact grid suited to its classifier. For each configuration, the pipeline (standardization plus classifier) is fit on the inner-training fold and scored on the inner-validation fold by EER; the configuration with the lowest validation EER is selected and refit on the full training set. Because standardization is fit only on the fold supplied to the pipeline, validation and test data do not influence preprocessing during selection. For the MLP, the selected configuration is trained under three independent weight initializations and the per-query scores are averaged; the MLP uses max_iter = 1000, early stopping with n_iter_no_change = 20, and scikit-learn defaults for batch_size (auto) and validation_fraction (0.1) at the recorded library version. The training procedures are classifier-appropriate rather than artificially identical across families. k-NN, LDA, the threshold rule, and linear SVM are effectively deterministic for a fixed training set and selected configuration in the implementation used here, whereas MLP optimization depends on stochastic weight initialization and iterative training. Averaging the MLP scores across three independent initializations is therefore used to reduce dependence on any single initialization, not to provide the MLP with additional training data or test-set information. This procedural asymmetry reflects an inherent difference between the evaluated classifier families and should be considered when interpreting the comparison.
3.7. Statistical Methodology
The statistical unit is the subject, not the random seed. Each subject/condition is evaluated under five random seeds (1–5), and the resulting EERs are first averaged within each subject; inference is then performed across the 51 subject-level means. The results are reported as a subject-level mean EER with 95% confidence intervals (t-distribution, N = 51). Pairwise differences are tested with paired-samples t-tests, cross-checked with Wilcoxon signed-rank tests, and summarized with paired Cohen’s dz. For the primary CMU analysis, paired-t p-values are adjusted with the Holm’s step-down procedure over a predefined 11-comparison family. Statistical significance is always interpreted together with absolute EER differences and effect sizes so that small but detectable differences are not overstated.
3.8. ORL Face Verification Experimental Setup
The ORL analysis applies the same principles at the image level. Each subject is enrolled with N = 5 genuine training images, leaving 5 genuine test images per subject; every other identity contributes 5 disjoint images to impostor training and 5 to impostor testing. The protocol is repeated over 10 random splits. Two classifiers are evaluated—k-NN with a predefined k = 3 and LDA—under standardized raw pixels and the predefined PCA-40 representation. Per-subject EERs are averaged over splits before inference, with 95% confidence intervals and Holm-corrected paired tests computed across the 40 subjects.
The separate PCA sensitivity analysis repeats the PCA evaluation at 10, 20, 40, 80, and 150 components, fitting PCA on the training partition only for each split and recording cumulative explained variance and subject-level EERs. At PCA-40, the mean explained variance is summarized across splits to characterize the variability of the retained variance. This analysis does not use test performance to select a dimensionality. ORL remains a secondary case study rather than evidence of modality-independent classifier superiority.
3.9. Latency and Deployment-Size Characterization
Single-query CPU latency was characterized on the primary session-disjoint/fixed-impostor configuration at N = 10, 50, and 200 using time.perf_counter_ns() with a batch size of 1, 100 untimed warm-up queries, and 1000 timed queries per subject, model, and N. End-to-end latency includes feature preprocessing and classifier scoring, and preprocessing-only and model-only latencies are measured separately. For the MLP, the timed path scores the same three-initialization ensemble used in the accuracy evaluation. We report the means, standard deviations, and the 50th, 95th, and 99th percentiles, along with the true global maximum. CPU affinity and processor frequency were not fixed under macOS; therefore, these values characterize observed desktop CPU single-query latency rather than hard-real-time deadlines.
The deployment footprint is reported as a serialized deployment-bundle size—the size of the persisted scaler and model artifacts, or the template parameters for the threshold rule—as a storage-size proxy rather than resident runtime memory. Complexity also depends on the number of enrollment samples, feature dimensionality, number of classes, implementation, and solver, and is qualified accordingly.
3.10. Implementation Environment
All experiments were run CPU-only on an Apple M3 Pro MacBook Pro under macOS, without GPU acceleration; CPU affinity and processor frequency were not explicitly controlled. The finalized experiments were executed with Python 3.12.4, scikit-learn 1.9.1, NumPy 2.5.3, SciPy 1.18.1, and pandas 3.0.5, and exact per-experiment environment details are retained with the finalized computational artifacts. A single scikit-learn-based implementation is used across the classifier families where applicable, so that differences reflect the classifiers and their selected hyperparameters rather than implementation differences.
4. Results
4.1. CMU Primary Results
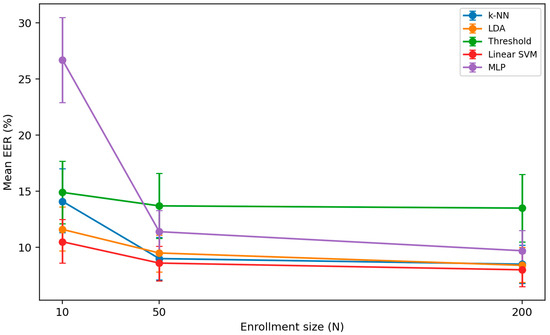
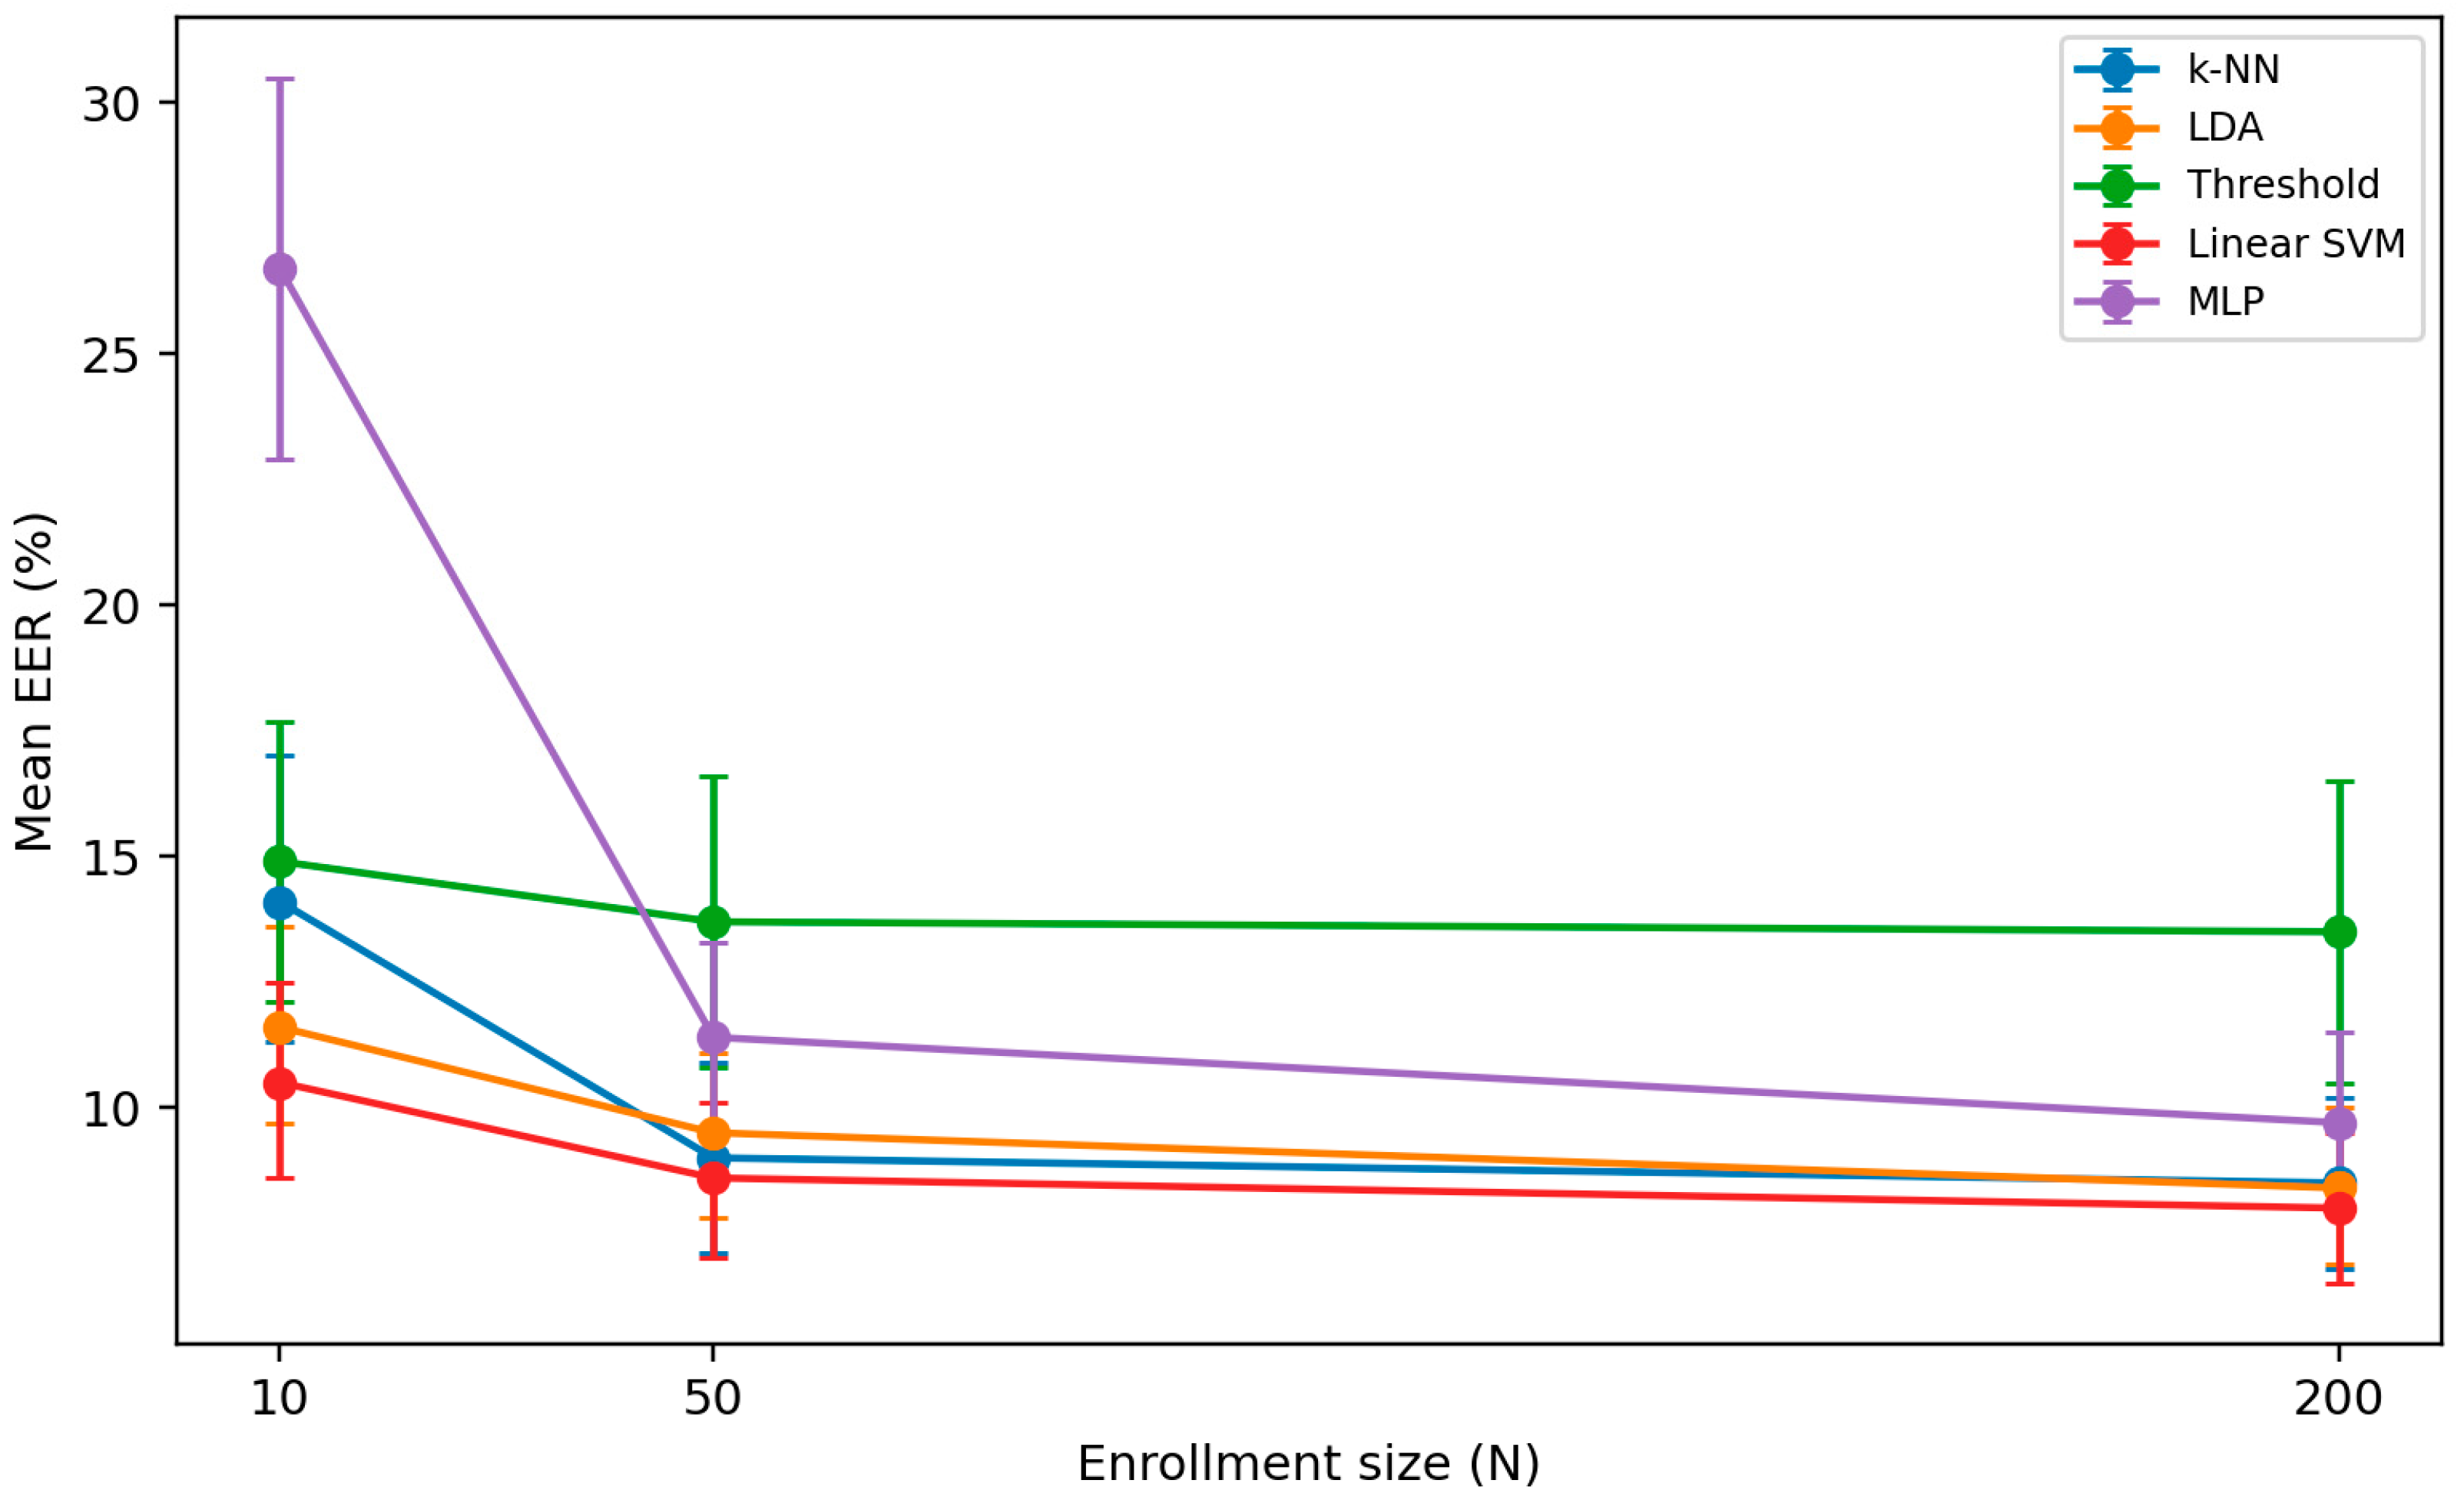
Table 2 reports subject-level mean EERs with 95% confidence intervals under the primary session-disjoint/fixed-impostor protocol, along with two strict operating points at N = 200. Linear SVM has the lowest mean EER at all three enrollment sizes (10.5%, 8.6%, and 8.0%), with LDA and k-NN close behind. The three converge as enrollment grows: at N = 200, they fall within about 0.5 percentage points (8.0–8.5%). The evaluated shallow MLP is much weaker at the smallest enrollment (26.7% at N = 10) but improves sharply as enrollment increases (11.4% at N = 50; 9.7% at N = 200). The threshold rule remains comparatively stable across enrollment sizes, decreasing from 14.9% at N = 10 to 13.5% at N = 200. Figure 2 shows the same primary results with 95% confidence interval error bars.
Table 2.
Subject-level mean EER (%) with 95% CIs and CMU session-disjoint/fixed-impostor protocol (N = 51). Operating points are reported at N = 200.
Figure 2.
Mean EER by classifier and enrollment size (CMU, session-disjoint split). Error bars show 95% confidence intervals across the 51 subjects.
4.2. Statistical Significance
Table 3 gives the finalized Holm-corrected subject-level paired tests. At N = 200, neither k-NN versus LDA (Δ = +0.02 pp, Holm p = 0.970) nor k-NN versus linear SVM (Δ = +0.43 pp, Holm p = 0.729) is significant; LDA versus linear SVM remains significant after correction but is small in absolute terms (Δ = +0.41 pp, dz = 0.42, Holm p = 0.023). Furthermore, k-NN, LDA, and linear SVM each significantly outperformed the evaluated MLP at N = 200 within the predefined comparison family. At N = 10, the MLP gaps are far larger (about 12.5–16.2 pp), and both k-NN versus LDA (Δ = +2.50 pp, Holm p = 0.0315) and LDA versus linear SVM (Δ = +1.12 pp, Holm p < 0.001) are significant.
Table 3.
Subject-level paired tests and CMU session-disjoint/fixed-impostor. ΔEER < 0 favors A; dz is paired Cohen’s effect size; p-values are Holm-corrected across the 11-comparison family. Sig.: Yes = significant at α = 0.05 after Holm correction; ns = not significant.
4.3. Session-Leakage Control
Table 4 compares the primary session-disjoint split with the random-split control under the fixed-impostor condition. Random splitting generally produces somewhat lower EERs than session-disjoint evaluation, although the effect is not uniform across classifiers or enrollment sizes. These results support retaining the session-disjoint condition as the primary analysis because it preserves the temporal separation between enrollment and authentication sessions, while the random-split control characterizes the effect of ignoring the session structure under the evaluated protocol.
Table 4.
Mean EERs (%) under random vs. session-disjoint splits (fixed-impostor). Each cell gives random-split EER → session-disjoint EER, with the difference (session-disjoint − random, in percentage points) in parentheses; positive values indicate a higher EER under session-disjoint evaluation.
4.4. Class Balance Control
Table 5 contrasts the fixed-impostor and balanced conditions under the session-disjoint split. Class balance materially affects the low-enrollment results, with a direction and magnitude that depend on the classifier and enrollment size. At N = 10, matching the impostor count to the genuine count sharply worsens several classifiers (for example, LDA rises from 11.6% to 27.1%, and k-NN from 14.1% to 20.1%), whereas at N = 200, the balanced condition slightly improves k-NN, SVM, and MLP. Improvement with enrollment also persists under balanced training, indicating that the observed enrollment effect is not explained solely by changes in the genuine-to-impostor training ratio. Balancing is therefore not uniformly beneficial, and the genuine-to-impostor ratio should be reported explicitly.
Table 5.
Mean EER (%), fixed-impostor/balanced, session-disjoint split.
4.5. ORL Face Verification Case Study
Table 6 reports the revised N = 5 ORL case study. LDA on standardized raw pixels achieves the lowest mean EER (1.47%), with a higher k-NN (2.64%). The predefined 40-component PCA does not improve either classifier (LDA 1.47% → 1.59%; k-NN 2.64% → 3.03%). In paired subject-level tests, the raw-feature k-NN–LDA difference does not survive Holm’s correction (adjusted p = 0.098), whereas under PCA-40, the difference favors LDA and does survive correction (adjusted p = 0.037, dz = 0.43); neither raw-versus-PCA contrast is significant after correction.
Table 6.
ORL subject-level mean EER (%) with 95% CIs, N = 5, 10 repeated splits (n = 40 subjects).
The dimensionality sensitivity analysis gives the mean cumulative explained variance of 60.11%, 71.01%, 81.21%, 90.52%, and 97.71% for PCA-10, PCA-20, PCA-40, PCA-80, and PCA-150, respectively; at PCA-40, the mean explained variance varies little across the 10 repeated splits (SD = 0.203 percentage points). The mean EER across these dimensionalities is 5.28%, 2.69%, 1.59%, 1.15%, and 1.43% for LDA and 5.15%, 3.92%, 3.03%, 2.96%, and 2.97% for k-NN. Because PCA-40 was predefined before the dimensionality sensitivity analysis, the lower LDA EER observed at PCA-80 (1.15% versus 1.59% at PCA-40 and 1.47% for standardized raw pixels) is reported as sensitivity evidence rather than used for post hoc model selection. The sweep demonstrates that the primary PCA-40 result is not solely an artifact of a single tested dimensionality: performance improves substantially from 10 to approximately 40–80 components and changes relatively little thereafter. Importantly, these results do not establish that PCA is universally unhelpful; they show specifically that the predefined PCA-40 representation does not improve either evaluated classifier relative to its standardized raw-pixel condition.
4.6. Latency and Deployment Size
Table 7 reports single-query latency on the desktop CPU platform. For every configuration, the 99th percentile end-to-end latency stays below 0.7 ms. Furthermore, k-NN shows the largest increase in mean latency with enrollment size (from 0.282 ms at N = 10 to 0.327 ms at N = 200), while LDA and linear SVM remain nearly constant (~0.117 ms and ~0.103 ms), and the evaluated MLP requires about 0.23 ms. A few isolated observations far exceed these percentiles, including a 73.36 ms maximum for k-NN at N = 50. Because CPU affinity and frequency were not controlled under macOS, these values describe observed desktop CPU latency rather than hard-real-time behavior, and no hard-real-time guarantee is claimed.
Table 7.
End-to-end single-query latency (ms) and CMU session-disjoint/fixed-impostor, Apple M3 Pro.
Table 8 reports serialized deployment-bundle sizes (a storage-size proxy, not resident runtime memory). The threshold rule, linear SVM, and LDA are the smallest and constant in enrollment size; k-NN grows with enrollment because it retains training samples; and the evaluated MLP has the largest bundle.
Table 8.
Serialized deployment-bundle size (KB).
4.7. Empirical Trade-Off Summary
Table 9 summarizes the observed trade-offs. It is confined to the evaluated datasets and configurations and is descriptive rather than prescriptive: it records what was observed rather than recommending a universally best classifier.
Table 9.
Empirical summary limited to the evaluated datasets and configurations.
5. Discussion
5.1. Interpretation of Observed Patterns
Under the scarce-enrollment conditions studied, the lower-parameter decision rules achieved lower EER than the evaluated shallow MLP. At N = 10 on a 31-dimensional feature set, LDA and linear SVM reach substantially lower mean EER than the evaluated shallow MLP, whose performance is more sensitive to the smallest training set; the MLP improves sharply as enrollment grows, and the differences among LDA, SVM, and k-NN shrink. At N = 200, k-NN differs significantly from neither LDA nor SVM, and the LDA–SVM difference, while significant, is only 0.41 percentage points. The comparatively flat performance of the threshold rule is consistent with its independent per-feature template, which does not model correlations among timing features. These interpretations pertain to the evaluated configurations and datasets and are not general claims about neural or non-neural methods.
5.2. Deployment Trade-Offs
Latency alone does not strongly separate the classifiers here: every configuration remains below 0.7 ms at the 99th percentile on the test platform, so deployment decisions also depend on accuracy, storage, and latency-tail behavior. Linear SVM pairs the lowest mean CMU EER with a very small, constant serialized bundle (~1.8 KB) and stable typical latency on the evaluated platform and protocol, though these desktop measurements should not be interpreted as a universal recommendation for embedded systems, which would require direct measurement on representative hardware. k-NN is competitive at larger enrollment, but its storage and query cost grow with the number of retained samples, and it exhibits the largest observed latency tail. The threshold rule represents the extreme efficiency point, with the smallest latency and storage proxy, but at a clear accuracy cost on CMU. The latency and serialized-bundle measurements reported here should not be interpreted as direct estimates of embedded computational or energy costs. Desktop CPU execution time characterizes relative inference behavior on the evaluated platform, whereas embedded deployment additionally depends on processor architecture, memory hierarchy, power-management policy, model implementation, and concurrent system workloads. Recent embedded-AI studies illustrate the importance of evaluating inference latency together with hardware-specific power and energy behavior when assessing deployment feasibility [17]. Accordingly, direct measurements on representative embedded hardware—including inference latency, power draw, and energy per authentication—are required before drawing conclusions about energy efficiency in an on-device biometric system.
5.3. Limitations
Several factors bound how far these results generalize. CMU and ORL are legacy benchmarks collected under controlled conditions; only two modalities and a limited set of classifier families are examined; the CMU features are handcrafted timing features for a single fixed password; and the neural baseline is deliberately shallow rather than an extensively tuned representation-learning architecture. ORL provides only ten images per subject, which constrains the face case study. The PCA sensitivity sweep reduces the concern that the predefined PCA-40 result is an isolated dimensionality effect, but it does not establish that the observed dimensionality trends will generalize to other datasets or enrollment conditions. Latency and bundle size were measured on a desktop-class Apple Silicon CPU rather than embedded hardware; energy was not measured; and no hard-real-time guarantee is claimed. Adversarial robustness was not evaluated and is distinct from the small-sample verification accuracy measured here.
5.4. Generalization
The low-enrollment behavior observed here may extend to settings where feature dimensionality is high relative to available enrollment, but confirming this requires evaluation on additional modalities and datasets. Enrollment size is associated with substantial changes in verification performance in the evaluated CMU setting: the shallow MLP improves from a 26.7% mean EER at N = 10 to 9.7% at N = 200, while the gaps among the strongest lightweight classifiers narrow. Learned embeddings could alter both the absolute EER and the relative differences among classifiers; therefore, the specific numbers here characterize the evaluated handcrafted representations rather than fundamental limits of the classifier families. Future cross-modality work should therefore test the same constraint-aware protocol with learned representations rather than extrapolating the present ordering. The use of two structurally different biometric modalities provides a limited cross-modality check, but it does not establish that the observed classifier behavior is dataset-independent. In particular, differences in sample size, feature dimensionality, acquisition conditions, and subject variability may influence the relative behavior of the evaluated classifiers. Accordingly, the present results should be interpreted as evidence conditional on the CMU and ORL protocols studied here rather than as intrinsic properties of the classifier families. Establishing broader generality will require applying the same constraint-aware protocol to additional datasets and modalities while systematically controlling the enrollment size, class balance, and evaluation structure.
6. Computational Repeatability
To support verifiability, the pipeline was re-executed from the same source code against freshly loaded dataset copies, and the outputs were compared with the recorded results. This is computational repeatability—re-running the same procedure and code to obtain the same numbers—rather than independent reproducibility, which would require an independent implementation. The finalized computational artifacts include the evaluation code, split seeds, per-subject result files, summary and paired-test outputs, PCA sensitivity outputs, latency results, and recorded software environment information. These artifacts are publicly available in the accompanying reproducibility repository: https://github.com/neilprovenzano/constraint-aware-biometric-authentication (accessed on 26 August 2026).
7. Conclusions
This study evaluated five lightweight classifier families for biometric verification under controlled data and deployment constraints rather than proposing a new classifier. Under the session-disjoint CMU protocol, linear SVM has the lowest mean EER at N = 10, 50, and 200 (10.5%, 8.6%, and 8.0%). The gaps among SVM, LDA, and k-NN narrow substantially with enrollment: at N = 200, k-NN differs significantly from neither LDA nor SVM, and the LDA–SVM difference, though significant, is only 0.41 percentage points. The evaluated shallow MLP is especially sensitive at N = 10 but improves markedly with more enrollment. The class balance control shows that the genuine-to-impostor ratio can materially affect low enrollment results and should not be left implicit. In the ORL case study, raw-feature LDA has the lowest mean EER, PCA-40 offers no improvement, and the dimensionality sweep indicates that performance improves substantially through approximately 40–80 components, with relatively small changes thereafter. Deployment measurements further show that practical classifier selection involves trade-offs among accuracy, latency, storage, and latency-tail behavior rather than identifying a single universally superior classifier. Taken together, the results support constraint-aware evaluations incorporating session separation, explicit class balance, training-only preprocessing and tuning, and subject-level inference.
Future work should test these questions with learned representations sized for edge deployment, extend the comparison to additional modalities and embedded hardware with direct latency and energy measurement, and examine adversarial robustness, which lies outside the accuracy-focused scope reported here.
Author Contributions
Conceptualization, N.P. and S.L.; methodology, N.P.; software, N.P.; validation, N.P. and I.T.F.; formal analysis, N.P.; investigation, N.P. and I.T.F.; writing—original draft preparation, N.P.; writing—review and editing, N.P., I.T.F. and S.L.; supervision, S.L. All authors have read and agreed to the published version of the manuscript.
Funding
This research received no external funding.
Institutional Review Board Statement
Not applicable.
Informed Consent Statement
Not applicable.
Data Availability Statement
This study used the publicly available CMU keystroke dynamics benchmark [5] and ORL (AT&T) Database of Faces [6]. No new primary biometric data were collected. Evaluation code, experiment configurations, split seeds, and derived result files supporting the findings are publicly available at https://github.com/neilprovenzano/constraint-aware-biometric-authentication (accessed on 26 August 2026). The original biometric datasets are not redistributed in the repository.
Conflicts of Interest
The authors declare no conflicts of interest.
Abbreviations
The following abbreviations are used in this manuscript:
| AI | Artificial Intelligence |
| CMU | Carnegie Mellon University |
| CNN | Convolutional Neural Network |
| CPU | Central Processing Unit |
| CSV | Comma-Separated Values |
| EER | Equal Error Rate |
| FAR | False Accept Rate |
| FRR | False Reject Rate |
| GPU | Graphics Processing Unit |
| k-NN | k-Nearest Neighbor |
| LDA | Linear Discriminant Analysis |
| ML | Machine Learning |
| MLP | Multilayer Perceptron |
| ORL | Olivetti Research Laboratory |
| PCA | Principal Component Analysis |
| RGB-D | Red-Green-Blue-Depth |
| SVD | Singular Value Decomposition |
| SVM | Support Vector Machine |
References
- Stragapede, G.; Vera-Rodriguez, R.; Tolosana, R.; Morales, A.; DeAndres-Tame, I.; Damer, N.; Fierrez, J.; Ortega-Garcia, J.; Gonzalez, N.; Shadrikov, A.; et al. IEEE BigData 2023 Keystroke Verification Challenge (KVC). In Proceedings of the 2023 IEEE International Conference on Big Data (BigData); IEEE: Piscataway, NJ, USA, 2023; pp. 6092–6100. [Google Scholar]
- Dai, X.; Zhao, R.; Hu, P.; Munteanu, A. KD-Net: Continuous keystroke dynamics based human identification from RGB-D image sequences. Sensors 2023, 23, 8370. [Google Scholar] [CrossRef] [Scilit] [PubMed]
- Wang, X.; Tang, Z.; Guo, J.; Meng, T.; Wang, C.; Wang, T.; Jia, W. Empowering edge intelligence: A comprehensive survey on on-device AI models. ACM Comput. Surv. 2025, 57, 228. [Google Scholar] [CrossRef] [Scilit]
- Zhang, J.; Tran, D.; Ahmadi, B. EdgeEar: Efficient and accurate ear recognition for edge devices. arXiv 2025, arXiv:2502.07734. [Google Scholar]
- Killourhy, K.S.; Maxion, R.A. Comparing anomaly-detection algorithms for keystroke dynamics. In Proceedings of the 39th Annual IEEE/IFIP International Conference on Dependable Systems and Networks (DSN); IEEE: Piscataway, NJ, USA, 2009; pp. 125–134. [Google Scholar]
- Samaria, F.; Harter, A. Parameterisation of a stochastic model for human face identification. In Proceedings of the 2nd IEEE Workshop on Applications of Computer Vision; IEEE: Piscataway, NJ, USA, 1994; pp. 138–142. [Google Scholar]
- Kapoor, S.; Narayanan, A. Leakage and the reproducibility crisis in machine-learning-based science. Patterns 2023, 4, 100804. [Google Scholar] [CrossRef] [Scilit] [PubMed]
- Dodge, J.; Gururangan, S.; Card, D.; Schwartz, R.; Smith, N.A. Show your work: Improved reporting of experimental results. In Proceedings of the 2019 Conference on Empirical Methods in Natural Language Processing (EMNLP-IJCNLP), Hong Kong, China, 3–7 November 2019; pp. 2185–2194. [Google Scholar]
- Jain, A.K.; Ross, A.; Prabhakar, S. An introduction to biometric recognition. IEEE Trans. Circuits Syst. Video Technol. 2004, 14, 4–20. [Google Scholar] [CrossRef] [Scilit]
- Duda, R.O.; Hart, P.E.; Stork, D.G. Pattern Classification, 2nd ed.; Wiley-Interscience: New York, NY, USA, 2001. [Google Scholar]
- Vapnik, V.N. The Nature of Statistical Learning Theory; Springer: New York, NY, USA, 1995. [Google Scholar]
- Belhumeur, P.N.; Hespanha, J.P.; Kriegman, D.J. Eigenfaces vs. Fisherfaces: Recognition using class specific linear projection. IEEE Trans. Pattern Anal. Mach. Intell. 1997, 19, 711–720. [Google Scholar] [CrossRef] [Scilit]
- Risto, H.N.; Graven, O.H. Fixed-text keystroke dynamics authentication data set—Collection and analysis. Ann. Telecommun. 2024, 79, 731–743. [Google Scholar] [CrossRef] [Scilit]
- Budžys, A.; Kurasova, O.; Medvedev, V. Integrating deep learning and data fusion for advanced keystroke dynamics authentication. Comput. Stand. Interfaces 2025, 92, 103931. [Google Scholar] [CrossRef] [Scilit]
- Shadman, R.; Wahab, A.A.; Manno, M.; Lukaszewski, M.; Hou, D.; Hussain, F. Keystroke Dynamics: Concepts, Techniques, and Applications. ACM Comput. Surv. 2025, 57, 283. [Google Scholar] [CrossRef] [Scilit]
- Manin, L.; Oliva, G.; Bianco, M.G.; Hossain, M.M.; Valić, S.; Islam, S.K.; Laganà, F.; Fiorillo, A.S.; Pullano, S.A. Application of FTIR and PCA-LR metabolites recognition for bergamot essential oil authentication. Spectrochim. Acta A Mol. Biomol. Spectrosc. 2026, 352, 127561. [Google Scholar] [CrossRef] [Scilit] [PubMed]
- Bibbò, L.; Laganà, F.; Bilotta, G.; Meduri, G.M.; Angiulli, G.; Cotroneo, F. AI-Enhanced Eco-Efficient UAV Design for Sustainable Urban Logistics: Integration of Embedded Intelligence and Renewable Energy Systems. Energies 2025, 18, 5242. [Google Scholar] [CrossRef] [Scilit]

Disclaimer/Publisher’s Note: The statements, opinions and data contained in all publications are solely those of the individual author(s) and contributor(s) and not of MDPI and/or the editor(s). MDPI and/or the editor(s) disclaim responsibility for any injury to people or property resulting from any ideas, methods, instructions or products referred to in the content. |
© 2026 by the authors. Licensee MDPI, Basel, Switzerland. This article is an open access article distributed under the terms and conditions of the Creative Commons Attribution (CC BY) license.