


Abstract
Capture-the-flag (CTF) competitions are widely used for cybersecurity training and informal assessment, yet their measurement properties are rarely reported. We evaluated five editions of a national CTF event held between 2018 and 2025 using 94 challenges, 58 teams, 1393 submission attempts, and a 2025 participant survey (n = 38). KR-20 point estimates ranged from 0.72 to 0.82, but were imprecise except in the largest edition; sensitivity analyses treating unattempted items as missing produced weaker, assumption-dependent estimates. Across the corpus, 34% of items had no response variance, and 22% were never attempted. Author-assigned points tracked observed difficulty only weakly (pooled ρ = −0.40, 95% CI [−0.57, −0.19]). Across four coding procedures, technical knowledge was prominent (78–94 items), analytical skills varied substantially (35–70), and ethics, communication, and risk management were absent. A degree-preserving null reproduced an apparent breadth–performance association, indicating a mechanical artifact. Submission precision increased from approximately 0.15 in 2018 to 0.69 in 2025 (Jonckheere–Terpstra z = 6.15, p < 0.001). Overall, reliability alone does not establish validity: CTF scores provide useful but incomplete evidence for broad inferences about cybersecurity competence, particularly with small samples and selective item engagement.
1. Introduction
The demand for cybersecurity practitioners continues to outpace the supply of formally qualified candidates, and the pathways by which practitioners acquire and demonstrate competence remain markedly less standardized than in adjacent engineering disciplines. In penetration testing, professional formation spans formal degree programs, vendor certification, self-directed practice on commercial training platforms, and competitive events. Employers and educators consequently lack a common vocabulary for describing what a practitioner can do, and candidates lack a reliable map of the skills they are expected to acquire.
CTF competitions occupy an unusual position in this landscape. They are simultaneously recreational events, recruitment channels, teaching instruments and—increasingly—informal assessments, with performance cited in hiring decisions and in curriculum evaluation. Their appeal is easy to understand: they generate authentic, time-stamped behavioral evidence of practical skill at a scale that supervised examinations cannot match, and at negligible marginal cost. What is far less clear is whether the evidence they produce supports the inferences that are routinely drawn from it.
That question is a measurement question and can be addressed using established tools. A CTF challenge set is structurally test-like: it comprises scored items presented within a common event window, although participant strategies, collaboration, and exposure to individual items are not standardized as in a conventional examination. Classical test theory provides well-understood statistics for such instruments—item difficulty, item discrimination, and internal consistency—and these statistics are reported routinely for educational assessments but rarely for CTF challenge sets. Event organizers assign point values, publish scoreboards, and archive platform databases; they rarely ask whether the resulting ranking is sufficiently reliable for its intended use or whether the observed scores support the broader competence interpretations attached to them. Reliability is therefore one part of the argument, not evidence of validity by itself.
A second and related gap concerns construct coverage. Structured competency frameworks for cybersecurity describe the practitioner role as a composite of technical, analytical, and behavioral competencies, the latter including ethical judgment, client communication, and risk prioritization. A flag-submission instrument observes only what can be reduced to a string submitted to a scoring engine. Whether the competencies that resist that reduction are simply unmeasured—or implicitly devalued by an assessment culture that has grown up around the format—has not been examined empirically.
This study addresses both gaps using an unusually complete data source: the full platform exports of five editions of Hacking Night, a national cybersecurity competition held in Croatia between 2018 and 2025, together with a participant survey administered at the most recent edition. Because the exports include both incorrect and correct submissions, hint unlocks, and complete challenge metadata, the events can be reconstructed as assessment instruments rather than merely as scoreboards. The study asks four questions:
- RQ1. What are the psychometric properties—reliability, item difficulty, and item discrimination—of CTF challenge sets used in practice?
- RQ2. Do author-assigned point values correspond to observed item difficulty?
- RQ3. Which competency dimensions and knowledge areas do such instruments actually elicit evidence for, and which do they leave unmeasured?
- RQ4. Which team-level behaviors are associated with performance, how have observable participant behaviors changed across editions, and how do participants perceive the competencies and development barriers examined in the most recent edition?
The contribution is threefold. First, we provide what is, to our knowledge, the first psychometric evaluation of CTF challenge sets across multiple editions of the same event series. Second, we quantify the gap between the competency dimensions a structured model specifies and those a flag-submission instrument can evidence. Third, we translate both results into concrete instrumentation requirements for organizers who wish to use competitive events as components of a defensible competency assessment.
2. Related Work
This section positions the study within prior research on CTF-based cybersecurity education, competency and assessment validity, professional formation, behavioral evidence, and the remaining measurement gap.
2.1. CTFs as Cybersecurity Learning Environments
Game-based and hands-on approaches have become prominent in cybersecurity education because they can place learners in adversarial, problem-solving situations that are difficult to reproduce with lecture-only instruction. A systematic review of 181 cybersecurity digital games found substantial diversity in how cybersecurity is represented and argued for designs that move beyond superficial gamification toward deeper engagement with security concepts [1]. Karagiannis and Magkos showed how CTF challenges can be embedded in a virtual learning environment that combines interactivity, self-directed work, collaboration, and game elements [2]. In university courses, however, CTF use creates assessment-specific design problems: Vykopal et al. identified scoring, scaffolding, plagiarism, and learning-analytics capability as four practical concerns when CTF tasks are used as assessed coursework [3]. Platform choice also matters; a comparison of Facebook CTF and CTFd found that CTFd exposed substantially richer formative-assessment functionality, whereas Facebook CTF provided comparatively little support for assessment [4].
The broader computing-education literature provides a useful contrast because it has increasingly treated assessment quality as a measurement problem rather than merely a scoring problem. Peteranetz and Albano used classical test theory (CTT) and item response theory (IRT) to evaluate the reliability and discrimination of a computing-knowledge assessment [5]. Specifically in cybersecurity, Švábenský et al. mapped 15,963 CTF solutions to formal curricular guidance. They found strong representation of technical topics such as cryptography and network security but weak coverage of human and non-technical aspects [6]. Evidence on instructional effectiveness is generally positive but heterogeneous: Workman found the strongest applied outcomes when simulations and live activities were combined with classroom instruction [7], while Khader et al. argued for continuous alignment among cybersecurity curriculum content, delivery, and assessment rather than isolated awareness activities [8].
2.2. Competence, Construct Coverage, and Assessment Validity
A recurring issue in cybersecurity education is the breadth of the construct being assessed. In assessment-validity terms, construct underrepresentation occurs when an instrument samples too little of the domain required by the intended interpretation: a score may be internally consistent while still omitting important competencies. This distinction matters here because the validity question is not whether CTFs can measure anything reliably, but whether evidence from flag submissions is sufficient to support broader inferences about professional cybersecurity competence. A systematic review of competencies for critical-infrastructure cybersecurity grouped required capabilities into technical, managerial, implementation, and soft-skill categories and noted continued disagreement about which competencies are most critical [9]. This breadth is difficult to observe through flag submission alone. Research on supervised CTFs has therefore begun to instrument the process around the final answer: Burská et al. developed a progress-visualization tool that exposes instructors to trainee progression, stalled participants, and schedule deviations during a CTF session [10]. At the same time, validated cybersecurity concept assessments show what stronger measurement evidence can look like. The Cybersecurity Concept Inventory was evaluated using both CTT and IRT and demonstrated reliability and validity for introductory conceptual knowledge [11].
CTF-specific studies, by contrast, have generally focused on learning, engagement, or course performance rather than the measurement properties of the challenge set itself. Cole found that CTF-style exercises increased motivation compared with traditional exercises, with no significant difference in relevant examination performance [12]. An Internet of Things (IoT)-focused CTF likewise reported positive participant feedback and evidence of performance gains for practical learning [13]. At the workforce level, Osunji argued that cybersecurity education should be explicitly connected to competency and workforce frameworks, including observable professional activities rather than course completion alone [14]. Herman et al. extended psychometric work in cybersecurity with the Cybersecurity Curriculum Assessment, using CTT and IRT to evaluate an instrument intended for students beyond the introductory level [15]. These studies establish that cybersecurity knowledge can be assessed psychometrically, but they do not establish that competitive CTF scores constitute a valid general measure of professional competence.
2.3. CTFs, Professional Formation, and Behavioral Evidence
The distinction matters because CTF performance is socially meaningful beyond the classroom. Fisk describes CTFs as educational experiences and gateways into cybersecurity professionalization, including recruitment and status formation within the security community [16]. Mason et al. likewise found a gamified cybersecurity training course acceptable to a diverse group of UK undergraduates, with positive perceptions of enjoyment, engagement, usability, relevance, and educational efficacy, illustrating the potential of game-based cybersecurity training beyond specialist computing cohorts [17]. Cyber ranges further broaden the observable process beyond a final flag: Russo et al. combined Jeopardy-style CTF and cyber-defense exercises in a university cyber-range setting [18], while a systematic review of online university cybersecurity education identified virtual laboratories, simulations, gamification, and project-based assessment as common mechanisms for practical-skills development [19]. These environments highlight a key measurement point: richer task contexts can reveal evidence that a scoreboard alone cannot capture.
Recent work has accordingly shifted from outcomes toward the process of solving. Tay et al. frame CTF problem-solving through the Information Search Process, treating uncertainty and information seeking as observable parts of the learning process [20]. Vigl and Abramova extended the format to privacy education through eight purpose-designed CTF tasks; feedback from 27 students indicated increased confidence and described the exercises as enjoyable, motivating, and engaging, showing that CTF design can deliberately target concepts beyond conventional exploitation tasks [21]. In industrial control system training, Abaimov et al. emphasized preparation, realistic domain context, and challenge design as prerequisites for meaningful participation [22], while Harish et al. combined cyber ranges with cyber–physical testbeds to extend training beyond conventional information-technology exercises [23]. Together, these studies suggest that behavioral traces surrounding a challenge may carry educational information that a final flag does not; the unresolved question is which traces support defensible measurement inferences rather than merely describing activity.
2.4. Recent Evidence and the Remaining Measurement Gap
Recent empirical work reinforces both the promise and the limits of CTF-based training. Khoo et al. found that a first implementation of a CTF training framework produced limited overall improvement. In contrast, a revised iteration with stronger scaffolding yielded clearer gains in selected cybersecurity topics [24]. In a cross-national university study, Schafeitel-Tähtinen and Lazarov reported increases in knowledge, skills, self-efficacy, and interest following a gamified CTF scenario, while also showing that different learner groups can benefit differently [25]. Learning analytics work has become correspondingly more process-oriented: Ošlejšek et al. used process-driven visual analysis and clustering of CTF activity to identify engagement patterns and potential problems in exercise design [26].
Two recent reviews underline the same methodological gap from a broader perspective. Amjad et al. synthesized 68 studies on serious-game frameworks for cybersecurity training and highlighted the need for more structured evaluation and classification of training designs [27]. Matus et al., reviewing 172 studies of gamified cybersecurity training platforms, concluded that the literature remains fragmented across didactics, user experience, platform architecture, and operational concerns, making it difficult to identify which design choices yield defensible educational evidence [28]. Thus, although recent work supports the use of CTFs as engaging learning environments and has begun to exploit richer telemetry, the literature still provides little evidence about the psychometric behavior of real competition challenge sets across repeated editions. In particular, researchers have rarely evaluated reliability, item discrimination, calibration of author-assigned point values, and competency-domain under-representation together. The present study addresses that gap by treating five editions of the same national event series as assessment instruments and analyzing both their measurement properties and the construct space they can and cannot observe.
3. Materials and Methods
This section describes the study design, event corpus, data harmonization, competency coding, derived measures, participant survey, statistical procedures, and ethical considerations.
3.1. Study Design
This retrospective observational study combines secondary analysis of archived competition-platform data with a cross-sectional participant survey. For psychometric analyses, we treated each edition as a separate instrument because challenge composition, scoring, and team composition differed across years; we used corpus-level summaries only where explicitly stated. The unit of analysis is the challenge item for the psychometric strand (n = 94) and the team for the behavioral strand (n = 56 teams with at least one recorded attempt, from 58 rostered teams). No intervention was administered, and no data were collected specifically for this study beyond the 2025 survey.
3.2. Event Corpus
Hacking Night is an evening cybersecurity competition organized by Algebra Bernays University in Zagreb, Croatia, open to students and industry practitioners. Five editions were available for analysis: 2018, 2020, 2023, 2024, and 2025. The 2019, 2021, and 2022 editions were not held because of organizational and resource constraints, including limited funding; no competition data exist for those years. All five editions analyzed were team-based evening events lasting 4.5 to 6.7 h. Both competition platforms are open-source software distributed without a commercial vendor: CTFd (CTFd LLC, Austin, TX, USA) and Facebook CTF (Meta Platforms, Inc., Menlo Park, CA, USA). The archived exports record database schema revisions rather than platform release numbers, so the precise platform version in use at each edition cannot be stated retrospectively.
We obtained complete platform exports for all five editions. For the four CTFd editions, this comprised the full JavaScript Object Notation (JSON) database export, including the submissions, users, teams, challenges, hints, unlocks, and tracking tables. For the 2018 edition, the export was a MySQL dump from which the scores_log, failures_log, hints_log, teams, and levels tables were parsed. Critically, all five exports record both correct and incorrect submissions, allowing reconstruction of attempt behavior rather than outcomes alone.
3.3. Data Harmonization
The two platforms use incompatible schemas, and the events use inconsistent local category labels, so we harmonized the data. We mapped submissions from both platforms to a common attempt record comprising event, team, challenge, timestamp, and correctness. Facebook CTF has no individual user accounts, so we conducted all analyses at the team level to preserve comparability across the corpus; we retained CTFd user identifiers but did not use them as the unit of analysis, doing so for reasons discussed in Section 5.4. We identified administrator and organizer test accounts by account type, the hidden flag, and the pre-event registration timestamp, and we excluded them and their associated teams.
The five editions used 22 distinct native category labels. For the primary knowledge-area analysis (Coding A), these labels were harmonized into eight areas—web and application exploitation, network and infrastructure, cryptography, credential and user attacks, encoding and steganography, privilege escalation, reverse engineering, and digital forensics—using the native category label and, where necessary, the challenge title. Three items from the 2018 edition carried no category and could not be classified from their titles; we retained them in all analyses and reported them as unclassified. Alternative knowledge-area classification using title and description evidence is described under Coding B in Section 3.4.
3.4. Competency and Knowledge-Area Coding
We evaluated each of the 94 items against six competency dimensions of the structured competency model under development for this domain: technical knowledge, analytical skills, critical thinking, ethics and responsibility, communication, and risk management. Established cybersecurity workforce frameworks, including the European Cybersecurity Skills Framework and the NICE Workforce Framework for Cybersecurity, likewise describe penetration testing as combining technical and analytical capabilities with ethical conduct, communication, and risk judgment [29,30]. We therefore use the six dimensions as a compact operationalization rather than claim a new taxonomy. Technical knowledge required cybersecurity-relevant tooling, systems, protocols, exploitation, cryptography, reverse engineering, forensics, or comparable security-specific knowledge; analytical skills required multi-step chaining of intermediate findings; critical thinking required inference or lateral reasoning beyond systematic enumeration; and ethics, communication, or risk management required some element of the scored artifact itself to reflect the corresponding dimension. Because we refined the technical-knowledge boundary after producing the independent codings, we report the resulting definitional discrepancy explicitly as a limitation rather than treating it as random rater error.
Three evaluators examined competency coverage through four recorded procedures with deliberately different evidence sources. Coding A (Evaluator 1) was a rule-based mapping from platform category labels, with challenge titles used only when necessary; it served as the continuity mapping for the primary knowledge-area summaries. Coding B (Evaluator 1) was a second rule-based sensitivity analysis using titles and descriptions with an explicit keyword rule set and no category labels. Coding C (Evaluator 2) independently coded all 94 challenges from item evidence and additionally assigned a knowledge area where defensible. Coding D (Evaluator 3) independently coded all 94 challenges for the six competency dimensions without access to A, B, or C. Thus, A–B comparisons test robustness to evidence source within the rule-based procedure, whereas C–D comparisons provide direct inter-rater evidence for competency dimensions. C–D agreement was summarized using raw agreement and Cohen’s κ with 95% bootstrap percentile confidence intervals from 5000 item-level resamples. For dimensions rated absent on all 94 items by both evaluators, κ is not estimable and raw agreement is reported. Because Coding A inherits platform labels that sometimes denote target environments rather than techniques, fine-grained knowledge-area results under A are treated as descriptive and are checked against description-based Codings B and C in Section 4.4.
3.5. Derived Measures
We computed primary item difficulty as the proportion of all eligible teams solving the item, treating a non-solve as 0 in the instrument-as-administered matrix. Because non-engagement and failure after engagement are not equivalent, we also conducted an attempt-conditional sensitivity analysis in which we treated team-item pairs with no recorded submission as missing. Attempt-conditional difficulty is the proportion solved among teams that attempted the item. Attempt-conditional discrimination is the point-biserial correlation, among teams that attempted the focal item, between its solve indicator and the proportion of other attempted items that team solved. We report this quantity only when at least three usable teams and variation in both variables were available.
For reliability, no edition contained a team that attempted every item, so listwise-deletion KR-20 is undefined. We therefore used multiple imputation as a sensitivity analysis rather than presenting an available-case coefficient as ordinary KR-20. For each item, we Jeffreys-smoothed the observed success probability among attempts as (s + 0.5)/(a + 1), where s is the number of solves, and a is the number of teams attempting the item. In 5000 imputations, missing team-item cells were first imputed from this item-specific probability (a missing-at-random benchmark). We then repeated the procedure as a pattern-mixture MNAR sensitivity analysis after multiplying the odds of success for every unattempted cell by 0.5. We computed KR-20 on each completed matrix and averaged across imputations. The MNAR multiplier is a sensitivity parameter, not an estimated selection mechanism; the original analysis, which codes every unattempted item as unsolved, provides a still more pessimistic boundary. These analyses therefore test how strongly the reliability conclusion depends on assumptions about selective item engagement.
At team level, the following measures were derived: total points; the number of solves; the number of attempts; submission precision, defined as the ratio of correct to total submissions; breadth, defined as the number of distinct knowledge areas attempted; the Shannon entropy of the distribution of attempts across knowledge areas; hint unlocks; team size; the number of distinct members submitting; and normalized time to first and last solve, expressed as a fraction of elapsed event time to permit comparison across editions of differing duration. Because scoring schemes and challenge sets differ between editions, we standardized team outcomes within each edition before pooling.
3.6. Participant Survey
We administered a 22-item questionnaire to participants in the 2025 edition, yielding 38 responses from 39 registered participants. The instrument covered professional role and experience, formal training history, perceived importance of penetration testing and of six competency dimensions, current development methods, perceived barriers to professional development, self-assessed proficiency, and attitudes toward structured competency models. Closed items used nominal categories, multiple selection, or five-point Likert scales. The questionnaire was anonymous, and no identifier linked responses to platform accounts; Section 5.4 addresses the consequences of this design decision. We developed the questionnaire for this exploratory study and did not independently validate it as a psychometric instrument; therefore, we interpret the survey findings descriptively and as hypothesis-generating evidence.
3.7. Platform and Submission-Processing Audit
We audited the platform exports and submission-processing rules for each edition (Table 1). All CTFd challenges were stored as standard challenges, and the dynamic-challenge tables were empty; the 2018 Facebook CTF levels likewise used fixed base point values with no active bonus. Dynamic scoring was therefore not enabled in any analyzed edition, and the point-value analysis uses the stored author-set value. The CTFd exports record no active event-level submission-rate limit: the relevant field is blank in 2023 and 2025 and is absent from the 2020 and 2024 exports. The 2018 backup contains no corresponding rate-limit setting, so we cannot rule out an external web server or proxy limit in the archived data.
Table 1.
Platform and submission-processing audit by edition. “No setting recorded” means that no event-level rate-limit field is present in the archived export; it does not exclude infrastructure-level throttling outside the platform export.
CTFd flags were static. Case-insensitive matching was configured for 21 of 22 flag records in 2020, all 21 records in 2023, 9 of 10 in 2024, and 20 of 22 in 2025; the remaining records used exact matching. No correct CTFd submission contained leading or trailing whitespace, and no correct submission omitted the stored flag prefix. The exports contain no separate generic whitespace- or prefix-normalization rule. The Facebook CTF score log records successful outcomes but not the submitted successful string, so its case/whitespace/prefix behavior cannot be reconstructed from the archive. We retained exact repeated submissions in the attempt-level precision analysis (81 in 2018, 65 in 2020, 6 in 2023, 1 in 2024, and 3 in 2025); they do not affect the binary team-item solve matrix.
For the reviewer-requested brute-force audit, we prospectively defined a high-rate burst as at least eight incorrect submissions by the same team to the same item within any rolling 60-s window. The 2018 failure log contained one such burst, comprising nine incorrect submissions to one item within 38 s. Excluding those nine submissions changed the 2018 aggregate precision only from 79/640 = 0.1234 to 79/631 = 0.1252 and did not change team-level ranks or the Kruskal–Wallis statistic reported in Section 4.7.
3.8. Statistical Analysis
Given small per-edition sample sizes and ordinal or non-normally distributed outcomes, we used non-parametric methods throughout. We estimated associations between item value and difficulty with Spearman correlation within each edition. We combined them across editions using a sample-size-weighted Stouffer procedure, rather than pooling items across instruments with different compositions. We tested differences in submission precision across editions using the Kruskal–Wallis test, we tested the ordered alternative using the Jonckheere–Terpstra trend test, and we assessed pairwise contrasts using Mann–Whitney tests with Holm correction. We report effect sizes as Cliff’s delta. We estimated team-level correlates of standardized performance using Spearman correlations with Holm correction across the eight candidate predictors, jointly using ordinary least squares (OLS) regression with edition fixed effects. We tested distributional differences in solve pacing with the two-sample Kolmogorov–Smirnov test. We assessed survey group differences using Mann–Whitney tests and associations using Spearman correlation, applying Holm correction across the nine survey tests as a family. We conducted analyses in Python 3.12 using pandas 3.0.2, NumPy 2.4.4, and SciPy 1.17.1. We used two-sided tests and α = 0.05 throughout; all analyses were exploratory, and we did not pre-register hypotheses. We summarized inter-rater agreement between Codings C and D using raw percentage agreement and Cohen’s κ, with 95% percentile confidence intervals from 5000 item-level bootstrap resamples; for invariant dimensions, we reported raw agreement because κ was not estimable.
3.9. Ethical Considerations
The platform data analyzed here were generated in the ordinary operation of a public competition. We pseudonymized all records before analysis: we removed account names, e-mail addresses, and Internet Protocol (IP) addresses from the analysis dataset; replaced them with opaque identifiers; and ensured no individual or team is identifiable in any reported result. The 2025 survey was voluntary and anonymous. We established cross-edition participation by comparing salted hashes of registered e-mail addresses; we did not retain the addresses themselves. We did not attempt to link survey responses to platform accounts, and the aggregate comparison reported in Section 4.10 is cohort-level only.
4. Results
This section reports corpus characteristics, psychometric properties, coding stability and competency coverage, team behavior, longitudinal submission and solve patterns, participant perceptions, cohort-level calibration, and cross-edition participation.
4.1. Descriptive Characteristics of the Corpus
The corpus comprises 94 challenge items, 58 rostered teams and 1393 submission attempts, of which 347 (24.9%) were correct. Table 2 summarises the five editions. Event scale varies considerably: the 2023 edition attracted 19 teams and the 2020 edition 7, while challenge set size ranges from 10 to 22 items. Two teams registered in 2023 made no submissions and are excluded from team-level analyses.
Table 2.
Descriptive characteristics of the five editions. Precision is the ratio of correct to total submissions. Items solved counts the distinct items solved by at least one team.
Two teams registered in 2023 without submitting and are therefore carried in the roster count but excluded from all team-level analyses reported below, giving 56 analyzable teams across the corpus.
4.2. Psychometric Properties and Their Precision
KR-20 point estimates ranged from 0.72 to 0.82 over the full item set and from 0.77 to 0.86 when restricted to items with response variance (Table 3). Bootstrap intervals, however, were wide wherever the team count was small: the 2020 estimate of 0.82 carries an interval of [0.29, 0.94] on seven teams, and the 2024 estimate of 0.72 carries an interval of [0.12, 0.86] on nine. Only the 2023 edition, with 19 teams, supports a comparatively precise estimate (0.78 [0.69, 0.84]). The point estimates alone therefore do not establish adequate reliability in the four smaller editions.
Table 3.
Psychometric summary by edition, with bias-corrected and accelerated (BCa) bootstrap 95% confidence intervals on KR-20 (10,000 resamples, teams resampled). No team solved the floor items; all teams solved the ceiling items.
Item quality is similarly uneven and imprecise. Across the corpus, 32 items (34.0%) produced no response variance: 25 were solved by no team and 7 by every team. These items contribute nothing to the ranking the scoreboard produces. Among the 55 items with variance, discrimination was satisfactory on average (mean rpb = 0.45, median 0.46), and 33 items (60.0%) reached the conventional threshold of 0.40. But the median 95% interval on an item discrimination estimate is 0.79 units wide; only 28 of 55 intervals (50.9%) exclude zero, only 20 lie entirely above the conventional floor of 0.20, and 20 span more than a full unit. Item difficulty is estimated more precisely but still coarsely, with a median interval width of 0.40 among items with variance.
Figure 1 displays every item estimate with its interval. The practical consequence is that item-level decisions—such as retiring a specific challenge or judging one item better than another—are not supportable at these sample sizes. In contrast, distributional statements about the item set are. We therefore restrict all item-level claims below to the aggregate level. Figure 2 plots the same items in the difficulty–discrimination plane, showing that items with no response variance are concentrated at both extremes of the difficulty range rather than being confined to items that proved too hard.
Figure 1.
Item statistics with 95% BCa bootstrap intervals. (Left): difficulty for all 94 items, ordered by estimate. (Right): rest-corrected discrimination for the 55 items with response variance. The dotted line marks the conventional discrimination floor of 0.20.
Figure 2.
Item map. Rest-corrected point-biserial discrimination against item difficulty for the 55 items with response variance. The dotted line marks the conventional discrimination floor of 0.20; crosses along the base mark the 32 items with no variance.
The attempt-sensitive analysis materially changes the estimand and demonstrates strong selection into item engagement (Table 4). Mean difficulty rises in every edition when restricted to teams that actually attempted an item, most sharply in 2025 (0.367 to 0.945). Attempt-conditional discrimination is estimable for only 32 items across the corpus, compared with 55 under the primary matrix, and its pooled mean is 0.20 rather than 0.45; in 2024, no item has enough attempted-response variation for this coefficient. The reliability sensitivity is even more assumption-dependent. Mean imputed KR-20 under the missing-at-random benchmark ranges from −0.130 to 0.671 across editions; under the MNAR pattern-mixture specification (success odds for unattempted cells multiplied by 0.5), it ranges from −0.108 to 0.680. Negative coefficients indicate that the imputed completed matrices do not behave as internally consistent scales under those missingness assumptions. These sensitivity results strengthen rather than relax the paper’s caution: the apparently favorable primary KR-20 point estimates depend substantially on coding selective non-engagement as failure, and the small, selectively exposed samples do not support a robust reliability claim.
Table 4.
Primary and attempt-sensitive item analysis. Difficulty and discrimination are means across items within edition; n gives the number of items for which attempt-conditional discrimination is estimable. MAR and MNAR columns are mean KR-20 across 5000 completed matrices. The MNAR sensitivity multiplies the odds of success for unattempted cells by 0.5.
The imprecision is easier to appreciate item by item than in aggregate. Figure 1 therefore plots each estimate with its interval, difficulty on the left and discrimination on the right, with items ordered by estimate size.
The two panels of Figure 1 treat difficulty and discrimination separately. Plotting them against one another shows how the two properties are jointly distributed, in particular where the items that carry no information sit relative to those that discriminate well.
Two features of the item map are worth noting. Items with no response variance occur at both extremes of the difficulty range, not only at the difficult end, so an instrument can lose information to items that are too easy as readily as to items nobody solves. The three negatively discriminating items are not the hardest, consistent with idiosyncratic solution paths rather than difficulty alone.
4.3. Assigned Point Values and Observed Difficulty
In all five editions, the challenge authors assigned point values before the event to reflect expected difficulty. The association between assigned value and observed difficulty was negative in every edition, as intended, but its magnitude was inconsistent and its precision poor (Table 5). Only the 2018 and 2020 editions yield intervals excluding zero (ρ = −0.68 [−0.88, −0.20] and −0.60 [−0.80, −0.25]); the intervals for the three most recent editions all include zero, and the 2024 interval spans almost the entire range of the coefficient. Pooling items across editions gives ρ = −0.398 [−0.574, −0.188], and combining the within-edition tests gives z = 4.38 (p < 0.001).
Table 5.
Association between author-assigned point value and observed item difficulty, with BCa bootstrap 95% intervals.
The defensible conclusion is therefore narrower than the pooled coefficient alone suggests. Across the corpus, assigned values show a weak-to-moderate inverse rank association with observed difficulty, but within any single recent edition the data cannot establish that association. The pooled squared rank correlation is approximately 0.16, but we treat this only as a descriptive index rather than as variance explained. Because the final ranking is a value-weighted sum, uncertainty in value–difficulty correspondence propagates directly into the ordering that participants and employers may interpret as a competence ranking.
The pattern behind these coefficients is visible when all 94 items are plotted together. Figure 3 shows assigned value against observed difficulty across the pooled corpus, with editions distinguished by marker.
Figure 3.
Author-assigned point value against observed item difficulty for all 94 items. The dashed line is a logarithmic fit across the pooled corpus.
The negative slope appears across the pooled corpus but is driven disproportionately by the two earliest editions, in which authors assigned a wider range of point values. In the later editions, the assigned values cluster more narrowly, limiting the range over which any association could be detected.
4.4. Stability of the Coding
Agreement between Evaluator 1’s two rule-based codings differed sharply by coding layer (Table 6). At the competency layer, A and B produced similar prevalence estimates for analytical skills (74.5% vs. 73.4%; κ = 0.42 [0.20, 0.62]) and critical thinking (25.5% vs. 19.1%; κ = 0.39 [0.17, 0.60]); both classified all items as technical. We traced three initial Coding B flags for non-technical dimensions to the word “client,” which referred to a client machine rather than a stakeholder, and corrected them. After correction, both rule-based procedures assigned zero items to ethics, communication, and risk management.
Table 6.
Agreement and distributional comparison across coding procedures. Codings A–B are rule-based robustness codings produced by Evaluator 1. Codings C–D are independent evaluations produced by Evaluators 2 and 3. For C–D, 95% confidence intervals for Cohen’s κ are bootstrap percentile intervals (5000 resamples). κ is not estimable when both evaluators assign every item to the same category; we report raw agreement for those dimensions. * Coding B flagged three items before correction of a rule artifact.
At the knowledge-area layer, A–B agreement was poor (κ = 0.164 [0.063, 0.265]; raw agreement = 0.277). The discrepancy was systematic: platform labels sometimes denote target environments rather than techniques. In 2023, for example, labels such as ATLAS, Virtuozzo, and Users group technically different tasks under the same environment. Description-based Coding B consequently redistributed items that label-based Coding A placed together. This result makes Coding A useful for continuity with the native event taxonomy but unsuitable as a precise technique classification.
Evaluators 2 and 3 provide the direct inter-rater check. Coding C classified 78 of 94 items as technical, 66 as analytical, and 26 as requiring critical thinking; Coding D classified 88, 35, and 18, respectively. C–D raw agreement was 89.4% for technical knowledge (κ = 0.50 [0.21, 0.73]), 54.3% for analytical skills (κ = 0.17 [0.02, 0.32]), and 83.0% for critical thinking (κ = 0.53 [0.32, 0.72]). Both evaluators assigned zero items to ethics and responsibility, communication, and risk management, yielding 100% raw agreement for each; κ is undefined because both used only the absent category. The principal asymmetry is therefore clear: the absence of the three non-technical dimensions is invariant, while the exact boundary of analytical skills is not.
The technical disagreement was directional rather than random: all ten C–D disagreements were items that Evaluator 2 coded non-technical and Evaluator 3 coded technical. Evaluator 2 applied a security-specific criterion, excluding general encoding, interpretation, cultural-clue, extraction, demonstration, and similar puzzles that could require reasoning without cybersecurity-specific knowledge; Evaluator 3 applied the broader original codebook criterion of tooling or system knowledge. The disagreement therefore identifies a construct-boundary problem in the codebook. Analytical skills showed an even less stable boundary. These findings motivate caution about exact prevalence estimates and the prospective codebook refinement described in Section 5.4. Exact prevalence estimates for analytical skills, and to a lesser extent technical knowledge and critical thinking, are therefore not sufficiently stable to support precise coverage claims. The invariant absence of ethics, communication, and risk management has a narrower interpretation: the scored flag artifact did not directly require evidence of those dimensions under the operational definitions used. It does not imply that participants did not use, discuss, or learn those competencies while solving challenges.
Taken together, the four procedures converge most strongly on what the instrument does not directly measure. Ethics and responsibility, communication, and risk management are absent under every procedure. In contrast, exact allocations among technical knowledge, analytical skills, critical thinking, and knowledge areas depend on operational definition and evidence source. The coverage analysis therefore gives greatest weight to findings invariant across procedures and treats fine-grained area counts as provisional.
4.5. Knowledge-Area and Competency Coverage
Of the 94 items, 73 (77.7%) were attempted by at least one team, and 62 (66.0%) were solved by at least one team; these two figures are independent of the coding. Because these quantities are properties of the items rather than their labels, we can repeat the coverage analysis under any coding and report it under Coding A for continuity with Figure 4 and under Coding C as a sensitivity check. Under the primary knowledge-area mapping (Coding A), coverage is highly uneven across areas and editions (Figure 4), although those area assignments are provisional for the reasons given in Section 4.4. Web and application exploitation (27 items) and network and infrastructure (23 items) together account for 53.2% of the corpus under Coding A and were almost fully engaged. Cryptography contributed 13 items, of which 8 were attempted, and credential and user attacks contributed 9 items, of which only 3 were attempted. In the 2025 edition, all four cryptography items, the single forensics item, the single privilege-escalation item, and three of four encoding and steganography items received no attempts from any of the 13 teams.
Figure 4.
Knowledge-area coverage by edition under the primary mapping (Coding A). Each cell shows items attempted over items offered; shading indicates the share attempted. Dashes mark areas not represented in that edition’s challenge set.
Recomputing coverage under Coding C leaves every substantive conclusion in place while redistributing items between areas. Under Coding C, cryptography comprises 8 items, of which 4 were attempted (Coding A: 13 items, 8 attempted); credential and user attacks comprise 11 items, of which 9 were attempted (Coding A: 9 and 3); privilege escalation comprises 9 items, of which 7 were attempted but only 3 solved (Coding A: 6, 5 and 4); and digital forensics comprises 2 items, of which 1 was attempted under both codings. The areas that attract least engagement relative to their representation are the same under both procedures, and the aggregate totals are identical by construction. The per-area figures in Figure 4 should nonetheless be read as indicative rather than exact, for the reasons given in Section 4.4.
The competency mapping is more starkly skewed (Table 7), but prevalence within the measured dimensions depends on coding procedure. Technical knowledge remained dominant across procedures (78–94 items), critical thinking occupied a narrower range (18–26 items), and analytical skills varied substantially (35–70 items), confirming that its operational boundary is the least stable. The principal construct-underrepresentation result, however, was invariant: after correction of the documented Coding B rule artifact, Codings A and B and both independent evaluations C and D assigned no items to ethics and responsibility, communication, or risk management. Because every edition ultimately scored a flag string rather than reasoning, justification, prioritization, or reporting, the observed score provides no direct evidence for those three dimensions.
Table 7.
Competency-dimension coverage under the primary rule-based Coding A across the 94-item corpus. Table 6 and Section 4.4 report the prevalence estimates for Codings C and D and the agreement between them. Items with observed evidence are those solved by at least one team and therefore those for which the instrument produced positive evidence under Coding A.
Coverage also varies by edition, and the aggregate figures conceal how unevenly individual areas were represented and engaged from one year to the next. Figure 4 shows that distribution, showing for each edition how many items each knowledge area contributed and how many any team attempted.
Two patterns recur across editions. Areas represented by a single item are frequently either fully engaged or entirely ignored, so their coverage figures rest on one observation, and the areas with the largest item counts are not consistently the best engaged, with cryptography contributing thirteen items under Coding A, of which eight drew any attempt.
4.6. Team Behavior and Performance: A Negative Result
We standardized team outcomes within edition and regressed them on behavioral predictors with edition fixed effects. The initial model identified a strong association between breadth of engagement—the number of distinct knowledge areas a team attempted—and performance (b = 0.858, SE = 0.157, t = 5.48, p < 0.001; R2 = 0.417, n = 56). Because breadth is computed from the same team-by-item incidence structure that also constrains performance, we tested whether this association held after controlling for engagement volume and a margin-preserving null.
Controlling for the number of distinct items attempted reduced the breadth coefficient from 0.858 to 0.321 (t = 2.68, p = 0.010) while increasing R2 from 0.417 to 0.763. More decisively, a degree-preserving randomization that held each team’s attempt count and each item’s attempt count fixed while rewiring team-item links reproduced the association: the observed t = 6.04 lay near the center of a null distribution with a mean of 6.00 and a 95% range [4.99, 7.26] (p = 0.427). The apparent breadth effect is therefore consistent with the arithmetic structure of the incidence matrix rather than an independent behavioral relationship.
A temporally separated exploratory specification—breadth during the first half of an event predicting standardized solves during the second half—gave b = 0.492 (SE = 0.204, t = 2.42, p = 0.020, n = 47). Still, the corresponding bivariate association was not significant (ρ = 0.257, p = 0.082). We therefore treat it only as a hypothesis for future data designed to separate predictor and outcome in time.
4.7. Change in Submission Behavior Across Editions
Submission precision increased strongly and in order across editions, from a mean of 0.154 in 2018 to 0.691 in 2025; the 2024 estimate was slightly higher than the 2025 estimate, so the sequence is not strictly monotonic (Figure 5). The difference across editions is large and highly significant (Kruskal–Wallis H = 35.97, p < 0.001), and the ordered alternative is strongly supported (Jonckheere–Terpstra z = 6.15, p < 0.001). Pairwise contrasts after Holm correction separate the two earliest editions from the two most recent with maximal effect sizes (Cliff’s δ = −1.00 for 2018 vs. 2024, 2018 vs. 2025, 2020 vs. 2024 and 2020 vs. 2025; all adjusted p ≤ 0.005), and they also separate 2023 from both 2024 and 2025 (δ = −0.81 and −0.74, adjusted p = 0.005).
Figure 5.
Submission precision by edition. Boxes show the interquartile range and median across teams; points are individual teams.
The behavioral change is substantial in absolute terms. In 2018, the median team submitted roughly eight flags for every one that scored; in 2025, the median team submitted three for every two that scored. Mean attempts per team fell from 64.0 in 2018 to 11.7 in 2025, while mean solves per team remained essentially unchanged (7.9 and 8.1, respectively). Teams in the later editions were not more successful; they were more selective about when to submit.
The 2018 brute-force sensitivity audit identified one high-rate burst under the prespecified threshold of at least eight incorrect submissions by one team to one item within 60 s. Removing its nine submissions changed aggregate 2018 precision from 0.1234 to 0.1252 and left the team-level precision ranks unchanged; consequently, the Kruskal–Wallis result is unchanged (H = 35.97, p < 0.001). This isolated burst therefore does not explain the cross-edition precision pattern.
The medians show a pronounced ordered shift, although the five-edition sequence should not be described as strictly monotonic; the interquartile ranges of the two earliest editions do not overlap those of the two most recent. Whether the change reflects participants, challenge design, or scoring configuration cannot be settled here, and Section 5.3 sets out the competing explanations.
4.8. Solve Pacing
As an exploratory longitudinal comparison, we contrasted the two earlier editions (2018 and 2020) with the three editions held after the multi-year interruption (2023–2025). Normalized solve-time distributions differed between these groups (Kolmogorov–Smirnov D = 0.176, p = 0.010). The share of solves occurring in the final quarter of the event fell from 0.32 and 0.38 in 2018 and 2020 to 0.11 and 0.16 in 2024 and 2025. Because the breakpoint was not pre-registered and editions differ in challenge composition and participants, this comparison is descriptive evidence of a temporal pattern rather than a causal or confirmatory test.
Figure 6 illustrates the identical comparison in cumulative terms, charting the proportion of solves for each edition aggregated over normalized event time, allowing editions of varying lengths to be analyzed on a unified axis. A curve that rises sharply and then levels off indicates an edition with early, concentrated scoring, whereas a curve that follows the diagonal suggests a uniform distribution of solves throughout the allotted time. The curves from 2018 and 2020 align more closely with the diagonal than those from 2024 and 2025, reflecting the pacing discrepancy captured by the Kolmogorov–Smirnov statistic:
Figure 6.
Cumulative share of solves against normalized event time, by edition.
Later editions reach their final score earlier in the available time and then flatten, consistent with teams exhausting the subset of the challenge set they judge tractable rather than continuing to work on the remainder. This reading is consistent with the coverage results in Section 4.5, though the present data cannot establish it directly.
4.9. Participant Perceptions
The 2025 survey (n = 38, from 39 registered participants) describes a predominantly early-career cohort: 18 respondents (47.4%) reported one to three years of experience and 5 (13.2%) less than one year; moreover, 9 (23.7%) identified as students and 9 (23.7%) as penetration testers. Perceived importance of penetration testing was at the ceiling (mean 4.39 on a five-point scale; 84.2% responded 4 or 5), as were attitudes toward competency models (mean 4.03; 78.9% responded 4 or 5), limiting these items’ discriminating power.
Perceived competency importance was strongly ordered (Table 8). Every respondent selected technical knowledge; a total of 86.8% selected critical thinking, and 81.6% selected analytical skills, whereas 36.8% selected risk management and 34.2% selected communication. Descriptively, this ordering resembles the coverage profile in Section 4.5: the dimensions absent from the scored challenge sets are also among those selected less often as important. This is a cohort-level correspondence only; the survey did not measure individual competency possession and was not linked to platform behavior.
Table 8.
Perceived competency importance and perceived barriers to professional development (2025 participant survey, n = 38; multiple selection permitted).
Respondents with formal penetration testing training rated their own proficiency higher than those without (median 3 vs. 2; U = 261.0, Cliff’s δ = +0.55, p = 0.004, Holm-adjusted p = 0.036), the only survey contrast to survive correction. Self-rated proficiency was negatively associated with the belief that a structured competency model would improve penetration testing quality (ρ = −0.335, p = 0.040). Still, this association does not survive Holm correction across the survey family (adjusted p = 0.317) and should be treated as a hypothesis for confirmatory testing rather than as a result.
The ordering in Table 8 is the perception counterpart to the coverage profile reported in Section 4.5, and Section 5.1 examines the correspondence between the two. The barriers respondents identified are notable for being structural rather than individual: cost, access to practice, and access to mentors together outrank any concern about the clarity of competency standards.
4.10. Cohort-Level Comparison of Perceived Importance and Challenge Engagement
Because the survey was anonymous, individual responses cannot be linked to platform accounts. The 2025 cohort nevertheless permits a descriptive aggregate comparison because 38 of 39 registered participants responded. Respondents unanimously selected technical knowledge as important and selected analytical skills and critical thinking at rates above 80%. Under the primary knowledge-area mapping (Coding A), teams in the same cohort engaged with 5 of the 8 represented knowledge areas and left 9 of 22 items (40.9%) entirely unattempted, including every cryptography item (Table 9). These quantities measure different constructs—perceived competency importance and observed challenge engagement—and must not be interpreted as individual calibration. Their juxtaposition only shows that broad endorsement of technical and analytical competencies at the cohort level did not translate into broad engagement with all knowledge areas offered by the event.
Table 9.
Engagement by knowledge area in the 2025 edition under the primary mapping (Coding A). Teams attempting: counts teams making at least one submission to any item in the area.
The areas that attracted no engagement in 2025 were not those with the fewest items on offer: cryptography contributed four items and drew no attempt at all, while reverse engineering contributed one and was attempted by nine of the thirteen teams. Representation in the challenge set and participant engagement are therefore only loosely coupled.
4.11. Cross-Edition Participation
Across the four CTFd editions, 114 distinct individuals were registered. Twelve appeared in two or more editions and three in three or more. Team names also recur across editions. Repeat participation is therefore present but limited, and it is insufficient to support individual longitudinal analysis; it is noted here as a source of mild non-independence in the pooled team-level models.
5. Discussion
This section interprets the principal findings, distinguishes defensible behavioral signals from structural artifacts, considers longitudinal changes and study limitations, and derives implications for CTF instrument design.
5.1. Principal Findings
Three substantive findings stand out. First, the primary instrument-as-administered matrices produced KR-20 point estimates from 0.72 to 0.82, but those estimates were imprecise and individual items carried limited information. Only the largest edition estimated the primary coefficient with useful precision, and one third of all items produced no response variance. More importantly, the reviewer-requested attempt-sensitive analysis shows that selective exposure is consequential: attempt-conditional difficulty is substantially greater, attempt-conditional discrimination is often not estimable, and multiple-imputation reliability estimates vary sharply with missingness assumptions. The data therefore do not establish robust internal consistency across editions; nominal item count also substantially overstates the number of items that differentiate teams.
Second, correspondence between intended and realized difficulty is limited where it can be estimated. Point values encode an organizer’s difficulty judgment into the scoring function; across the corpus they show only a modest inverse rank association with observed difficulty, and in each of the three most recent editions the bootstrap interval includes zero. Because rankings are value-weighted sums, uncertainty in this calibration directly weakens the ordering’s interpretability as a competence measure.
Third, and most consequential for competency assessment, this instrument class has narrow construct coverage in a specific and predictable way. Technical competence is consistently prominent across the four coding procedures, whereas the estimated extent of analytical-skill coverage depends on its operational definition and evaluator interpretation. By contrast, ethical judgment, communication, and risk prioritization are absent across all four coding procedures, including the independent evaluations by Evaluators 2 and 3, consistent with the fact that a scoring engine that accepts only a flag string does not directly observe these competencies. This is not a deficiency of the events studied here but a property of the format. It becomes a problem when competitive performance is treated as a general proxy for professional readiness.
A fourth observation is methodological. An apparently strong behavioral finding—that breadth of engagement, rather than volume of attempts, predicts performance—passed every conventional robustness check we applied, including permutation inference, clustered standard errors, leave-one-edition-out estimation, and replication under the alternative rule-based Coding B, yet was nonetheless an artifact. Only a null model that preserves the marginal structure of the team-by-item incidence matrix revealed that the association is what one would expect from arithmetic alone. We highlight this because learning-analytics work on competition data routinely reports associations of exactly this form, and the conventional robustness toolkit does not detect the problem.
The convergence between the coverage and perception profiles warrants comment. The three competency dimensions the instrument cannot measure—ethics and responsibility, communication, and risk management—are precisely the three participants rate least important. However, the ordering within each set differs: participants ranked critical thinking above analytical skills, whereas the coverage profile ranks them in reverse order. The available data cannot distinguish whether an assessment culture organized around flag capture shapes what practitioners value, whether prior values shape the events that get built, or whether both reflect a common cause. The correspondence is nonetheless worth stating precisely because it is the kind of self-reinforcing pattern a structured competency model is intended to interrupt.
5.2. What Behavioral Measures Can and Cannot Be Recovered
The failure of the breadth result has general implications for the behavioral analysis of competition data. Measures derived from the team-by-item incidence matrix—breadth, coverage, specialization indices, entropy of engagement—are strongly constrained by the row and column margins of that matrix, and associations among them frequently follow from those margins rather than from anything that a participant did. Evaluate any such measure against a margin-preserving null before interpretation, and we encourage this to become standard practice in the field.
This does not mean we can measure nothing. Quantities that are not functions of the incidence margins—submission precision, solve timing, hint dependence, and the temporal separation of predictor and outcome—remain interpretable, and, notably, the one specification separating breadth in time from performance retained a modest association. The corpus cannot support a cross-sectional behavioral claim derived from the same matrix that defines the outcome.
5.3. The Shift in Submission Behavior
Submission precision changed markedly across the corpus, but the editions are observationally heterogeneous and do not identify a cause for that change. The platform audit confirms that dynamic scoring was not enabled in any edition and finds no active event-level rate limit in the archived CTFd configuration; however, flag-matching rules and platform implementations differ, and infrastructure-level throttling outside the exports cannot be excluded. The transition from Facebook CTF in 2018 to CTFd from 2020 onward therefore remains one competing explanation. A second competing explanation is the changing availability of general-purpose AI/LLM assistance in later editions; such tools could affect challenge solving, flag construction, and willingness to submit uncertain answers. Participant composition, challenge design, and event-specific configuration also changed. Because platform, calendar time, participant population, challenge composition, and the availability of external assistance were not independently manipulated, the present design cannot separate their effects. The 2018 burst sensitivity also shows that the single high-rate brute-force does not drive the observed precision-shift burst identified in that log. The precision comparison is therefore descriptive of these five editions. It must not be interpreted as a longitudinal change in participant competence, professional discipline, or an effect of either platform migration or AI assistance.
5.4. Limitations
The most consequential limitation is the unit of analysis. All five editions were team-based, and the 2018 platform records no individual accounts. Where individual identifiers exist, they record which team member submitted the flag, not who solved the challenge; in three-person teams, these routinely differ. This corpus can support no individual-level competence claim.
Second, the survey was anonymous and did not include a linkage token, so self-assessment cannot be paired with demonstrated performance at the individual level. The comparison in Section 4.10 is therefore cohort-level and descriptive; the near-complete response rate supports the cohort’s representativeness but does not convert perceived importance into a measure of individual competence or permit person-level calibration.
Third, sample sizes are small at every level: 7 to 19 teams per edition, 10 to 22 items, and 38 survey respondents. Item difficulty estimates from 7 teams have wide confidence intervals, and discrimination estimates are correspondingly unstable. Item response theory models, the preferred approach for jointly estimating item and person parameters, are not identifiable at these sample sizes, so we used classical test theory statistics instead. Selective item engagement is an additional measurement limitation: no team attempted every item in any edition, and the attempt-conditional/MNAR sensitivity analyses show that reliability and discrimination depend strongly on how unattempted team-item cells are modeled.
Fourth, three evaluators assessed competency coverage: Evaluator 1 generated Codings A and B, Evaluator 2 generated Coding C, and Evaluator 3 generated Coding D. The C–D comparison provides direct inter-rater evidence for the competency layer, but agreement varies by dimension. Technical knowledge showed high raw agreement (89.4%) with moderate chance-corrected agreement (κ = 0.50), and critical thinking showed 83.0% raw agreement with κ = 0.53. Analytical skills were less stable (54.3% raw agreement; κ = 0.17), indicating that its operational boundary remains sensitive to evaluator interpretation and should not support fine-grained claims without further codebook refinement or adjudication. Conversely, Evaluators 2 and 3 both assigned zero items to ethics and responsibility, communication, and risk management (100% raw agreement for each), reinforcing the principal construct-underrepresentation finding. Cohen’s κ cannot be estimated for these invariant dimensions. Knowledge-area reliability rests on a single independent classification, since only Coding C coded that layer, leaving 14 items unclassified. Comparison against it, nonetheless, localizes the problem: agreement with the label-derived Coding A is poor (κ = 0.364), whereas agreement with the description-derived Coding B is moderate (κ = 0.562), indicating that the weakness lies in deriving areas from platform labels rather than in the construct itself. Accordingly, interpret fine-grained knowledge-area coverage and the exact prevalence of analytical skills with caution.
A further qualification concerns the coding instrument itself. The codebook defined technical knowledge as the application of tooling or system knowledge; Evaluator 2 applied the narrower, security-specific criterion reported in Section 4.4, and articulated that criterion during coding rather than specifying it in advance. In our view, the revised definition is better, and we updated the released codebook to reflect it. However, we made the change after coding, so the C–D comparison spans two definitions. A confirmatory study should fix the definition before coding begins.
Fifth, the editions differ in platform, scoring configuration, challenge composition, and participant mix, and the corpus spans seven years. Within-edition standardization and edition fixed effects mitigate, but do not eliminate, this heterogeneity. Twelve individuals participated in more than one edition, introducing mild non-independence that the models do not accommodate. Finally, participants self-selected into a voluntary evening competition, so the cohort is not representative of the cybersecurity workforce.
5.5. Implications for Instrument Design
The results translate into specific requirements for organizers who intend competitive events to contribute evidence to a structured competency assessment:
- Item analysis should be routine. Difficulty and discrimination can be computed from any platform export within minutes of an event closing, and retiring or revising the third of items that carry no information would materially improve the instrument at no cost to participants.
- Point values should be calibrated empirically. Values derived from observed difficulty in prior editions, or dynamic scoring based on solve counts, would remove a known source of ranking error.
- Challenge sets should be balanced deliberately across the knowledge areas the competency model specifies, and coverage should be reported. An area represented by a single item that no team attempts contributes nothing.
- Individual accounts should be required even where teams compete socially, since per-person attribution cannot be reconstructed after the fact.
- Behavioral measures derived from the team-by-item incidence matrix should be tested against a margin-preserving null before interpretation.
- Where non-technical competencies are to be assessed, the scored artifact must change. A written finding, a prioritization decision under time constraints, or a client-facing summary can be scored alongside flags, and nothing less will provide evidence for the three currently unmeasured dimensions.
A pseudonymous linkage token issued at registration and carried through both questionnaires and the platform account would, at negligible cost, convert the cohort-level comparison reported here into individual-level calibration.
6. Conclusions
Treating five editions of a national capture-the-flag competition as assessment instruments rather than as scoreboards yields a consistent but deliberately narrow picture. Primary KR-20 point estimates ranged from 0.72 to 0.82, but only the largest edition estimated that coefficient with useful precision, and attempt-sensitive multiple-imputation analyses produced substantially weaker and assumption-dependent coefficients. The editions therefore do not establish robust reliability. Most items that generated response variance discriminated acceptably, but a third of all items generated no variance, author-assigned point values corresponded only loosely to realized difficulty, and competency coverage was markedly incomplete. Across three evaluators and four coding procedures, technical knowledge was consistently prominent, while the estimated extent of analytical-skill coverage varied with operational definition. Most importantly, ethics and responsibility, communication, and risk management received no direct evidence of assessment under any coding procedure—not because the events were necessarily poorly designed, but because the scored artifact was a flag string that did not require demonstrating those competencies.
A behavioral analysis of the same corpus yielded a cautionary negative result: an apparent effect of engagement breadth on performance survived every conventional robustness check and was nonetheless an arithmetic artifact of the incidence matrix, detectable only under a margin-preserving null. These findings support a narrow rather than a general use of competitive performance in competency assessment. CTF results provide comparatively strong evidence of technical performance within the knowledge areas an event actually exercises, but the extent to which they also evidence broader analytical competence depends on how that construct is operationalized. In this corpus, they provide no direct evidence of ethics and responsibility, communication, or risk-management competence and should not be treated as evidence of general professional readiness. The gap is measurable, and the instrumentation changes required to close part of it are modest and specified above.
The natural continuation of this work is an edition instrumented from the outset for measurement: individual accounts, competency-tagged challenges balanced across the model’s knowledge areas, empirically calibrated point values, a pseudonymous linkage token, and a scored artifact that observes at least one non-technical dimension. Such a design would permit individual-level calibration of self-assessed competence against demonstrated competence, which the present corpus can only approximate.
Author Contributions
Conceptualization, D.R., S.G. and V.D.; methodology, D.R., S.G., V.D. and R.P.; software, R.P.; validation, D.R., S.G. and R.P.; formal analysis, V.D. and D.R.; investigation, D.R.; data curation, D.R. and V.D.; writing—original draft preparation, D.R. and V.D.; writing—review and editing, D.R. and S.G.; supervision, S.G.; project administration, D.R. and S.G. All authors have read and agreed to the published version of the manuscript.
Funding
This research received no external funding.
Institutional Review Board Statement
The institutional ethics committee reviewed and approved the study. The ethics approval is documented separately.
Informed Consent Statement
Participation in the survey was voluntary and anonymous. Platform data were generated during the ordinary operation of a public competition and were pseudonymized before analysis.
Data Availability Statement
The harmonized item-level and team-level datasets, all four competency coding outputs (Codings A–D), the coding codebook and evaluator coding sheets, and the analysis code are available from the corresponding author on reasonable request. Raw platform exports contain participant e-mail addresses and cannot be released.
Conflicts of Interest
The authors declare no conflicts of interest.
References
- Coenraad, M.; Pellicone, A.J.; Ketelhut, D.J.; Cukier, M.; Plane, J.; Weintrop, D. Experiencing Cybersecurity One Game at a Time: A Systematic Review of Cybersecurity Digital Games. Simul. Gaming 2020, 51, 586–611. [Google Scholar] [CrossRef] [Scilit]
- Karagiannis, S.; Magkos, E. Adapting CTF Challenges into Virtual Cybersecurity Learning Environments. Inf. Comput. Secur. 2020, 29, 105–132. [Google Scholar] [CrossRef] [Scilit]
- Vykopal, J.; Švábenský, V.; Chang, E.-C. Benefits and Pitfalls of Using Capture the Flag Games in University Courses. In Proceedings of the 51st ACM Technical Symposium on Computer Science Education (SIGCSE ’20), Portland, OR, USA, 11–14 March 2020; pp. 752–758. [Google Scholar] [CrossRef] [Scilit]
- Chicone, R.G.; Ferebee, S. A Comparison Study of Two Cybersecurity Learning Systems: Facebook’s Open Source Capture the Flag and CTFd. Issues Inf. Syst. 2020, 21, 202–212. [Google Scholar] [CrossRef] [Scilit]
- Peteranetz, M.S.; Albano, A.D. Development and Evaluation of the Nebraska Assessment of Computing Knowledge. Front. Comput. Sci. 2020, 2, 11. [Google Scholar] [CrossRef] [Scilit]
- Švábenský, V.; Čeleda, P.; Vykopal, J.; Brišáková, S. Cybersecurity Knowledge and Skills Taught in Capture-the-Flag Challenges. Comput. Secur. 2021, 102, 102154. [Google Scholar] [CrossRef] [Scilit]
- Workman, M.D. An Exploratory Study of Mode Efficacy in Cybersecurity Training. J. Cybersecur. Educ. Res. Pract. 2021, 2021, 2. [Google Scholar] [CrossRef] [Scilit]
- Khader, M.; Karam, M.; Fares, H. Cybersecurity Awareness Framework for Academia. Information 2021, 12, 417. [Google Scholar] [CrossRef] [Scilit]
- Chowdhury, N.; Gkioulos, V. Key Competencies for Critical Infrastructure Cyber-Security: A Systematic Literature Review. Inf. Comput. Secur. 2021, 29, 697–723. [Google Scholar] [CrossRef] [Scilit]
- Burská, K.D.; Rusňák, V.; Ošlejšek, R. Enhancing Situational Awareness for Tutors of Cybersecurity Capture the Flag Games. In Proceedings of the 25th International Conference on Information Visualization (IV), Sydney, Australia, 5–9 July 2021; pp. 235–242. [Google Scholar] [CrossRef] [Scilit]
- Poulsen, S.; Herman, G.L.; Peterson, P.A.H.; Golaszewski, E.; Gorti, A.; Oliva, L.; Scheponik, T.; Sherman, A.T. Psychometric Evaluation of the Cybersecurity Concept Inventory. ACM Trans. Comput. Educ. 2022, 22, 3451346. [Google Scholar] [CrossRef] [Scilit]
- Cole, S.V. Impact of Capture The Flag (CTF)-Style vs. Traditional Exercises in an Introductory Computer Security Class. In Proceedings of the 27th ACM Conference on Innovation and Technology in Computer Science Education (ITiCSE ’22), Dublin, Ireland, 8–13 July 2022; Volume 1, pp. 470–476. [Google Scholar] [CrossRef] [Scilit]
- Oliveira Júnior, A.; Funchal, G.; Queiroz, J.; Loureiro, J.; Pedrosa, T.; Parra, J.; Leitão, P. Learning Cybersecurity in IoT-Based Applications through a Capture the Flag Competition. In Proceedings of the 2022 IEEE 20th International Conference on Industrial Informatics (INDIN), Perth, Australia, 25–28 July 2022; pp. 560–565. [Google Scholar] [CrossRef] [Scilit]
- Osunji, O. Bridging the Disconnect within Cybersecurity Workforce Supply Chain. J. Colloq. Inf. Syst. Secur. Educ. 2022, 9, 6. [Google Scholar] [CrossRef] [Scilit]
- Herman, G.L.; Huang, S.; Peterson, P.A.H.; Oliva, L.; Golaszewski, E.; Sherman, A.T. Psychometric Evaluation of the Cybersecurity Curriculum Assessment. In Proceedings of the 54th ACM Technical Symposium on Computer Science Education (SIGCSE ’23), Toronto, ON, Canada, 15–18 March 2023; Volume 1, pp. 228–234. [Google Scholar] [CrossRef] [Scilit]
- Fisk, N. Developmental Challenges: Capture the Flag and the Professionalization of Cybersecurity. Hum. Organ. 2023, 82, 61–72. [Google Scholar] [CrossRef] [Scilit]
- Mason, O.J.; Collman, S.; Kazamia, S.; Boureanu, I. Preparing UK Students for the Workplace: The Acceptability of a Gamified Cybersecurity Training. J. Cybersecur. Educ. Res. Pract. 2024, 2024, 11. [Google Scholar] [CrossRef] [Scilit]
- Russo, E.; Ribaudo, M.; Orlich, A.; Longo, G.; Armando, A. Cyber Range and Cyber Defense Exercises: Gamification Meets University Students. In Proceedings of the 2nd International Workshop on Gamification in Software Development, Verification, and Validation (Gamify ’23), San Francisco, CA, USA, 4 December 2023; pp. 29–37. [Google Scholar] [CrossRef] [Scilit]
- Ahmed, A.; Watterson, C.; Alhashmi, S.; Gaber, T. How Universities Teach Cybersecurity Courses Online: A Systematic Literature Review. Front. Comput. Sci. 2024, 6, 1499490. [Google Scholar] [CrossRef] [Scilit]
- Tay, A.; Hayes, S.M.; Wilson, D.; Hall, E.; Kaufman, D. Gamified Cybersecurity Education Through the Lens of the Information Search Process: An Exploratory Study of Capture-the-Flag Competitions. Issues Informing Sci. Inf. Technol. 2024, 21, 1. [Google Scholar] [CrossRef] [Scilit] [PubMed]
- Vigl, W.; Abramova, S. Design and Use of Privacy Capture-the-Flag Challenges in an Introductory Class on Information Privacy and Security. In Proceedings of the 2024 Conference on Innovation and Technology in Computer Science Education (ITiCSE ’24), Milan, Italy, 8–10 July 2024. [Google Scholar] [CrossRef] [Scilit]
- Abaimov, S.; Gardiner, J.; Samanis, E.; Williams, J.; Samanis, M.; Shahbi, F.; Rashid, A. Capture The Industrial Flag: Lessons from Hosting an ICS Cybersecurity Exercise. In Proceedings of the 10th ACM Cyber-Physical System Security Workshop (CPSS ’24), Singapore, 15 May 2024; pp. 98–106. [Google Scholar] [CrossRef] [Scilit]
- Harish, A.V.; Tam, K.; Jones, K. Generating Training Events for Building Cyber-Physical Security Skills. Comput. J. 2025, 68, 445–459. [Google Scholar] [CrossRef] [Scilit]
- Khoo, L.J.; Yatim, M.H.M.; Wong, Y.S. Research on Capture the Flag Exercises for Cybersecurity Skill Training Among Malaysian Undergraduates. J. Hum. Centered Technol. 2025, 4, 1–9. [Google Scholar] [CrossRef] [Scilit]
- Schafeitel-Tähtinen, T.; Lazarov, W. Teaching and Learning Cybersecurity Using Capture the Flag: Effectiveness Comparison Between University Students in Finland and Czechia. Comput. Appl. Eng. Educ. 2025, 33, e70082. [Google Scholar] [CrossRef] [Scilit]
- Ošlejšek, R.; Chudovský, R.; Macak, M. Process-Driven Visual Analysis of Cybersecurity Capture the Flag Exercises. Inf. Syst. 2026, 136, 102627. [Google Scholar] [CrossRef] [Scilit]
- Amjad, K.; Ishaq, K.; Nawaz, N.A.; Rosdi, F.; Dogar, A.B.; Khan, F.A. Unlocking Cybersecurity: A Game-Changing Framework for Training and Awareness—A Systematic Review. Hum. Behav. Emerg. Technol. 2025, 2025, 9982666. [Google Scholar] [CrossRef] [Scilit]
- Matus, N.; Berríos, S.; Isla, R. From CTF to Competence: UX-Driven and Didactic Foundations for Gamified Cybersecurity Training Platforms. Appl. Sci. 2026, 16, 6100. [Google Scholar] [CrossRef] [Scilit]
- European Union Agency for Cybersecurity (ENISA). European Cybersecurity Skills Framework (ECSF): Role Profiles; ENISA: Athens, Greece, 2022. [Google Scholar] [CrossRef]
- Petersen, R.; Santos, D.; Wetzel, K.; Smith, M.; Witte, G. Workforce Framework for Cybersecurity (NICE Framework); NIST Special Publication 800-181 Revision 1; National Institute of Standards and Technology: Gaithersburg, MD, USA, 2020. [Google Scholar] [CrossRef] [Scilit]
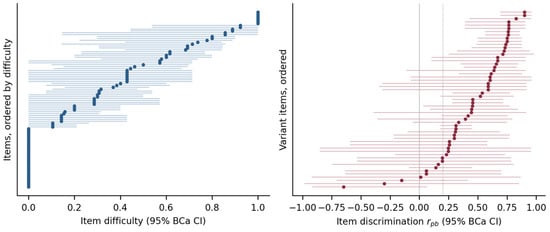
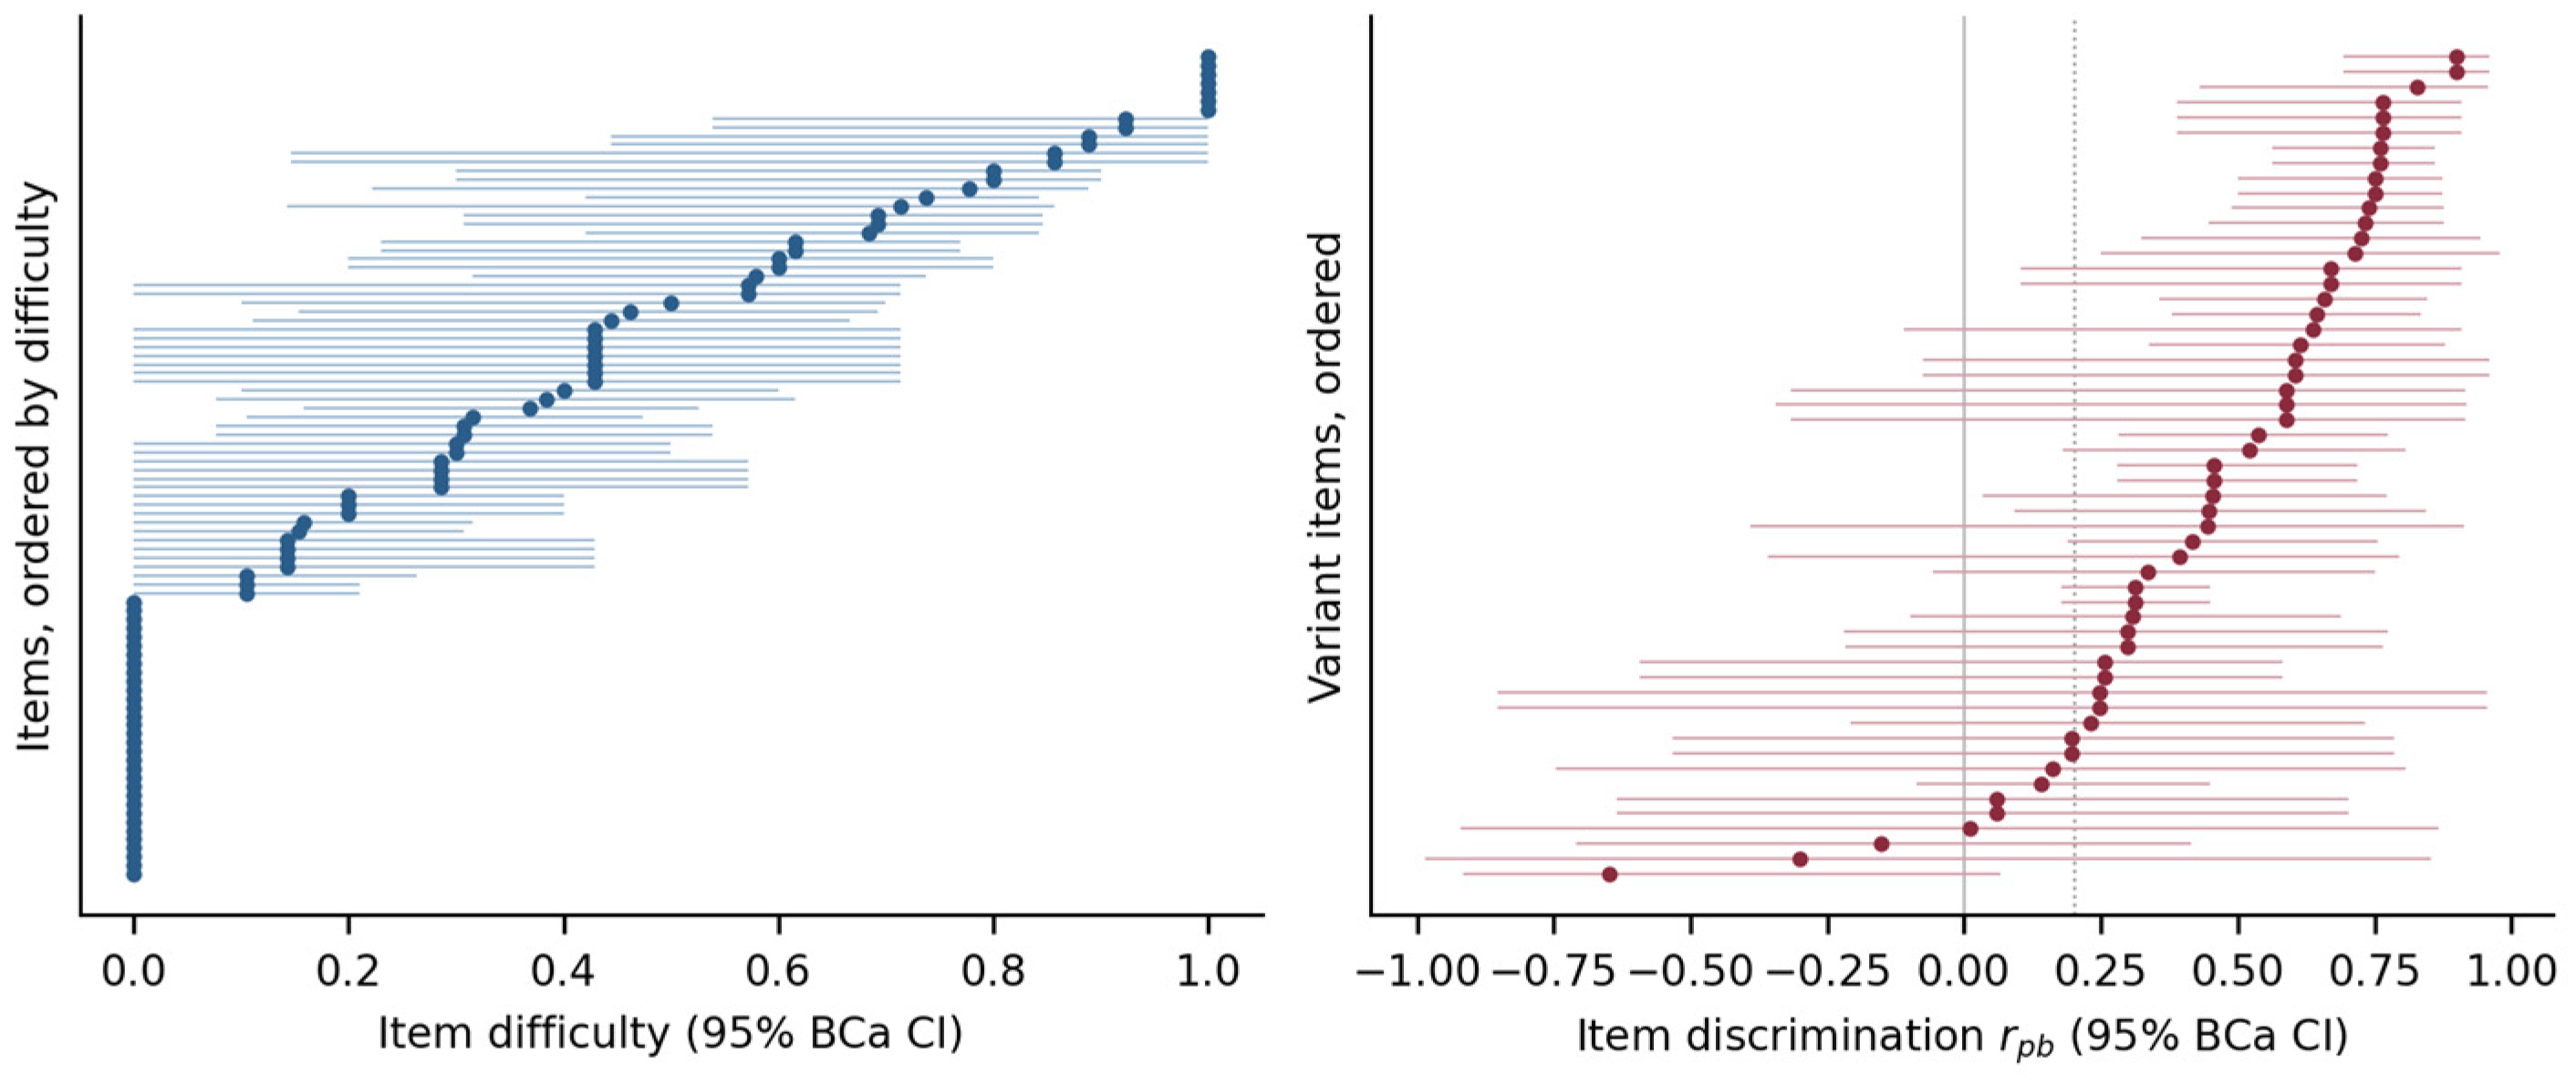
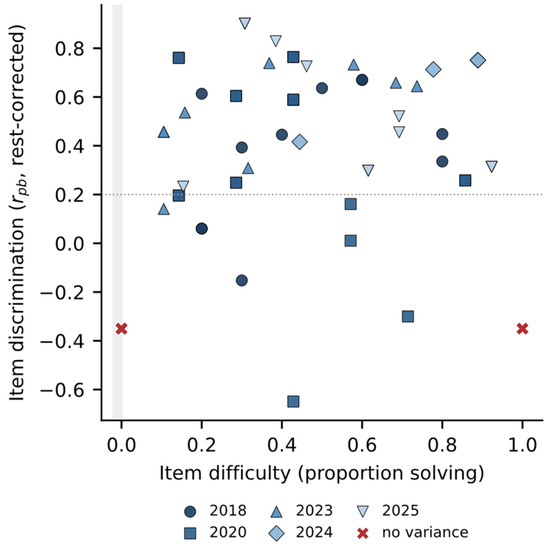
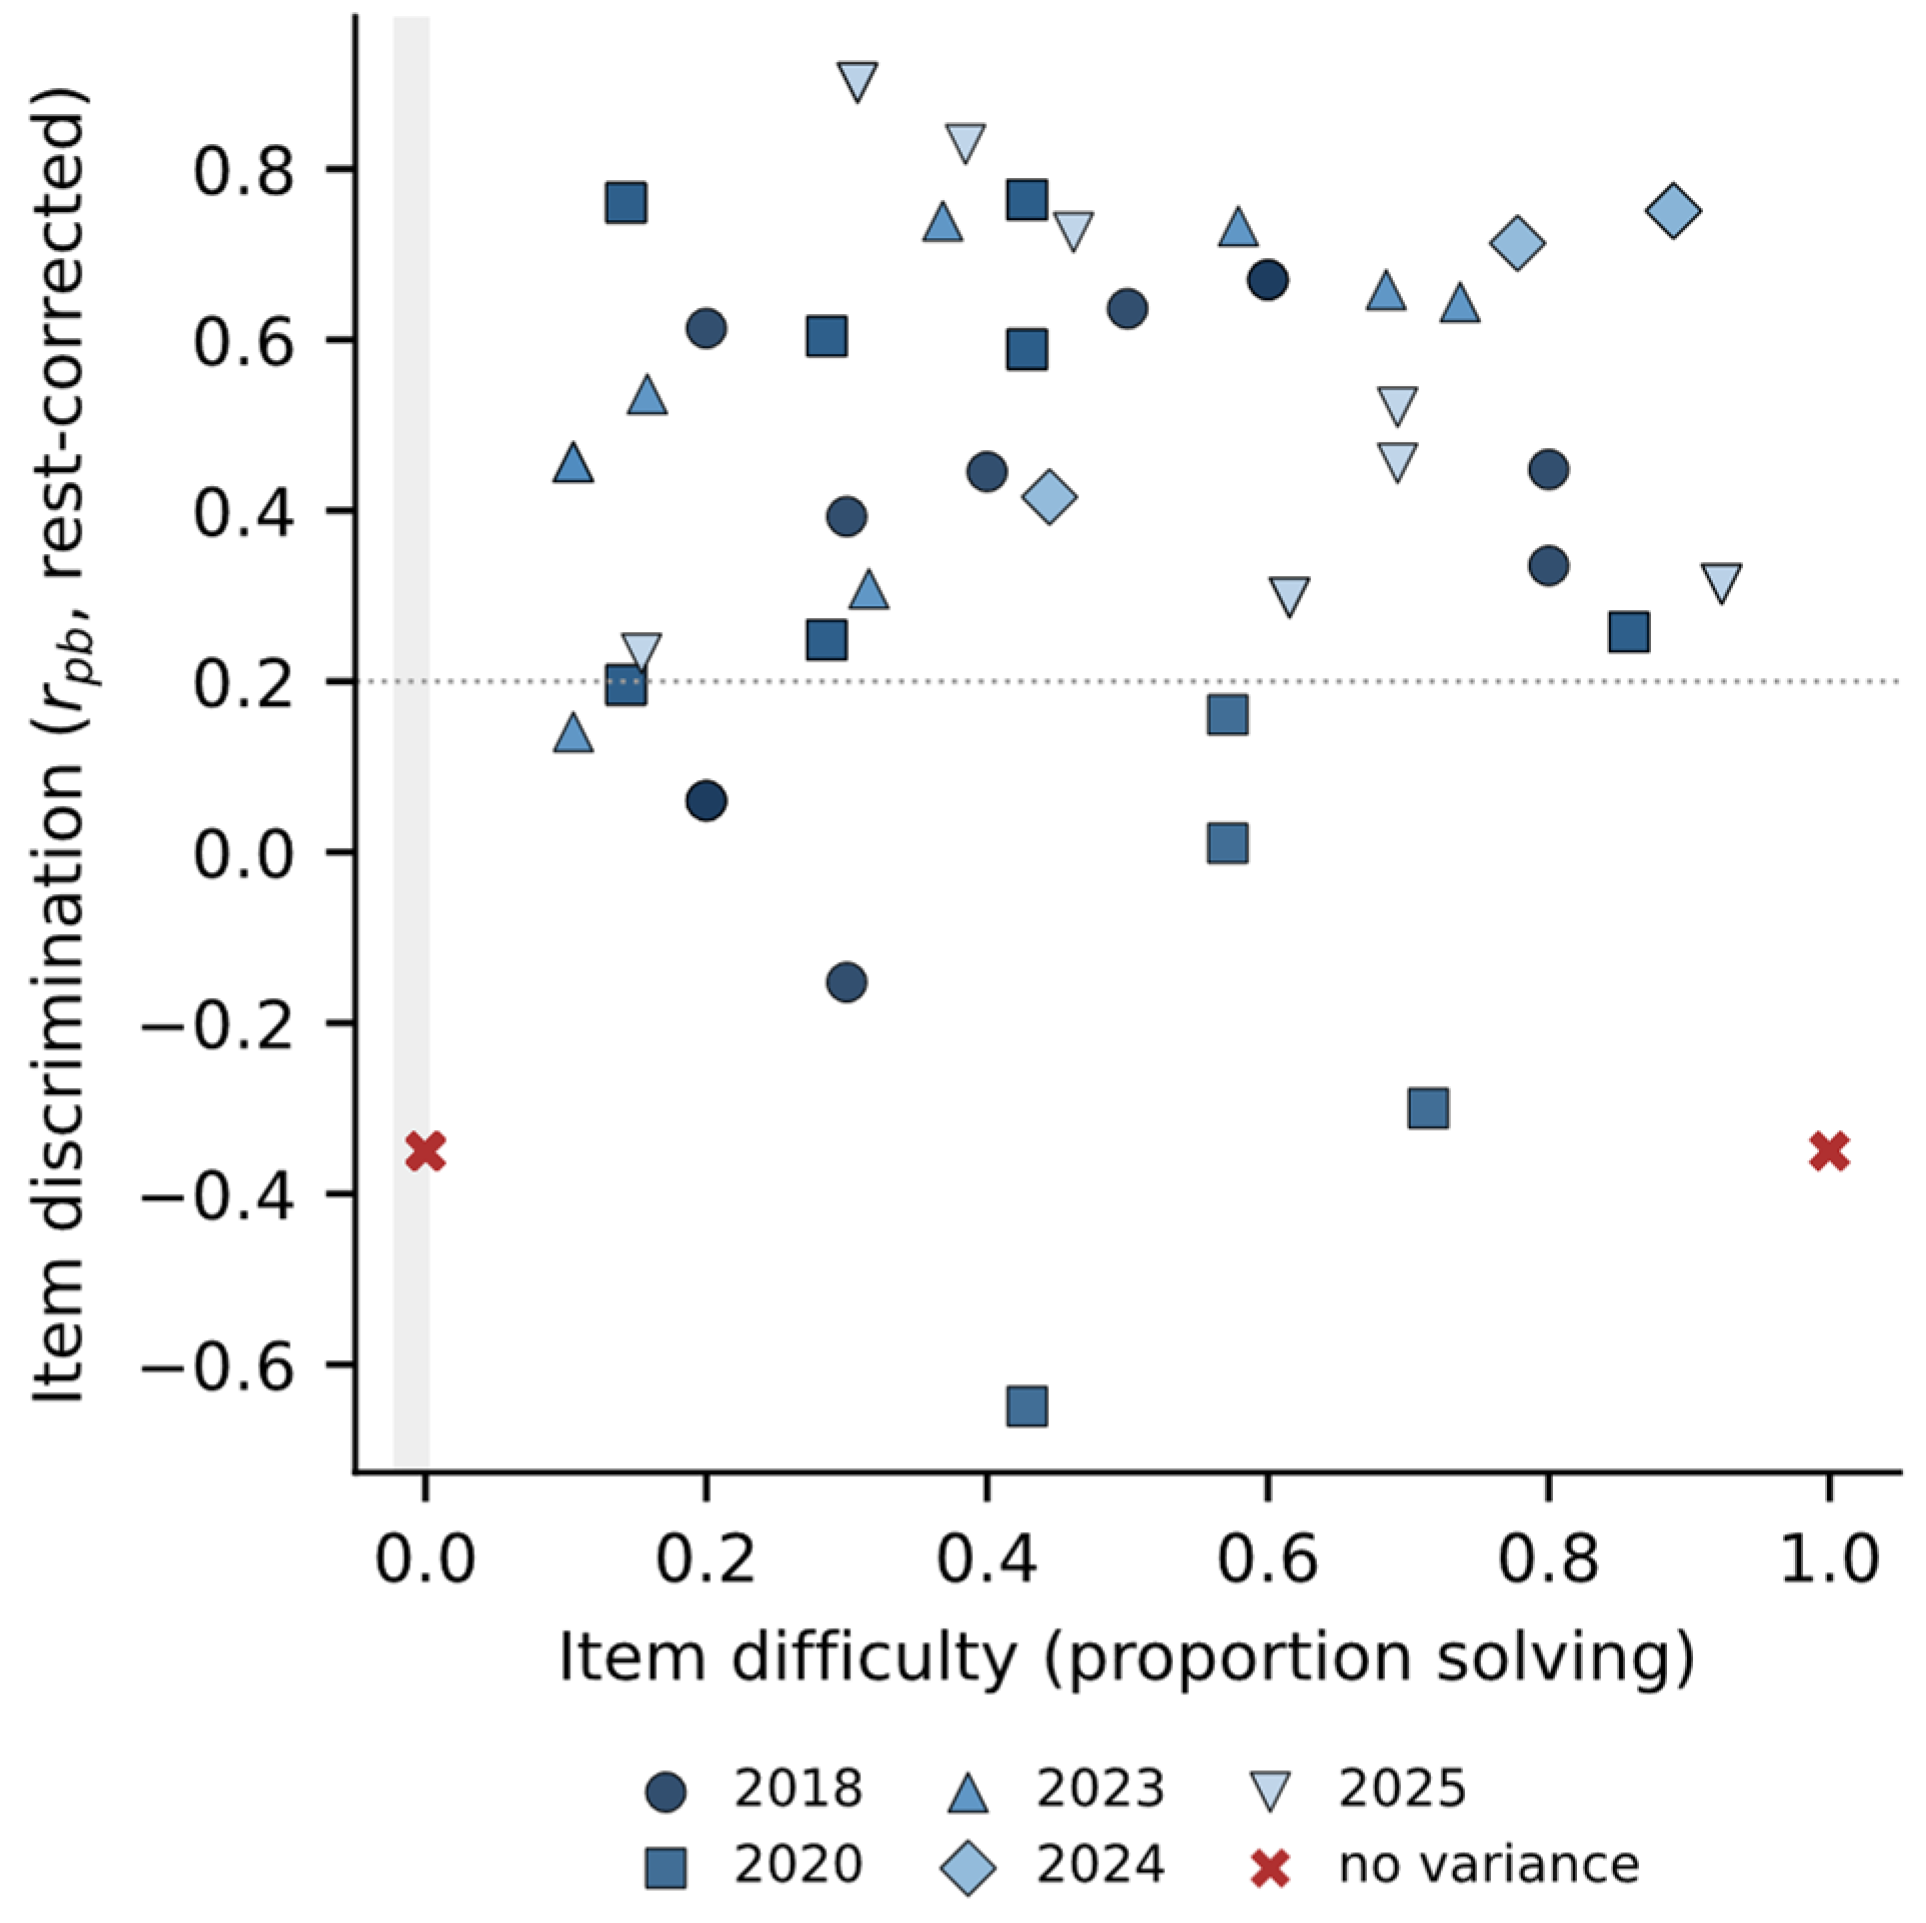
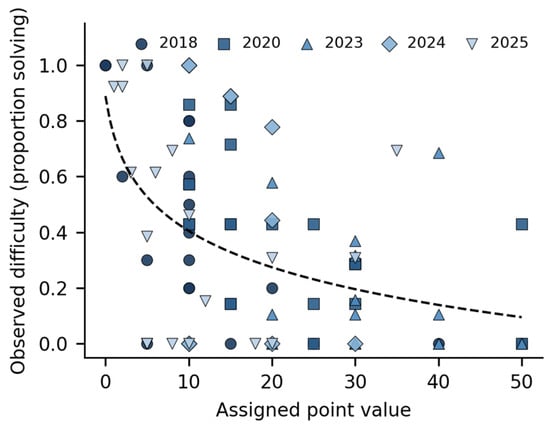
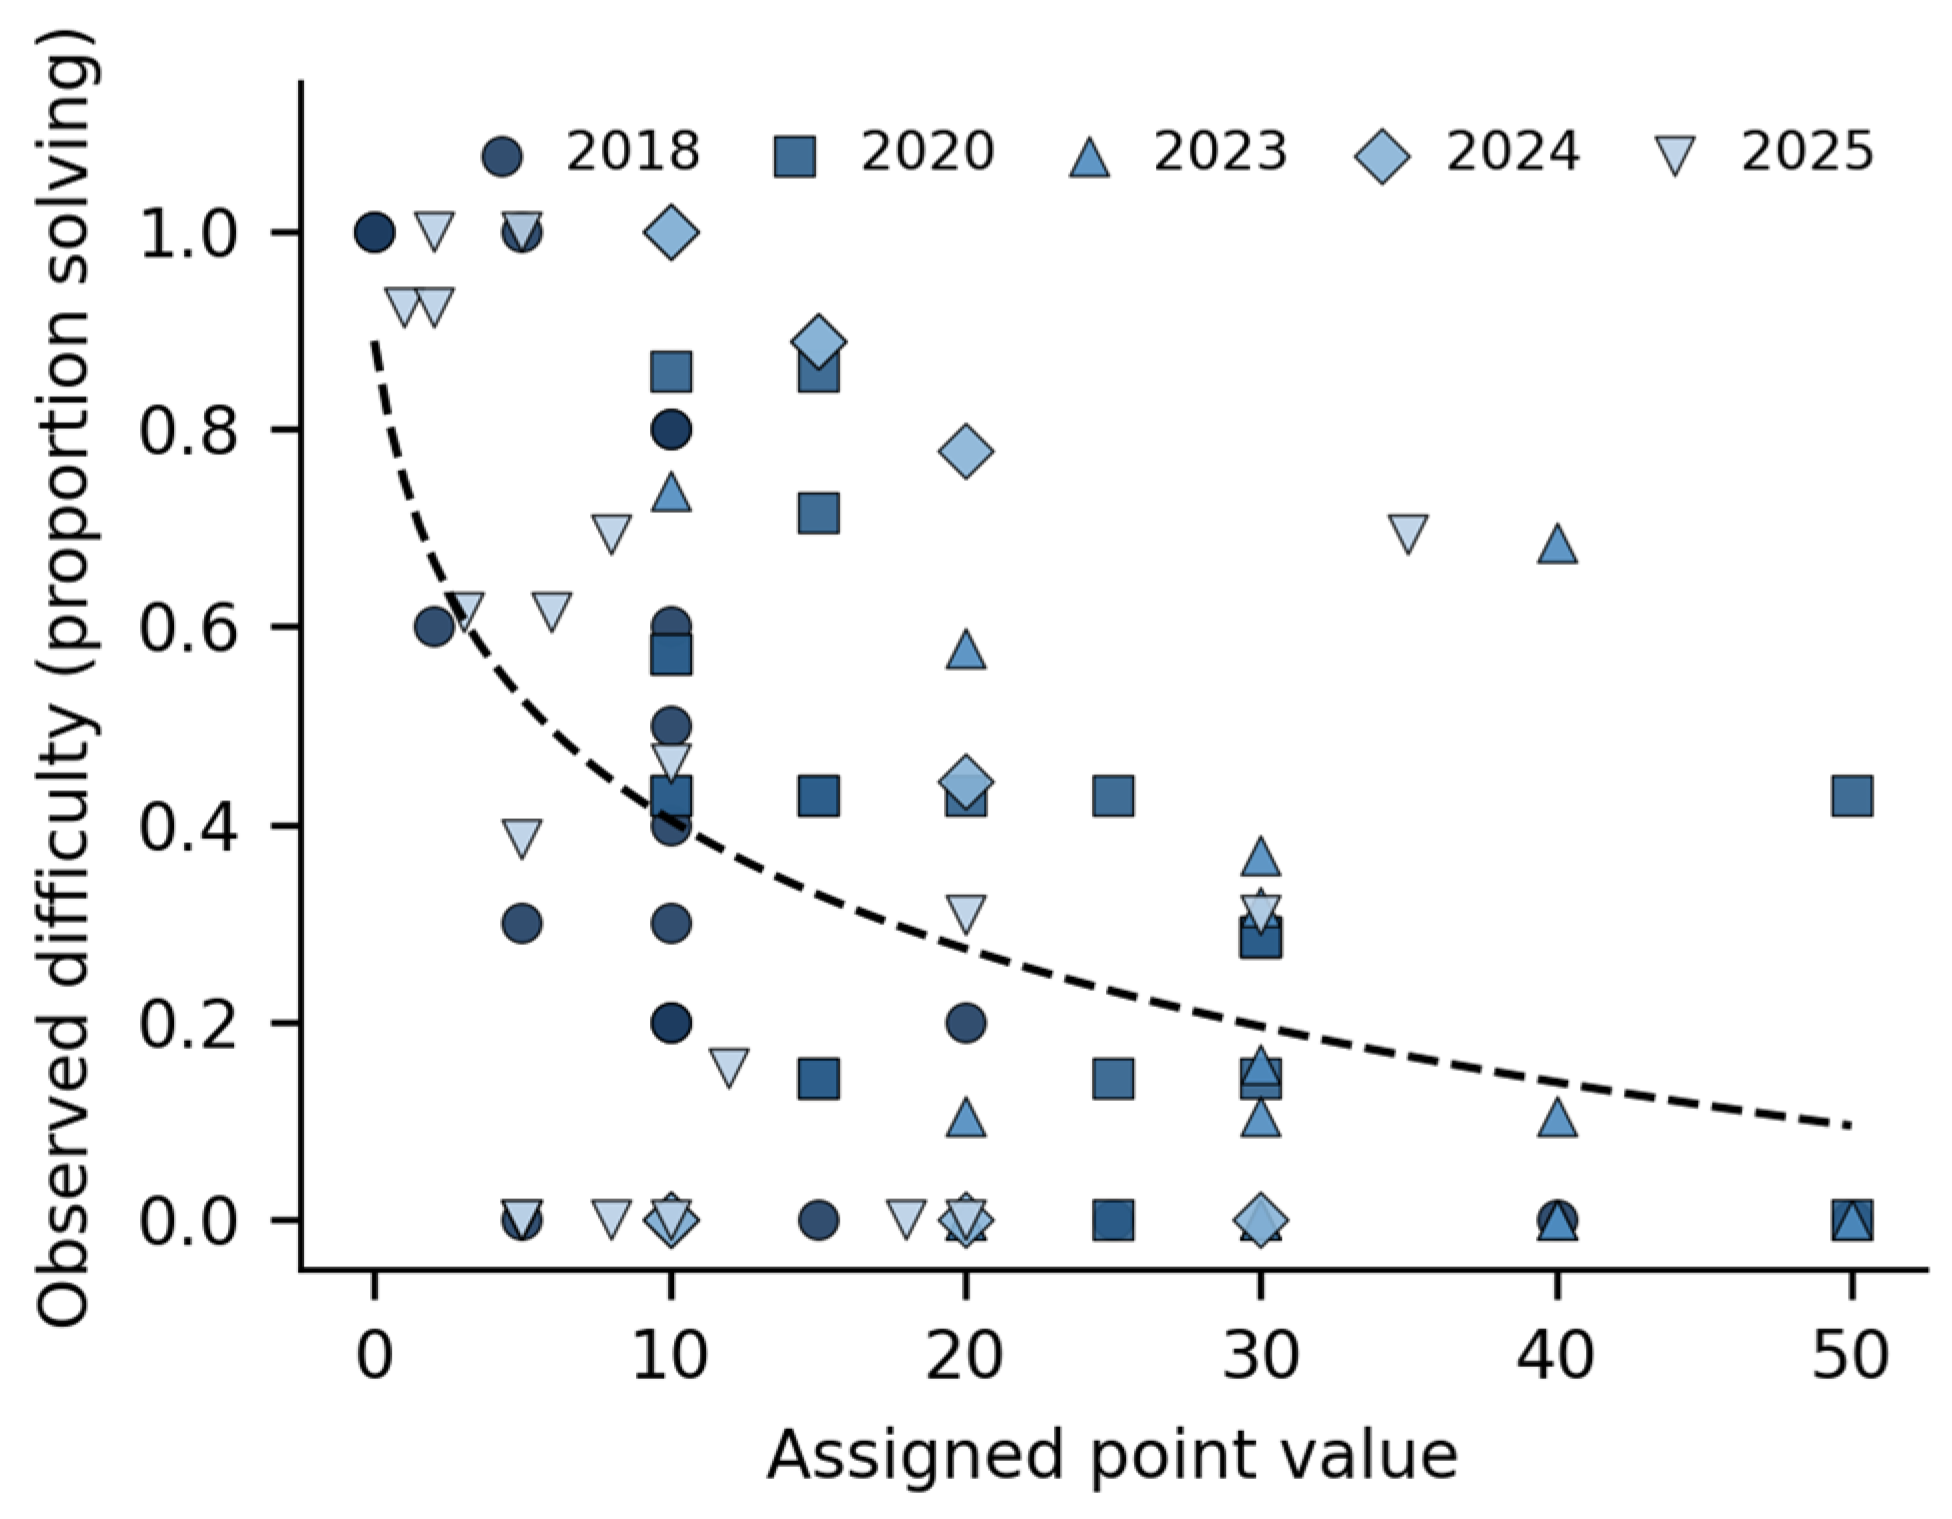
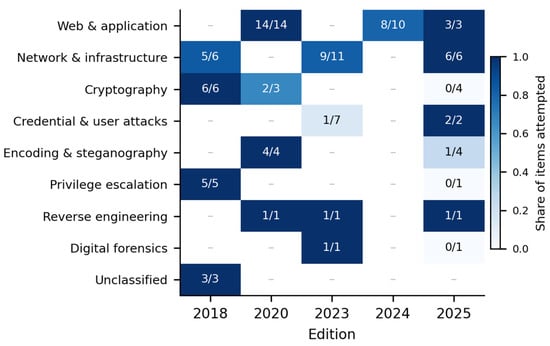
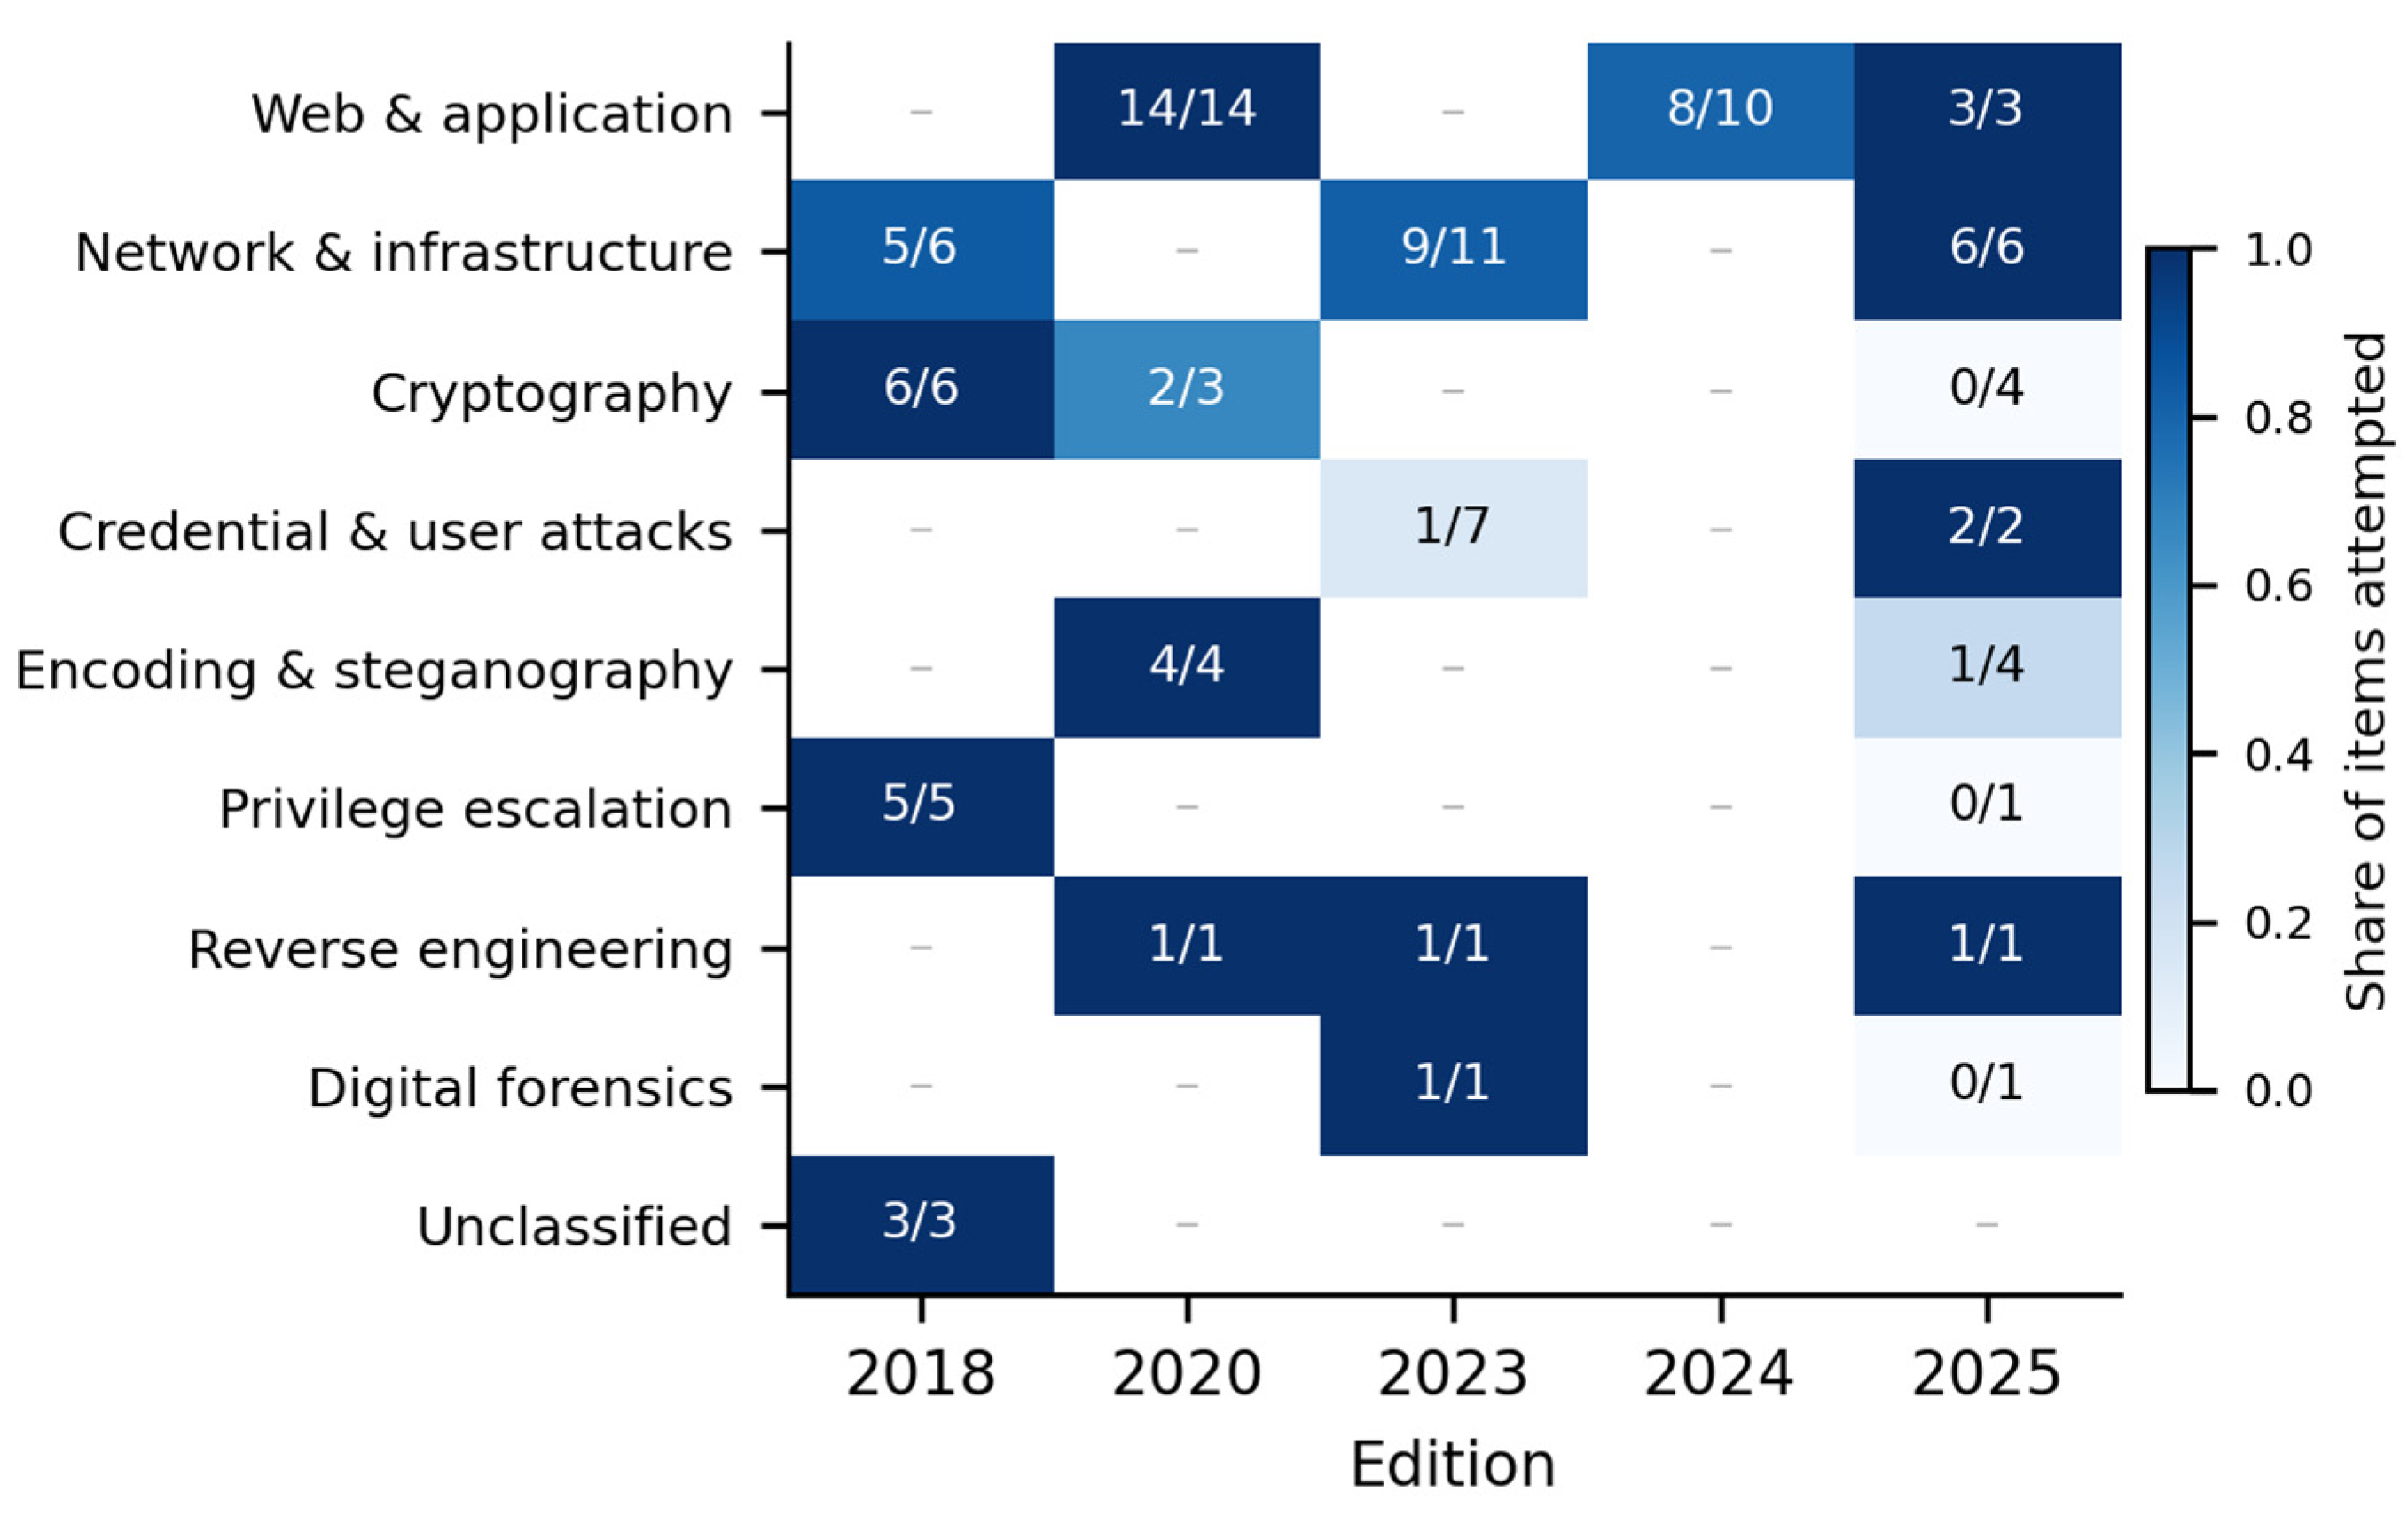
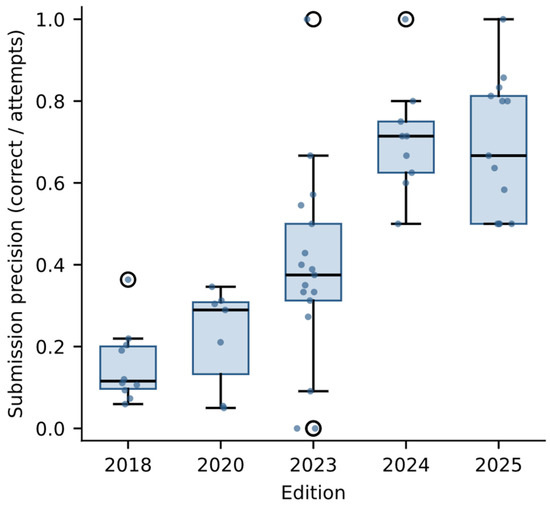
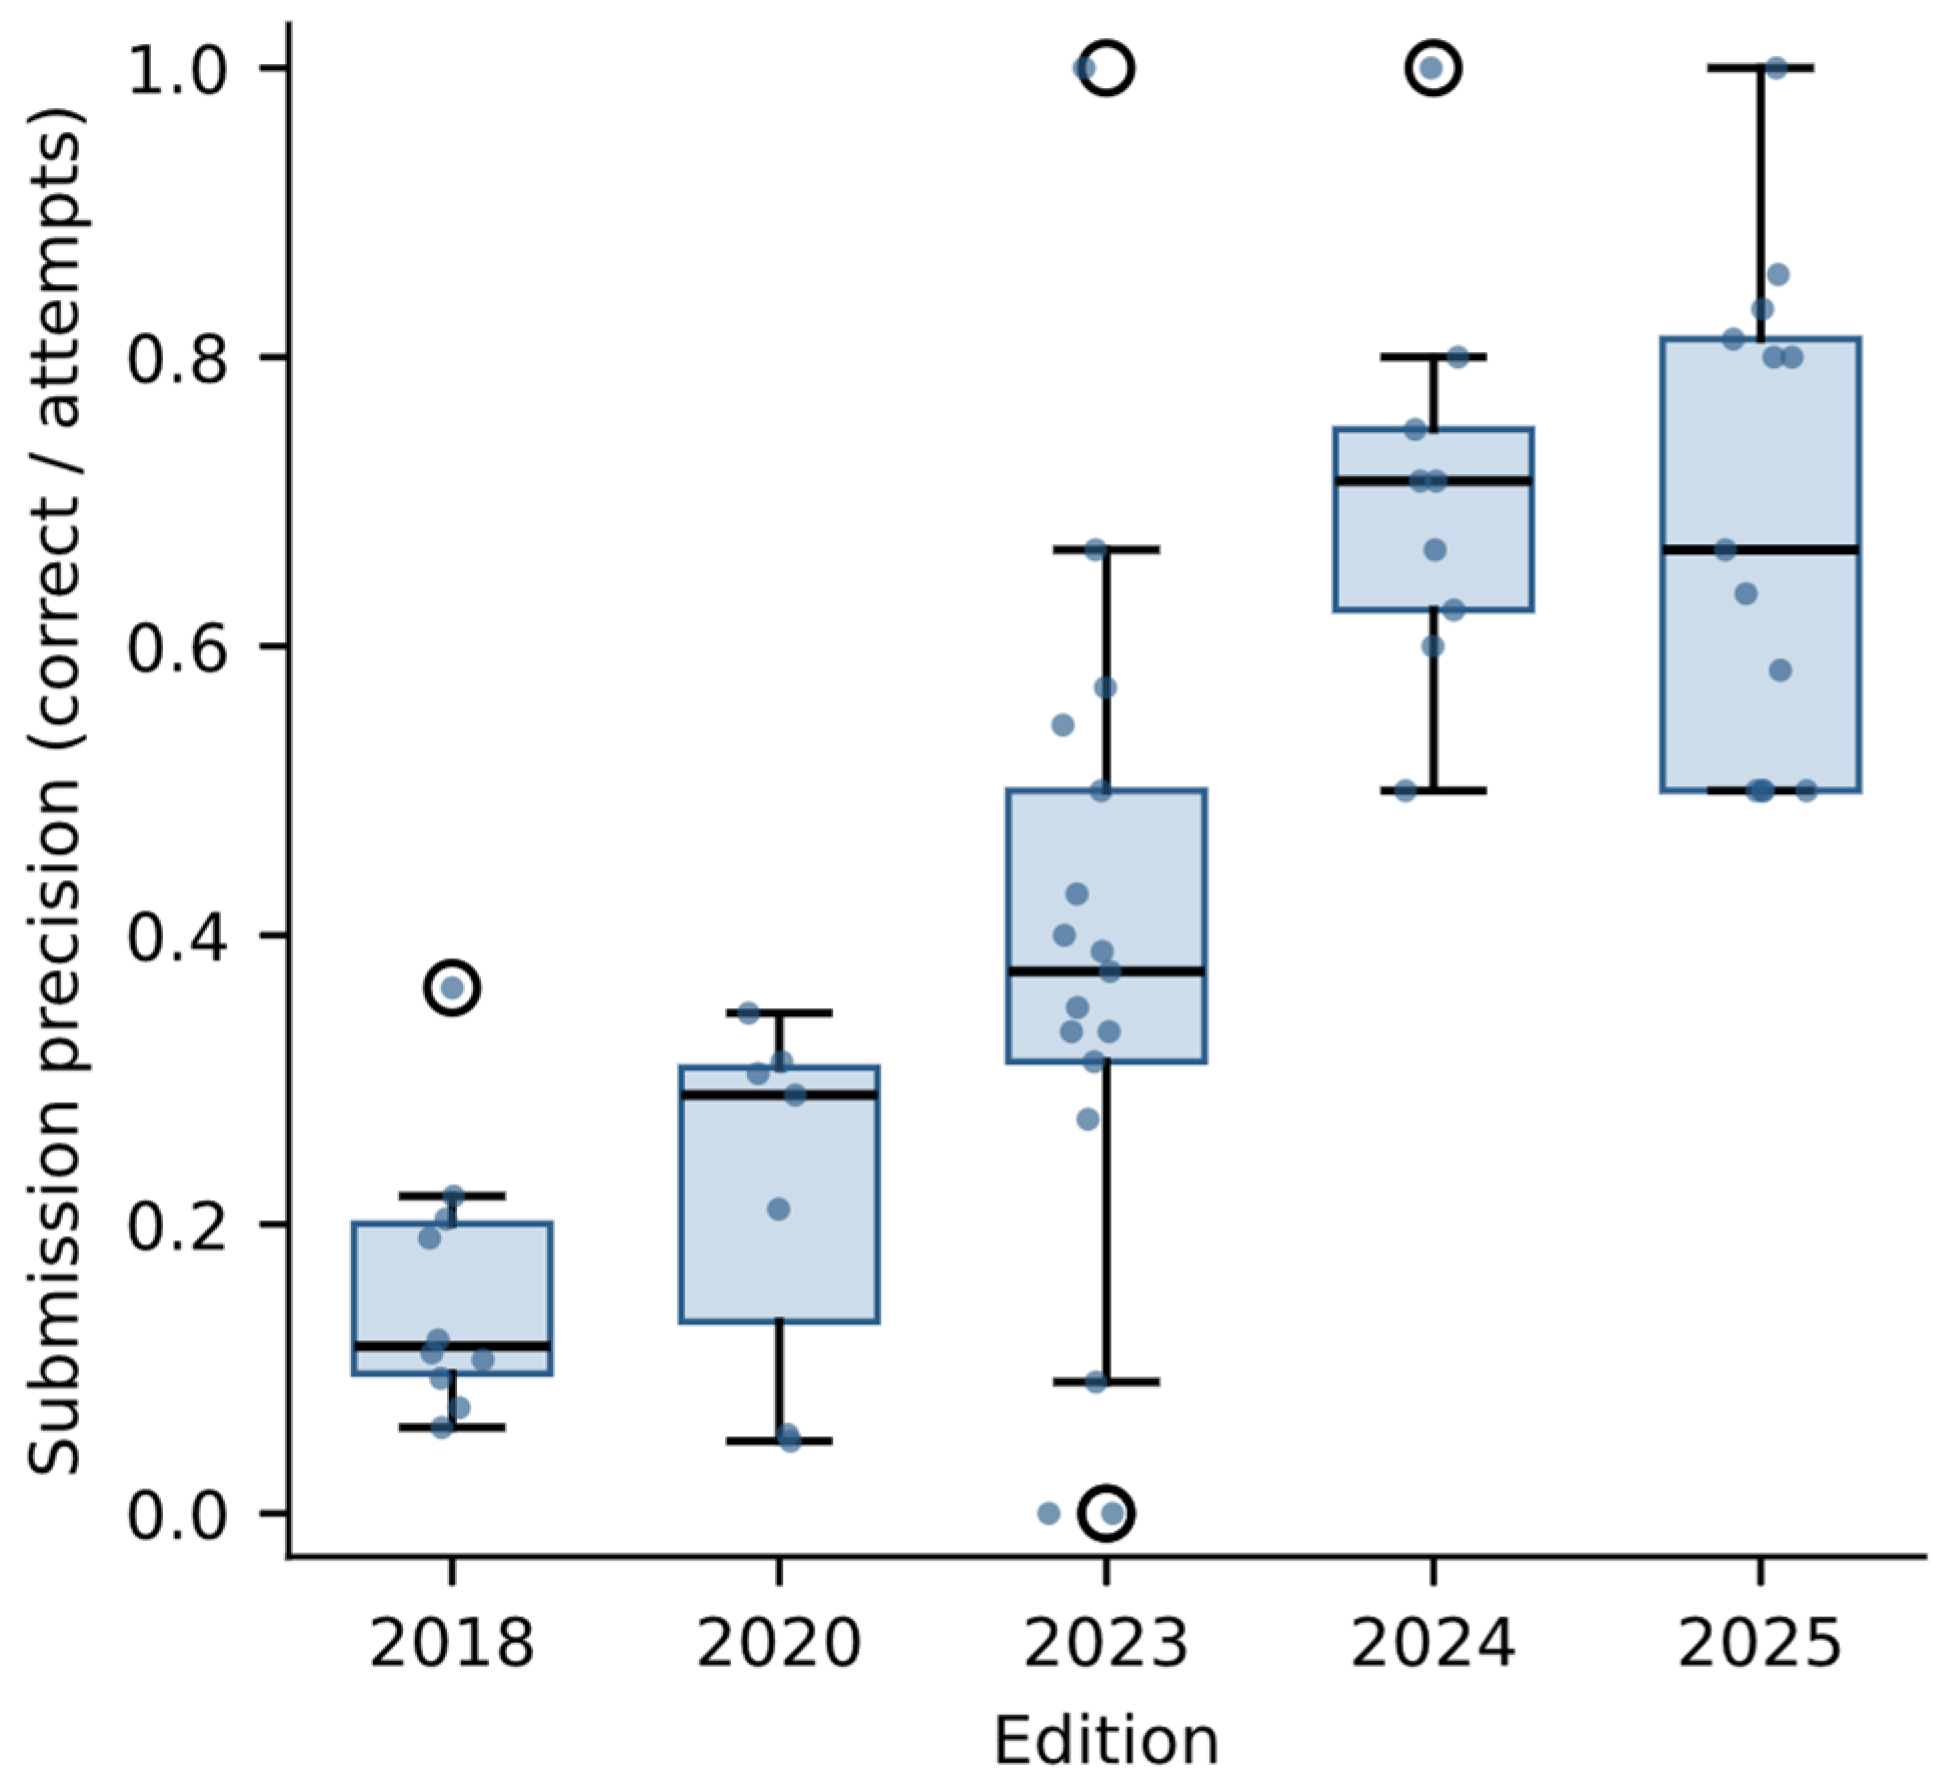
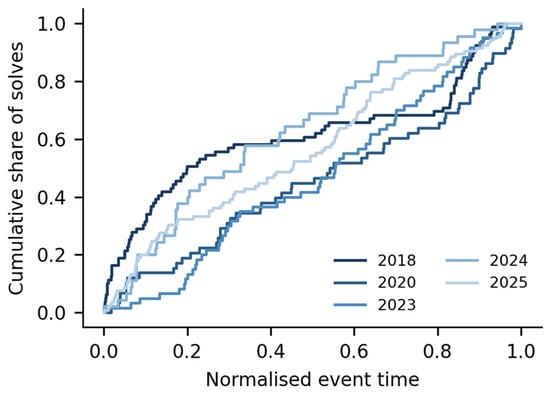
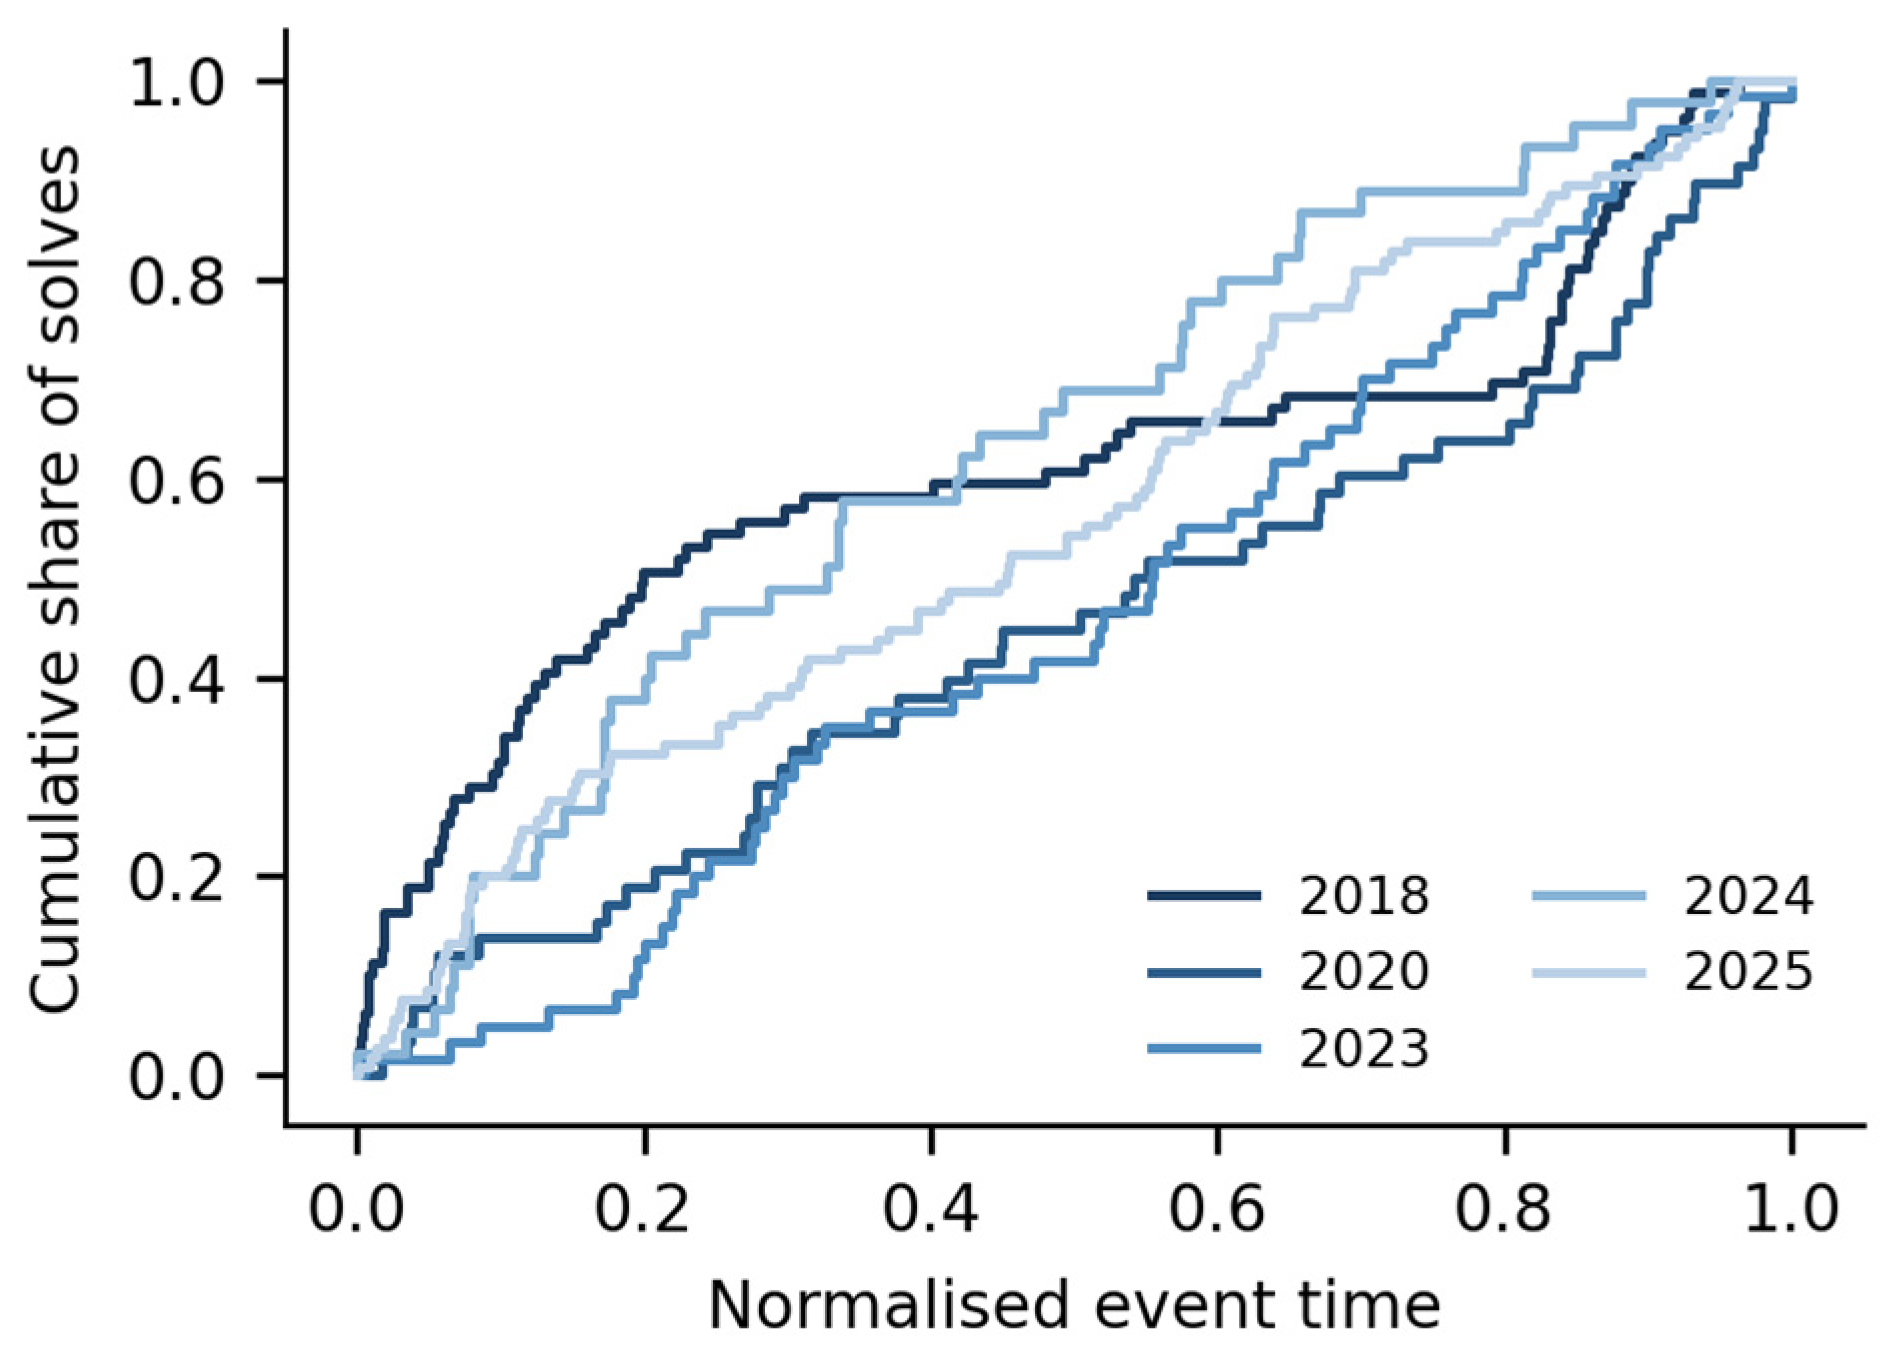

Disclaimer/Publisher’s Note: The statements, opinions and data contained in all publications are solely those of the individual author(s) and contributor(s) and not of MDPI and/or the editor(s). MDPI and/or the editor(s) disclaim responsibility for any injury to people or property resulting from any ideas, methods, instructions or products referred to in the content. |
© 2026 by the authors. Licensee MDPI, Basel, Switzerland. This article is an open access article distributed under the terms and conditions of the Creative Commons Attribution (CC BY) license.