


Abstract
Re-evaluating versioned artificial intelligence (AI) coding agents is expensive, motivating small task panels that represent a full benchmark. We audit whether such representativeness predicts regression-screening value (a regression is a task the previous configuration solved and the target failed), with every selector frozen before target outcomes are read. We study Risk-weighted Representative Regression Panels (R3P), which combine a semantic, structural, and behavioral multi-cover core with a stratified probability audit, against nine target-blind baselines on SWE-bench Verified at a 10% task budget. In five declared configuration pairs, R3P attained the highest normalized coverage score (0.840) but estimated the regression rate less accurately than uniform random (mean absolute error (MAE) 0.0639 versus 0.0403) and fragility-stratified sampling (0.0384). The deficit held in all 18 pairs of an exhaustive same-organization cohort and was matched by an equal-sized random core, so under the certainty-core estimator, it reflects budget allocation, not core choice. Under its declared fragility-first seed rule, R3P detected more regressions than random sampling (recall 0.146 versus 0.101), but not through coverage: its fragility-ordered seed held 12 of the 13 regressions its cores caught, and over 500 random seed-visiting orders, median recall was 0.095, below random. High coverage neither guaranteed regression detection nor substituted for probability sampling.
1. Introduction
Repository-level benchmarks have become a central instrument for evaluating artificial intelligence (AI) systems that attempt realistic software-maintenance tasks. SWE-bench, for example, asks a system to resolve issues drawn from real repositories and evaluates the resulting patches by executing tests in reconstructed environments [1]. Agent scaffolds such as SWE-agent and mini-SWE-agent make these evaluations operational across many underlying language models [2,3]. The same realism that makes such benchmarks useful also makes them costly: each task can require a long agent trajectory, model calls, repository setup, and test execution. Evaluation cost was substantial even before the repository-level setting existed: competition-level code generation already required millions of sampled programs per problem [4]. Budget pressure of this kind is familiar from industrial continuous testing, where the cost of running every test at every change has motivated large-scale test scheduling and learned test selection [5,6].
Evaluation is not a one-time activity. Model providers release new versions, reasoning settings change, and agent scaffolds evolve. A higher aggregate pass rate does not imply monotonic improvement at task level: a new configuration may newly solve some tasks while failing tasks its predecessor solved. We call the latter events benchmark regressions. For release screening, the practical question is therefore not only whether the new version has a higher mean score, but also whether a limited evaluation budget can expose the losses that matter to users who rely on previously solved tasks.
This question is related to, but materially different from, traditional regression-test selection. Classical techniques select program test cases using information about changes to a program under test and coverage or dependency relations [7,8]. Here, each selected item is itself a repository-level issue-resolution episode, the system under test is a versioned AI agent, source-level change information for a proprietary model is usually unavailable, and the observable outcome is whether the agent-generated patch passes the benchmark tests. We therefore use the term regression panel rather than claiming a safe unit-test selection technique.
Recent work has shown that carefully chosen subsets can reduce the cost of large language model (LLM) evaluation while preserving overall scores or rankings [9,10,11]. Those objectives are important, but a subset that reproduces an aggregate rank can still miss a sparse set of version-specific regressions. Conversely, a panel selected only from historically difficult items can be narrow and yields no defensible full-suite estimate when inclusion probabilities are zero for the remaining tasks.
We audit this gap through Risk-weighted Representative Regression Panels (R3P), a deliberately strong hybrid search-and-sampling design. Its deterministic core uses a budgeted multi-cover formulation to represent tasks across semantic, structural, and pre-target behavioral views, with additional coverage for historically fragile tasks. Its randomized audit component samples outside the core within locked fragility strata. We call a selector target-blind when it is frozen before any outcome of the target configuration is read, so that it has access only to what a release engineer would have before running the new version. The design therefore lets us test a tempting assumption directly: that a target-blind panel which covers historical task structure well also exposes future version-specific regressions and supports useful population estimates.
The paper makes four contributions:
- It defines a leakage-resistant, pre-target estimand for task-level regressions between two observed coding-agent configurations.
- It operationalizes a risk-weighted, multi-view multi-cover panel and audits its mixed-integer linear program (MILP)-seeded greedy heuristic against proven target-blind mixed-integer optima on five 80-task calibration instances.
- It identifies the inferential price of combining a deterministic core with a small probability audit, distinguishing descriptive panel error from a design-valid finite-population estimate.
- It provides a reproducible result on audited public SWE-bench records: the panel with the highest observed normalized coverage score estimated the regression rate less accurately than simple probability sampling, and its detection advantage required fragility information and was carried by a fragility-ordered seed rather than by the coverage objective.
The contribution is thus an empirical audit of one coverage objective; its conclusions are limited to that objective and to the audited records. The study shows why coverage optimization, regression detection, and population estimation should be evaluated as separate objectives rather than treated as interchangeable meanings of “representative”.
Section 2 situates the question against regression-test selection and efficient-evaluation work. Section 3 defines the estimand and the target freeze that makes the evaluation falsifiable, and Section 4 the panel construction. Section 5 fixes the budgets, baselines, and endpoints before any target outcome is read. Section 6 reports the audit, including a control that attributes the estimation deficit to budget allocation, a seed-rule analysis showing that detection is not determined by the coverage objective, and a recurrence analysis of the single-rollout records. Section 7 and Section 8 draw the practical consequences and state what the design cannot support.
2. Background and Related Work
2.1. Traditional Regression-Test Selection and Reduction
Regression testing seeks evidence that software changes have not damaged existing behavior. Test-suite reduction removes redundant tests, selection identifies tests relevant to a change, and prioritization orders tests for earlier feedback, an ordering problem that continues to attract search-based treatments in which a metaheuristic optimizes a fault-detection-rate objective under a fixed budget [8,12]. Representative-set and coverage-preserving formulations are long-standing: Harrold et al. [13] select a smaller suite that retains specified testing requirements, while later work studies safety, precision, efficiency, and fault-detection trade-offs [7,14].
Our setting does not inherit the usual safety guarantee. We do not observe the internal code delta between proprietary model versions, and benchmark tasks do not correspond to unit tests covering a single changed program. R3P instead uses prior, externally observed agent outcomes and task metadata. A full benchmark remains the reference population, and a reduced panel is an evidence-producing screen rather than a proof that the target configuration is free of regressions.
2.2. Efficient Benchmark Evaluation
Efficient LLM evaluation has produced methods that use small curated subsets, latent item models, and rank-aware selection. tinyBenchmarks estimates full-benchmark performance from compact item sets using item-response ideas [9]. SubLIME predicts the rank fidelity of candidate subsets from anchor-model outcomes and intrinsic dataset features [10]. MetaEval explicitly estimates item discrimination and distills a compact meta-benchmark [11]. These studies motivate strong score- and rank-preserving baselines in our experiment.
A second strand adapts item selection to the model under test instead of fixing one subset for all models. Adaptive procedures estimate a latent ability parameter and choose items by expected information; predicting item difficulty from item content makes this practical at scale and yields a more reliable measure than the average score over a random subset of the same size [15]. Fluid Benchmarking extends this by adapting item selection to the capability level of the model under test and by reporting validity and saturation alongside cost, arguing that evaluation quality is multidimensional rather than a single efficiency–fidelity trade-off [16]. These methods matter here in one specific respect: they make explicit that the value of an item depends on what is being measured, which is precisely the dependency our results probe.
Our objective differs in three ways. First, the target event is directional: success by the previous configuration followed by failure by the target. Second, selection must be frozen before the target outcomes are revealed. Third, release screening needs both event discovery and an uncertainty-aware estimate of the regression rate over the full eligible population. Accordingly, score- and rank-preserving surrogates enter the study as baselines, and set-cover, facility-location, and representative-subset optimization serve as established components.
2.3. Regression Evaluation of AI Code Systems
ReCatcher formalizes regression testing between code-generating LLMs across correctness, static quality, and performance dimensions [17]. Our work is narrower in outcome definition but broader in scope, since it covers repository-level agent behavior rather than standalone code generation: it targets official binary execution outcomes on issue-resolution tasks and studies how to reduce the number of expensive episodes required to detect regressions. Because the label is produced by the benchmark test harness, no LLM judge is introduced.
SAGE combines LLM-guided exploration, semantic analysis, and multi-objective test selection for gray-box game regression testing [18]. R3P is distinct in unit of analysis, available information, and inferential aim. SAGE generates and selects game trajectories using update semantics; R3P selects fixed repository-level benchmark instances using only pre-target records and augments a search-selected core with a probability sample.
2.4. Representative Patterns and Overlapping Coverage
The conceptual lineage of R3P includes typical-pattern mining, which seeks a small collection of observed objects that jointly represents a larger dataset while considering representability, diversity, full coverage, and multiplicity [19]. It also draws on overlapping, non-exhaustive clustering, where objects may be covered by multiple centers and outliers need not be forced into a cluster [20]. We instantiate this representative-object perspective for versioned coding-agent evaluation by defining multiple task views, risk-weighted multi-cover, a strict temporal freeze, and a design-based audit. The underlying set-cover and submodular ideas are classical [21,22]; in this study, the construction serves as an auditable test case for the representativeness assumption.
3. Problem Formulation
3.1. Observed Outcomes and Transition Estimand
Let be the tasks in a benchmark and let be the observed outcome for task i under configuration c, where denotes that the official test harness marks the generated patch as resolved. A configuration includes the model, reasoning setting, agent scaffold version, and other recorded evaluation settings. We compare a previous configuration p with a target configuration t.
The eligible regression population is
For each eligible task, the observed regression indicator is
and the finite-population regression rate is
Restricting the population to previously solved tasks gives “regression” a directional and operational meaning. Improvements on previously failed tasks are outside the primary estimand and do not cancel regressions.
This is a finite-population, observed-outcome estimand. The public records contain one rollout per configuration–task pair. Thus, describes the archived executions; it does not identify the contribution of any changed component or estimate a latent success probability under repeated stochastic runs.
3.2. Prospective Freeze and Admissible Information
For each transition, all panel-selection inputs are frozen before reading . The admissible history is
where is the timestamp in the official evaluation record. The timestamp is an observational ordering key and need not equal a vendor’s product-release date. Static benchmark metadata available independently of the target outcome is admissible. The target outcome, target-generated patch, and gold code patch are not features. The test specification and issue metadata may be used because they are properties of the benchmark task, not observations of the target agent.
3.3. Design Objectives
Given a task-count budget b, a panel should meet the following objectives:
- Detect as many target regressions as possible, particularly among tasks with greater observable historical fragility.
- Avoid a false clear, defined as observing no regression when the full eligible population contains at least one.
- Represent heterogeneous tasks rather than concentrating on a single repository or task archetype.
- Estimate with quantifiable sampling uncertainty.
No method can guarantee the first two properties without full execution or a strong model of unseen outcomes. R3P treats them as empirical objectives, pursues the third through its multi-view cover core, and reserves probability-sampling budget to support the fourth.
4. Risk-Weighted Representative Regression Panels
4.1. Historical Fragility, Not Severity
Suppose the frozen history contains m configurations. Let denote a historical failure of task i under configuration c. We estimate a shrunk failure rate
where is the global historical failure rate and is the prior strength. The public record contains multiple model families rather than one causal version chain, so adjacent-column flips would depend on an arbitrary ordering. For , we instead compute the order-invariant pairwise disagreement
with the global pairwise-disagreement rate, the sums running over the m history configurations; for , is set to the constant . The selection weight is
where prevents any task from receiving zero weight. The constants and and the weights 0.65 and 0.35 are fixed for the primary analysis and listed in Appendix B; the exploratory uniform-fragility ablation removes this signal rather than tuning its constants.
We call historical fragility in the text. It measures observed difficulty and outcome instability in the available record. It does not encode the business impact, user harm, security consequence, or safety severity of a failure. A production release process would require organization-specific severity information in addition to this score.
4.2. Three Task-Similarity Views
Each view yields a similarity matrix computed without target outcomes.
4.2.1. Semantic View
Issue text is represented with deterministic term frequency–inverse document frequency (TF–IDF) features over unigrams and bigrams [23,24], and task similarity is cosine similarity. This choice avoids a versioned embedding application programming interface (API) and makes the representation auditable.
4.2.2. Structural View
Numeric descriptors include issue length, issue code-block count, fail-to-pass and pass-to-pass test counts, test-patch file/line statistics, task year, and benchmark difficulty. Structural similarity is times standardized numeric proximity plus times a same-repository indicator plus times difficulty proximity , so difficulty enters both terms. The gold solution patch is not used.
4.2.3. Behavioral View
For tasks i and j, behavioral similarity is the fraction of frozen historical configurations on which their binary outcomes agree:
When no history is available, the behavioral view is omitted rather than estimated from the target configuration.
4.3. Budgeted Multi-Cover Core
For each view v, every eligible task j defines a coverage element. Candidate i covers that element when i is among the nearest eligible neighbors of j under view v. Let encode this relation. Standard elements require one selected representative. Tasks in the top fragility quartile also receive a bonus element that requires two distinct representatives, making multiplicity explicit.
Let indicate a selected core task and indicate that element e meets its required multiplicity . For core budget , the exact formulation is
For a standard element representing task j in view v, the implementation sets , where is the locked view weight. Its high-fragility bonus element has . We set , where . This is an additive candidate-fragility bonus, not merely a lexicographic tiebreaker. Groups impose one-representative lower bounds for repository groups and fragility strata; each family of bounds is imposed only when the core budget is at least the number of groups in that family.
The main selector is an MILP-seeded greedy heuristic rather than a purely greedy solver. Its seed is a quota-feasible set of minimum cardinality: among all sets satisfying the group quotas, it has the fewest tasks, and among seeds of that cardinality, the declared design prefers more fragile tasks, in the lexicographic sense made explicit below. We call any minimum-cardinality quota-feasible set an admissible seed. Admissible seeds are generally not unique, so the preference has to be implemented as an explicit rule. The implementation first obtains the minimum cardinality from an auxiliary binary program,
whose integer optimum is unambiguous. It then visits eligible tasks in decreasing fragility , breaking ties by instance identifier, and fixes a task into the seed whenever an admissible seed containing all tasks fixed so far still exists; each check is an exact feasibility program with no time limit. The resulting seed is unique for the declared order and does not depend on solver tolerances. The original implementation instead encoded the preference as a fragility term inside the auxiliary program. That term is smaller than the solver’s optimality tolerance, so which admissible seed was returned depended on the solver build; Section 6.4 reports the consequences and Appendix D reconciles the original values. Starting from the seed, the heuristic fills the remaining core slots by largest marginal gain in Equation (9), using fragility and then instance identifier as deterministic tiebreakers. If any quota deficit remains, quota gain is prioritized before objective gain. The separate 80-task mixed-integer calibration directly optimizes Equation (9); it calibrates search quality, not regression detection.
For cross-method reporting, let denote the complete objective in Equation (9), with each determined by whether S satisfies its required multiplicity. The normalized coverage score is , where P is the entire executed panel, including audit tasks where applicable, and is the full eligible population. It is a full-set saturation ratio, not an optimality ratio against the best panel at the same budget.
4.4. Probability Audit and Population Estimator
The total budget is split as . The deterministic core C receives 65% of the rounded budget and the probability audit receives the remainder. Eligible non-core tasks are assigned to at most three fragility strata whose cut points are equal-frequency quantiles of fragility over the full eligible population [25]. To retain strictly positive inclusion probabilities at very small budgets, the implementation sets the stratum count to , where is the number of eligible non-core tasks, and allocates at least one draw to every nonempty stratum. Within each stratum h, tasks are drawn without replacement from remaining tasks, with inclusion probability .
The core is observed with certainty. A Horvitz–Thompson-style estimator [26] of the finite-population regression total and rate is
where A is the audit sample [27]. Conditional on the frozen core and under the stated sampling design, Equation (14) is design-unbiased for the observed finite population. The usual stratified sampling variance is
Budgets allocate at least two audit items per nonempty stratum when feasible. For a one-item or all-equal stratum draw, where the usual plug-in variance is uninformative, the implementation uses the bounded-binary variance as a conservative sensitivity calculation. Main interval-coverage results use exact hypergeometric inversion within each finite-population stratum and the Bonferroni allocation across strata; both interval width and coverage are reported.
4.5. Frozen-Panel Procedure
For each transition , the evaluation follows this order:
- Construct from the previous configuration only.
- Freeze the admissible history, task features, fragility scores, similarity matrices, budgets, and random seeds.
- Select the deterministic core and draw the audit panel without reading target outcomes.
- Reveal the archived target outcomes and compute regression events.
- Evaluate detection and estimation against the full eligible population.
- Retain row-level transition, method, budget, repetition, and seed fields, together with checksums that bind generated outputs to the source snapshots and analysis code.
This retrospective prequential procedure approximates the information boundary of prospective deployment, to the resolution of the leaderboard timestamps, even though all outcomes already exist in the archive.
5. Empirical Study Design
5.1. Research Questions
- RQ1: Screening under a frozen panel.
- Do panels optimized for historical coverage, at a fixed task-count budget, improve future regression recall or false-clear risk relative to simpler target-blind selectors?
- RQ2: Population inference.
- What estimation error and interval width results are obtained when a fixed total budget is divided between a deterministic representative core and a probability audit?
- RQ3: Representativeness versus utility.
- How well does the quota-feasible heuristic optimize its declared coverage objective, and does higher coverage imply better regression screening or estimation?
- RQ4: Robustness.
- Do the primary conclusions persist under core–audit reallocation, feature and fragility ablations, broader configuration cohorts, protocol-regime shifts, and static multilingual contrasts?
5.2. Data Sources and Immutable Snapshots
The primary population is SWE-bench Verified, a 500-task human-validated subset of the repository-level SWE-bench benchmark [1,28]. Task metadata are pinned to Hugging Face revision c104f840cc67f8b6eec6f759ebc8b2693d585d4a. Per-task outcomes, API calls, and reported costs come from the official SWE-bench website repository [29] at commit 15491f17ea8274f55686338291d7da27df4d1bd7. The analysis uses the “bash-only” leaderboard, which is intended to compare language models under a minimal agent setting [3].
The deterministic audit pipeline requires an exact 500-task key set, checks that the declared aggregate resolved count agrees with the per-task records within rounding tolerance, rejects inconsistent rows, and deduplicates only a same-folder display-name alias with an identical outcome vector. The current build retains 40 complete, internally consistent configuration records and 20,000 binary task–configuration outcomes; 23 retained configurations are marked checked=true, meaning that the run was performed or directly verified by the SWE-bench team, and 22 of these use mini-SWE-agent 1.x. The 13 records with agent version 2.0.0 are not checked. These are provenance counts; only the checked records were run or verified by the SWE-bench team.
For external robustness, we use the official SWE-bench Multilingual task and leaderboard records associated with SWE-smith [30]. The same consistency and alias-deduplication rules retain 12 complete, internally consistent configurations over 300 tasks (3600 outcomes). Because these records do not provide a defensible pre-contrast chronology, no outcomes of configurations outside the contrast pair enter panel construction, and the previous configuration’s outcomes only define the eligible population. Task fragility is fixed to one, the behavioral view is omitted, and the multi-cover core uses semantic and structural views with weights 0.60 and 0.40. Risk-stratum quotas and high-fragility multiplicity are disabled, while budget-feasible repository lower bounds are retained.
The Multilingual probability audit is stratified by the target-free static score
The available comparison methods are uniform random sampling, joint repository–static-score stratified random sampling, static-score stratified random sampling (the design-valid stratified baseline of Section 5.4 with the static score as stratifier), k-center, unweighted facility location, and R3P. Top-fragility, fragility-weighted facility, rank-preserving, and score-information baselines are omitted because they require non-uniform historical fragility or a multi-configuration pre-target outcome history. The five Multilingual contrasts are static transportability checks, not temporal version validations or a replication of the primary R3P specification.
The computational package contains a SHA-256 experiment manifest and is submitted as a Supplementary Material with this manuscript, together with the retrieval script, the pinned upstream revisions, and their digests, so that the data audit and the target-freeze probes can be re-executed once the sources have been re-fetched from their original rights holders. The upstream records are not themselves redistributed, because the pinned leaderboard repository is licensed CC BY-NC 4.0; the digests of the rebuilt matrices are supplied so that a reader can confirm byte-for-byte that they hold the inputs this study used.
5.3. Transition Cohorts
The highest-provenance analysis contains the five declared within-family configuration pairs for which both endpoints are marked checked=true: Claude Sonnet, Claude Opus, Gemini, GLM, and Kimi. Together with three additional within-family pairs involving GPT or v2 Claude Opus records, they form a broader eight-pair sensitivity cohort. These analysis pairs were locked after source and outcome auditing but before running comparative method-effectiveness experiments; the study is retrospective and was not preregistered. The registry is deliberately defined and is not an exhaustive sample of every possible leaderboard pair. The “within-family” label does not imply that only the underlying language model changed: minor agent-protocol, prompt, reasoning, or other recorded settings can also differ. A separate robustness cohort contains nine transitions that change the agent-protocol major version, reasoning regime, or another substantial configuration component. Those comparisons are intentionally labeled agent-protocol-major regime shifts: neither cohort supports component-level causal attribution. Five multilingual configuration contrasts are analyzed separately. Appendix A records exact labels.
Because the declared registry is curated, we added in revision an exhaustive secondary cohort defined by a rule rather than by selection: every ordered pair of checked=true configurations from the same organization, as recorded in the leaderboard’s organization tag, in which the previous configuration’s evaluation date strictly precedes the target’s. The rule yields 18 pairs from 6 organizations, including the five primary pairs. Only seven are same-tier successors; the rule also admits tier changes (for example, Claude 4 Sonnet to Claude 4 Opus, or o3 to GPT-5 nano), a different model line (o3 to gpt-oss-120b), and one older model evaluated later (Qwen3-Coder 480B to Qwen2.5-Coder 32B). Appendix E lists each relation. The cohort is therefore a broad population of configuration replacements within an organization, not a set of version upgrades. It was defined after the original results were known and is reported as a secondary analysis (Section 6.8, Appendix E).
The configuration timestamp determines the frozen history. We report model family, previous and target labels, dates, eligible task count, and full-suite regression count for every transition. The transition registry is included in the computational package; no pair was added to or removed from the declared registry after comparative method results were observed; the exhaustive cohort described above is a separate, post hoc secondary analysis.
5.4. Budgets and Competing Methods
The primary budget is the number of executed tasks, expressed as 5%, 10%, 20%, and 30% of and rounded by a documented deterministic rule. Recorded API calls and dollar costs are secondary outcomes because their availability and comparability vary across providers. Every matched-budget method receives the same number of eligible tasks. Because repository-level tasks differ widely in cost, we also compare methods at matched monetary cost: for each panel, we record the share of the target configuration’s archived dollar cost and API calls that it would have incurred, and we compare R3P with uniform random sampling at equal target-cost share by interpolating along random sampling’s budget curve (Section 6.8). This re-prices the task-count panels; no cost-constrained selector was tested. Agent runtime is not recorded in the public records and is not analyzed.
We compare nine target-blind baselines with R3P:
- Uniform random sampling.
- Fragility-stratified random sampling: the eligible population is divided into the same equal-frequency fragility strata as the R3P audit, every stratum receives at least one draw, and the Horvitz–Thompson estimator of Equation (14) is applied with an empty core, so every task has a known, strictly positive inclusion probability.
- Joint repository–fragility stratified random sampling, retained from the original submission as a descriptive comparator: at small budgets, some of its joint strata receive no draw, so it has zero inclusion probability for their tasks and supports no design-valid population estimate.
- Top historical fragility.
- Farthest-first k-center selection.
- Unweighted facility-location selection.
- Fragility-weighted facility-location selection.
- ç rank-preserving coreset that greedily minimizes the squared discrepancy between panel and full-history pairwise configuration-score differences.
- A score-information proxy that ranks task i by , where is its frozen success frequency and is configuration c’s leave-one-task-out mean outcome. This is a transparent proxy, not a fitted item-response model.
- R3P with its deterministic multi-cover core and stratified audit.
The full suite is the reference population, not a matched-budget competitor; no target-aware oracle enters any reported comparison.
Random and hybrid methods use 1000 locked repetitions per transition–budget pair. Seeds are derived from the study seed 20260808 and stable identifiers, so adding a transition does not alter existing draws.
5.5. Outcome Metrics
Let P be the selected panel and the full set of observed regressions.
5.5.1. Regression Recall
, undefined when . Zero-regression transitions are retained for estimation metrics.
5.5.2. False-Clear Indicator
. For randomized methods, we report its empirical probability across repetitions and Monte Carlo standard error. Where the fixed-core stratified design permits, the corresponding finite-population hypergeometric probability is also reported exactly.
5.5.3. Estimation Quality
Mean absolute error, empirical 95% interval coverage, and mean interval width for . A targeted deterministic method without a probability component is not assigned a design-based interval.
5.5.4. Efficiency
Executed task fraction is primary. When complete and comparable, we also report the fraction of archived API calls and reported cost that would have been incurred by the selected panel under the previous configuration, which is known before the target is run, and under the target configuration, which is what an evaluation actually spends. These secondary measures are descriptive. Target-side cost depends on the outcome: in these data, regressed tasks tend to be more expensive for the target.
5.5.5. Optimization Quality
Weighted coverage objective, seeded-heuristic-to-exact ratio, solver status, and solver runtime. This metric evaluates search behavior, not regression detection directly.
5.6. Statistical Analysis
The transition is the primary unit of comparison; tasks are not treated as independent study replications. Within each budget and cohort, we first average repeated-sampling metrics for each transition and method. We then compare R3P with each baseline using paired transition-level differences.
We deliberately do not organize the primary analysis around a null-hypothesis significance test. With five paired transition units, the two-sided sign-flip reference distribution has support , so its attainable minimum is : no configuration of the data could have produced . Reporting such a test as confirmatory would therefore be uninformative in a way that is a property of the design rather than of the results. We instead report, for every pairwise contrast, (i) the paired mean and median difference with its Monte Carlo standard error, (ii) the sign pattern across all five transitions, (iii) the full leave-one-pair-out recomputation, and (iv) the same contrast at every budget and in every declared cohort. Sign-flip tests with the Holm correction [31] are retained in Appendix F for completeness and are labeled as low-powered descriptive checks, not as evidence of equivalence.
Directional consistency across budgets and cohorts is reported as correlated corroboration. The five both-checked pairs are a subset of the eight declared within-family pairs, the budget curves reuse the same outcome matrix, and the cohorts share tasks and underlying models; these slices are therefore not independent replications, and we do not combine them into a joint tail probability.
Confidence-interval calibration for Equation (14) is assessed empirically across repeated audit samples conditional on each frozen core. For design-valid estimators, we report the empirical coverage and width of the exact finite-population hypergeometric interval defined after Equation (15). This choice avoids relying on a normal approximation in small samples [32].
The single locked primary endpoint is the transition-level mean absolute error of the estimate of the (unweighted) regression rate at the 10% task budget in the five both-checked pairs. Regression recall and false-clear probability are key secondary discovery endpoints. Other budget curves, the broader within-family cohort, regime shifts, multilingual contrasts, and ablations are exploratory. This hierarchy was fixed after inspecting the source matrices and event counts but before the comparative run; it is not described as a prospective confirmatory registration. Missing cost observations are reported, not imputed.
Changes Made in Revision
The following were added or corrected after the original results were known. (i) The seed preference of the declared design is now implemented by the explicit rule of Section 4.3; every R3P result under the declared rule comes from one run of that implementation, and the original values are reconciled in Appendix D. (ii) The fragility-stratified baseline above was added as the design-valid stratified comparator. (iii) A seed-rule sensitivity analysis replaces the original seed enumeration, and a random-core control was added to the allocation sweep (Section 6.4 and Section 6.5). (iv) The exhaustive same-organization cohort and (v) cost-matched comparisons were added. (vi) The original label-noise sweep was withdrawn and replaced by an analysis of the recurrence of archived regressions in near-replicate configurations (Section 6.6). (vii) Per-run panel membership and inclusion probabilities are now written to the result files. The locked primary endpoint, budgets, random-number seeds, transition registry, the original baselines, and all parameters other than the seed rule are unchanged.
5.7. Ablation and Sensitivity Analyses
The supplementary ablation analysis changes one design choice at a time at the 10% budget in the five both-checked pairs:
- Remove the pre-target behavioral view.
- Replace fragility weights with uniform weights.
- Remove repository and fragility-stratum lower bounds.
- Remove the extra multi-cover requirement for the upper fragility quartile.
- Change the deterministic-core/probability-audit allocation from 65/35 to 50/50.
The broader within-family cohort, agent-protocol-major regime shifts, and multilingual contrasts are additional exploratory sensitivities. Every ablation preserves the target-outcome freeze during panel construction; the ablation set is exploratory and was not preregistered.
5.8. Reproducibility and Leakage Controls
The computational package (Supplementary S1) records immutable upstream revisions and checksums and contains the fetch/build scripts, study configuration, analysis code, generated result tables, figures, random-seed rules, and environment specification. Raw downloaded payloads and processed source matrices are excluded from redistribution and reconstructed from the pinned sources. Unit tests verify expected task/configuration shapes, anomaly exclusion, target-outcome isolation, deterministic selection, determinism and minimality of the seed rule, and the unbiased audit estimator on synthetic finite populations. The suite has 14 passing tests, and the quality report records 352,448 panel-result rows and 22 transition-level leakage probes, all of which passed. A clean reproduction command rebuilds every reported table and figure from the pinned snapshots.
As an end-to-end leakage probe, every held-out target label was complemented before rebuilding the 10% core and audit panel with the same permitted inputs and seed. Neither the core nor panel hash changed in any of the 22 transitions. No target-outcome column is used as a selection feature; each feature is traceable to task metadata, a configuration strictly preceding the target timestamp, or the designated previous configuration in a same-date contrast.
6. Results
6.1. Data and Transition Audit
Before any comparison, the source records were audited for completeness and internal consistency. The Verified audit began with 48 bash-only leaderboard rows. Seven rows lacked a complete 500-task record and one Claude 3.7 row declared 264 resolved tasks although its per-task records contained 51; all eight were excluded. The retained matrix therefore contains 40 complete configurations, 500 tasks, and 20,000 binary outcomes. The Multilingual audit began with 14 rows and retained 12 after excluding one 297-of-300 mismatched task set and one same-folder alias, yielding 3600 outcomes. The outcome-matrix SHA-256 digests are reported in the computational package.
Table 1 gives the five both-checked pairs used for the primary analysis. All five contained observed regressions. Eligible populations ranged from 219 to 338 previously solved tasks; regression rates ranged from 0.0448 to 0.1882. A 10% panel therefore executed 22–34 tasks, or 4.4–6.8% of the full 500-task benchmark. Integer rounding produced 144 task executions across the five transitions: a mean 10.139% of each eligible population and 5.76% of the full benchmark. The equally weighted mean of the five finite-population regression rates was 0.09395.
Table 1.
Audited primary transitions. The eligible population contains tasks solved by the previous configuration.
6.2. RQ1: Screening Under a Frozen Panel
At the locked 10% budget, R3P detected more of the archived regressions than the probability-sampling baselines. Its design-expected regression recall was 0.146 against 0.101 for uniform random sampling and 0.099 for fragility-stratified sampling, and its deterministic core contained at least one regression in every primary transition, so its exact false-clear probability was 0.000 against 0.107 and 0.103. Per-transition recall ranged from 0.115 to 0.195. Table 2 reports every endpoint, and Figure 1 and Figure 2 display them.
Table 2.
Primary 10% matched-budget audit over the five both-checked transitions. Recall and false-clear entries are exact design expectations for randomized methods and fixed-panel observations for deterministic methods. Interval entries are the empirical coverage and mean width of the exact stratified hypergeometric interval of Section 4 for the three design-valid estimators. A dagger marks methods without a design-valid population estimator, whose rate error is therefore descriptive; their recall and false-clear entries are defined as for the other methods. Boldface marks the best value among design-valid estimators and the highest coverage score; ties are left unmarked. R3P: Risk-weighted Representative Regression Panels; MAE: mean absolute error.
Figure 1.
Estimation and discovery at the primary 10% eligible-task budget. Filled circles identify the three design-valid point estimators; open squares are descriptive panel means, which carry no known inclusion probabilities and therefore support no population estimate. The lower panel expands the dense region of the upper panel along the error axis. R3P: Risk-weighted Representative Regression Panels; MAE: mean absolute error.
Figure 2.
Exact false-clear probability at the same budget. Values are design probabilities for randomized methods and observations over the five archived transitions for deterministic panels. R3P: Risk-weighted Representative Regression Panels.
The advantage did not come from coverage. First, coverage and discovery were not aligned across methods: facility location had the second-highest coverage score (0.8001) and recall 0.130, while the top-fragility panel had the lowest coverage (0.5408) and the highest recall (0.488). Second, within R3P, the detections sit in the seed. In each primary transition, the fragility-ordered seed has 6 tasks, and across the five cores, it contained 12 of the 13 regressions the cores caught; the coverage-greedy completion added 63 tasks in total and 1 regression, fewer than the 5.7 expected from the same number of randomly chosen tasks. Third, fragility information was necessary: replacing it with uniform weights reduced recall to 0.050 with false-clear probability 0.367, and removing the group quotas, and with them the seed, reduced recall to 0.105 (Section 6.8). The archived regressions are concentrated where fragility points: in the five primary transitions, 59–90% of them (mean 71%) lay in the top quartile of target-blind historical fragility. Fragility weighting alone was not sufficient either: Section 6.4 shows that seeds chosen without regard to fragility, completed under the same fragility-weighted objective, detect at about the rate of random sampling (median recall 0.095). High coverage was therefore compatible with good detection in the declared configuration, but the detection was carried by the fragility-ordered seed rather than by coverage.
The top-fragility panel illustrates why the endpoints cannot be collapsed into one score: it found almost half of all regressions at a 10% budget, but its panel mean was a poor population-rate estimate (MAE 0.3062) and it had the lowest normalized coverage score in Table 2. The corresponding sign-flip tests are reported in Appendix F; as noted in Section 5.6, with five units, they cannot reach conventional significance by construction and are not used to support any claim here.
6.3. RQ2: Population Inference
At the locked primary endpoint, R3P had mean absolute regression-rate error 0.0639; uniform random sampling had 0.0403 and fragility-stratified sampling 0.0384. The mean paired difference against random sampling was and against fragility-stratified sampling , in favor of the probability designs.
The difference is precisely estimated as a computational quantity: the conditional Monte Carlo standard error over 1000 draws is 0.00065 for R3P and 0.00044 for random sampling, giving 0.00079 for the paired difference, so the observed gap is roughly 30 Monte Carlo standard errors wide. The residual uncertainty is therefore attributable to having five transition units, not to Monte Carlo error in computing each transition’s design expectation. It is also directionally uniform: all five pairs favor random sampling, with paired differences of (Claude Sonnet), (Gemini), (Claude Opus), (GLM), (Kimi). Removing each pair in turn leaves the mean paired difference between and (Table 3).
Table 3.
Leave-one-pair-out recomputation of the primary 10% estimation endpoint. Each row removes one transition and recomputes the equally weighted mean over the remaining pairs. R3P: Risk-weighted Representative Regression Panels; MAE: mean absolute error.
All three design-valid intervals attained at least nominal coverage (R3P 99.9%, uniform random 98.0%, fragility-stratified 99.9%), but their widths differ for two reasons that should be kept apart. The R3P interval (mean width 0.714) is wide because only about a third of the budget is sampled. The fragility-stratified interval (width 0.455) is wider than the random-sampling interval (0.220) although its point estimate is more accurate, because the exact interval allocates the error rate across strata by the Bonferroni split and adds the per-stratum bounds linearly; the width difference is a property of that conservative construction, not of the stratified design. With the plug-in normal interval of Equation (15) applied identically to the three designs, the mean widths were 0.245 (fragility-stratified), 0.190 (uniform random), and 0.390 (R3P), with coverage of at least 98.2%. The stratified interval remains wider mainly because the conservative bounded-variance substitution is triggered in low-fragility strata whose audit draw contains no regression. Point-estimation error, which does not depend on the interval method, is therefore the primary comparison.
A random-core control identifies why the deterministic core costs accuracy. Replacing R3P’s optimized core by a core of the same size drawn uniformly at random, with the same stratified audit on the remaining tasks, gives nearly the same error at every allocation (Section 6.5; at the default 65% core, 0.0664 against 0.0639). The deficit is therefore the familiar arithmetic of a certainty stratum: tasks observed with certainty reduce the sampled fraction of the remaining population, and the Horvitz–Thompson expansion of a smaller sample has larger variance whatever the core contains. What the representativeness objective does not do is recover that loss: optimizing the core for coverage made it at most slightly more informative about the population regression rate than a random core of the same size (differences of at most 0.0026). A certainty core would reduce error only if it absorbed a large share of the population variance, for example, by containing most regressions; in these transitions, it did not.
6.4. Reconciliation and Sensitivity to the Seed Rule
The original submission reported three R3P values for the same primary endpoint: 0.0667 in its Table 2, 0.0644 in its allocation and constant tables, and 0.0640 from a co-author’s re-execution on another solver build. All three came from the same declared design; they differed because admissible seeds are not unique and the original implementations resolved the choice differently. Appendix D traces each value to its source. Every R3P entry under the declared rule in this version comes from one run of the explicit rule of Section 4.3. Selecting the archived rule in the same code, with the solver build recorded in the lock file, reproduces every value in the original archived result files (including the Table 2 value 0.0667) exactly, apart from Holm-adjusted p-values, which change because nine rather than eight comparisons are now adjusted; this confirms that the correction changes the seed and nothing else. In all five primary transitions, the declared rule’s seed attains the largest total fragility among admissible seeds; that maximum is not attained by a unique seed, which is why a verbal preference for fragile tasks does not fix the seed without the explicit rule.
Because the seed rule is a design parameter rather than an implementation detail, we report how the endpoints move when it changes. Table 4 compares the declared fragility-first rule with the archived solver-dependent rule, a neutral rule that orders tasks by a hash of their identifiers, and an ensemble obtained by applying the same lexicographic procedure to 500 uniformly random visiting orders. Every rule returns an admissible seed of the same minimum cardinality; the seeds then differ in which tasks they contain, and the greedy completion differs accordingly. The ensemble is a sensitivity analysis, not a new estimand. It is blind to fragility in the seed step and is uniform over visiting orders rather than over admissible seeds; all 500 cores were distinct.
Table 4.
Sensitivity of R3P to the seed rule at the 10% budget. Recall is the exact design expectation. Ensemble columns give the 5th–95th percentile of recall and the minimum–maximum of the core coverage objective and of rate MAE across 500 uniformly random visiting orders, each of which yields an admissible seed. R3P: Risk-weighted Representative Regression Panels; MAE: mean absolute error.
Two results follow. Estimation is insensitive to the seed: across the ensemble, the five-pair mean error ranged from 0.0631 to 0.0690, and every one of the 500 visiting orders was less accurate than random sampling. Detection is not: averaged over the five pairs, ensemble recall had median 0.095, 5th–95th percentile 0.071–0.124, and range 0.051–0.156; false-clear probability had 5th–95th percentile 0.000–0.225. The ensemble therefore straddles random sampling (0.101 and 0.107), with 35% of orders above it on recall. Within a transition, the cores’ coverage objectives differed by at most 11.7% of the largest, and the rank correlation between core objective and recall ranged from −0.11 to 0.11. The declared fragility-first rule lies above the ensemble’s 95th percentile (recall 0.146), which is consistent with Section 6.2: the rule itself directs the seed toward fragile tasks, where regressions concentrate. The supported conclusion is limited: in these transitions, a high coverage objective neither guaranteed nor determined regression detection, while the deterministic core that attained that objective consistently cost estimation accuracy under the Horvitz–Thompson estimator used here.
6.5. Allocation and Constant Sensitivity
6.5.1. Core–Audit Allocation
Table 5 sweeps the core share from 0% to 75% at the 10% budget. Estimation error rises with the certainty share in this design: 0.0384 with no core, 0.0445 at 25%, 0.0511 at 50%, 0.0639 at the study’s 65%, and 0.0760 at 75%. The random-core column shows the same pattern (largest difference 0.0026), so the sweep documents the cost of certainty units under this estimator rather than a property of deterministic cores in general; a core that captured most regressions, or a model-assisted estimator, could behave differently. Detection moves differently: recall peaks at 0.176 with a 25% core and declines as the core grows, and every allocation with a core had zero false-clear probability in these transitions. If a hybrid is used at all, these data favor an audit-dominant allocation over the core-dominant default.
Table 5.
Core–audit allocation at the 10% budget, averaged over the five both-checked transitions. The random-core control replaces the optimized core by a uniformly random core of the same size, redrawn in every repetition, with the same stratified audit. R3P: Risk-weighted Representative Regression Panels; MAE: mean absolute error.
6.5.2. Weighting Constants
Table 6 varies the three view weights and the two fragility components. Across five view-weight settings, the rate error spans 0.0629–0.0654; across four fragility mixtures, including the two degenerate cases that use failure frequency alone or outcome disagreement alone, it spans 0.0639–0.0656. Every value remains well above the 0.0403 of uniform random sampling. Recall is more sensitive (0.092–0.167), again tracking the fragility specification more than the coverage views.
Table 6.
Sensitivity to the weighting constants at the 10% budget with the default 65/35 allocation, under the declared seed rule. R3P: Risk-weighted Representative Regression Panels; MAE: mean absolute error.
6.6. Single-Rollout Records and the Recurrence of Regressions
Every configuration in the retained records reports a single attempt per task, so an archived reversal may reflect run-to-run variation rather than a persistent loss. We did not re-execute the configurations. Dated and preview model snapshots are routinely superseded or withdrawn, hosted models can change behind a stable identifier, and the agent releases used for the archive have since changed, so a re-execution today would not be guaranteed to reproduce the configurations under study. For the open-weight models (the GLM and Kimi pairs), a repeated-rollout study is feasible in principle, on a serving stack and agent release that would differ from the archive’s; we leave it to future work. Three analyses nonetheless bear on the question without new executions.
First, consider what single rollouts do to the estimation comparison. Because every selector is frozen before target outcomes are read, each design-valid estimator is unbiased for the rate of the recorded verdicts, and the difference between that realized rate and a persistent rate is common to all designs. The ranking of designs therefore transfers to a persistent-rate estimand provided it is stable across plausible realizations of the verdicts; the recurrent-label analysis below is one such check.
Second, for three primary transitions, the leaderboard contains a near-replicate of the target: the same model family evaluated again under the later agent release with a high reasoning setting (for Gemini, the general-availability successor of the preview model; the successor resolved fewer tasks overall, 69.6% against 74.2% for the preview). These near-replicates are not checked=true records and are used only to label outcomes after panels are frozen. If archived regressions were isolated random flips, they would recur in the near-replicate at about the rate at which retained tasks (solved by both configurations of the pair) fail there. They recur far more often (Table 7): 0.35–0.83 of archived regressions failed again (26 of 57 pooled), against 0.022–0.059 of retained tasks, a risk ratio of 9.0–15.9 (one-sided Fisher ). Because regressions concentrate on historically fragile tasks, which fail more often in any run, we repeated the comparison within target-blind fragility quartiles; the Mantel–Haenszel risk ratio remained 3.1–12.3. A substantial share of archived regressions therefore reflects task-specific failures that recur for the target model beyond what historical fragility explains. Because the near-replicates differ in agent release and reasoning setting, the recurrence rates are not estimates of persistence, and the analysis does not classify individual reversals. A second public submission folder for one configuration (Gemini 3 Pro, agent 2.0.0, dated 17 February 2026) proved to be a duplicate upload, with identical verdicts on all 495 tasks it shares with the archived run, and was not used; the check is included in Supplementary S1.
Table 7.
Recurrence of archived regressions in a near-replicate of the target configuration, and the 10% comparison on recurrent regressions only. Risk ratios (RRs) compare the failure rate in the near-replicate of regressed and retained eligible tasks; the Mantel–Haenszel (MH) ratio stratifies by target-blind fragility quartile. R3P: Risk-weighted Representative Regression Panels; MAE: mean absolute error.
Third, we restricted the regression label to reversals that recurred in the near-replicate and repeated the comparison with the same frozen panels (Table 7). R3P remained less accurate than random sampling in 2 of the 3 transitions and tied in the third. On detection, R3P’s advantage held in 2 of the 3 transitions and reversed for Claude Sonnet, where its core contained none of the 9 recurrent regressions (recall 0.040 against 0.102; false-clear probability 0.68 against 0.38). Label perturbation is not a substitute for repeated execution, so no label-noise sweep is reported. Conclusions about detection remain conditional on the recorded verdicts.
6.7. RQ3: Representativeness Versus Utility
The two objectives can now be placed side by side. R3P had the largest observed mean normalized coverage score at 10% (0.8400); facility location was next at 0.8001. The higher objective did not yield lower rate error, and Section 6.2 and Section 6.4 show that it did not determine discovery. The optimized surrogate behaved as designed, but it was weakly aligned with the future event of interest.
The bounded optimization calibration used a deterministic SHA-256-selected set of 80 eligible tasks per primary transition, an eight-task total budget, and a five-task multi-cover core. Target outcomes were never read. The mixed-integer solver proved optimality in all five cases. The heuristic-to-optimum objective ratio ranged from 0.736 to 0.911 (median 0.786), as shown in Table 8. The calibration does not establish full-scale optimality or rule out search quality as a contributor. The conclusion that a high coverage-objective value was not sufficient for regression screening rests on the main-panel comparisons, not on this calibration. Full-MILP runtimes were 3.14–6.18 s, compared with 0.0065 s on average for the MILP-seeded heuristic in these 80-task calibrations.
Table 8.
Eighty-task optimization calibration. All mixed-integer solutions were proven optimal with zero reported gap. MILP: mixed-integer linear program.
6.8. RQ4: Robustness
Figure 3 shows the budget curves. At 5%, 20%, and 30%, R3P rate MAE was 0.0982, 0.0417, and 0.0261, versus 0.0586, 0.0267, and 0.0205 for random sampling and 0.0554, 0.0258, and 0.0200 for fragility-stratified sampling. Its expected recall was 0.1260, 0.2448, and 0.4719, versus 0.0514, 0.2014, and 0.3021. The fixed core exposed at least one regression in every primary transition at every budget, giving an exact false-clear probability of zero under the conditional audit design; random probabilities were 0.2925, 0.0162, and 0.0026.
Figure 3.
Budget trade-offs on the five both-checked transitions. Values are means of transition-level metrics. For randomized methods, the recall and false-clear curves use exact design expectations; fixed-panel curves are observations over the five archived transitions. Panels were selected independently at each budget rather than nested, so the curves are not cumulative. R3P: Risk-weighted Representative Regression Panels; MAE: mean absolute error.
6.8.1. Cost-Matched Comparison
R3P panels drew slightly more expensive tasks: at 10%, they would have incurred 0.108 of the target configuration’s archived cost, against 0.102 for random sampling (0.115 and 0.102 of the previous configuration’s cost). We compared R3P with random sampling at equal cost by interpolating along random sampling’s budget curve, using only transition–budget cells whose cost lies inside that curve’s observed range; for target cost, this excludes the 30% budget in four transitions and the 5% budget in two, where R3P’s cost falls outside random sampling’s range. At matched target cost, R3P was less accurate in 14 of 14 cells (at 10%: 0.0639 against 0.0396), and the result was the same when cost was measured by the previous configuration’s archived cost (13 of 13) or by the target’s API calls (15 of 15). Its recall was higher than random sampling’s in 13 of 14 target-cost cells (at 10%: 0.146 against 0.108), in 10 of 13 previous-cost cells, and in 15 of 15 call-count cells. The estimation ordering is therefore not an artifact of measuring the budget in tasks rather than in cost.
The supplementary ablations in Table 9 change one design choice at a time. The 50/50 allocation reduced error to 0.0527 and raised recall to 0.161. Uniform fragility reduced recall to 0.050 and raised false-clear probability to 0.367; removing group quotas reduced recall to 0.105 with false-clear 0.131. These same-data comparisons are exploratory and do not replace the locked primary design.
Table 9.
Supplementary ablations at a 10% budget. The default row is an independently seeded 1000-draw replication of the main hybrid design on the same core, so its rate error differs from the R3P row of Table 2 by about one Monte Carlo standard error while its exact-design detection entries are identical. For the same reason, the 50/50 row differs from the 50% row of Table 5 by Monte Carlo error. R3P: Risk-weighted Representative Regression Panels; MAE: mean absolute error. CI: confidence interval.
The broader eight-pair within-family sensitivity preserved the primary pattern: at 10%, R3P MAE was 0.0606 versus 0.0380 for random sampling, while expected recall was 0.1375 versus 0.1013. In nine agent-protocol-major regime shifts, R3P again had higher error (0.0590 versus 0.0368) and higher recall (0.1670 versus 0.1012). For Multilingual, only random, the two stratified designs, k-center, facility location, and the static R3P variant were available. With no admissible multi-configuration history, that variant omitted the behavioral view, used uniform task-fragility weights, and stratified its audit with the target-free static score in Equation (16). It is a transportability stress test of the architecture, not a replication of the primary specification. Without fragility information, the static variant was again less accurate and also lost the detection advantage: MAE 0.0922 versus 0.0532, recall 0.1007 versus 0.1024, and false-clear probability 0.2034 versus 0.1480.
6.8.2. Exhaustive Same-Organization Cohort
Across all 18 rule-defined pairs (Appendix E), R3P was less accurate than uniform random sampling in 18 of 18 pairs and less accurate than fragility-stratified sampling in 18 of 18 (mean MAE 0.0777 against 0.0479 and 0.0453). The sign is the same for every organization’s mean difference, and removing any one organization leaves the mean difference between and . Because one organization contributes eight pairs and four contribute one each, the organization-resampling interval, , rests on only six clusters and should be read descriptively. Excluding the five pairs with regression rates above 0.4, which involve tier or model-line changes, R3P remained less accurate in 13 of 13 pairs (0.0650 against 0.0393). Its recall exceeded random sampling in 16 pairs (mean difference ). The cohort shares tasks and several models with the primary pairs and is correlated corroboration rather than independent replication, but it removes the curation of the declared registry as an explanation for either result.
7. Discussion
7.1. Three Objectives, Not One Notion of Representativeness
Coverage asks whether selected tasks resemble the historical population; detection asks whether the panel contains sparse losses of an unseen target; estimation asks whether it supports an unbiased and precise statement about the full eligible population. In this audit, the three came apart. R3P attained the highest coverage score, detected more regressions than random sampling through its fragility-ordered seed rather than its coverage, and estimated the regression rate less accurately than both probability designs.
The small-instance optimization calibration makes imperfect search an unlikely complete explanation for the gap between coverage and detection, but does not rule it out at full scale. More directly, semantic similarity, metadata similarity, and historical outcome agreement were weak surrogates for where a future version would regress, whereas historical fragility was a useful one. The top-fragility baseline makes the complementary point: it was effective at finding regressions in these archived transitions but substantially biased the estimate of the population rate. A deterministic panel can therefore be useful for diagnosis without being a survey sample.
7.2. The Arithmetic of a Hybrid Budget
At a 10% total budget, a 65/35 split leaves only about 3.5% of eligible tasks for probability sampling after the deterministic core is removed. The random-core control of Section 6.3 shows that this allocation, not the content of the optimized core, accounts for the estimation deficit, and the allocation sweep shows rate MAE rising with the certainty share under the Horvitz–Thompson estimator used here. The result is specific to that estimator and to cores that do not absorb most of the population variance; it is not a general statement that deterministic cores are harmful. Detection behaves differently and non-monotonically, peaking at a 25% core, so a hybrid that is wanted for both roles should sit near an audit-dominant allocation rather than the core-dominant default we tested. A future hybrid should treat the audit fraction as a decision variable constrained by a required precision, rather than fixing the core share first.
7.3. Implications for AI-Agent Release Evaluation
The defensible recommendation depends on the decision, and it can be stated operationally. (1) To estimate a benchmark-wide regression rate, use a probability design; in these data, fragility-stratified sampling was the most accurate, and uniform random sampling was close behind. (2) To expose losses quickly, target the top quartile of historical fragility, which held 59–90% of the archived regressions, and report the design’s historical false-clear behavior, but do not use that panel to estimate prevalence. (3) If both roles are needed, keep the deterministic share small; here, a 25% core gave the highest recall of the allocations tested at a modest cost in accuracy. (4) Budget in the currency that is actually spent, since tasks differ by more than an order of magnitude in cost; the previous configuration’s cost is available before the target is run. (5) Treat a reversal found by a reduced panel as a candidate to be re-run before it blocks a release, since single-rollout verdicts do not separate persistent loss from run-to-run variation. (6) Refresh the panel and its fragility scores with periodic full runs. A hybrid is warranted only when both roles are needed and enough budget remains for the probability component.
A reduced panel can run for frequent candidate screening, as continuous-integration practice does for conventional test suites [33], while periodic full benchmark audits refresh the history and reveal panel staleness. Organizations may add severity weights only when they possess a defensible, task-specific impact model; historical fragility is not a substitute.
The method is most defensible when the previous and target configurations differ in one documented component. When model, reasoning policy, prompt, environment, and agent scaffold change together, a detected regression is real at the system configuration level but cannot be attributed to the model alone. Our separate agent-protocol-major regime-shift cohort reports this boundary separately rather than pooling it with within-family transitions; the declared within-family cohort also supports association, not causal attribution.
7.4. Relationship to Full-Benchmark Evaluation
A regression panel is not a permanent benchmark replacement. Selection from historical outcomes can overfit yesterday’s failure modes, and sparse future regressions can lie outside any deterministic core. The audit sample mitigates zero-probability blind spots, but only the full suite observes every archived task. We therefore recommend periodic full runs, panel refresh, and reporting the complete selection design whenever reduced results inform a release.
7.5. Why the Negative Finding Matters
Efficient-evaluation work is vulnerable to surrogate validation: a subset can preserve a historical score, ranking, or coverage objective yet fail on the future event the subset is deployed to catch. Our target freeze turns that concern into a falsifiable test. Reporting the failed alignment is more useful than retuning the panel after observing the target, because it supplies a baseline and a protocol against which future learned, severity-aware, or multi-rollout selectors can be evaluated.
This concern is not specific to our setting. Efficient-evaluation methods are typically validated against the quantity they were built to preserve. The same gap between a validated proxy and the property of interest has been reported outside efficient evaluation: in an evaluation of a fine-tuned language model for unit-test generation, the reference-similarity score was low for reasons unrelated to test quality—multiple admissible tests and reference misalignment—while human inspection of the same outputs found near-duplicate tests and a substantial share that relied on hard-coded values and so exercised few edge cases. Neither fact is visible in the similarity metric, and the authors call for validation metrics designed specifically for machine-generated tests [34]. A related pattern appears in multilingual unlearning, where general multilingual utility can conceal damage to neighboring knowledge [35]; there, too, an aggregate measure hides localized loss. Item-response approaches that estimate full-benchmark scores from compact anchor sets are assessed on score recovery [9]; rank-prediction methods are assessed on rank fidelity [10]; adaptive procedures that select items by estimated information are assessed on the precision of an ability estimate [15]. Each is coherent on its own terms. What our result adds is that success on any of these surrogates does not by itself license a claim about a directional, sparse, version-specific event. Where the decision being supported is a release gate, the relevant validity target is detection of the losses that gate exists to prevent, and Section 6.4 shows that, for the coverage objective studied here, that target was not determined by the objective’s value.
8. Threats to Validity
We organize the discussion using the construct, internal, conclusion, and external categories established for controlled experimentation in software engineering [36], together with the reliability category that case-study guidance adds for studies whose data collection cannot be repeated identically [37], and we treat temporal validity under the same heading. The last category is pertinent here because the archived execution records we analyze cannot be regenerated identically.
8.1. Construct Validity
Binary task resolution captures functional correctness under the benchmark harness, not patch maintainability, security, latency, trajectory quality, or user value. A pass can also conceal unstable or inefficient behavior. No LLM judge is used, which removes one subjective layer but does not make the harness perfect. Historical fragility combines failure frequency and order-invariant cross-configuration outcome disagreement; it must not be interpreted as severity.
The harness itself is under active scrutiny, and this bears directly on how our outcome variable should be read. Manual screening of SWE-bench has attributed a substantial share of apparent successes to solution text present in the issue description, and a further share to test suites too weak to separate a correct patch from an incorrect one [38]. The same concern was raised earlier for function-level benchmarks, where augmenting HumanEval with automatically generated tests overturned a substantial share of previously accepted solutions [39]. An audit of frontier-model failures on the Verified split attributed most examined cases to defects in the tests or in the problem specification rather than to model limitations, cited pretraining contamination as a second and independent reason, and recommended discontinuing the split as a capability measure [40]. Contamination-resistant successors collect fresh tasks continuously to avoid the pretraining overlap that static splits accumulate [41].
Two features of the present design limit, without eliminating, the consequence of these problems. First, the estimand is defined over archived execution outcomes rather than over latent capability: a regression is a reversal of a recorded harness verdict, which is exactly the quantity a release screen acts on, and it remains well defined even where that verdict is an imperfect proxy for correctness. Second, both configurations in a pair are evaluated under the same harness, so a defective test that misclassifies a task tends to misclassify it identically for the previous and the target configuration and therefore usually does not register as a regression. The residual exposure is to tests whose verdict differs between configurations for reasons unrelated to the code change. We caution against reading our regression counts as measurements of capability loss.
8.2. Internal Validity
Public leaderboard configurations can differ in model, scaffold, prompts, reasoning effort, and execution settings. Agent-protocol-major regime shifts are reported separately, but the declared within-family cohort can still contain minor protocol or setting differences; unrecorded differences can also remain. Leaderboard timestamps are used for freezing and may not equal provider release dates. Data audits detect incomplete, inconsistent, and duplicate records but cannot detect every provenance error. The revision changed the implementation of the seed rule after the original results were known; the change implements the declared design, it is reported with the original values in Appendix D, and Section 6.4 shows the estimation conclusion under every admissible alternative.
8.3. Statistical Conclusion Validity
The number of configuration transitions is modest and regression events are sparse in the archived transitions. Treating tasks as independent replicates would overstate precision, so inference is performed at transition level. Random-method repetitions quantify sampling variation conditional on archived outcomes; they do not create new independent agent runs. The exhaustive same-organization cohort adds pairs, but they share tasks and models with the primary pairs and are not independent replications. The sign-flip tests are Holm-adjusted and reported only descriptively (Appendix F); no claim rests on them, and the artifact supplies effect sizes and transition-level metrics.
8.4. External Validity
The primary data comprise Python-language repository tasks under a minimal bash-only agent. The supplied reproduction package specifies Python 3.11 for the analysis scripts. Results may not transfer to interactive integrated development environment (IDE) agents, other tool policies, private enterprise repositories, other programming languages, or benchmarks with hidden evaluation. The multilingual analysis broadens task provenance but is not a temporal replication. The findings concern one coverage objective, three similarity views, and one estimator; they do not establish that representative subset selection in general is ineffective for regression detection. Additional benchmarks and prospectively captured multi-rollout releases are required.
8.5. Reliability and Temporal Validity
Every configuration–task pair contains a single recorded attempt, so the design cannot separate systematic regression from run-to-run variation at the level of an individual task; non-deterministic test outcomes are a documented hazard of exactly this form [42,43]. The estimators are unbiased for the recorded verdicts, and the recurrence analysis of Section 6.6 shows that archived regressions recur in a near-replicate far more often than retained tasks (solved by both configurations) fail (0.35–0.83 against 0.022–0.059). In the three transitions that have a near-replicate, on recurrent regressions alone, R3P remained less accurate than random sampling in two and tied in the third, while its detection advantage reversed in one. Detection results therefore remain conditional on the recorded verdicts, and a prospective study with repeated rollouts per configuration would be needed to estimate persistent regression rates. Model APIs, benchmark infrastructure, and leaderboard records also evolve. Pinned snapshots, deterministic builds, and checksums support reproduction of this study, not indefinite equivalence to a future live leaderboard.
9. Ethical and Responsible-Use Considerations
The study uses public benchmark tasks and public aggregate/per-task evaluation records and does not involve human participants or collect personal data. The method may reduce repeated compute, but a smaller panel can also create false confidence. Reports must therefore disclose the panel budget, inclusion design, eligible population, false-clear behavior, and date of the last full audit. The method must not be presented as certifying security, safety, or fitness for deployment.
10. Conclusions
This paper formulates configuration-to-configuration coding-agent evaluation as a prospective finite-population regression problem and audits one representative design, R3P, which joins a search-selected, multi-view, fragility-weighted core with a stratified probability audit. In the locked five-transition, 10%-budget audit, R3P attained the highest observed normalized coverage score but estimated the regression rate less accurately than uniform random and fragility-stratified sampling, a deficit that held in every pair of an exhaustive same-organization cohort and that, under the certainty-core Horvitz–Thompson estimator, a random core of equal size reproduced. R3P detected more regressions than random sampling, but the gain required fragility information and was carried by its fragility-ordered seed rather than its coverage, and admissible seeds with similar coverage objectives ranged from below to above random sampling on detection. The general lesson is practical: historical representativeness, future regression detection, and population inference are distinct objectives. Budgeted evaluations should declare which one they serve, preserve the target-outcome freeze, and retain periodic full-suite audits.
Supplementary Materials
The following supporting information can be downloaded at: https://www.mdpi.com/article/10.3390/electronics15204597/s1, Supplementary S1: Reproduction Package (Version 2), comprising the MIT-licensed analysis code, the drivers for every table and figure, and the generator of the result values quoted in the text, the unit tests including both target-freeze tests, the study configuration, the retrieval script together with the pinned upstream revisions and their SHA-256 digests, all summary result tables, per-run panel membership with task-level inclusion probabilities, and a SHA-256 manifest over every delivered file. The per-run endpoint table (352,448 rows) is omitted for size and is regenerated exactly by the package’s experiment target. The upstream task and leaderboard records are not themselves redistributed, because the pinned leaderboard repository is licensed CC BY-NC 4.0; the retrieval script rebuilds them from the pinned revisions and verifies every download against the recorded digests before any analysis runs.
Author Contributions
Conceptualization, T.G. and Z.Z.; methodology, T.G. and Z.Z.; software, T.G.; validation, Z.Z., H.W. and Q.C.; formal analysis, Z.Z.; investigation, T.G. and Z.Z.; data curation, T.G.; writing—original draft preparation, T.G. and Z.Z.; writing—review and editing, T.G., H.W. and Q.C.; visualization, T.G.; supervision, H.W. and Q.C.; project administration, H.W. and Q.C., T.G. and Z.Z. contributed equally to this work. All authors have read and agreed to the published version of the manuscript.
Funding
This research received no external funding.
Institutional Review Board Statement
Not applicable. The study analyzes public software-benchmark records and does not involve humans or animals.
Informed Consent Statement
Not applicable.
Data Availability Statement
No new experimental data were generated; every outcome analyzed here derives from public archived execution records. The task set is the official SWE-bench Verified split [28], available at https://www.swebench.com/verified.html (accessed on 8 August 2026). The per-task outcomes, API-call counts, and reported costs are taken from the official SWE-bench website data repository [29], available at https://github.com/SWE-bench/swe-bench.github.io (accessed on 8 August 2026) and pinned at commit 15491f17ea8274f55686338291d7da27df4d1bd7; the pinned revisions are given in Section 5 and in Supplementary S1. All summary result tables, the transition registry, per-run panel membership, and task-level inclusion probabilities are included in the Supplementary Materials, together with the scripts that regenerate every table and figure in this article and the per-run endpoint table. The upstream records themselves are not redistributed there, because the pinned leaderboard repository is licensed CC BY-NC 4.0; the package supplies the retrieval script, the pinned revisions, and the SHA-256 digests required to rebuild and verify them.
Acknowledgments
During the preparation of this manuscript, the authors used OpenAI Codex (GPT-5.6 Sol) to polish the readability of the text and to assist with reviewing and maintaining the analysis code. The tool contributed nothing to the conception of the study, its research design, its analysis, or the interpretation of the results, and produced none of the reported numbers. The authors have reviewed and edited the output and take full responsibility for the content of this publication.
Conflicts of Interest
The authors declare no conflicts of interest.
Abbreviations
The following abbreviations are used in this manuscript:
| AI | Artificial intelligence |
| API | Application programming interface |
| CI | Confidence interval |
| IDE | Integrated development environment |
| MH | Mantel–Haenszel |
| RR | Risk ratio |
| R3P | Risk-weighted Representative Regression Panels |
| MAE | Mean absolute error |
| MCSE | Monte Carlo standard error |
| MILP | Mixed-integer linear program |
| HT | Horvitz–Thompson |
| LLM | Large language model |
| TF–IDF | Term frequency–inverse document frequency |
Appendix A. Transition Registry
Table A1 and Table A2 mirror the human-readable labels in the study configuration. The completed build resolved each label to exactly one audited configuration identifier.
Table A1.
Declared within-family configuration-transition specifications. The five both-checked primary pairs are Claude Sonnet, Claude Opus 4–4.5, Gemini, GLM, and Kimi.
Table A2.
Agent-protocol-major and reasoning-regime-shift specifications.
The multilingual transportability contrasts are Claude Opus 4.5 versus 4.6, Claude Haiku versus Sonnet, Claude Sonnet versus Opus, GPT-5 mini versus GPT-5.2, and GPT-5.2 versus GPT-5-2 Codex. They are configuration contrasts, not chronological version claims. Labels follow the upstream leaderboard names, including the spelling “GPT-5-2”.
Appendix B. Locked Parameters
Table A3 lists every parameter held fixed in the main analysis.
Every parameter modification in a sensitivity analysis is recorded in the supplementary assumptions output. No value may be selected using target outcomes from the transition being evaluated.
Table A3.
Locked main-analysis parameters.
Appendix C. Reproduction Outputs
The completed run produced the following: (1) source and processed-data checksums; (2) a row-level exclusion audit; (3) the resolved transition registry; (4) seeds, task counts, panel/core SHA-256 hashes, and design-validity fields for every run; (5) long-form metric records; (6) transition-level summaries; (7) exact-versus-seeded-heuristic optimization logs; (8) the sign-flip tests of Appendix F; (9) the manuscript figures; (10) the seed-rule, allocation, constant, recurrence, cost-matched, and exhaustive-cohort tables; (11) the file of result values quoted in the text; and (12) environment and dependency records.
Appendix D. Cross-Environment Re-Execution and Reconciliation of Reported Values
Before the original submission, a co-author who had not written the analysis pipeline re-executed the released package from the pinned upstream revisions on different hardware and a different interpreter and library stack. Systematic assessment of reproducibility in repository-derived empirical studies has been advocated for over a decade [44].
The re-execution reproduced four properties exactly: all archive checksums verified; the processed matrices rebuilt byte-identically from the pinned leaderboard commit and dataset revision; the eligible populations, regression counts, and rates of Table 1 recomputed exactly; and the unit tests, including both target-freeze probes, passed once the upstream checkout was restored. It also identified four issues. Three were mechanical and are resolved in Supplementary S1 version 2, which accompanies this revision. First, the dependency specification had no upper bounds, and under a newer pandas release, the leakage probe failed because an outcome column was returned as a read-only array; version 2 declares tested upper bounds, ships an exact lock file, and copies the arrays before mutation. Second, several tests require the upstream leaderboard checkout, which is licensed CC BY-NC 4.0 and is therefore not redistributed; when it is absent, these tests are skipped with an instruction to run the retrieval script. Third, the data-build step did not create its output directory; it now does. Version 2 also writes per-run panel membership and task-level inclusion probabilities to the results directory.
The fourth issue was substantive. Admissible seeds are not unique, and the original seed program resolved the choice with a term below the solver’s optimality tolerance, so the same random-number seed did not determine the same deterministic core across solver builds. The original submission reported three values for the primary R3P endpoint, all because admissible seeds are not unique: two arose from the sub-tolerance term under different solver builds, and the value in its allocation and constant tables came from an interim implementation of the fragility-first preference whose driver was not archived; its output (recall 0.1236) differs from that of the explicit procedure (recall 0.146) because several seeds attain the maximal total fragility, so the verbal preference alone does not determine the seed; the explicit lexicographic procedure of Section 4.3 does. Table A4 traces each value to its source. In this version, every R3P result under the declared rule comes from one run of that procedure, and all drivers, including those for the allocation, constant, and seed-rule tables, are part of Supplementary S1 version 2. Selecting the archived rule in version 2, with the solver build in its lock file, reproduces every value in the original archived result files exactly, apart from Holm-adjusted p-values, which change because nine rather than eight comparisons are now adjusted; the version-2 files additionally contain the fragility-stratified baseline added in revision and the target-cost columns.
Table A4.
Provenance of the R3P values for the primary endpoint (MAE) and the secondary discovery endpoints reported in the original submission and in this version (five both-checked transitions, 10% budget). R3P: Risk-weighted Representative Regression Panels; MAE: mean absolute error.
The co-author re-execution did not complete the full 22-transition sweep on its hardware; it covered the pinned data rebuild, the test suite, and the primary five-pair endpoint at the 10% budget. For this revision, the complete pipeline, including all 22 declared transitions and contrasts (eight within-family, nine regime-shift, five multilingual) and all supplementary analyses, was re-run from an empty directory with the exact package versions recorded in the lock file.
Appendix E. Exhaustive Same-Organization Cohort
Table A5 lists every pair admitted by the rule of Section 5: both configurations checked=true, the same organization tag, and a strictly earlier previous-configuration evaluation date. Each pair uses its own frozen history (all configurations dated before the target) and the 10% task budget; MAE entries average 1000 locked draws, seeded by the pair identifier and therefore independently of Table 2 for the five primary pairs, and recall entries are exact design expectations.
Table A5.
Rule-defined same-organization transitions at the 10% budget. Rel.: S, same-tier successor; T, tier change within a model line; O, other (a different model line, or an older model evaluated later). R3P: Risk-weighted Representative Regression Panels; MAE: mean absolute error.
Appendix F. Sign-Flip Tests
Table A6 reports two-sided paired sign-flip tests with the Holm correction across the nine baseline comparisons at the 10% budget. As explained in Section 5.6, five paired units admit a minimum attainable two-sided p of ; these tests are therefore descriptive and are included for comparison with the original submission. An entry of means that all five paired differences share a sign; that no smaller p is attainable is a property of the design.
Table A6.
Paired sign-flip tests at the 10% budget over five both-checked transitions. Differences are R3P minus baseline in rate MAE; positive differences favor the baseline. The attainable minimum two-sided p is ; entries at that value are at the design floor. R3P: Risk-weighted Representative Regression Panels; MAE: mean absolute error.
References
- Jimenez, C.E.; Yang, J.; Wettig, A.; Yao, S.; Pei, K.; Press, O.; Narasimhan, K.R. SWE-bench: Can Language Models Resolve Real-World GitHub Issues? In Proceedings of the Twelfth International Conference on Learning Representations (ICLR), Vienna, Austria, 7–11 May 2024. [Google Scholar]
- Yang, J.; Jimenez, C.E.; Wettig, A.; Lieret, K.; Yao, S.; Narasimhan, K.R.; Press, O. SWE-agent: Agent–Computer Interfaces Enable Automated Software Engineering. In Proceedings of the Advances in Neural Information Processing Systems, Vancouver, BC, Canada, 10–15 December 2024; Volume 37. [Google Scholar]
- SWE-Agent Team. Mini-SWE-Agent: The Minimal AI Software Engineering Agent. GitHub Repository and Documentation. 2026. Available online: https://github.com/swe-agent/mini-swe-agent (accessed on 8 August 2026).
- Li, Y.; Choi, D.; Chung, J.; Kushman, N.; Schrittwieser, J.; Leblond, R.; Eccles, T.; Keeling, J.; Gimeno, F.; Dal Lago, A.; et al. Competition-Level Code Generation with AlphaCode. Science 2022, 378, 1092–1097. [Google Scholar] [CrossRef] [Scilit] [PubMed]
- Memon, A.; Gao, Z.; Nguyen, B.; Dhanda, S.; Nickell, E.; Siemborski, R.; Micco, J. Taming Google-Scale Continuous Testing. In Proceedings of the 39th International Conference on Software Engineering: Software Engineering in Practice Track (ICSE-SEIP), Buenos Aires, Argentina, 20–28 May 2017; pp. 233–242. [Google Scholar] [CrossRef] [Scilit]
- Machalica, M.; Samylkin, A.; Porth, M.; Chandra, S. Predictive Test Selection. In Proceedings of the 41st International Conference on Software Engineering: Software Engineering in Practice Track (ICSE-SEIP), Montreal, QC, Canada, 25–31 May 2019; pp. 91–100. [Google Scholar] [CrossRef] [Scilit]
- Rothermel, G.; Harrold, M.J. Analyzing Regression Test Selection Techniques. IEEE Trans. Softw. Eng. 1996, 22, 529–551. [Google Scholar] [CrossRef] [Scilit]
- Yoo, S.; Harman, M. Regression Testing Minimization, Selection and Prioritization: A Survey. Softw. Test. Verif. Reliab. 2012, 22, 67–120. [Google Scholar] [CrossRef] [Scilit]
- Maia Polo, F.; Weber, L.; Choshen, L.; Sun, Y.; Xu, G.; Yurochkin, M. tinyBenchmarks: Evaluating LLMs with Fewer Examples. In Proceedings of Machine Learning Research; PMLR: Cambridge, MA, USA, 2024; Volume 235, pp. 34303–34326. [Google Scholar]
- Saranathan, G.; Xu, C.; Alam, M.P.; Kumar, T.; Foltin, M.; Wong, S.Y.; Bhattacharya, S. SubLIME: Subset Selection via Rank Correlation Prediction for Data-Efficient LLM Evaluation. In Proceedings of the 63rd Annual Meeting of the Association for Computational Linguistics (Volume 1: Long Papers), Vienna, Austria, 27 July–1 August 2025; pp. 30572–30593. [Google Scholar] [CrossRef] [Scilit]
- Wang, Z.; Wu, W.; Wang, G.; Ye, G.; Cheng, Z. MetaEval: Measuring the Discrimination of Benchmarks for Efficient LLM Evaluation. Proc. AAAI Conf. Artif. Intell. 2026, 40, 33773–33781. [Google Scholar] [CrossRef] [Scilit]
- Assiri, M. Test Case Prioritization Using Dragon Boat Optimization for Software Quality Testing. Electronics 2025, 14, 1524. [Google Scholar] [CrossRef] [Scilit]
- Harrold, M.J.; Gupta, R.; Soffa, M.L. A Methodology for Controlling the Size of a Test Suite. ACM Trans. Softw. Eng. Methodol. 1993, 2, 270–285. [Google Scholar] [CrossRef] [Scilit]
- Jeffrey, D.; Gupta, N. Improving Fault Detection Capability by Selectively Retaining Test Cases During Test Suite Reduction. IEEE Trans. Softw. Eng. 2007, 33, 108–123. [Google Scholar] [CrossRef] [Scilit]
- Truong, S.T.; Tu, Y.; Liang, P.; Li, B.; Koyejo, S. Reliable and Efficient Amortized Model-Based Evaluation. In Proceedings of Machine Learning Research; PMLR: Cambridge, MA, USA, 2025; Volume 267, pp. 60238–60265. [Google Scholar]
- Hofmann, V.; Heineman, D.; Magnusson, I.; Lo, K.; Dodge, J.; Sap, M.; Koh, P.W.; Wang, C.; Hajishirzi, H.; Smith, N.A. Fluid Language Model Benchmarking. In Proceedings of the Second Conference on Language Modeling (COLM), Montreal, QC, Canada, 7–10 October 2025. [Google Scholar]
- Abbassi, A.A.; da Silva, L.M.P.; Nikanjam, A.; Khomh, F. ReCatcher: Towards LLMs Regression Testing for Code Generation. arXiv 2025. [Google Scholar] [CrossRef] [Scilit]
- Cai, J.; Li, J.; Li, N.; Mao, Z.; Zhang, M.; Tei, K. SAGE: Semantic-Aware Gray-Box Game Regression Testing with Large Language Models. Autom. Softw. Eng. 2026, 33, 102. [Google Scholar] [CrossRef] [Scilit]
- Hu, H.L.; Chen, Y.L. Mining Typical Patterns from Databases. Inf. Sci. 2008, 178, 3683–3696. [Google Scholar] [CrossRef] [Scilit]
- Chen, Y.L.; Hu, H.L. An Overlapping Cluster Algorithm to Provide Non-Exhaustive Clustering. Eur. J. Oper. Res. 2006, 173, 762–780. [Google Scholar] [CrossRef] [Scilit]
- Chvátal, V. A Greedy Heuristic for the Set-Covering Problem. Math. Oper. Res. 1979, 4, 233–235. [Google Scholar] [CrossRef] [Scilit]
- Nemhauser, G.L.; Wolsey, L.A.; Fisher, M.L. An Analysis of Approximations for Maximizing Submodular Set Functions—I. Math. Program. 1978, 14, 265–294. [Google Scholar] [CrossRef] [Scilit]
- Spärck Jones, K. A Statistical Interpretation of Term Specificity and Its Application in Retrieval. J. Doc. 1972, 28, 11–21. [Google Scholar] [CrossRef] [Scilit]
- Salton, G.; Yang, C.S. On the Specification of Term Values in Automatic Indexing. J. Doc. 1973, 29, 351–372. [Google Scholar] [CrossRef] [Scilit]
- Cochran, W.G. Sampling Techniques, 3rd ed.; John Wiley & Sons: New York, NY, USA, 1977. [Google Scholar]
- Särndal, C.E.; Swensson, B.; Wretman, J. Model Assisted Survey Sampling; Springer Series in Statistics; Springer: New York, NY, USA, 1992. [Google Scholar] [CrossRef] [Scilit]
- Horvitz, D.G.; Thompson, D.J. A Generalization of Sampling Without Replacement from a Finite Universe. J. Am. Stat. Assoc. 1952, 47, 663–685. [Google Scholar] [CrossRef]
- SWE-Bench Team. SWE-Bench Verified. Official Benchmark Website. 2026. Available online: https://www.swebench.com/verified.html (accessed on 8 August 2026).
- SWE-Bench Team. SWE-Bench Website Data Repository. GitHub Repository, Commit 15491f17ea8274f55686338291d7da27df4d1bd7. 2026. Available online: https://github.com/swe-bench/swe-bench.github.io (accessed on 8 August 2026).
- Yang, J.; Lieret, K.; Jimenez, C.E.; Wettig, A.; Khandpur, K.; Zhang, Y.; Hui, B.; Press, O.; Schmidt, L.; Yang, D. SWE-smith: Scaling Data for Software Engineering Agents. arXiv 2025. [Google Scholar] [CrossRef] [Scilit]
- Holm, S. A Simple Sequentially Rejective Multiple Test Procedure. Scand. J. Stat. 1979, 6, 65–70. [Google Scholar]
- Bowyer, S.; Aitchison, L.; Ivanova, D.R. Position: Don’t Use the CLT in LLM Evals With Fewer Than a Few Hundred Datapoints. In Proceedings of Machine Learning Research; PMLR: Cambridge, MA, USA, 2025; Volume 267, pp. 81143–81184. [Google Scholar]
- Elbaum, S.; Rothermel, G.; Penix, J. Techniques for Improving Regression Testing in Continuous Integration Development Environments. In Proceedings of the 22nd ACM SIGSOFT International Symposium on Foundations of Software Engineering (FSE), Hong Kong, China, 16–21 November 2014; pp. 235–245. [Google Scholar] [CrossRef] [Scilit]
- Rehan, S.; Al-Bander, B.; Al-Said Ahmad, A. Harnessing Large Language Models for Automated Software Testing: A Leap Towards Scalable Test Case Generation. Electronics 2025, 14, 1463. [Google Scholar] [CrossRef] [Scilit]
- Shao, P.; Jin, Y.; Lu, C.; Liu, X.; Qin, W.; Ai, X.; Kawaguchi, K.; Hong, R. Beyond Cross-Lingual Transfer: Benchmarking Propagation Boundaries in Multilingual LLM Unlearning. arXiv 2026. [Google Scholar] [CrossRef] [Scilit]
- Wohlin, C.; Runeson, P.; Höst, M.; Ohlsson, M.C.; Regnell, B.; Wesslén, A. Experimentation in Software Engineering; Springer: Berlin, Heidelberg, 2012. [Google Scholar] [CrossRef] [Scilit]
- Runeson, P.; Höst, M. Guidelines for Conducting and Reporting Case Study Research in Software Engineering. Empir. Softw. Eng. 2009, 14, 131–164. [Google Scholar] [CrossRef] [Scilit]
- Xue, H.; Aleithan, R.; Enan, N.; Uddin, G.; Wang, S. SWE-Bench+: Enhanced LLM Coding Benchmark. In Proceedings of the 3rd ACM International Conference on AI-Powered Software (AIware ’26), Montreal, QC, Canada, 6–7 July 2026; Association for Computing Machinery: New York, NY, USA, 2026; pp. 332–339. [Google Scholar] [CrossRef] [Scilit]
- Liu, J.; Xia, C.S.; Wang, Y.; Zhang, L. Is Your Code Generated by ChatGPT Really Correct? Rigorous Evaluation of Large Language Models for Code Generation. In Proceedings of the Advances in Neural Information Processing Systems, New Orleans, LA, USA, 10–16 December 2023; Volume 36, pp. 21558–21572. [Google Scholar]
- OpenAI. Why We No Longer Evaluate SWE-bench Verified. 2026. Available online: https://openai.com/index/why-we-no-longer-evaluate-swe-bench-verified/ (accessed on 5 September 2026).
- Badertdinov, I.; Golubev, A.; Nekrashevich, M.; Shevtsov, A.; Karasik, S.; Andriushchenko, A.; Trofimova, M.; Litvintseva, D.; Yangel, B. SWE-rebench: An Automated Pipeline for Task Collection and Decontaminated Evaluation of Software Engineering Agents. arXiv 2025, arXiv:2505.20411. [Google Scholar]
- Luo, Q.; Hariri, F.; Eloussi, L.; Marinov, D. An Empirical Analysis of Flaky Tests. In Proceedings of the 22nd ACM SIGSOFT International Symposium on Foundations of Software Engineering (FSE), Hong Kong, China, 16–21 November 2014; pp. 643–653. [Google Scholar] [CrossRef] [Scilit]
- Parry, O.; Kapfhammer, G.M.; Hilton, M.; McMinn, P. A Survey of Flaky Tests. ACM Trans. Softw. Eng. Methodol. 2022, 31, 1–74. [Google Scholar] [CrossRef] [Scilit]
- González-Barahona, J.M.; Robles, G. On the Reproducibility of Empirical Software Engineering Studies Based on Data Retrieved from Development Repositories. Empir. Softw. Eng. 2012, 17, 75–89. [Google Scholar] [CrossRef] [Scilit]
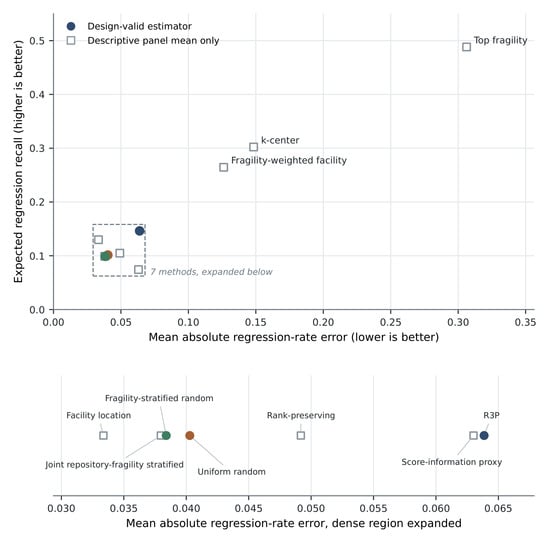
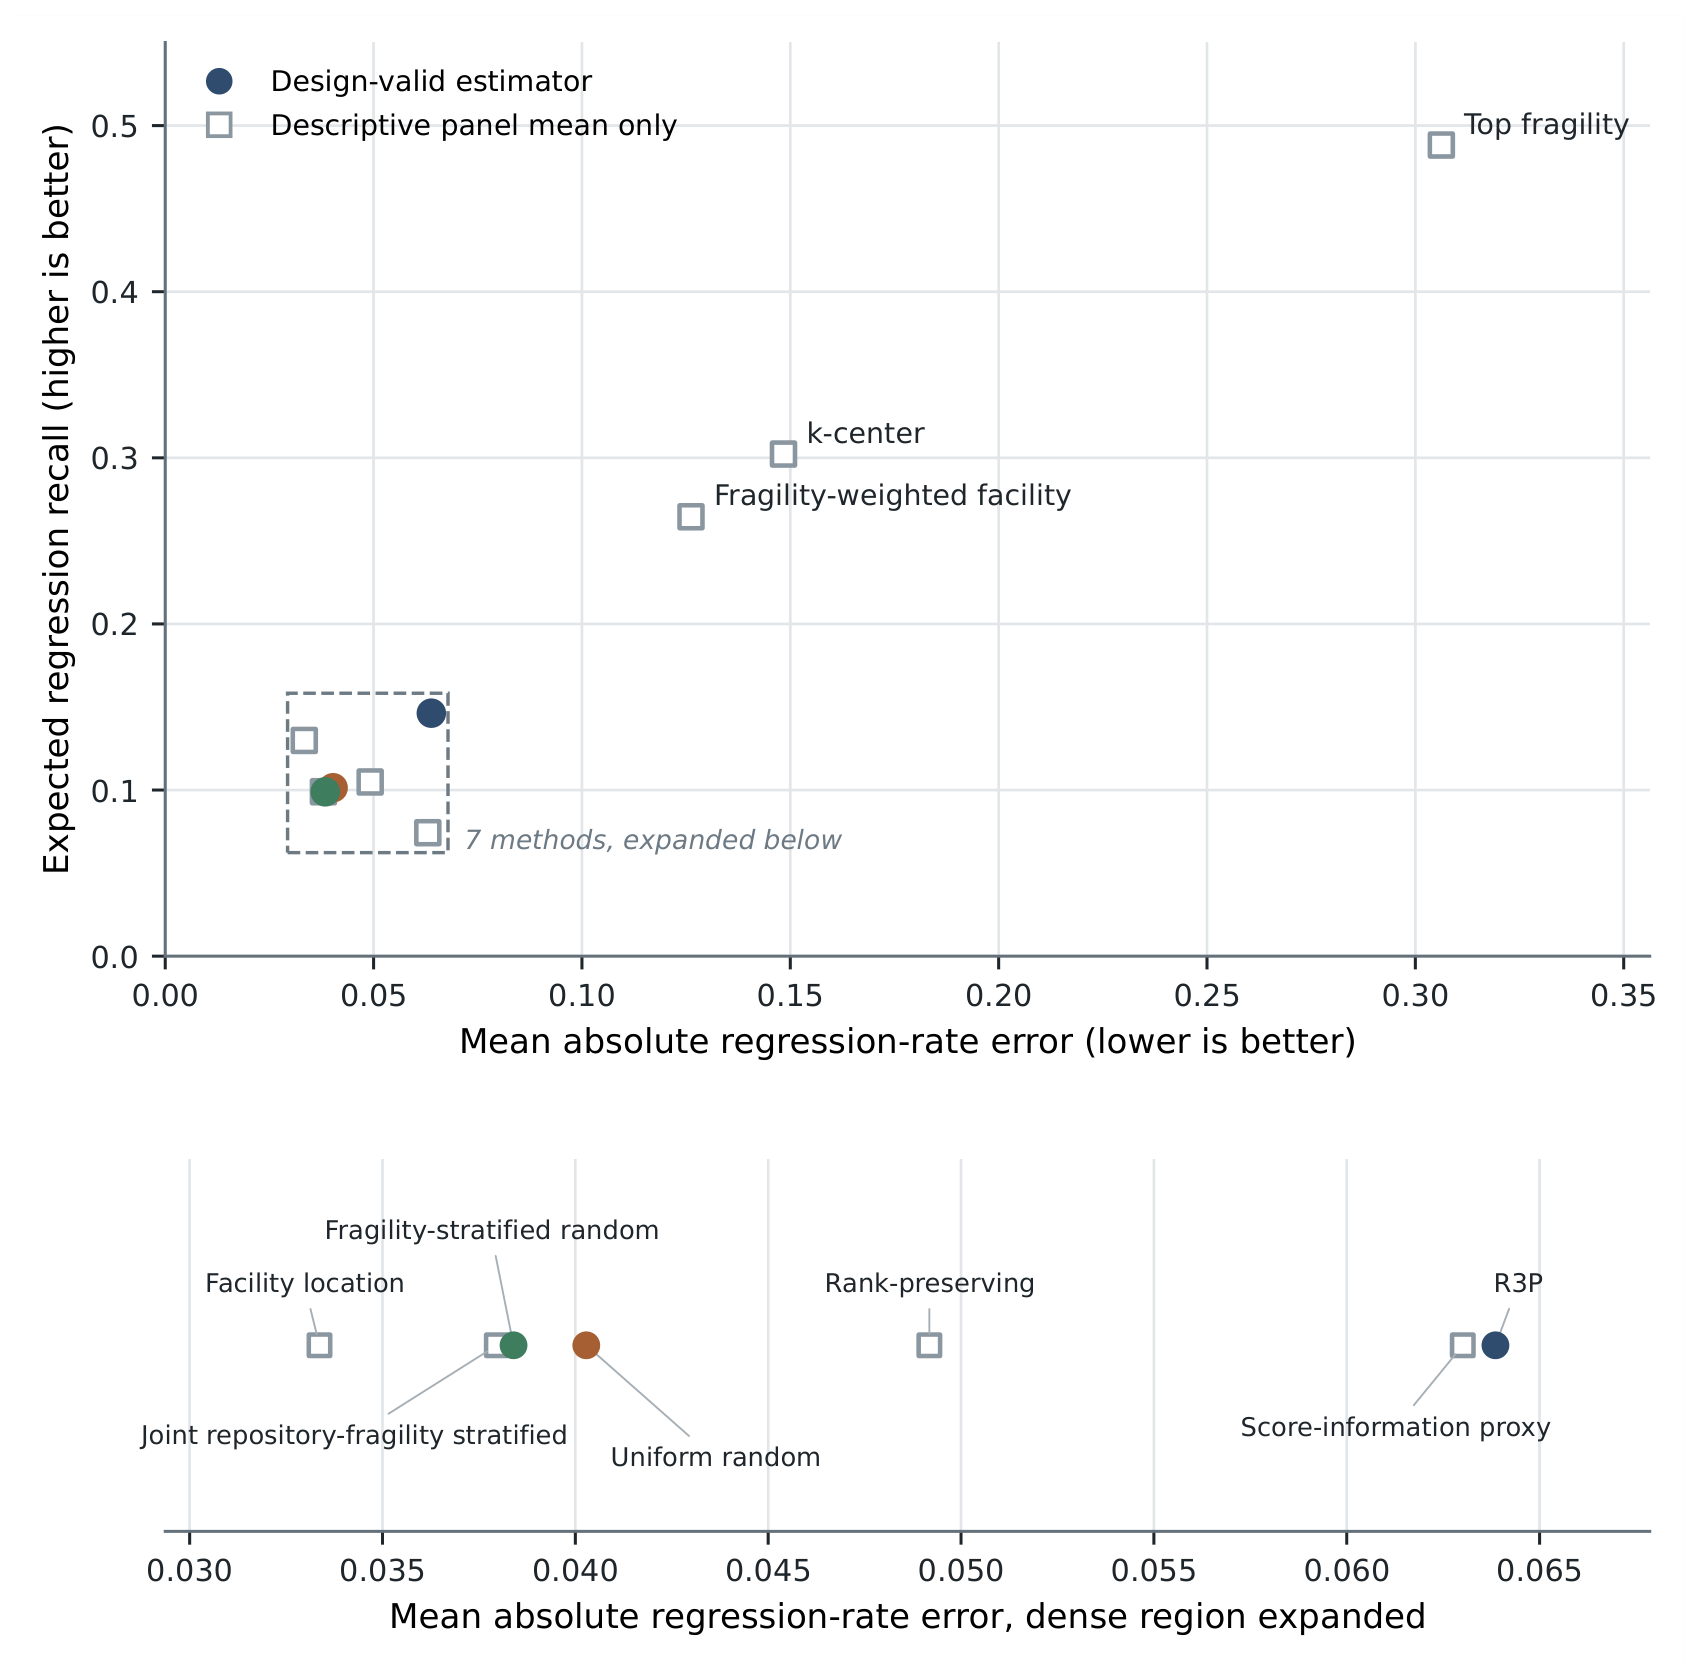
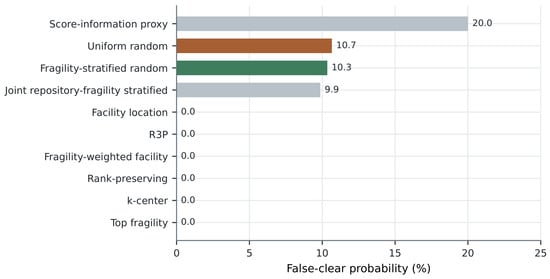
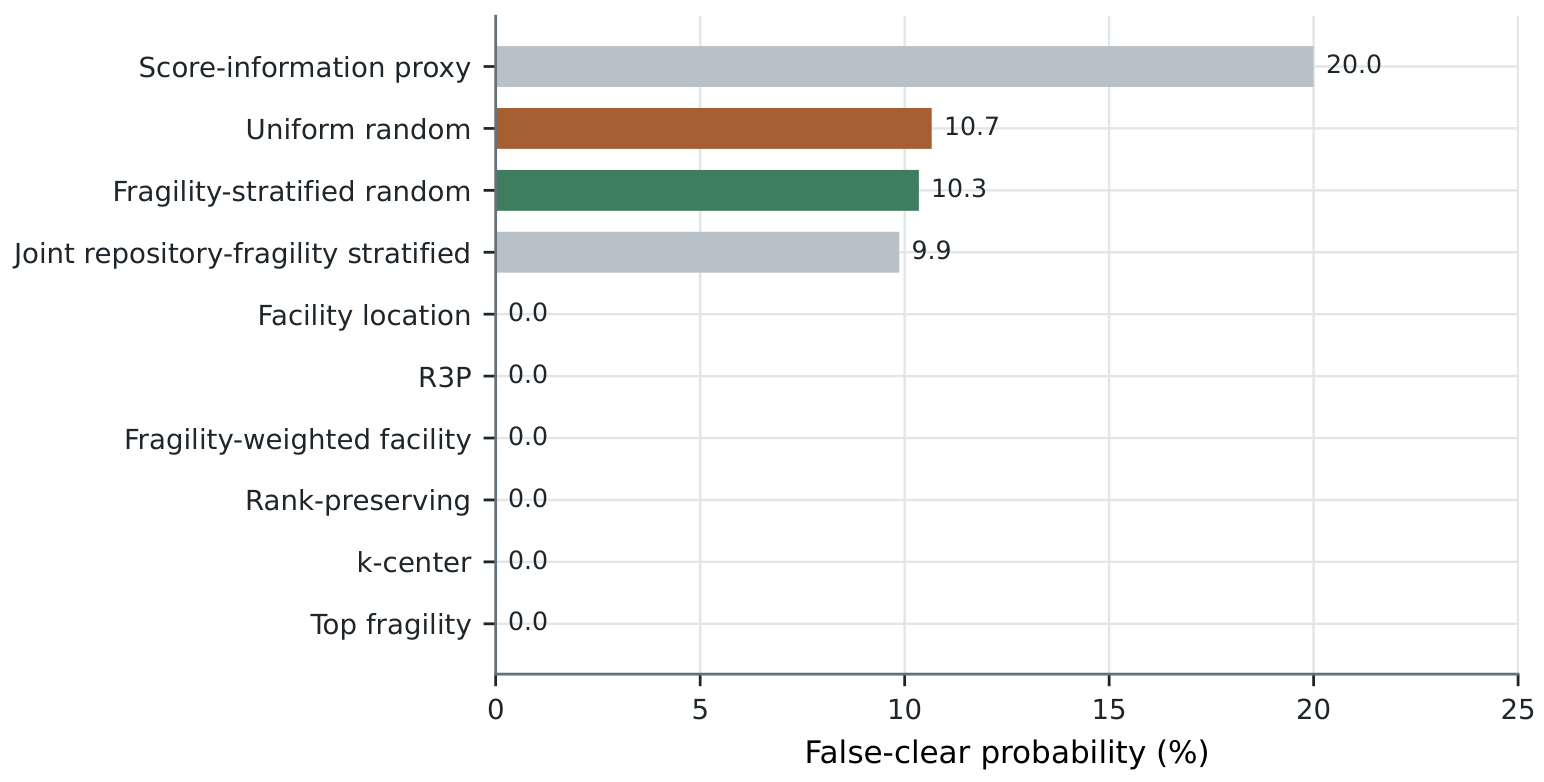
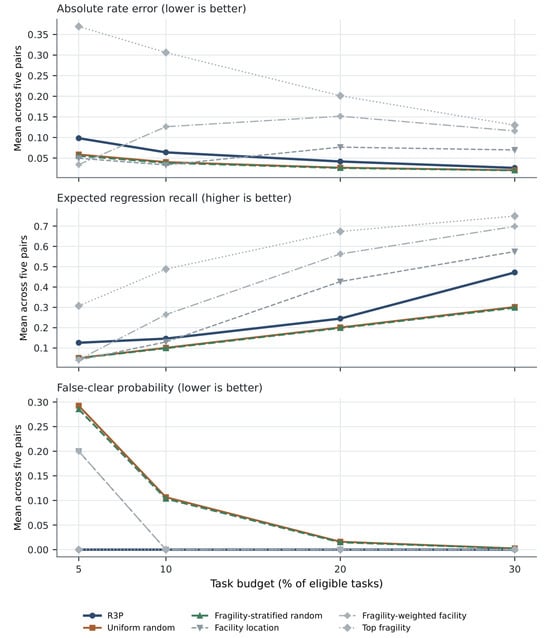
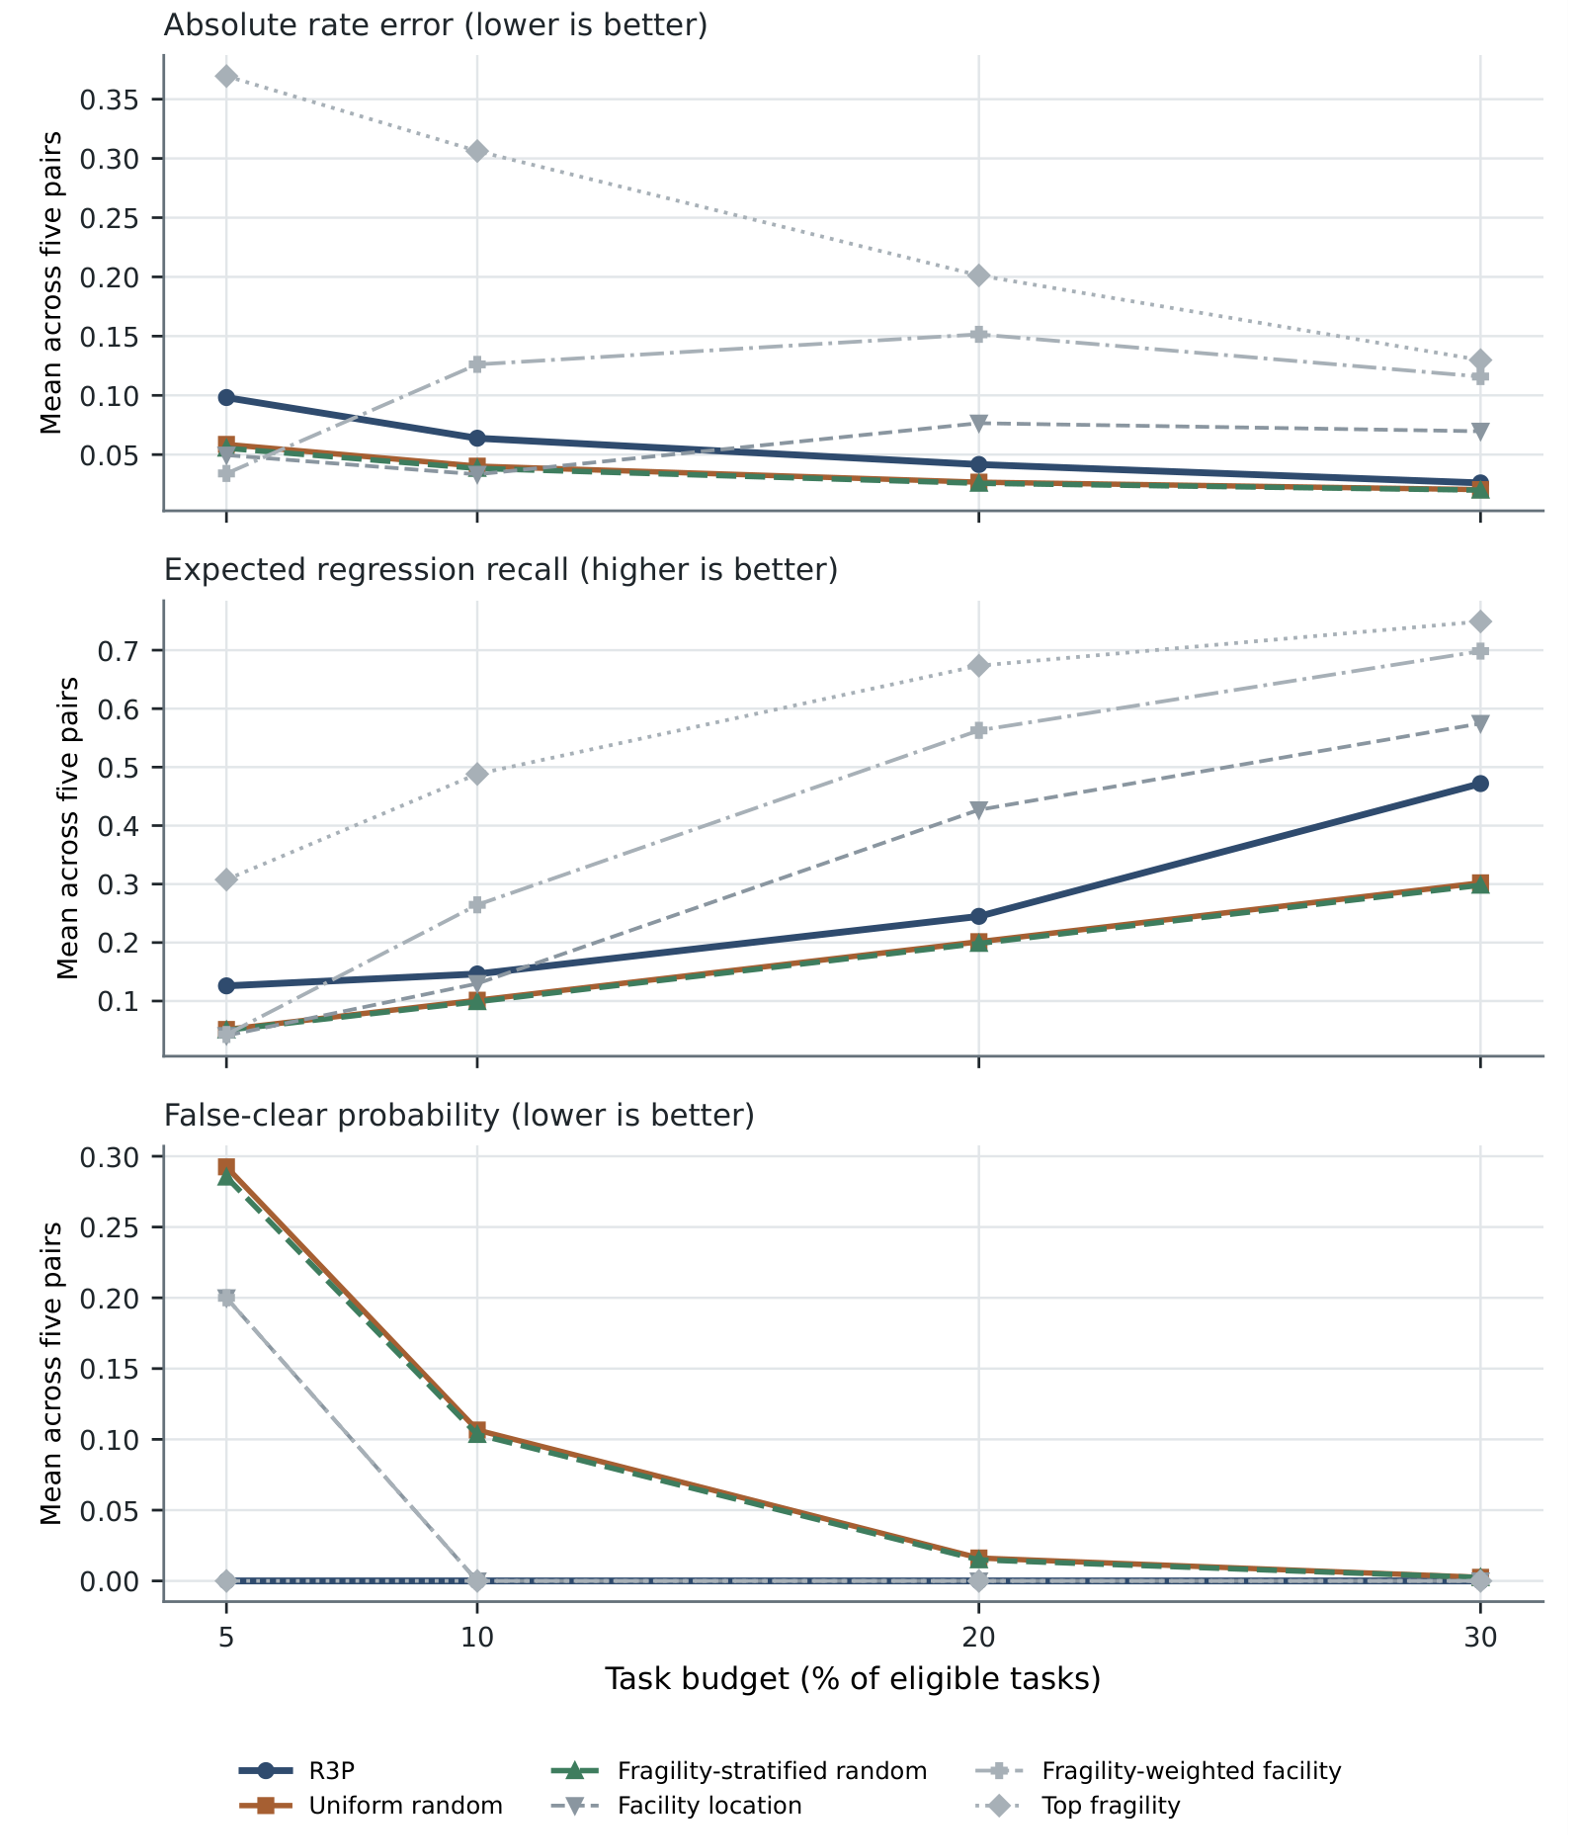

Disclaimer/Publisher’s Note: The statements, opinions and data contained in all publications are solely those of the individual author(s) and contributor(s) and not of MDPI and/or the editor(s). MDPI and/or the editor(s) disclaim responsibility for any injury to people or property resulting from any ideas, methods, instructions or products referred to in the content. |
© 2026 by the authors. Licensee MDPI, Basel, Switzerland. This article is an open access article distributed under the terms and conditions of the Creative Commons Attribution (CC BY) license.