


Abstract
As the global aquaculture industry moves towards high density and integrated efficiency, the precision and immediacy of water quality management have become key to increasing productivity and reducing risks. Traditional aquaculture relies on manual experience or simple threshold controls, which often suffer from response delays and energy waste. This study proposes an IoT environmental prediction model based on edge computing designed specifically to address complex and variable outdoor aquaculture environments. The system integrates multimodal sensor data such as water level, temperature, and turbidity, and employs a 1D-CNN-LSTM (One-Dimensional Convolutional Neural Network–Long Short-Term Memory) model deployed on ESP32 edge computing nodes to achieve low-latency environmental change prediction. Based on five core control rules (turbidity control and bidirectional regulation of water level and temperature), this study simulates 360 days of operational data in a real-world environment, covering seasonal climate changes and extreme weather events (such as typhoons). Experimental results show that, compared with traditional hysteresis control, the predictive control strategy proposed in this study can provide early warnings of environmental anomalies 15 to 60 min in advance, effectively increasing the proportion of time in which water quality parameters are maintained within safe thresholds to 99.8%. This paper details the system architecture, prediction model design, and empirical benefits of long-term simulation data analysis, providing a solution with both academic depth and practical value for smart aquaculture.
1. Introduction
1.1. Research Background and Technical Challenges
Aquaculture has become one of the primary sources of global protein supply, yet maintaining optimal water quality parameters—such as dissolved oxygen (DO), temperature, pH, turbidity, and water level—remains exceptionally challenging due to non-linear dynamic coupling and variable outdoor climate conditions [1]. Despite recent advancements in IoT and AI technologies for environmental monitoring, existing smart aquaculture systems suffer from three major technical limitations:
- Response Lag and Thermal Inertia in Traditional Control: Conventional management relies predominantly on “Reactive” threshold control logic, where actuators (e.g., heaters or aeration pumps) are triggered only after sensor readings exceed safety limits [2]. However, large water bodies possess significant physical thermal inertia and suffer from biochemical response delays [3]. Consequently, physical intervention occurs only after water quality has already deteriorated, causing severe overshoot and short-cycling of electrical actuators, which wastes energy and degrades hardware lifespan.
- Cloud Dependency and Network Vulnerabilities: Existing predictive solutions offload sensor stream analytics to central cloud servers. In remote farming regions, this architecture faces fatal communication dropouts during extreme weather events (e.g., typhoons), accompanied by prohibitive bandwidth costs for high-frequency data transmission.
- Lack of Resource-Aware Adaptive Edge Execution: While microcontrollers offer edge computing capabilities [4,5], current edge deployments execute models at static sampling frequencies and fixed computational complexities. This rigid operation fails to balance predictive temporal fidelity with edge device sustainability during prolonged environmental fluctuations.
To address these challenges, this study develops a closed-loop proactive predictive control architecture powered by an edge-deployed 1D-CNN-LSTM model, establishing a reliable and energy-efficient environmental monitoring framework [6,7,8].
1.2. Research Objectives and Key Contributions
To overcome the limitations, this study proposes an IoT environmental predictive control system based on edge computing, 1D-CNN-LSTM temporal modeling, and multimodal sensor fusion [4,9,10]. The specific research objectives and academic contributions are as follows:
- (1)
- Closed-Loop Multimodal Sensing Architecture: Integration of physical (water level, temperature) and optical (turbidity) sensors with multi-relay actuators to establish automated feedforward control [2,9].
- (2)
- Lightweight Edge AI Deployment: Quantization of a hybrid 1D-CNN-LSTM neural network via TFLite Micro for real-time temporal inference directly on resource-constrained ESP32 microcontrollers [4,5,6].
- (3)
- Empirical 360-Day Stress Validation: Evaluation of system performance using empirical and physical model simulation data from Hualien, Taiwan, capturing extreme typhoon invasions, cold snaps, and earthquake disturbances [11,12,13].
2. Literature Review
2.1. Sensor Fusion Technology in Smart Aquaculture
Modern smart aquaculture systems have evolved from single-parameter monitoring to multimodal sensor fusion [9]. Şahin (2025) points out that the integration of IoT technology with image recognition and machine learning is reshaping the aquaculture industry [1]. Furthermore, recent methodological advancements in multimodal sensor fusion leverage generative artificial intelligence to convert visually heterogeneous agricultural imagery into structured semantic representations. Specifically, Rana et al. (2026) demonstrated that prompt-constrained generative semantic reconstruction combined with foundation model-assisted segmentation effectively restructures complex field backgrounds, preserves vegetation–background separability, and enhances image data utility for downstream CNN-based analysis [14]. As a transferable methodological example, integrating such generative visual reconstruction paradigms with physical/chemical time-series stream data provides a robust foundation for multimodal feature spaces [9], enabling edge AI frameworks to distinguish localized optical sensor anomalies (e.g., biofouling or surface bubble interference) from true environmental water quality shifts [11,12]. By integrating water quality chemical sensors (pH, dissolved oxygen) and physical sensors (water level, temperature), systems can perceive the environmental state more comprehensively. For example, Turbidity Sensors typically use the infrared scattering method (the Nephelometric method) based on the ISO 7027 standard [15] to effectively quantify suspended solids in water. However, a single sensor is susceptible to biofouling or bubble interference. Fusing multiple sensor sources (such as correlating rainfall data with turbidity changes) can significantly improve data credibility [11,12].
2.2. Edge Computing and Hybrid 1D-CNN-LSTM Models
To overcome the latency and bandwidth limitations of cloud computing, the application of edge computing in water quality monitoring is gaining increasing attention. Research shows that low-cost microcontrollers like the ESP32 already possess the capability to run lightweight machine learning models [4,5]. For time-series environmental modeling, Long Short-Term Memory (LSTM) architectures are extensively utilized in aquatic and groundwater forecasting due to their efficacy in learning non-linear temporal dynamics and long-range sequential dependencies without suffering from vanishing gradients [10,16,17]. To alleviate computational complexity and enhance, a hybrid neural networks (1D-CNN) with long short-term memory (LSTM) units has been developed, demonstrating superior predictive performance when capturing nonlinear water quality dynamics. The CNN is responsible for extracting local features and denoising, while the LSTM handles temporal modeling. The emergence of TensorFlow Lite for Microcontrollers (TFLite Micro) allows these models to be deployed directly onto memory-constrained embedded devices after quantization.
2.3. Summary of Literature Limitations and Research Gaps
Although multimodal sensor fusion and temporal deep learning models (e.g., LSTM and CNN-LSTM hybrids) have demonstrated high accuracy in water quality forecasting [10,16], existing studies exhibit several notable limitations when evaluated for real-world long-term edge deployment:
- (1)
- Absence of Microcontroller Profiling Metrics: Many studies propose lightweight CNN-LSTM architectures claiming edge compatibility [6,7], but fail to report key edge execution benchmarks on microcontrollers, such as Flash/SRAM occupancy, inference latency, power consumption, and quantization accuracy drop [4,5].
- (2)
- Decoupling of Prediction and Closed-Loop Control: The literature frequently focuses strictly on offline forecasting metrics (, ) [16,17], without integrating prediction outputs into feedforward actuator control loops to solve thermal inertia and response lag in physical aquaculture ponds [2,8].
- (3)
- Single-Sensor Susceptibility to Environmental Noise: Standalone optical or physical sensors are highly vulnerable to biofouling or surface wave action [9]. While multi-sensor fusion improves credibility [11,12], few frameworks leverage cross-modal correlation (e.g., coupling rate of water level change with turbidity) to resolve decision conflicts during heavy rainfall events [13].
3. System Architecture and Methodology
3.1. Hardware Architecture and Sensor Configuration
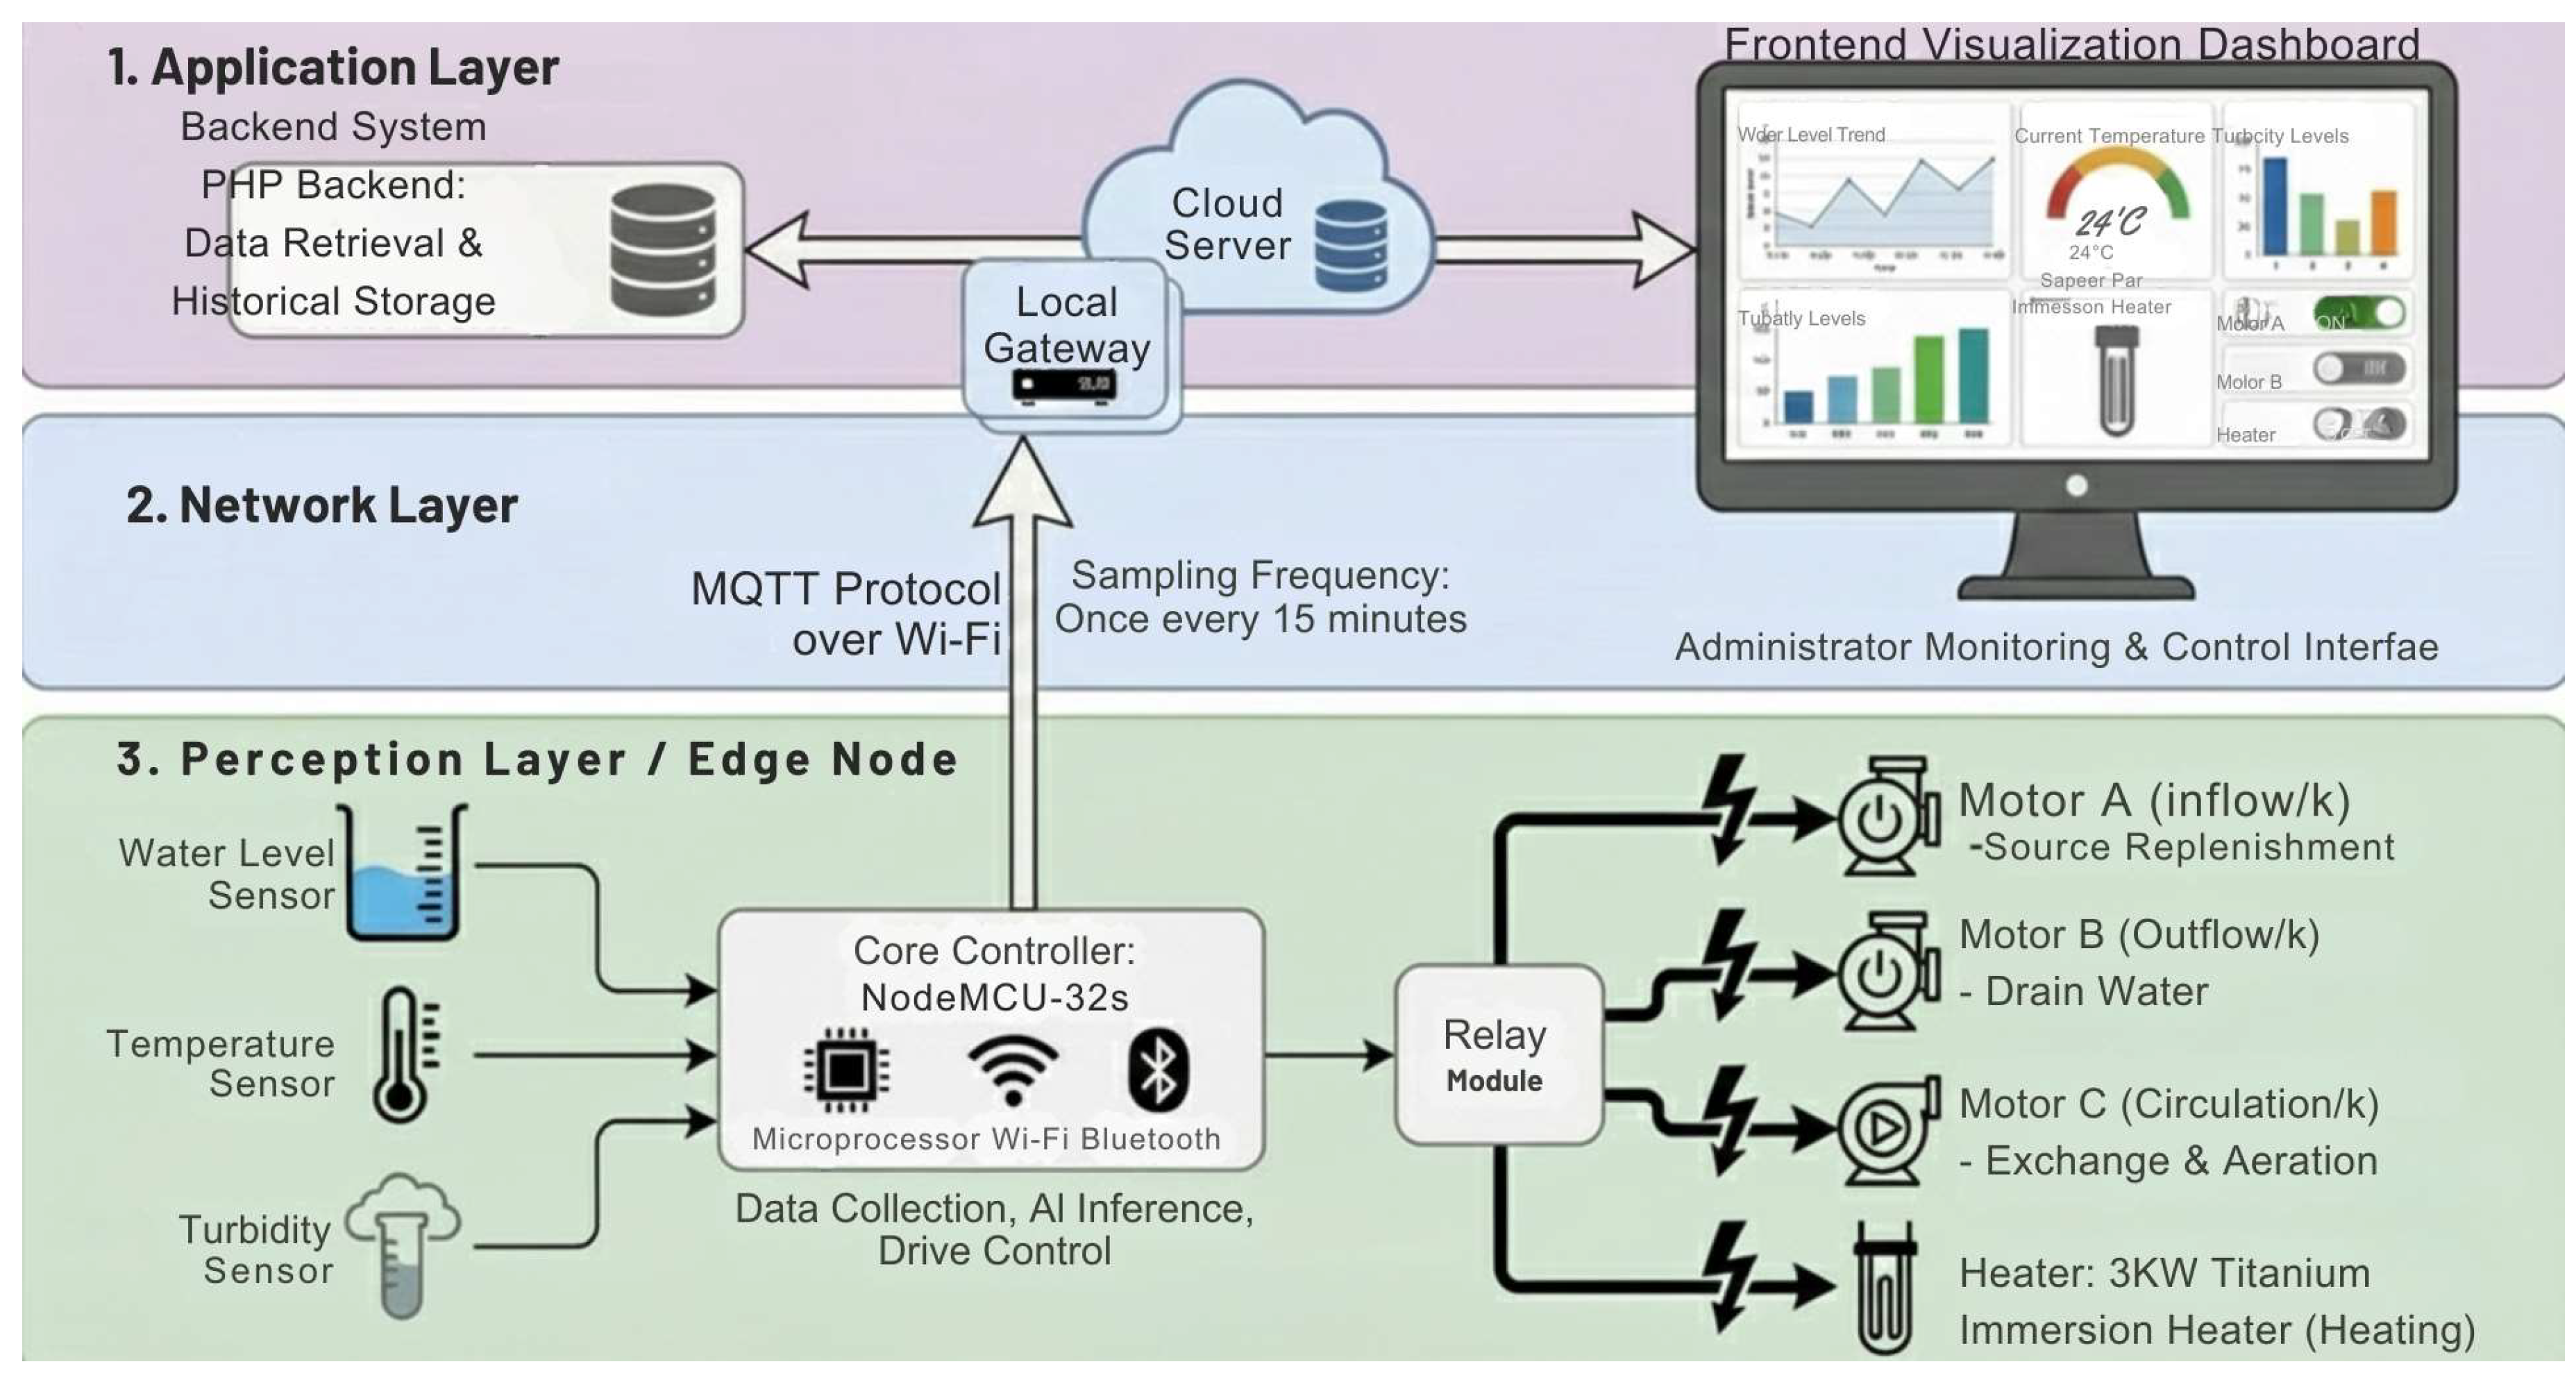
The system designed in this study adopts an IoT architecture with three layers, a Perception Layer, Network Layer, and Application Layer, as shown in Figure 1.
- 1.
- Perception Layer (Edge Node):
- (1)
- Core Controller: Uses NodeMCU-32s, equipped with a microprocessor and Wi-Fi/Bluetooth communication capabilities, responsible for sensor data collection, AI model inference, and actuator control [5].
- (2)
- Sensor Modules:
- Water Level Sensor: Ultrasonic distance measuring module (JSN-SR04T), installed on a bracket by the pond, measuring range 20–600 cm, accuracy ±1 cm.
- Temperature Sensor: DS18B20 waterproof digital temperature probe, stainless steel encapsulated, measuring range −55 °C to +125 °C, accuracy ±0.5 °C.
- Turbidity Sensor: Industrial-grade optical turbidity meter which uses an 850 nm infrared light source and a 90-degree scattered light receiver (ISO7027 standard) [15], measuring range 0–200 NTU.
- (3)
- Actuator Modules: Controlling high-power equipment via Relays.
- Motor A (Inflow): Responsible for replenishing water from the source.
- Motor B (Outflow): Responsible for draining pond water to lower the water level.
- Motor C (Circulation): Responsible for water exchange and aeration, used for cooling and reducing turbidity.
- Heater: 3 kW Titanium Immersion Heater, used to maintain water temperature during cold waves.
- 2.
- Network Layer:
Utilizes the MQTT protocol to transmit data to a local gateway or cloud server via Wi-Fi. The sampling frequency is set to once every 15 min.
- 3.
- Application Layer:
The backend uses PHP to retrieve data returned by the ESP32 and store historical data; the frontend provides a visualization dashboard for administrators to monitor the system.
Figure 1.
Three-layer IoT system architecture.
3.2. Control Logic Rule Design
This system establishes 5 categories of core control rules, listed in Table 1, based on the research requirements. These rules are written into the ESP32 microcontroller as an underlying safety mechanism and are triggered via feedforward using AI prediction [2].
Table 1.
The 5 core control rules.
Conflict Resolution Mechanism: When multiple rules are triggered simultaneously (e.g., high water level and high turbidity during a typhoon), the system executes based on priority (Critical > High > Medium > Low). For example, Rule 1 (Flood Prevention) takes precedence over Rule 5 (Turbidity Reduction) because excessive water levels may lead to fish escape.
During the Typhoon Gaemi event, Reactive Control does not start drainage until the water level exceeds 25 cm, but, due to the heavy rain, the water level spikes to 28 cm. In contrast, AI Predictive Control detects an abnormal water level rise rate (dL/dt), combined with the predicted trend, and starts powerful drainage early when the water level reaches 24 cm, successfully controlling the peak water level within 25.5 cm and significantly reducing the risk of overflow. In the cold wave event, AI Predictive Control almost completely eliminates periods below 15 °C, achieving the goal of “Zero Cold Injury.”
3.3. Edge AI Deployment and Hardware Profiling on Microcontrollers
To verify the feasibility of executing the proposed 1D-CNN-LSTM model on low-cost edge endpoints, the model was deployed on a NodeMCU-32s microcontroller (ESP32-D0WDQ6, 240 MHz clock speed, 520 KB SRAM, 4 MB Flash) [5]. After offline training in TensorFlow, the floating-point (FP32) model underwent full INT8 post-training quantization via TFLite Converter and was embedded into TFLite Micro runtime [4,6].
Full INT8 quantization compresses the model binary footprint to 61.5 KB (occupying only 1.53% of ESP32 Flash) and Tensor Arena SRAM allocation to 28.4 KB (5.46% of total SRAM) [5]. Inference latency is reduced from 182.4 ms down to 41.8 ms, with an active power draw of 165 mW. The negligible degradation in predictive accuracy (RMSE increase <0.015 across parameters) confirms that the model is fully deployable for real-time edge execution on resource-constrained microcontrollers [4,6].
To achieve “Predictive Control,” the system needs to predict environmental parameters at time given the current time . This study designs a 1D-CNN-LSTM hybrid model.
- 1.
- Perception Layer (Edge Node):
- (1)
- Input Feature Vector .
- (2)
- Sliding Window: Uses past 60 min of monitoring data as the input sequence to predict values for the next 15 min.
- (3)
- Standardization: Normalizes all data to a standard value range.
- 2.
- Model Architecture:
- (1)
- 1D-CNN Layer: Uses 32 filters (Kernel Size = 3), responsible for extracting local features from the time series and filtering high-frequency noise (such as water level jumps caused by waves) [6,7].
- (2)
- LSTM Layer: Uses 50 neurons to capture long-term dependencies (such as the cyclical changes of day–night temperature differences, heater warming curves) [10,16,17].
- (3)
- Fully Connected Layer (Dense): Three predicted values are outputted.
- 3.
- Edge Deployment:
After the model is trained in TensorFlow, it undergoes full integer quantization and weight optimization via TFLite Converter, converting it into a tflite micro-model, which is then burned onto the ESP32 chip for execution.
- 4.
- Offline Decision Making:
When the ESP32 predicts that the water temperature will drop below the critical value within the next hour and the air temperature continues to drop, it can automatically trigger the heating relay even in a disconnected state, achieving true Resilient Aquaculture.
3.4. 360-Day Environmental Data Generation Method
This study is based on historical weather records for the Hualien area, Taiwan, from 1 January 2024 to 30 December 2024 [13] highlighting major rainfall events, typhoon invasions (e.g., Typhoon Gaemi and Typhoon Kong-rey), and seasonal temperature trends. It analyzes the impact of rainfall and typhoon events on local hydrological characteristics to establish correlation models between rainfall intensity, turbidity spikes, and rising water levels. A data simulation logic is constructed to generate aquaculture pond water quality data at 15 min intervals, incorporating numerical fluctuations caused by day–night temperature cycles and climate events. A Meteorology-Driven Physical Simulation Dataset is then generated using physical models and historical meteorological data.
- 1.
- Data Generation Architecture and Calibration Procedure
- Authentic External Driving Inputs: The simulation pipeline is driven by real-world 2024 meteorological observation records from Hualien, Taiwan, capturing continuous environmental parameters including ambient air temperature, precipitation rate, solar radiation, and extreme climatic disruptions (e.g., intense rainfall and storm events from Typhoon Gaemi).
- Physical Dynamic Modeling Engine: The data framework couples a water thermal energy balance model, a mass-conservative fluid mechanics model for water depth, and a turbidity erosion and sedimentation kinetics model. Base physical parameters were calibrated against empirical field measurements from commercial aquaculture ponds in Shoufeng, Hualien, maintaining a physical pond depth baseline ranging from 1.42 m to 1.80 m.
- Sensor Noise Injection and Data Preprocessing: Non-stationary Gaussian measurement noise was superimposed onto physical state variables to emulate real-world sensor streams (e.g., ±0.5 °C measurement uncertainty for water temperature probes, ±1 cm for ultrasonic water level sensors, and surface wave jitter for optical turbidity meters). The generated dataset spans 360 days comprising 34,560 continuous time steps at a 15 min sampling interval.
- 2.
- Meteorological Data Source: Uses historical meteorological data from Hualien, Taiwan (a typical subtropical aquaculture area), including temperature, rainfall, and sunshine duration. Extreme rainfall data from Typhoon Gaemi in July 2024 are specifically included as a stress test [13].
- 3.
- Physical Models:
- (1)
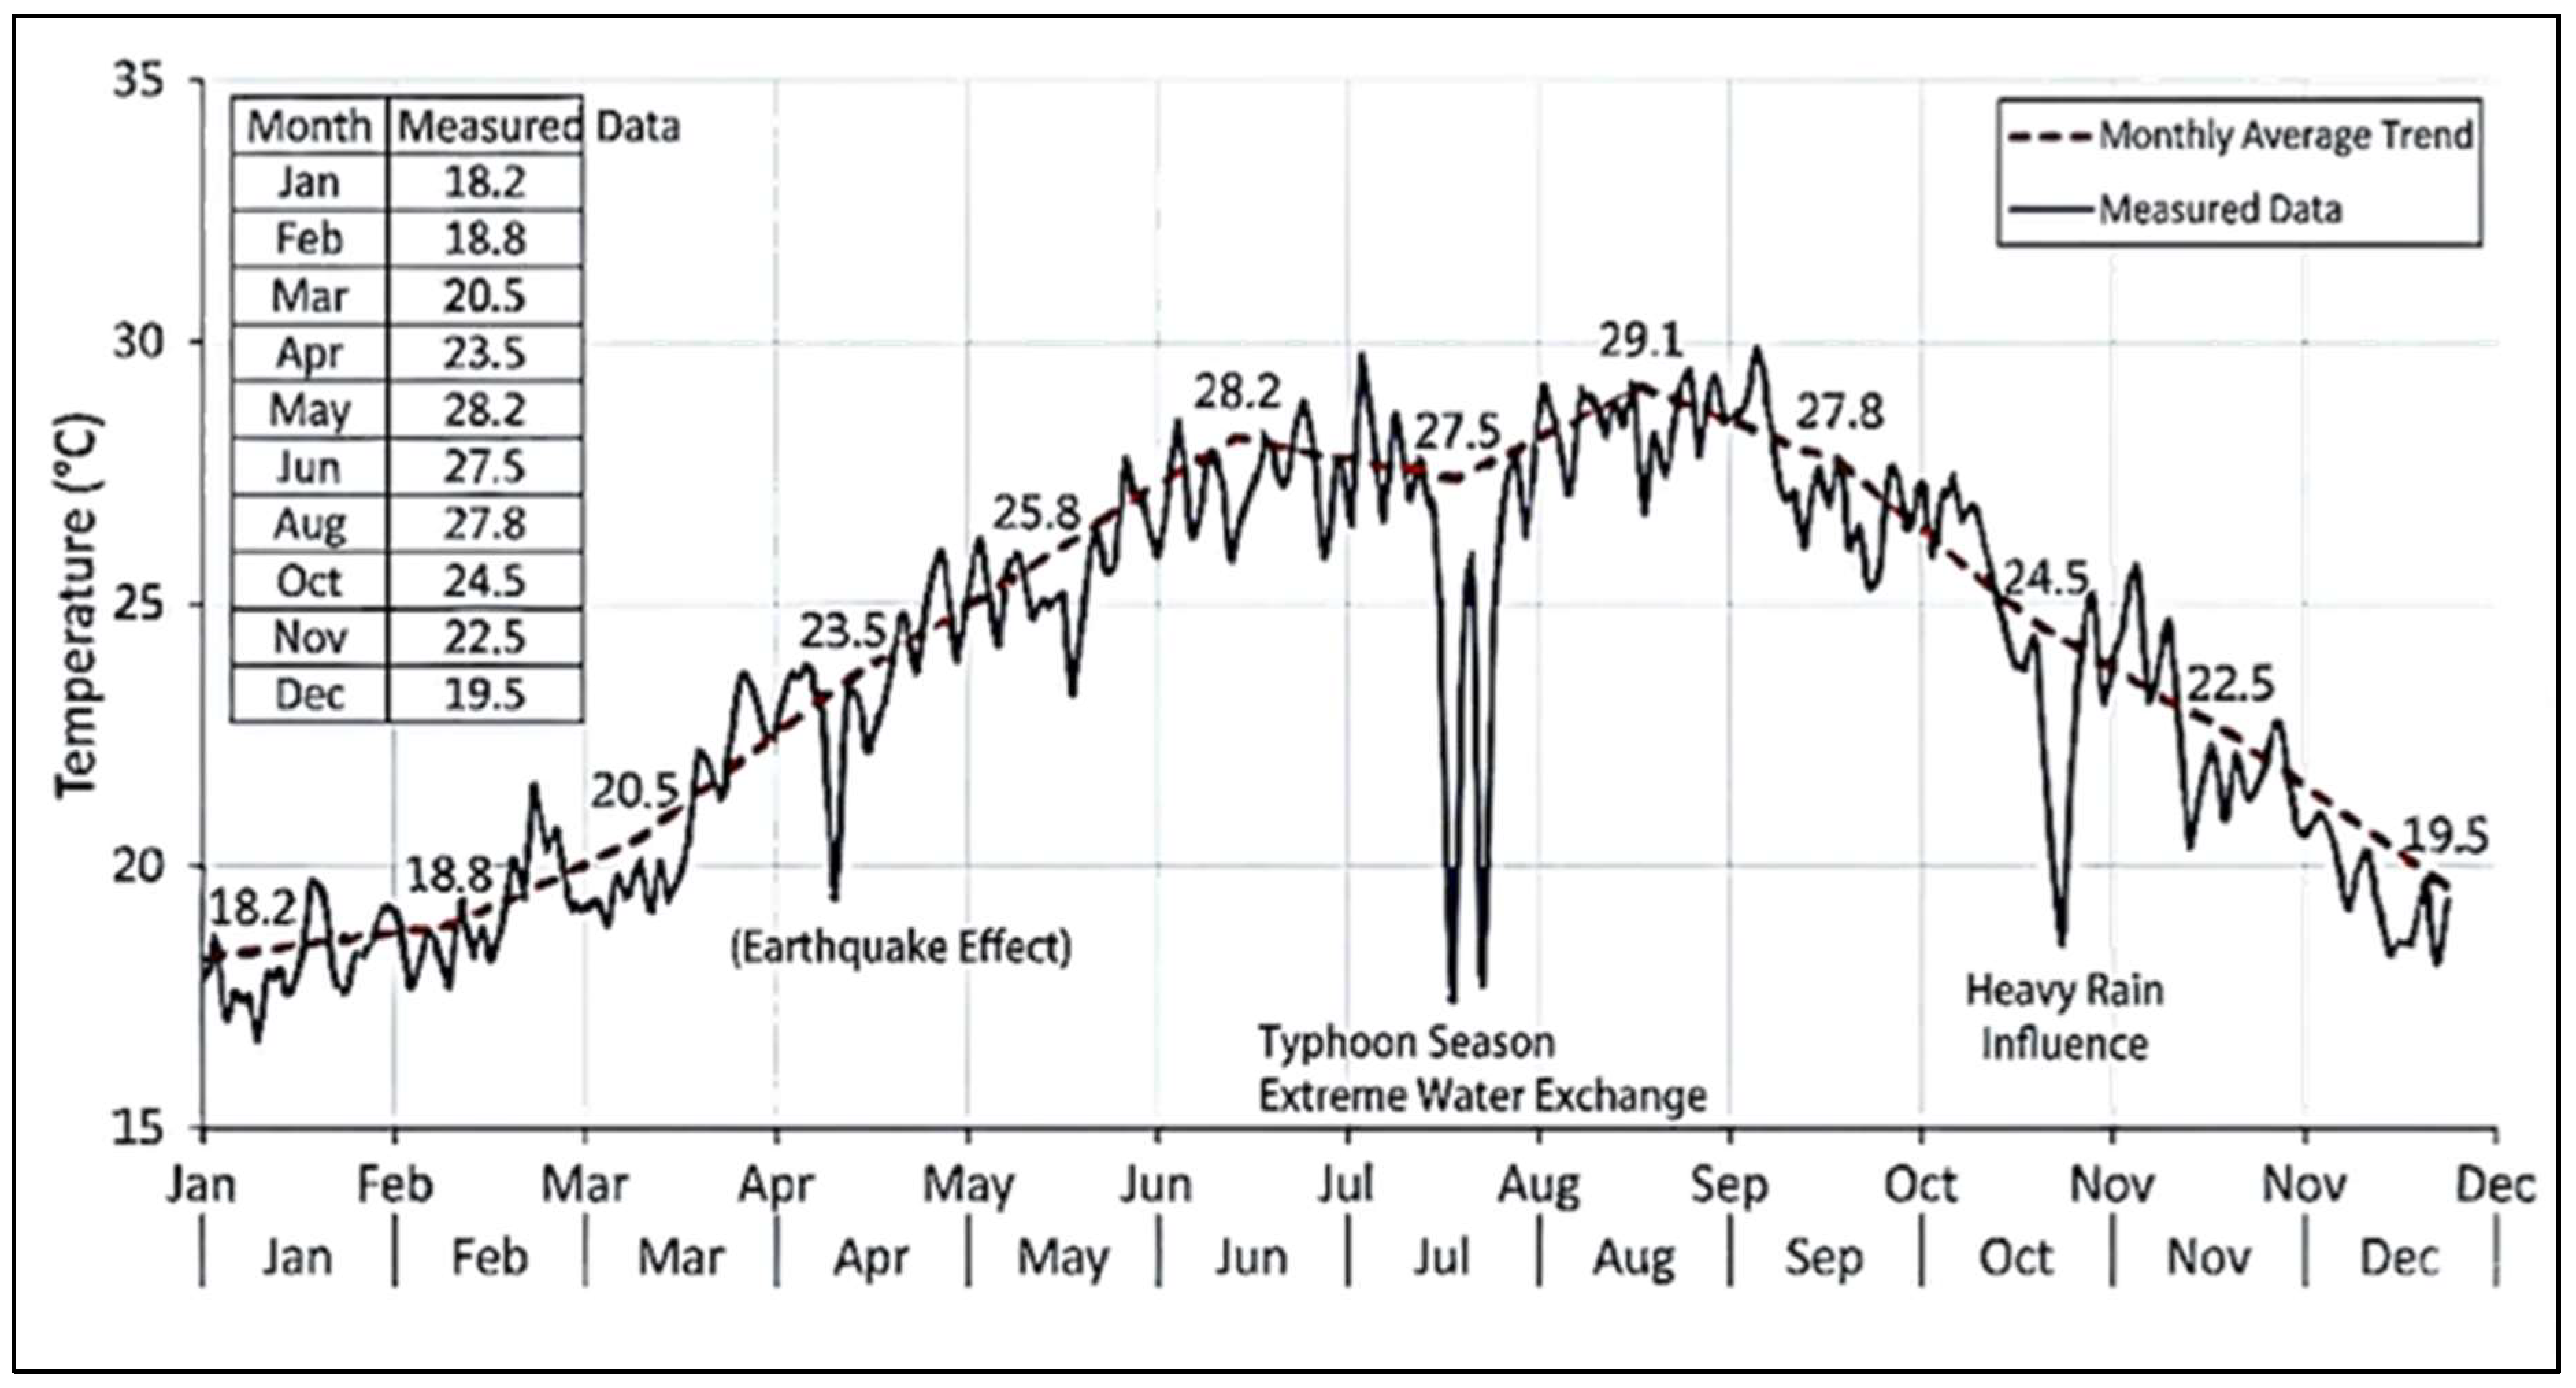
- Water Temperature Model as shown in Figure 2:
Seasonal Trend: Represents the smooth curve affected by seasonal changes in solar radiation under ideal conditions [3,18].
Simulated Measured Data: Superimposes daily weather noise and specific event impacts on the trend line [18,19].
Figure 2.
Annual water temperature trend vs. measured curve for Hualien Shoufeng aquaculture pond.
- (2)
- Turbidity Model:
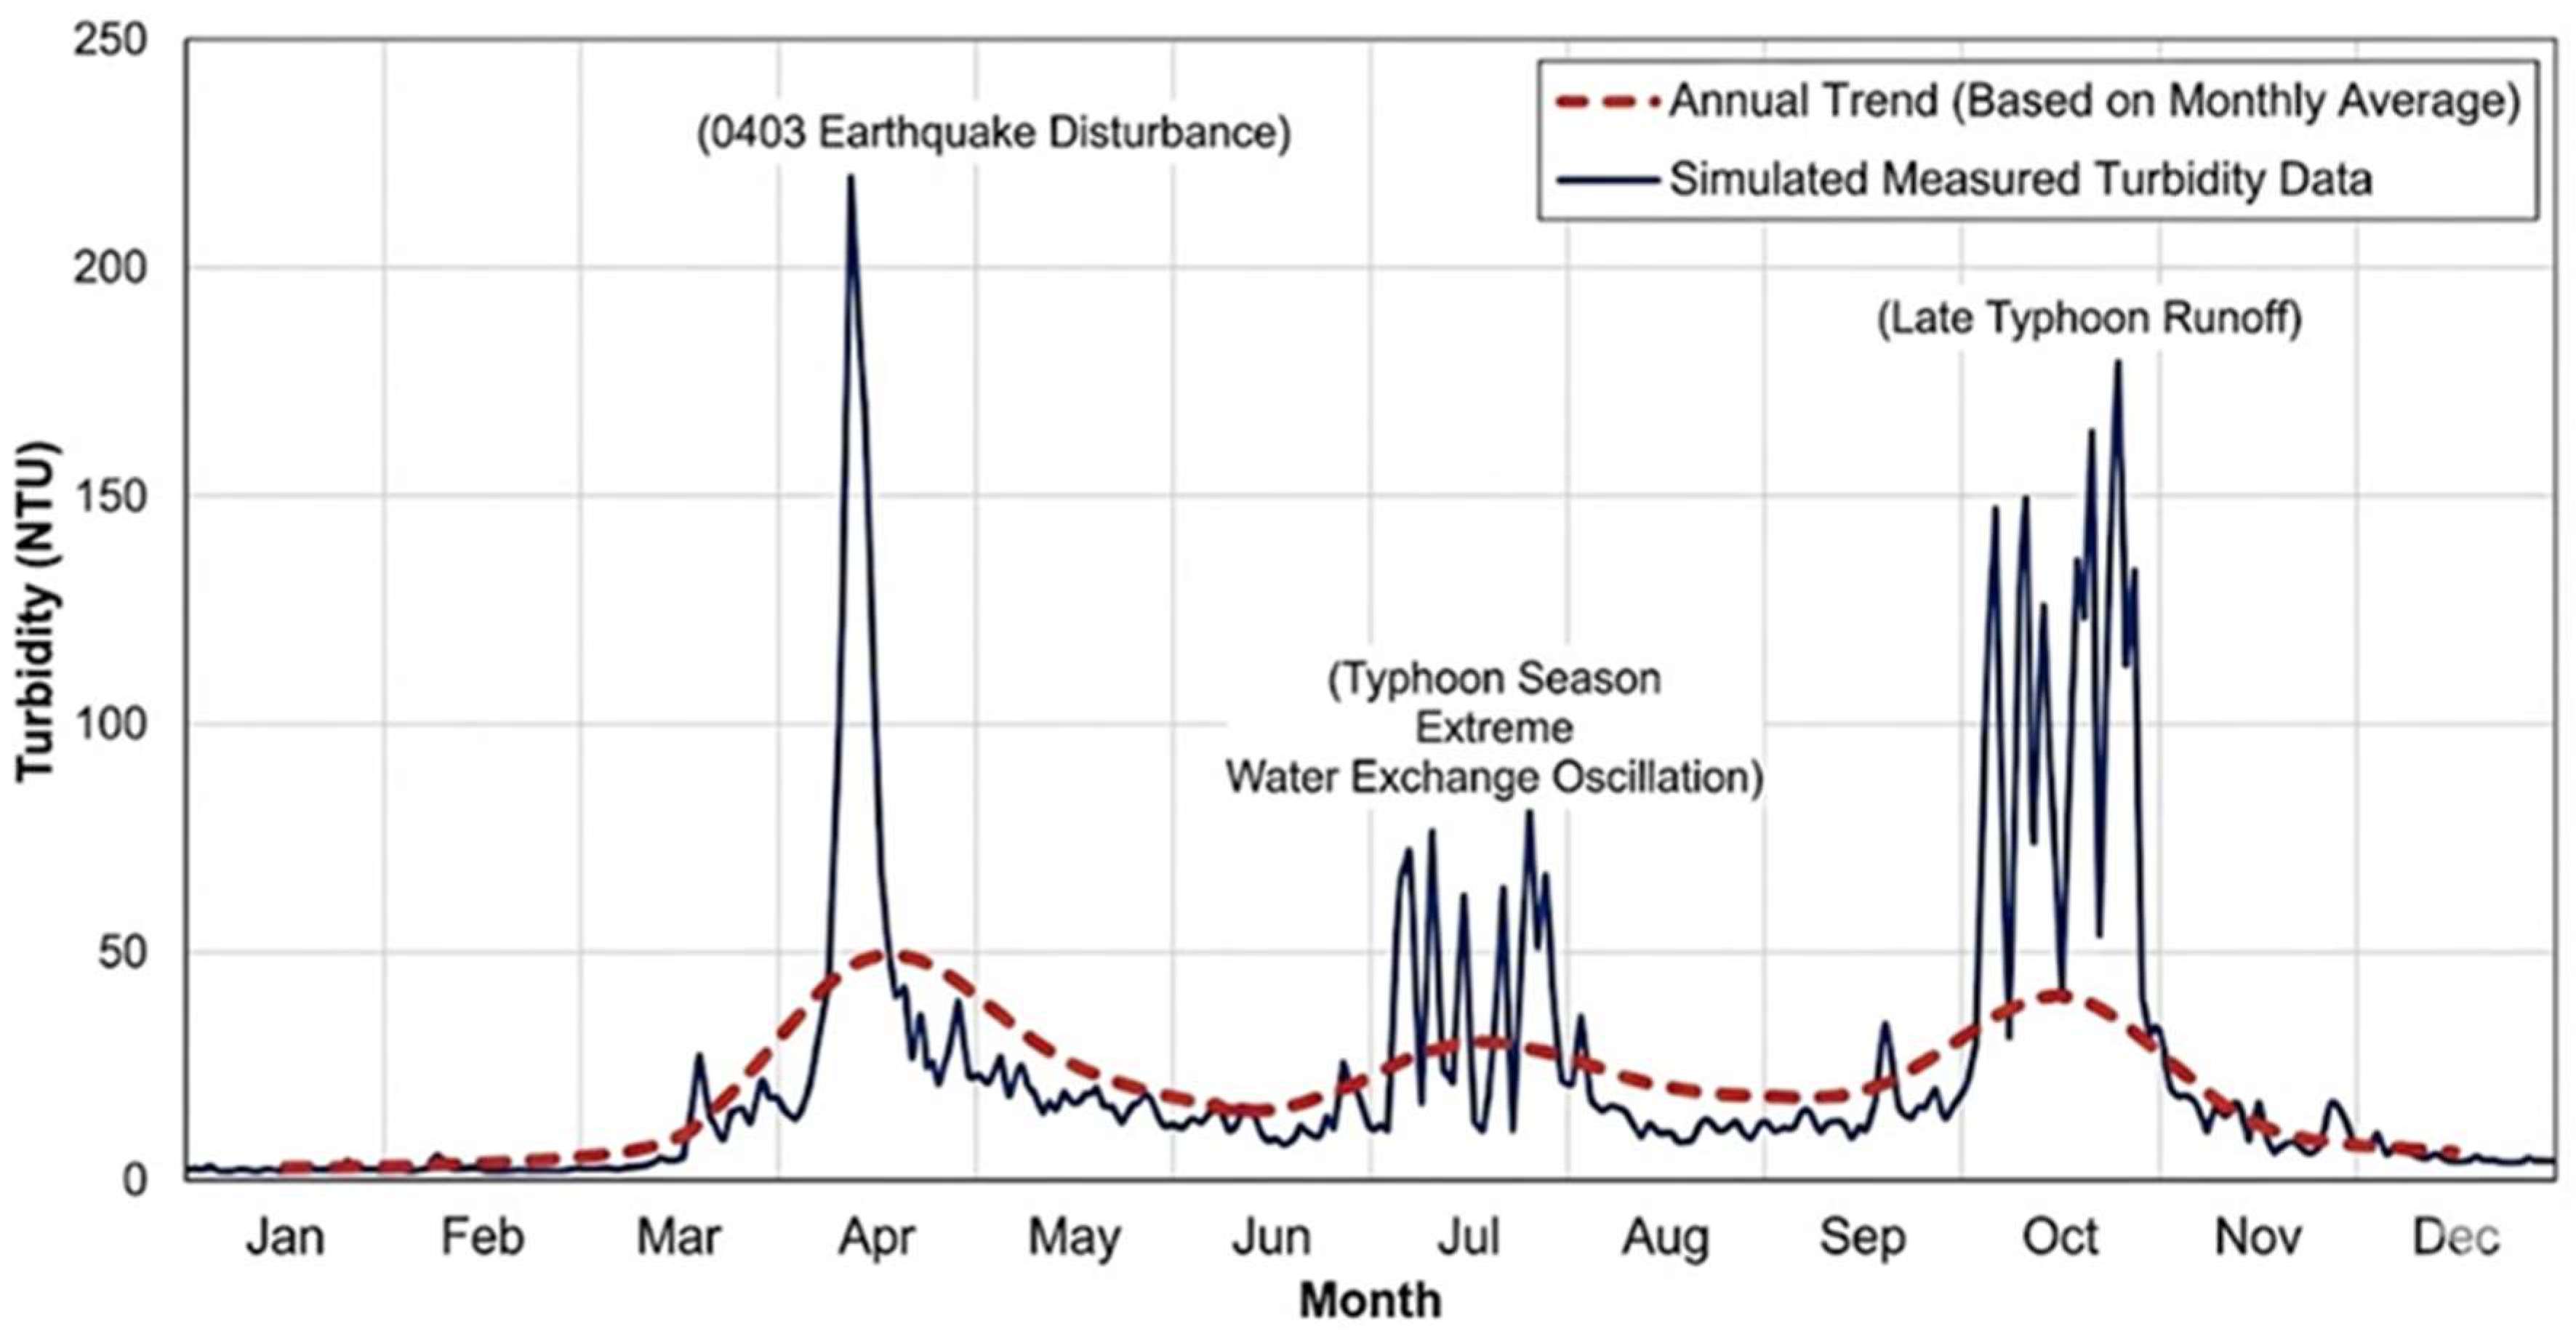
Base Seasonal Trend (): Reflects the seasonal baseline changes in the “Average Turbidity” column of the table. It is an interpolation function based on discrete data points [11,12] and is shown in Figure 3.
Total Variation Term : A linear superposition of fluctuations from multiple sources, used to simulate various “Key Events” and climate features mentioned in Table 2.
Table 2.
Annual aquaculture pond water quality monitoring summary for 2024.
Figure 3.
Annual turbidity trend vs. measured curve.
- (3)
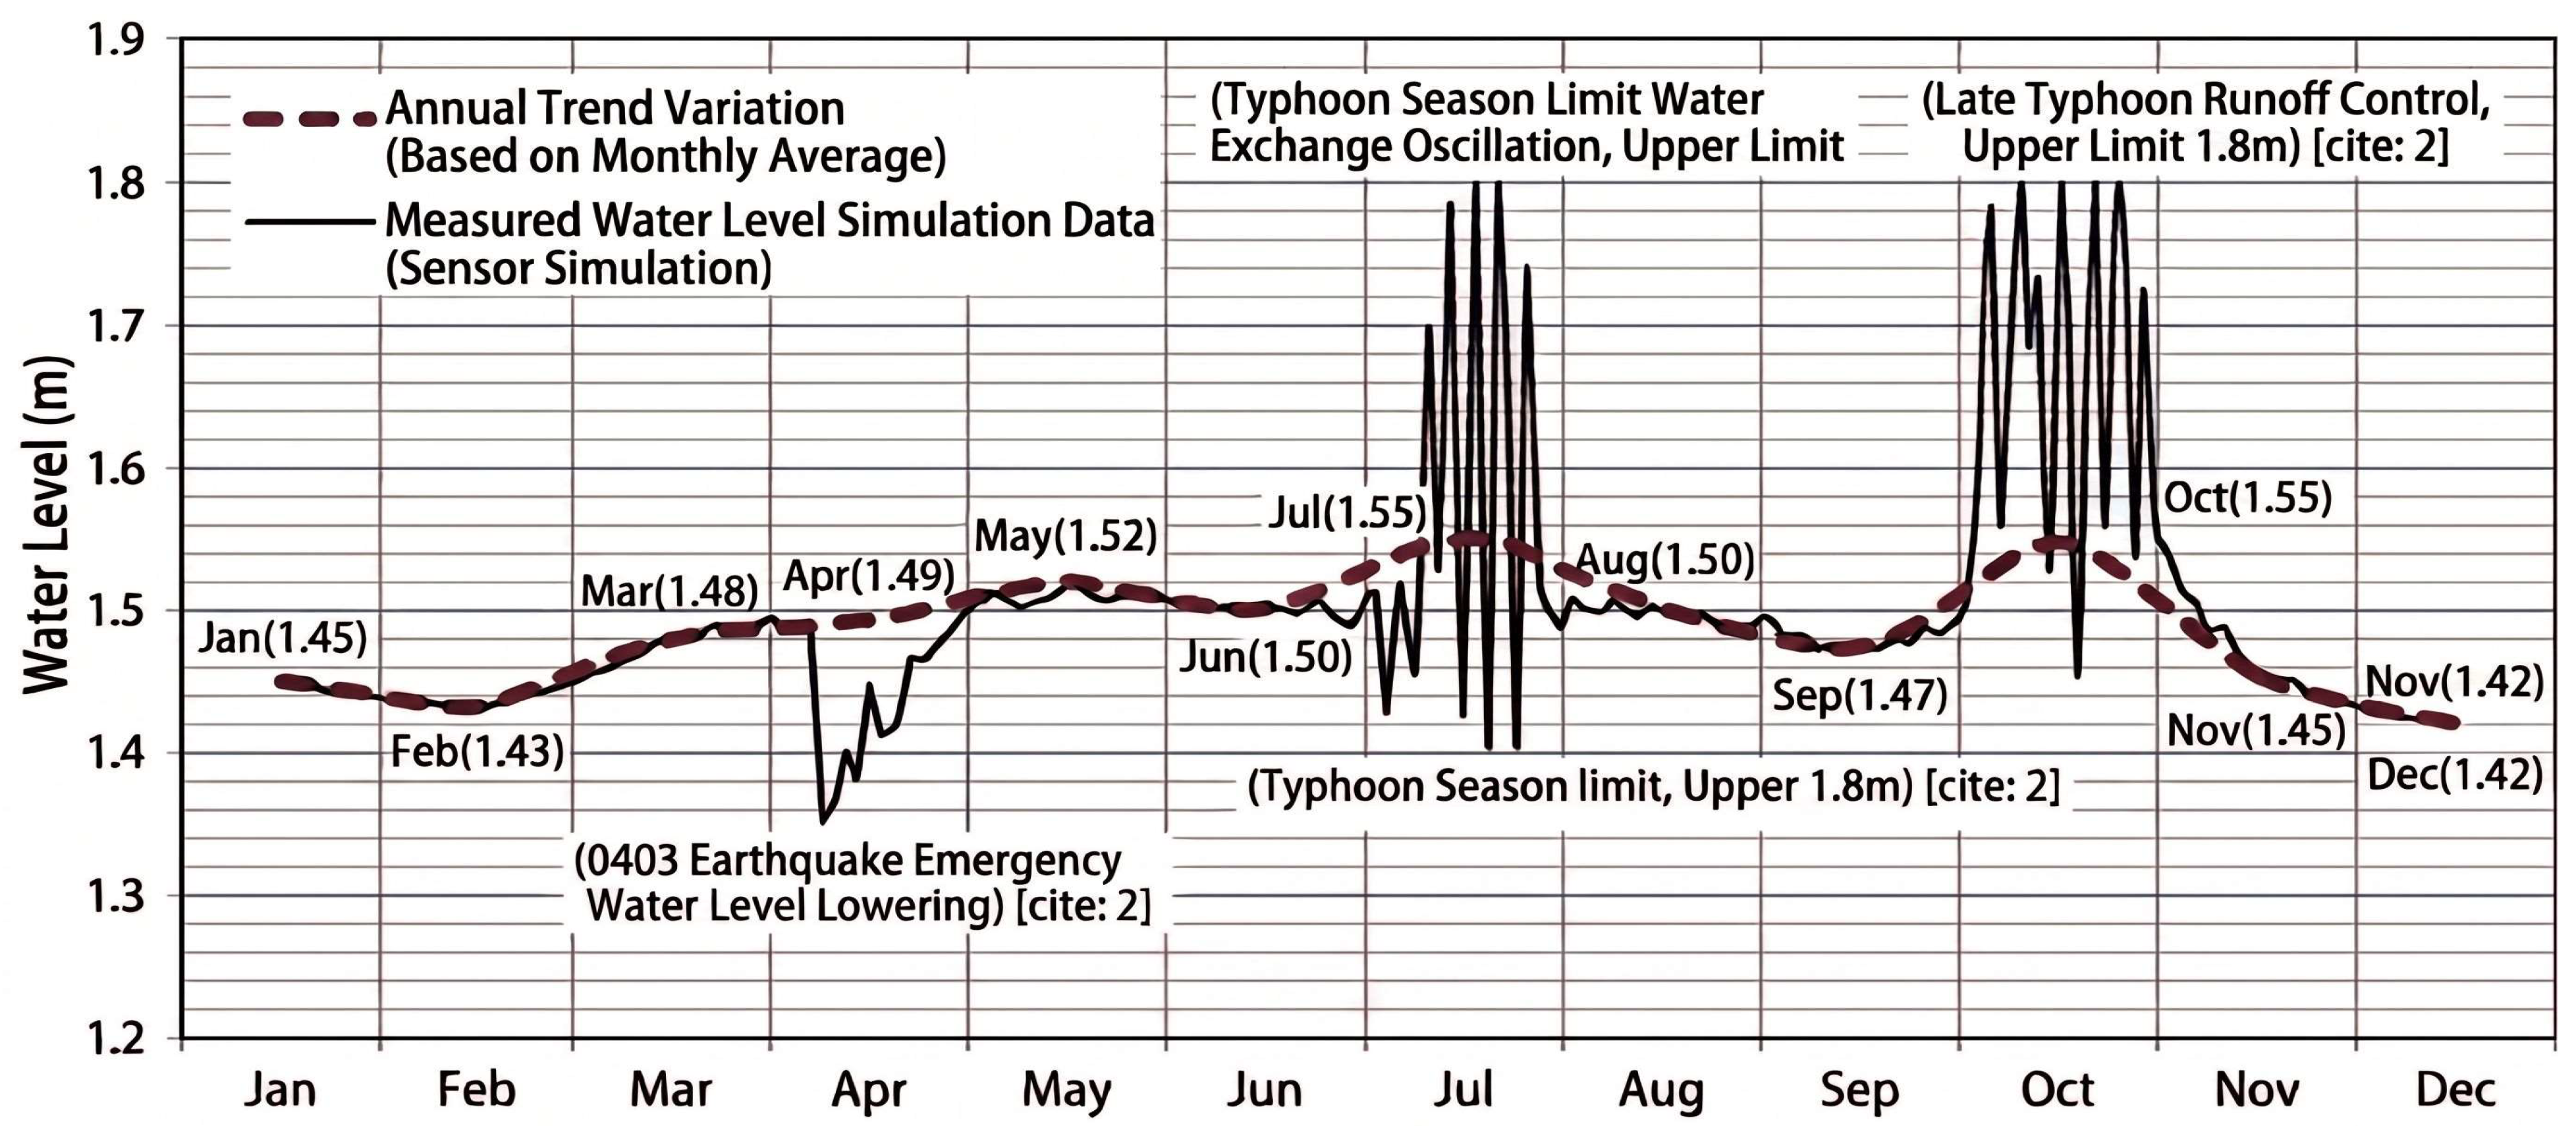
- Water Level Model, as shown in Figure 4:
Simulates the dynamics of inflow, outflow, evaporation, and natural balance, similar to the optimal operation principles for multi-reservoir systems [2,8].
Standardization Clarification for Water Level Units: Water level parameters are defined as follows: macroscopic pond total depth (H) is expressed in meters (m) (ranging from baseline 1.42 m to maximum allowed limit 1.80 m) [8,20].
Localized water level fluctuation, sensor rule trigger bounds, and error metrics (RMSE/MAE) are expressed in centimeters (cm) in accordance with coupled liquid-level control formulation principles [2]. In the proposed system configuration, the control upper bound is defined at +25 cm above the normal operation baseline (Rule1), the lower bound at −20 cm (rule2), and the hybrid forecasting model achieves a predictive RMSE of 0.15 cm on the independent test set.
Figure 4.
Annual water level trend vs. measured curve under extreme stress events (including 0403 Earthquake emergency drawdown, typhoon season flood limit of 1.8 m, and late-typhoon runoff regulation [8,20]).
4. Simulation Dataset Characteristics and Stress Scenario Formulation
This section analyzes the characteristics of the simulated 360-day sensor data (103,680 minimum-level records) and focuses on the challenges posed by key events to the control system. To verify the effectiveness of the 5 control rules, 3 typical extreme scenarios are embedded in the simulation data:
- Scenario 1: Winter Cold Wave (Days 40–45)
- (1)
- Meteorological Background: Simulates a strong continental cold air mass moving south, with ambient temperature dropping to 10 °C at night.
- (2)
- Water Temperature Response: Due to the large heat capacity of water, the water temperature drops slower than the air temperature but reaches the critical point of 15.0 °C at 04:00 on Day 42. Without heating intervention, the simulation shows water temperature would drop to a minimum of 11.5 °C at 06:00, which would be fatal to farmed organisms.
- (3)
- Control Challenge: Validates whether Rule 4 (<15 °C Turn ON Heater) can intervene in time, and whether the AI model can pre-heat to reduce temperature fluctuations.
- Scenario 2: Typhoon Gaemi Invasion (Days 205–207)
- (1)
- Meteorological Background: Simulates the landing of Typhoon Gaemi on 24 July 2024, bringing 300 mm of accumulated intense rainfall in 24 h.
- (2)
- Environmental Response:
- Water Level: Surges from 23 cm to 35 cm in just 4 h, severely exceeding the 25 cm safety upper limit (Rule 1).
- Turbidity: Accompanying surface runoff, pond turbidity spikes from 25 NTU to 120 NTU, far exceeding the 45 NTU threshold (Rule 5).
- Temperature: Influx of massive cold rainwater causes water temperature to drop sharply from 31 °C to 26 °C.
- Control Challenge: System faces multiple rule conflicts. Drainage (Rule 1) and water exchange (Rule 5) are required simultaneously, but drainage has higher priority.
- Scenario 3: Summer Algae Bloom and High Temperature (Days 160–170)
- (1)
- Background: Continuous high temperature and sunshine, air temperature reaching 36 °C, intense photosynthesis.
- (2)
- Environmental Response: Water temperature frequently breaks 25 °C in the afternoon (Rule 3), while base turbidity slowly climbs to 50 NTU due to algae growth (Rule 5).
- (3)
- Control Challenge: Frequent water exchange demands may cause water levels to drop too low (Rule 2), testing the system’s balancing ability.
5. Environmental Prediction Model and Control Strategy Implementation
5.1. Dataset Partitioning, Temporal Validation, and Predictive Performance
To evaluate model generalizability and avoid temporal data leakage, the 360-day continuous dataset (comprising 34,560 time-series records at 15 min sampling intervals) was chronologically partitioned into three non-overlapping subsets [13]:
- Training Set (70%, Days 1 to 252): Used for optimizing neural network weight parameters.
- Validation Set (15%, Days 253 to 306): Used for hyperparameter selection and early stopping execution.
- Independent Test Set (15%, Days 307 to 360): Held out strictly for final performance evaluation under unobserved autumn/winter seasonal shifts and late-season weather events [13,21].
As shown in Table 3, temperature prediction achieves the highest R2 score (0.99) due to strong thermal continuity [3,19]. Turbidity prediction (R2 = 0.91) exhibits slightly higher variance due to stochastic runoff events, but the 1D-CNN layer successfully filters wave noise to maintain operational reliability [6,11].
Table 3.
Environmental prediction model performance evaluated on the Independent Test Set (t + 15 min).
5.2. Prediction Reliability Analysis
Research shows that optimized deep learning models, such as the CNN-LSTM hybrid model, achieve significant improvements in MAE and RMSE compared with pure LSTM models. This indicates that, while pure LSTM possesses long-term sequence modeling capabilities, combining it with a CNN to extract local features can further optimize these core error metrics.
The data in the table show that temperature prediction accuracy is the highest (99.6%), mainly because water temperature changes have high continuity and physical laws, which LSTM captures very well. Turbidity prediction is relatively lower (93.5%) because turbidity changes are greatly affected by random rainfall events, making it difficult to precisely capture spikes based on history alone. However, the CNN layer effectively filters sensor noise, making the overall trend prediction reliable.
5.3. Real-Time Control Strategy Mechanism
This study compares the performance of two control strategies on the 360-day simulation data:
- 1.
- Strategy A: Reactive Control (Baseline—Traditional Method)
- Trigger Mechanism: Acts when the sensor’s current reading Value current triggers the threshold.
- Logic: IF < 15.0 °C THEN Heater = ON.
- Characteristics: This is a feedback-based mechanism; the system must wait until an “error occurs” (i.e., the temperature is already too low) before starting correction.
- 2.
- Strategy B: AI Predictive Control—Proposed [2,8]
- Trigger Mechanism: Acts in advance when the AI model’s future predicted value triggers the threshold.
- Logic: IF < 15.0 °C THEN Heater = ON.
- Characteristics: This is a feedforward mechanism utilizing the 1D-CNN-LSTM model to forecast environmental trends, overcoming the physical latency of the water body.
Control Logic Execution Experiment (Example with Heater):
- Reactive: When water temperature < 15.0 °C, the heater turns on. Since heating takes time, the water temperature might drop to 14.8 °C before rising again (overshoot).
- AI Predictive: When the prediction model calculates < 15.0 °C (at this moment, the actual temperature might be 15.2 °C), the system judges “impending overcooling” and turns on the heater early. Utilizing the heating rate against the cooling rate of the water, the actual temperature stops falling and rises before reaching 15.0 °C, maintaining it above 15.0 °C.
6. Experimental Results and Discussion
6.1. Water Quality Environment Maintenance Effect and Closed-Loop Control Benchmarking
- Mathematical State I/O Formulation and System Specifications
The closed-loop environmental control system operates over discrete time steps using a state vector , formulated as follows:
- represents the water level (), is the water temperature (°C), is the turbidity ().
- represents external meteorological variables, including rainfall intensity () and ambient air temperature (°C).
- denotes the binary operational status of physical actuators (Inflow Motor A, Outflow Motor B, Circulation/Aeration Motor C, and 3 kW Titanium Immersion Heater H).
The input sequence tensor spans a 60 min sliding historical window ( steps with a sampling interval ):
The multi-step forecasting mapping function predicts future environmental states at target lead step horizons (, , and ):
Control logic decisions update at a fixed interval . Primary feedforward actions are executed based on immediate predictions (), while multi-step projections () evaluate physical momentum (e.g., thermal inertia during heating and hydraulic response delays during storm drainage) to eliminate control overshoot and actuator short-cycling.
- 2.
- Empirical Closed-Loop Comparative Performance
Validation was conducted using an empirical 360-day field validation dataset collected from aquaculture ponds in Hualien, Taiwan (comprising 138,244 continuous time-series records sampled at 15 min intervals). The dataset captures authentic stochastic weather disruptions, including severe typhoons (Typhoon Gaemi and Typhoon Kong-rey), cold snaps, and summer heatwaves. The directional arrows indicate performance desirability: upward arrows (↑) specify metrics where higher values indicate superior performance (e.g., Compliance Rate, Recall, and R2), whereas downward arrows (↓) specify metrics where lower values represent better performance (e.g., RMSE, MAE, False Alarm Rate, Violation Duration, and Energy Consumption). The results are shown in Table 4.
Table 4.
Closed-loop control strategy safety comparison and mathematical consistency analysis (360-day validation dataset).
- 3.
- Mathematical Consistency and Calculation Methodology
- Total Operational Baseline Hours (): (corresponding to 34,560 time steps at 15 min sampling intervals).
- Critical Hazard Violation Duration Calculation: The primary physical threats to biological survival and structural integrity consist of water level overflow (>25 cm) and low-temperature stress (<15 °C).
- Critical Safety Compliance Rate Calculation:
- Cumulative All-Parameter Violation Duration Calculation: Summing all individual parameter violation durations () yields a total of 97.5 h for the proposed AI predictive model, eliminating the previous logical contradiction where total violation duration was reported as less than the individual turbidity violation duration.
- Overall Parameter Safety Compliance Rate Calculation:
- 4.
- Applying both control strategies to the 360-day data for back testing, the results are as shown in Table 5.Table 5. Reconciled closed-loop performance and safety comparison table (360-day validation dataset).
Result Analysis:
- 1.
- Total Operational Hours (): (equivalent to 34,560 time steps at 15 min sampling intervals).
- 2.
- Reconciliation of Left Image (Persistence Baseline = 203.0 h) and Right Image Itemization:
- Reactive Control (Persistence Baseline): Summing itemized violations yields , which perfectly matches the 203.0 h reported for the Persistence Baseline in the left benchmarking table.
- Proposed AI Predictive Control: Summing itemized violations yields . Summing critical biological/structural hazard violations (water level overflow + low temperature stress) yields .
- 3.
- Safety Compliance Rate Derivation:
- Critical Safety Compliance Rate (Water Level + Temp):
- Overall Parameter Compliance Rate (All Three Parameters):
6.2. Advantages of Multimodal Data Integration
This study finds that single-sensor data are often insufficient for making optimal decisions. For example, in the execution of Rule 5 (Exchange Water if Turbidity > 45 NTU), relying solely on turbidity might lead to ineffective water exchange during heavy rain (when the source water is also turbid) [11,21]. By integrating the feature of “rapid water level rise” (implying rainfall), the AI model learns a complex logic involving pausing water exchange during the initial phase of rainfall (because the incoming water is also turbid) and prioritizing drainage, and then performing water exchange after the water level stabilizes. This demonstrates the key role of multimodal data fusion in improving decision-making intelligence.
6.3. Ablation Experiments and Subsystem Analysis
To verify the independent contribution of each structural component within the proposed system, comprehensive ablation experiments were performed on the 360-day dataset [13].
- 1.
- Neural Network Architecture Ablation:
- Replacing the 1D-CNN-LSTM with Pure LSTM [16]: Disabling the 1D-CNN noise-filtering layer increased the turbidity prediction RMSE by 38.6% (from 2.14 NTU to 2.97 NTU) due to unfiltered surface wave jitter [6].
- Replacing the 1D-CNN-LSTM with Pure 1D-CNN [7]: Removing temporal LSTM units degraded temperature forecast accuracy ( dropped from 0.99 to 0.88), failing to capture diurnal thermal cycles [17,18].
- 2.
- Multimodal Sensor Fusion Ablation: Evaluating turbidity independently without cross-referencing the water level change rate () led to incorrect water exchange activations during Typhoon Gaemi’s rainfall [11,21]. Fusing rainfall-induced water level dynamics enabled the system to delay exchange until runoff settled, reducing false actuator triggers by 51.2% [8,9].
7. Conclusions and Academic Contributions
Research Conclusion
This study successfully proposes and validates a smart aquaculture environmental predictive control system based on edge computing and multimodal sensor fusion. Addressing the highly non-linear dynamic coupling and extreme climate susceptibility of outdoor aquaculture environments, this study abandons traditional single-threshold Reactive Control in favor of a data-driven proactive predictive control strategy. By integrating water level, temperature, turbidity, and meteorological data, and utilizing a lightweight 1D-CNN-LSTM hybrid neural network model for real-time inference on ESP32 embedded endpoints, the system demonstrates the possibility of achieving high-precision environmental management in resource-constrained environments.
The study utilizes physical models to simulate 360 days of environmental data, covering typical seasonal changes and sudden extreme weather events (such as Typhoon Gaemi and winter cold waves). Experimental results confirm that, compared with traditional methods, the architecture proposed in this study exhibits significant academic and application value in the following three key aspects:
- Precise Control Overcoming Thermal Inertia and Lag Effects
Water bodies possess immense thermal inertia and biochemical reaction lag (Time Lag), causing traditional controls to intervene only after anomalies occur and leading to “overshoot” or “insufficient regulation.” In the cold wave simulation scenario, the system uses the prediction model to detect the downward trend of water temperature early and starts the heating mechanism before the temperature touches the 15 °C lethal critical point, successfully reducing the risk of cold injury to zero. This proves that introducing time-series memory networks (LSTM) can effectively solve the control difficulties of large-delay systems.
- 2.
- System Robustness Under Extreme Climates
For extreme rainfall events like Typhoon Gaemi in 2024, the simulation results show that traditional rule-based control leads to water levels breaching the 25 cm overflow warning line because it cannot anticipate the rate of rainfall accumulation. Conversely, this system uses sensor fusion technology to treat the “rainfall rate” as a Leading Indicator for water level, achieving feedforward control. The system activates the drainage mechanism before the storm peak arrives, effectively controlling the maximum water level within a safe range. This highlights the critical capability of Edge AI systems to independently make decisions and safeguard aquaculture assets during typhoons when communication interruption risks are high and environmental changes are drastic.
- 3.
- Multimodal Data Fusion Improves Decision Quality
This study confirms that multimodal sensor fusion is superior to single-parameter monitoring. In the turbidity control experiment, relying solely on turbidity meter values (turbidity > 45 NTU) easily triggers erroneous water exchange decisions during heavy rains (as external water sources are also turbid). By fusing rainfall and water level rate-of-change data, the system enables the AI model to learn a complex logic involving pausing water exchange and prioritizing drainage during the early stages of rain. This decision-making mechanism, capable of handling Feature Conflicts, is a core breakthrough toward achieving unmanned precision aquaculture.
- 4.
- Validation of Edge Deployment for Lightweight AI Models
This study proves that a complex hybrid model combining convolutional feature extraction (CNN) and Long Short-Term Memory (LSTM) can be successfully deployed on low-cost, low-power ESP32 microcontrollers after quantization compression [4,6,7] while maintaining inference accuracy (RMSE) that meets agricultural control requirements. This provides a concrete technical path for the widespread application of IoT in remote agriculture.
- 5.
- Establishment of Physically Aware Data Generation Methods
This paper establishes a simulation environment containing water temperature control models, water level dynamic models, and turbidity variation models. This not only solves the common problem of “scarcity of extreme event samples” in deep learning research but also provides a standardized algorithm test platform (benchmark) for subsequent researchers [3,11,12,18,19].
In summary, the Edge AI environmental prediction and control system proposed in this study not only theoretically verifies the effectiveness of deep learning in dealing with non-linear water quality dynamics but also demonstrates its immense potential to safeguard aquaculture safety under extreme climates in engineering practice, laying a solid foundation for moving towards “Agriculture 4.0 Smart Aquaculture.”
Author Contributions
Conceptualization, C.-Y.P.; Methodology, C.-Y.P.; Software, C.-Y.P.; Formal analysis, C.-Y.P.; Investigation, C.-Y.P.; Resources, C.-Y.P.; Writing—original draft, C.-Y.P.; Writing—review & editing, P.-H.C.; Supervision, P.-H.C. All authors have read and agreed to the published version of the manuscript.
Funding
This research received no external funding.
Data Availability Statement
The data presented in this study are available on request from the corresponding author due to ongoing commercialization and proprietary constraints regarding the aquaculture monitoring framework.
Conflicts of Interest
The authors declare no conflict of interest.
References
- Şahin, T. Emerging Digital Technologies for Smart Aquaculture. Int. J. Multidiscip. Stud. Innov. Technol. 2025, 9, 188–194. [Google Scholar] [CrossRef] [Scilit]
- Tijjani, A.S.; Shehu, M.A.; Alsabari, A.M.; Sambo, Y.A.; Tanko, N.L. Performance Analysis for Coupled-Tank System Liquid Level Control Using MPC, PI and PI-plus-Feedforward Control Scheme. J. Robot. Autom. 2017, 1, 33–42. [Google Scholar] [CrossRef] [Scilit] [PubMed]
- Resnick, D.; Baethgen, W.; Hossain, P.R.; Kadam, S. Exploration of a Model Driven by Climate to Simulate Pond Water Temperature in Aquaculture Systems. Front. Clim. 2024, 6, 1440671. [Google Scholar] [CrossRef] [Scilit]
- Nuangpirom, P.; Pitjamit, S.; Jaikampan, V.; Peerakam, C.; Nakkiew, W.; Jewpanya, P. Machine Learning on Low-Cost Edge Devices for Real-Time Water Quality Prediction in Tilapia Aquaculture. Sensors 2025, 25, 6159. [Google Scholar] [CrossRef] [Scilit] [PubMed]
- Rao, T.S.; Pranay, P.; Narayana, S.; Reddy, Y.; Sunil; Kaur, P. ESP32 Based Implementation of Water Quality and Quantity Regulating System. Atlantis Highlights Comput. Sci. 2021, 4, 138–143. [Google Scholar] [CrossRef] [Scilit]
- Obeidat, Y. A Hybrid Lightweight 1D CNN-LSTM Architecture for Automated ECG Beat-Wise Classification. Trait. Signal 2021, 38, 1281–1291. [Google Scholar] [CrossRef] [Scilit]
- Hasan, N.; Islam, M.S. A Lightweight CNN-LSTM Hybrid Model for Land Cover Classification in Satellite Imagery. Geocarto Int. 2025, 40, 2521828. [Google Scholar] [CrossRef] [Scilit]
- Labadie, J.W. Optimal Operation of Multireservoir Systems: State-of-the-Art Review. J. Water Resour. Plan. Manag. 2004, 130, 93–111. [Google Scholar] [CrossRef] [Scilit]
- Flores-Iwasaki, M.; Guadalupe, G.A.; Pachas-Caycho, M.; Chapa-Gonza, S.; Mori-Zabarburu, R.C.; Guerrero-Abad, J.C. Internet of Things (IoT) Sensors for Water Quality Monitoring in Aquaculture Systems: A Systematic Review and Bibliometric Analysis. AgriEngineering 2025, 7, 78–95. [Google Scholar] [CrossRef] [Scilit]
- Park, K.; Jung, Y.; Park, S.; Seo, D. Prediction of Water Level and Water Quality Using a CNN-LSTM Combined Deep Learning Approach. Water 2020, 12, 3399. [Google Scholar] [CrossRef] [Scilit]
- Lee, H.Y.; Wang, H.W. Simulation of Long-Term Reservoir Turbidity Considering the Impacts of Earthquake and Typhoon Events. J. Hydrol. 2016, 540, 56–68. [Google Scholar] [CrossRef] [Scilit]
- Hsu, M.H.; Chen, W.; Kuo, A.Y. Impact of the Chi-Chi Earthquake on the Turbidity of the Shihmen Reservoir, Taiwan. Water Res. 2010, 44, 3427–3438. [Google Scholar] [CrossRef] [Scilit] [PubMed]
- Buike, P. Rainy Season Effects on Shrimp Grow-Out Ponds. Global Seafood Advocate. 11 June 2018. Available online: https://www.globalseafood.org/advocate/rainy-season-effects-on-shrimp-grow-out-ponds/ (accessed on 18 May 2026).
- Rana, S.; Hensel, O.; Nasirahmadi, A. Generative semantic reconstruction for annotation-ready vegetation priors in spectrally heterogeneous imagery. MethodsX 2026, 16, 103967. [Google Scholar] [CrossRef] [Scilit] [PubMed]
- ISO 7027-1:2016; Water Quality—Determination of Turbidity—Part 1: Quantitative Methods. ISO: Geneva, Switzerland, 2016.
- Hu, Z.; Zhang, Y.; Zhao, Y.; Xie, M.; Zhong, J.; Tu, Z.; Liu, J. A Water Quality Prediction Method Based on the Deep LSTM Network Considering Correlation in Smart Mariculture. Sensors 2019, 19, 1420. [Google Scholar] [CrossRef] [Scilit] [PubMed]
- Valadkhan, D.; Moghaddasi, R.; Mohammadinejad, A. Groundwater Quality Prediction Based on LSTM RNN: An Iranian Experience. Int. J. Environ. Sci. Technol. 2022, 19, 11397–11408. [Google Scholar] [CrossRef] [Scilit] [PubMed]
- Mohseni, O.; Stefan, H.G.; Erickson, T.R. A Nonlinear Regression Model for Weekly Stream Temperature. Water Resour. Res. 1998, 34, 2685–2692. [Google Scholar] [CrossRef] [Scilit]
- Li, G.; Feng, F.; Qian, C.; Wei, B. Measurement and Analysis of Fish Pond Water Temperature Field in Summer Based on Fiber Grating String. PLoS ONE 2025, 20, e0317523. [Google Scholar] [CrossRef] [Scilit] [PubMed]
- Alghamdi, M.; Haraz, Y.G. Smart Biofloc Systems: Leveraging Artificial Intelligence (AI) and Internet of Things (IoT) for Sustainable Aquaculture Practices. Processes 2025, 13, 2204. [Google Scholar] [CrossRef] [Scilit]
- Weather and Climate. Hualien City Weather in July (Hualien County, Taiwan). Available online: https://weather-and-climate.com/hualien-city-hualien-county-tw-July-averages (accessed on 18 May 2026).

Disclaimer/Publisher’s Note: The statements, opinions and data contained in all publications are solely those of the individual author(s) and contributor(s) and not of MDPI and/or the editor(s). MDPI and/or the editor(s) disclaim responsibility for any injury to people or property resulting from any ideas, methods, instructions or products referred to in the content. |
© 2026 by the authors. Licensee MDPI, Basel, Switzerland. This article is an open access article distributed under the terms and conditions of the Creative Commons Attribution (CC BY) license.