


Abstract
Reliable fabric inspection is difficult to automate because production-line imagery differs substantially from the controlled samples used by many public benchmarks. This paper introduces LUSITANOv2, a high-resolution fabric-defect dataset collected at an active textile inspection station with an industrial line-scan camera and directional illumination. It contains 25,120 native images, including both defect-containing and defect-free fabric, together with 18,557 class-agnostic bounding boxes. We establish supervised baselines with YOLOv12n, Faster R-CNN, and RT-DETR-L and evaluate nine one-class anomaly-detection methods. RT-DETR-L achieves the highest mAP@0.5 in the matched detector comparison, reaching 0.610, compared with 0.597 for Faster R-CNN and 0.592 for YOLOv12n. In a separate controlled YOLOv12n resolution study, retaining more native weave detail improves detection performance, reaching 0.598 mAP@0.5 at the highest tested resolution. A post hoc analysis finds no simple recall penalty for defects that touch the image boundary. Matched zero-shot experiments across LUSITANOv2, TILDA, and ZJU-Leaper reveal substantial cross-dataset degradation despite stronger in-domain results. LUSITANOv2 provides a realistic benchmark for localized defect detection, one-class anomaly detection, resolution-sensitive line-scan processing, and future work on transfer to active textile-production settings.
1. Introduction
The global textile industry is a cornerstone of modern manufacturing and an important driver of the world’s economy, employing millions of people worldwide. Quality control is essential to its success and profitability. The perceived quality of a textile product is closely linked to its aesthetic and structural integrity, and even minor imperfections can lead to devaluation, material waste, and reduced consumer confidence. Fabric defects, including slubs, neps, holes, stains, and mispicks, must therefore be identified and removed from the production pipeline [1].
Traditionally, fabric inspection has relied on trained human inspectors who scan large fabric surfaces under specialized lighting conditions. Although this process has supported the industry for many years, it has important limitations. It is labor-intensive, time-consuming, repetitive, and expensive, which makes it a bottleneck in high-throughput manufacturing environments [2]. The process is also subjective and susceptible to human error. Inspection accuracy can be affected by fatigue, inattention, and differences in individual skill [3]. These difficulties are compounded by the wide variety of possible defects and by the fact that manufacturers often apply different standards when deciding what counts as a defect. There is therefore a strong need for reliable and efficient automated inspection methods [4].
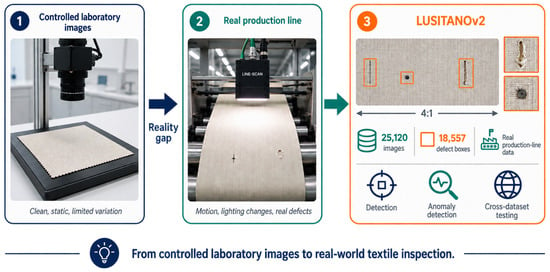
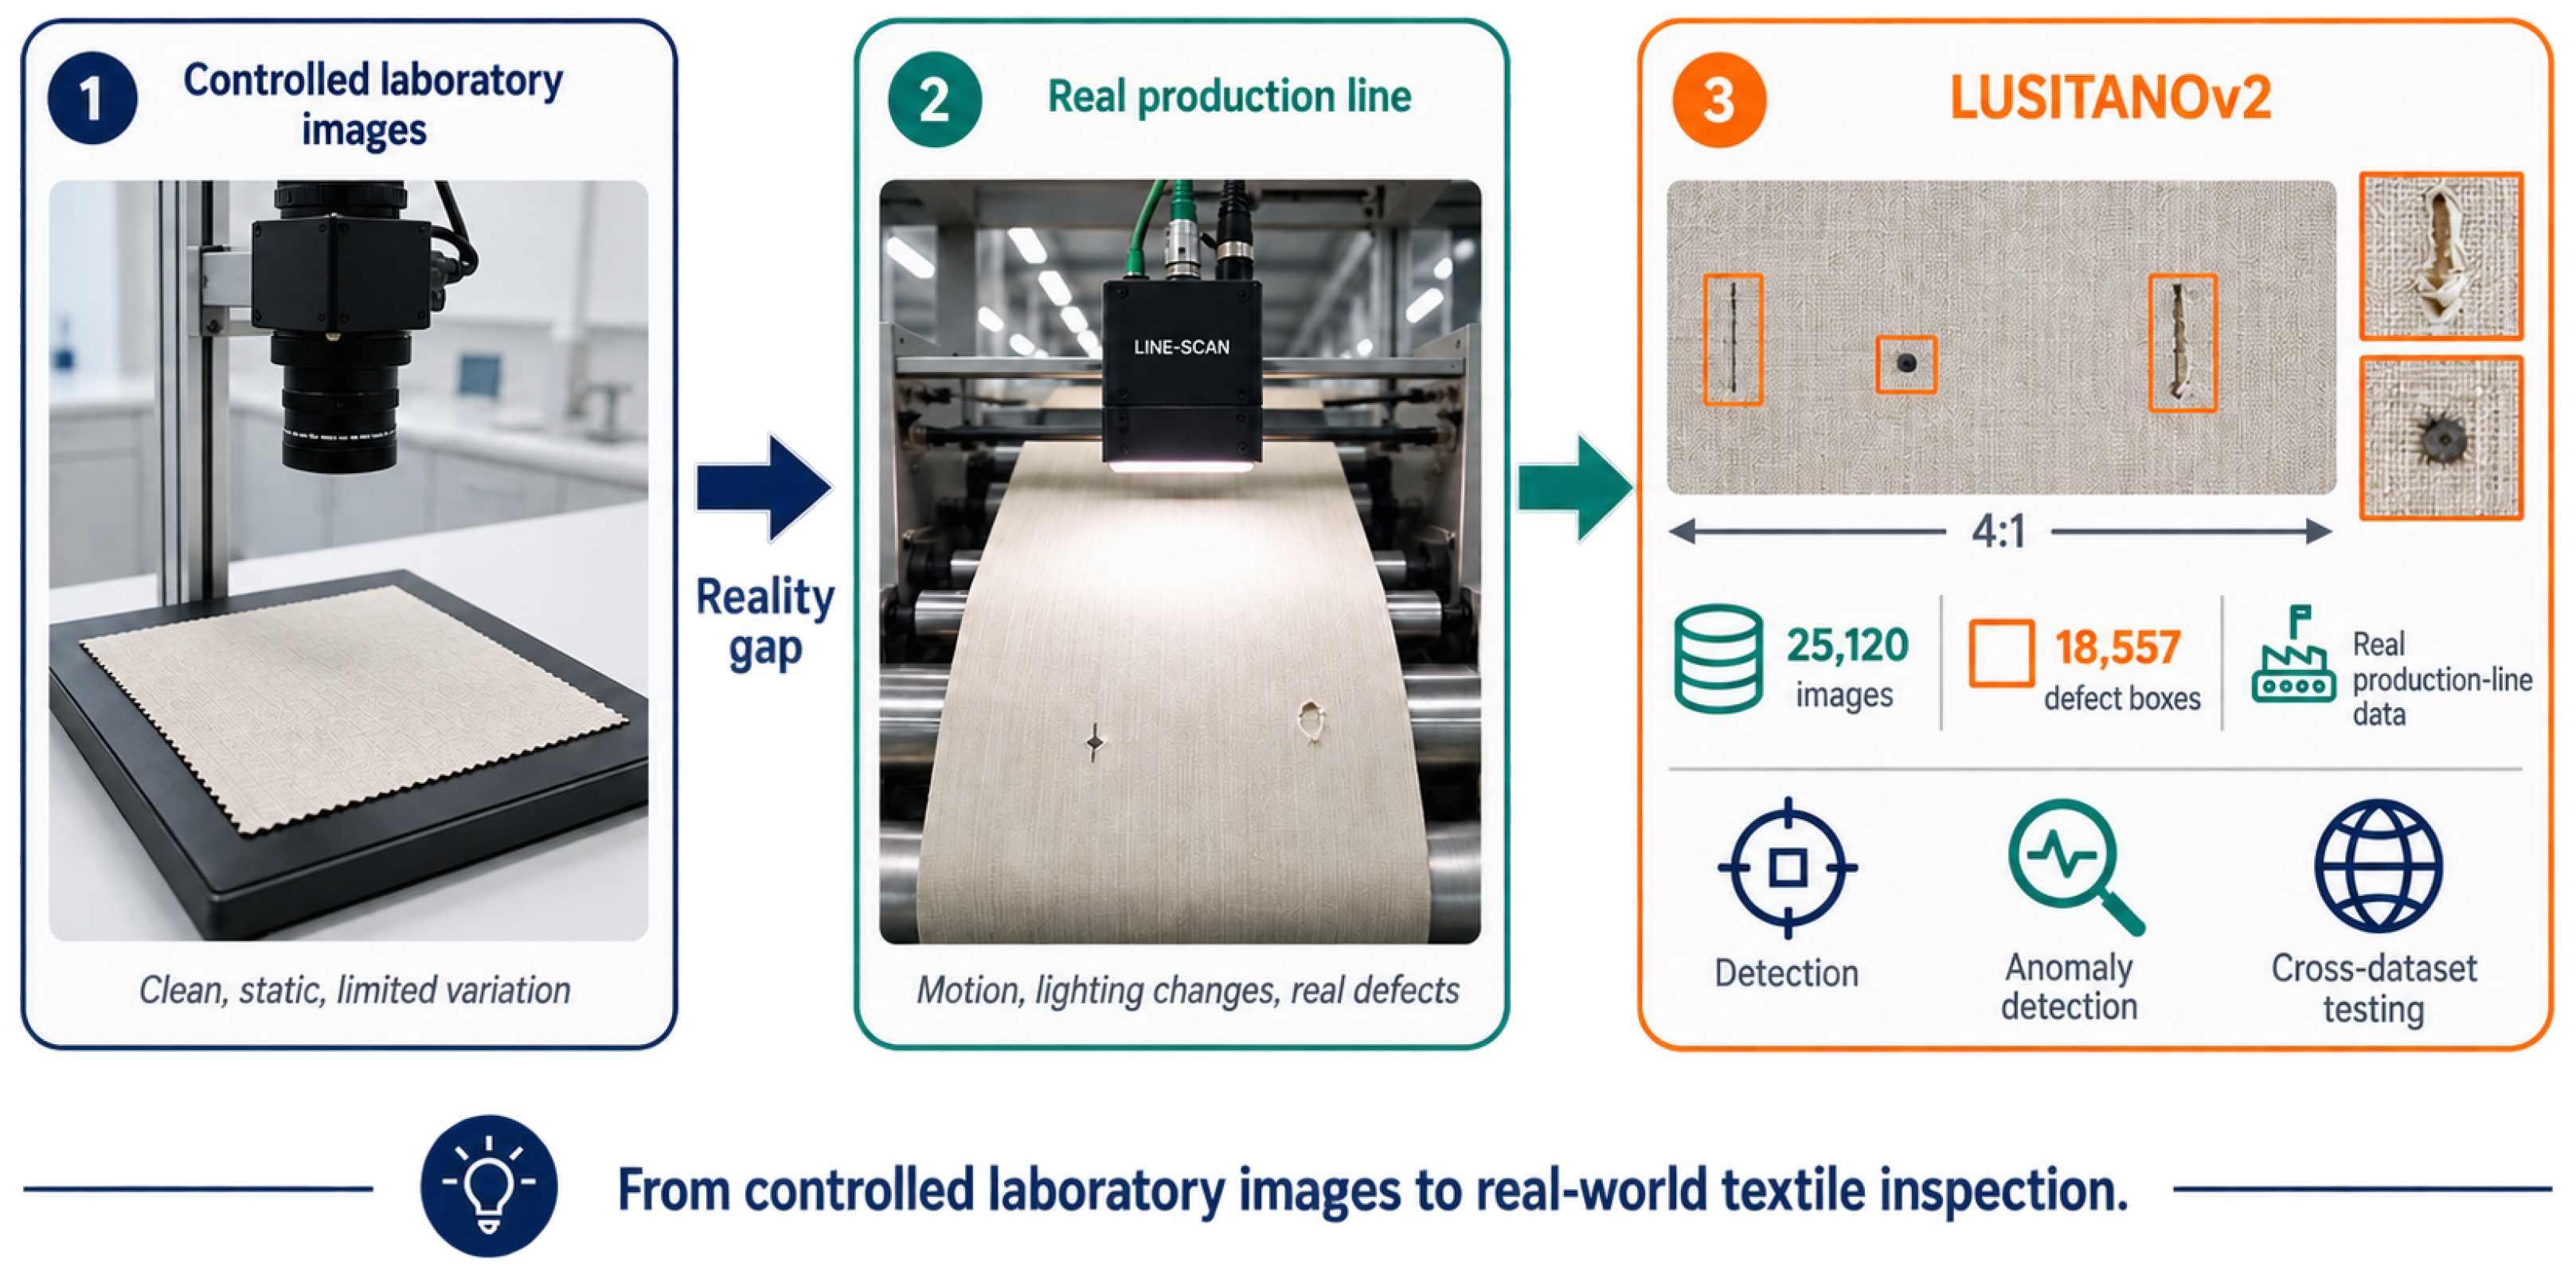
Figure 1 summarizes the motivation for LUSITANOv2 by illustrating the gap between controlled laboratory imagery and real production-line textile inspection.
Figure 1.
Conceptual overview of the motivation behind LUSITANOv2. Controlled laboratory imagery is typically acquired under clean and static conditions, whereas active textile production introduces motion, acquisition variability, and naturally occurring defects. LUSITANOv2 captures this production setting with 25,120 images and 18,557 class-agnostic defect annotations, supporting supervised detection, one-class anomaly detection, and cross-dataset evaluation.
Computer vision has long offered a promising route to automated fabric inspection. Early work focused on classical machine-vision techniques that can be broadly grouped into statistical, spectral, structural, and model-based approaches. Statistical methods, including gray-level co-occurrence matrices [5] and local binary patterns [6], characterize texture properties and identify departures from a non-defective pattern. Spectral approaches use Fourier analysis [7], wavelet transforms [8], or Gabor filters [9] to capture periodic and directional structure in textile weaves. Structural methods represent a fabric as a collection of texture primitives and identify defects where that organization is disturbed [10]. Model-based methods, including Markov random fields, seek to model the expected texture and detect anomalous regions [11]. These methods established important foundations, but their deployment can require substantial domain knowledge and their performance may not generalize well across fabrics and acquisition conditions [12].
The last decade has brought a major shift in computer vision through the success of deep learning. Convolutional neural networks have achieved strong performance across a wide range of visual tasks [13]. In fabric inspection, researchers have applied classification models to identify defective patches, object detectors such as Faster R-CNN and YOLO to localize defects with bounding boxes [14,15], and semantic-segmentation models such as U-Net to estimate pixel-level defect outlines [16]. These methods offer a flexible basis for building practical inspection systems.
Their effectiveness, however, depends on large amounts of high-quality annotated data [17]. This requirement remains a major obstacle to broader adoption, particularly when models are expected to work across different fabrics, lighting conditions, and acquisition systems. Although several public datasets are available, their scope and collection procedures impose important limitations [17].
Public datasets have been indispensable to progress, but their acquisition conditions and annotation formats differ substantially. TILDA and HKU-Fabric were influential early resources [18,19], while ZJU-Leaper provides a larger modern benchmark [20]. Their documented laboratory-oriented settings do not capture every source of variation present on an operating textile line, including fabric motion, changing material programs, illumination effects, and line-scan geometry. As a result, strong performance on a laboratory dataset should not automatically be treated as evidence that a model will work reliably in production. These differences motivate explicit cross-dataset evaluation.
The image-acquisition hardware is a particularly important source of domain shift. The established fabric-defect benchmarks considered here, including TILDA and ZJU-Leaper, rely on area-scan cameras or flatbed scanners. These settings differ from continuous line-scan inspection of a moving fabric web [21]. A line-scan system captures the fabric as a sequence of narrow strips while the material is moving, which changes the image geometry and exposes the inspection process to production conditions such as motion, illumination variation, and changing fabric programs. Public line-scan resources such as AFID [22] and RAW-FABRID [23] help address this gap, but the locally available references do not document all of the properties needed for a direct benchmark comparison. This motivates a dataset whose acquisition setting and annotations are described explicitly.
To address this gap, we introduce LUSITANOv2. It extends the earlier LUSITANO dataset [17] with 25,120 high-resolution line-scan images and 18,557 localized defect instances collected over six months at an operational inspection station. The benchmark combines real production-line acquisition, native 4:1 imagery, class-agnostic multi-instance bounding boxes, and defect-free images for one-class evaluation. The dataset is not intended to claim universal representativeness. Its purpose is to provide a realistic and reproducible acquisition setting whose characteristics are explicit and can be measured.
This paper provides a detailed description of the LUSITANOv2 dataset, including its collection methodology, annotation process, and statistical properties. We present a comprehensive set of benchmarks using supervised detectors and one-class anomaly-detection methods, establishing reference results for future work. Complementing the detector comparison, we study the effect of letterboxed input resolution with a standardized YOLOv12n model in order to examine the practical consequences of the native 4:1 image geometry. We also quantify zero-shot transfer among LUSITANOv2, TILDA [18], and ZJU-Leaper [20] under a shared detector recipe. The transfer experiment is not a domain-adaptation method; it measures the raw gap that any future adaptation algorithm would need to address.
To address this gap, we introduce LUSITANOv2. It extends the earlier LUSITANO dataset with 25,120 high-resolution line-scan images and 18,557 localized defect instances collected over six months at an operational inspection station. The benchmark combines real production-line acquisition, native 4:1 imagery, class-agnostic multi-instance bounding boxes, and defect-free images for one-class evaluation. The dataset is not intended to claim universal representativeness. Its purpose is to provide a realistic and reproducible acquisition setting whose characteristics are explicit and can be measured.
The remainder of the paper is organized as follows. Section 2 reviews related work on fabric-defect detection and existing datasets. Section 3 describes the LUSITANOv2 acquisition, annotation protocol, and dataset characteristics. Section 4 presents the experimental setup and evaluation protocols. Section 5 reports and analyzes the experimental results. Section 6 discusses the main findings, limitations, and future research directions. Section 7 concludes the paper.
2. Related Work
2.1. Fabric Defect Detection
Fabric-defect detection methods are commonly grouped into classical texture-analysis techniques and learning-based approaches [24,25]. Both remain relevant. Classical methods make their assumptions about regular texture explicit and can be effective when the weave, illumination, and image geometry are stable. Learning-based methods can represent more complex appearance variation, but require appropriate training data and careful evaluation. This distinction is important for LUSITANOv2 because the dataset combines repetitive textile structure with the variation of an active production line.
Classical Texture Analysis: Classical methods describe fabric texture through hand-crafted features and then identify deviations from the expected pattern. The main families are statistical, spectral, structural, and model-based methods [26,27,28]. Their practical appeal is clear: they can be computationally light, interpretable, and useful when only a small amount of labeled data is available. Their main limitation is that the definition of a normal texture often changes with the weave, the material, the illumination, and the acquisition setup. Statistical approaches operate directly on image intensities or on local relationships between intensities. Histogram statistics provide simple global measures of brightness and contrast, but they may miss small or localized defects when the rest of the image dominates the distribution [29,30]. Gray-level co-occurrence matrices capture second-order spatial relationships between intensity values and have been widely used to derive texture descriptors [5]. Auto-correlation is useful when the fabric has a clear periodic structure because peaks in the correlation function reveal repeating spatial frequencies [31,32]. Local binary patterns provide a compact description of local contrast and are relatively robust to illumination changes, but their discrimination can be limited for subtle or highly variable defect appearances [6,33].
Spectral methods analyze the frequency structure of a fabric. Fourier transforms expose periodic components, wavelet transforms provide multi-resolution analysis, and Gabor filters jointly represent spatial frequency and orientation [7,34,35]. These tools are well suited to regular woven patterns because a defect can disturb an otherwise stable frequency response. Wavelets and Gabor filters have also been used as preprocessing stages or feature extractors for later learning-based systems [8,36,37]. Their performance is less reliable when the background texture is irregular, when the defect is weak relative to normal weave variation, or when a single set of filter parameters must cover several fabric types. Structural and model-based methods address texture from a different perspective. Structural approaches represent a fabric as an arrangement of texture primitives, such as repeated regions or line elements, and then search for violations of the expected arrangement [10]. Model-based approaches, including autoregressive models and Markov random fields, estimate a generative or probabilistic description of local texture dependencies [38,39,40]. These approaches can be useful for regular or stochastic textures, but they depend on modeling assumptions that may not transfer cleanly between materials or production conditions [12,28]. The diversity of operating conditions in LUSITANOv2 therefore motivates learned baselines in addition to classical analysis.
Deep Learning for Supervised Detection: Deep learning has expanded fabric inspection from hand-crafted texture descriptors to learned representations for classification, localization, segmentation, and anomaly scoring [13,41]. Convolutional neural networks have been used to classify fabric patches and to learn multiscale texture features. For example, CNN-based systems have been evaluated on TILDA, HKU-Fabric, and proprietary data, while later work has explored multiscale networks, ResNet-based models, capsule networks, and mobile encoder-decoder architectures [16,42,43,44,45]. These studies demonstrate that learned representations can capture defect appearance without specifying texture rules by hand. They also show that reported performance is closely tied to the dataset, annotation protocol, and acquisition conditions used for evaluation. For industrial inspection, localization is often more useful than image-level classification because the output must indicate where an operator should examine the fabric. Object detectors address this requirement by predicting bounding boxes and confidence scores. One-stage detectors, including SSD and YOLO, predict classes and boxes in a single forward pass and are commonly selected when inference speed is important [15,46]. Two-stage detectors, including Faster R-CNN and its variants, first generate candidate regions and then classify and refine them [14,47]. This additional proposal stage can improve localization of difficult objects, although it usually increases computational cost [48].
Fabric-specific work has often modified these detector families to address small, low-contrast, or multiscale defects. YOLO-based studies have added lightweight backbones, feature-pyramid modules, attention mechanisms, specialized losses, and additional detection layers [49,50,51,52,53]. Two-stage work has combined Faster R-CNN with Gabor features, improved feature pyramids, dilated convolutions, or multiscale kernels [54,55,56]. These methods are valuable demonstrations of task-specific adaptation, but their changes to data, preprocessing, architecture, and optimization make direct comparison difficult. Transformer-based detectors provide a complementary end-to-end detection paradigm. RT-DETR adapts the DETR framework to real-time detection through an efficient hybrid encoder and improved query selection [57]. Accordingly, this study evaluates representative one-stage, two-stage, and transformer-based detector families rather than proposing another specialized architecture. YOLOv12n represents a lightweight one-stage detector, Faster R-CNN provides a two-stage reference, and RT-DETR-L provides a transformer-based comparison point. The models are evaluated with class-agnostic bounding boxes and aspect-ratio-preserving letterboxing. This design makes it possible to examine how different standard detector families behave on wide industrial line-scan images before attributing improvements to bespoke architectural changes.
2.2. Prior Work on One-Class Anomaly Detection
Normality Modeling and Reconstruction: A one-class anomaly-detection method is trained to characterize normal data and to assign an anomaly score to deviations from that normality. This setting is relevant to textile inspection because defects can be diverse, rare, and difficult to enumerate as a fixed set of classes. It is complementary to supervised localization. Supervised detectors require bounding boxes for defective images, whereas one-class methods can be trained using defect-free images and can flag previously unseen departures from normal texture [58]. Early anomaly-detection systems used statistical, transform-based, model-based, and graph-based descriptions of normal texture. Deep learning has made it possible to learn these descriptions from data rather than defining them manually. This is attractive for industrial inspection because collecting labels for every possible defect type is costly and incomplete. A supervised system may perform poorly on a defect class absent from its training set, while a one-class system can instead learn the appearance of acceptable fabric and score deviations from it [59]. Reconstruction is one common strategy. Autoencoders are trained to reproduce normal inputs, and the reconstruction residual is used as an anomaly signal [60]. Generative models have been used in a similar way by producing a normal-looking reconstruction and comparing it with the observed image [61,62]. A limitation is that a high-capacity model may also reconstruct part of an anomalous region well, reducing the contrast between normal and defective samples. Modern methods therefore often compare intermediate features, restrict the representation of normality, or introduce synthetic anomalies during training.
Feature-Based Methods and Evaluation: Knowledge distillation is another influential approach. A student network is trained to reproduce the features of a teacher on normal samples. At test time, a discrepancy between the two networks can serve as an anomaly score because the student has not learned to reproduce abnormal structure [63,64,65,66]. Other methods model the distribution of normal patch features, store representative normal features in a memory bank, estimate likelihoods with normalizing flows, or use reconstruction models designed to make anomalous regions more visible [67,68,69,70]. The one-class experiments in this study cover several of these methodological families. SimpleNet and SuperSimpleNet use learned feature representations and synthetic anomaly mechanisms [71,72]; CFlow models normal features with conditional flows [69]; DRAEM uses reconstruction and discriminative segmentation [70]; EfficientAD and PaDiM use compact feature-based normality models [67,73]; PatchCore relies on a memory bank of normal patch features [68]; and STFPM and Reverse Distillation use teacher–student feature discrepancies [65,66]. The set is not intended as an exhaustive survey. It provides diverse, reproducible reference points for anomaly scoring on the same industrial imagery used by the supervised experiments. LUSITANOv2 provides bounding boxes but no pixel-level defect masks. For this reason, the one-class benchmark reports image-level AUROC rather than presenting a pixel-level localization comparison. This keeps the evaluation aligned with the available ground truth and distinguishes the one-class task from the supervised bounding-box detection protocol.
Table 1 makes the intended distinction explicit without inferring undocumented properties. LUSITANOv2 combines the largest verified image and bounding-box counts in this local comparison with RGB industrial line-scan acquisition on an active production line. The other benchmarks remain important resources, but their documented sensor, setting, and annotation characteristics differ. In particular, the combination of production-line acquisition, native wide frames, and multi-instance localized annotations makes LUSITANOv2 suitable for testing detection under conditions not represented by static laboratory samples. This is a complementary benchmark contribution, not a claim that any single dataset can represent all textile-production settings.
Table 1.
Comparison of public fabric-defect benchmarks. NR denotes a property not verified from the references available in this repository; it does not indicate that the property is absent. Defect types refer to released annotation classes. LS: line-scan; AS: area-scan; Prod.: active production line.
3. Dataset Description
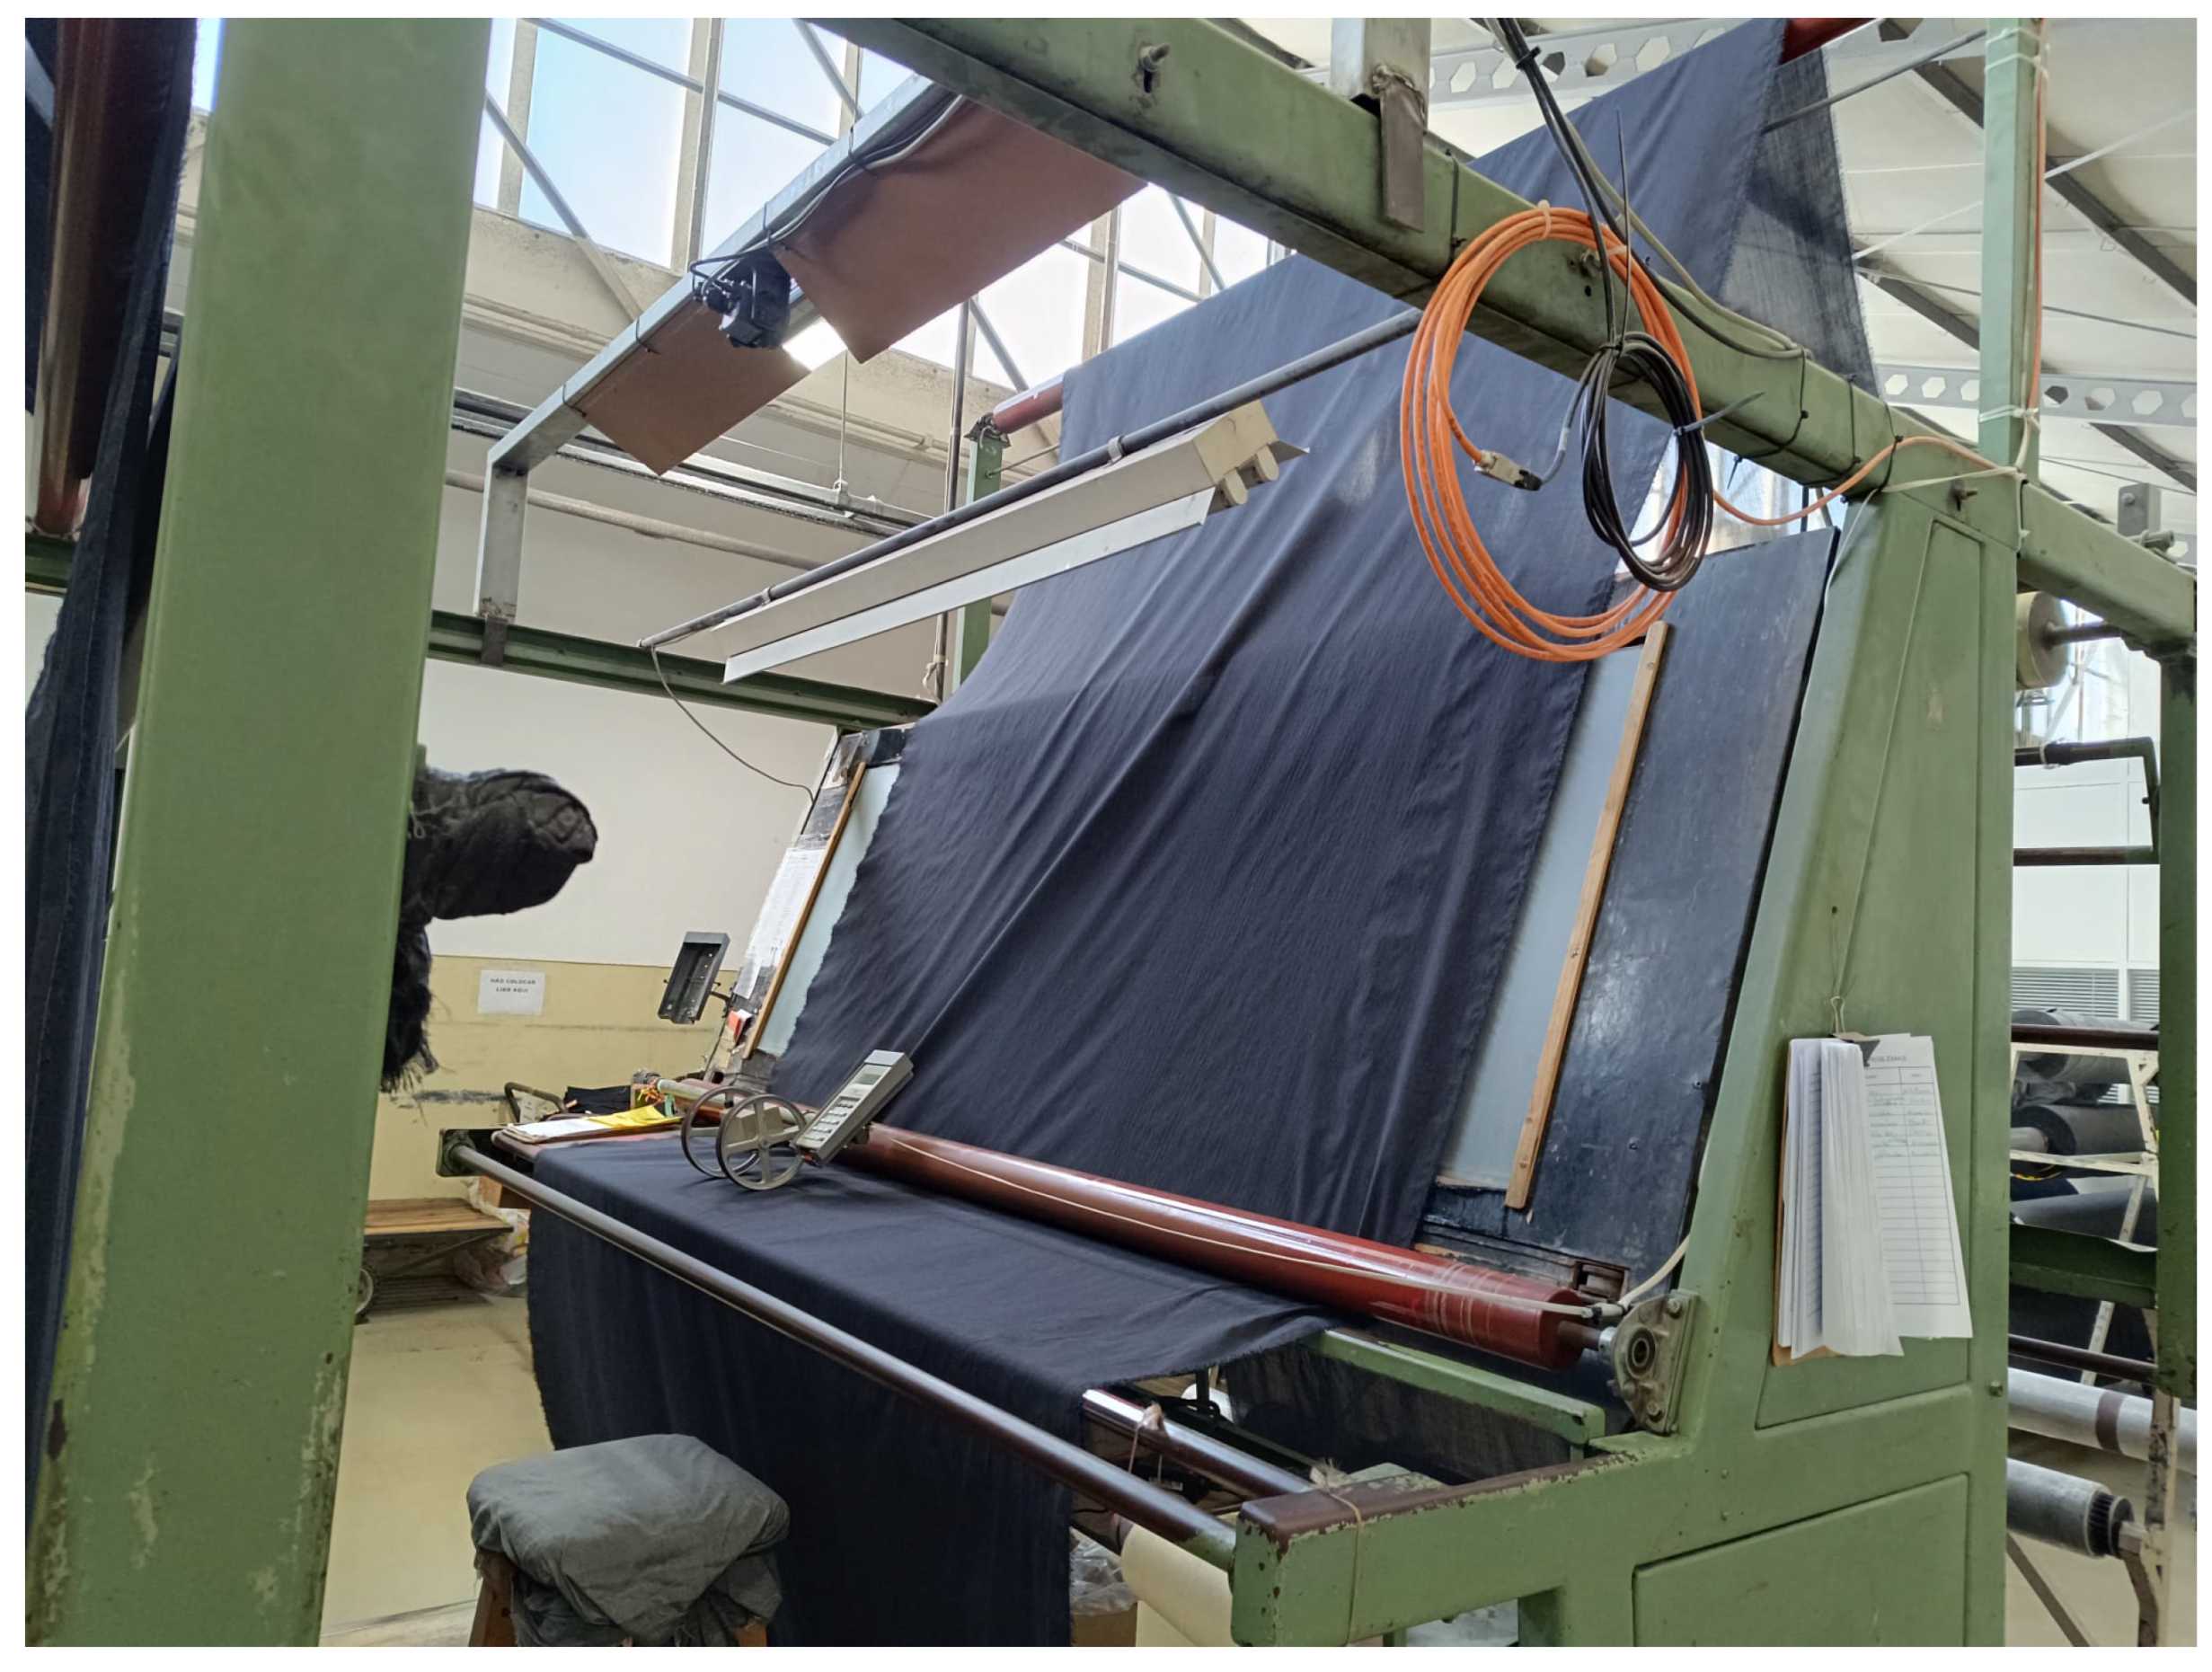
The LUSITANOv2 dataset was collected over six months, from June to December, at Paulo de Oliveira, S.A., in Covilhã, Portugal (https://www.paulo-oliveira.pt/), accessed on 3 August 2025. An industrial Teledyne DALSA (Waterloo, ON, Canada) Linea Color 4K 13 kHz GigE camera (https://www.teledynevisionsolutions.com/products/linea/?model=LA-GC-04K05B, accessed on 5 August 2025) was installed above a textile inspection machine with an LED Flood Lineal CYL 1015mm-45o-Blanco-NoDiff lighting system (EFFILUX, Les Ulis, France). The camera and illumination geometry were selected to cover the inspection zone while keeping the light source clear of the operator workspace, as illustrated in Figure 2.
Figure 2.
Camera setup at the textile factory.
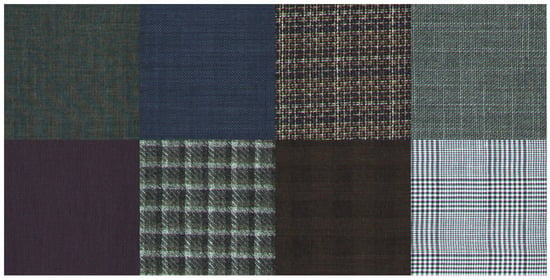
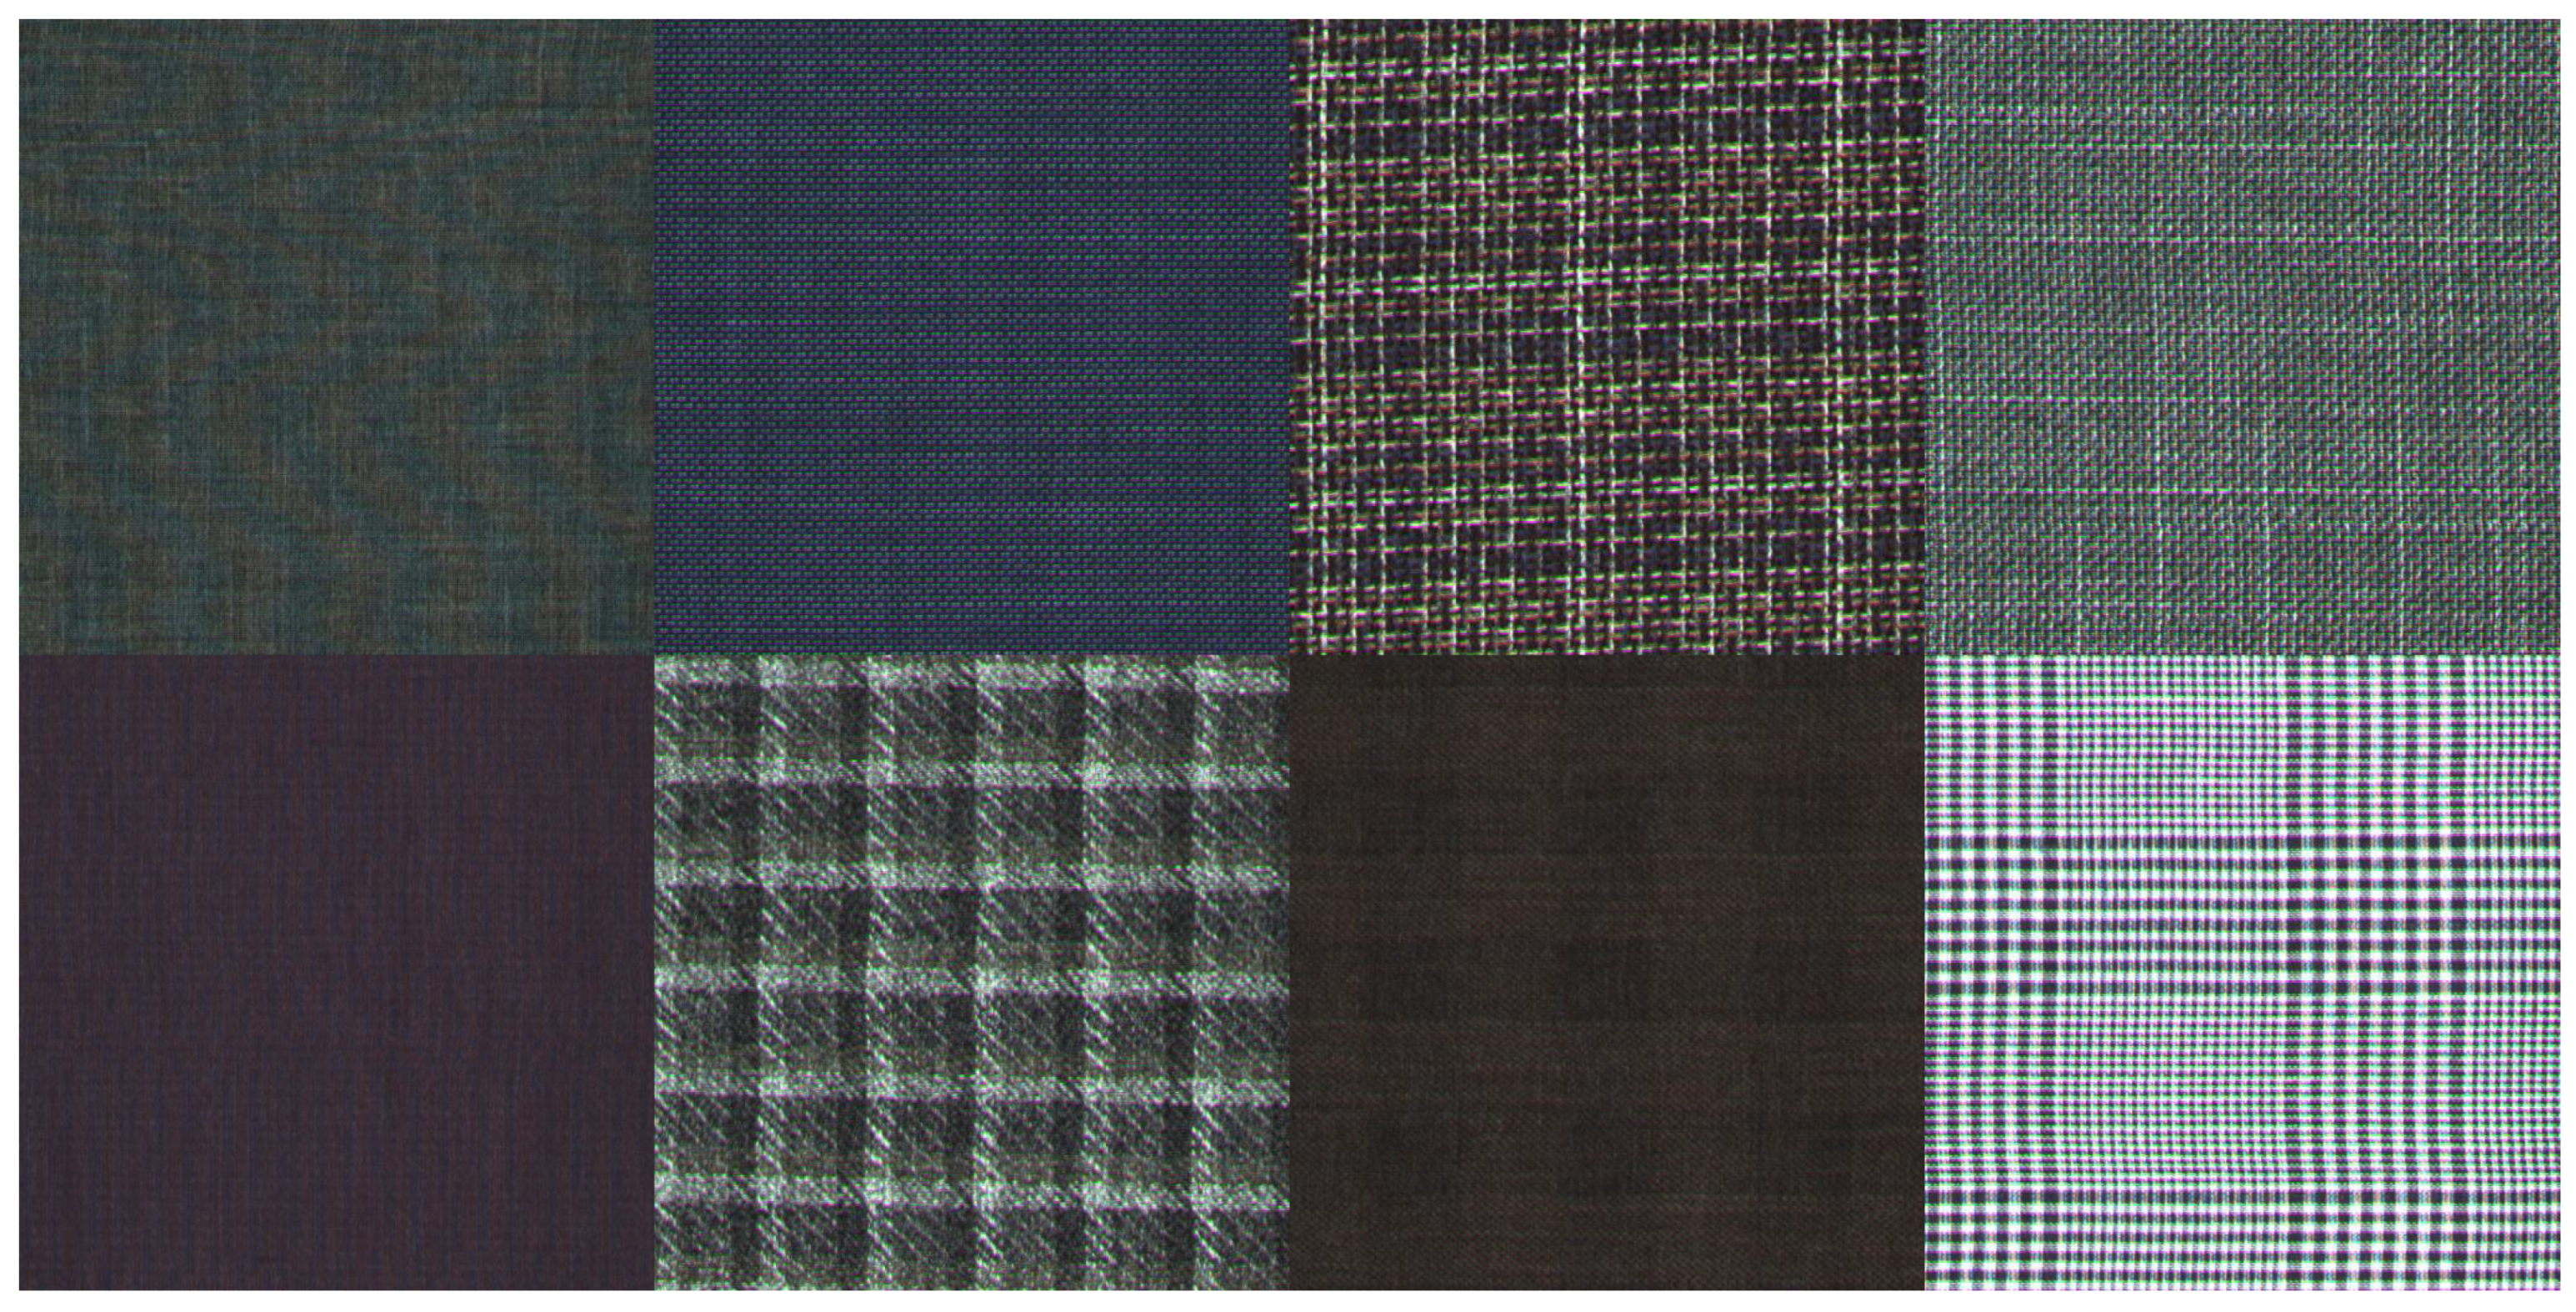
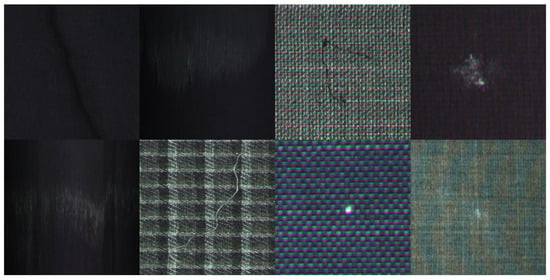
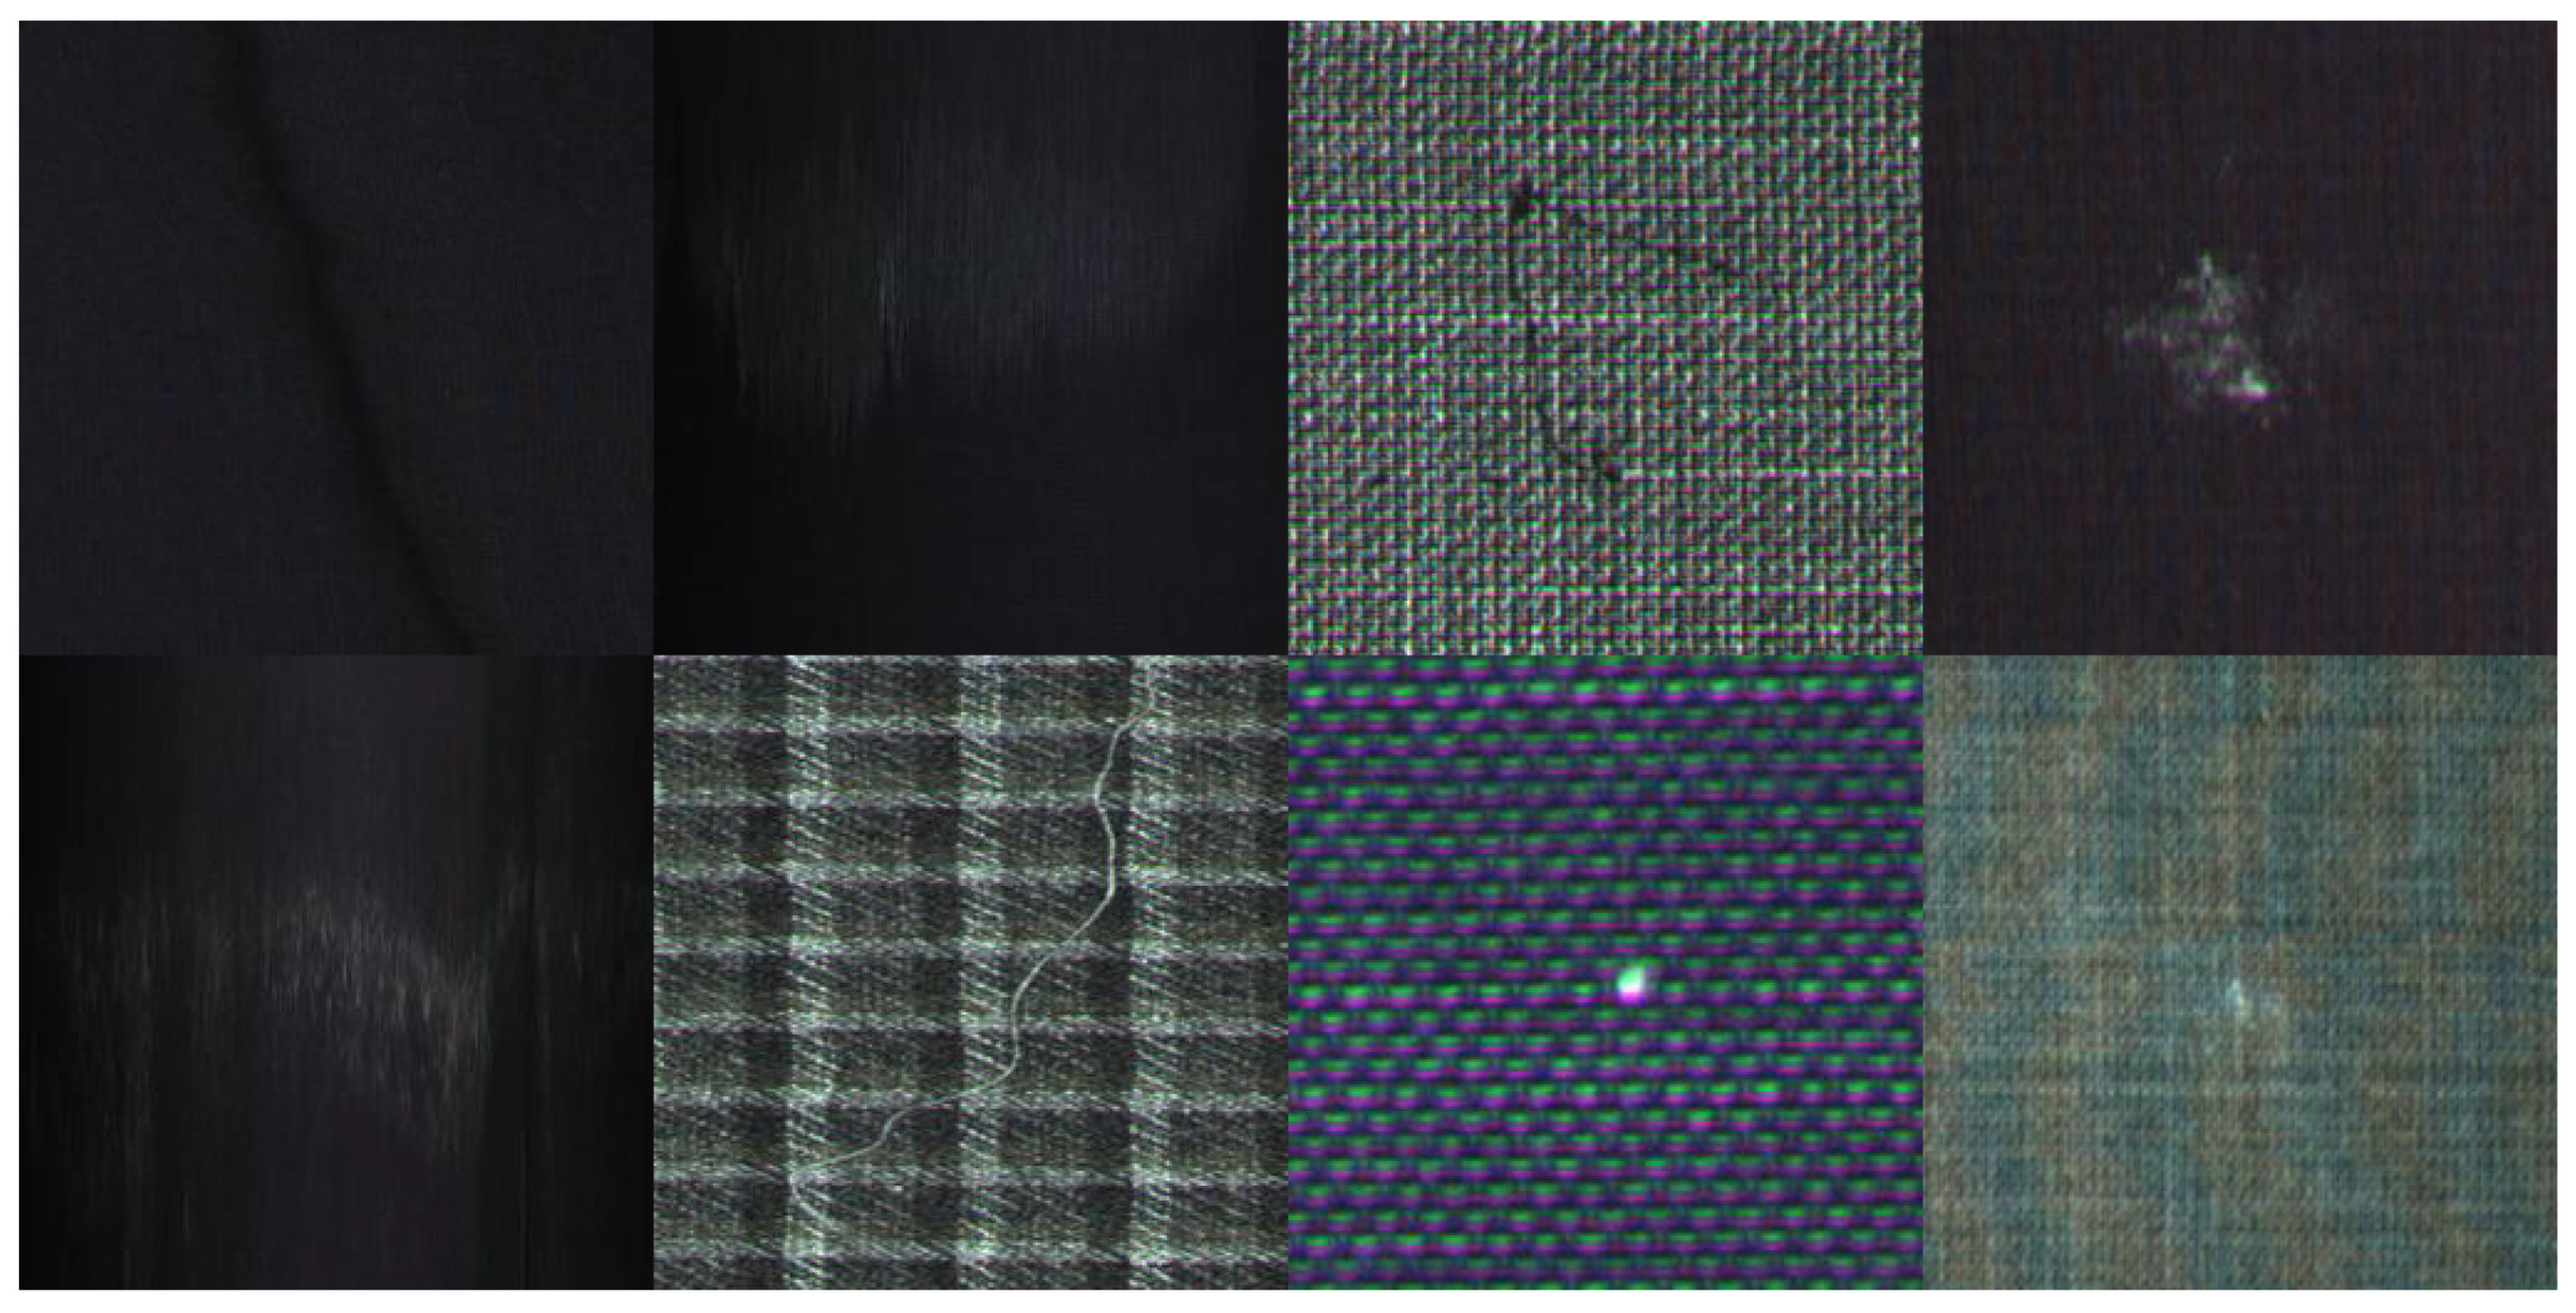
A line-scan camera was used to cover the moving fabric web at high spatial resolution. The acquisition system did not use an external encoder; collection was performed while the inspection web operated at a nominally constant speed. All captured defects occurred naturally during production, and no data augmentation was applied to the released images. Figure 3 presents normal fabric examples, while Figure 4 shows representative defective examples. Because the labels are class-agnostic, these figures illustrate visual variability rather than a formal defect taxonomy.
Figure 3.
Different types of fabric samples.
Figure 4.
Different types of defects, in different fabric samples.
3.1. Dataset Overview
The dataset contains 25,120 images: 12,654 defect-containing images with 18,557 bounding-box annotations and 12,466 defect-free images. Table 2 summarizes this near-even image-level balance across the training, validation, and test partitions. All defects are annotated in YOLO format under one class, defect; the labels do not provide a fine-grained defect taxonomy. Terms such as slubs, holes, stains, broken yarns, or mispicks therefore describe visually observed examples rather than formal annotation categories. This class-agnostic protocol supports both localized anomaly triage and one-class evaluation, while leaving multi-class characterization for future annotation work. Although the original collection contained substantially more defect-free material and unevenly represented fabric programs, the released selection was reduced to limit image-level imbalance while retaining the observed defect annotations.
Table 2.
Dataset summary.
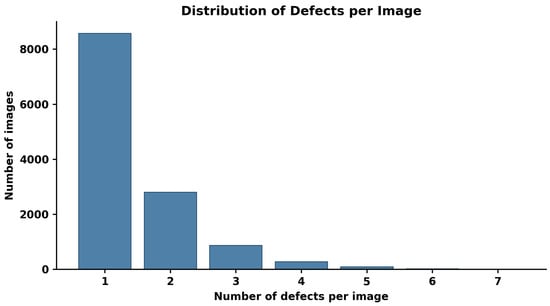
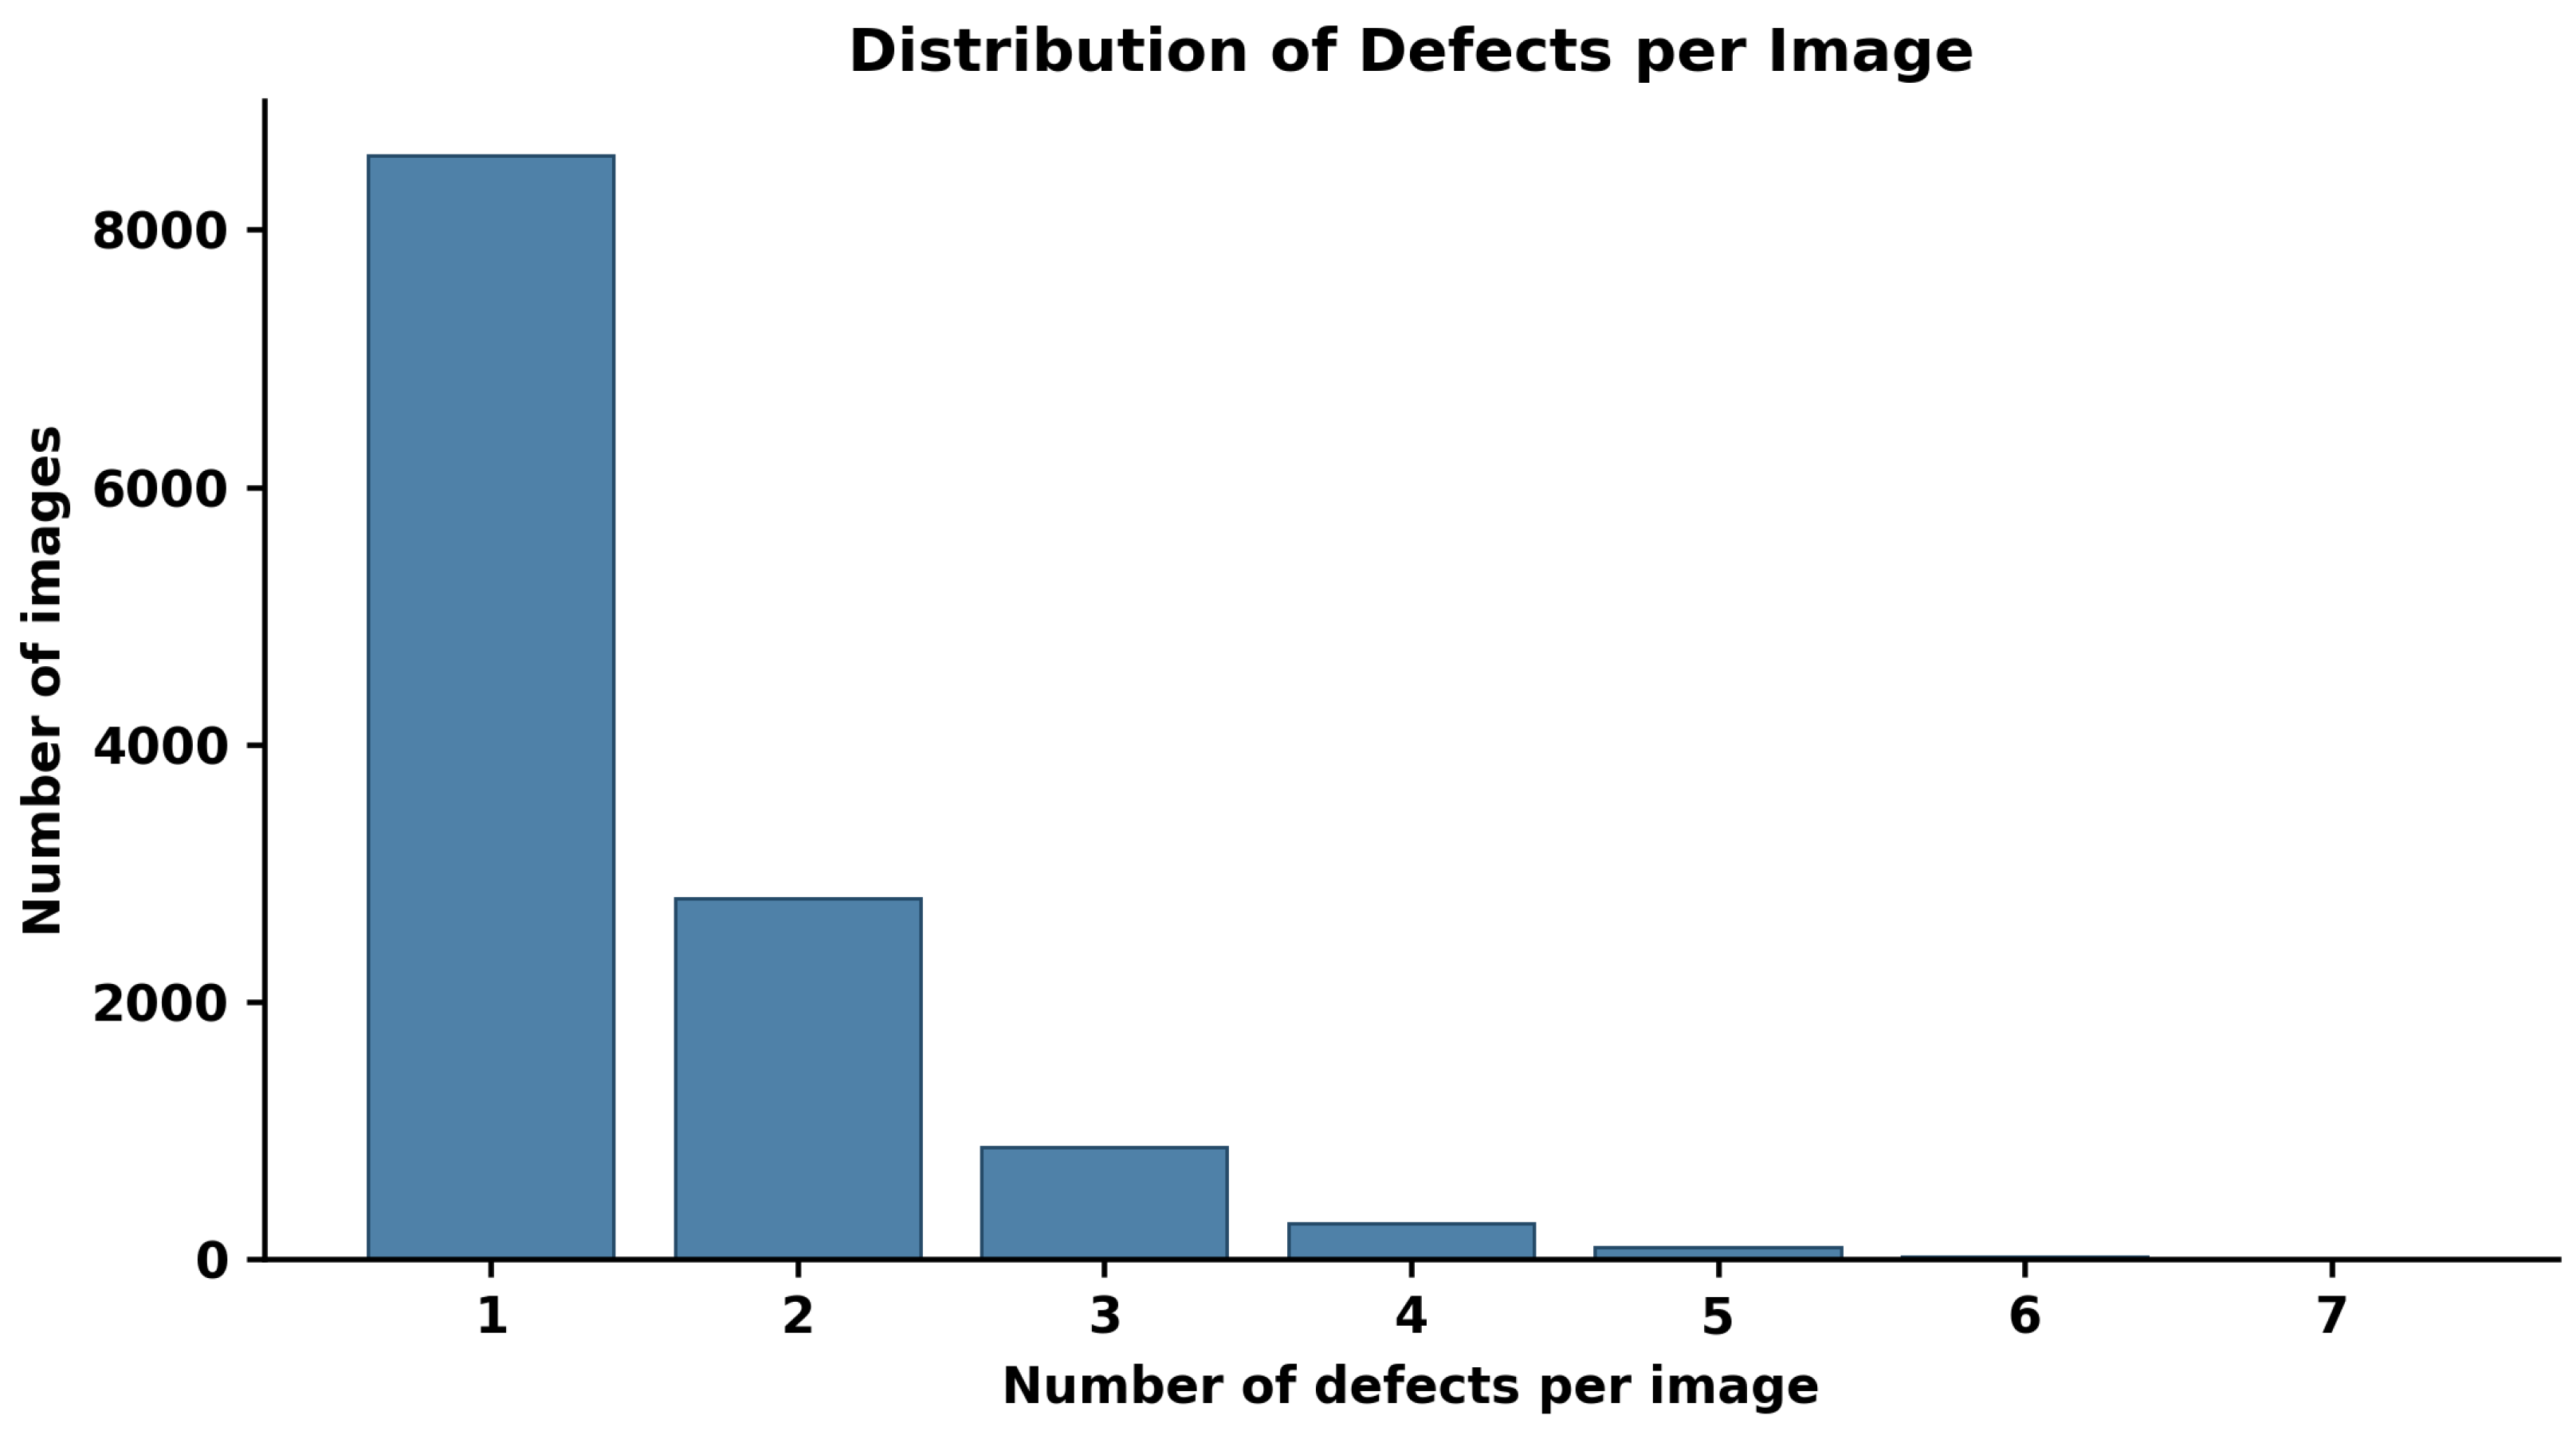
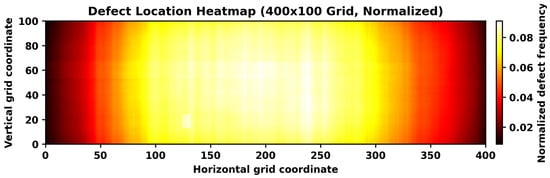
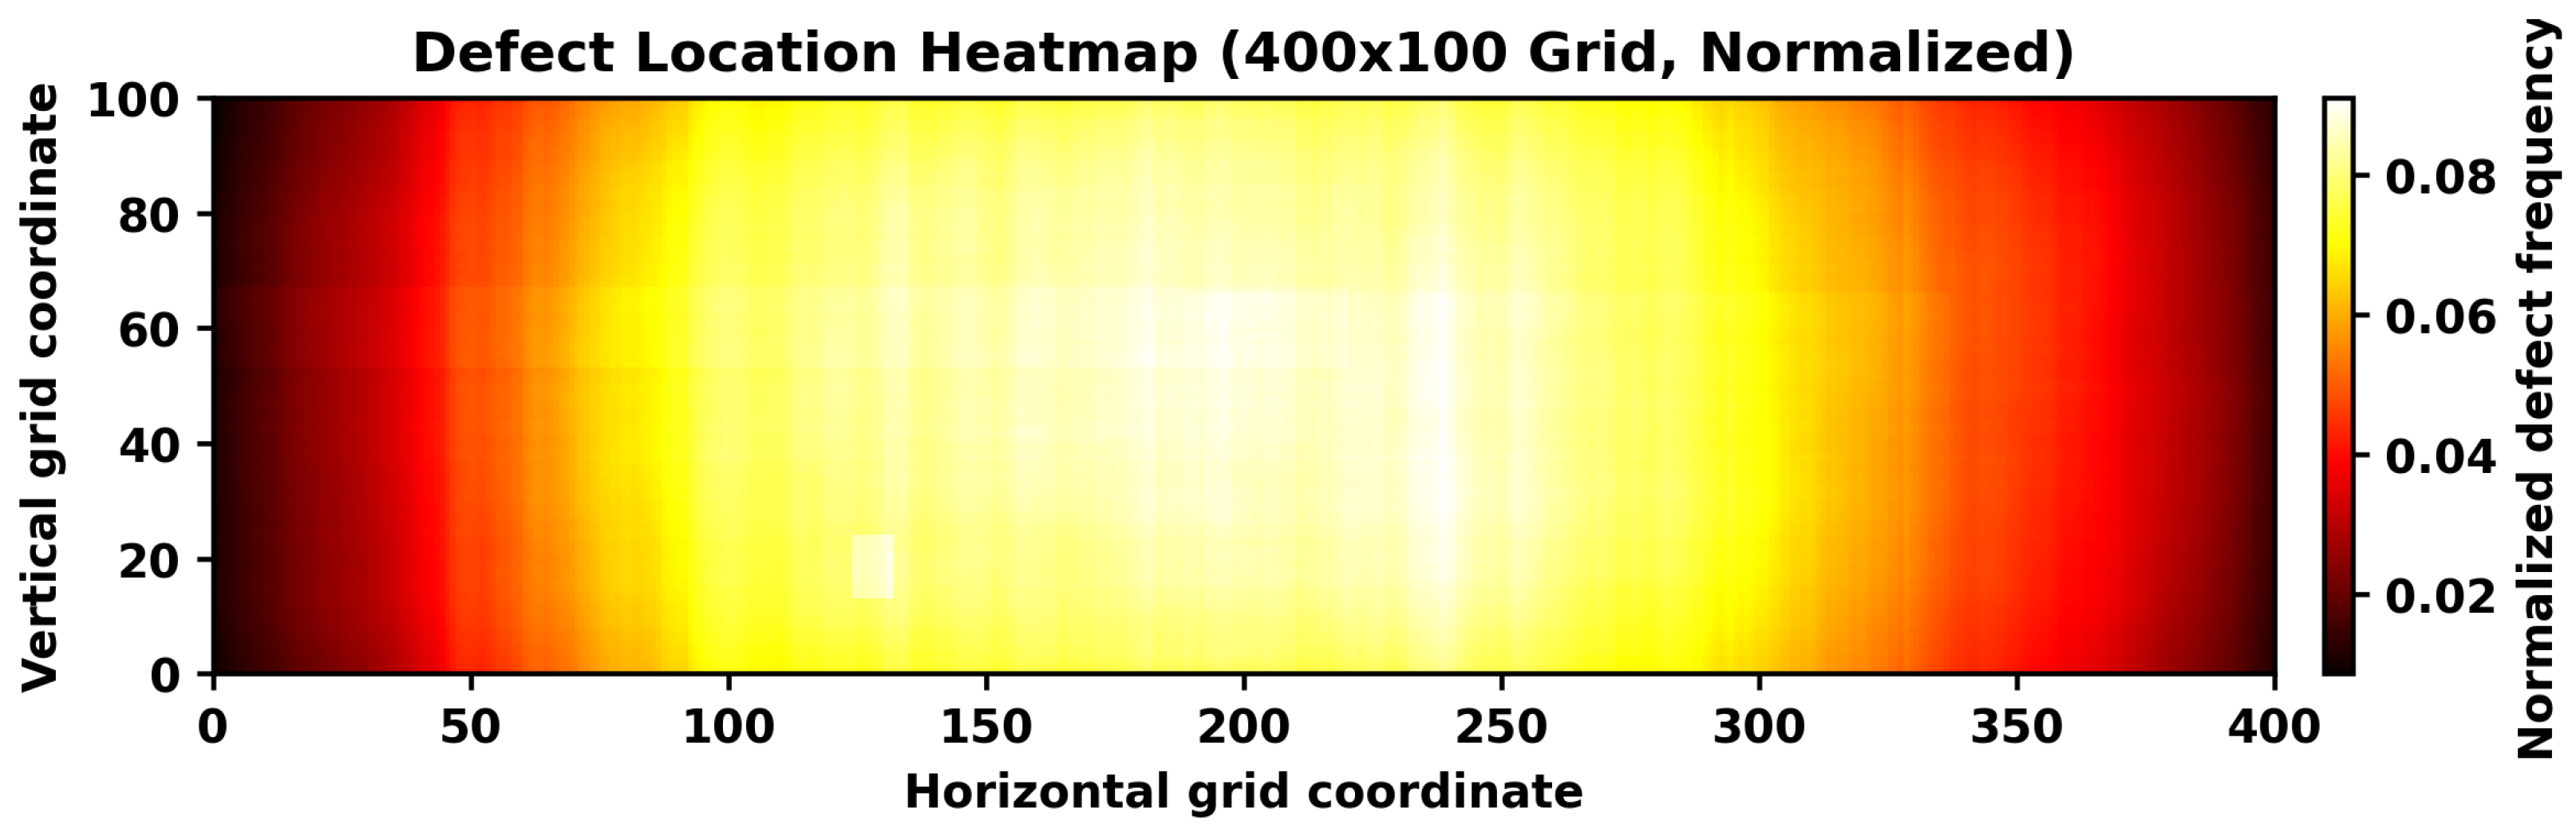
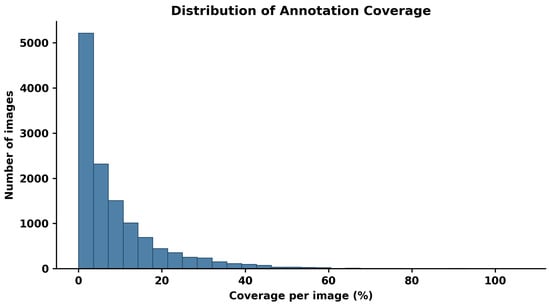
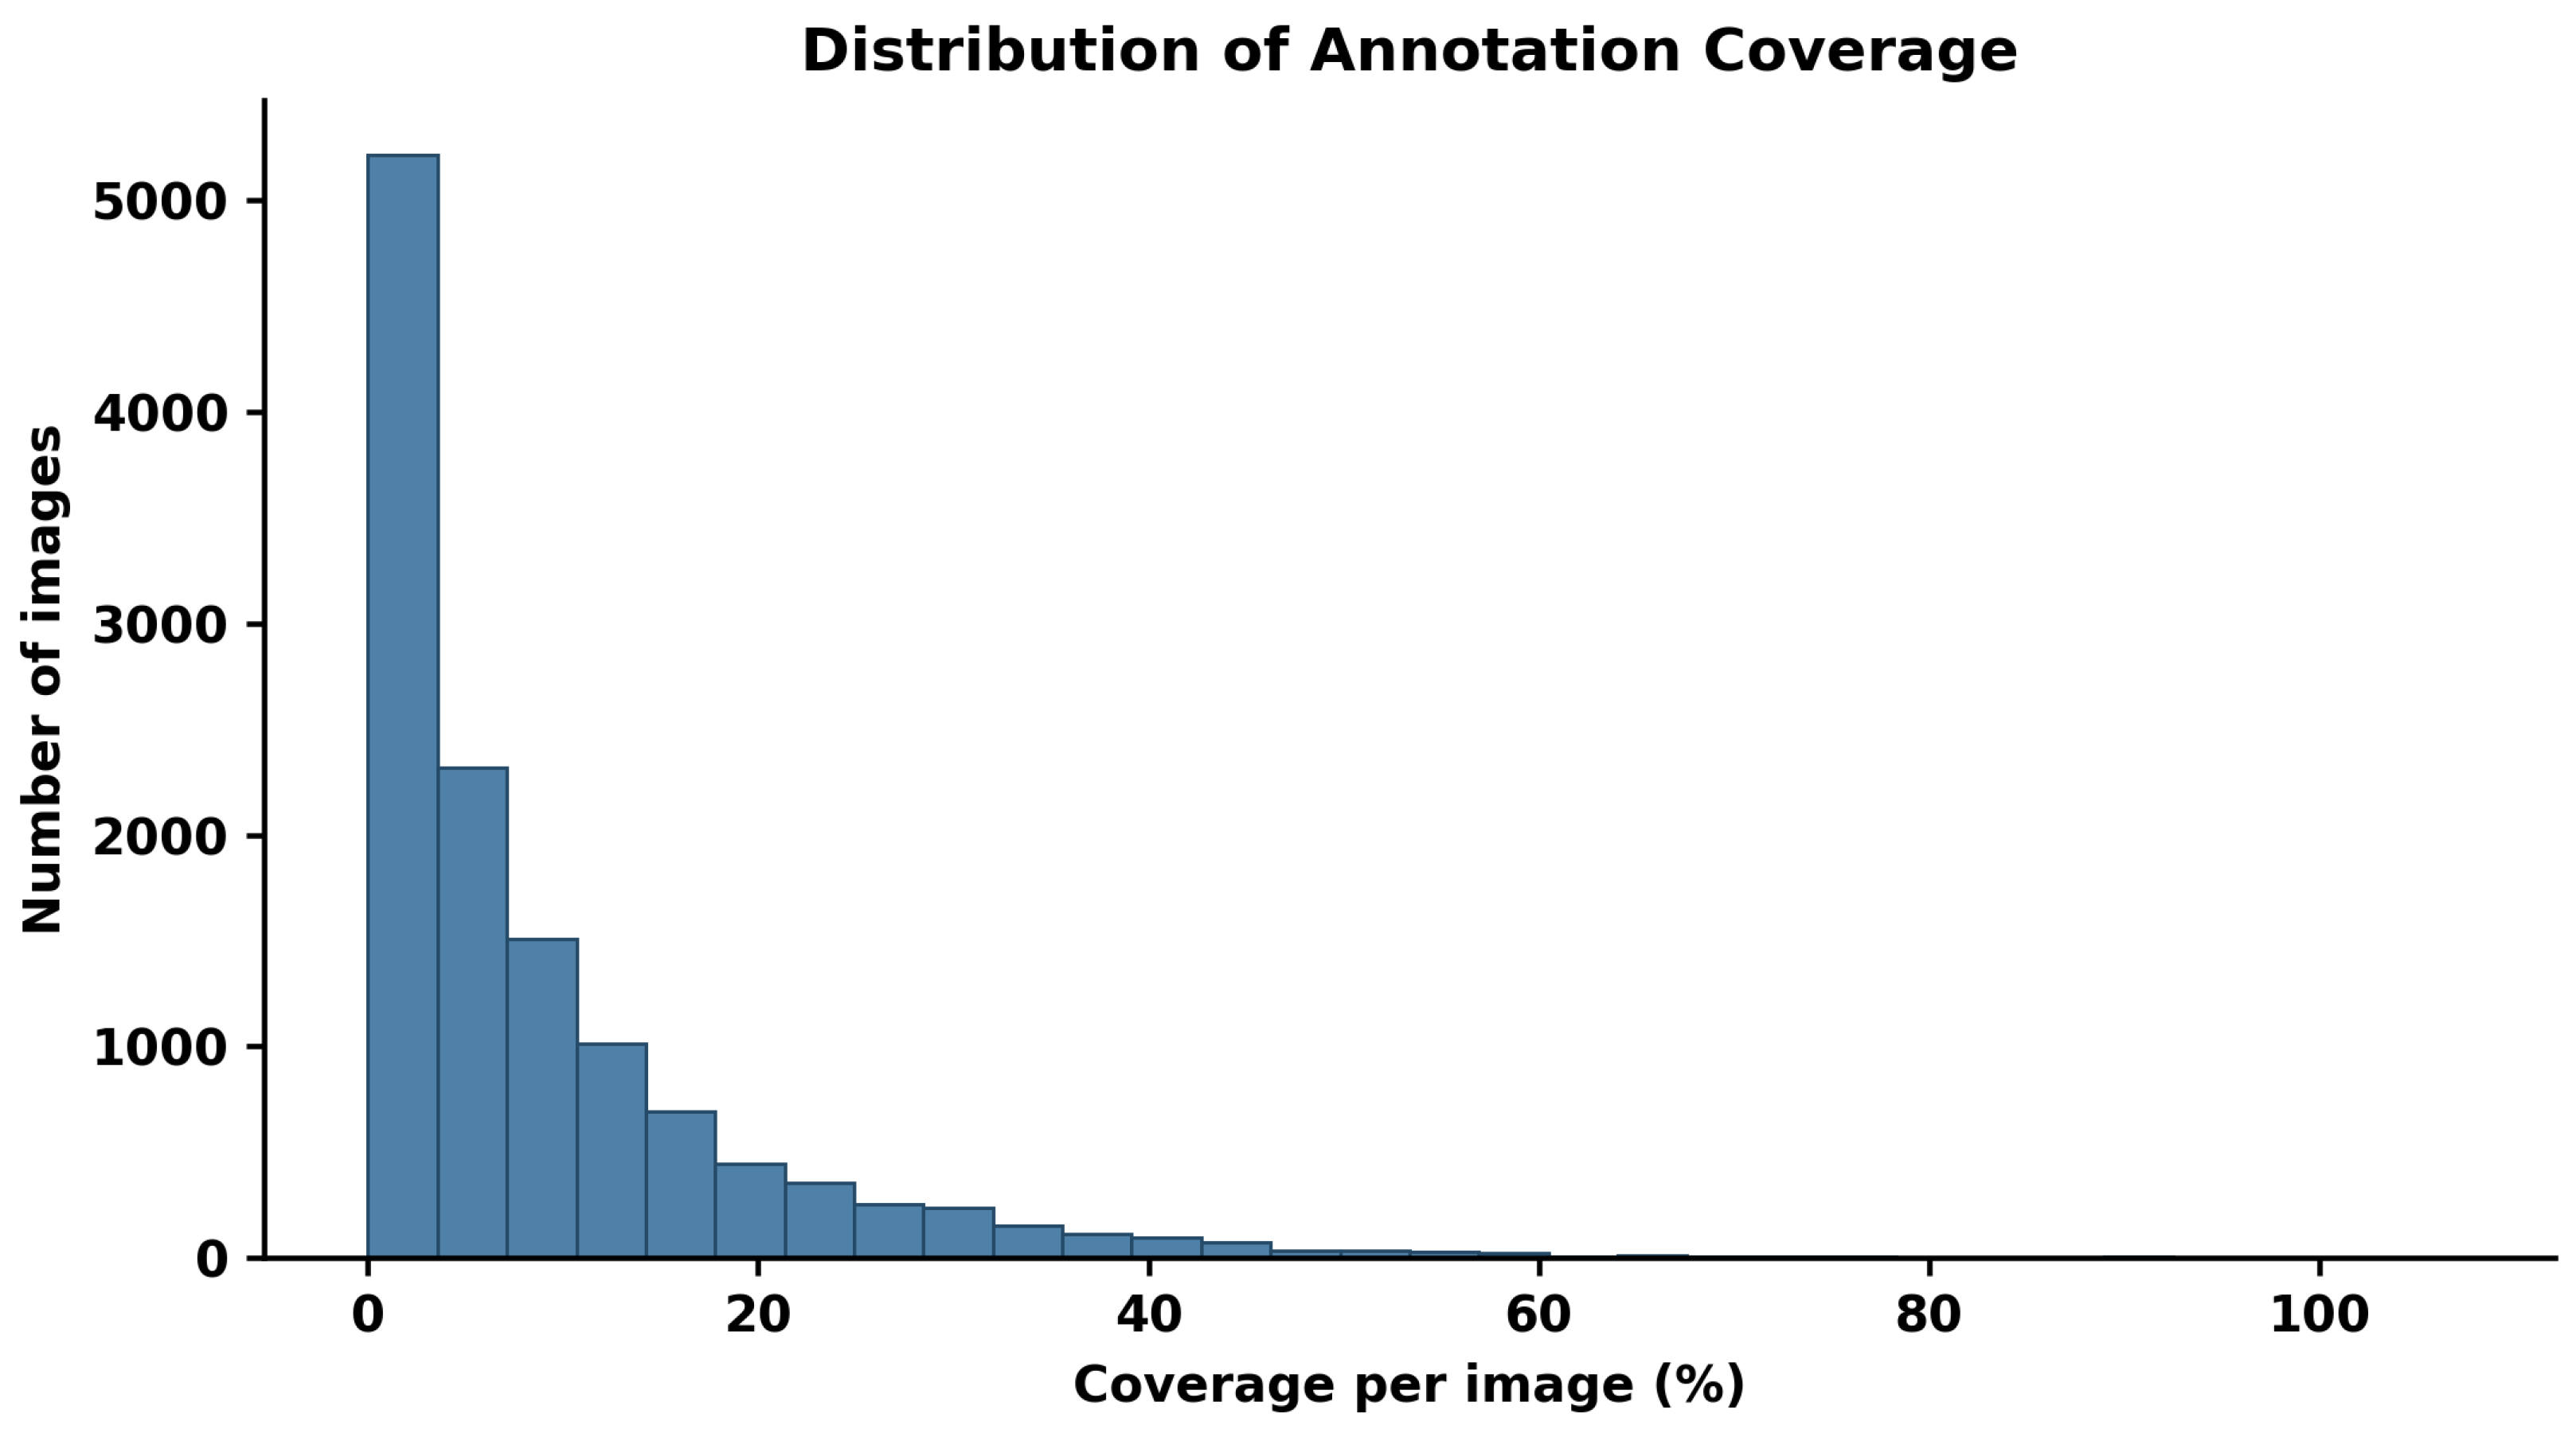
Defect Image Analysis: Defects are localized with YOLO-format bounding boxes. Most defect-containing images show a single defect, but multiple-defect cases are also represented: 67.64% contain one defect, 21.98% contain two, 7.35% contain three, and 3.03% contain four or more, as shown in Figure 5. Their locations are not uniform across the frame. The empirical distribution in Figure 6 has greater density near the center than near the lateral edges; this descriptive pattern is reported without inferring its cause. Figure 7 further shows that most annotated boxes cover only a small fraction of the full frame, which is consistent with the high-resolution line-scan setting.
Figure 5.
Histogram of defect count per image.
Figure 6.
Heatmap of defect occurrence.
Figure 7.
Histogram of defect coverage area per image.
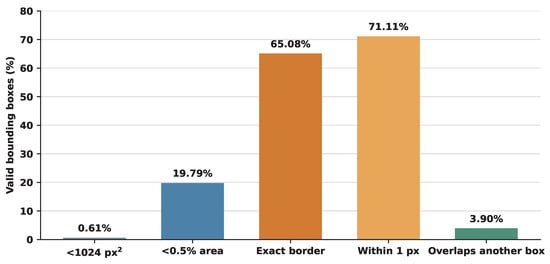
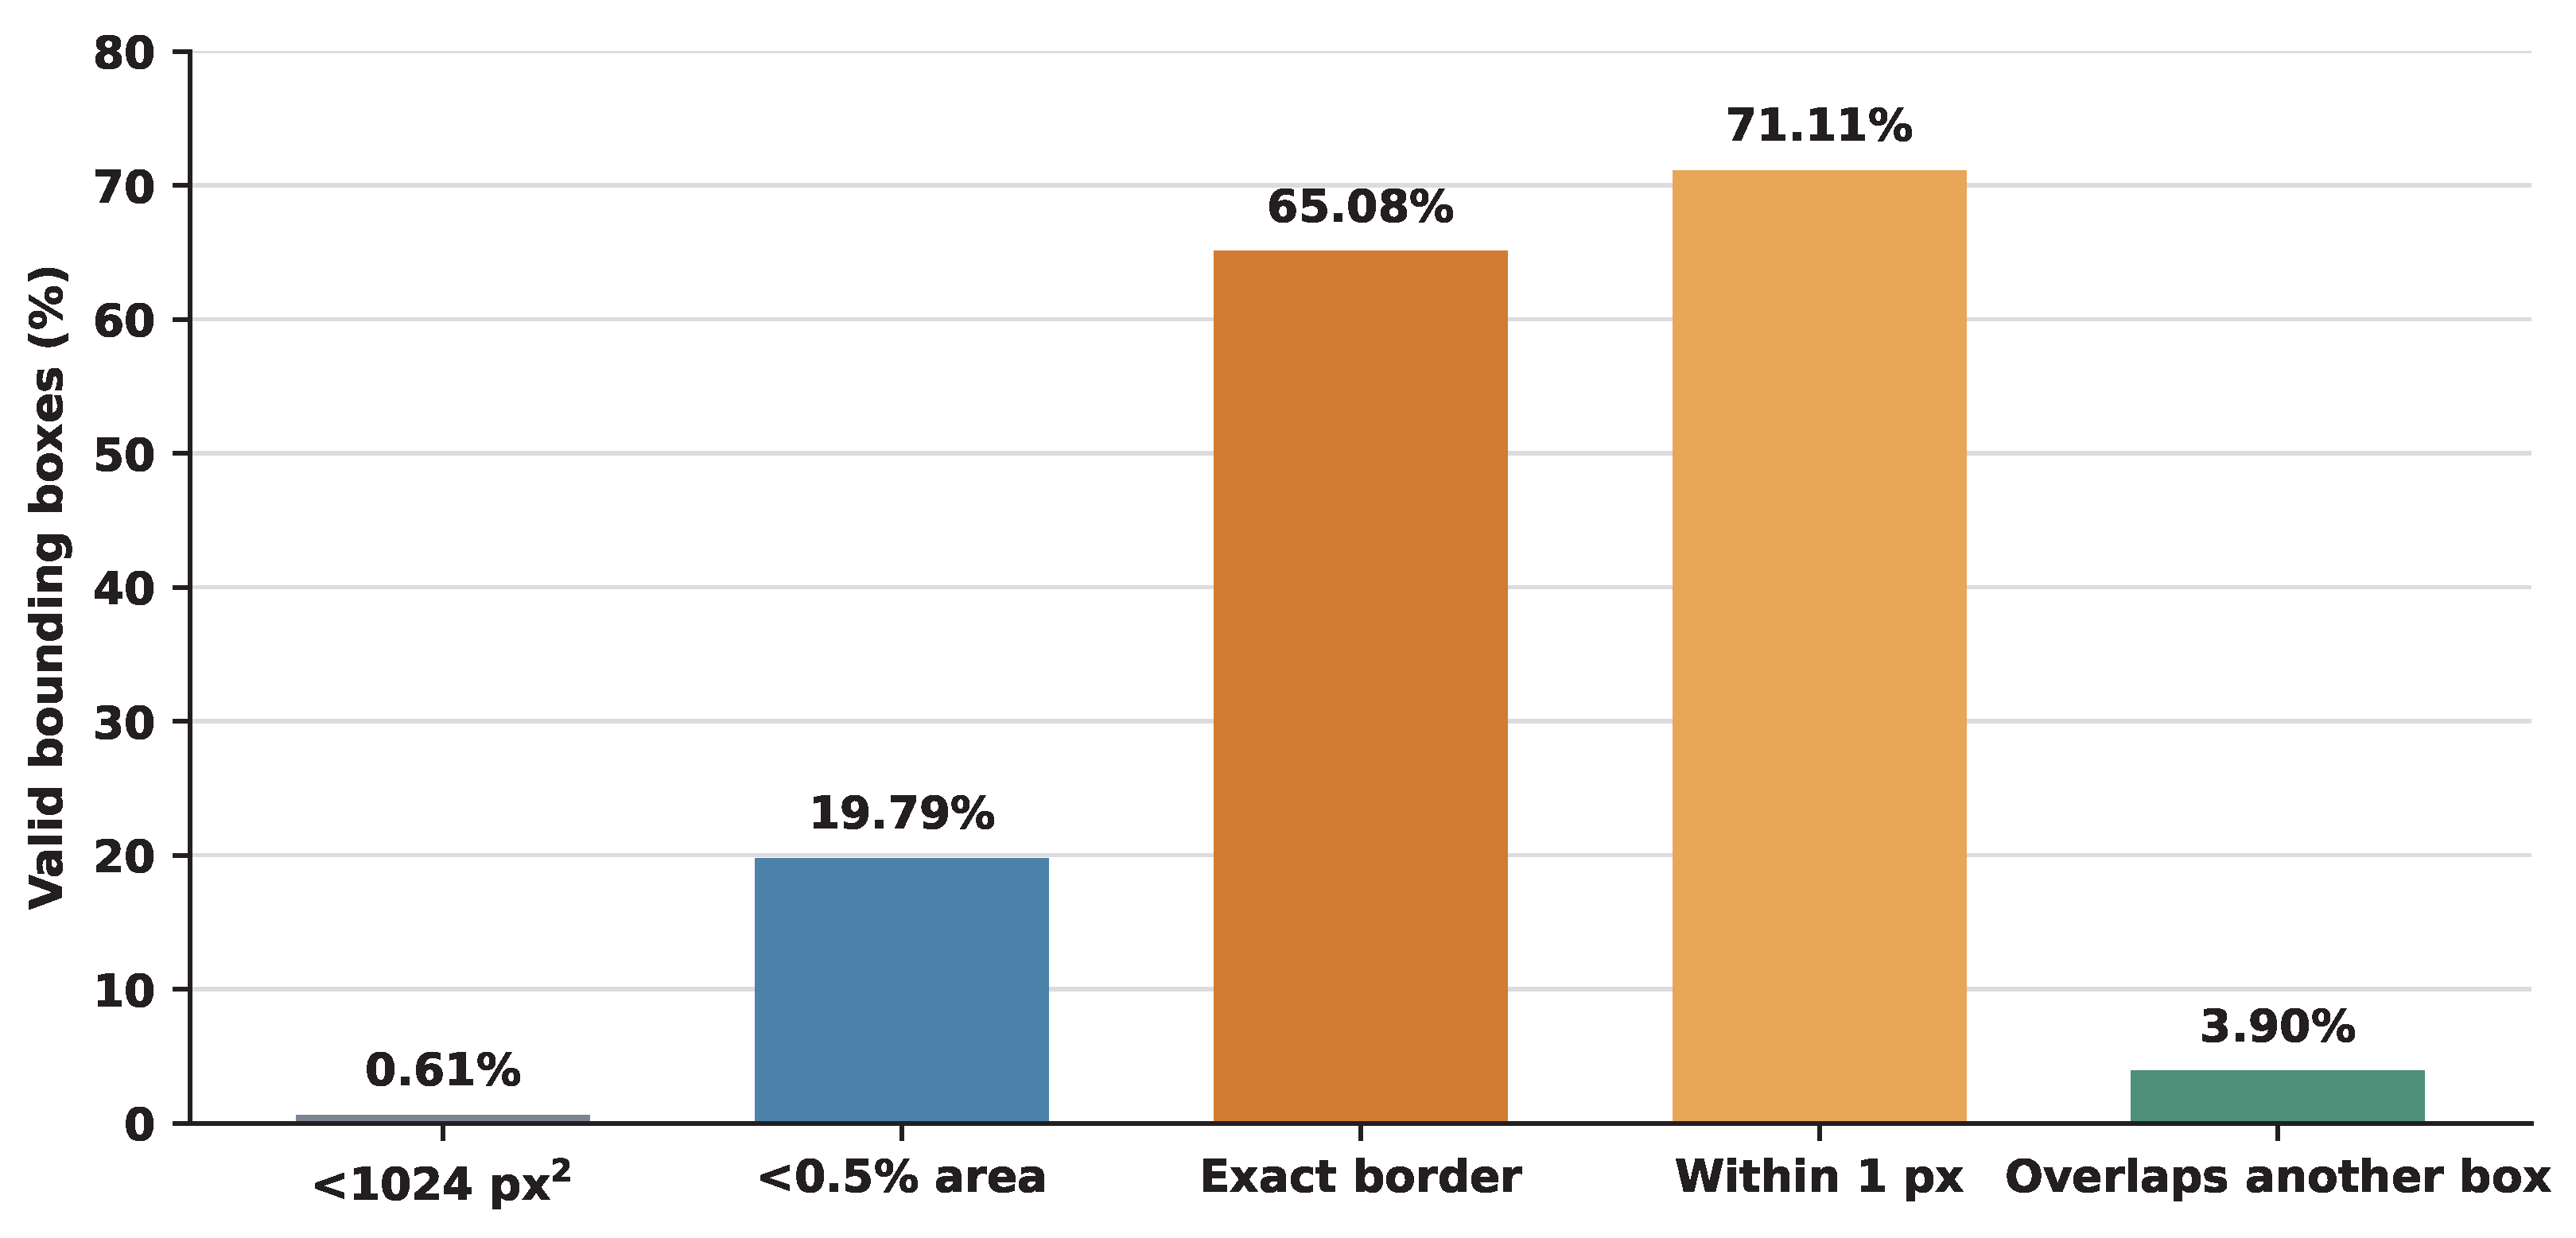
Annotation Geometry: We measured the prevalence of small, overlapping, and boundary-adjacent boxes; these geometry-based calculations exclude three zero-area training labels but retain all other raw annotations. Figure 8 reports the proportion of valid boxes in each explicitly defined category. Only 0.61% of valid boxes cover fewer than 1024 native pixels, whereas 19.79% cover less than 0.5% of the image area. A box is counted as overlapping when it has nonzero intersection with another valid box in the same image, which occurs for 3.90% of valid boxes. We distinguish two boundary definitions in native coordinates: an exact-border box has , , , or , whereas a boundary-proximal box is exact-border or lies within one native pixel of a boundary. Exact contact accounts for 65.08% of valid boxes overall, while the one-pixel definition accounts for 71.11%. Table 3 reports split-wise counts because the two definitions are not interchangeable. Boundary contact is common relative to the other geometry statistics measured here, but its effect on detector performance is evaluated separately in the supervised subgroup analysis in Section 5.1; prevalence alone does not establish that a subgroup is more difficult.
Figure 8.
Geometry characteristics computed from native YOLO annotations. Exact-border and one-pixel boundary-proximal prevalence are shown separately; overlap means nonzero intersection with another valid box in the same image.
Table 3.
Boundary prevalence among valid boxes in the raw LUSITANOv2 split. Exact contact means that a box edge equals or exceeds a native image boundary; boundary-proximal includes boxes within one native pixel.
Split Representativeness: To verify that the training, validation, and test partitions are representative, we analyzed bounding-box area, relative area, aspect ratio, brightness, and contrast. Defects of different sizes are similarly distributed across splits, and the long-tailed size distribution is preserved so that rare large defects are not confined to one subset. Brightness and contrast are likewise consistent: no partition is noticeably darker, brighter, or lower in contrast. Statistical comparison of bounding-box area, relative area, aspect ratio, image aspect ratio, brightness, and contrast using the Kolmogorov–Smirnov (KS) test found no significant differences. For example, bounding-box area gave , for train versus validation and , for train versus test; brightness and contrast comparisons gave in every case. The average number of defects per image also remains nearly identical across the three splits, ranging from 0.73 to 0.74. Together, these visual and statistical checks indicate that the partitions are well balanced for training and evaluation, without systematic bias in the measured image-level properties.
3.2. Dataset Structure
The released dataset has two main folders: images, containing all dataset images, and labels, containing the corresponding annotation files. Each folder is subdivided into train, val, and test directories that define the training, validation, and test partitions. This mirrored layout keeps every image alongside an unambiguous annotation location and supports direct use with the provided detection configuration.
4. Experiments
This section establishes supervised detection and one-class anomaly-detection baselines for LUSITANOv2, then uses controlled studies to examine two properties that are central to production line-scan inspection: the effect of input resolution and the extent of cross-dataset transfer. The goal is not to claim that the selected methods exhaust the available architectures. Rather, the experiments provide a reproducible reference point for evaluating how standard vision pipelines behave on high-resolution, wide-format fabric imagery collected during active production.
4.1. Experimental Setup
Shared Experimental Setup: All experiments were conducted on an NVIDIA RTX A6000 GPU (Santa Clara, CA, USA) with 48 GB of VRAM. Unless a later subsection states otherwise, detection runs used a maximum budget of 100 epochs, initial learning rate , AdamW, weight decay , and batch size 16. The archived multi-architecture YOLO launch records early-stopping patience 5. By contrast, the independently archived YOLOv12n resolution and transfer studies used early stopping disabled and completed all 100 epochs. They are therefore reported as separate controlled experiments, rather than as re-evaluations of the multi-architecture checkpoint.
Aspect-Ratio-Preserving Letterboxing: Native LUSITANOv2 frames are (aspect ratio 4:1). Mapping these ribbons onto the square canvases expected by standard detectors by anisotropic resizing would stretch the weave and distort defect geometry. We therefore apply isotropic letterboxing: the long side is scaled to a network input size s, producing a 4:1 content region of , which is then padded to an tensor. For , the detector sees fabric content inside a canvas. This choice preserves the native aspect ratio and keeps the full web width in a single forward pass; the cost is a uniform reduction in spatial sampling of the weave. The resolution analysis in Section 5.1 measures that cost directly, rather than assuming that a single operating point is sufficient.
Benchmark Scope and Method Justification: This benchmark evaluates three complementary supervised detector families: YOLOv12n, Faster R-CNN, and RT-DETR-L, together with one-class anomaly-detection methods. Annotation compatibility: LUSITANOv2 supplies bounding boxes, which directly support the reported supervised task; pixel masks were neither inferred nor synthesized. Supervised segmentation architectures are consequently outside the present comparison, because a fair evaluation would require new pixel-level annotations. Architectural coverage: YOLOv12n is the lightweight YOLOv12 variant used in the controlled resolution and transfer studies, Faster R-CNN provides a two-stage comparison point, and RT-DETR-L provides a transformer-based detector. This is a representative rather than exhaustive selection. Role in transfer analysis: the manuscript does not propose a domain-adaptation algorithm. Instead, it quantifies zero-shot transfer among LUSITANOv2, TILDA, and ZJU-Leaper under a matched detector in the supervised results in Section 5.1, so that the production-line domain gap is measured rather than assumed.
4.2. Supervised Detection Experiments
Overall Supervised Detection: We evaluate three detector families: the one-stage YOLOv12n model, the two-stage Faster R-CNN model, and the transformer-based RT-DETR-L model. YOLOv12n uses the available pretrained yolo12n.pt initialization, while Faster R-CNN uses the Torchvision ResNet-50-FPN v2 implementation. Both receive aspect-ratio-preserving letterboxed inputs and are evaluated on held-out data with mAP@0.5 and mAP@0.5:0.95. For Faster R-CNN, precision and recall are reported at IoU and confidence ; these fixed operating-point values should not be conflated with the full confidence-sweep metrics used by the Ultralytics evaluator. RT-DETR-L uses pretrained rtdetr-l.pt weights and the same input size, batch size, AdamW optimizer, initial learning rate, weight decay, and 100-epoch training budget. The final checkpoint is evaluated on the same held-out test split using the corresponding detector evaluation protocol.
Segmentation and domain-adaptation algorithms remain important future extensions, but neither is evaluated in this manuscript.
Input-Resolution Ablation: The letterboxing rule above still leaves the scalar s unspecified. Because LUSITANOv2 contains thin and low-contrast defects, s controls both the weave detail that survives downsampling and the padded area that the detector must ignore. We therefore trained four independent YOLOv12n models on the LUSITANOv2 training split at , corresponding to 4:1 fabric regions of , , , and . Each run used 100 epochs, batch size 16, seed 0, and square letterboxing (rect = false); no run was initialized from another resolution’s weights, and each was evaluated on the held-out LUSITANOv2 test set at its matching s. This design attributes performance differences to input sampling density rather than to optimizer state or a change of architecture. We use ( content) as the default operating point for the subsequent transfer study, while the supervised results in Section 5.1 test whether that choice is supported by accuracy rather than convention.
Cross-Dataset Transfer Protocol: The introduction proposes that laboratory area-scan benchmarks and in situ line-scan imagery occupy different visual domains. To test this proposition, we trained one YOLOv12n detector on each of LUSITANOv2, TILDA [18], and ZJU-Leaper [20], then evaluated every checkpoint on every test set to form a transfer matrix. All three models used the same recipe: 100 epochs, AdamW, initial learning rate , weight decay , batch size 16, , and early stopping disabled so that every run completed the full schedule.
Every annotation was mapped to the single class defect, which is the only compatible definition across the three sources, and zero-area ZJU-Leaper boxes were discarded. For TILDA, 20% of the original training images were held out at random with seed 0 to form a validation split; ZJU-Leaper retained its official training, validation, and test partitions. The LUSITANOv2 transfer cache excludes eight TIFFs containing labels outside the one-class mapping and one non-decodable TIFF. These nine raw files contain 15 label rows, leaving 2503 images and 1850 compatible boxes for the transfer cohort. No fine-tuning, style transfer, or domain-adaptation loss was applied at test time, so all off-diagonal entries are strictly zero-shot. This protocol holds architecture, optimizer, image size, and class definition fixed, allowing the training images to be the only intended source of variation.
4.3. One-Class Anomaly Detection
To complement supervised detection, we also evaluate unsupervised one-class anomaly-detection methods. These methods are trained only on non-defective fabric and are therefore relevant when defect annotations are scarce or costly to acquire. The archived experiments use the open-source Anomalib library [74] to evaluate SimpleNet [71], SuperSimpleNet [72], CFlow [69], DRAEM [70], EfficientAD [73], PaDiM [67], PatchCore [68], STFPM [65], and Reverse Distillation [66].
Performance is measured with image-level AUROC. Although LUSITANOv2 provides bounding boxes, the archived one-class evaluation does not provide a shared pixel-level localization protocol or masks. Pixel AUROC is therefore not reported, and the results should be interpreted as image-level anomaly-discrimination baselines.
5. Results and Analysis
5.1. Supervised Detection Results
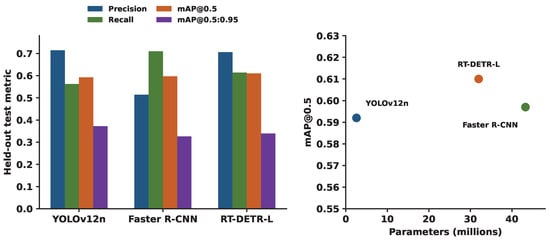
Overall Detector Comparison: Table 4 reports held-out metrics and model sizes for YOLOv12n, Faster R-CNN, and RT-DETR-L under the matched supervised comparison. RT-DETR-L reaches 0.610 mAP@0.5, ahead of Faster R-CNN (0.597) and YOLOv12n (0.592). RT-DETR-L therefore achieves the highest mAP@0.5 among the evaluated detector architectures.
Table 4.
Multi-architecture detector results on the LUSITANOv2 test set at . YOLOv12n, Faster R-CNN, and RT-DETR-L are evaluated on the held-out test set using the protocols described in Section 4.2. Precision and recall follow the corresponding evaluator configurations.
RT-DETR-L achieves the highest mAP@0.5 (0.610) among the evaluated detectors. Under their respective evaluator operating points, Faster R-CNN reports a recall of 0.710, whereas YOLOv12n reports a precision of 0.714 and the highest mAP@0.5:0.95 of 0.372. These results indicate complementary operating characteristics rather than a universally superior architecture.
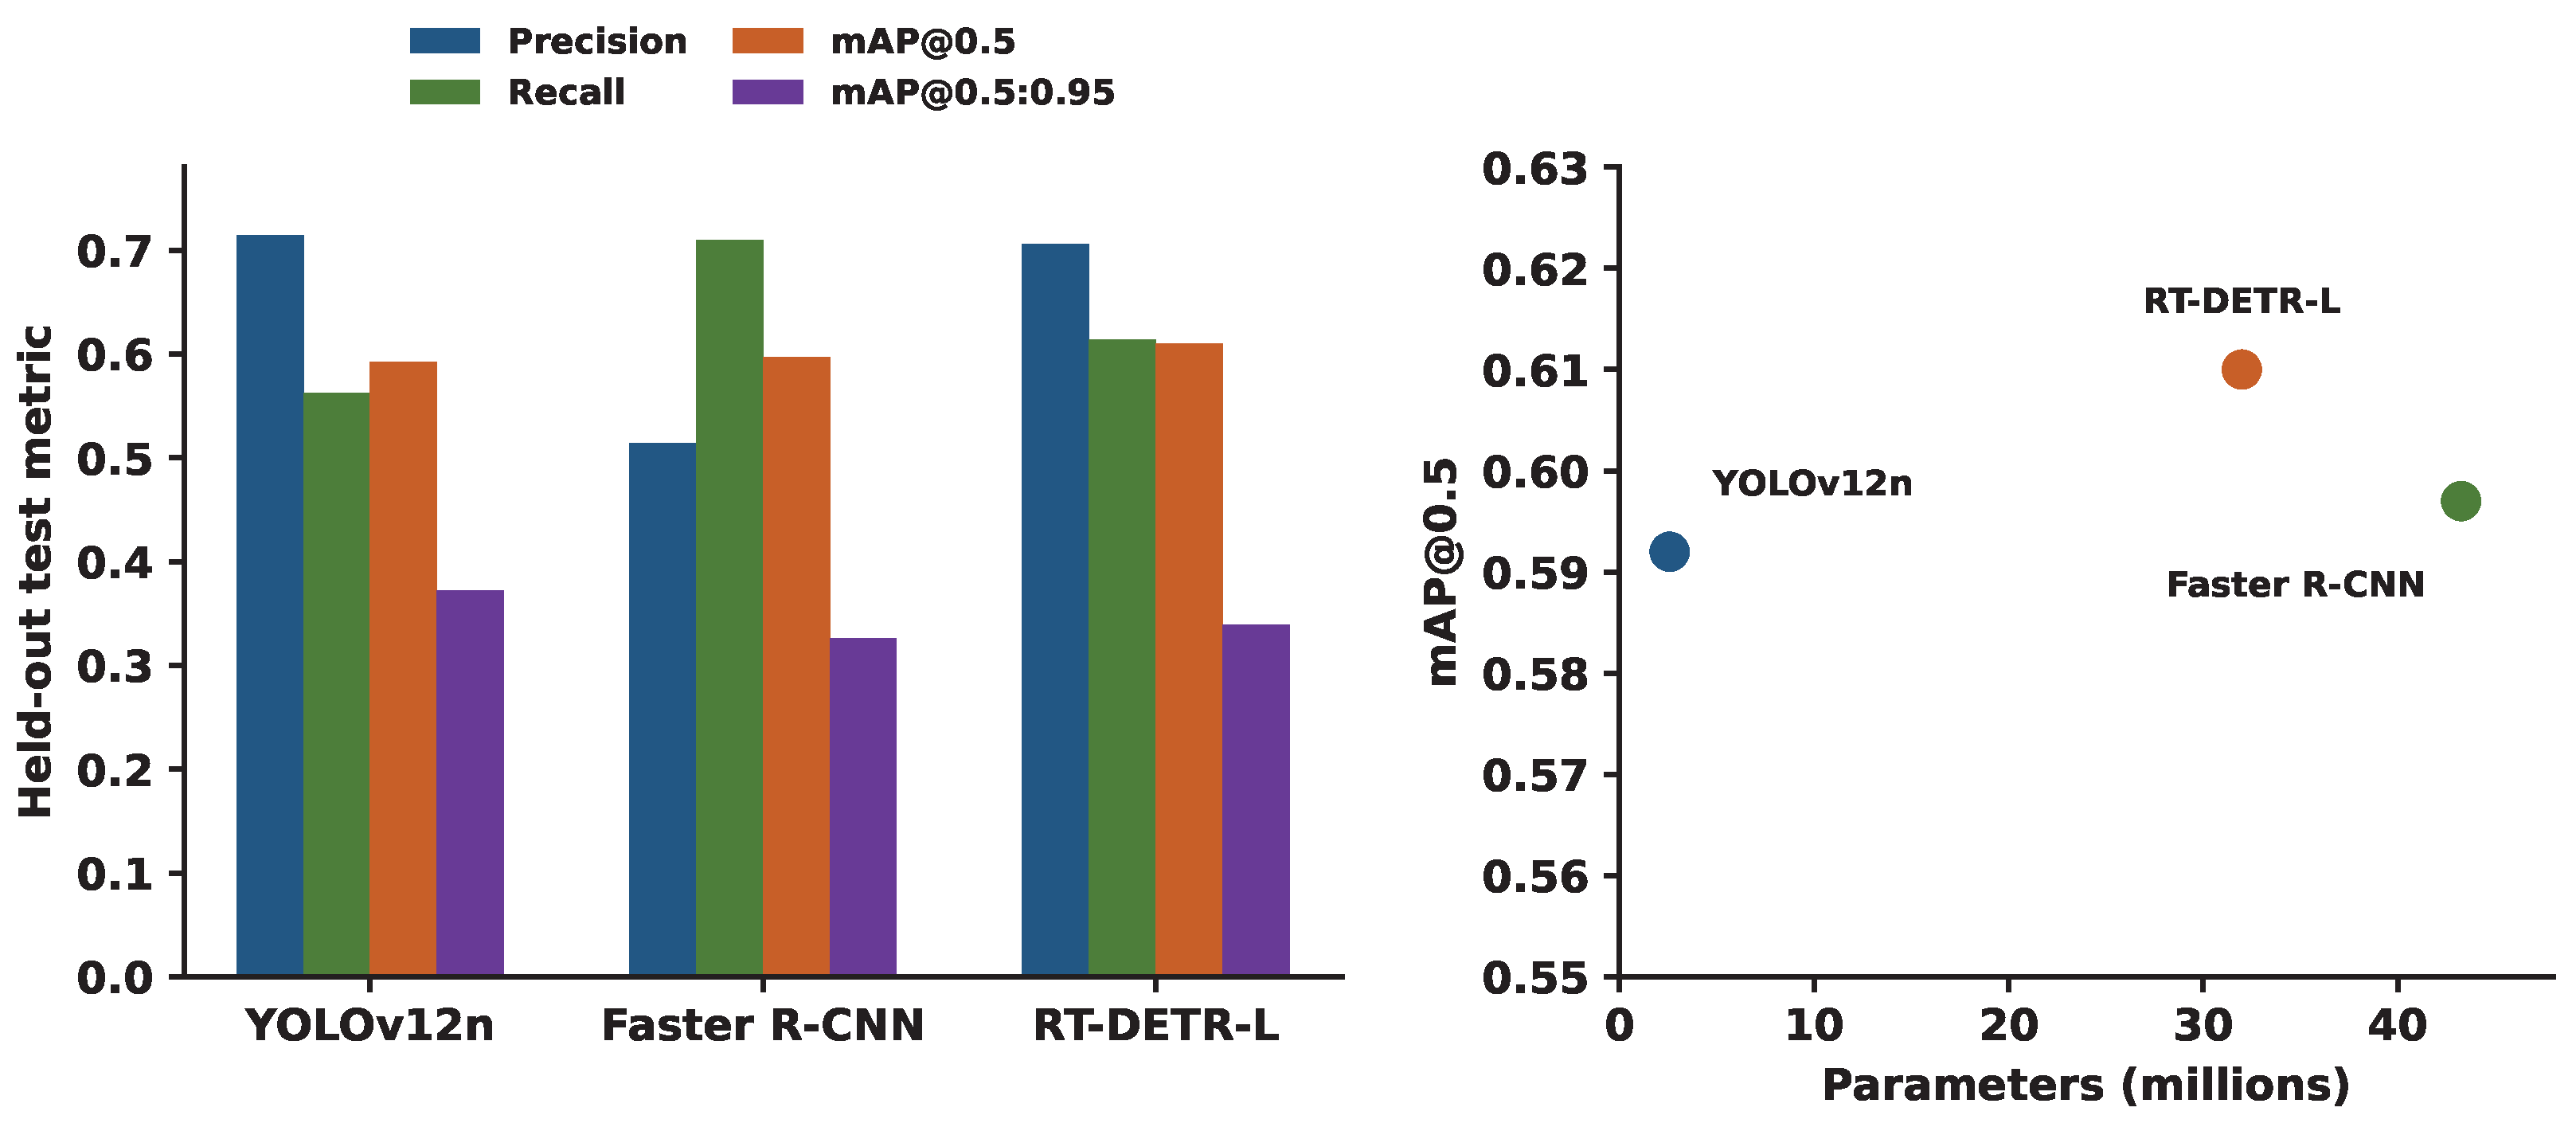
Why YOLOv12n Remains the Controlled Reference: Figure 9 makes the model-selection rationale explicit. YOLOv12n has 2.57 M parameters, approximately 17 times fewer than Faster R-CNN and 12 times fewer than RT-DETR-L, while its mAP@0.5 of 0.592 remains within 0.018 of the best-performing RT-DETR-L result of 0.610. Its mAP@0.5:0.95 of 0.372 is also the highest in the matched comparison. Parameter count is a measure of model scale, not a substitute for a measured latency comparison; the study therefore does not claim that YOLOv12n is faster than the other implementations. YOLOv12n is retained because the resolution ablation and cross-dataset matrix require a single fixed architecture. Keeping it fixed isolates the effects of retained weave detail and training domain, whereas switching to a different detector architecture would confound these controlled analyses with an architectural change.
Figure 9.
Detector trade-off on the LUSITANOv2 held-out test set at . The first panel compares precision, recall, mAP@0.5, and mAP@0.5:0.95. The second relates mAP@0.5 to parameter count. YOLOv12n is retained as the fixed model for the controlled resolution and transfer studies. Precision and recall follow the respective evaluator operating points and should therefore be interpreted cautiously across architectures; parameter count alone is not interpreted as a latency measurement.
Exact-Border and Interior Defects: Table 5 compares exact-border and interior defects. The raw test split contains 1865 boxes, whereas the three detector checkpoints are evaluated on the same 2503-image compatible cohort used by the transfer cache (1850 class-0 boxes; Section 4.2). We performed inference only and did not update weights. A ground-truth box is exact-border when it contacts a native image boundary. For each image, predictions at score were sorted by confidence and matched one-to-one against all ground-truth boxes at IoU . The resulting quantity is ground-truth recall at this fixed operating point, not AP. The subgroup recall values are not directly comparable with the native YOLOv12n recall in Table 4, because this analysis fixes the score threshold at 0.50 whereas the Ultralytics summary reports recall at its maximum-F1 confidence threshold.
Table 5.
Post hoc exact-border subgroup analysis on the compatible 2503-image test cohort. Recall is measured at score with one-to-one matching at IoU ; matched IoU is reported only for matched boxes. is interior minus exact-border recall.
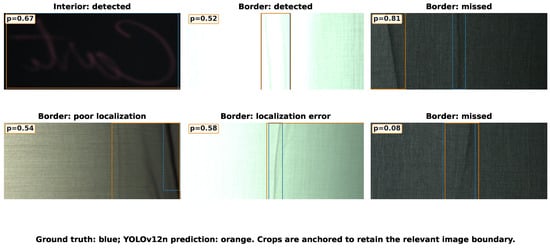
At this common fixed threshold, exact-border boxes have higher recall than interior boxes for YOLOv12n, Faster R-CNN, and RT-DETR-L. Thus, exact contact with the frame boundary is not by itself associated with lower point recall in the evaluated checkpoints. This descriptive result does not establish that boundary contact itself makes defects easier to detect: border contact is correlated with box geometry, size, location, and visual context, none of which is controlled here.
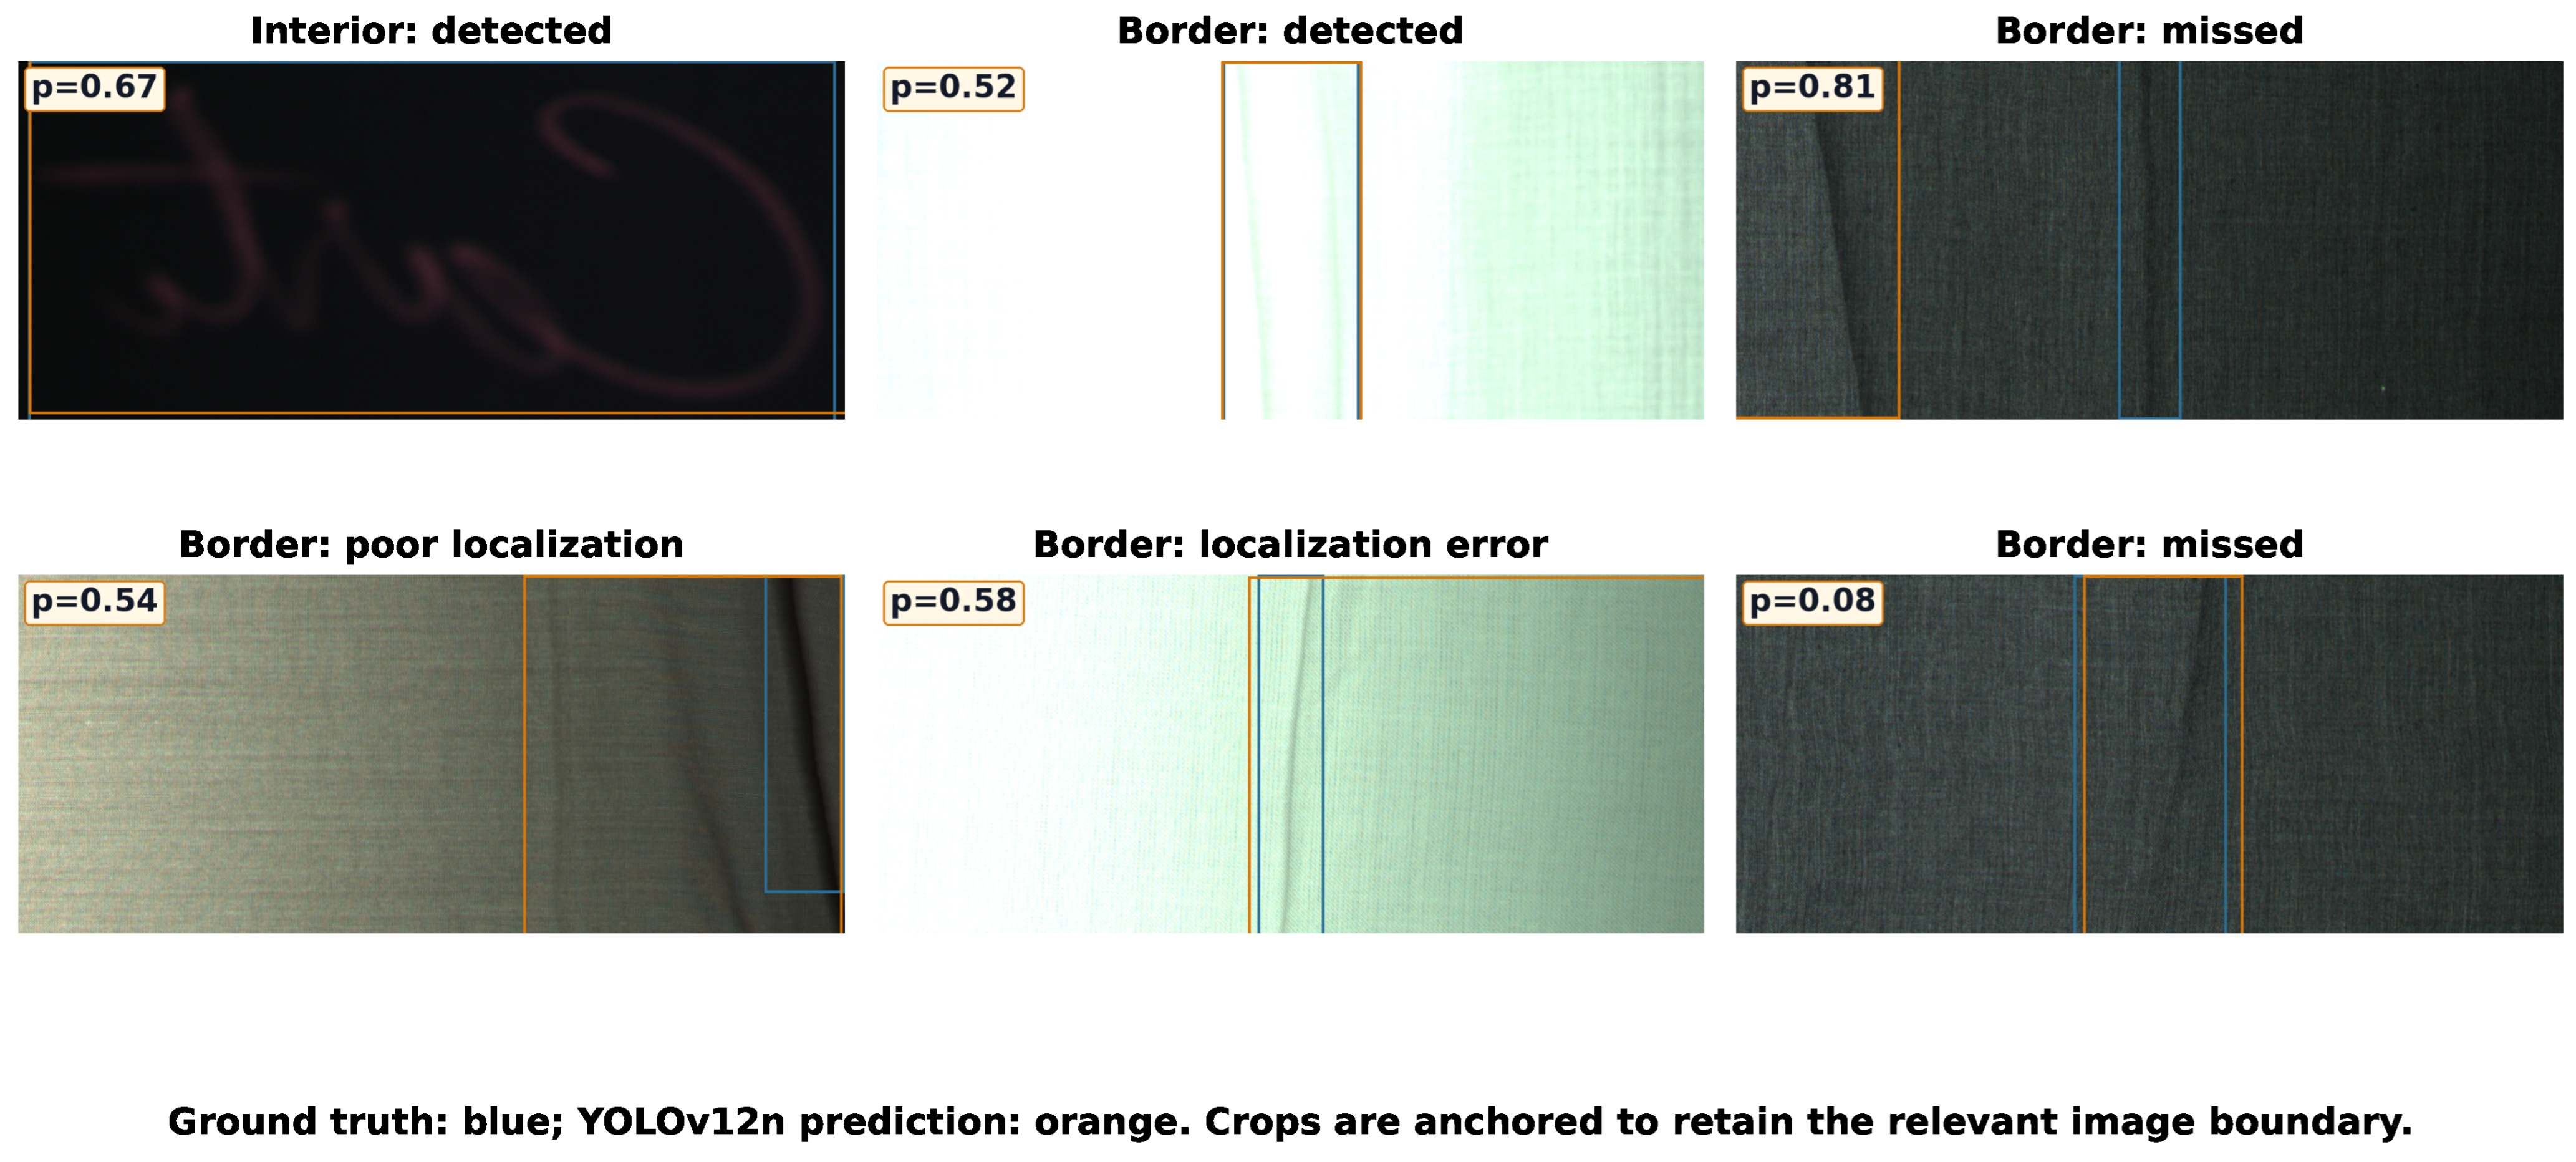
Figure 10 illustrates matched and missed examples for both subgroups.
Figure 10.
Representative fixed-threshold YOLOv12n examples from the compatible test cohort. Ground-truth boxes are blue and predictions are orange; when no prediction reaches the fixed threshold, the closest subthreshold candidate is shown with its confidence. The label p denotes prediction confidence. The panels show both matched and missed cases for interior and exact-border defects, illustrating why boundary contact alone is not a causal explanation of detector behavior.
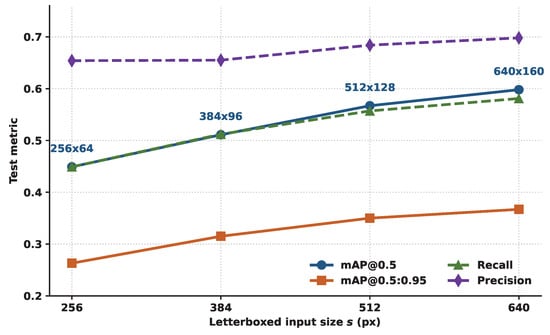
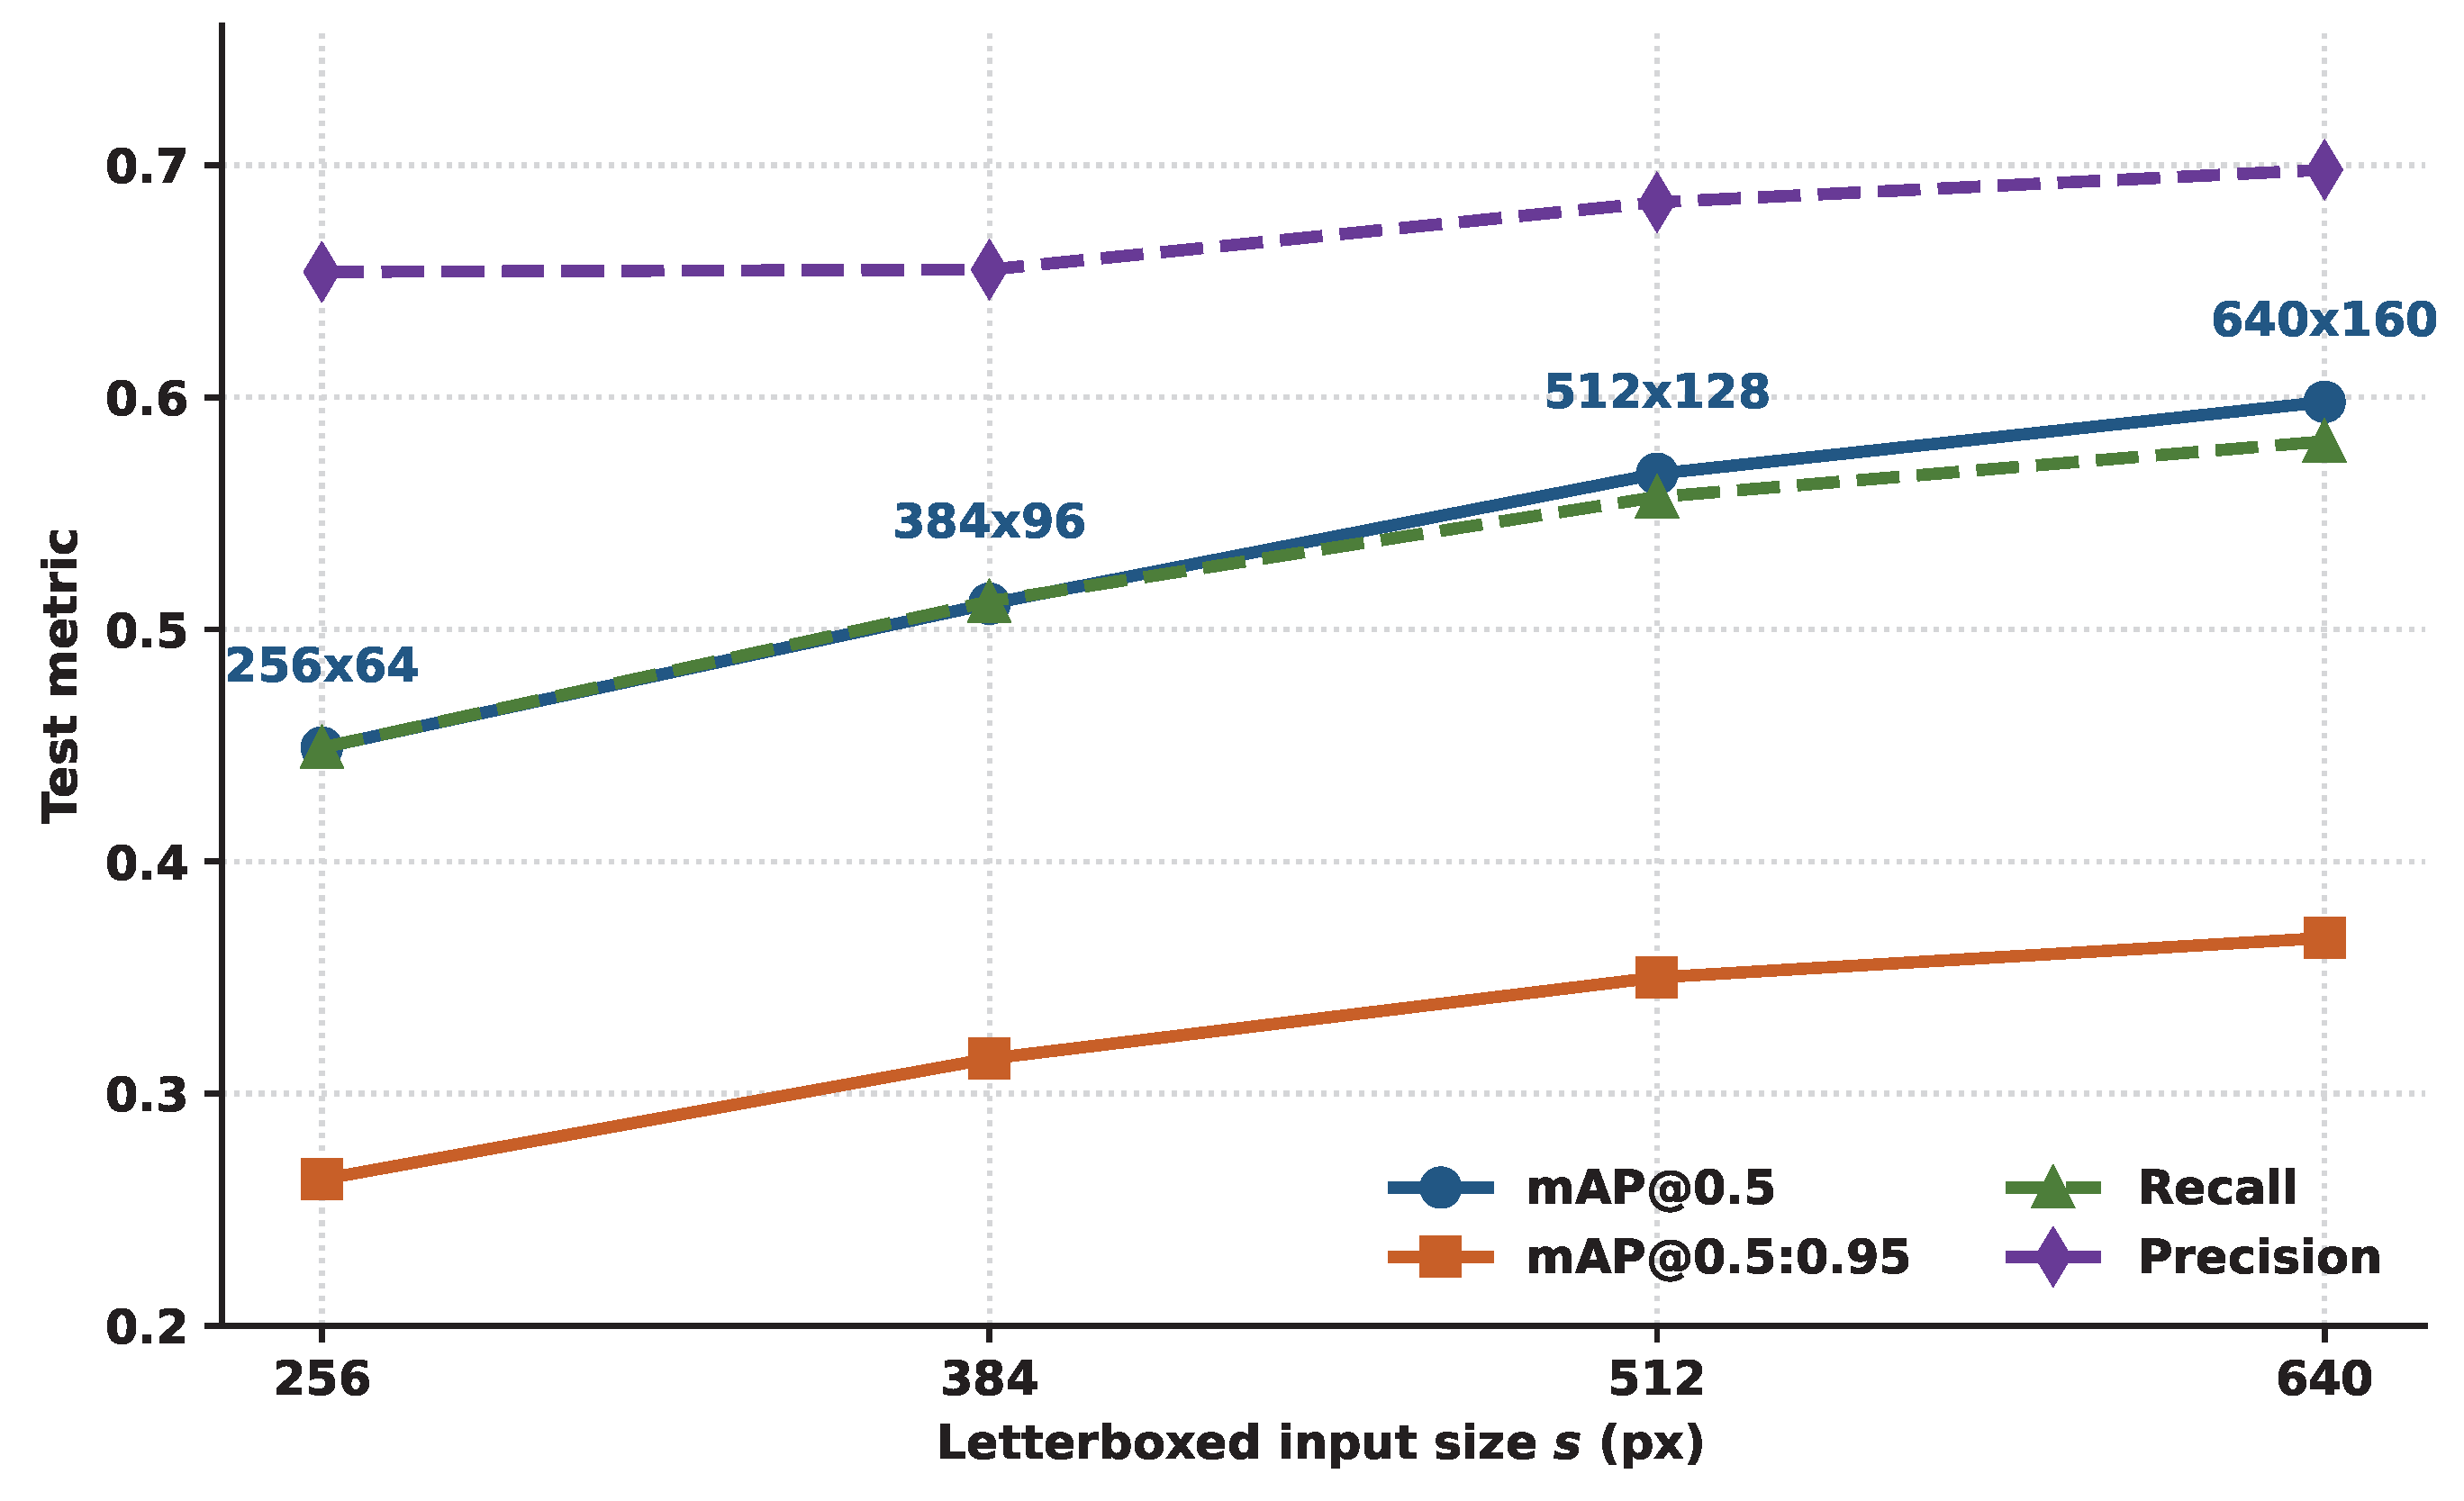
Effect of Input Resolution: Table 6 and Figure 11 report the LUSITANOv2 test metrics of four independently trained YOLOv12n models. Every metric improves as s increases. Raising the letterboxed canvas from 256 to 640 px lifts mAP@0.5 from 0.449 to 0.598, a 33% relative increase, and mAP@0.5:0.95 from 0.263 to 0.367. Recall accounts for most of this gain, increasing from 0.449 to 0.581, whereas precision changes only from 0.654 to 0.698. The additional pixels therefore primarily reduce missed detections rather than substantially changing the false-positive profile.
Table 6.
YOLOv12n input-resolution ablation on the LUSITANOv2 test set. Each row is an independent 100-epoch run. Content is the 4:1 fabric region after isotropic letterboxing to an canvas.
Figure 11.
LUSITANOv2 test metrics versus letterboxed input size s. Annotated labels give the corresponding 4:1 content region. Gains are largest up to and continue, more slowly, at .
The improvement slows as resolution rises: the 256 to 384 step adds 0.062 mAP@0.5, the 384 to 512 step adds 0.056, and the 512 to 640 step adds 0.031. Thus, ( fabric content) captures most of the observed benefit and remains the justified operating point for the matched transfer experiment, while is the most accurate setting and shows that additional weave detail still helps. Inference time remains on the order of 1.7 ms per image across this range. The ablation therefore provides an empirical basis for aspect-ratio-preserving letterboxing: even the content region is too coarse for this line-scan stream, and the models still process downsampled full frames rather than cropped native-resolution patches.
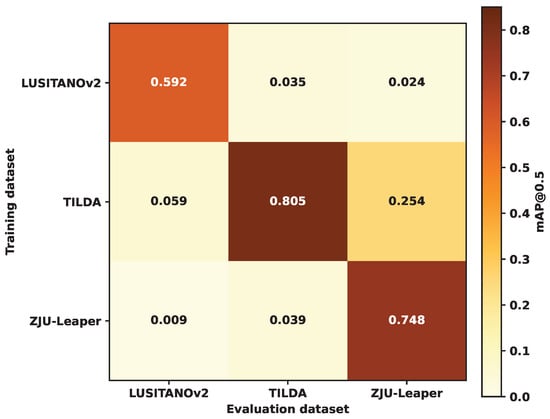
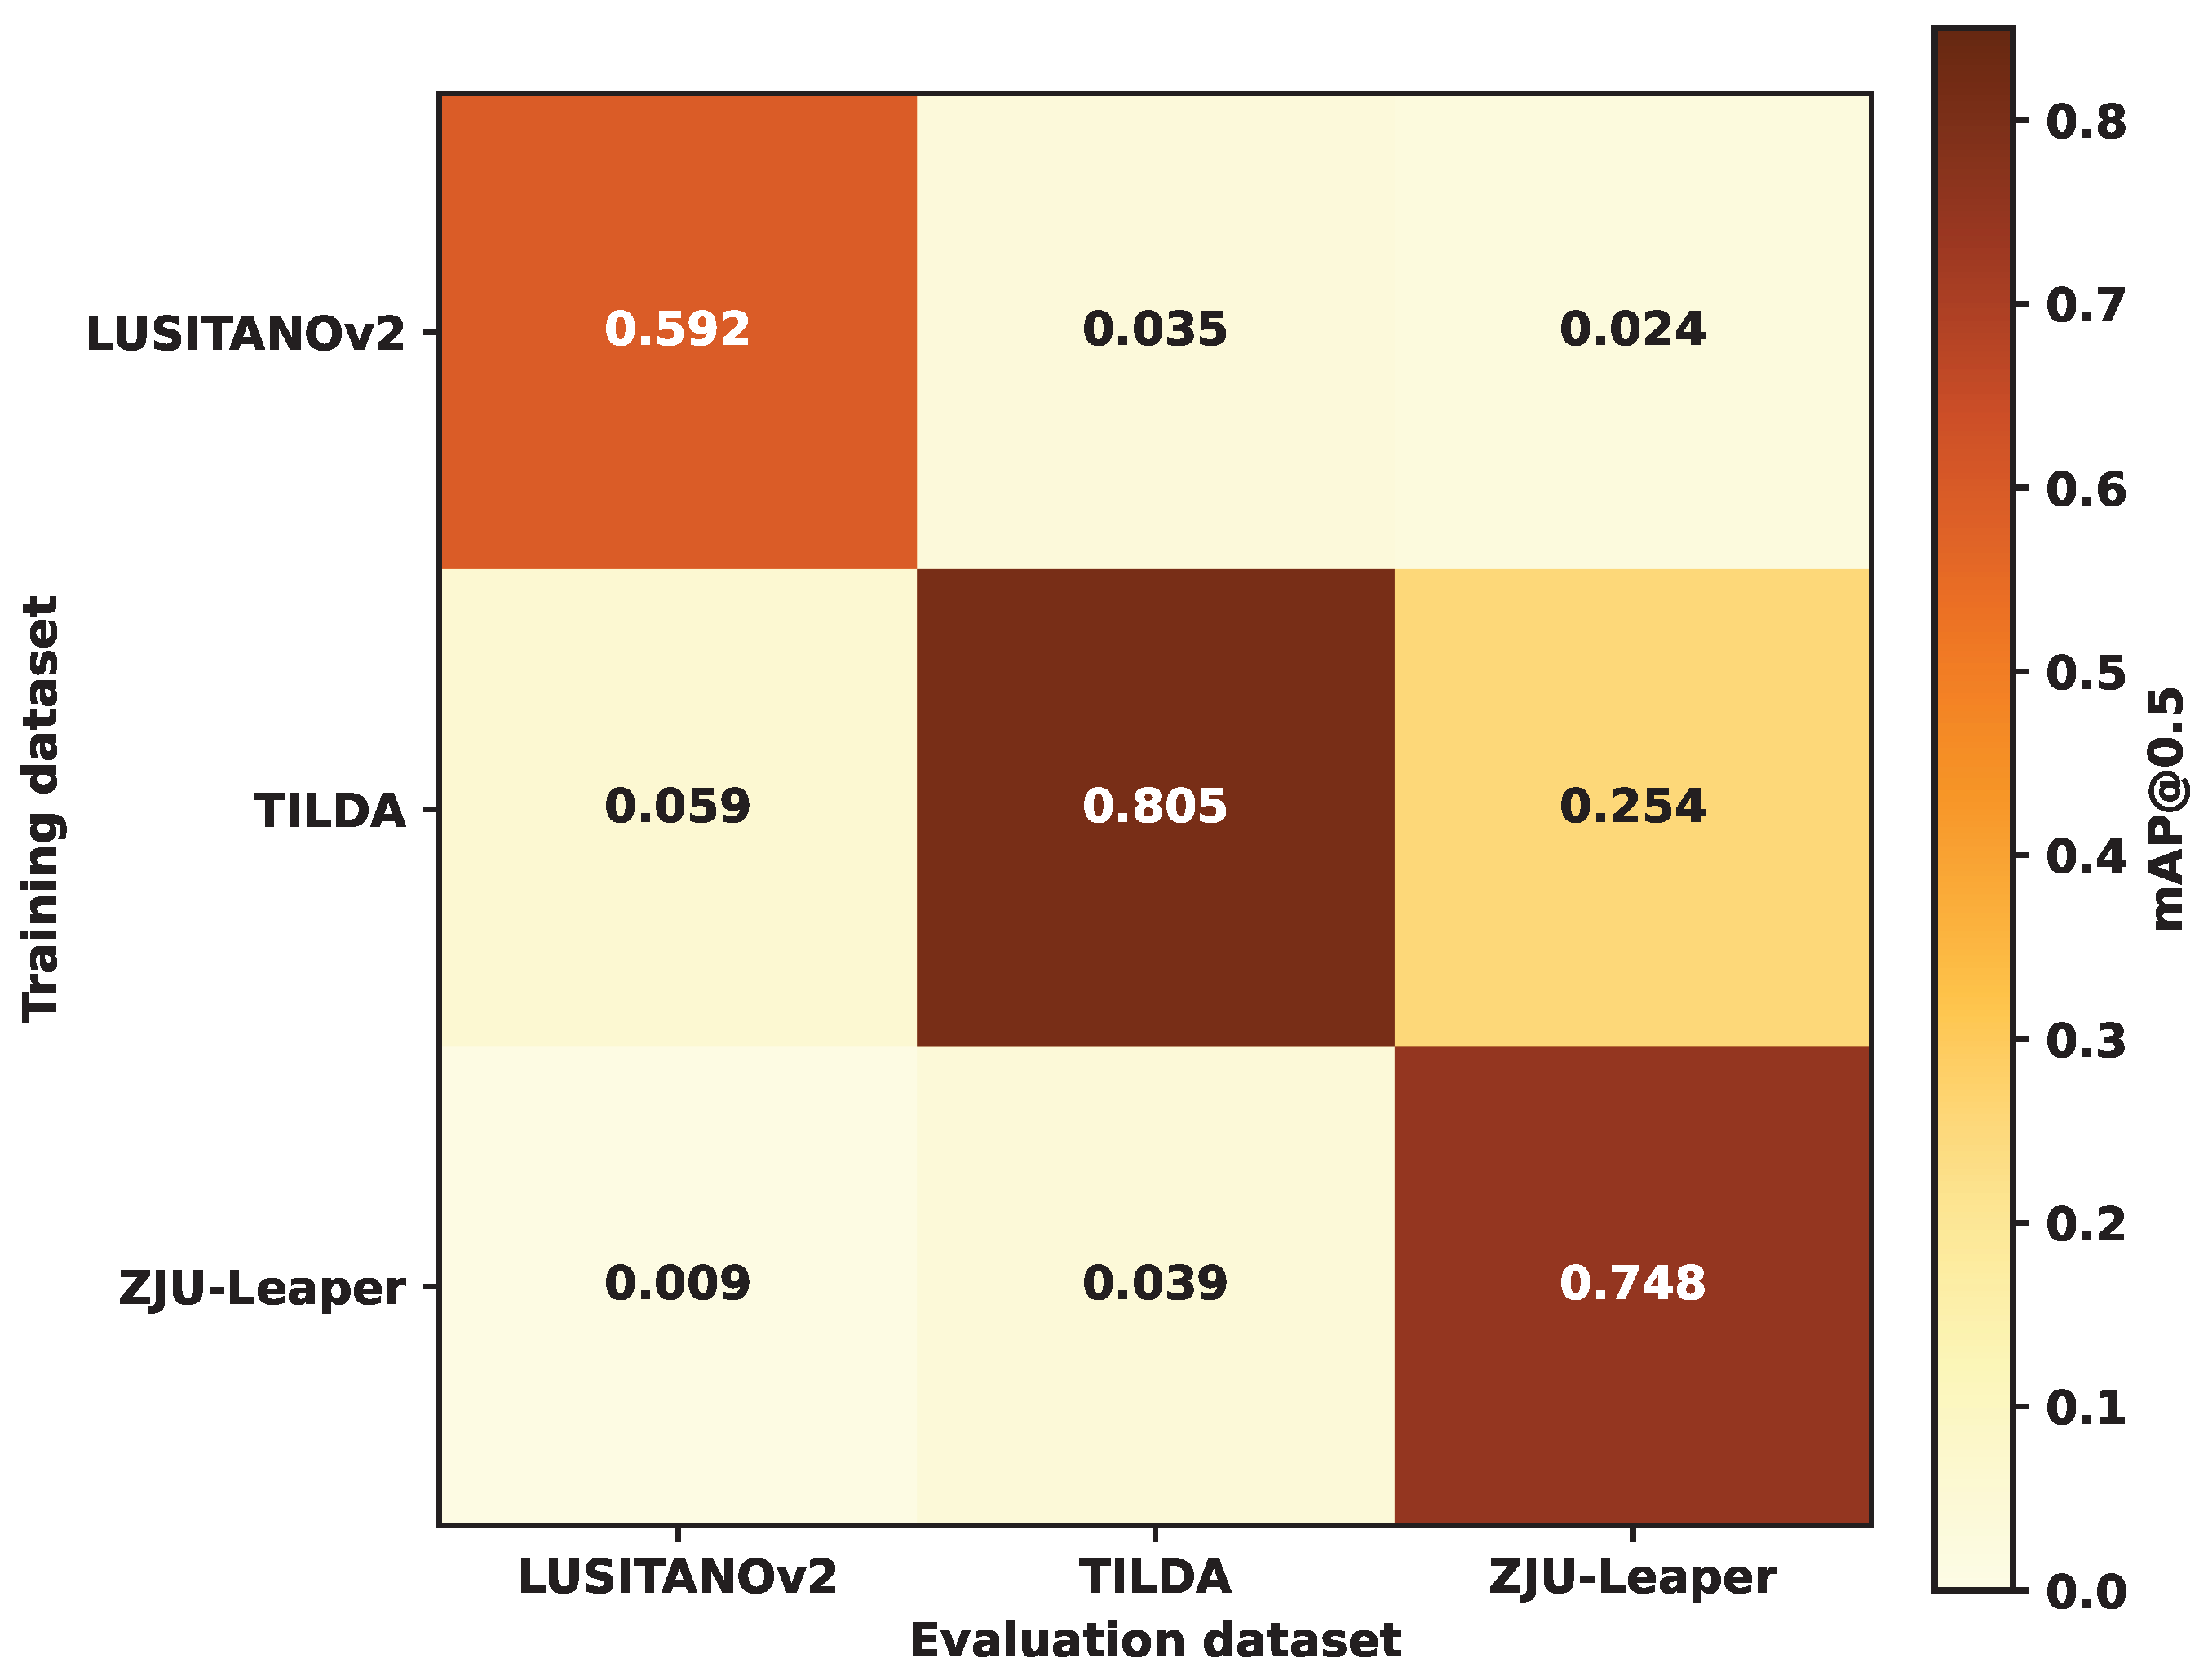
Cross-Dataset Transfer: Table 7 and Figure 12 summarize the zero-shot evaluation. The diagonal entries show that the matched YOLOv12n recipe reaches 0.805 mAP@0.5 on TILDA and 0.748 on ZJU-Leaper, compared with 0.592 on LUSITANOv2. The same detector that is strong on the existing public laboratory sets therefore leaves substantial residual error on the industrial line-scan test set. This result is consistent with the combined effects of wide-frame geometry, fine-scale defect appearance, line-scan acquisition, and production-domain variability, rather than with an intrinsic weakness of YOLOv12n.
Table 7.
Zero-shot YOLOv12n transfer among LUSITANOv2, TILDA, and ZJU-Leaper. All models use , 100 epochs, and the same optimizer. In-domain entries are on the diagonal. The LUSITANOv2 cohort contains 2503 images/1850 compatible boxes after the documented nine-file filter; TILDA has 810/619 and ZJU-Leaper 594/938.
Figure 12.
mAP@0.5 for every train→eval pair. The diagonal is in-domain performance; off-diagonal cells are zero-shot transfer. Laboratory-to-laboratory transfer (TILDA→ZJU-Leaper) is the only non-trivial off-diagonal entry; transfer into or out of LUSITANOv2 is near-zero.
Off-diagonal transfer is markedly weaker. A model trained on LUSITANOv2 reaches 0.035 mAP@0.5 on TILDA and 0.024 on ZJU-Leaper, representing relative decreases of 94% and 96% from its in-domain value. In the reverse direction, TILDA to LUSITANOv2 yields 0.059 and ZJU-Leaper to LUSITANOv2 yields 0.009. The only non-trivial off-diagonal entry is TILDA to ZJU-Leaper at 0.254; both are area-scan or near-square laboratory collections, yet this is still far below ZJU-Leaper’s 0.748 in-domain score. Transfer among laboratory sets is therefore incomplete, but it is materially stronger than transfer into or out of LUSITANOv2.
The matrix is consistent with a large domain gap involving frame geometry, moving-web line-scan acquisition, controlled laboratory capture, and visual defect appearance. A shared one-class mapping aligns label names but not necessarily visual semantics. The experiment measures zero-shot transfer only, not a domain-adaptation method, and it does not isolate the causal contribution of individual factors. Its practical implication is nevertheless clear: a detector that performs well on TILDA or ZJU-Leaper is not automatically ready for an operational line-scan station, and the converse is also true. LUSITANOv2 therefore provides a target domain with a documented transfer gap for future adaptation studies.
5.2. One-Class Anomaly Detection Results
Image-Level Anomaly Detection: Table 8 summarizes the image-level results for the nine one-class methods.
Table 8.
Image-level one-class anomaly-detection results. Pixel AUROC is not reported because the archived evaluation has no common pixel-level protocol or masks.
The reported one-class results are moderate overall: SuperSimpleNet obtains the highest AUROC at 0.72, PaDiM follows at 0.68, and the mean across the nine reported methods is 0.59. These values show that image-level anomaly scoring remains challenging on this dataset, but they do not by themselves identify why one method outperforms another. DRAEM has the lowest archived aggregate AUROC at 0.34. The raw score arrays, data manifests, and evaluation configuration needed to audit score polarity and the positive-class convention are not available in this repository. No retrospective score inversion is applied, and no mechanism-level claim is made from this result. Future work can test whether textile-specific priors, multi-scale representations, or line-scan sequence context improve one-class detection.
6. Discussion
Benchmark interpretation: The results establish LUSITANOv2 as a demanding benchmark for both in-domain detection and cross-dataset transfer. Among the three supervised detectors, RT-DETR-L achieves the highest mAP@0.5 at 0.610, while YOLOv12n achieves the highest mAP@0.5:0.95 at 0.372. Under their respective evaluator operating points, Faster R-CNN reports a recall of 0.710 and YOLOv12n reports a precision of 0.714. The post hoc border analysis uses a common operating threshold, so it complements rather than replaces these native-evaluator metrics. Repetitive yet variable textile texture remains a central challenge because small changes in weave structure, yarn orientation, illumination, and fabric tension can resemble true defects. Exact boundary contact is also common, affecting 65.08% of valid boxes. However, all three evaluated detectors have higher fixed-threshold recall on exact-border boxes, so the present evidence does not support a simple border penalty. Boundary status remains correlated with box geometry and location, and therefore does not by itself determine the effect of partial context.
The resolution study reinforces this interpretation at the level of sampling rather than architecture. Native 4:1 frames are not naturally represented by a square detector canvas: letterboxing determines how much of the weave remains after downsampling. The monotonic gains in recall and mAP from to fabric content show that many LUSITANOv2 defects are spatially fine relative to the reduced grid. Selecting is consequently a measured compromise that recovers most of the available gain, not a default inherited from square-image training. The residual improvement at motivates native-resolution patches and rectangular batches, which may retain more useful weave detail.
Domain shift and one-class learning: The cross-dataset matrix turns the domain-shift argument from Section 1 into a measured result. In-domain YOLOv12n is competent on all three datasets, reaching 0.59–0.80 mAP@0.5, whereas zero-shot transfer is weak. The reduction is largest when acquisition physics differ, from line-scan production imagery to area-scan laboratory imagery, and smallest between the two laboratory datasets (TILDA→ZJU-Leaper). Because the model recipe and label space are held fixed, this pattern is consistent with LUSITANOv2 occupying a distinct visual domain rather than with an artifact of class mapping or inadequate training. These results motivate domain-adaptation and domain-generalization strategies before cross-domain deployment, and LUSITANOv2 provides a public target on which to test them. The one-class results tell a related story: SuperSimpleNet and PaDiM achieve the strongest AUROC values, but the best value of 0.72 remains moderate. Generic anomaly models therefore also struggle with structural textile variation, while the missing raw DRAEM artifacts preclude a method-specific interpretation of its low result. These findings are especially relevant because the data were acquired directly from an operational textile line with an industrial line-scan camera, capturing illumination, positioning, motion, and production variation that are difficult to reproduce in controlled laboratory collection.
Scope and limitations: LUSITANOv2 is a realistic and reproducible industrial benchmark, but it remains a single-site resource. All images come from one inspection station at Paulo de Oliveira, S.A., using one camera placement and a largely fixed directional LED configuration; the dataset cannot therefore establish generalization across factories, production lines, cameras, or illumination systems. Its labels are class-agnostic defect boxes rather than a taxonomy, severity labels, or pixel-level masks, so the current release cannot fairly support fine-grained supervised classification or segmentation. The wide native frames are commonly letterboxed to square canvases, reducing the default fabric region to pixels, and the resolution experiment shows that this sampling loss matters. Although the subgroup analysis finds no simple recall penalty for border-touching defects, boundary contact co-varies with geometry and context and cannot replace targeted sequential or overlapping-tile studies. Finally, the study does not provide a matched latency, throughput, FLOPs, or memory comparison across all detector implementations, and the transfer matrix measures a domain gap without evaluating a domain-adaptation or domain-generalization method. These boundaries define the appropriate interpretation of the present baselines rather than limiting the value of the dataset.
Future research: The most direct next step is multi-site acquisition across factories, production lines, fabric programs, cameras, and lighting conditions. Richer labels, including defect taxonomy, severity, and pixel-level masks, would enable fair multi-class detection and supervised segmentation. Boundary-aware sequential and overlapping-tile methods should be evaluated separately for interior and border-touching defects, while rectangular batches, higher-resolution processing, and native-resolution patches can address the loss of detail identified by the resolution study. The zero-shot results provide a baseline for domain-adaptation and domain-generalization research, which should pair accuracy with documented throughput on matched hardware. Finally, textile-aware one-class methods can exploit weave regularity and continuous line-scan context instead of treating every frame as an independent generic surface sample.
7. Conclusions
LUSITANOv2 introduces a real-world fabric-defect benchmark acquired at an active textile inspection station with an industrial line-scan camera and directional illumination. The dataset contains 25,120 high-resolution RGB images, including defect-containing and defect-free material, and 18,557 class-agnostic defect boxes. Its native 4:1 frame geometry, repeated textile structure, production-line variation, and frequent boundary-touching annotations distinguish it from controlled laboratory collections. This paper establishes reproducible baselines for supervised localization, image-level one-class anomaly detection, input-resolution sensitivity, border subgroups, and zero-shot cross-dataset transfer. RT-DETR-L achieves the highest mAP@0.5 in the matched detector comparison at 0.610, followed by Faster R-CNN at 0.597 and YOLOv12n at 0.592. The three models nevertheless exhibit different operating characteristics across precision, recall, localization accuracy, and model size. In a separate controlled resolution study, YOLOv12n reaches 0.598 mAP@0.5 with retained fabric content, demonstrating that preservation of native weave detail is consequential rather than incidental. The best image-level one-class result is an AUROC of 0.72, and the zero-shot matrix reveals marked degradation between LUSITANOv2 and laboratory datasets despite stronger in-domain performance. At a shared fixed threshold, exact-border boxes do not show lower recall for the completed detectors, but this descriptive result does not isolate the causal effect of boundary contact because border status is associated with geometry and location.
The principal contribution of LUSITANOv2 is thus not a claim that one existing model solves industrial inspection, but a documented and realistic setting in which future methods can be evaluated fairly. The benchmark identifies clear priorities: retain the native aspect ratio and fine weave detail, study boundary context with sequential or overlapping views, collect data across sites and acquisition conditions, enrich the labels, and evaluate domain adaptation together with measured deployment efficiency. By making these challenges explicit and providing common baselines, LUSITANOv2 supports the development of inspection systems that can progress from laboratory accuracy toward robust use in active textile production.
Author Contributions
R.C. led the research, performed the majority of the work, and prepared the original manuscript. M.R. contributed to the experiments and subsequent additions to the study. H.P. supervised the research. All authors have read and agreed to the published version of the manuscript.
Funding
This work was funded by EU (NextGenerationEU program) and by PRR: Plano de Recuperação e Resiliência, within the scope of the “Projeto Lusitano—Agenda Mobilizadora para a Inovação Empresarial da Indústria Têxtil e do Vestuário de Portugal” (2022-C05i0101-02, SGO 2030). Also, it was co-funded by national funds through FCT – Fundação para a Ciência e a Tecnologia, I.P., and by EU funds under project/support UID/50008/2025 – Instituto de Telecomunicações, with DOI identifier https://doi.org/10.54499/UID/50008/2025.
Data Availability Statement
The LUSITANOv2 dataset presented in this study is openly available on Zenodo at https://doi.org/10.5281/zenodo.22150068 [75].
Conflicts of Interest
The authors declare no conflicts of interest. The funders had no role in the design of the study; in the collection, analyses, or interpretation of data; in the writing of the manuscript; or in the decision to publish the results.
Abbreviations
The following abbreviations are used in this manuscript:
| AUROC | Area under the receiver operating characteristic curve |
| R-CNN | Region-based convolutional neural network |
References
- Rasheed, A.; Zafar, B.; Rasheed, A.; Ali, N.; Sajid, M.; Dar, S.H.; Habib, U.; Shehryar, T.; Mahmood, M.T. Fabric defect detection using computer vision techniques: A comprehensive review. Math. Probl. Eng. 2020, 2020, 8189403. [Google Scholar] [CrossRef] [Scilit]
- Hanbay, K.; Talu, M.F.; Özgüven, Ö.F. Fabric defect detection systems and methods—A systematic literature review. Optik 2016, 127, 11960–11973. [Google Scholar] [CrossRef] [Scilit]
- Song, K.; Petrou, M.; Kittler, J. Texture defect detection: A review. Appl. Artif. Intell. X Mach. Vis. Robot. 1992, 1708, 99–106. [Google Scholar] [CrossRef] [Scilit]
- Ngan, H.Y.; Pang, G.K.; Yung, N.H. Automated fabric defect detection—A review. Image Vis. Comput. 2011, 29, 442–458. [Google Scholar] [CrossRef] [Scilit]
- Haralick, R.M.; Shanmugam, K.; Dinstein, I. Textural Features for Image Classification. IEEE Trans. Syst. Man Cybern. 1973, SMC-3, 610–621. [Google Scholar] [CrossRef] [Scilit]
- Monadjemi, A. Towards Efficient Texture Classification and Abnormality Detection. Ph.D. Thesis, University of Bristol, Bristol, UK, 2004. [Google Scholar]
- Chan, C.h.; Pang, G.K. Fabric defect detection by Fourier analysis. IEEE Trans. Ind. Appl. 2000, 36, 1267–1276. [Google Scholar] [CrossRef] [Scilit]
- Liang, Z.; Xu, B.; Chi, Z.; Feng, D. Intelligent characterization and evaluation of yarn surface appearance using saliency map analysis, wavelet transform and fuzzy ARTMAP neural network. Expert Syst. Appl. 2012, 39, 4201–4212. [Google Scholar] [CrossRef] [Scilit]
- Mak, K.L.; Peng, P. An automated inspection system for textile fabrics based on Gabor filters. Robot. Comput.-Integr. Manuf. 2008, 24, 359–369. [Google Scholar] [CrossRef] [Scilit]
- Vilnrotter, F.M.; Nevatia, R.; Price, K.E. Structural analysis of natural textures. IEEE Trans. Pattern Anal. Mach. Intell. 1986, PAMI-8, 76–89. [Google Scholar] [CrossRef] [PubMed]
- Zhang, Y.; Jiang, G.; Yao, J.; Tong, Y. Intelligent segmentation of jacquard warp-knitted fabric using a multiresolution Markov random field with adaptive weighting in the wavelet domain. Text. Res. J. 2014, 84, 28–39. [Google Scholar] [CrossRef] [Scilit]
- Xu, Y.; Meng, F.; Wang, L.; Zhang, M.; Wu, C. Fabric surface defect detection based on GMRF Model. In Proceedings of the 2021 2nd International Conference on Artificial Intelligence and Information Systems, Chongqing, China, 28–30 May 2021; pp. 1–4. [Google Scholar] [CrossRef] [Scilit]
- Li, Z.; Liu, F.; Yang, W.; Peng, S.; Zhou, J. A survey of convolutional neural networks: Analysis, applications, and prospects. IEEE Trans. Neural Netw. Learn. Syst. 2022, 33, 6999–7019. [Google Scholar] [CrossRef] [Scilit] [PubMed]
- Ren, S.; He, K.; Girshick, R.; Sun, J. Faster r-cnn: Towards real-time object detection with region proposal networks. Adv. Neural Inf. Process. Syst. 2015, 28, 91–99. [Google Scholar]
- Redmon, J.; Divvala, S.; Girshick, R.; Farhadi, A. You only look once: Unified, real-time object detection. In Proceedings of the IEEE Conference on Computer Vision and Pattern Recognition, Las Vegas, NV, USA, 27–30 June 2016; pp. 779–788. [Google Scholar]
- Jing, J.; Wang, Z.; Rätsch, M.; Zhang, H. Mobile-Unet: An efficient convolutional neural network for fabric defect detection. Text. Res. J. 2022, 92, 30–42. [Google Scholar] [CrossRef] [Scilit]
- Carrilho, R.; Yaghoubi, E.; Lindo, J.; Hambarde, K.; Proença, H. Toward automated fabric defect detection: A survey of recent computer vision approaches. Electronics 2024, 13, 3728. [Google Scholar] [CrossRef] [Scilit]
- Andersen, I. TILDA Fabric Dataset. 2021. Available online: https://universe.roboflow.com/irvin-andersen/tilda-fabric (accessed on 13 September 2026).
- Ngan, H.Y.; Pang, G.K. Regularity analysis for patterned texture inspection. IEEE Trans. Autom. Sci. Eng. 2008, 6, 131–144. [Google Scholar] [CrossRef] [Scilit]
- Zhang, C.; Feng, S.; Wang, X.; Wang, Y. Zju-leaper: A benchmark dataset for fabric defect detection and a comparative study. IEEE Trans. Artif. Intell. 2020, 1, 219–232. [Google Scholar] [CrossRef] [Scilit]
- Ozek, A.; Seckin, M.; Demircioglu, P.; Bogrekci, I. Artificial intelligence driving innovation in textile defect detection. Textiles 2025, 5, 12. [Google Scholar] [CrossRef] [Scilit]
- Silvestre-Blanes, J.; Albero-Albero, T.; Miralles, I.; Pérez-Llorens, R.; Moreno, J. A public fabric database for defect detection methods and results. AUTEX Res. J. 2019, 19, 363–374. [Google Scholar] [CrossRef] [Scilit]
- Pérez-Llorens, R.; Albero-Albero, T.; Silvestre-Blanes, J. A Dataset of Raw Fabric Grayscale Images for Defect Detection. Data 2026, 11, 116. [Google Scholar] [CrossRef] [Scilit]
- Zhao, S.; Yin, L.; Zhang, J.; Wang, J.; Zhong, R. Real-time fabric defect detection based on multi-scale convolutional neural network. IET Collab. Intell. Manuf. 2020, 2, 189–196. [Google Scholar] [CrossRef] [Scilit]
- Li, C.; Li, J.; Li, Y.; He, L.; Fu, X.; Chen, J. Fabric defect detection in textile manufacturing: A survey of the state of the art. Secur. Commun. Netw. 2021, 2021, 9948808. [Google Scholar] [CrossRef] [Scilit]
- Jain, A.K.; Duin, R.P.W.; Mao, J. Statistical pattern recognition: A review. IEEE Trans. Pattern Anal. Mach. Intell. 2000, 22, 4–37. [Google Scholar] [CrossRef] [Scilit]
- Sakhare, K.; Kulkarni, A.; Kumbhakarn, M.; Kare, N. Spectral and spatial domain approach for fabric defect detection and classification. In Proceedings of the 2015 International Conference on Industrial Instrumentation and Control (ICIC), Pune, India, 28–30 May 2015; pp. 640–644. [Google Scholar]
- Mahajan, P.; Kolhe, S.; Patil, P. A review of automatic fabric defect detection techniques. Adv. Comput. Res. 2009, 1, 18–29. [Google Scholar]
- Xie, X. A review of recent advances in surface defect detection using texture analysis techniques. ELCVIA Electron. Lett. Comput. Vis. Image Anal. 2008, 7, 1. [Google Scholar] [CrossRef] [Scilit]
- Pietikäinen, M.; Mäenpää, T.; Viertola, J. Color texture classification with color histograms and local binary patterns. In Proceedings of the 2nd International Workshop on Texture Analysis and Synthesis, Copenhagen, Denmark, 1 June 2002; pp. 109–112. [Google Scholar]
- Zhang, Y.F.; Bresee, R.R. Fabric defect detection and classification using image analysis. Text. Res. J. 1995, 65, 1–9. [Google Scholar] [CrossRef] [Scilit]
- Tilocca, A.; Borzone, P.; Carosio, S.; Durante, A. Detecting fabric defects with a neural network using two kinds of optical patterns. Text. Res. J. 2002, 72, 545–550. [Google Scholar] [CrossRef] [Scilit]
- Srilatha, N.; Reddy, V.L. Image Texture Analysis with Local Binary Patterns: A Review. In Proceedings of the 2021 Innovations in Power and Advanced Computing Technologies (i-PACT), Kuala Lumpur, Malaysia, 27–29 November 2021; pp. 1–6. [Google Scholar]
- Mallat, S.G. A theory for multiresolution signal decomposition: The wavelet representation. IEEE Trans. Pattern Anal. Mach. Intell. 1989, 11, 674–693. [Google Scholar] [CrossRef] [Scilit]
- Daugman, J.G. Two-dimensional spectral analysis of cortical receptive field profiles. Vis. Res. 1980, 20, 847–856. [Google Scholar] [CrossRef] [Scilit] [PubMed]
- Hanbay, K.; Talu, M.F.; Özgüven, Ö.F.; Öztürk, D. Real-time detection of knitting fabric defects using shearlet transform. Text. Appar. 2019, 29, 1–10. [Google Scholar] [CrossRef] [Scilit]
- Deotale, N.T.; Sarode, T.K. Fabric defect detection adopting combined GLCM, Gabor wavelet features and random decision forest. 3D Res. 2019, 10, 5. [Google Scholar] [CrossRef] [Scilit]
- Haralick, R.M. Statistical and structural approaches to texture. Proc. IEEE 1979, 67, 786–804. [Google Scholar] [CrossRef] [Scilit]
- Wilson, R.; Li, C.T. A class of discrete multiresolution random fields and its application to image segmentation. IEEE Trans. Pattern Anal. Mach. Intell. 2003, 25, 42–56. [Google Scholar] [CrossRef] [Scilit]
- Deng, H.; Clausi, D.A. Gaussian MRF rotation-invariant features for image classification. IEEE Trans. Pattern Anal. Mach. Intell. 2004, 26, 951–955. [Google Scholar] [CrossRef] [Scilit] [PubMed]
- Kahraman, Y.; Durmuşoğlu, A. Deep learning-based fabric defect detection: A review. Text. Res. J. 2023, 93, 1485–1503. [Google Scholar] [CrossRef] [Scilit]
- Jing, J.F.; Ma, H.; Zhang, H.H. Automatic fabric defect detection using a deep convolutional neural network. Color. Technol. 2019, 135, 213–223. [Google Scholar] [CrossRef] [Scilit]
- Jeyaraj, P.R.; Samuel Nadar, E.R. Computer vision for automatic detection and classification of fabric defect employing deep learning algorithm. Int. J. Cloth. Sci. Technol. 2019, 31, 510–521. [Google Scholar] [CrossRef] [Scilit]
- Jeyaraj, P.R.; Nadar, E.R.S. Effective textile quality processing and an accurate inspection system using the advanced deep learning technique. Text. Res. J. 2020, 90, 971–980. [Google Scholar] [CrossRef] [Scilit]
- Kahraman, Y.; Durmuşoğlu, A. Classification of defective fabrics using capsule networks. Appl. Sci. 2022, 12, 5285. [Google Scholar] [CrossRef] [Scilit]
- Liu, W.; Anguelov, D.; Erhan, D.; Szegedy, C.; Reed, S.; Fu, C.Y.; Berg, A.C. Ssd: Single shot multibox detector. In Proceedings of the Computer Vision–ECCV 2016: 14th European Conference, Amsterdam, The Netherlands, 11–14 October 2016; Proceedings, Part I. Springer: Cham, Switzerland, 2016; pp. 21–37. [Google Scholar]
- Girshick, R. Fast r-cnn. In Proceedings of the IEEE International Conference on Computer Vision, Santiago, Chile, 7–13 December 2015; pp. 1440–1448. [Google Scholar]
- Soviany, P.; Ionescu, R.T. Optimizing the trade-off between single-stage and two-stage deep object detectors using image difficulty prediction. In Proceedings of the 2018 20th International Symposium on Symbolic and Numeric Algorithms for Scientific Computing (SYNASC), Timisoara, Romania, 20–23 September 2018; pp. 209–214. [Google Scholar]
- Liu, Z.; Cui, J.; Li, C.; Wei, M.; Yang, Y. Fabric defect detection based on lightweight neural network. In Proceedings of the Chinese Conference on Pattern Recognition and Computer Vision (PRCV); Springer: Cham, Switzerland, 2019; pp. 528–539. [Google Scholar]
- Liu, Q.; Wang, C.; Li, Y.; Gao, M.; Li, J. A fabric defect detection method based on deep learning. IEEE Access 2022, 10, 4284–4296. [Google Scholar] [CrossRef] [Scilit]
- Guo, Y.; Kang, X.; Li, J.; Yang, Y. Automatic Fabric Defect Detection Method Using AC-YOLOv5. Electronics 2023, 12, 2950. [Google Scholar] [CrossRef] [Scilit]
- Li, F.; Xiao, K.; Hu, Z.; Zhang, G. Fabric defect detection algorithm based on improved YOLOv5. Vis. Comput. 2024, 40, 2309–2324. [Google Scholar] [CrossRef] [Scilit]
- Wang, X.; Fang, W.; Xiang, S. Fabric defect detection based on anchor-free network. Meas. Sci. Technol. 2023, 34, 125402. [Google Scholar] [CrossRef] [Scilit]
- Chen, M.; Yu, L.; Zhi, C.; Sun, R.; Zhu, S.; Gao, Z.; Ke, Z.; Zhu, M.; Zhang, Y. Improved faster R-CNN for fabric defect detection based on Gabor filter with Genetic Algorithm optimization. Comput. Ind. 2022, 134, 103551. [Google Scholar] [CrossRef] [Scilit]
- Li, L.; Li, Q.; Liu, Z.; Xue, L. Effective Fabric Defect Detection Model for High-Resolution Images. Appl. Sci. 2023, 13, 10500. [Google Scholar] [CrossRef] [Scilit]
- Wu, J.; Le, J.; Xiao, Z.; Zhang, F.; Geng, L.; Liu, Y.; Wang, W. Automatic fabric defect detection using a wide-and-light network. Appl. Intell. 2021, 51, 4945–4961. [Google Scholar] [CrossRef] [Scilit]
- Zhao, Y.; Lv, W.; Xu, S.; Wei, J.; Wang, G.; Dang, Q.; Liu, Y.; Chen, J. DETRs Beat YOLOs on Real-time Object Detection. In Proceedings of the IEEE/CVF Conference on Computer Vision and Pattern Recognition, Seattle, WA, USA, 16–22 June 2024; pp. 16965–16974. [Google Scholar]
- Seliya, N.; Abdollah Zadeh, A.; Khoshgoftaar, T.M. A literature review on one-class classification and its potential applications in big data. J. Big Data 2021, 8, 122. [Google Scholar] [CrossRef] [Scilit]
- Simon, P.; Uma, V. Deep learning based feature extraction for texture classification. Procedia Comput. Sci. 2020, 171, 1680–1687. [Google Scholar] [CrossRef] [Scilit]
- Kramer, M.A. Nonlinear principal component analysis using autoassociative neural networks. AIChE J. 1991, 37, 233–243. [Google Scholar] [CrossRef] [Scilit]
- Harshvardhan, G.; Gourisaria, M.K.; Pandey, M.; Rautaray, S.S. A comprehensive survey and analysis of generative models in machine learning. Comput. Sci. Rev. 2020, 38, 100285. [Google Scholar] [CrossRef] [Scilit]
- Salakhutdinov, R. Learning deep generative models. Annu. Rev. Stat. Its Appl. 2015, 2, 361–385. [Google Scholar] [CrossRef] [Scilit]
- Hinton, G.; Vinyals, O.; Dean, J. Distilling the knowledge in a neural network. arXiv 2015, arXiv:1503.02531. [Google Scholar]
- Salehi, M.; Sadjadi, N.; Baselizadeh, S.; Rohban, M.H.; Rabiee, H.R. Multiresolution knowledge distillation for anomaly detection. In Proceedings of the IEEE/CVF Conference on Computer Vision and Pattern Recognition, Nashville, TN, USA, 20–25 June 2021; pp. 14902–14912. [Google Scholar]
- Wang, G.; Han, S.; Ding, E.; Huang, D. Student-teacher feature pyramid matching for anomaly detection. arXiv 2021, arXiv:2103.04257. [Google Scholar]
- Deng, H.; Li, X. Anomaly detection via reverse distillation from one-class embedding. In Proceedings of the IEEE/CVF Conference on Computer Vision and Pattern Recognition, New Orleans, LA, USA, 18–24 June 2022; pp. 9737–9746. [Google Scholar]
- Defard, T.; Setkov, A.; Loesch, A.; Audigier, R. Padim: A patch distribution modeling framework for anomaly detection and localization. In Proceedings of the International Conference on Pattern Recognition; Springer: Cham, Switzerland, 2021; pp. 475–489. [Google Scholar]
- Roth, K.; Pemula, L.; Zepeda, J.; Schölkopf, B.; Brox, T.; Gehler, P. Towards total recall in industrial anomaly detection. In Proceedings of the IEEE/CVF Conference on Computer Vision and Pattern Recognition, New Orleans, LA, USA, 18–24 June 2022; pp. 14318–14328. [Google Scholar]
- Gudovskiy, D.; Ishizaka, S.; Kozuka, K. Cflow-ad: Real-time unsupervised anomaly detection with localization via conditional normalizing flows. In Proceedings of the IEEE/CVF Winter Conference on Applications of Computer Vision, Waikoloa, HI, USA, 3–8 January 2022; pp. 98–107. [Google Scholar]
- Zavrtanik, V.; Kristan, M.; Skočaj, D. Draem—A discriminatively trained reconstruction embedding for surface anomaly detection. In Proceedings of the IEEE/CVF International Conference on Computer Vision, Montreal, BC, Canada, 10–17 October 2021; pp. 8330–8339. [Google Scholar]
- Liu, Z.; Zhou, Y.; Xu, Y.; Wang, Z. SimpleNet: A Simple Network for Image Anomaly Detection and Localization. In Proceedings of the IEEE/CVF Conference on Computer Vision and Pattern Recognition, Vancouver, BC, Canada, 17–24 June 2023; pp. 20402–20411. [Google Scholar]
- Rolih, B.; Fučka, M.; Skočaj, D. SuperSimpleNet: Unifying Unsupervised and Supervised Learning for Fast and Reliable Surface Defect Detection. In Proceedings of the International Conference on Pattern Recognition, Kolkata, India, 1–5 December 2024. [Google Scholar]
- Batzner, K.; Heckler, L.; König, R. Efficientad: Accurate visual anomaly detection at millisecond-level latencies. In Proceedings of the IEEE/CVF Winter Conference on Applications of Computer Vision, Waikoloa, HI, USA, 3–8 January 2024; pp. 128–138. [Google Scholar]
- Akcay, S.; Ameln, D.; Vaidya, A.; Lakshmanan, B.; Ahuja, N.; Genc, U. Anomalib: A deep learning library for anomaly detection. In Proceedings of the 2022 IEEE International Conference on Image Processing (ICIP), Bordeaux, France, 16–19 October 2022; pp. 1706–1710. [Google Scholar]
- Carrilho, R.; Rashidunnabi, M.; Proença, H. LUSITANOv2: RGB Line-Scan Images and Annotations for Fabric Defect Detection. Zenodo. 2026. Available online: https://doi.org/10.5281/zenodo.22150068 (accessed on 13 September 2026).

Disclaimer/Publisher’s Note: The statements, opinions and data contained in all publications are solely those of the individual author(s) and contributor(s) and not of MDPI and/or the editor(s). MDPI and/or the editor(s) disclaim responsibility for any injury to people or property resulting from any ideas, methods, instructions or products referred to in the content. |
© 2026 by the authors. Licensee MDPI, Basel, Switzerland. This article is an open access article distributed under the terms and conditions of the Creative Commons Attribution (CC BY) license.