


Abstract
Automated betel leaf disease recognition remains challenging under limited and imbalanced data conditions. This study investigates an Upper Confidence Bound (UCB)-guided adaptive augmentation framework for the classification of healthy leaves, leaf rot, and leaf spot. To reduce the risk of performance inflation caused by augmented-data leakage, only the 2037 original images of a publicly available betel leaf disease dataset were used for stratified training, validation, and test partitioning, while augmentation was restricted to the training stage. Several representative deep learning architectures, including ResNet, DenseNet, EfficientNet, MobileNet, and ConvNeXt-Tiny, were evaluated under a unified experimental setting. In the proposed approach, augmentation-policy selection is formulated as a multi-armed bandit problem, where the UCB controller dynamically selects among predefined augmentation arms comprising different RandAugment magnitudes and Mixup settings based on validation performance. Among the evaluated configurations, ConvNeXt-Tiny integrated with UCB-guided augmentation achieved strong overall performance, with an accuracy of 98.04%, a macro-F1 score of 97.87%, and a micro-average AUC of 0.999. These findings indicate that combining ConvNeXt-Tiny with adaptive augmentation can provide an effective approach for betel leaf disease classification under the investigated limited-data setting, with potential for future deployment in resource-constrained agricultural monitoring applications.
1. Introduction
The betel leaf is a medicinal plant, scientifically known as Piper betle L., and belongs to the Piperaceae family. It is valued for its glossy, heart-shaped leaves and rich composition of bioactive compounds that collectively contribute to its diverse pharmacological properties [1]. Numerous studies report strong antioxidant, antimicrobial, anti-inflammatory, and antifungal activities that support its traditional use in treating wounds, infections, and digestive disorders, while its phenolic constituents show promising antidiabetic and anticancer potential. Its antimicrobial activity also makes it a natural food preservative that improves safety and shelf life, contributing to its widespread cultivation across South and Southeast Asia. Notably, in Bangladesh, betel leaf is an economically important crop that supports rural livelihoods and smallholder farmers [2,3]. However, diseases such as leaf rot and leaf spot cause recurring yield loss, quality degradation, and major economic damage [4].
However, conventional manual visual inspection for plant disease detection is often subjective, labor-intensive, and dependent on expert knowledge. These limitations can result in delayed diagnosis, inconsistent assessment, and inappropriate pesticide use, particularly in resource-constrained farming environments [5]. In recent years, deep learning (DL) has emerged as a promising solution for automated plant disease recognition because of its ability to learn discriminative visual representations, such as texture irregularities, discoloration patterns, and lesion boundaries, directly from leaf images [6,7,8].
Recent studies have demonstrated promising results for DL-based models in betel leaf disease classification. For instance, a comparative study [9] investigated YOLOv5 and YOLOv8 for the binary classification of betel leaf diseases using a dataset of 300 images (150 images per class). To increase data variability, a fixed augmentation strategy was applied, including flipping, rotation, and cropping. The study reported an accuracy of 81.1% at 500 epochs for YOLOv5 and 83.4% at 300 epochs for YOLOv8, indicating a slight variation in classification performance with different training durations. Overall, these findings highlight the suitability of YOLO-based object detection frameworks for betel leaf disease identification while also emphasizing the limitation of small dataset size and the need for more diverse data to enhance model generalization.
Similarly, a benchmark study [10] introduced the BetelProNet framework, an efficient DL model based on the MobileNetV3 architecture, using a dataset of 1175 images containing healthy leaves and diseased categories such as leaf spot and bacterial leaf spot. To improve dataset variability and robustness, a fixed augmentation strategy involving rotation, flipping, cropping, and color jittering was applied, along with fine-tuning techniques to address class imbalance. The architecture incorporated depthwise separable convolutions, inverted residual blocks, and HSwish activation, enabling a lightweight design suitable for resource-constrained environments, with the reported benchmark showing an accuracy of 98% and approximately 1.51 million parameters.
To further support research in this domain, a publicly available dataset [4] was developed for three-class betel leaf disease classification, consisting of healthy leaves, leaf rot, and leaf spot. The dataset includes 2037 original field images that were augmented to produce 10,185 additional samples using geometric and photometric transformations such as flipping, brightness adjustment, contrast adjustment, and rotation, thereby enabling rapid benchmarking of modern pretrained architectures and demonstrating the practical potential of image-based diagnosis for early disease identification.
Building on this dataset, a study [11] proposed a lightweight attention-driven CNN incorporating the Convolutional Block Attention Module (CBAM), where a fixed augmentation strategy, including flipping, brightness correction, contrast variation, and rotation, was applied to enhance data diversity. The model, containing approximately 2.13 million parameters, achieved an accuracy of 95.58% and integrated Gradient-weighted Class Activation(Grad-CAM)-based explainable AI to improve interpretability and reliability of predictions.
Extending this line of research, the dataset was also utilized in an EfficientNet-B0–based study [12], where an additional 700 images were collected and combined with existing data to form a total of 10,170 images, including 5427 healthy, 3406 spot leaf, and 1337 rot leaf samples. A fixed augmentation strategy involving rotation, flipping, scaling, and brightness/contrast adjustment was reported, although the augmentation–partitioning order is inconsistently described in the paper. All images were resized to pixels. The model achieved an accuracy of 99.48% and incorporated Grad-CAM-based explainable AI to enhance the interpretability and reliability of the predictions.
In summary, DL has already demonstrated strong potential for smart agricultural monitoring; however, classification performance can remain sensitive to data scarcity and class imbalance. For example, Convolutional Neural Networks (CNNs) often achieve high classification accuracy under controlled experimental settings, yet their performance may degrade under the high variability of real field conditions, particularly when the training data are limited or imbalanced [5]. Under such conditions, data augmentation becomes an important component for increasing training-data diversity and reducing the risk of overfitting. However, conventional fixed augmentation applies a predetermined augmentation configuration throughout training and does not adapt the augmentation policy in response to model performance. Because the usefulness of different augmentation strengths or configurations may vary during training, this motivates the investigation of an adaptive policy-selection mechanism that can balance exploration of alternative augmentation settings with exploitation of those producing higher validation macro-F1 scores [13].
A second motivation concerns the construction of the evaluation protocol. The manner in which augmented images are used during dataset partitioning can affect the reliability of performance evaluation in betel leaf disease classification. When augmented variants derived from the same original image are distributed across both training and testing subsets, the resulting test set may no longer represent truly unseen data. Under such circumstances, the reported performance can be artificially inflated because the model is effectively evaluated on highly similar or near-duplicate samples. A similar phenomenon has been reported in DL-based biomedical image classification, where improper splitting of highly correlated images can lead to a substantial overestimation of test performance [14]. Therefore, constructing the training, validation, and test partitions using only the original images and restricting augmentation to the training set reduces the risk of leakage-induced performance inflation and provides a more controlled evaluation protocol. Together, these considerations motivate the present study to investigate UCB-guided adaptive augmentation while maintaining an original-image-based data-partitioning strategy.
To address the aforementioned challenges, this study investigates an Upper Confidence Bound (UCB)-based multi-armed bandit framework for adaptive augmentation policy selection in betel leaf disease classification. This work differs from existing betel leaf studies by combining a modern ConvNeXt-Tiny backbone with a UCB-based augmentation controller, while preserving a strict dataset split protocol in which only the original images are used for partitioning and augmentation is restricted to the training set. This design reduces the risk of performance inflation caused by augmented-data leakage. The main contributions of this work are summarized as follows:
- Augmentation-policy selection is formulated as a UCB-based multi-armed bandit problem for betel leaf disease classification, which enables adaptive selection among predefined augmentation policies during the policy-search stage under the investigated limited-data setting. The UCB controller balances exploration and exploitation to select augmentation policies based on validation performance.
- A controlled evaluation protocol is employed in which the training, validation, and test partitions are constructed using only the original images, while online augmentation is restricted exclusively to the training set. This design reduces the risk of leakage-induced performance inflation.
- The UCB-guided adaptive augmentation controller is integrated with ConvNeXt-Tiny to develop a unified classification framework for Healthy Leaf, Leaf Rot, and Leaf Spot recognition under the investigated limited-data setting.
- A comparative evaluation is conducted across multiple representative DL backbones, including ResNet, DenseNet, EfficientNet, MobileNet, and ConvNeXt-Tiny, under a consistent experimental protocol. The experimental results show that ConvNeXt-Tiny with UCB-guided augmentation achieves the highest overall performance among the evaluated backbone configurations.
2. Proposed Framework
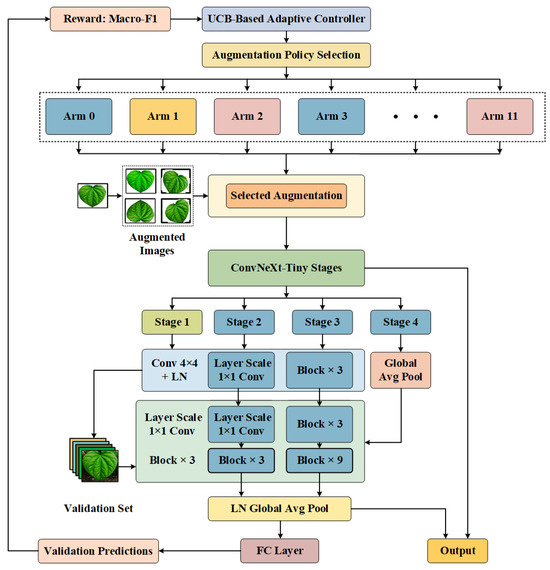
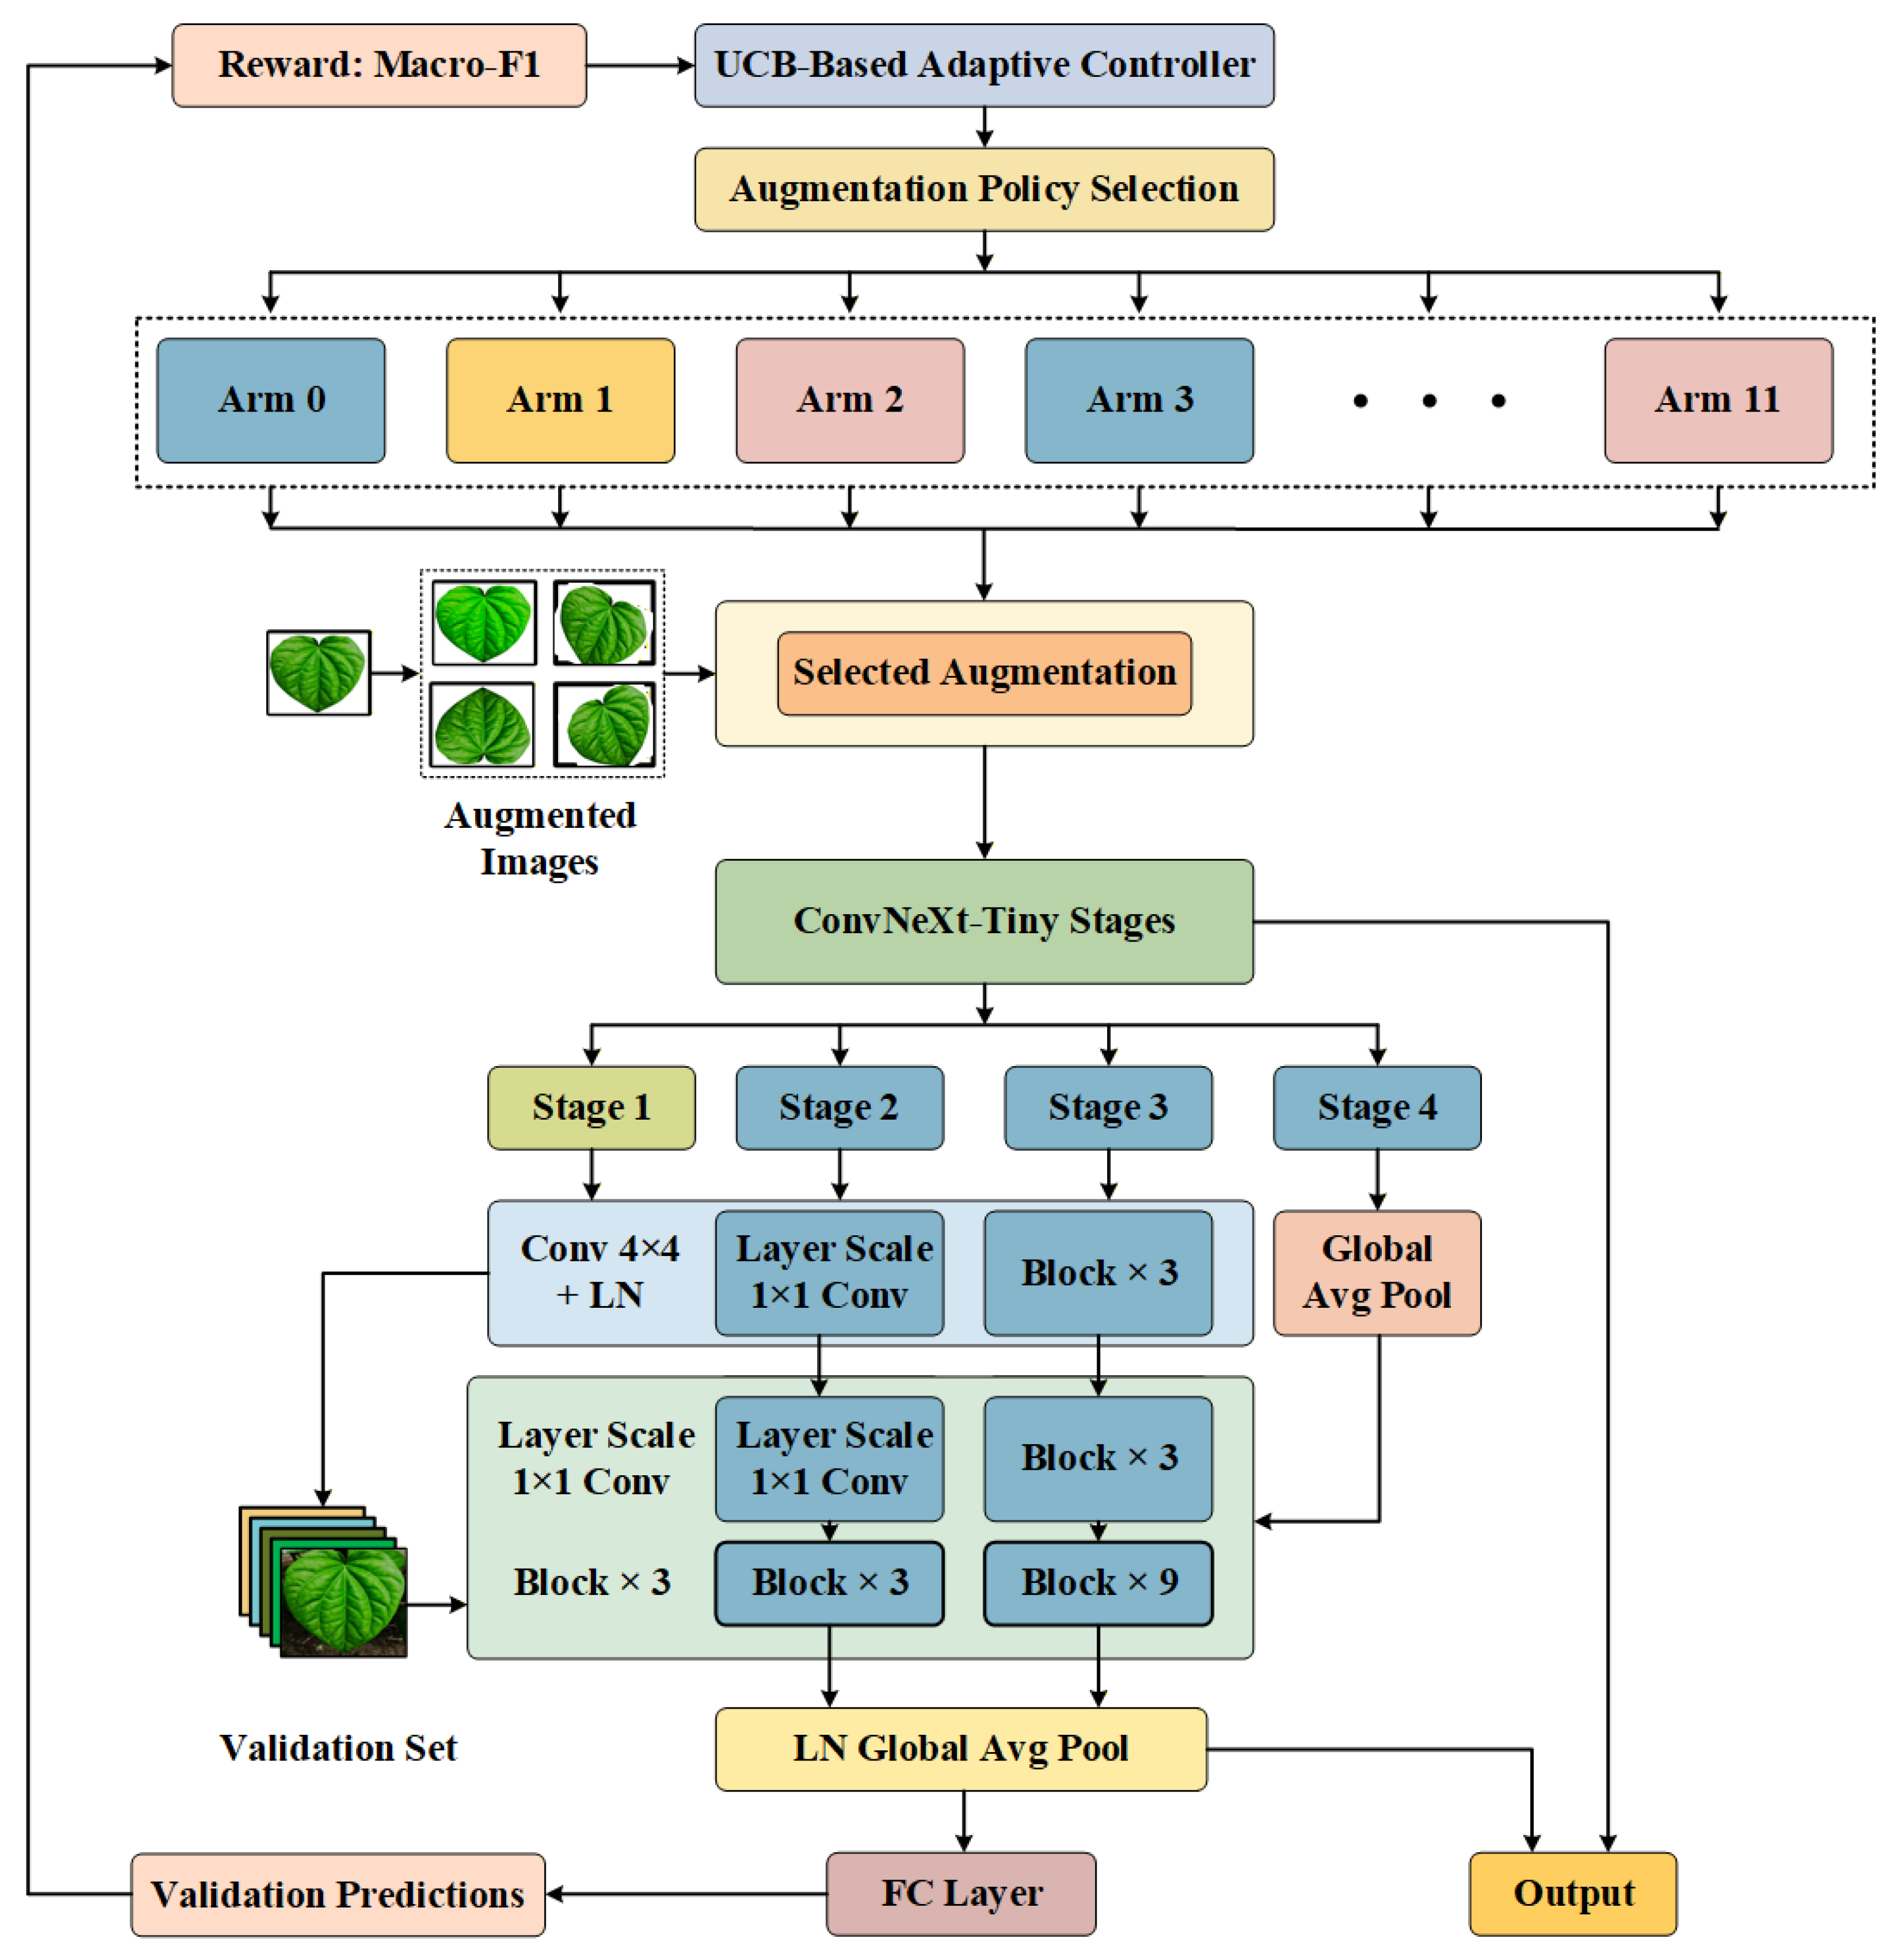
This section presents the proposed framework for betel leaf disease classification under limited and imbalanced data conditions. The overall system is designed to classify three categories, namely Healthy Leaf, Leaf Rot, and Leaf Spot, by integrating a UCB-based multi-armed bandit augmentation controller with a ConvNeXt-Tiny backbone within a unified training pipeline. The following subsections describe the dataset and data-splitting strategy, the adopted augmentation strategies, the UCB-based multi-armed bandit mechanism, the ConvNeXt-Tiny backbone, and the overall system architecture. Accordingly, the overall workflow of the proposed framework is illustrated in Figure 1.
Figure 1.
Overall architecture of the proposed framework for betel leaf disease classification under limited-data conditions.
2.1. Dataset
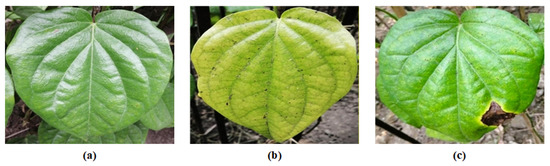
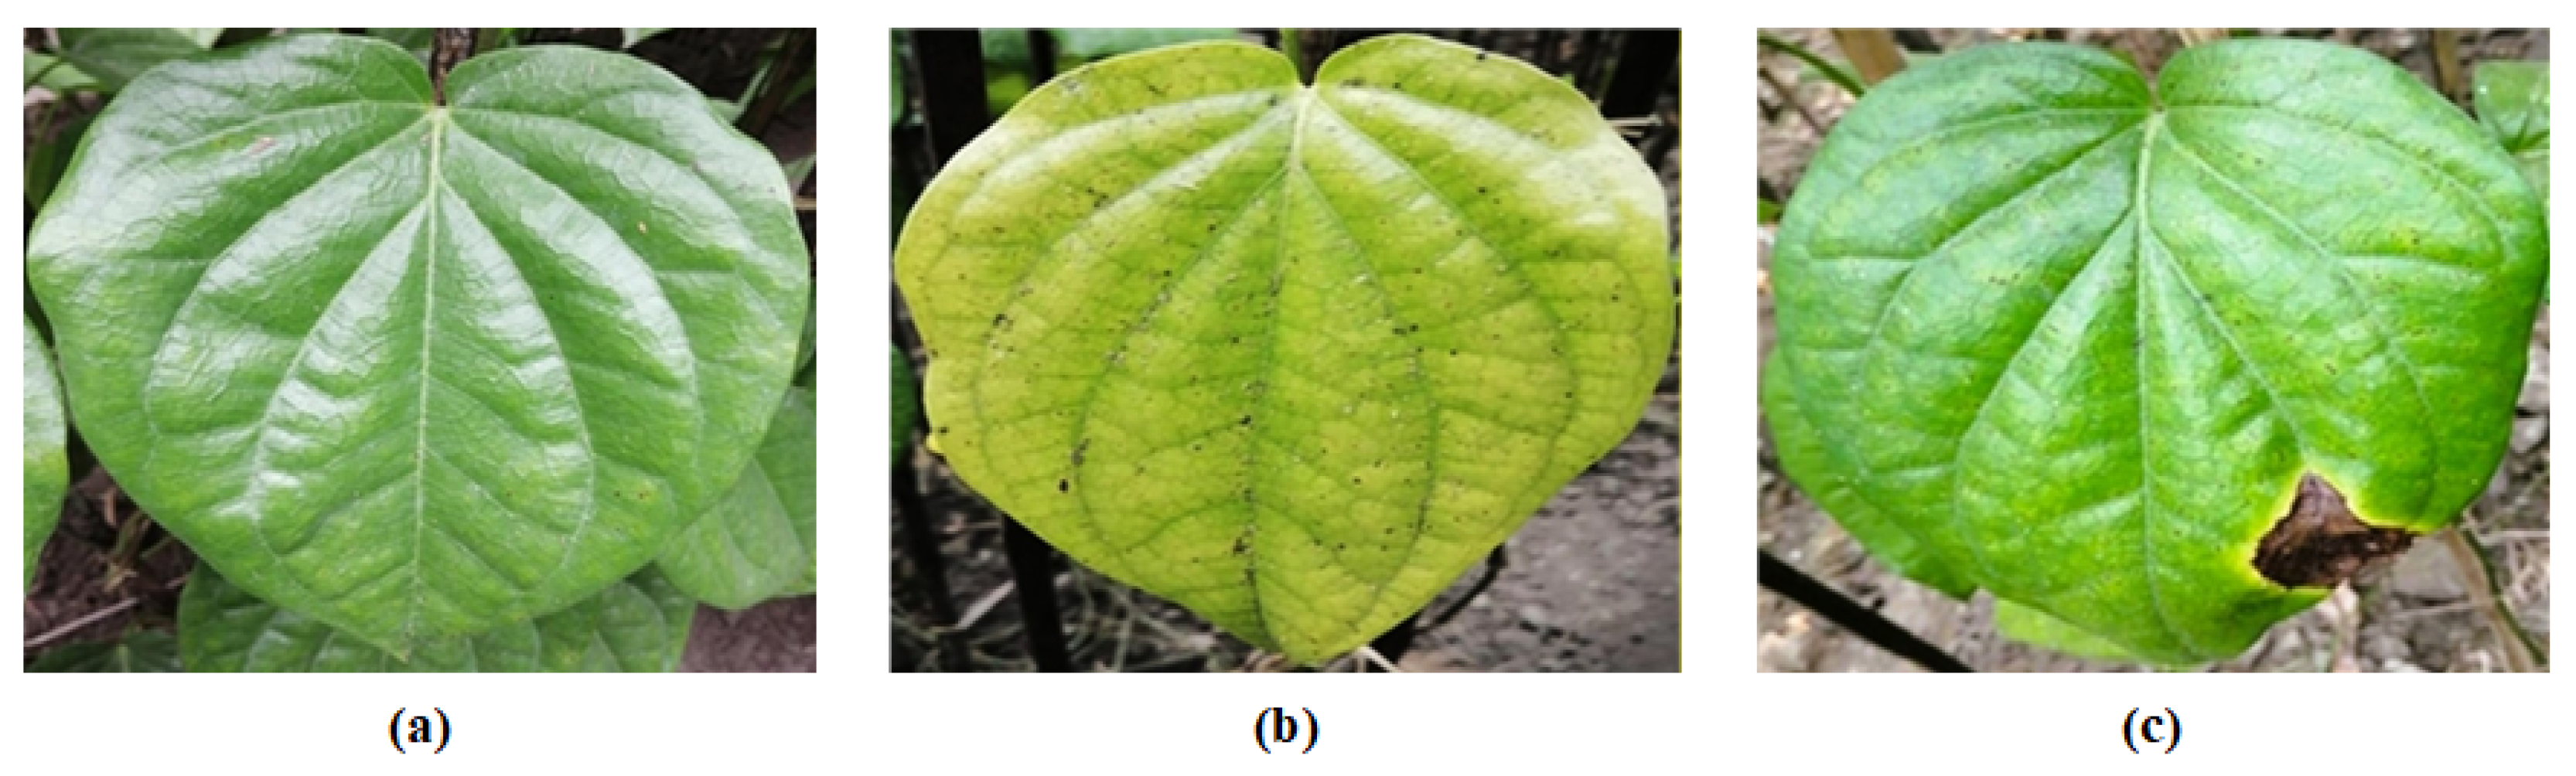
This study uses the publicly available Comprehensive Betel Leaf Disease Dataset for Advanced Pathology Research [15], which was collected and released by the original dataset authors and was not constructed or collected by the authors of the present study. The dataset contains 2037 original images collected from four betel cultivation fields in Bangladesh using smartphone cameras under field conditions. Although the images were collected from four different cultivation fields, the publicly released original dataset is organized by disease class rather than field of origin. Specifically, the images collected across the four fields are provided in three class-wise folders corresponding to Healthy Leaf, Leaf Rot, and Leaf Spot, and separate field-wise subsets are not provided. Therefore, a reproducible field-wise partition could not be constructed from the publicly released dataset in the present study. The original subset comprises 1080 Healthy Leaf images, 269 Leaf Rot images, and 688 Leaf Spot images. Representative samples from the three classes are shown in Figure 2. All original images are provided at a resolution of pixels.
Figure 2.
Representative samples of the three betel leaf classes: (a) Healthy Leaf, (b) Leaf Spot, and (c) Leaf Rot.
The original dataset authors additionally applied image augmentation techniques, including vertical and horizontal flipping, brightness adjustment, and rotation. This process generated 10,185 pre-generated augmented images, comprising 5400 Healthy Leaf, 1345 Leaf Rot, and 3440 Leaf Spot images. Consequently, the complete publicly released dataset contains 12,222 images across the three classes. The original and pre-generated augmented images are provided as separate subsets of the released dataset.
In the present study, only the 2037 original images were used to construct the training, validation, and test partitions. A stratified split of approximately 70%/15%/15% was applied, resulting in 1425 training images, 306 validation images, and 306 test images. The exact class-wise distribution of these partitions is presented in Table 1.
Table 1.
Class-wise distribution of the original dataset splits.
The pre-generated augmented subset released with the dataset was excluded from the data-splitting procedure to prevent potential near-duplicate leakage between the training and evaluation sets. Instead, online data augmentation, including augmentations selected by the UCB controller, was applied exclusively to the training set. The validation and test sets remained original and non-augmented, and the test set was not used for augmentation-policy selection, model training, or hyperparameter tuning.
2.2. Upper Confidence Bound
At each training epoch, the augmentation strategy is selected using an Upper Confidence Bound (UCB) controller over 12 predefined augmentation policies [16]. Each policy, referred to as an arm, represents a specific combination of RandAugment magnitude and Mixup activation. The selected arm is applied for one training epoch, after which the validation macro-F1 score is used to update the UCB controller.
Formally, the i-th augmentation arm is defined as
where denotes the RandAugment magnitude and indicates whether Mixup is disabled or enabled, respectively. The complete set of augmentation arms is denoted by
For an arm that has already been evaluated, its UCB score at epoch t is calculated as
where is the empirical mean reward of arm , is the number of times that arm has been selected, and c controls the exploration–exploitation balance. In this study, .
If one or more arms have not yet been evaluated, one of the untried arms is selected randomly. Once all arms have been evaluated at least once, the arm selected at epoch t is
After training for one epoch using the selected arm , the model is evaluated on the validation set. The resulting validation macro-F1 score is used as the reward:
The selection count of the chosen arm is then updated as
and its empirical mean reward is updated incrementally according to
When the selected arm enables Mixup [17], the mixing coefficient is sampled from a Beta distribution:
Two training images and their corresponding labels are then combined as
and
where and are two training images, while and are their corresponding labels. When Mixup is disabled, the original training images and labels are used. This formulation enables the UCB controller to adaptively select among predefined combinations of RandAugment magnitude and Mixup activation. The overall policy selection procedure is summarized in Algorithm 1.
| Algorithm 1 UCB-guided training pipeline for betel leaf disease classification |
| Require: Betel leaf dataset, training epochs E Ensure: Best-trained ConvNeXt-Tiny model and final test results
|
After completion of the UCB-guided adaptive search, the augmentation configuration achieving the highest validation macro-F1 is selected and fixed for the final model refit. During this refitting stage, the UCB controller is no longer updated, and the augmentation arm does not change across epochs. Thus, UCB serves as an adaptive augmentation-policy search mechanism, whereas the final reported model is trained using the selected fixed augmentation configuration. The performance reported on the independent test set therefore corresponds to this fixed-policy refitted model rather than to a model trained with continuously adaptive UCB augmentation.
2.3. ConvNeXt and ConvNeXt-Tiny
To address the growing performance gap between traditional Convolutional Neural Networks (ConvNets) and Vision Transformers (ViTs), the authors of Ref. [18] proposed the Convolutional Neural Network for the Next Generation (ConvNeXt) for large-scale image classification. Although ViTs have demonstrated strong global modeling capability, they often compromise important convolutional inductive biases, such as locality, translation equivariance, and parameter efficiency. To overcome these limitations, ConvNeXt revisits classical ConvNet design and systematically modernizes it by incorporating architectural principles inspired by Transformer models while maintaining a purely convolutional structure without self-attention. As a result, ConvNeXt achieves performance comparable to state-of-the-art Transformers while preserving the computational efficiency and structural advantages of convolutional networks.
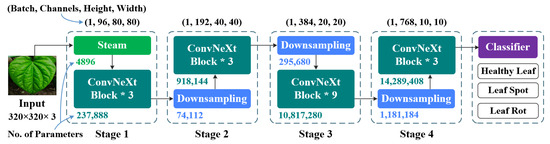
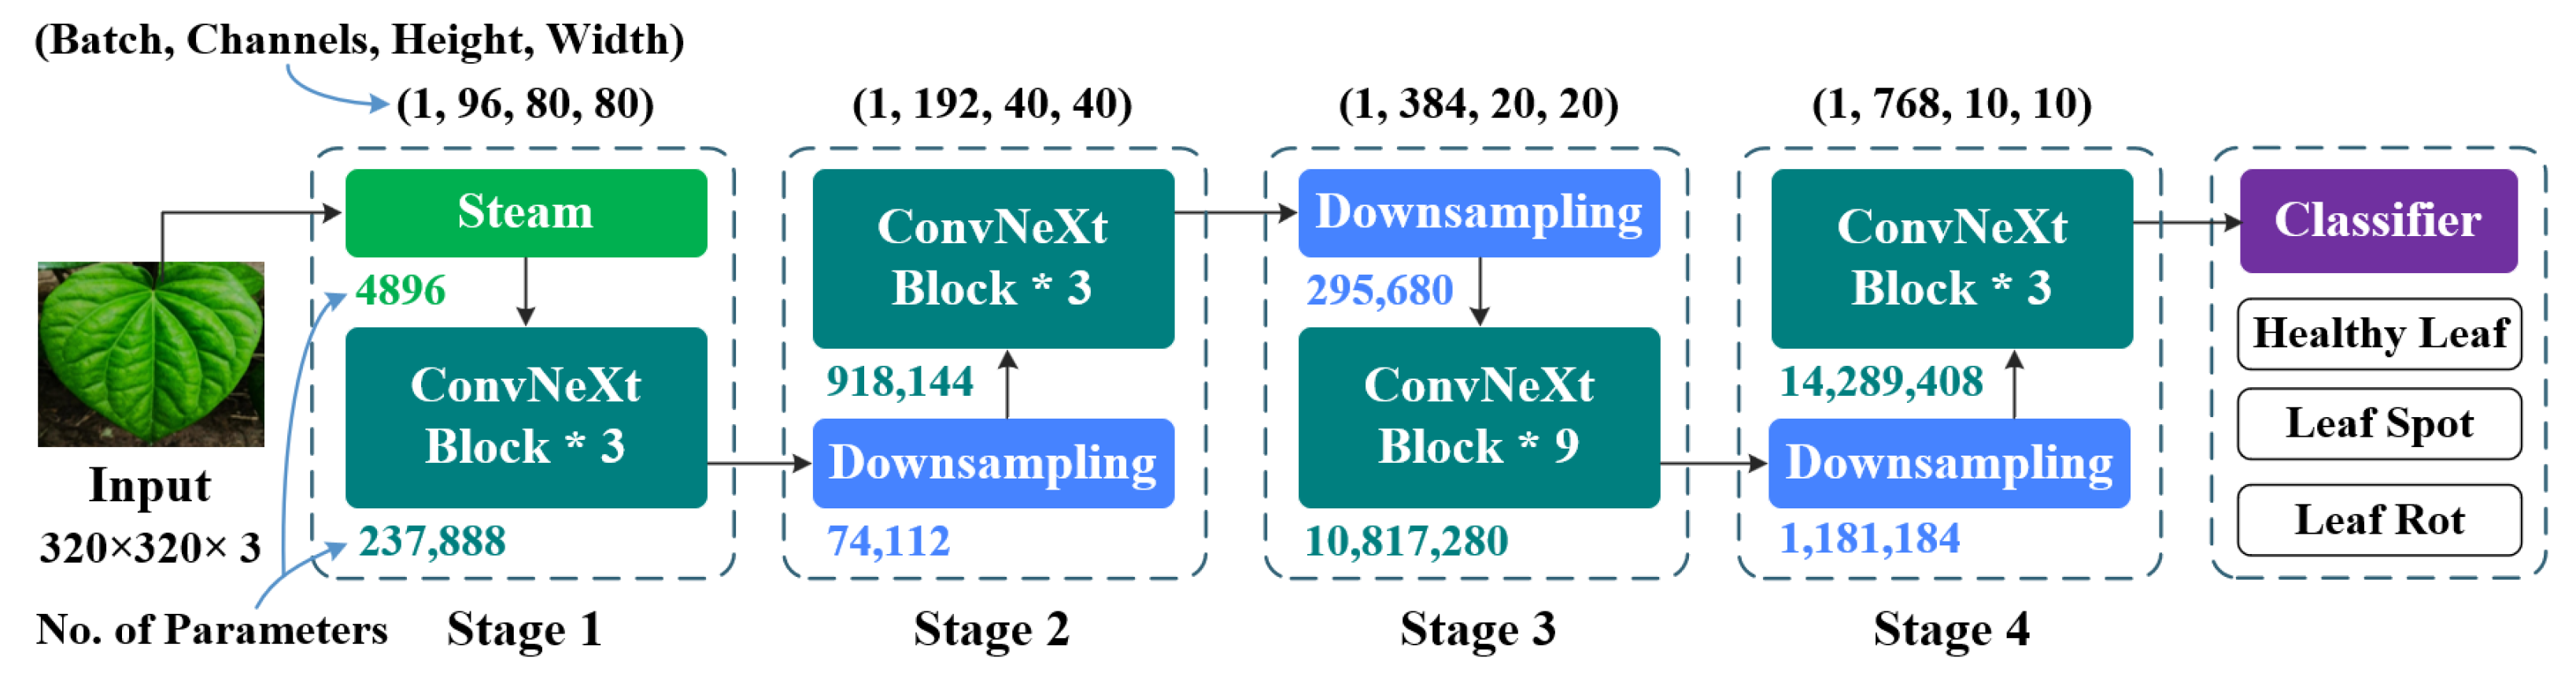
Within the ConvNeXt family, ConvNeXt-Tiny is the lightest and most computationally efficient variant, designed to balance classification accuracy and model complexity, as shown in Figure 3. It follows a four-stage hierarchical architecture with channel dimensions [96, 192, 384, 768] and block depths [3, 3, 9, 3], resulting in approximately 28 million parameters. Despite its compact design, ConvNeXt-Tiny achieves competitive performance on the ImageNet-1K benchmark, outperforming classical convolutional models such as ResNet-50 and matching or exceeding several Transformer-based and hybrid architectures with comparable computational budgets. Compared with the larger ConvNeXt variants (Small, Base, and Large), ConvNeXt-Tiny has lower model complexity and computational requirements. These characteristics make it a potentially suitable backbone for image classification applications where computational resources are an important consideration [19]. In the present study, ConvNeXt-Tiny was subsequently selected as the backbone for the augmentation analysis based primarily on its classification performance under the common baseline evaluation protocol, as discussed in Section 4.1.
Figure 3.
ConvNeXt-Tiny architecture for 320 × 320 input images.
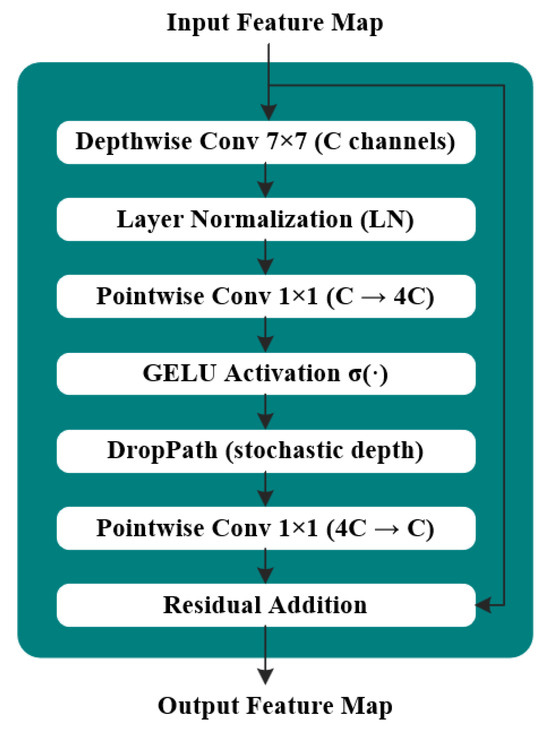
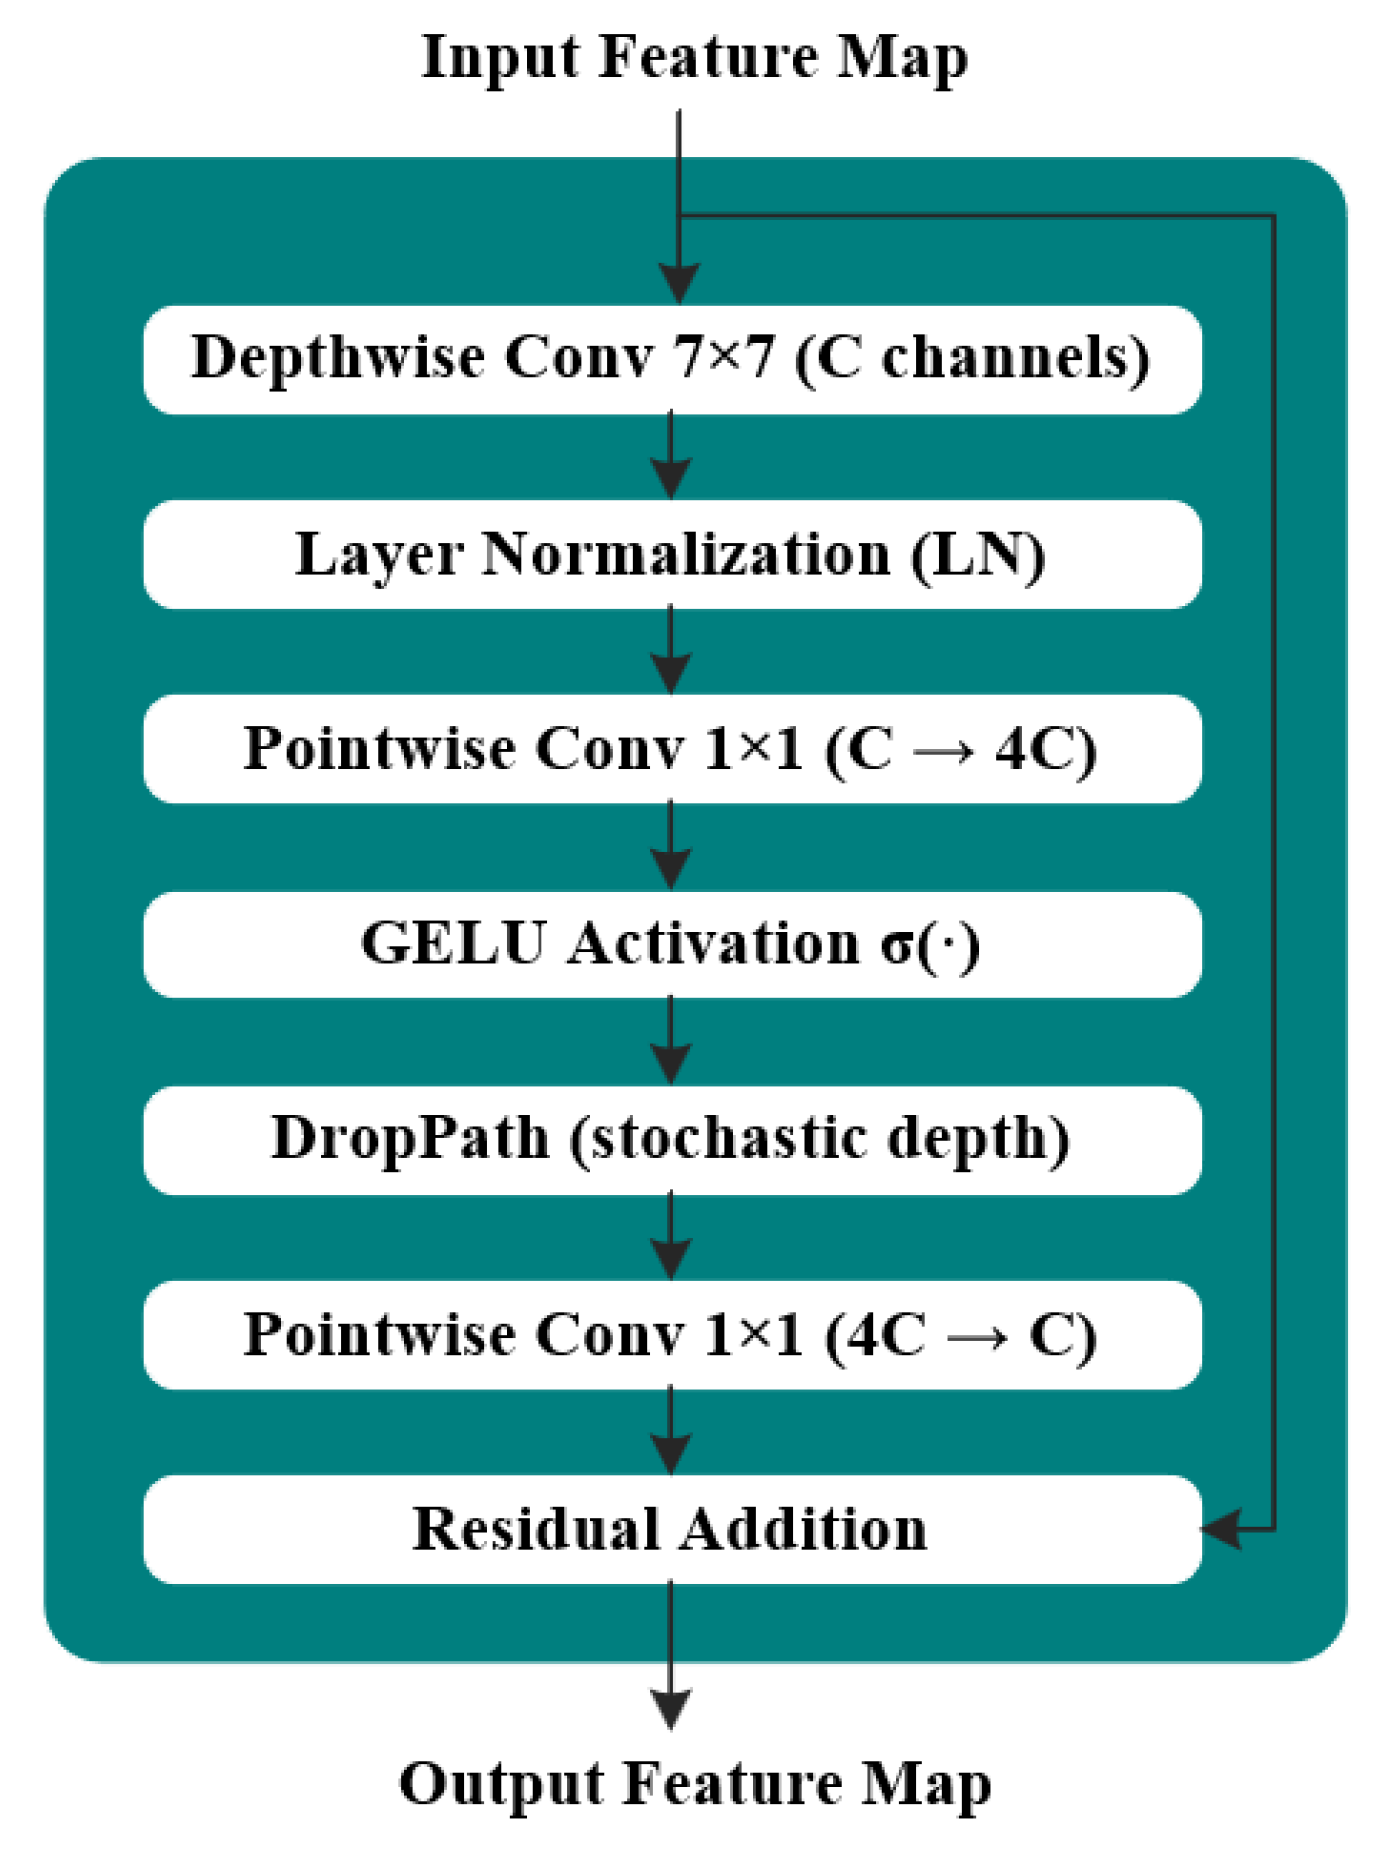
At the block level, ConvNeXt introduces several targeted modifications over conventional architectures such as ResNet, as illustrated in Figure 4. These include (i) a patchify input stem based on a single convolution with stride 4, replacing the stacked convolutions commonly used in ResNet; (ii) large-kernel depthwise convolutions with a kernel size of to enlarge the effective receptive field; (iii) the replacement of Batch Normalization with Layer Normalization to improve training stability; and (iv) the adoption of a Transformer-inspired inverted bottleneck design with Gaussian Error Linear Unit (GELU) activation. Collectively, these modifications enable ConvNeXt to exploit modern training strategies while maintaining the efficiency of convolutional architectures.
Figure 4.
The internal structure of ConvNeXt Block.
2.4. Theoretical Architecture and Mathematical Formulation of ConvNeXt-Tiny
ConvNeXt-Tiny follows a hierarchical convolutional architecture, as illustrated in Figure 3, while the internal structure of a ConvNeXt block is shown in Figure 4. The network consists of a patch embedding stem, four hierarchical stages with progressive downsampling, and a classification head. Let the input RGB image be defined as follows:
where H and W denote spatial dimensions.
2.4.1. Patch Embedding Stem
Initial feature extraction is performed using a patchifying convolution:
which reduces spatial resolution while increasing channel dimension.
2.4.2. Stage 1: Low-Level Feature Extraction
Low-level features are extracted using ConvNeXt blocks. Each block is defined as follows:
where consists of depthwise convolution, Layer Normalization, and multi-layer perceptron expansion–projection with GELU activation, enabling efficient local feature modeling.
2.4.3. Stage 2: Mid-Level Representation Learning
This stage operates at reduced resolution with increased channels. The same residual formulation is applied, enabling learning of structural patterns such as shape and vein variations.
2.4.4. Stage 3: Deep Feature Extraction
At this stage, feature maps are further downsampled to with higher channel depth. Multiple ConvNeXt blocks capture discriminative semantic representations for disease classification.
2.4.5. Stage 4: High-Level Semantic Abstraction
The final stage operates at with maximum channel dimension, producing compact high-level representations suitable for classification.
The hierarchical configuration is defined as
where C represents channel dimensions and D denotes block depths per stage.
2.4.6. Classification Head
The final feature map is globally pooled:
followed by linear classification:
where denotes the class-logit vector, and are the classifier weights and bias, respectively, and .
For the proposed three-class betel leaf classification task, ConvNeXt-Tiny contains 27,822,435 trainable parameters, providing a balance between representational capacity and model complexity within the ConvNeXt family, as detailed in Figure 3.
3. Experimental Setup
3.1. Experimental Setup and Implementation Details
All experiments were conducted on an AMD Ryzen 7 5700X 8-core processor (3.40 GHz) and an NVIDIA GeForce RTX 3080 Ti GPU with 12 GB VRAM. The implementation was carried out in the Visual Studio Code environment using Python 3.9.13, CUDA 11.8, cuDNN 9.1.0, PyTorch 2.7.1 and TorchVision 0.22.1. Five DL baseline models with ImageNet-pretrained weights for transfer learning, namely ConvNeXt-Tiny, DenseNet-201, EfficientNetV2-S, ResNet-50D, and MobileNetV3-Large, were trained under different augmentation policies, and the best-performing model was selected based on the results obtained.
The original five backbones were selected to provide a representative, rather than exhaustive, comparison across distinct convolutional design principles and computational characteristics. ResNet-50D represents residual learning with refinements to the conventional ResNet design, whereas DenseNet-201 represents dense connectivity and extensive feature reuse. EfficientNetV2-S, pretrained on ImageNet-21K, represents an efficiency-oriented architecture from the EfficientNetV2 family, while MobileNetV3-Large represents a compact mobile-oriented architecture based on computationally efficient convolutional operations. ConvNeXt-Tiny was included as a modernized pure convolutional architecture incorporating large-kernel depthwise convolution and other design choices influenced by recent vision architectures. The selection was also motivated by the demonstrated relevance of ResNet-, DenseNet-, EfficientNet-, and MobileNet-family architectures to previous betel-leaf disease classification studies [12,20,21]. This initial set was subsequently expanded to include additional recent lightweight CNN and vision-transformer-based architectures, as reported in Section 4.1.
All DL models were trained using input images of size with a mini-batch size of 16 for 40 epochs using the AdamW optimizer, with a learning rate of and a weight decay of . For the primary experiments, a fixed random seed of 42 was used for Python’s random module, NumPy, PyTorch, and CUDA. The multi-seed robustness analysis described in Section 4.5 was conducted separately using seeds 42, 43, 44, 45, and 46. In addition, linear warmup with cosine annealing, label smoothing (0.05), exponential moving average (0.9996), and WeightedRandomSampler were adopted to improve training stability, generalization, and class imbalance handling.
For the fixed augmentation baseline, a predefined augmentation pipeline was applied throughout training. The term fixed refers to the use of an unchanged augmentation policy and parameter configuration across epochs, while stochastic transformations were still sampled for individual training images. The complete augmentation and preprocessing settings, including application probabilities and parameter values, are summarized in Table 2. In particular, RandAugment was applied with two randomly selected operations per image using a fixed magnitude of , while Mixup was not used.
Table 2.
Fixed augmentation and preprocessing configuration used for the ConvNeXt-Tiny fixed-augmentation baseline.
In contrast, the UCB-guided framework adaptively selected the RandAugment magnitude during the policy-search stage and optionally activated Mixup according to the selected augmentation arm. For the proposed framework, an initial 6-arm UCB search space combining RandAugment magnitude levels with optional Mixup was considered, as summarized in Table 3. This initial search space was subsequently reformulated as a 12-arm configuration to enable finer-grained exploration, as shown in Table 4.
Table 3.
Definition of the 6 augmentation arms used in the UCB-based bandit controller.
Table 4.
Definition of the 12 augmentation arms used in the UCB-based bandit controller.
The magnitude levels defining the two policy spaces were selected heuristically rather than through formal range optimization. The 12-arm space uses –6 with Mixup disabled or enabled to provide a denser set of candidate augmentation strengths; larger or alternative magnitude ranges were not systematically investigated in the present study.
3.2. Evaluation Metrics
The DL models considered in this study were evaluated using standard performance metrics, including accuracy, Precision, Recall, and F1-score. In addition, the macro-F1 score was computed because it represents the average of class-wise F1-scores and provides a balanced evaluation across all classes. This is particularly important in class-imbalanced disease detection tasks, where dominant classes may otherwise bias the overall performance assessment.
A brief summary of the evaluation metrics is provided as follows:
- Accuracy: Represents the proportion of correctly classified samples among all observations, providing an overall measure of model performance.
- Precision (per class): Indicates the proportion of correctly predicted positive instances for a given class, reflecting the reliability of the model’s predictions.
- Recall (per class): Measures the proportion of actual instances of a class that are correctly identified, highlighting the model’s ability to capture relevant cases.
- F1-score (per class): Provides the harmonic mean of Precision and Recall, offering a balanced evaluation when both false positives and false negatives are important.
- Macro-F1: Computes the unweighted average of class-wise F1-scores, ensuring equal contribution from each class regardless of class distribution.
For each class c in a one-vs-rest setting, denotes the correctly predicted instances of class c, represents instances from other classes that are incorrectly predicted as class c, and corresponds to instances of class c that are misclassified as other classes. Here, N denotes the total number of samples, and K denotes the total number of classes, where in this study. Accordingly, the overall accuracy is defined as . The class-wise Precision and Recall are computed as and , respectively. Similarly, the class-wise F1-score is defined as , and the macro-F1 score is computed as the unweighted average of all class-wise F1-scores, i.e., Macro-F1 = .
4. Experimental Results
This section presents the experimental evaluation of the proposed framework for betel leaf disease classification under the investigated limited-data setting. First, the evaluated DL backbones, including multiple recent lightweight architectures, are compared under a unified experimental protocol to identify the best-performing backbone among the investigated models. The backbone for the subsequent augmentation analyses is selected primarily based on classification performance under the common baseline evaluation protocol rather than through an explicit accuracy–efficiency optimization criterion. Next, UCB is compared with alternative adaptive bandit controllers, including Thompson Sampling, epsilon-greedy, and softmax/Boltzmann exploration. The effects of different augmentation strategies are then examined, including no augmentation, fixed augmentation, and UCB-guided augmentation-policy search followed by fixed-policy refitting, together with the impact of expanding the UCB policy space from 6 arms to 12 arms. Finally, the selected ConvNeXt-Tiny framework is evaluated in detail using convergence behavior, ROC–AUC analysis, and confusion-matrix-based classification performance.
4.1. Comparative Evaluation of Deep Learning Backbones
Under the common baseline setting without augmentation, ConvNeXt-Tiny achieved the strongest overall performance among the evaluated backbones, with an accuracy of 0.944 and a macro-F1 score of 0.937, as shown in Table 5. Based on this performance-driven selection criterion, ConvNeXt-Tiny was selected for the subsequent augmentation analysis. Its performance further improved to an accuracy of 0.980 and a macro-F1 score of 0.979 under the 12-arm UCB-guided augmentation policy. Within the 12-arm search space, the best-performing ConvNeXt-Tiny checkpoint was obtained when Arm 10 was selected, corresponding to a RandAugment magnitude of 5 with Mixup enabled. The selected configuration was used to refit the ConvNeXt-Tiny model. The resulting trained model was subsequently evaluated on the independent test set. Here, denotes 12-arm UCB-guided augmentation, whereas denotes training without augmentation. Moreover, its class-wise metrics remained highly balanced, achieving an F1-score of 0.984 for Healthy Leaf, 0.976 for Leaf Rot, and 0.976 for Leaf Spot, thereby demonstrating relatively balanced class-wise performance under the investigated test setting. This result is consistent with the overall classification performance observed for ConvNeXt-Tiny under the investigated limited-data setting. Similarly, DenseNet-201 achieved the second-best performance and benefited substantially from the proposed UCB-guided augmentation, improving from an accuracy of 0.663 and macro-F1 of 0.481 without augmentation to 0.974 and 0.973, respectively. Notably, its Leaf Rot F1-score increased from 0.044 to 0.976, indicating improved recognition of the minority Leaf Rot class under UCB-guided augmentation.
Table 5.
Performance comparison of the evaluated DL backbones with and without 12-arm UCB-guided adaptive augmentation.
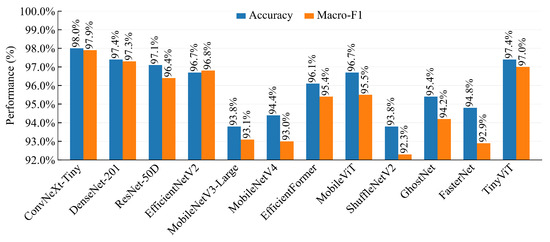
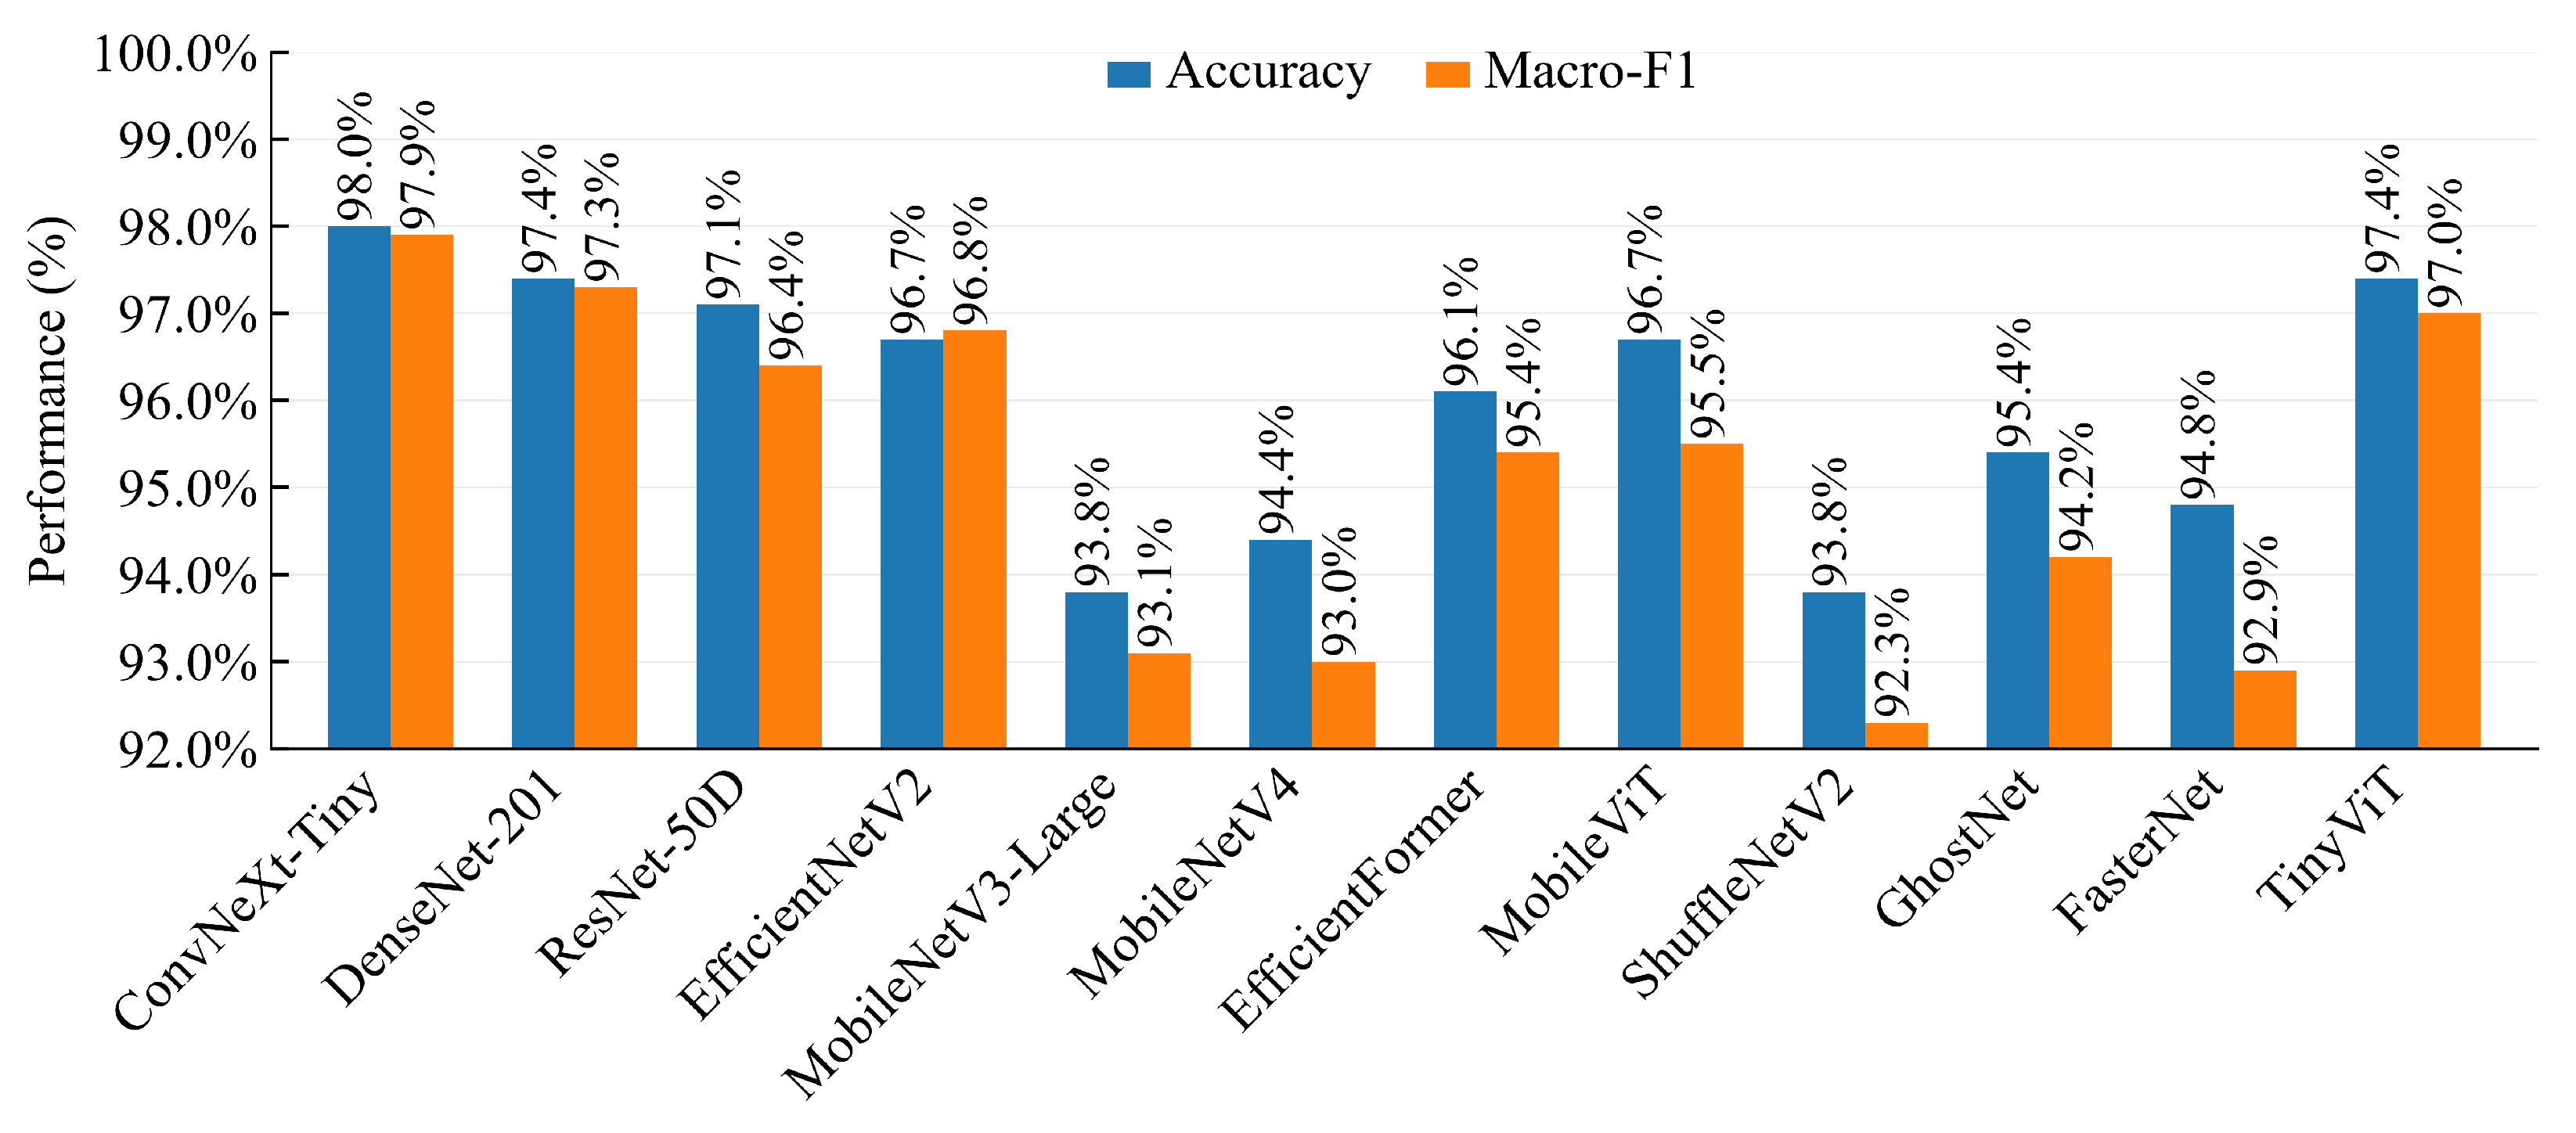
Meanwhile, the remaining models also demonstrated substantial improvements with UCB-guided augmentation. ResNet-50D improved from an accuracy of 0.837 and macro-F1 of 0.802 without augmentation to 0.971 and 0.964, respectively, indicating improved and more balanced class-wise performance. Moreover, EfficientNetV2 also showed remarkable improvement, with accuracy increasing from 0.507 to 0.967 and macro-F1 from 0.495 to 0.968. In particular, the Leaf Rot F1-score increased markedly from 0.426 to 0.976, indicating improved minority-class recognition under the investigated imbalanced-data setting. Likewise, MobileNetV3-Large improved from an accuracy of 0.487 and macro-F1 of 0.443 without augmentation to 0.938 and 0.931, respectively, while its Leaf Rot F1-score increased from 0.235 to 0.914. These consistent improvements across different network architectures indicate that the proposed UCB-guided augmentation can improve classification performance and class-wise balance under the investigated limited-data setting. These results further indicate that UCB-guided augmentation can provide substantial performance gains even when applied to a comparatively compact backbone such as MobileNetV3-Large. A visual comparison of the test accuracy and macro-F1 scores across the evaluated deep learning backbones under the 12-arm UCB-guided augmentation framework is presented in Figure 5.
Figure 5.
Visual comparison of test accuracy and macro-F1 across the evaluated deep learning backbones under the proposed 12-arm UCB-guided adaptive augmentation framework.
To provide a more comprehensive evaluation, particularly with regard to potential future deployment in resource-constrained agricultural applications, the performance of recent lightweight architectures, including MobileNetV4, EfficientFormer, MobileViT, ShuffleNetV2, GhostNet, FasterNet, and TinyViT, was also evaluated. These architectures were assessed using the same dataset partitioning, training, and evaluation protocol, both under the baseline setting without augmentation and with the proposed 12-arm UCB-guided augmentation framework. The additional experiments show that the 12-arm UCB-guided augmentation improved the classification performance of all seven evaluated lightweight architectures. For example, the accuracy of MobileNetV4 increased from 85.3% to 94.4%, ShuffleNetV2 from 82.0% to 93.8%, GhostNet from 86.3% to 95.4%, and FasterNet from 86.9% to 94.8%. Among these architectures, TinyViT achieved the strongest performance with UCB-guided augmentation, reaching 97.4% accuracy and 97.0% macro-F1. Nevertheless, ConvNeXt-Tiny with UCB-guided augmentation retained the highest overall performance, achieving 98.04% accuracy and 97.87% macro-F1. These additional results broaden the backbone comparison and indicate that the performance gains associated with UCB-guided adaptive augmentation are not restricted to ConvNeXt-Tiny.
4.2. Comparison of Adaptive Bandit Controllers
To further assess whether the observed benefit of adaptive augmentation-policy selection is specific to UCB or more generally associated with bandit-based adaptation, additional experiments were conducted using Thompson Sampling, epsilon-greedy, and softmax/Boltzmann exploration. All controllers were evaluated using the same 12-arm augmentation space, dataset partition, random seed, training protocol, and independent-test evaluation procedure. As summarized in Table 6, the proposed UCB controller achieved 98.04% accuracy and 97.87% macro-F1, matching the performance obtained with Thompson Sampling and epsilon-greedy, while slightly outperforming softmax/Boltzmann exploration, which achieved 97.71% accuracy and 97.60% macro-F1. These results indicate that the performance gains associated with adaptive augmentation-policy selection are not unique to UCB. UCB was retained as the primary controller because it provides a simple and transparent index-based exploration–exploitation mechanism that combines the observed reward with an explicit exploration bonus without requiring a prior probability distribution. Thus, although comparable performance was obtained with other bandit strategies, UCB remained a competitive and effective controller under the investigated experimental setting.
Table 6.
Comparison of different bandit controllers for adaptive augmentation-policy selection.
4.3. Analysis of Augmentation Strategies and UCB Policy Spaces
Beyond backbone selection, the effects of different augmentation strategies were further analyzed, and the results are summarized in Table 7. Performance consistently improves from no augmentation to fixed augmentation, as static transformations increase data diversity and reduce model overfitting by introducing realistic variations such as rotation, scaling, and illumination changes. Consequently, accuracy improves from 0.944 to 0.958, while macro-F1 increases from 0.937 to 0.951. The improvement is also reflected in class-wise performance, where the Leaf Rot F1-score increases from 0.923 to 0.937, and the Leaf Spot F1-score improves from 0.929 to 0.949, indicating enhanced recognition capability across disease categories.
Table 7.
Performance comparison of no, fixed, and UCB augmentation for betel leaf classification.
Notably, the UCB-guided augmentation strategy outperforms both no augmentation and fixed augmentation by adaptively selecting among predefined augmentation policies instead of applying transformations uniformly. The 6-arm UCB policy further improves accuracy to 0.961 and macro-F1 to 0.957, with additional gains in Leaf Rot recognition, where Recall and F1-score increase to 0.927 and 0.950, respectively. Furthermore, expanding the augmentation search space to 12-arm UCB achieves the highest overall performance, reaching an accuracy of 0.980 and a macro-F1 of 0.979. Although some individual class-wise metrics show slight reductions compared with 6-arm UCB, such as Healthy Leaf Recall decreasing from 1.000 to 0.975 and Leaf Spot Precision decreasing from 0.989 to 0.962, the 12-arm strategy improves the recognition of the minority Leaf Rot class while also increasing Leaf Spot Recall. Specifically, Leaf Rot Recall and F1-score increase from 0.927 and 0.950 under 6-arm UCB to 0.976 and 0.976 under 12-arm UCB, while Leaf Spot Recall improves from 0.913 to 0.990. These results indicate that the expanded augmentation policy space was associated with improved overall classification performance under the investigated test setting, while maintaining relatively balanced class-wise performance despite minor variations in individual metrics.
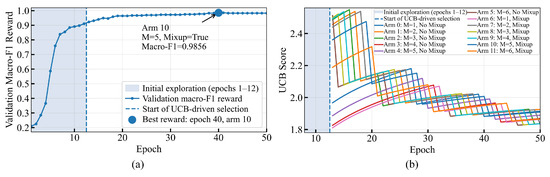
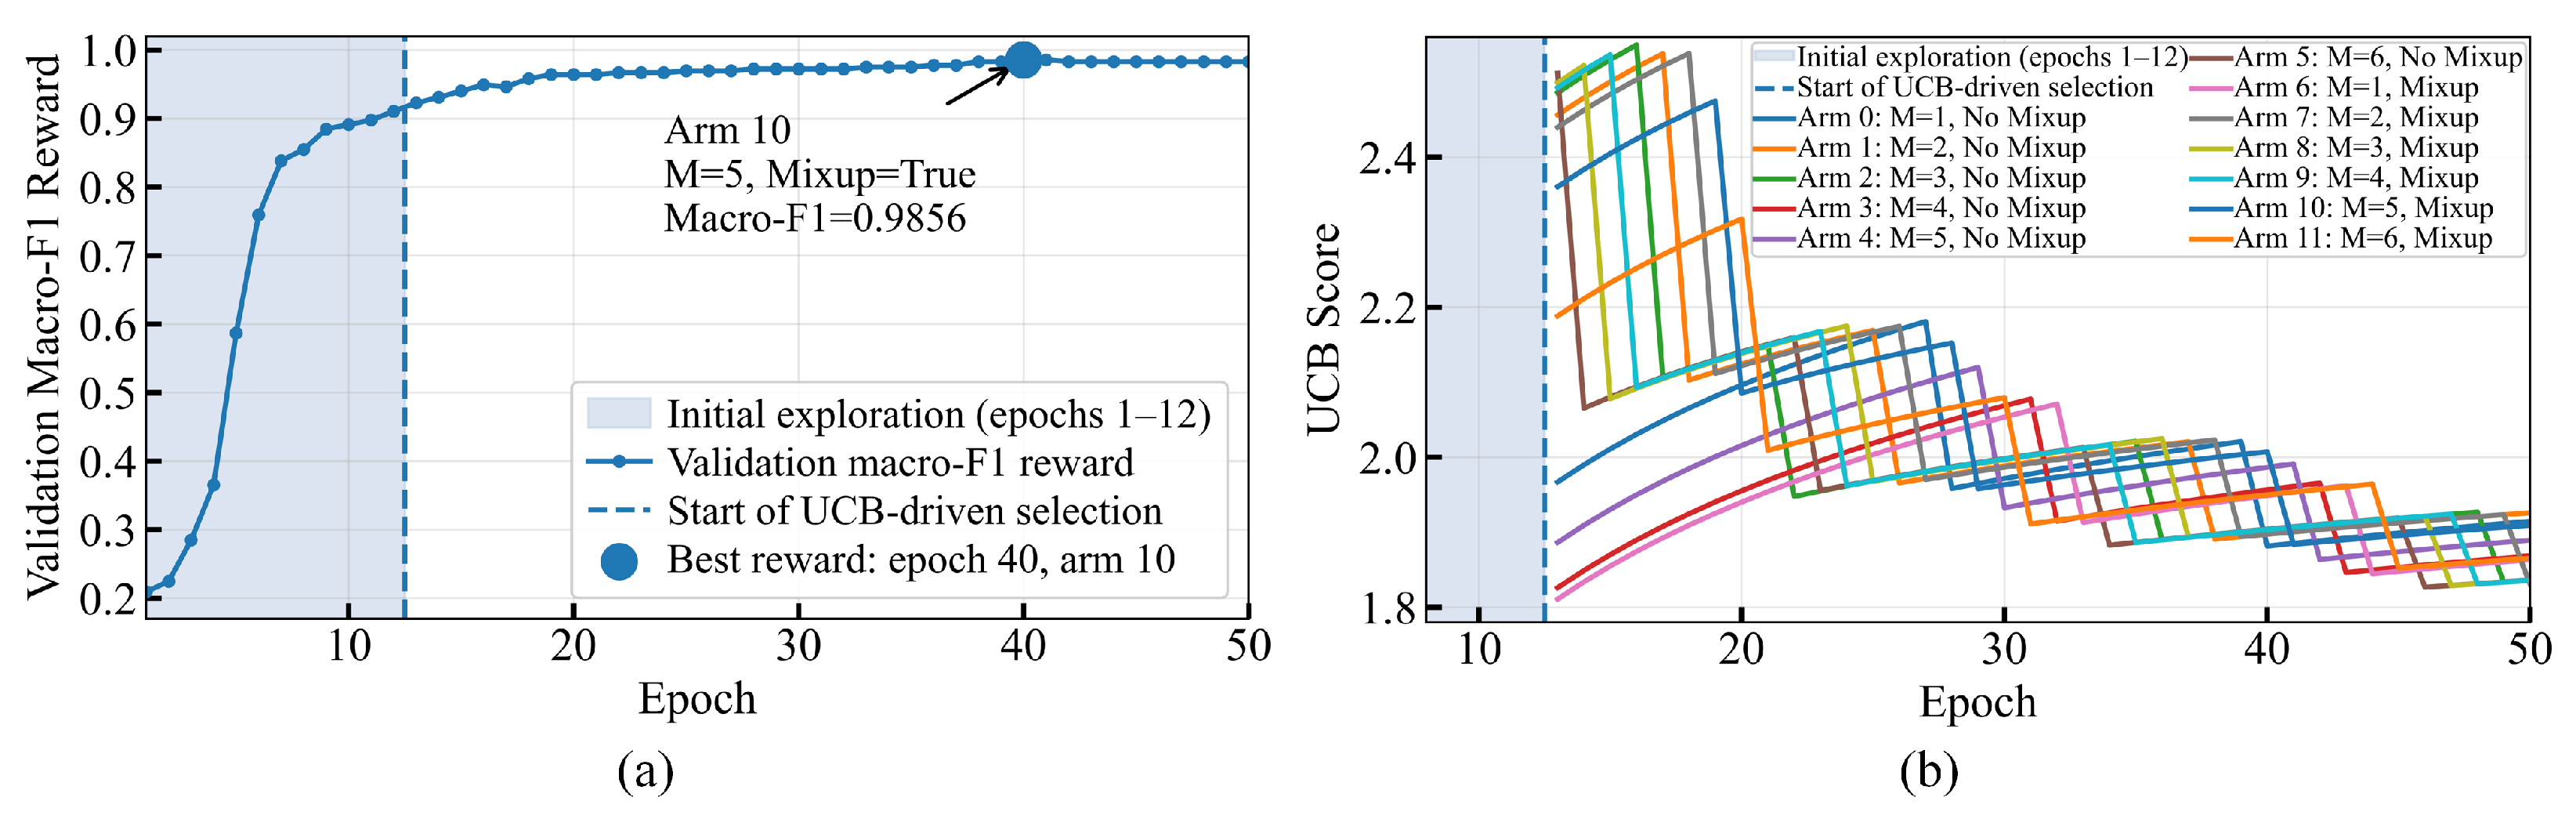
To further examine the behavior of the UCB controller during augmentation-policy search, Figure 6 presents the evolution of the validation macro-F1 reward and the arm-wise UCB scores over the 50-epoch search stage. During the initial exploration stage (epochs 1–12), each of the 12 augmentation arms is evaluated before UCB-driven selection begins. Thereafter, the controller balances exploitation of arms with higher observed validation performance and exploration of less frequently selected arms through the UCB exploration term.
Figure 6.
Evolution of the UCB-guided augmentation-policy search over 50 epochs: (a) validation macro-F1 reward and (b) UCB scores of the 12 augmentation arms.
As shown in Figure 6a, the validation macro-F1 reward generally improves following the initial exploration stage and subsequently remains at a high and relatively stable level. The highest observed validation reward of 0.9856 is obtained at epoch 40 using Arm 10, corresponding to RandAugment magnitude 5 with Mixup enabled. Figure 6b shows the corresponding evolution of the arm-wise UCB scores. After the initial exploration stage, the scores are repeatedly updated as additional reward observations are accumulated, and the differences among the competitive arms gradually narrow as the search progresses. These trajectories illustrate the exploration–exploitation behavior of the UCB controller and show that the selected augmentation configuration emerges from repeated validation-guided evaluation of the candidate policies rather than from a single randomly selected configuration.
To quantify the uncertainty associated with these performance estimates, 5000 stratified image-level bootstrap resamples were additionally used to compute percentile-based 95% confidence intervals for overall accuracy and macro-F1, as reported in Table 7. The proposed 12-arm UCB achieved 98.04% accuracy (95% CI: 96.41–99.35%) and 97.87% macro-F1 (95% CI: 95.87–99.47%), representing the highest point estimates among the four augmentation settings. In comparison, the 95% confidence intervals for accuracy were 91.83–96.73%, 93.46–97.71%, and 93.79–98.04% for no augmentation, fixed augmentation, and 6-arm UCB, respectively, while the corresponding macro-F1 intervals were 90.39–96.53%, 92.20–97.62%, and 92.94–97.95%. These bootstrap results support the robustness of the higher point estimates obtained with the proposed 12-arm UCB under resampling of the independent test set. However, because the confidence intervals partially overlap, they are interpreted as uncertainty-aware performance estimates rather than as evidence of statistically significant pairwise differences.
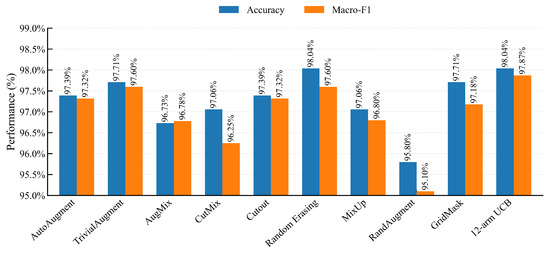
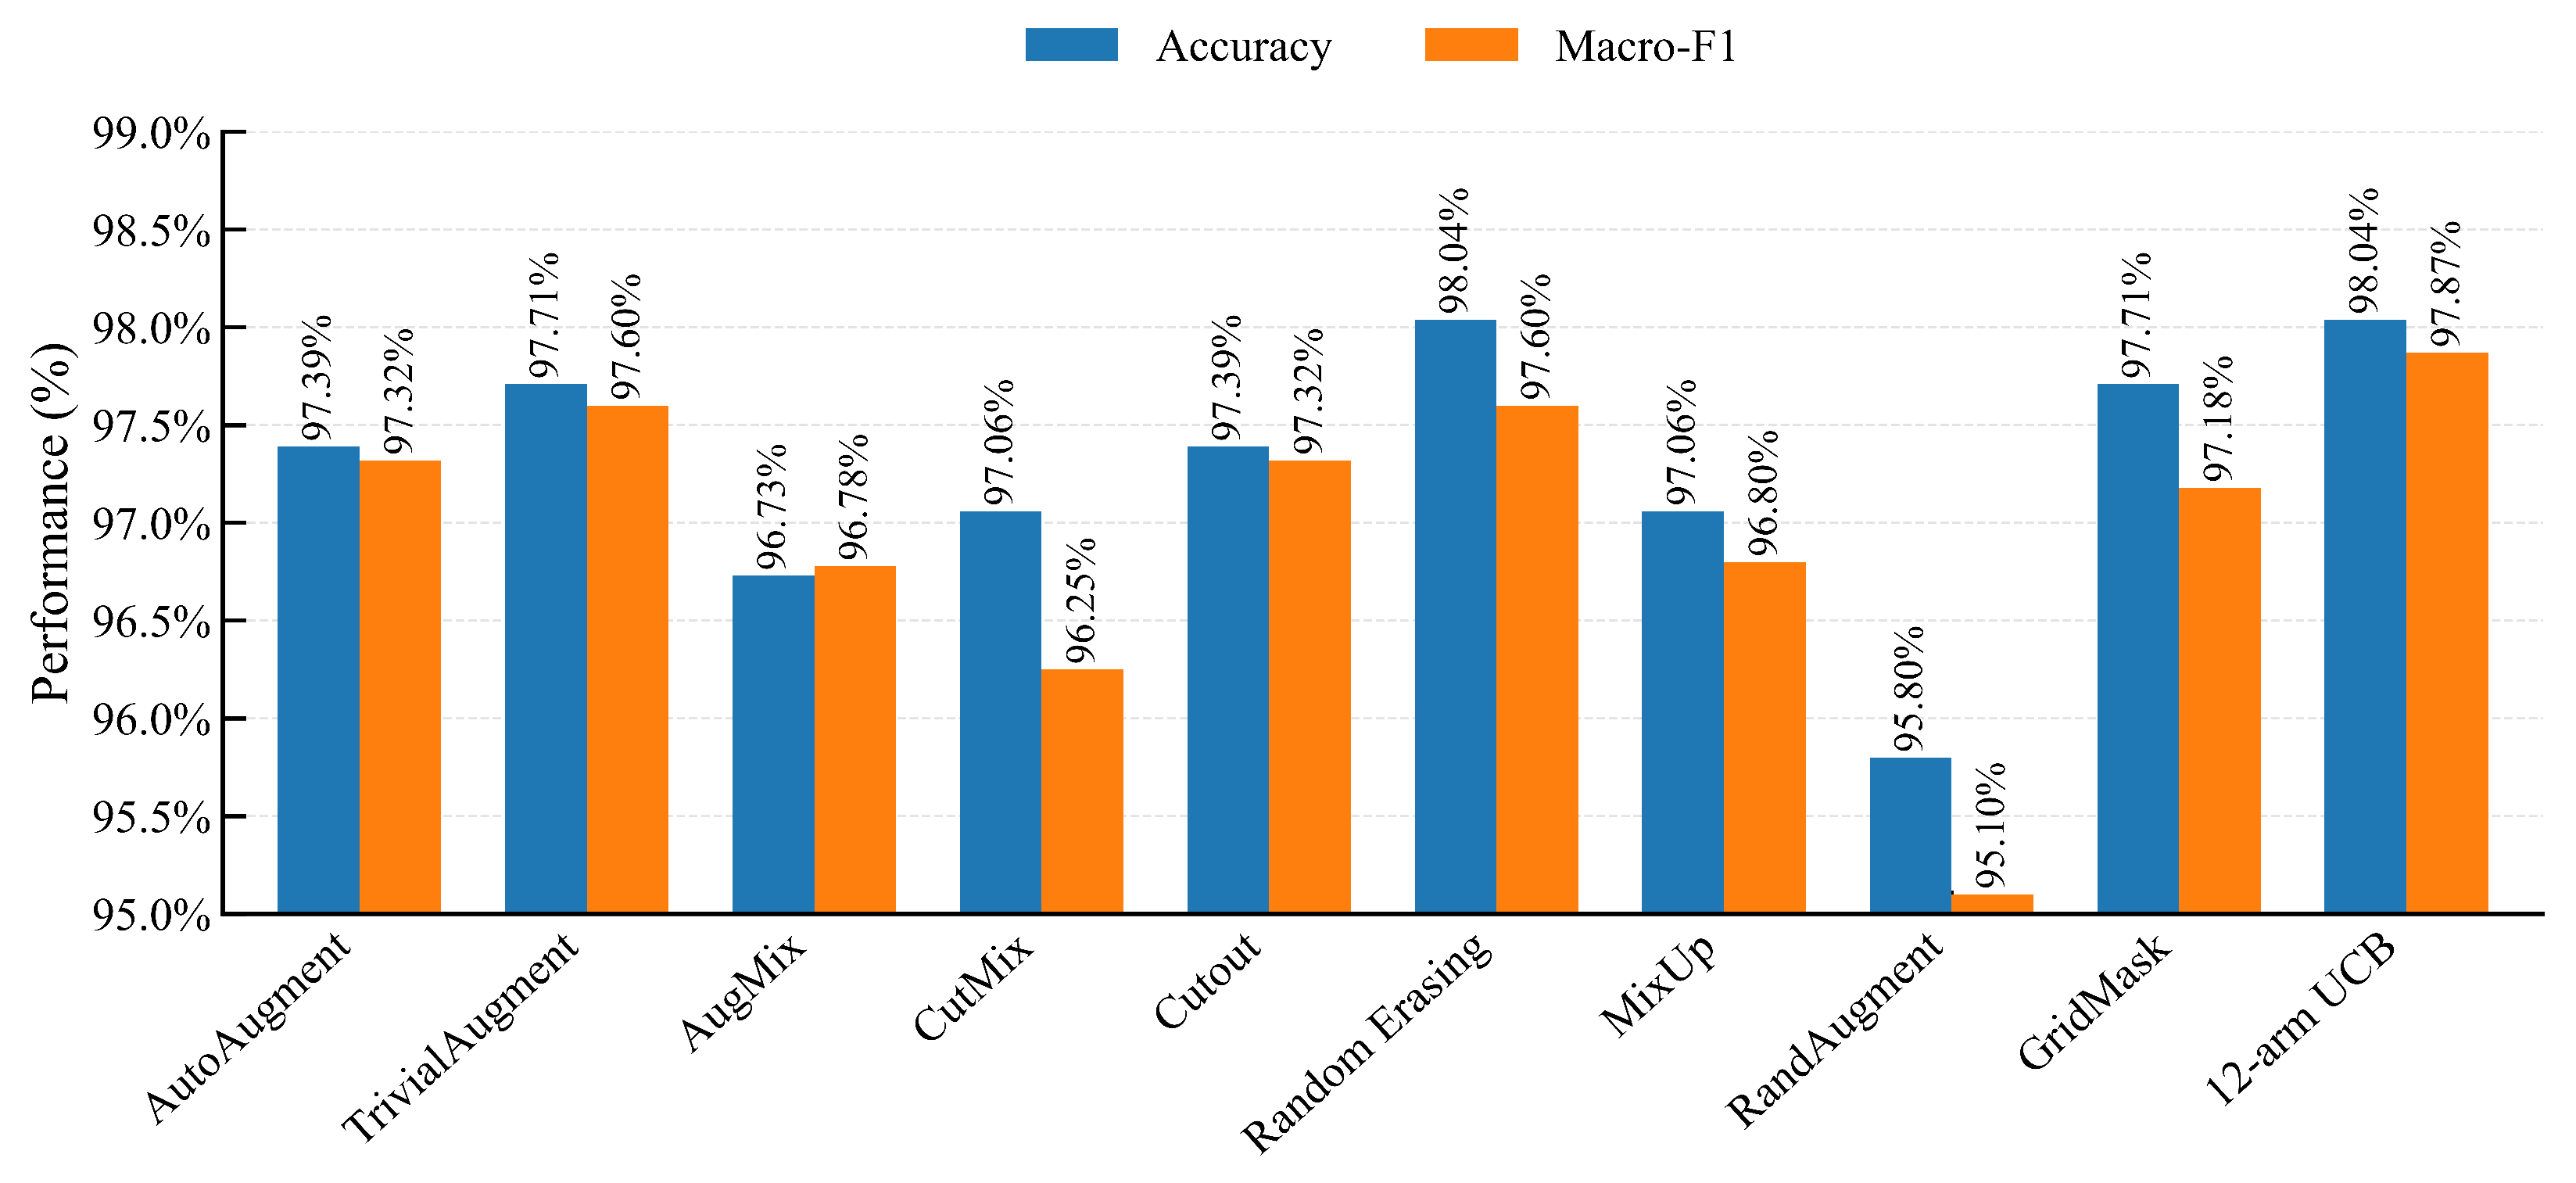
As shown in Table 8 and Figure 7, among all evaluated augmentation strategies, the proposed 12-arm UCB-guided augmentation achieved the highest macro-F1 of 97.87%, while also tying with Random Erasing for the highest test accuracy of 98.04%. To make the relatively small performance differences among the evaluated methods more discernible, the y-axis in Figure 7 is restricted to 95–99%. This result is particularly important because macro-F1 provides a class-balanced assessment of classification performance across the three betel leaf categories. In comparison, Random Erasing achieved 97.60% macro-F1, while TrivialAugment achieved 97.60% macro-F1 and 97.71% accuracy. RandAugment alone achieved 95.80% accuracy and 95.10% macro-F1, whereas Mixup alone achieved 97.06% accuracy and 96.80% macro-F1. These results indicate that the performance improvement cannot be attributed solely to RandAugment or Mixup individually. Although several established augmentation methods remain competitive, the proposed 12-arm UCB framework achieved the highest macro-F1 among the evaluated augmentation strategies.
Table 8.
Performance comparison of established augmentation methods and the proposed 12-arm UCB-guided augmentation using ConvNeXt-Tiny.
Figure 7.
Visual comparison of test accuracy and macro-F1 across established augmentation strategies and the proposed 12-arm UCB-guided adaptive augmentation using ConvNeXt-Tiny.
To quantify the computational overhead associated with the UCB-guided augmentation search, training times were measured under the same hardware and training settings. For all final model-training/refit runs, including the fixed selected policy, standard RandAugment, and the final model obtained after UCB search, training was conducted for 40 epochs. The UCB policy-search stage was performed separately for 50 epochs before the selected policy was fixed for the final 40-epoch refit. As summarized in Table 9, the fixed selected policy (Arm 10: RandAugment-5 + Mixup) required 32.365 min for 40 epochs, while standard RandAugment with required 32.728 min for 40 epochs. The 50-epoch UCB policy-search stage required 40.257 min, followed by 33.342 min for the 40-epoch fixed-policy refit, resulting in a total search-and-refit time of 73.599 min.
Table 9.
Computational overhead of the proposed UCB-guided augmentation search compared with the fixed selected policy and standard RandAugment.
Relative to the fixed selected policy, the complete UCB search-and-refit procedure required 2.274× the training time, while the corresponding ratio relative to standard RandAugment was 2.249×. However, the average time per epoch during the UCB search was approximately 0.805 min, compared with 0.809 min for the fixed selected policy and 0.818 min for standard RandAugment. Thus, the additional total training cost arises primarily from the separate 50-epoch policy-search stage rather than from substantial per-epoch computation introduced by the UCB controller. This additional cost is incurred during model development only, since the UCB controller is not used during inference.
To further evaluate robustness under increasing class imbalance, the minority Leaf Rot samples in the training and validation partitions were progressively reduced to 75%, 50%, and 25% of their original numbers, as summarized in Table 10. The numbers of Healthy Leaf and Leaf Spot samples were kept unchanged at 756 and 481 in the training set and 162 and 104 in the validation set, respectively. The independent test set was also kept unchanged across all experiments, containing 162 Healthy Leaf, 41 Leaf Rot, and 103 Leaf Spot images. UCB-guided augmentation consistently achieved higher test accuracy and macro-F1 than AutoAugment across all investigated imbalance levels. At the most severe 25% retention level, UCB achieved 96.41% accuracy and 95.29% macro-F1, compared with 94.44% accuracy and 92.65% macro-F1 for AutoAugment. The macro-F1 advantage increased from 0.55 percentage points under the original class distribution to 2.64 percentage points at the 25% retention level, indicating comparatively greater robustness of UCB-guided augmentation as minority-class availability decreased.
Table 10.
Performance under increasing Leaf Rot class imbalance.
4.4. Performance Evaluation of the Final ConvNeXt-Tiny Framework
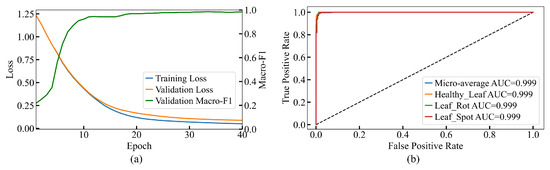
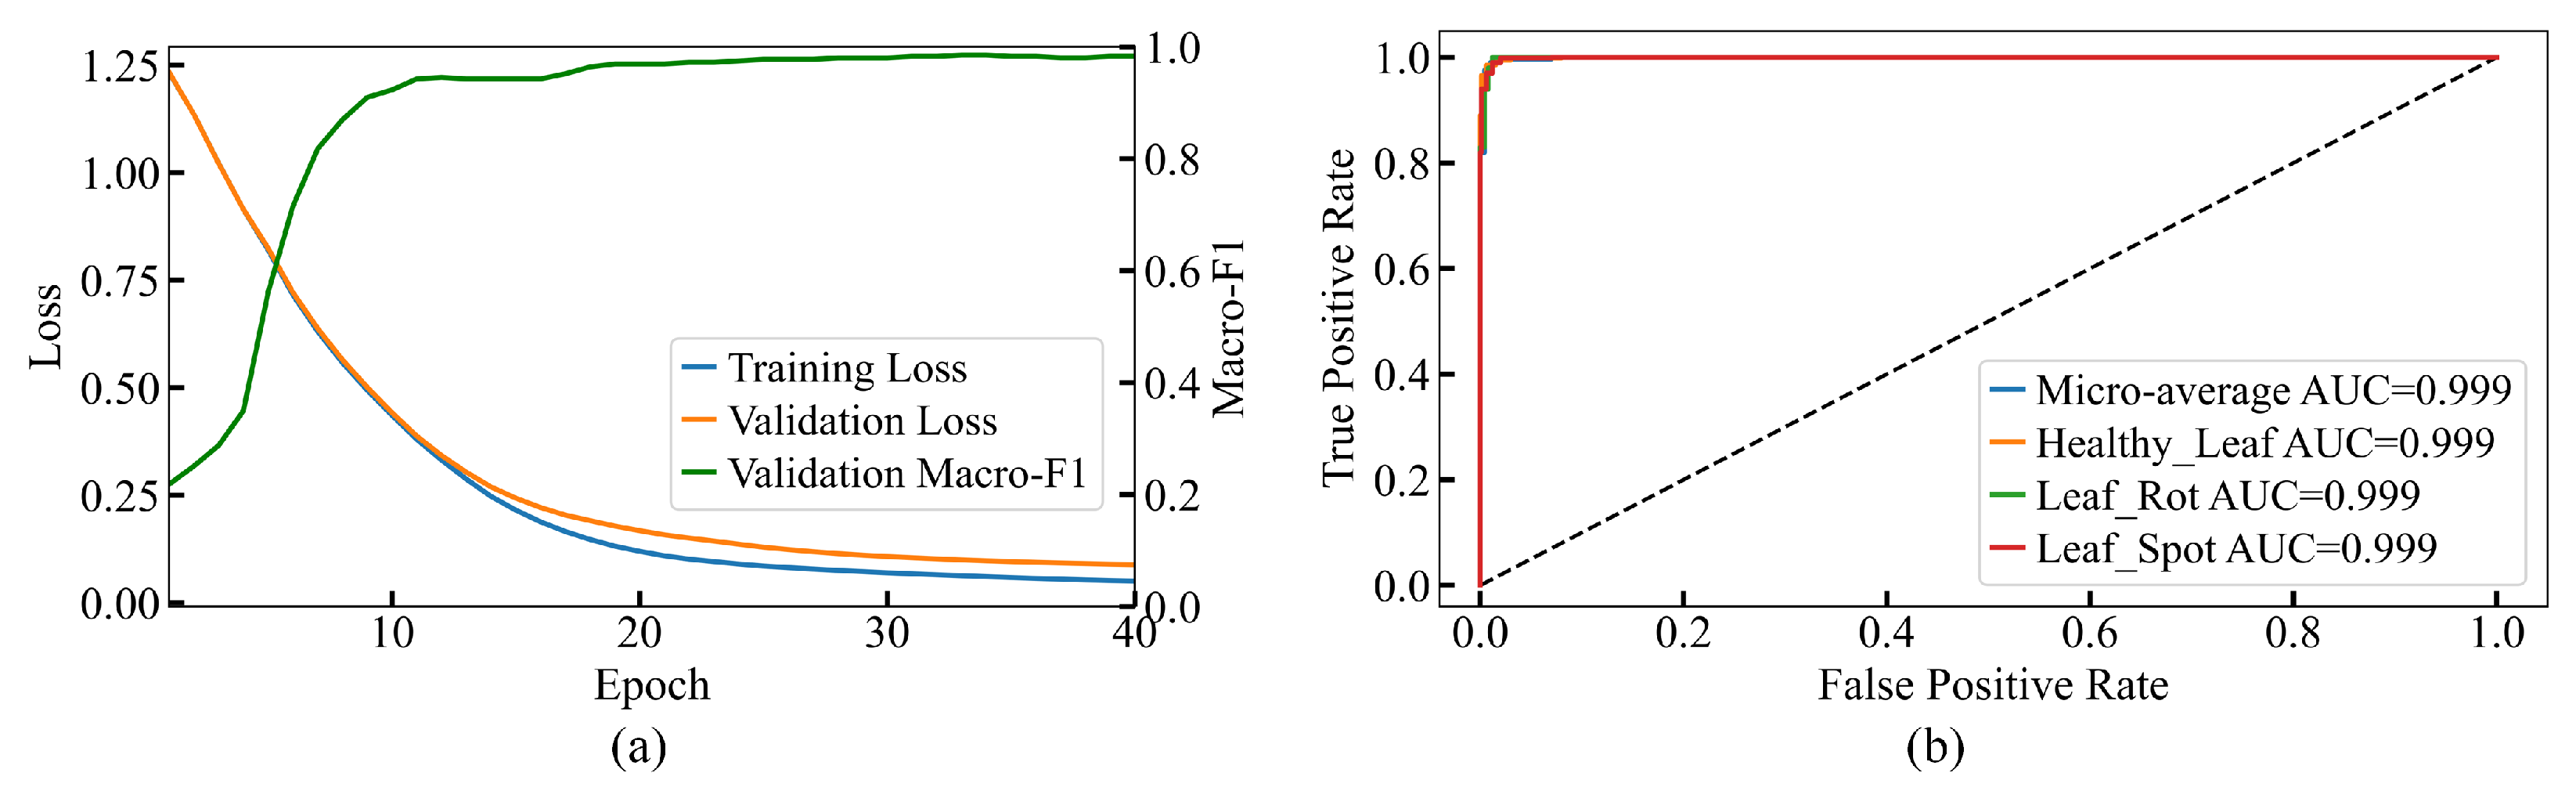
To assess convergence and potential overfitting, the training dynamics during the 40-epoch fixed-policy refitting stage are illustrated in Figure 8a. The training loss decreases rapidly during the early epochs and continues to decline throughout the refitting stage, approaching zero toward the end of training. Despite this strong fitting of the training data, the validation loss does not exhibit sustained late-epoch deterioration. The validation macro-F1 also increases rapidly during the early epochs and then remains high and relatively stable, with only minor fluctuations. These trends indicate stable convergence without clear evidence of severe overfitting under the investigated training regime. This final refitting stage is distinct from the preceding 50-epoch UCB augmentation-policy search shown in Figure 6a, after which the selected augmentation policy was fixed.
Figure 8.
(a) Training and validation loss with validation macro-F1 during the 40-epoch fixed-policy refit, and (b) one-vs-rest ROC curves of the final ConvNeXt-Tiny model after 12-arm UCB-guided augmentation-policy selection.
To evaluate discriminative capability, the classification effectiveness of the model is evaluated using Receiver Operating Characteristic–Area Under the Curve (ROC–AUC) analysis, as illustrated in Figure 8b. The ROC curves for all classes are tightly clustered toward the upper-left corner, indicating excellent class separability and a highly favorable trade-off between sensitivity and specificity. The micro-average ROC–AUC reaches 0.999, demonstrating near-perfect overall discriminative performance across the dataset. Moreover, each class, namely Healthy Leaf, Leaf Spot, and Leaf Rot, also achieves an AUC of 0.999, confirming the model’s consistently outstanding discrimination capability across all categories.
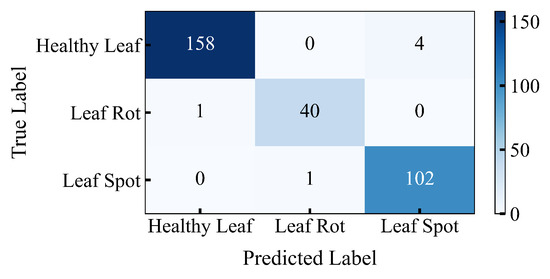
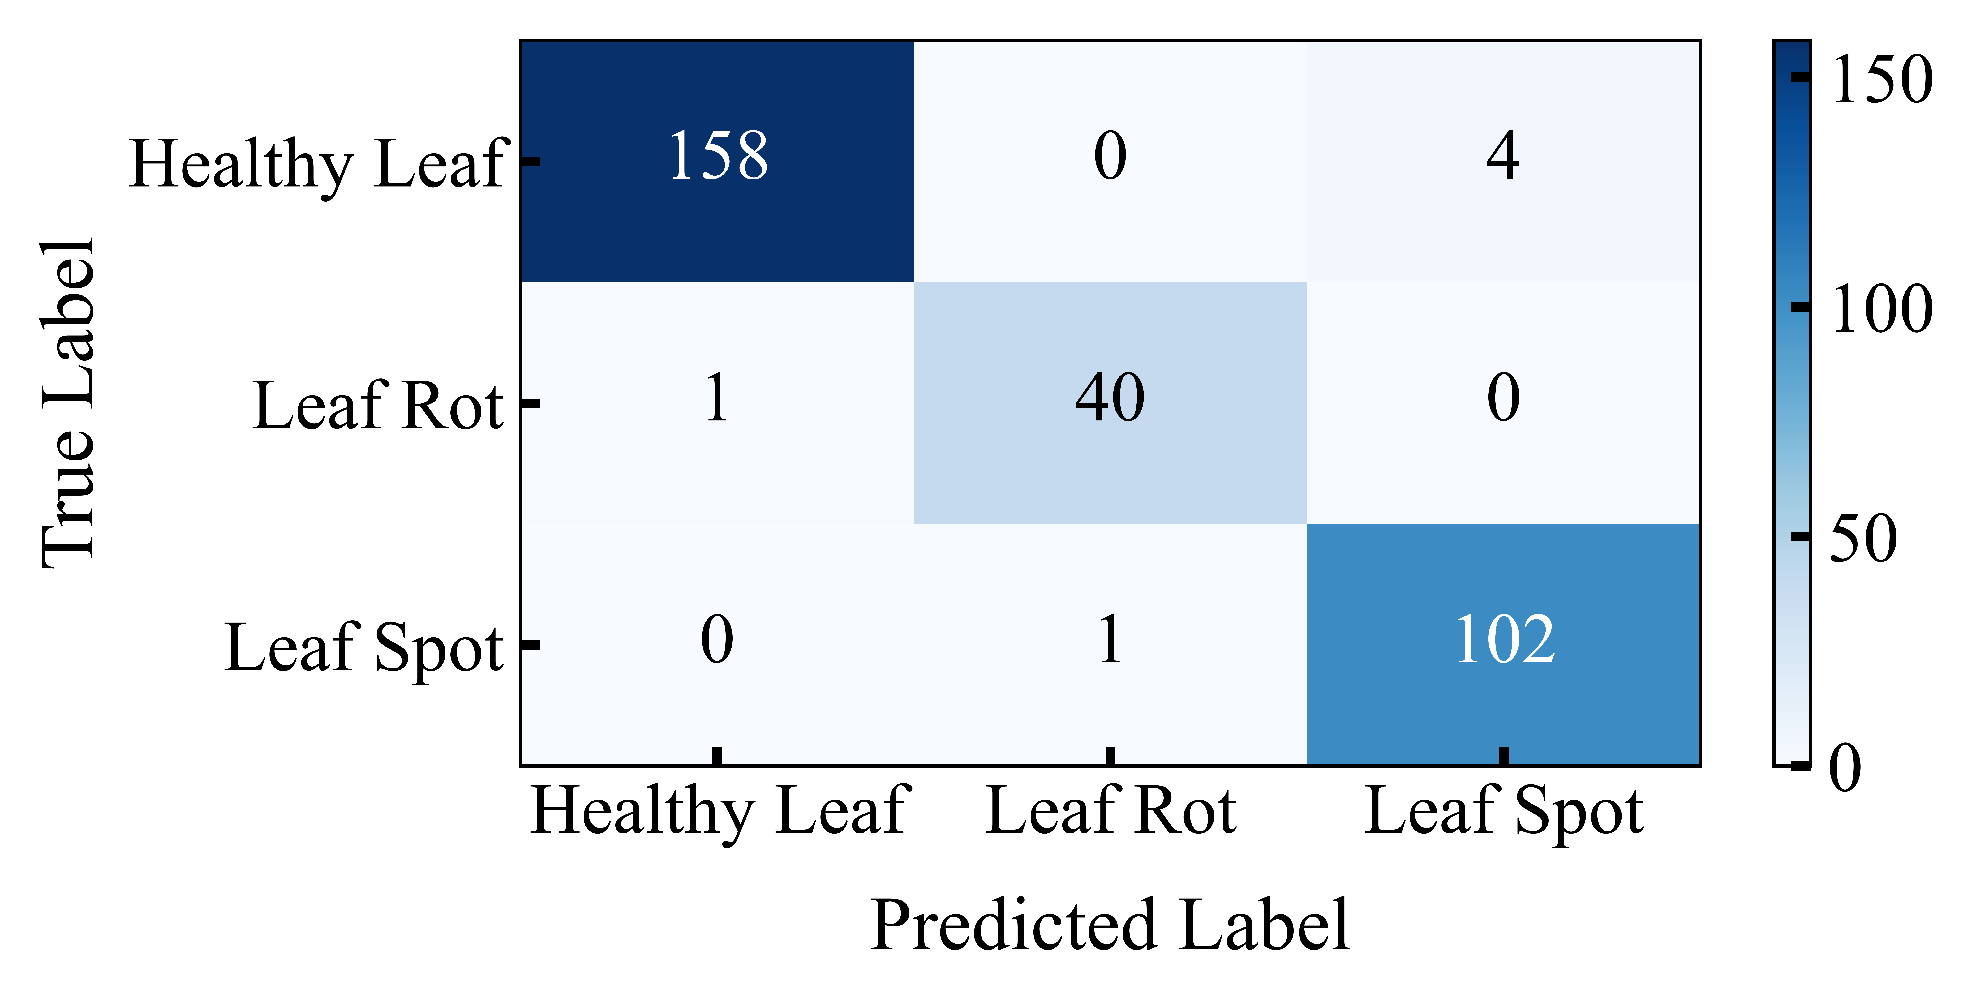
Finally, the confusion matrix analysis, presented in Figure 9, further validates the robustness of the proposed framework. The results show that predictions are strongly concentrated along the main diagonal, indicating high classification accuracy across all classes. Specifically, for the Healthy Leaf category, 158 out of 162 samples are correctly classified, with only 4 misclassified as Leaf Spot. Similarly, the Leaf Rot class achieves near-perfect recognition with 40 correct predictions out of 41, and only a single sample misclassified as Healthy Leaf. For the Leaf Spot class, 102 out of 103 samples are correctly identified, with one sample misclassified as Leaf Rot. Overall, the results from training loss, ROC-AUC, and the confusion matrix confirm that the proposed ConvNeXt-Tiny model with 12-arm UCB-guided augmentation achieves stable convergence, strong class separability, and reliable classification performance.
Figure 9.
Confusion matrix of the proposed ConvNeXt-Tiny model under 12-arm UCB-guided augmentation.
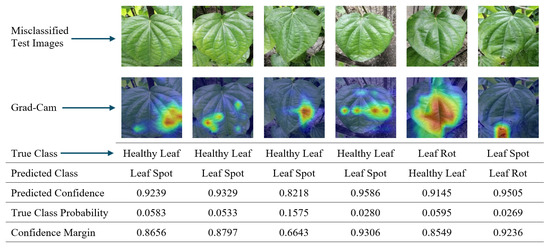
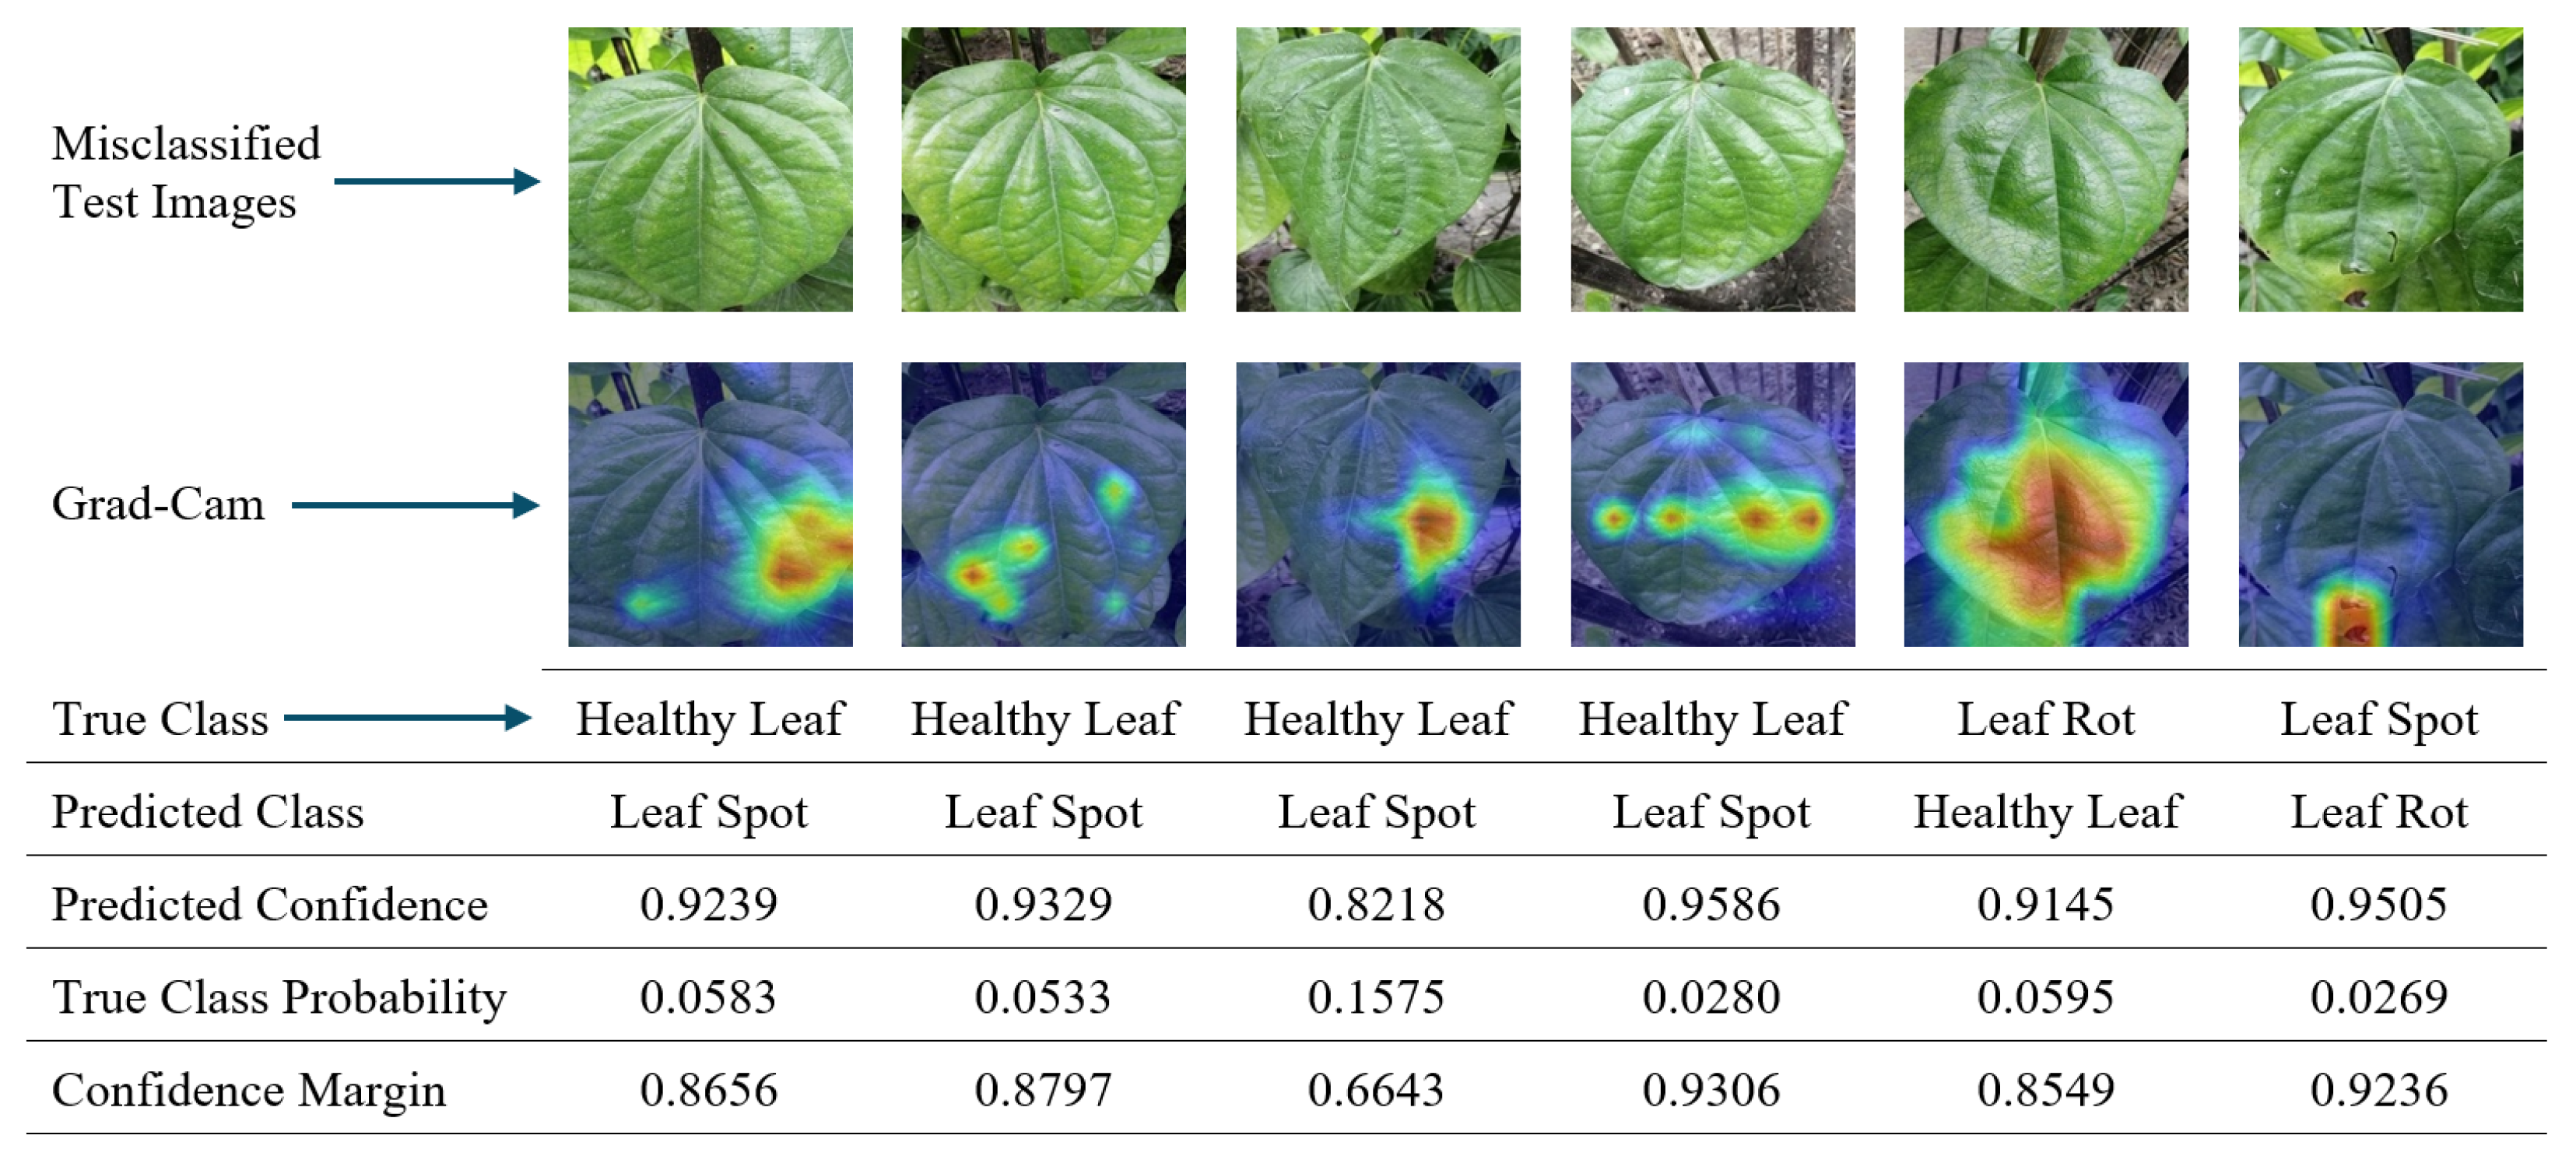
To investigate the remaining classification errors, a qualitative analysis of all six misclassified held-out test samples was conducted, as shown in Figure 10.
Figure 10.
Visual representation of the six misclassified test images with ground-truth labels, predicted classes, and Grad-CAM activation regions.
Four Healthy Leaf samples were incorrectly classified as Leaf Spot, one Leaf Rot sample was classified as Healthy Leaf, and one Leaf Spot sample was classified as Leaf Rot. The Healthy Leaf samples misclassified as Leaf Spot exhibit localized pale, mottled, or intensity-varying regions and, in some cases, small dark surface markings that may visually resemble mild spot-related symptoms. The corresponding Grad-CAM maps indicate that the model frequently attended to these localized regions when producing the incorrect Leaf Spot predictions.
The Leaf Rot sample misclassified as Healthy Leaf remains predominantly green and exhibits comparatively subtle visible disease characteristics. Its Grad-CAM response is distributed relatively broadly over the central leaf surface and venation rather than being concentrated on a distinct rot-related lesion. In contrast, the Leaf Spot sample misclassified as Leaf Rot contains a localized brown necrotic region near the lower portion of the leaf, where the Grad-CAM activation is strongly concentrated. This pattern indicates visual overlap between spot-related necrosis and rot-like tissue damage. Overall, the observed errors appear to be associated primarily with subtle disease manifestations and overlapping visual characteristics among the classes. Illumination and background variation may contribute to additional visual ambiguity in some samples, whereas the examined cases do not indicate partial leaves as a dominant source of error.
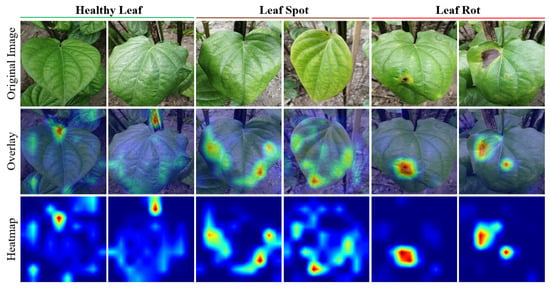
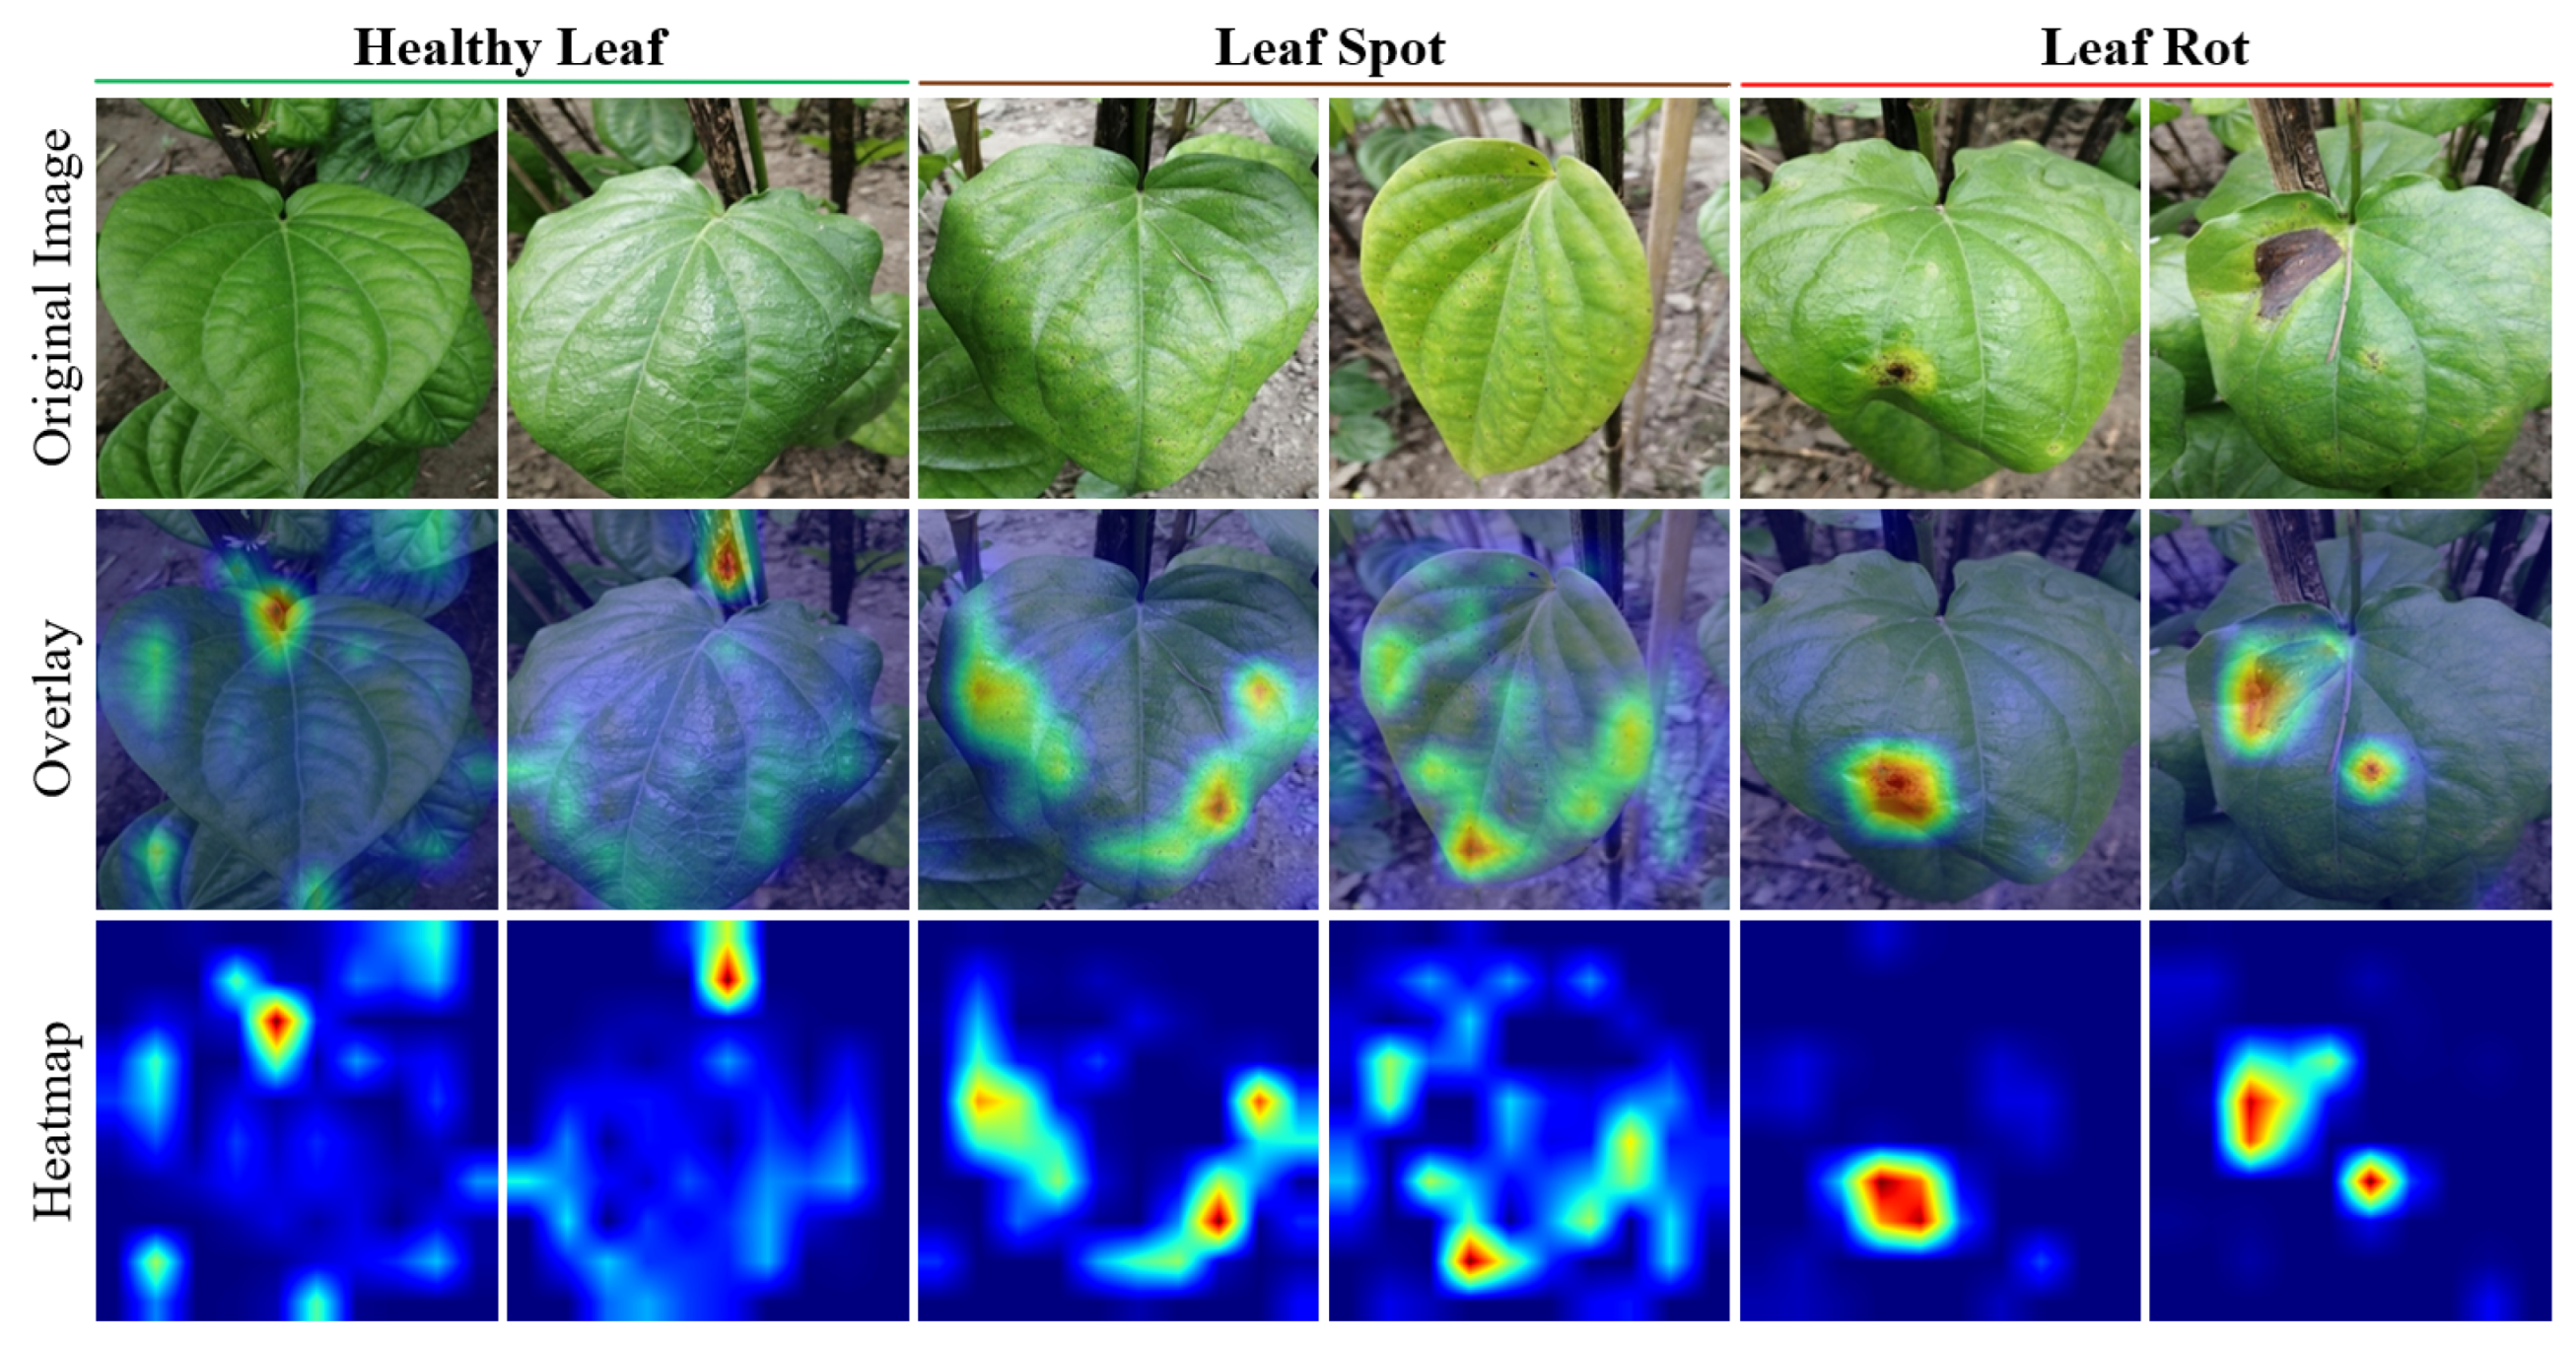
To further examine the visual evidence supporting the model predictions, Grad-CAM analysis was also performed on representative correctly classified images from the held-out test set, as illustrated in Figure 11.
Figure 11.
Representative Grad-CAM analysis of correctly classified held-out test images, showing prediction-relevant activation regions of the final ConvNeXt-Tiny model.
For the diseased samples, the strongest activations are predominantly located within the leaf surface and frequently overlap with visually apparent lesions, localized discoloration, and abnormal tissue regions. For Healthy Leaf samples, the activations are generally distributed over internal leaf regions and structural texture rather than being consistently concentrated on the surrounding background. Although secondary activation is observed near leaf boundaries, petiole regions, or adjacent image areas in some cases, these regions do not form a consistent dominant activation pattern across the examined samples.
These Grad-CAM visualizations provide qualitative evidence that the final ConvNeXt-Tiny model predominantly relies on leaf-related visual information, including disease-associated regions for the diseased classes, rather than systematically depending on background regions or acquisition-related cues. Nevertheless, Grad-CAM is a qualitative attribution method; therefore, the visualizations should not be interpreted as definitive evidence that the model predictions are completely independent of all potentially spurious image features.
4.5. Multi-Seed Robustness Analysis
To assess the stability of the proposed framework with respect to random initialization and dataset partitioning, the complete experimental procedure was repeated across five independent random seeds (42, 43, 44, 45, and 46). For each seed, a new stratified 70%/15%/15% training, validation, and test split was generated from the 2037 original images. The UCB-guided augmentation-policy search was then performed independently for each run, followed by fixed-policy refitting and evaluation on the corresponding independent test set. Thus, the variability across the five runs reflects the combined effects of random initialization and independently generated stratified dataset partitions.
As summarized in Table 11, the proposed framework achieved a mean accuracy of 0.986928 ± 0.006932 and a mean macro-F1 score of 0.985123 ± 0.006154 across the five independent runs. The corresponding mean macro-AUC was 0.997576 ± 0.004132. Although some run-to-run variation was observed, particularly in the macro-AUC obtained for seed 46, the overall classification performance remained consistently high across the evaluated seeds and dataset partitions. These results indicate that the performance of the proposed framework is reasonably stable under changes in random initialization and stratified dataset partitioning, thereby reducing the concern that the reported performance is driven solely by a single favorable random seed or data split.
Table 11.
Multi-seed robustness analysis of the proposed framework across five independent stratified dataset splits.
5. Discussion
5.1. Comparison with Previous Betel Leaf Disease Studies
The most closely related studies are compared in Table 12. All three studies are based on the same publicly available set of 2037 original images covering Healthy Leaf, Leaf Rot, and Leaf Spot [11,12], although the authors of [12] additionally incorporated 700 original images. The authors of [11] expanded the base dataset to 10,185 images using fixed augmentation and reported an 80:10:10 split, with the augmented dataset partitioned into training, validation, and test sets. In contrast, the authors of [12] used an expanded dataset containing 700 additional original images and reported a 70:15:15 split, although the augmentation–partitioning order is inconsistently described in the paper. The present study uses only the 2037 original images to construct the stratified 70:15:15 training, validation, and test subsets before any augmentation is applied. The 10,185 pre-generated augmented images released with the dataset are excluded, while online augmentation is restricted to the training subset, and the validation and test subsets remain composed of original images. This protocol reduces the risk of near-duplicate samples derived from the same original image appearing across training and evaluation subsets.
Table 12.
Methodological and performance comparison of closely related studies based on a common three-class betel leaf dataset.
The proposed framework also differs from the fixed augmentation strategies adopted in [11,12]. Rather than relying on a single manually specified augmentation configuration, the proposed method uses UCB-guided augmentation-policy selection to explore candidate RandAugment magnitudes with optional Mixup based on validation macro-F1. The selected augmentation configuration is subsequently fixed for the final model refit. These design choices provide several methodological advantages within the investigated experimental setting. First, splitting the original images before augmentation reduces the risk that augmented variants derived from the same source image are distributed across training and evaluation subsets. Second, excluding the pre-generated augmented subset and restricting online augmentation to the training set provides clearer control over the augmentation and evaluation protocol while preserving original validation and test images. Third, the UCB-guided search allows augmentation configurations to be evaluated adaptively during policy selection rather than requiring a single augmentation policy to be chosen manually in advance. Finally, fixing the selected policy for the final refit separates augmentation-policy search from final model training and ensures that the reported test performance corresponds to a clearly defined fixed-policy model.
The proposed ConvNeXt-Tiny model achieves an accuracy of 98.04% and a macro-F1 score of 97.87%. For comparison, the proposed lightweight CBAM-CNN in [11] reports 95.58% accuracy and 95.00% F1. In [12], the best-performing EfficientNet-B0 model is reported to achieve 99.48% accuracy; however, a corresponding macro-F1 score for that evaluation is not reported. In a separate 10-fold cross-validation analysis, the authors of [12] reports average accuracy and F1-score values of 98.95%. These numerical results should not be interpreted as a direct performance ranking because the studies differ in dataset composition, augmentation procedures, and evaluation protocols. Accordingly, the principal distinction of the present work lies in its original-image-first partitioning, controlled training-only augmentation, and UCB-guided augmentation-policy selection followed by fixed-policy refitting, rather than in claiming direct numerical superiority over previously reported results. Broader validation and deployment-related limitations of the present study are discussed in Section 5.2 and Section 5.3, respectively.
5.2. Validation Considerations
A further limitation concerns the repeated use of validation macro-F1 as the reward for augmentation-policy selection. Because the same validation set is evaluated throughout the 50-epoch adaptive search, some degree of policy-selection bias may arise. In the present study, this risk was separated from the final performance evaluation by keeping the independent test set completely untouched during augmentation-policy selection, model training, checkpoint selection, and hyperparameter tuning. Future work will investigate dedicated policy-selection validation subsets, nested validation, or repeated cross-validation to further reduce this source of selection bias.
5.3. Edge Deployment and Model Optimization Considerations
Recent studies have demonstrated the feasibility of deploying ConvNeXt-Tiny-based architectures on resource-constrained hardware, while also highlighting the importance of hardware-specific optimization. In Ref. [22], the authors deployed a ConvNeXt-Tiny-based shrimp health classification model on an NVIDIA Jetson Nano using TensorRT-FP16, including weight conversion, layer pruning, and inference-parameter optimization, achieving an inference latency of 39 ms and a peak throughput of 25 FPS.
Similarly, the authors of Ref. [23] implemented a dual-path ConvNeXt-Tiny–ViT skin cancer classification framework on a Zynq UltraScale+ FPGA using a dedicated hardware accelerator with optimized data transfer, dual-cache architecture, efficient scheduling, and parallel processing. Their implementation achieved an inference time of 20.8 ms with a power consumption of 2.8 W.
These studies indicate the potential feasibility of ConvNeXt-Tiny-based architectures for resource-constrained deployment when appropriate hardware-specific optimization is applied. However, model-compression techniques, such as post-training quantization, quantization-aware training, pruning, and knowledge distillation, as well as hardware-specific deployment optimization, were not investigated in the present study and therefore remain important directions for future work.
6. Conclusions and Future Work
In this work, a betel leaf disease classification framework was developed for the classification of healthy leaves, leaf rot, and leaf spot under a limited-data setting. Multiple representative DL architectures, including ResNet, DenseNet, EfficientNet, MobileNet, and ConvNeXt-Tiny, were evaluated under a unified experimental protocol. Furthermore, the effects of fixed augmentation and UCB-guided adaptive augmentation were systematically investigated. Among the evaluated configurations, ConvNeXt-Tiny integrated with the proposed 12-arm UCB-guided augmentation achieved strong overall classification performance, with an accuracy of 98.04%, a macro-F1 score of 97.87%, and a micro-average AUC of 0.999. The results indicate that dynamically balancing exploration and exploitation during augmentation-policy selection can provide an effective strategy for improving classification performance under the investigated limited-data setting.
Nevertheless, several limitations remain. The learned augmentation behavior may be dataset-dependent and should be validated on larger and more diverse agricultural datasets, including field-wise evaluation. Direct transfer of the augmentation policy learned on ConvNeXt-Tiny to alternative backbone architectures was not evaluated in the present study; therefore, the backbone-level transferability of the learned policy remains to be established in future work. Although Grad-CAM analysis was incorporated to provide qualitative insight into the model’s prediction-relevant regions, more extensive explainability evaluation using complementary attribution methods remains for future investigation. In addition, hardware-specific deployment, model compression, and formal accuracy–efficiency–search-cost evaluation were beyond the scope of this study. Future work will therefore investigate these aspects to further assess the generalizability, interpretability, and deployment efficiency of the proposed framework.
Author Contributions
Conceptualization, I.J. and S.H.; methodology, I.J.; software, I.J.; validation, I.J., S.H. and M.K.H.; formal analysis, I.J.; investigation, S.H.; resources, S.H. and M.K.H.; data curation, I.J.; writing—original draft preparation, I.J. and S.H.; writing—review and editing, M.K.H.; visualization, S.H.; supervision, M.K.H.; project administration, M.K.H. All authors have read and agreed to the published version of the manuscript.
Funding
This work was supported in part by JMU Libraries and the Office of Research, Economic Development and Innovation at James Madison University.
Institutional Review Board Statement
Not applicable.
Informed Consent Statement
Not applicable.
Data Availability Statement
The data supporting the findings of this study are publicly available in the Mendeley Data repository as the Comprehensive Betel Leaf Disease Dataset for Advanced Pathology Research (Version 1, DOI: 10.17632/vpzkntzjty.1). The dataset can be accessed at: https://data.mendeley.com/datasets/vpzkntzjty/1 accessed on 20 September 2026.
Acknowledgments
During the preparation of this manuscript, the authors used ChatGPT (GPT-5.5 and GPT-5.6, OpenAI) solely to assist with English-language editing and grammatical refinement. The authors critically reviewed and revised all AI-assisted text and take full responsibility for the accuracy, integrity, and final content of the manuscript.
Conflicts of Interest
The authors declare no conflicts of interest.
Abbreviations
The following abbreviations are used in this manuscript:
| AI | Artificial Intelligence |
| CBAM | Convolutional Block Attention Module |
| CNN | Convolutional Neural Network |
| DL | Deep Learning |
| GAP | Global Average Pooling |
| GELU | Gaussian Error Linear Unit |
| Grad-CAM | Gradient-weighted Class Activation Mapping |
| FN | False Negative |
| FP | False Positive |
| TP | True Positive |
| TN | True Negative |
| PR | Precision |
| RE | Recall |
| ROC-AUC | Receiver Operating Characteristic-Area Under the Curve |
| UCB | Upper Confidence Bound |
| ViTs | Vision Transformers |
References
- Singh, T.; Singh, P.; Pandey, V.K.; Singh, R.; Dar, A.H. A literature review on bioactive properties of betel leaf (Piper betle L.) and its applications in food industry. Food Chem. Adv. 2023, 3, 100536. [Google Scholar] [CrossRef] [Scilit]
- Roy, T.; Alam, C.A.; Mamun Sony, M.A.A. Livelihood pattern of betel leaf cultivators: A case study at Fakirhat Upazila in Bagerhat District of Bangladesh. S. Asian J. Agric. 2019, 7, 34–37. [Google Scholar] [CrossRef] [Scilit]
- Mahfuza, E.J.; Ahamed, M.S.; Hassan, M.F. Impact of betel leaf farming on livelihood and income generation in some selected areas of the Rajshahi District of Bangladesh. S. Asian J. Soc. Stud. Econ. 2023, 20, 250–259. [Google Scholar] [CrossRef] [Scilit]
- Hridoy, R.H.; Habib, M.T.; Mahmud, I.; Haque, A.; Mamun, M.A.A. A comprehensive image dataset for accurate diagnosis of betel leaf diseases using artificial intelligence in plant pathology. Data Brief 2025, 60, 111564. [Google Scholar] [CrossRef] [Scilit] [PubMed]
- Mehdipour, S.; Mirroshandel, S.A.; Tabatabaei, S.A. Vision transformers in precision agriculture: A comprehensive survey. Intell. Syst. Appl. 2026, 29, 200617. [Google Scholar] [CrossRef] [Scilit]
- Shakib, M.S.; Kamaruzzaman; Jaman, A.; Islam, M.N. A comprehensive analysis of multi-modal deep transfer learning for rice leaf disease detection. In Proceedings of the 6th International Conference on Electrical Engineering and Information & Communication Technology (ICEEICT), Dhaka, Bangladesh, 2–4 May 2024; pp. 1240–1245. [Google Scholar]
- Kumar, P.; Champa, H.N. Crop disease identification in tomato leaf using deep learning. In Proceedings of the International Conference on Computing Communication and Networking Technologies (ICCCNT), Delhi, India, 6–8 July 2023; pp. 1–7. [Google Scholar]
- Chen, Y.; Wang, A.; Liu, Z.; Yue, J.; Zhang, E.; Li, F.; Zhang, N. MoSViT: A lightweight vision transformer framework for efficient disease detection via precision attention mechanism. Front. Artif. Intell. 2025, 8, 1498025. [Google Scholar] [CrossRef] [Scilit] [PubMed]
- Keawpibal, N.; Naco, A.; Pukkhem, N. Comparative analysis of Yolov5 and Yolov8 algorithms for classification and detection of betel leaf diseases. AIP Conf. Proc. 2026, 3462, 150003. [Google Scholar] [CrossRef] [Scilit]
- Bhaskar, B.; Kusuma, S.; Prasad, K.A.; Naresh, A.; Subbaiah, C.V. BetelProNet framework: Efficient deep learning model for betel leaf disease detection. Int. Res. J. Multidiscip. Scope 2025, 6, 856–870. [Google Scholar] [CrossRef] [Scilit]
- Tabassum, S.; Ahamed, M.F. CBAM integrated attention driven model for betel leaf diseases classification with explainable AI. In Proceedings of the 2025 IEEE 2nd International Conference on Computing, Applications and Systems (COMPAS), Kushtia, Bangladesh, 23–24 October 2025; pp. 1–6. [Google Scholar]
- Nimu, S.S.; Akter, S.; Mim, M.A.; Salma, U.; Hasan, A. A deep learning approach for spot and rot disease detection in betel leaves. In Proceedings of the IEEE International Women in Engineering (WIE) Conference on Electrical and Computer Engineering (WIECON-ECE), Dhaka, Bangladesh, 21–22 December 2025; pp. 225–230. [Google Scholar]
- Xiao, A.; Han, K.; Shi, X.; Tian, J.; Hu, Z. Data augmentation with multi-armed bandit on image deformations improves fluorescence glioma boundary recognition. In Medical Image Computing and Computer Assisted Intervention—MICCAI 2024; Lecture Notes in Computer Science; Springer Nature: Cham, Switzerland, 2024; Volume 15002, pp. 130–140. [Google Scholar]
- Tampu, I.E.; Eklund, A.; Haj-Hosseini, N. Inflation of test accuracy due to data leakage in deep learning-based classification of OCT images. Sci. Data 2022, 9, 580. [Google Scholar] [CrossRef] [Scilit] [PubMed]
- Hridoy, R.H.; Habib, M.T.; Mahmud, I.; Haque, A.; Mamun, M.A.A. Comprehensive Betel Leaf Disease Dataset for Advanced Pathology Research. Mendeley Data 2025, V1. [Google Scholar] [CrossRef]
- Manome, N.; Shinohara, S.; Chung, U.-I. Simple modification of the upper confidence bound algorithm by generalized weighted averages. PLoS ONE 2025, 20, e0322757. [Google Scholar] [CrossRef] [Scilit] [PubMed]
- Zhang, H.; Cisse, M.; Dauphin, Y.N.; Lopez-Paz, D. Mixup: Beyond empirical risk minimization. In Proceedings of the International Conference on Learning Representations (ICLR), Vancouver, BC, Canada, 30 April–3 May 2018. [Google Scholar]
- Liu, Z.; Mao, H.; Wu, C.-Y.; Feichtenhofer, C.; Darrell, T.; Xie, S. A ConvNet for the 2020s. In Proceedings of the IEEE/CVF Conference on Computer Vision and Pattern Recognition (CVPR), New Orleans, LA, USA, 18–24 June 2022; pp. 11966–11976. [Google Scholar]
- Ispir, F.B.; Tanyildizi, E. Comparison of CNN and transformer models with transfer learning in monkeypox diagnosis. In Proceedings of the 9th International Artificial Intelligence and Data Processing Symposium (IDAP), Malatya, Turkiye, 6–7 September 2025; pp. 1–7. [Google Scholar]
- Tahsin, M.; Nuha, M.B.R.; Akter, S.; Hossain, A.; Rashid, M.R.A.; Islam, R.U.; Hossain, M.S. Leveraging pre-trained models within a semi-supervised and explainable AI RealTime framework: A pioneering paradigm for betel leaf disease detection. J. Agric. Food Res. 2025, 22, 102142. [Google Scholar] [CrossRef] [Scilit]
- Kusuma, S.; Jothi, K.R. Early betel leaf disease detection using vision transformer and deep learning algorithms. Int. J. Inf. Technol. 2024, 16, 169–180. [Google Scholar] [CrossRef] [Scilit]
- Le, T.D.; Huynh, K.-T.; Pham, D.D.; Nguyen, H.Q.; Nguyen, M.T. Edge-IoT ConvNeXt-CBAM System for Real-Time Classification of Shrimp Health Conditions. In Proceedings of the 2025 International Conference on Advanced Technologies for Communications (ATC), Hanoi, Vietnam, 16–18 October 2025; pp. 1–6. [Google Scholar]
- Smida, J.; Azizi, M.K.; Chandra Bose, A.S.; Smida, A. FPGA-Based Dual Path ConvNeXt-Tiny–ViT with Effective Feature Refinement for Skin Cancer Classification. IET Comput. Digit. Tech. 2026, 2026, 9183110. [Google Scholar] [CrossRef] [Scilit]

Disclaimer/Publisher’s Note: The statements, opinions and data contained in all publications are solely those of the individual author(s) and contributor(s) and not of MDPI and/or the editor(s). MDPI and/or the editor(s) disclaim responsibility for any injury to people or property resulting from any ideas, methods, instructions or products referred to in the content. |
© 2026 by the authors. Licensee MDPI, Basel, Switzerland. This article is an open access article distributed under the terms and conditions of the Creative Commons Attribution (CC BY) license.