


Abstract
Automated energy efficiency label quality inspection differs from traditional single-defect detection, as it requires joint analysis of multiple related targets, including product regions, energy efficiency labels, surface defects, energy grades, and label placement relationships. These targets exhibit complex spatial dependencies, requiring both fine-grained local perception and hierarchical spatial reasoning. To address this challenge, we propose a Hierarchical Region-Guided Multi-Task Network (HRG-MTN) for energy efficiency label quality inspection. HRG-MTN first extracts shared multi-scale visual features and introduces a Hierarchical Region Localization Module (HRLM) to progressively locate the product region, energy label region, and grade region through scale-aware feature aggregation. Based on the localized regions, Task-oriented Quality Inspection Branches (TQIB) perform three complementary tasks, including geometric position deviation estimation, fine-grained defect detection, and energy grade recognition. Furthermore, a Multi-task Structural Consistency Loss is designed to optimize task-specific predictions while preserving spatial consistency among hierarchical regions. To facilitate comprehensive evaluation, we construct the PQI dataset containing 3892 images, including 3512 training samples and 380 testing samples, covering diverse package quality inspection scenarios. Experimental results show that HRG-MTN achieves 99.3% precision, 99.7% recall, 99.5% F1-score, and 75.6% for defect inspection, improving the by 1.4% points compared with the ShortcutBreaker method.
1. Introduction
Automated energy label quality inspection aims to jointly analyze product regions, energy label regions, surface defects, and label placement relationships in structured visual inspection scenarios. Compared with general object inspection, this task requires fine-grained understanding of local label regions and spatial reasoning among hierarchical components, including the product region, energy label region, and grade region. However, variations in defect appearance and label placement introduce visual and spatial uncertainties, making it difficult to learn discriminative representations for reliable inspection.
Recent studies [1,2,3] on visual inspection have achieved promising progress in defect inspection and abnormality recognition. However, most existing methods usually detect product regions, label regions, defect regions, and grade regions separately, without explicitly modeling their spatial dependencies. This ignores the hierarchical relationships among package components, especially the dependency among the product region, energy label region, and grade region. Therefore, these methods may suffer from incomplete localization and unreliable recognition under label displacement, defect scale variation, and complex texture interference.
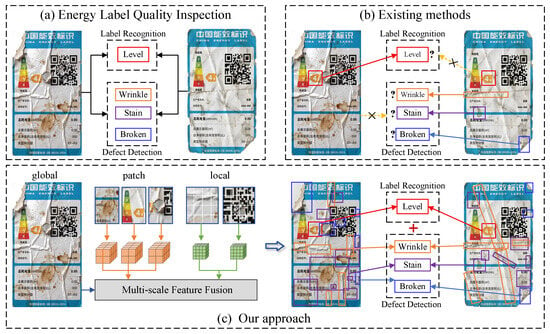
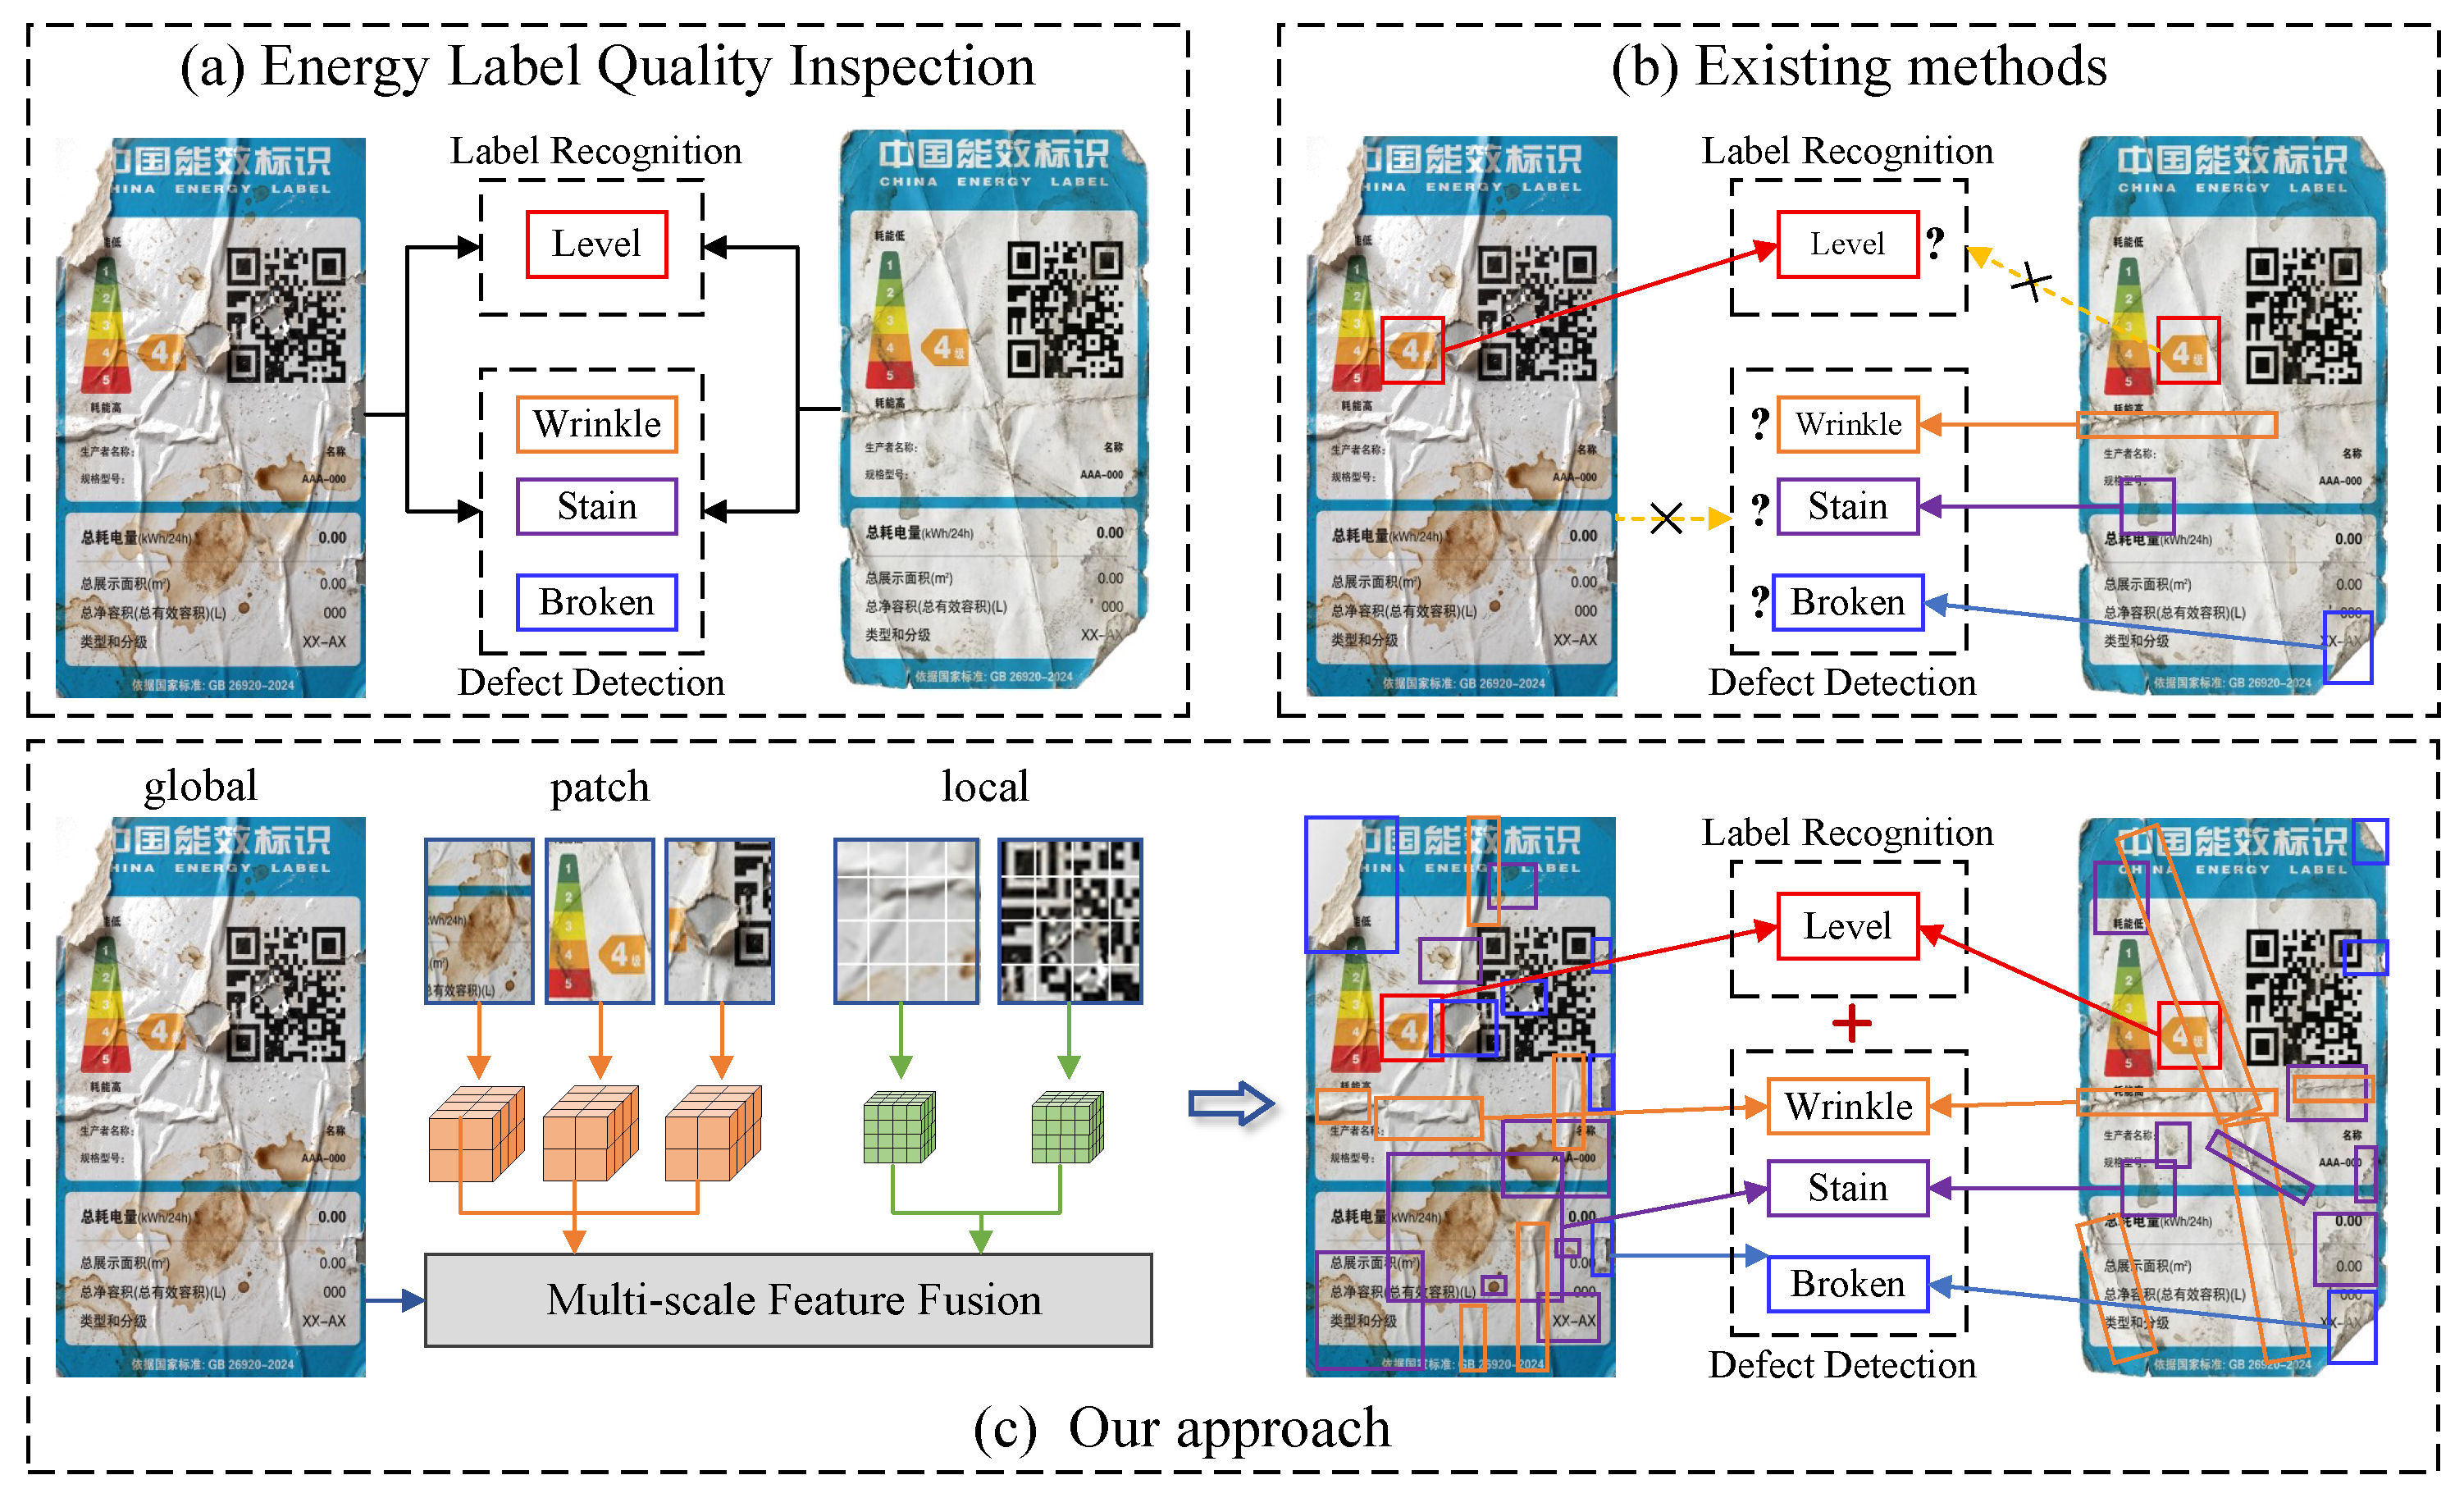
As shown in Figure 1a, energy label quality inspection involves multiple related elements, including the energy label, grade region, surface defects, and label placement relationship with the product surface. These elements exhibit clear hierarchical dependencies: the grade region is located within the energy label, and the label is attached to the product surface. However, as illustrated in Figure 1b, existing inspection-based methods usually treat these elements as independent objects, ignoring their structural relationships. Without structured region modeling, these methods [4,5,6] may suffer from incomplete localization and unreliable recognition under label displacement, background interference, and fine-grained defects such as broken, stain, and wrinkle regions.
Figure 1.
Illustration of package quality inspection and the proposed hierarchical region-guided approach. (a) Package quality inspection involves label recognition and defect inspection. (b) Existing methods tend to process different inspection targets independently. (c) Our approach integrates global, patch, and local cues for more reliable label recognition and defect inspection.
Based on the above observations, Figure 1c presents the proposed Hierarchical Region-Guided Multi-Task Network (HRG-MTN) for energy label quality inspection. The core idea is to organize different inspection cues from a hierarchical region-guided perspective within a unified multi-task learning framework. To this end, HRG-MTN introduces a structured design that aligns with the intrinsic spatial relationships among the product region, energy label region, and grade region. By integrating hierarchical region modeling and task-oriented visual reasoning, HRG-MTN aims to form a coherent representation for reliable energy label inspection under complex package conditions.
Specifically, HRG-MTN is composed of a hierarchical region localization module (HRLM), Task-oriented Quality inspection Branches (TQIB), and a Multi-task Structural Consistency Objective (MSCO). The HRLM progressively locates the product region, energy label region, and grade region from shared multi-scale visual features, providing structured spatial priors for subsequent quality inspection. Based on these localized regions, TQIB jointly performs position deviation estimation, fine-grained defect inspection, and energy grade recognition through three task-specific branches, including the position deviation branch, defect inspection branch, and grade recognition branch. In addition, MSCO is formulated to optimize task-specific predictions while enhancing the structural consistency among hierarchical regions, enabling more reliable energy label quality inspectionction under complex package conditions.
To better evaluate the effectiveness of the proposed method in realistic inspection scenarios, we construct a new Package Quality inspection (PQI) dataset for energy label quality inspection. The dataset contains package images with different inspection conditions, including normal labels, surface defects, energy grades, and label displacement cases. It covers diverse defect appearances, such as broken, stain, and wrinkle regions, as well as spatial variations caused by inaccurate label placement. Each sample is annotated with structured inspection information, including defect categories, spatial locations, energy-level labels, and position states. The proposed PQI dataset provides a comprehensive benchmark for studying hierarchical region localization, fine-grained defect inspection, position deviation estimation, and energy grade recognition in package inspection tasks.
The main contributions can be summarized as follows:
- We propose HRG-MTN for energy label quality inspection, which formulates package inspection as a structured multi-task problem involving region localization, defect inspection, position deviation estimation, and energy grade recognition.
- HRLM progressively localizes hierarchical regions, TQIB performs task-specific quality inspection, and MSCO constrains structural consistency among product, label, and grade regions.
- A Package Quality Inspection (PQI) dataset is constructed with structured annotations for surface defects, spatial locations, energy grades, and position states, supporting comprehensive evaluation of energy label quality inspection under complex package conditions.
2. Related Work
2.1. Energy Label Quality Inspection
Energy label quality inspection aims to identify package elements, surface defects, energy grades, and spatial layout abnormalities from visual images. Existing methods [7,8,9] mainly formulate related industrial inspection tasks as inspection or defect recognition problems, where package components and abnormal regions are localized or classified by visual features. Recent anomaly inspection and representation learning methods [10,11,12,13] can effectively capture salient package elements and obvious defects. However, energy label inspection is not a simple flat inspection task, since the product region, energy label region, and grade region exhibit clear hierarchical spatial relationships. In addition, fine-grained defects such as broken, stain, and wrinkle regions usually appear within local label areas and may be affected by complex textures, illumination variation, and label displacement. Therefore, these methods may lead to incomplete localization and unreliable recognition.
To address these issues, we propose a Hierarchical Region-Guided Multi-Task Network (HRG-MTN) to jointly model hierarchical region localization, position deviation estimation, fine-grained defect inspection, and energy grade recognition for energy label quality inspection.
2.2. Region-Aware Representation Learning for Energy Label Inspection
Hierarchical region-guided representation learning aims to capture visual cues from different structured regions, ranging from global product areas to local energy label and grade regions. Existing studies have shown that region-aware and multi-level representations can provide complementary information and reduce the limitation of relying on a single visual representation [4,14,15,16]. Such a representation mechanism is suitable for energy label quality inspection, where different inspection targets exhibit clear spatial dependencies. For example, label placement requires the relationship between the product region and the energy label region, surface defects mainly appear within local label areas, and energy grade recognition depends on the localized grade region. However, existing representation learning methods mainly focus on semantic or spatial feature aggregation, while the hierarchical relationships among inspection regions are less considered. This motivates the need for hierarchical region-guided modeling in energy label quality inspection.
In this paper, we introduce a hierarchical region-guided multi-task framework to jointly model structured region localization, position deviation estimation, fine-grained defect inspection, and energy grade recognition for energy label quality inspection.
2.3. Physics-Guided and Multimodal Learning for Industrial Inspection
Recent studies have explored incorporating domain knowledge and heterogeneous information to improve the reliability of industrial inspection and diagnosis. Physics-guided learning integrates physical constraints or prior knowledge into deep models to enhance interpretability and robustness. For example, Raissi et al. [17] introduced physics-informed neural networks by embedding physical laws into the learning process, while Karniadakis et al. [18] summarized the development of physics-informed machine learning for scientific and engineering applications. Meanwhile, multimodal learning methods aim to exploit complementary information from different sources through effective feature fusion. Baltrušaitis et al. [19] provided a comprehensive review of multimodal representation learning and fusion strategies. However, existing physics-guided and multimodal approaches mainly focus on external priors or heterogeneous feature integration, while the intrinsic spatial dependencies among different inspection components are rarely considered.
Different from these approaches, the proposed HRG-MTN does not rely on additional physical constraints or simple multimodal feature fusion. Instead, it explores the inherent hierarchical relationships within energy label inspection, where the product region, energy label region, and grade region exhibit clear spatial dependencies. By progressively localizing hierarchical regions and introducing structural consistency optimization, HRG-MTN establishes a region-guided multi-task framework that jointly performs position deviation estimation, fine-grained defect inspection, and energy grade recognition.
2.4. Intelligent Condition Monitoring and Diagnosis
Recent intelligent condition monitoring methods have achieved promising performance by combining signal processing and deep learning techniques [20,21,22] for industrial fault diagnosis. For example, multiple signal blind deconvolution methods have been developed to enhance weak fault-related features from noisy vibration signals, improving rolling bearing diagnosis reliability [23]. Meanwhile, variational gated hierarchical memory networks have been proposed to capture complex temporal dependencies and achieve robust fault diagnosis under high-noise conditions [24]. In addition, deep learning-based fault diagnosis methods have been widely investigated to automatically learn discriminative representations from raw monitoring signals, reducing the dependence on handcrafted features [25].
However, existing condition monitoring methods mainly focus on machinery health assessment based on vibration signals, sensor measurements, or temporal sequence modeling, while the spatial structural relationships among different components in visual inspection scenarios remain rarely explored. Different from these methods, this work focuses on energy-label quality inspection and proposes HRG-MTN, which models hierarchical spatial dependencies among product regions, energy-label regions, and grade regions through region-guided representation learning and multi-task optimization.
3. Our Approach
3.1. Overview
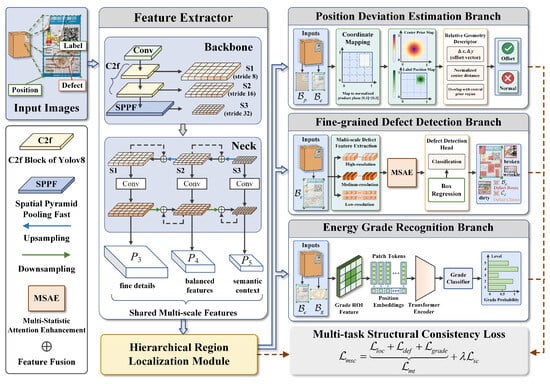
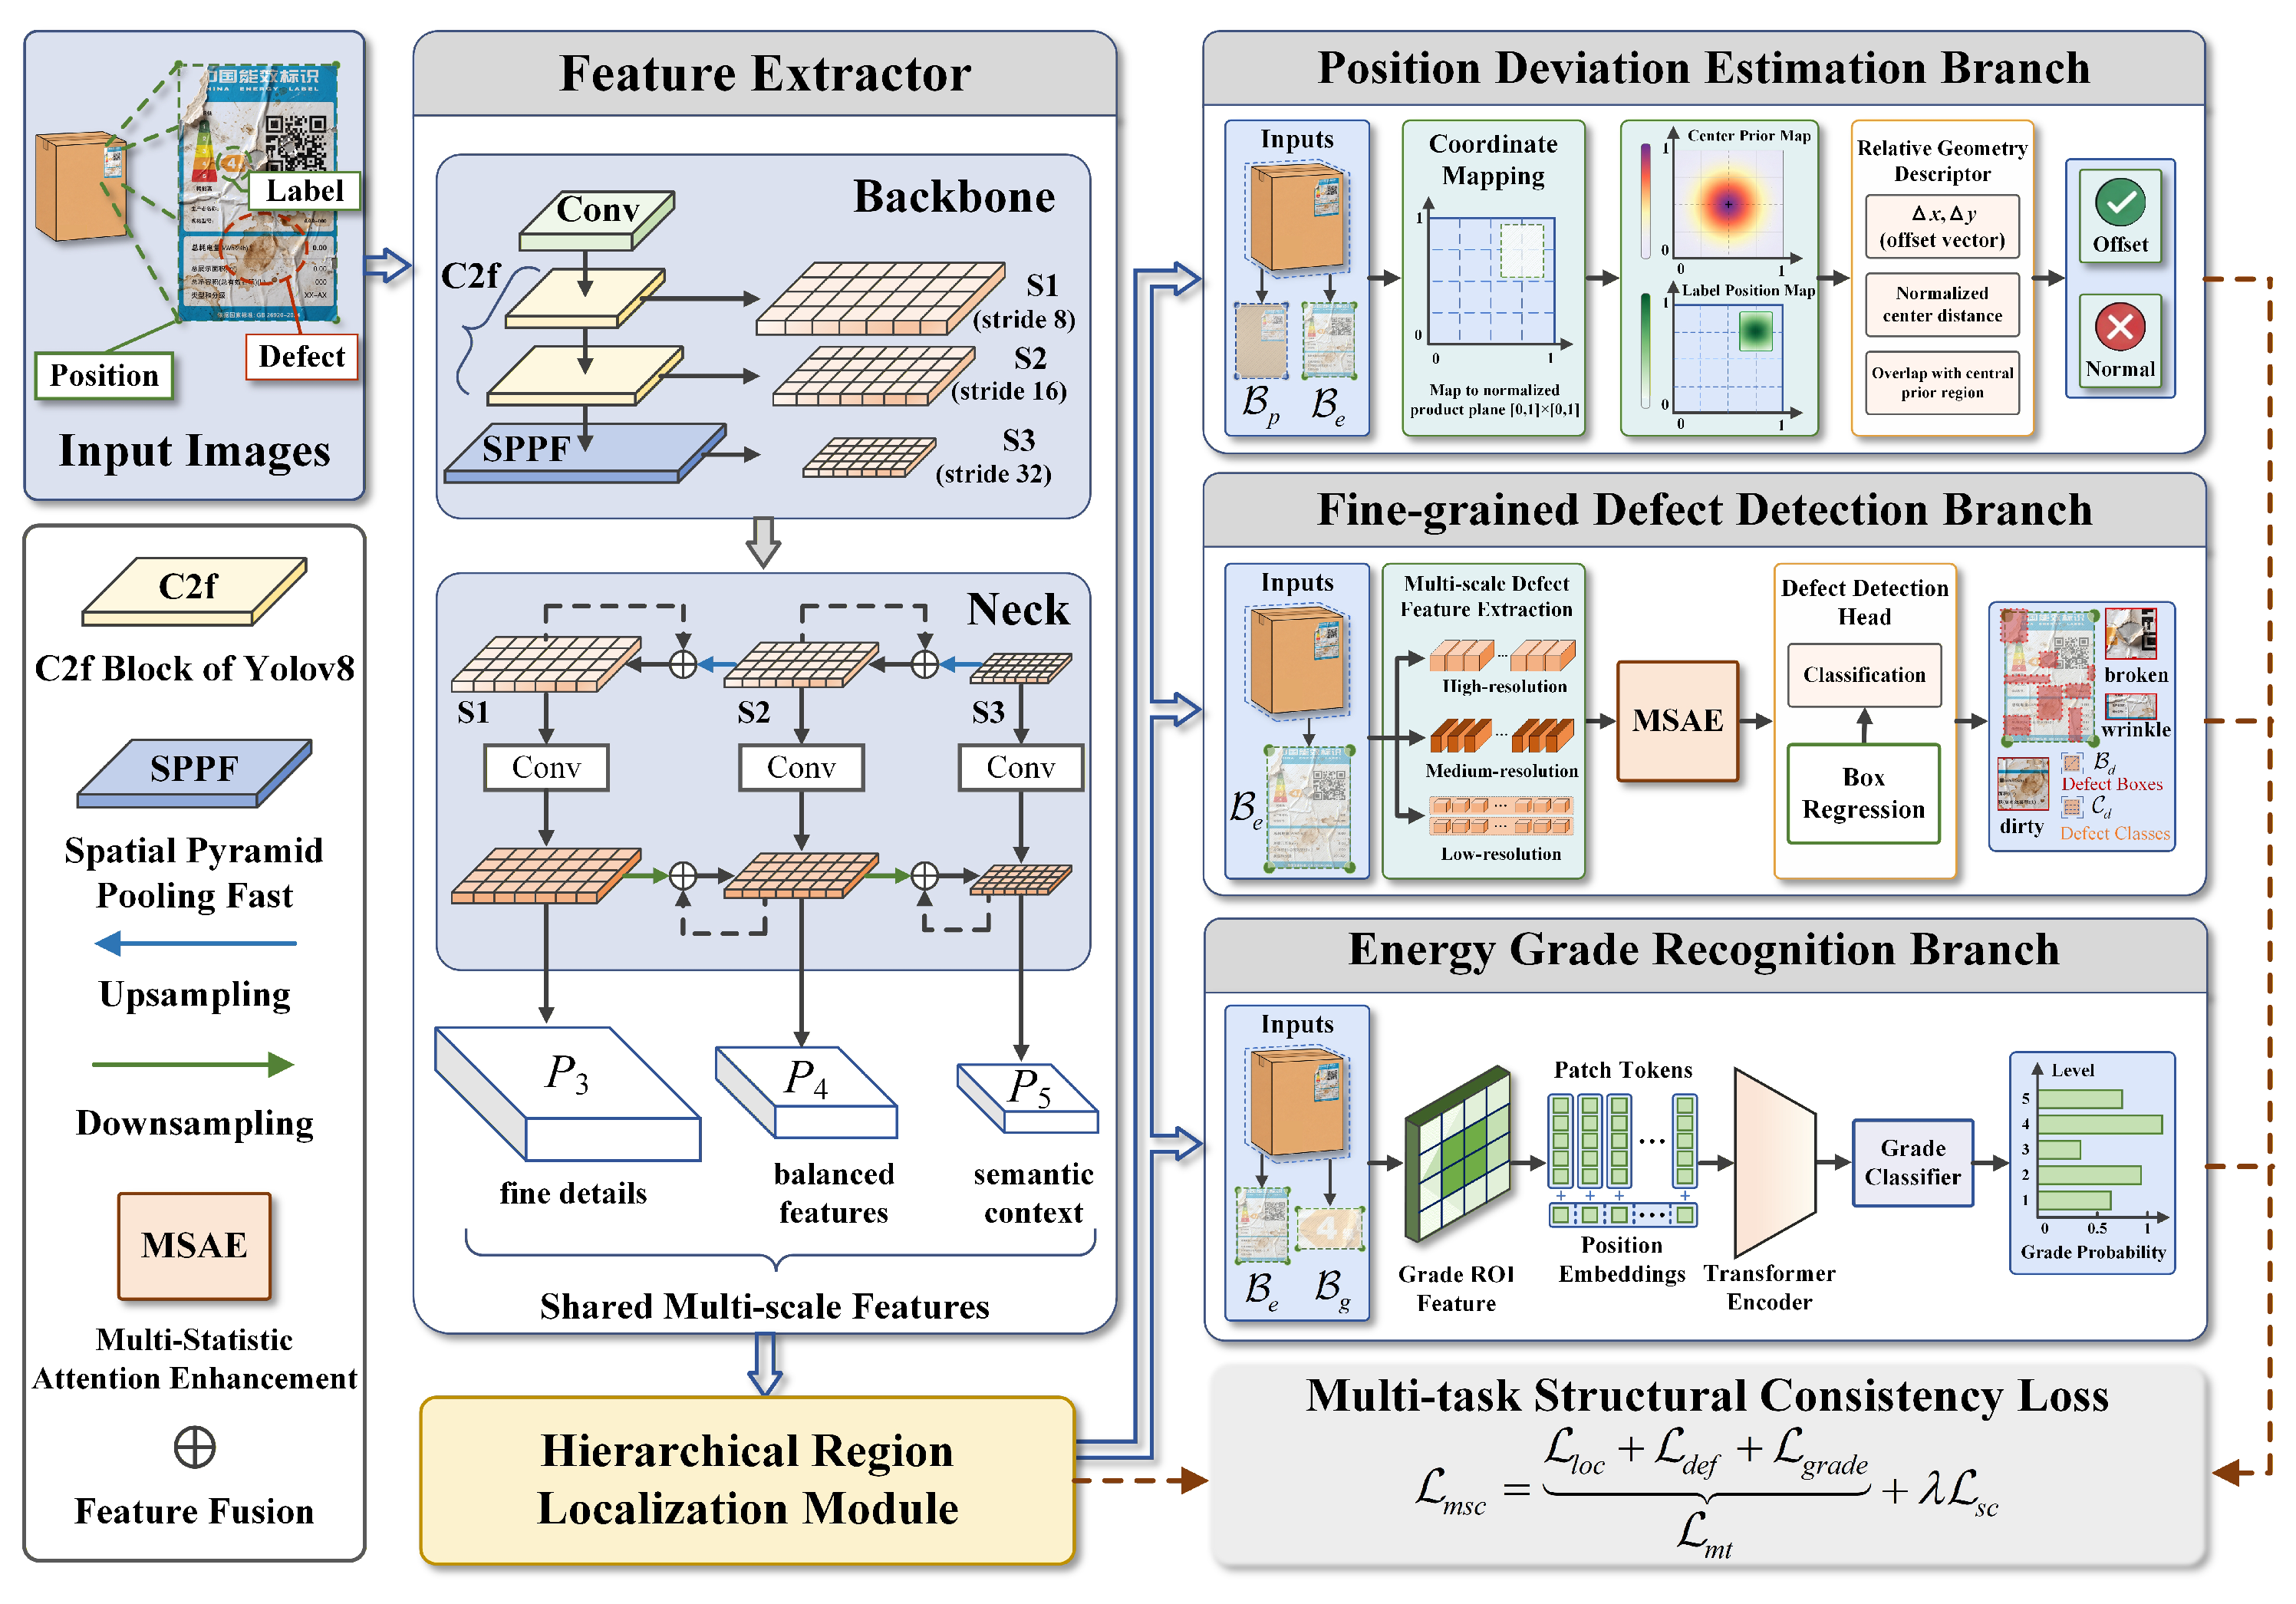
As shown in Figure 2, given an input image I, the proposed Hierarchical Region-Guided Multi-Task Network (HRG-MTN) first extracts shared multi-scale visual features for energy label quality inspection. Then, the hierarchical region localization module (HRLM) progressively locates the product region, energy label region, and grade region, providing structured spatial priors for subsequent inspection tasks. Based on these localized regions, the Task-oriented Quality inspection Branches (TQIB) perform position deviation estimation, fine-grained defect inspection, and energy grade recognition in a unified framework. Furthermore, the Multi-task Structural Consistency Objective (MSCO) is introduced to jointly optimize task-specific predictions and constrain the structural relationships among hierarchical regions. HRG-MTN follows the inherent spatial hierarchy among package components and integrates hierarchical localization, task-oriented inspection, and structural consistency modeling, enabling reliable inspection under complex conditions such as label displacement, stain regions, wrinkles, and broken regions.
Figure 2.
Overall framework of the proposed HRG-MTN. Shared multi-scale features are first extracted and fed into HRLM for hierarchical region localization. Based on the localized regions, TQIB performs position deviation estimation, fine-grained defect inspection, and energy grade recognition through three task-oriented branches, while MSCO further constrains structural relationships among hierarchical regions.
3.2. Feature Extractor
Energy label quality inspection requires both global structural perception and local detail representation. For example, product localization depends on global contour and layout information, while surface defect inspection and grade recognition rely on fine-grained label textures and local region details. To obtain multi-scale visual representations, we employ a YOLOv8-based [26] feature extractor, as shown in Figure 2.
Given an input image I, the backbone network extracts hierarchical features through stacked convolutional blocks and C2f modules, producing multi-scale feature maps:
where , , and correspond to feature maps with stride 8, 16, and 32, respectively.
To enlarge the receptive field and enhance global context modeling, the SPPF module is applied on the deepest feature:
where denotes the spatial pyramid pooling-fast operation.
Then, the neck module aggregates multi-scale features to produce the final feature pyramid:
where , , and represent feature maps with different resolutions and semantic levels, used for fine details, balanced semantics, and global context respectively.
3.3. Hierarchical Region Localization Module
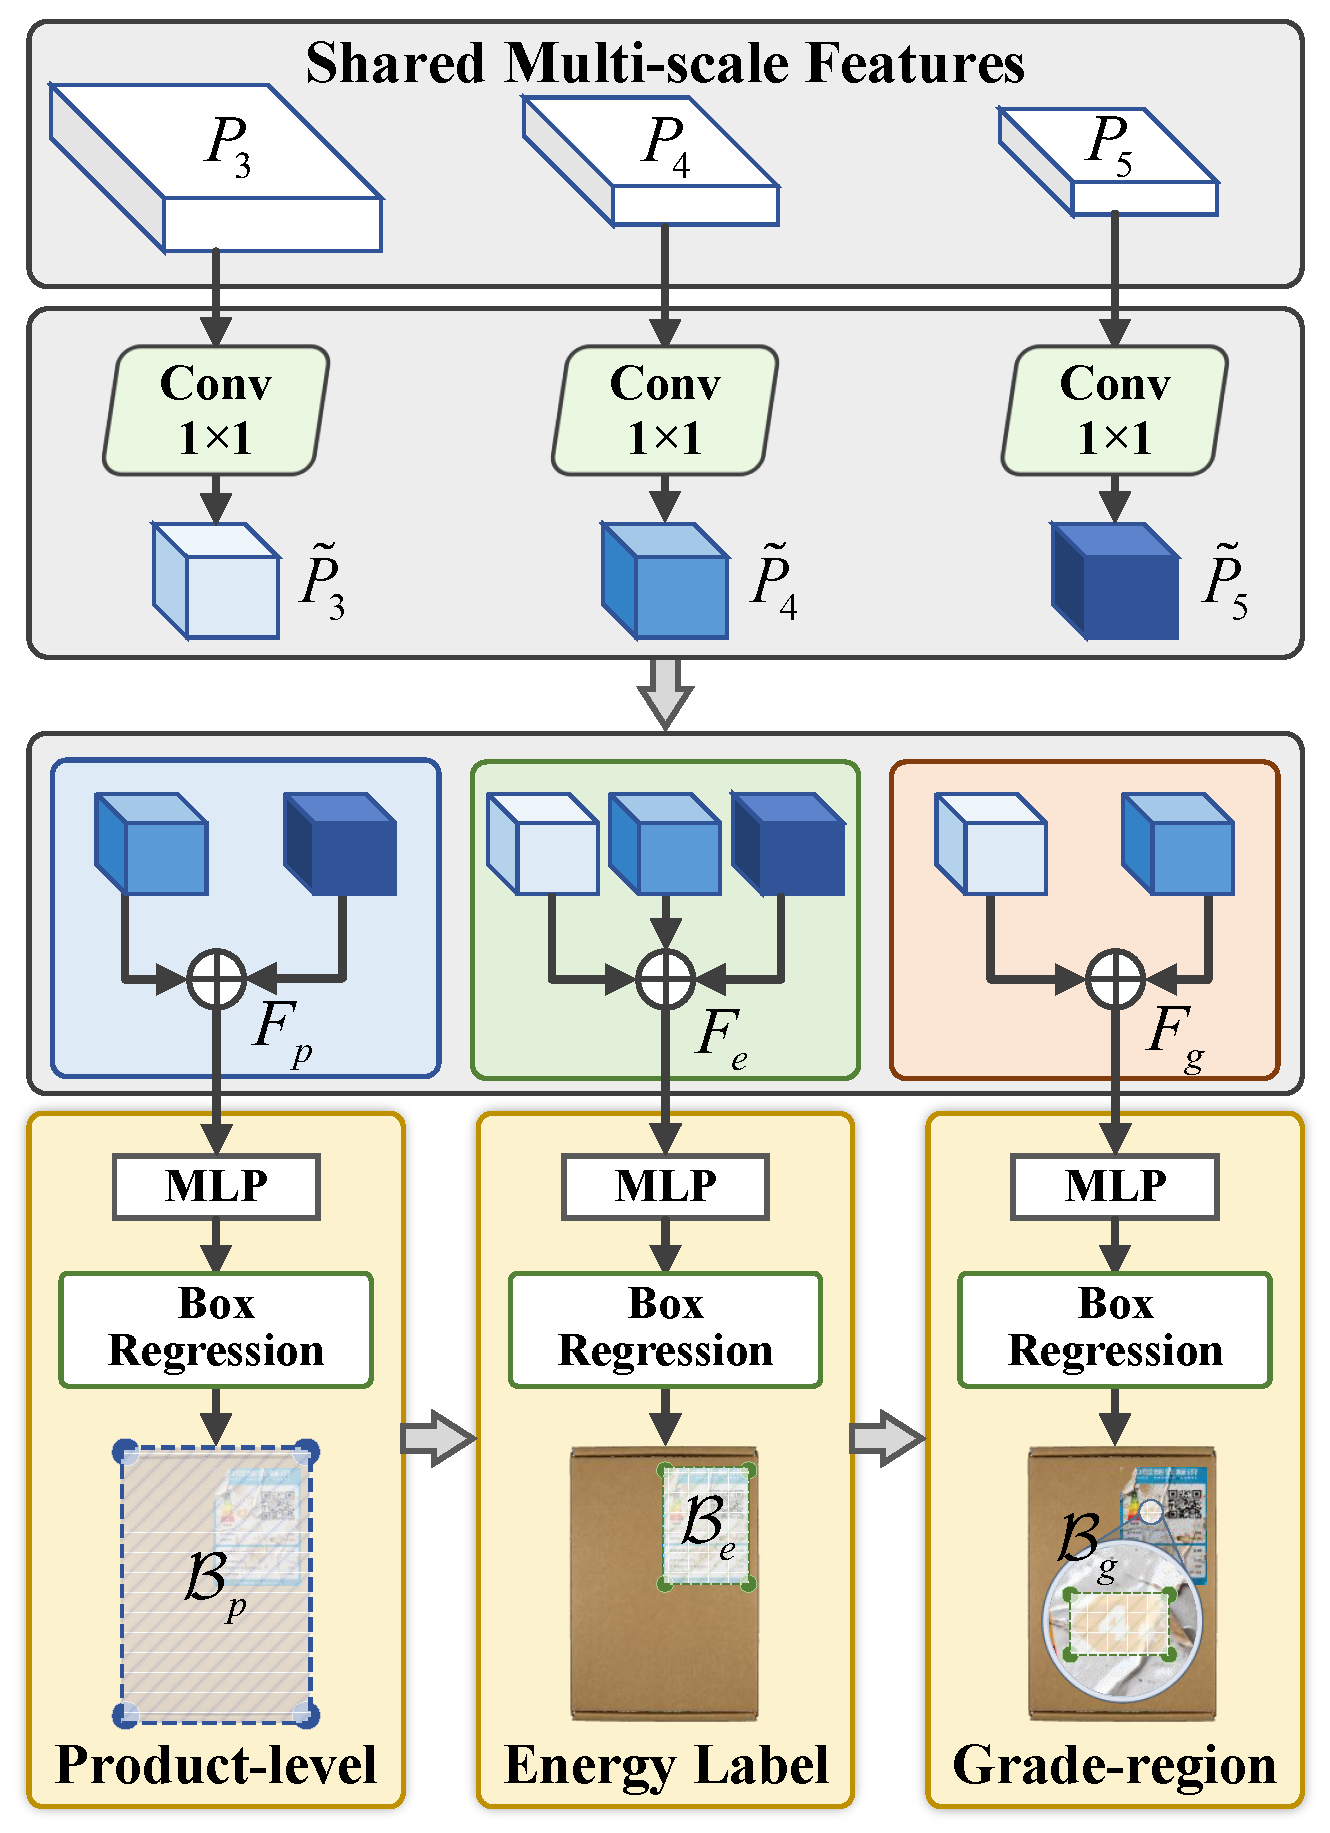
Energy label quality inspection contains clear spatial dependencies among different regions. The product region provides global spatial reference, the energy label region is attached to the product surface, and the grade region is located inside the energy label. Directly predicting all regions independently may ignore such structural relationships. To address this issue, we design a hierarchical region localization module (HRLM) to progressively localize product, energy label, and grade regions, as shown in Figure 3.
Figure 3.
Illustration of the proposed Hierarchical Region Localization Module (HRLM). Multi-scale features are first projected and aggregated into region-specific representations, which are then used to progressively localize the product region, energy label region, and grade region.
Given the multi-scale feature maps extracted by the feature extractor, a convolution is first applied to align feature channels: {}, where denotes the aligned feature map at each scale.
These aligned multi-scale features are then aggregated to form region-aware representations corresponding to different inspection targets: {}, where , , and denote the product-level feature, energy-label feature, and grade-region feature, respectively. focuses on global structural cues for product localization, captures label boundary and semantic information for energy label localization, and preserves fine-grained details for grade-region localization.
Based on these region-specific representations, region-specific prediction heads are used to refine each region:
where , , and represent the features corresponding to product, energy label, and grade regions, respectively.
Different from independent multi-head localization, the proposed HRLM performs progressive region refinement through hierarchical conditioning. Given the backbone feature map , the product region is first predicted as:
where denotes the normalized coordinates of the product region. Then, the product-aware feature is extracted using the differentiable ROIAlign operation:
where . The energy label region is subsequently predicted based on the refined feature:
Similarly, the grade region is localized in a progressive manner:
Thus, the three localization stages follow a hierarchical dependency relationship:
where each preceding localization result provides spatial guidance for the subsequent refinement stage.
The localization follows a coarse-to-fine hierarchy, where the product region provides spatial guidance for energy label localization, and the energy label further constrains grade-region localization.
Each region is represented as:
where denotes the center coordinate and denotes width and height.
3.4. Task-Oriented Quality Inspection Branches
The hierarchical regions predicted by HRLM provide structured spatial priors for different inspection targets. Based on these priors, we design the Task-oriented Quality inspection Branches (TQIB) to perform complementary energy label quality inspection tasks. Specifically, TQIB consists of three branches: the Position Deviation Estimation Branch, the Fine-grained Defect inspection Branch, and the Energy Grade Recognition Branch. The Position Deviation Estimation Branch models the relative placement relationship between the product and the energy label, the Fine-grained Defect inspection Branch focuses on subtle surface defects within the label region, and the Energy Grade Recognition Branch identifies the energy-level category from the localized grade region.
3.4.1. Position Deviation Estimation Branch
The position deviation estimation branch (PDEB) aims to determine whether the energy label is correctly attached to the product surface. Since the expected label position is related to the product region rather than the original image coordinate system, we first map the predicted energy label box into a product-normalized coordinate plane. Given the predicted product box and energy label box , the normalized label center is computed as:
where and denote the center coordinates and sizes of and , respectively.
In the normalized coordinate plane, the expected position of a normally attached energy label is represented by a position prior . Then, the relative geometric descriptor is constructed by measuring the deviation between the detected label position and the expected position prior:
where denotes the normalized label center, , , and denotes the normalized center distance. is the predefined threshold for position deviation judgment, and indicates whether the label is normal or offset. This design provides an interpretable way to estimate label displacement according to the relative spatial relationship between the product and the energy label.
3.4.2. Fine-Grained Defect Inspection Branch
The fine-grained defect inspection branch (FDDB) focuses on detecting fine-grained surface defects within the energy label region. Since defects such as broken, stain, and wrinkle regions mainly appear on the label surface, directly detecting them from the whole image may introduce background interference. Therefore, FDDB first extracts the label-level feature according to the predicted energy label region:
where denotes the region feature alignment operation.
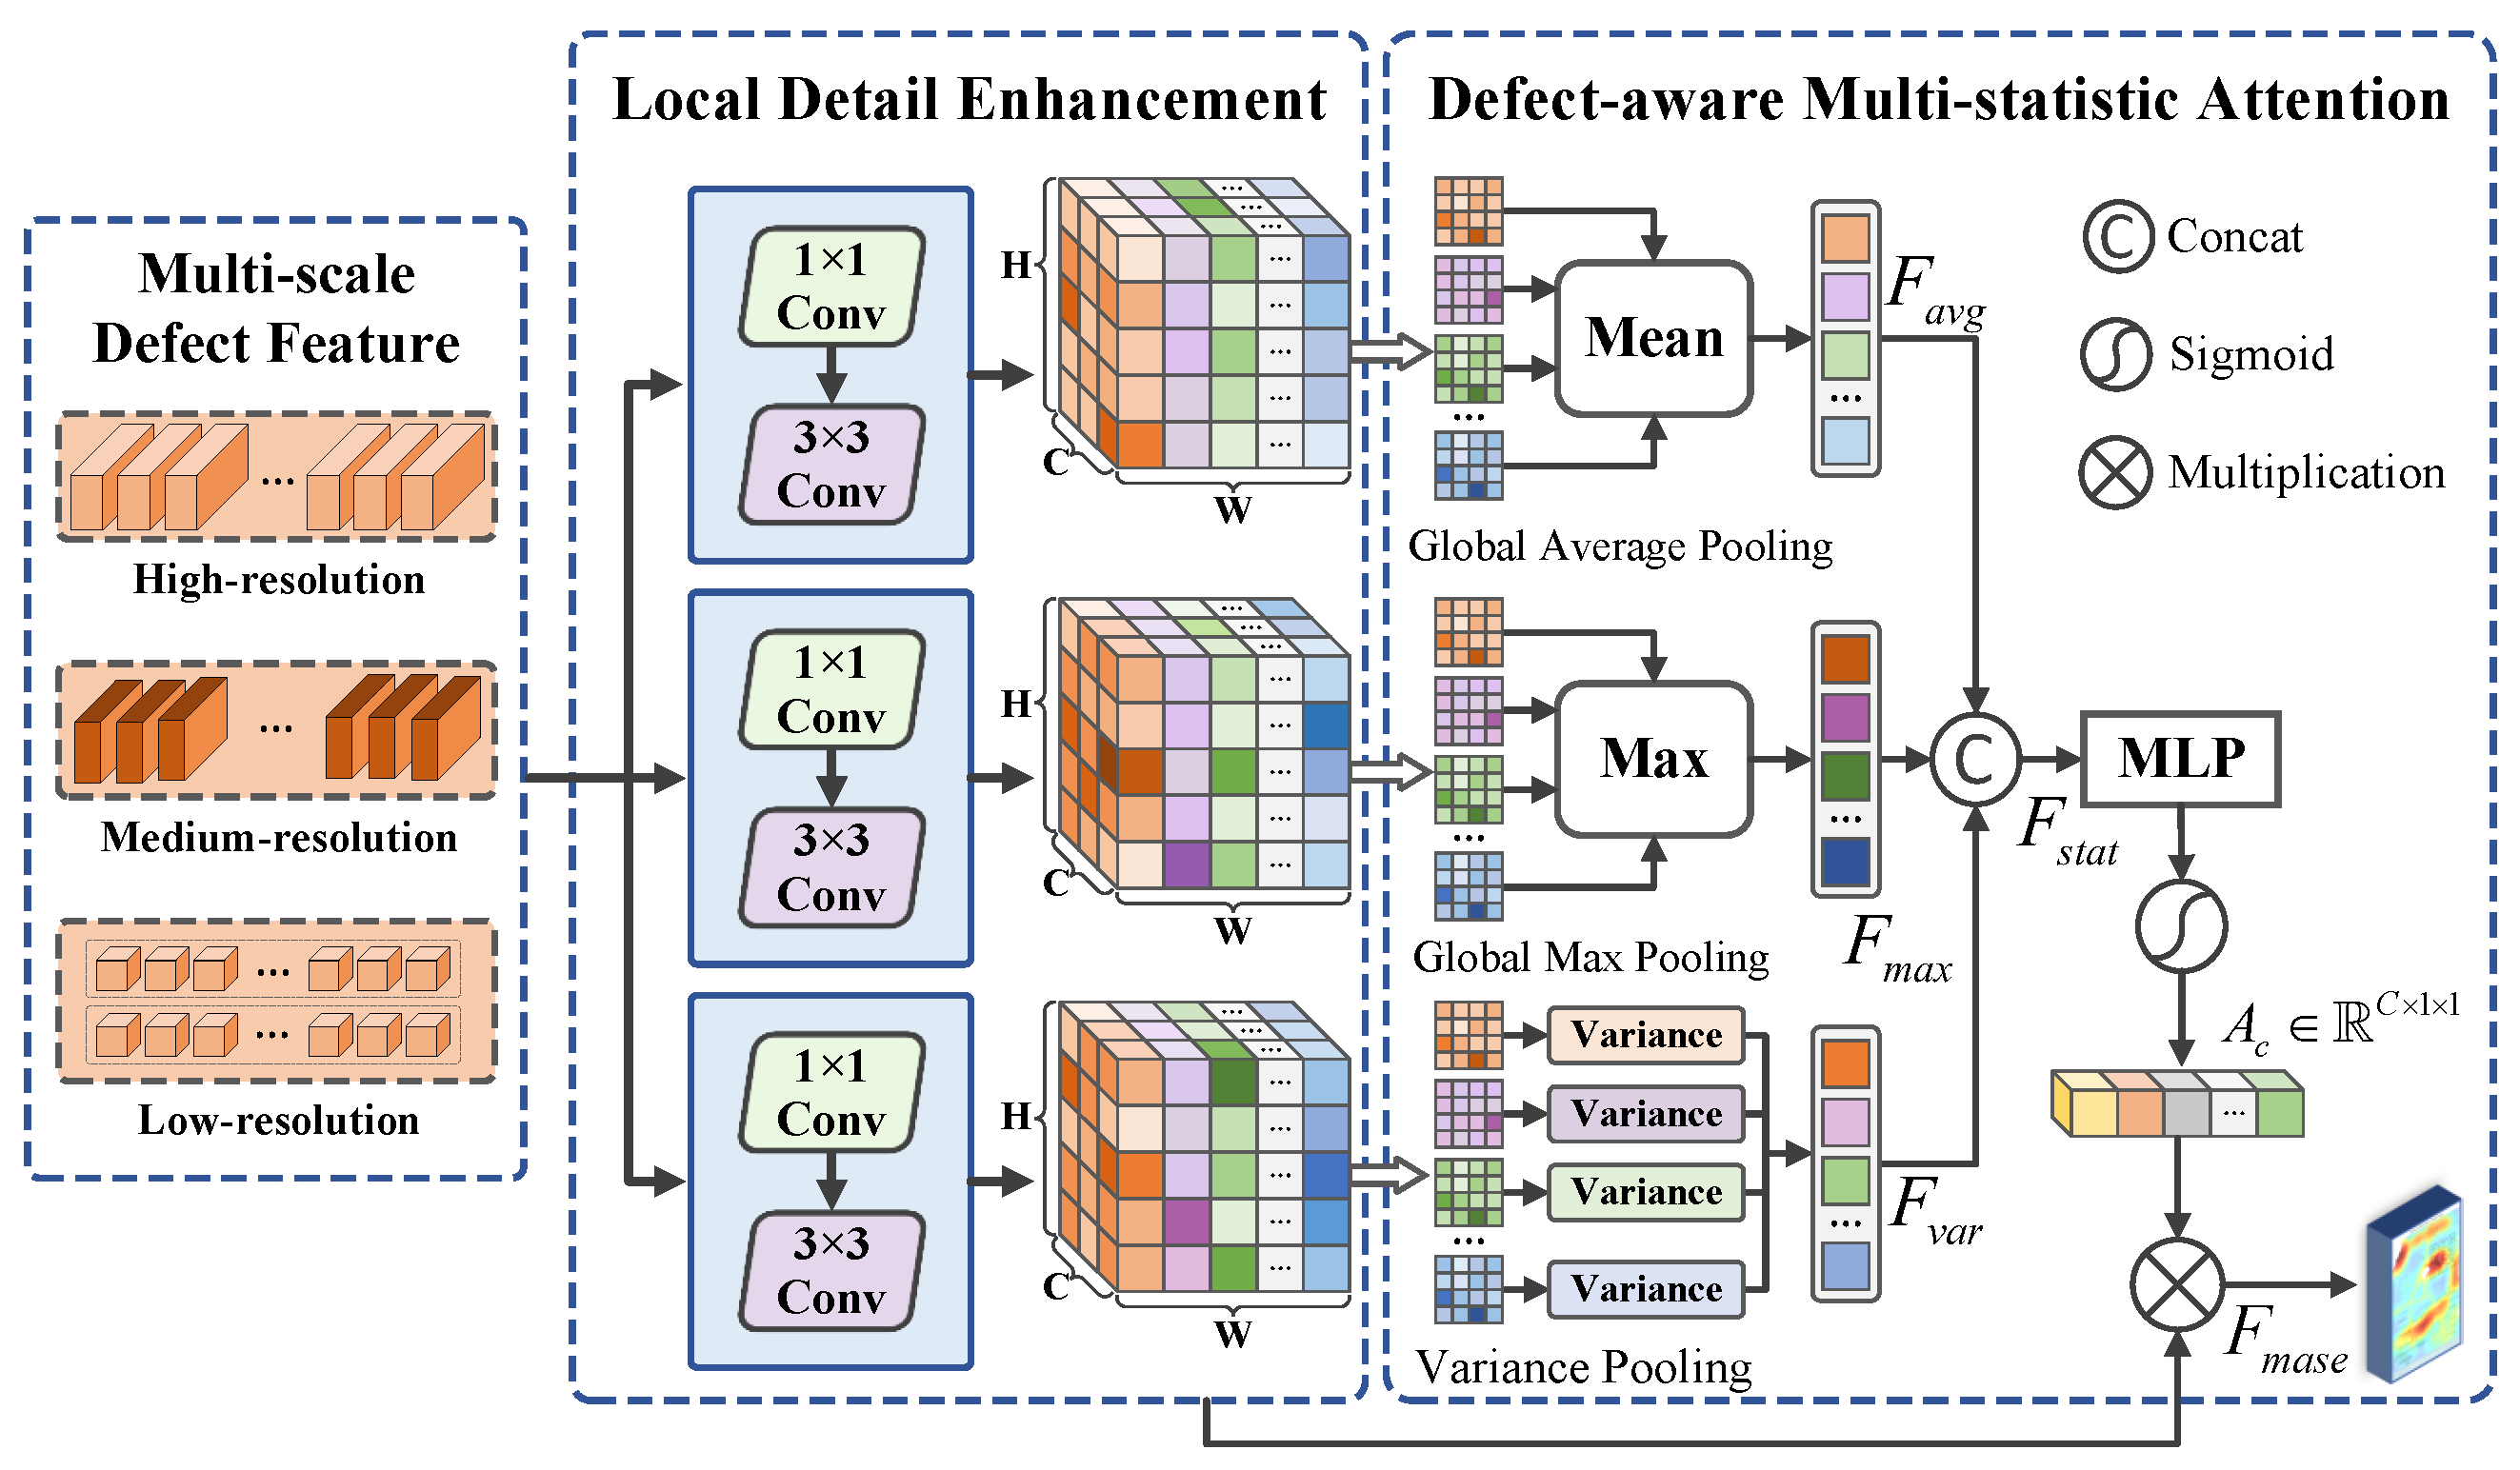
As shown in Figure 4, a Multi-Statistic Attention Enhancement (MSAE) module is introduced to enhance defect-sensitive representations. MSAE consists of a local detail enhancement stage and a defect-aware multi-statistic attention stage.
Figure 4.
Illustration of the proposed MSAE.
In the local detail enhancement stage, multi-scale convolutional operations are applied to capture defect cues at different spatial granularities: , where denotes the local feature enhancement function.
In the multi-statistic attention stage, average pooling, max pooling, and variance pooling are used to extract complementary statistical descriptors: {}.
These descriptors are concatenated and fed into a lightweight MLP to generate an attention map:
where denotes the sigmoid function. The enhanced defect representation is obtained by:
where ⊗ denotes element-wise multiplication.
Finally, the enhanced feature is fed into the defect inspection head:
where denotes the inspection head, and and represent defect boxes and categories.
3.4.3. Energy Grade Recognition Branch
The energy grade recognition branch (EGRB) aims to predict the energy-level category from the localized grade region. EGRB focuses on learning discriminative representations from the grade region while mitigating interference from surrounding texts, QR codes, and surface defects.
Given the predicted grade-region box , we first extract the region feature from the shared multi-scale representation:
where preserves spatial structure and local appearance information of the grade region.
The extracted region feature is then transformed into a sequence representation with positional encoding, and processed by a Transformer encoder for global dependency modeling:
where denotes patch token embedding, represents positional embeddings, and the Transformer captures long-range dependencies among grade-related visual tokens.
Finally, the energy grade is predicted via a classification head:
where denotes the grade classification head and is the predicted energy-level category.
3.5. Multi-Task Structural Consistency Loss
To jointly optimize region localization, task-specific prediction, and structural relationship modeling, we formulate a Multi-task Structural Consistency Objective (MSCO) for HRG-MTN. Its trainable loss formulation is referred to as the Multi-task Structural Consistency Loss (MSCL). The overall objective consists of a multi-task supervision loss and a structural consistency loss, defined as:
where denotes the multi-task supervision loss, represents the structural consistency loss, and is a balancing coefficient.
The multi-task supervision loss is defined as:
where supervises hierarchical region localization, supervises fine-grained defect detection, and supervises energy grade recognition. The box regression loss adopts the Complete IoU (CIoU) loss to optimize the localization accuracy by considering overlap area, center distance, and aspect ratio consistency between predicted and ground-truth boxes.
Specifically, is applied to the hierarchical regions predicted by HRLM, including the product region , energy label region , and grade region :
where and denote the predicted bounding box and the corresponding ground-truth region, respectively. The box regression loss measures the localization discrepancy between predicted and target regions.
The defect detection loss is defined over multiple defect instances within the energy label region:
The defect detection loss is further decomposed into three components, including the box regression loss, classification loss, and localization distribution loss:
where adopts the Complete IoU loss, adopts binary cross-entropy, and denotes the Distribution Focal Loss used for bounding-box distribution regression. The adopted YOLOv8-based detector does not employ an independent objectness loss; therefore, no separate objectness term is included. Predicted candidates are assigned to ground-truth instances according to the detector’s IoU-based matching strategy. Matched candidates contribute to localization and classification optimization, whereas unmatched candidates are treated as background through the classification targets. The same loss configuration and weights are used for the baseline and all compared variants.
During inference, confidence filtering and Non-Maximum Suppression are applied using the same settings for all compared methods.
The grade recognition loss is implemented with standard cross-entropy:
The position deviation state is not learned via an additional supervision term. Instead, it is computed deterministically from the geometric relationship between and .
Different from conventional task supervision, the structural consistency loss explicitly regularizes the spatial containment relationships among hierarchical regions. Since the energy label should lie inside the product region and the grade region should lie inside the energy label region, we define the containment ratio as:
Based on this, the structural consistency loss is formulated as:
where and are fixed thresholds controlling the required containment consistency between hierarchical regions rather than learned parameters. Specifically, constrains the energy-label region relative to the product region, while constrains the grade region relative to the energy-label region. The containment ratio is computed from continuous predicted boxes using standard tensor operations. Its min/max operations are piecewise differentiable with respect to the box coordinates, allowing to contribute to gradient-based optimization wherever the corresponding subgradients are defined.
4. Package Quality Inspection Dataset
4.1. Dataset
To evaluate package quality inspection under practical industrial scenarios, we construct a Package Quality inspection (PQI) dataset. Different from general defect inspection datasets that mainly focus on anomaly localization, the proposed PQI dataset is designed for multi-task package inspection, including package element recognition, surface defect inspection, and spatial layout abnormality analysis. These tasks require the model to jointly understand fine-grained local defects and global layout structures, which better reflects the requirements of real production-line inspection.
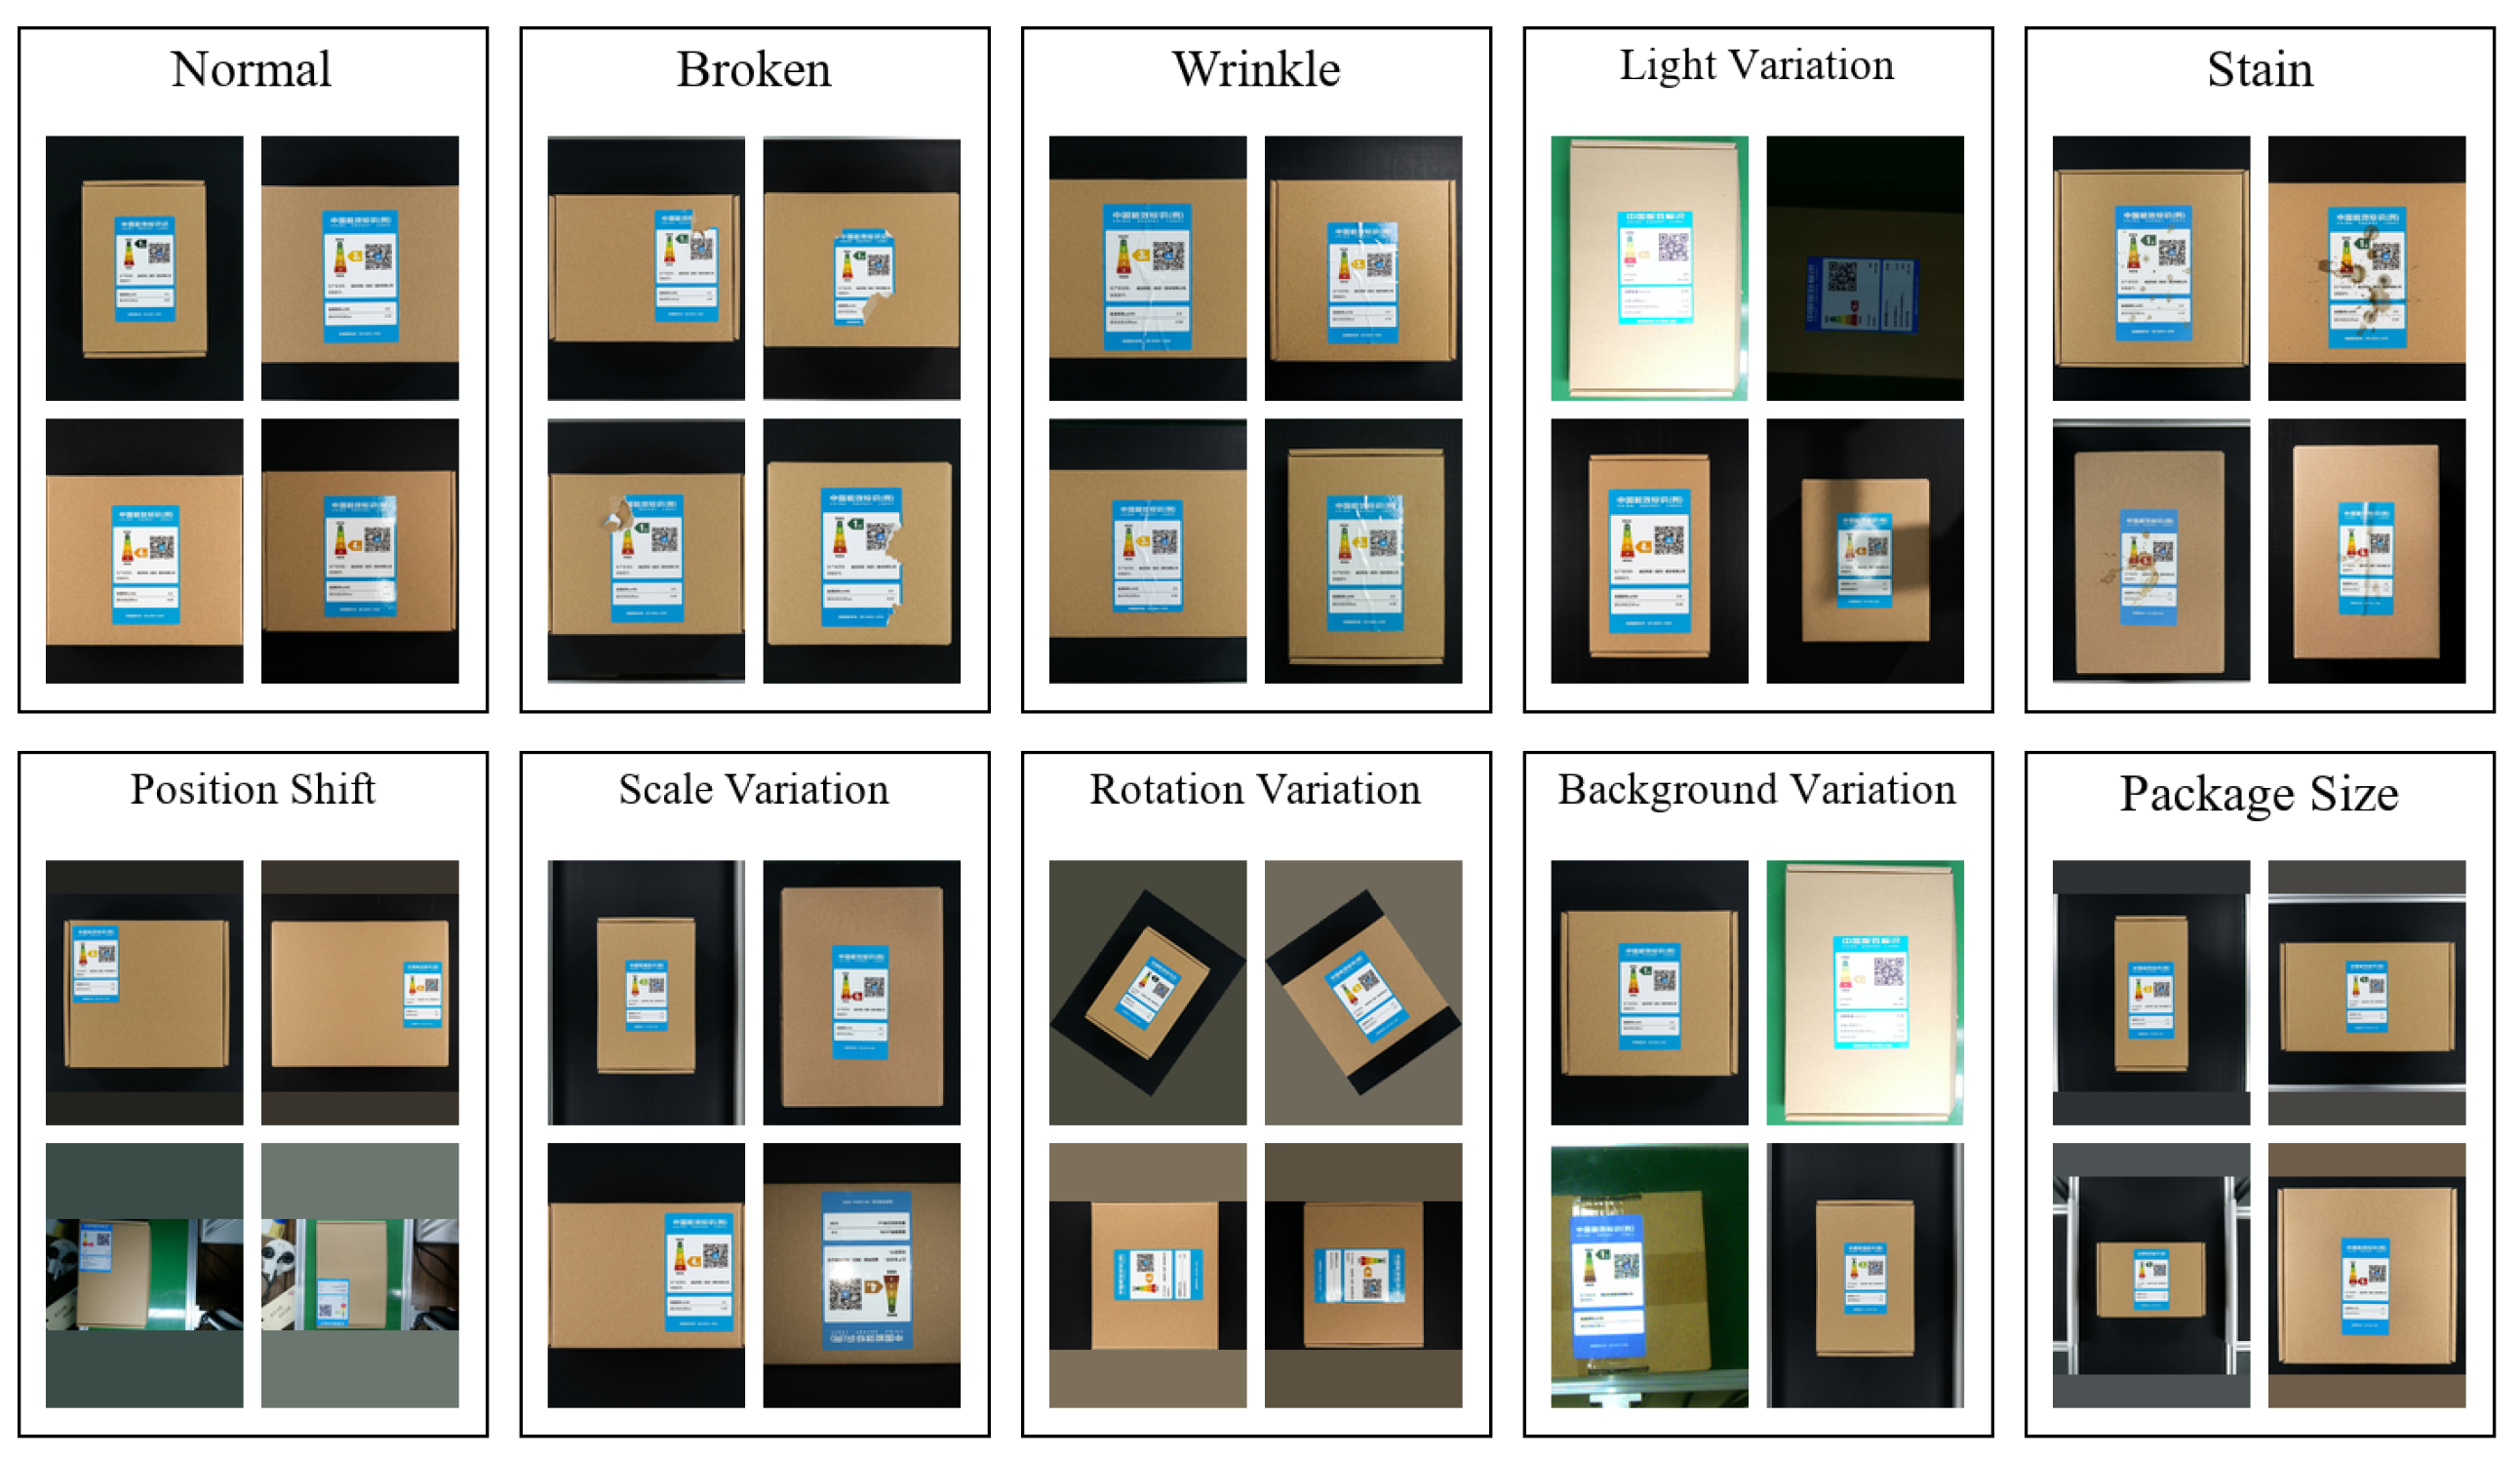
In Figure 5, the PQI dataset contains 3892 image samples in the final experimental setting. These samples are collected from self-built sources, covering diverse package appearances and inspection conditions. The dataset includes normal samples and abnormal samples with different quality issues, such as broken regions, stain, wrinkles, position deviation, illumination variation, and viewpoint changes. These visual variations provide a realistic basis for evaluating the robustness of package quality inspection models under complex industrial environments.
Figure 5.
Examples from the constructed Package Quality Inspection dataset.
During data annotation, each image is labeled according to the requirements of package inspection. Specifically, package elements and abnormal regions are annotated with bounding boxes, while defect categories and spatial abnormality labels are assigned according to the inspection results. The main defect categories include broken, stain, and wrinkle, corresponding to common package surface defects in industrial quality inspection. In addition, energy-level information and package position labels are annotated to support package element recognition and position-abnormality analysis.
Based on these annotations, the PQI dataset supports three inspection tasks. The first task is package element recognition, which aims to identify package-related semantic information and locate key package components. The second task is surface defect inspection, which requires the model to detect fine-grained defects with different appearances and spatial granularities. The third task is position-abnormality analysis, which determines whether the package label is correctly attached according to its spatial relationship with the package region. These tasks jointly evaluate the ability of a model to perform comprehensive package quality inspection.
For model training and evaluation, the PQI dataset is divided into training and testing subsets. The training set contains 3512 images and the testing set contains 380 images. During model development, the training subset is internally divided into an optimization subset and a validation subset for hyperparameter selection and checkpoint determination. The testing subset remains completely isolated and is only used for final performance evaluation.
To avoid potential information leakage, the dataset partition is performed according to physical product identity and acquisition information rather than random image-level splitting. Images from the same product, production batch, or identical acquisition sequence are strictly assigned to only one subset. Therefore, highly correlated samples will not appear simultaneously in different partitions.
To improve the diversity of training samples, targeted offline augmentation is applied only to the optimization subset, including flipping, illumination adjustment, blur and noise degradation, and wrinkle-oriented augmentation. No augmentation is applied to the validation and testing subsets, ensuring a fair and consistent evaluation protocol.
Table 1 reports the statistics of the proposed PQI dataset. The dataset contains 3892 image samples in the final experimental setting, including 3512 training images and 380 testing images. The dataset covers five energy levels and multiple quality types, including normal samples, broken regions, stains, wrinkles, and position deviations, supporting comprehensive package quality inspection.
Table 1.
Statistics of the PQI dataset and available annotations for different inspection tasks.
4.2. Annotation Criteria and Verification
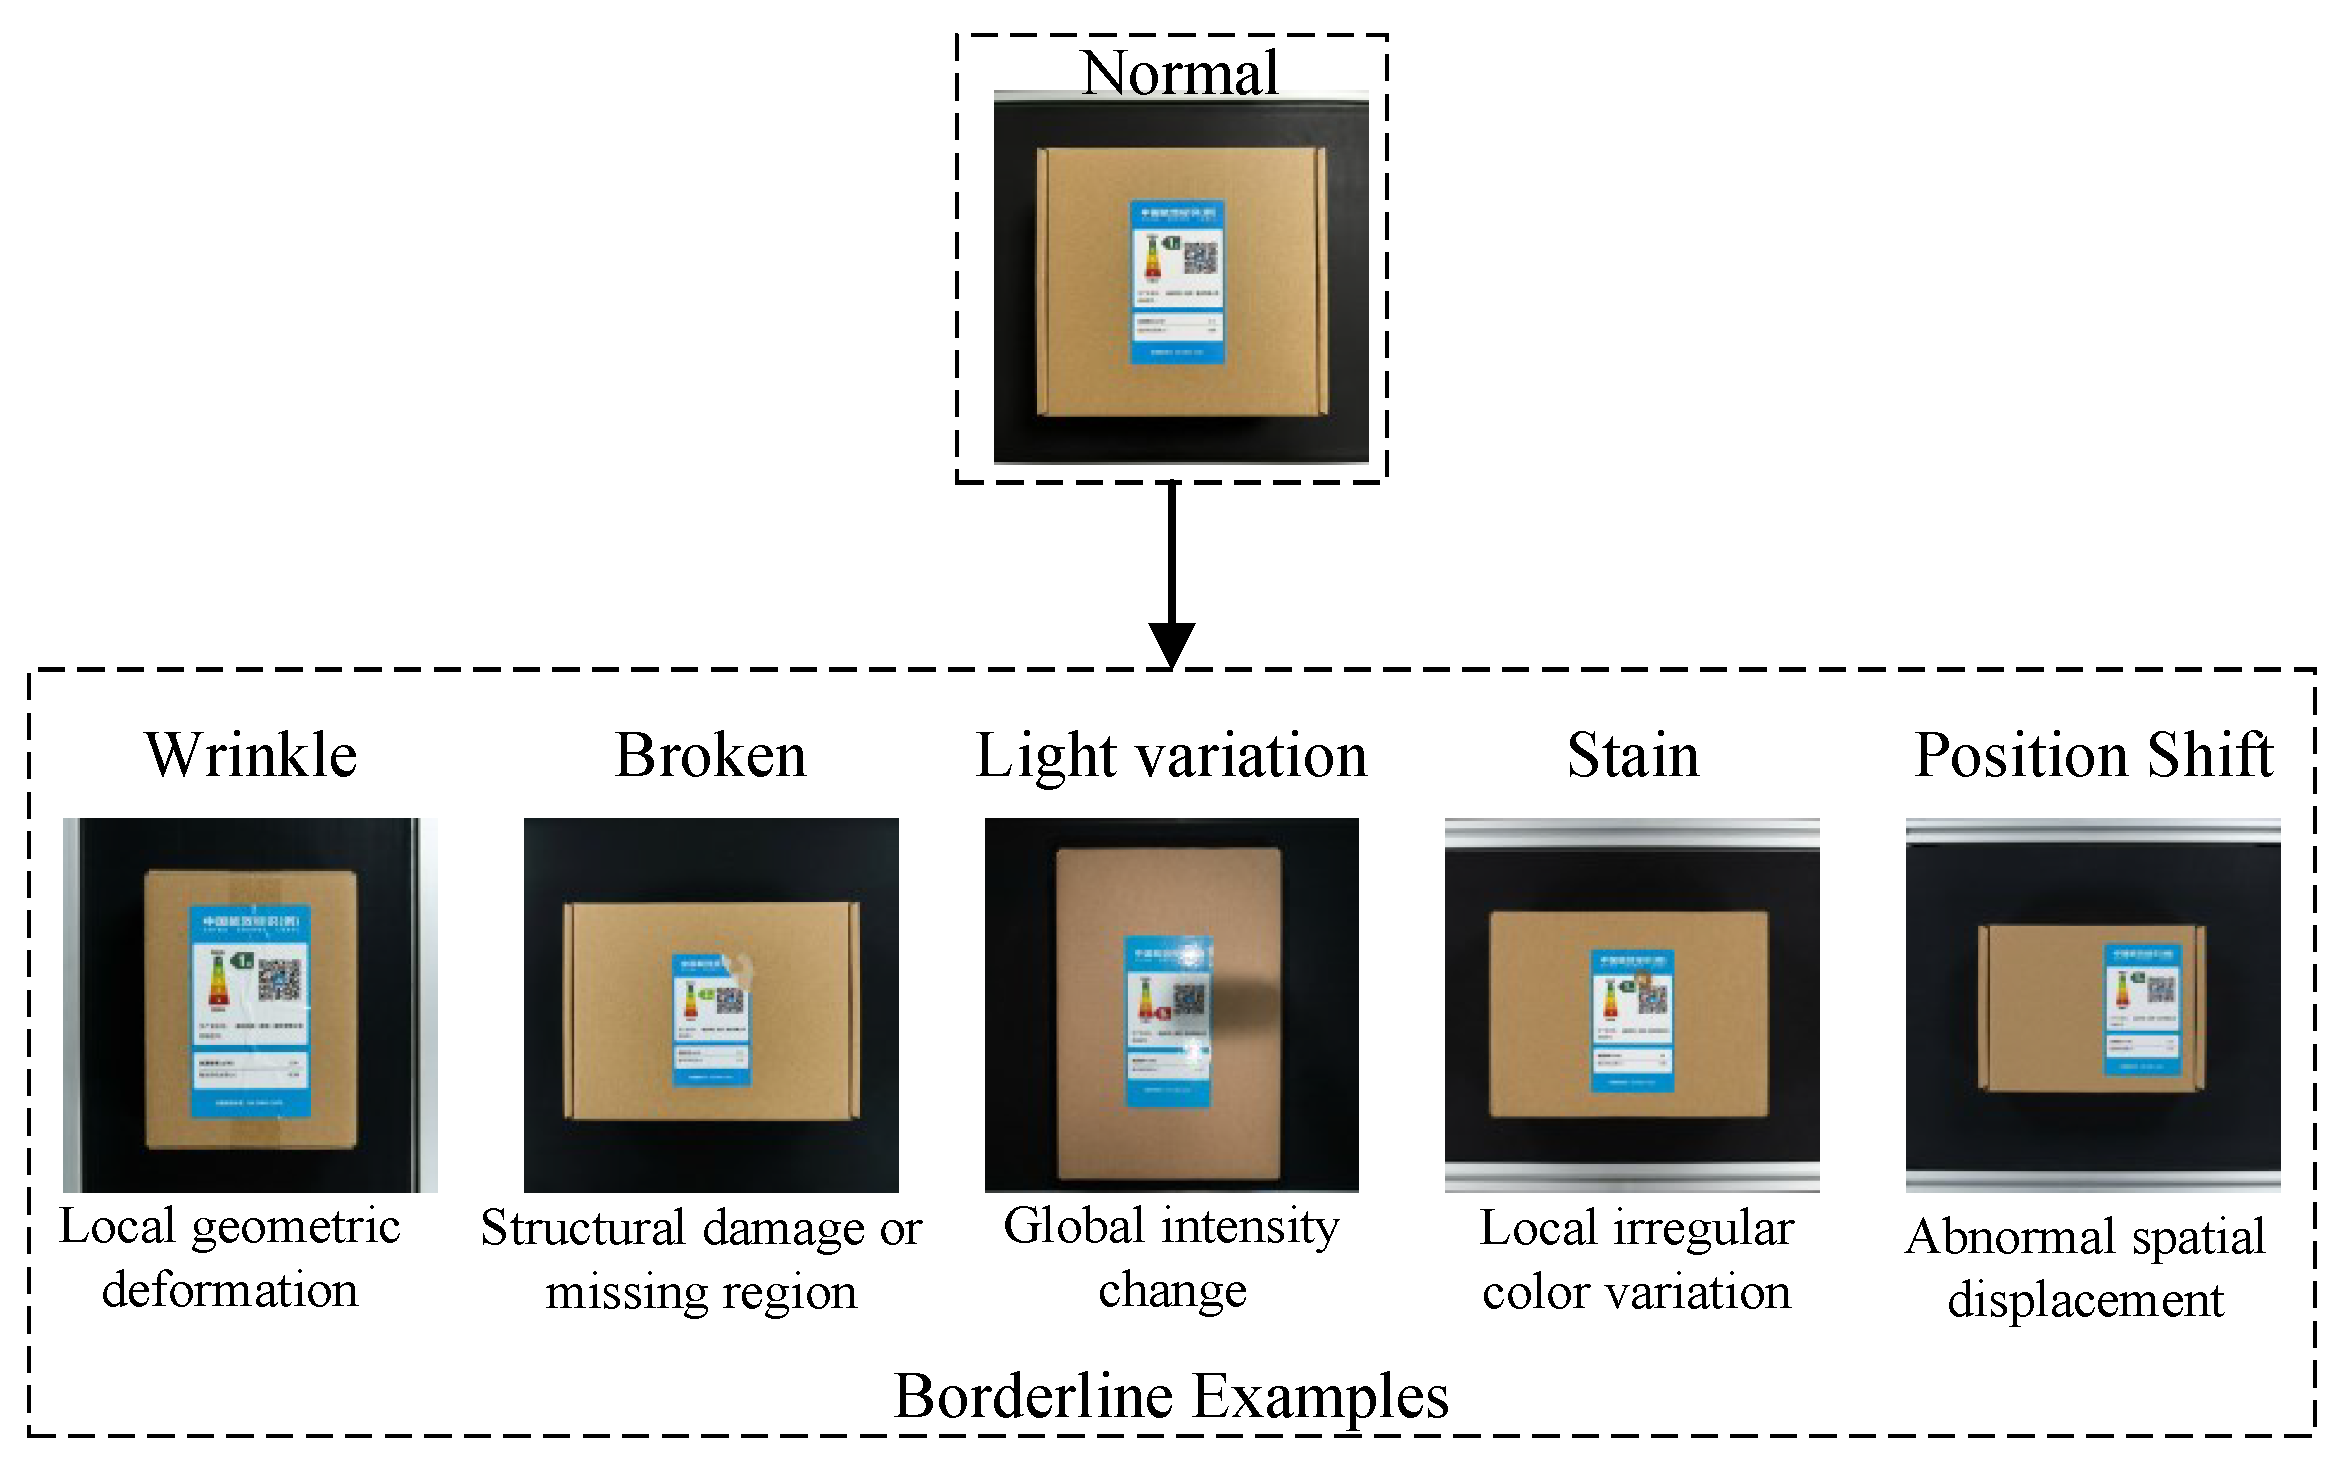
To improve the transparency and reliability of the PQI dataset, we define explicit annotation criteria for different quality conditions according to their visual characteristics. As illustrated in Figure 6, a normal sample is used as the reference, and the defective or abnormal cases are distinguished based on their specific appearance changes. In particular, wrinkle is annotated when the label exhibits local geometric deformation or folding patterns; broken is assigned when structural damage or missing regions are visible on the label surface; light variation refers to global intensity changes caused by illumination conditions rather than intrinsic label defects; stain is defined as local irregular color variation without obvious structural deformation; and position shift denotes abnormal spatial displacement of the energy label relative to the product region. During dataset construction, ambiguous samples were manually rechecked according to these criteria to reduce labeling inconsistency. Representative borderline examples are provided in Figure 6 to illustrate the differences among visually similar cases and to support the annotation verification process.
Figure 6.
Representative borderline cases in the Package Quality Inspection dataset for annotation verification. The examples illustrate different quality conditions, including wrinkle, broken, light variation, stain, and position shift. The annotations are determined according to local geometric deformation, structural damage, intensity variation, color inconsistency, and spatial displacement of the energy label.
5. Experiments
5.1. Datasets
We evaluate the proposed method on one self-constructed dataset and one public industrial anomaly inspection dataset.
PQI Dataset. The proposed Package Quality Inspection (PQI) dataset is constructed for product energy-label and package quality inspection. It contains 3892 image samples in the final experimental setting, including 3512 training images and 380 testing images. The dataset covers diverse inspection scenarios, including normal samples, broken labels, stains, wrinkles, position deviations, illumination variations, and viewpoint changes.
Each image is annotated according to the corresponding inspection requirements. Since different inspection tasks require different types of annotations, not all images contain annotations for every task. Specifically, the available annotations include energy-level labels, defect categories, defect locations, and position-abnormality labels. Therefore, the statistical summaries of different tasks are calculated independently according to their available annotations rather than forming mutually exclusive partitions of the whole dataset.
The PQI dataset supports three inspection tasks: package element recognition, surface defect inspection, and position-abnormality analysis. The complete dataset contains 3892 images, while the energy-level and quality-type statistics represent only the samples with corresponding valid annotations.
MVTec AD Dataset. To further evaluate the generalization ability of the proposed method on public industrial inspection scenarios, we conduct experiments on the MVTec AD dataset [27]. MVTec AD is a widely used benchmark for industrial anomaly inspection, containing over 5000 high-resolution images from 15 object and texture categories. Each category contains defect-free training images and testing images with both normal and defective samples. Since MVTec AD mainly focuses on anomaly inspection and localization, we use it as an auxiliary public benchmark to validate the effectiveness of the proposed defect representation learning strategy.
5.2. Evaluation Protocols and Implementation Details
All methods are trained on the training set and evaluated on the testing set under the same setting. Data augmentation is only applied to the optimization subset. The proposed method is implemented with PyTorch 1.13.1 and CUDA 11.7, and all experiments are conducted on an NVIDIA RTX 3090 GPU.
The quantitative results reported in Table 2, Table 3, Table 4 and Table 5 evaluate the defect-detection task only. Precisiondet, Recalldet, and F1det are calculated from defect-instance predictions, while follows the standard object-detection evaluation protocol. These metrics do not aggregate hierarchical region localization, energy-grade recognition, or position-abnormality assessment.
Table 2.
Ablation study of each module based on defect detection performance on the PQI dataset.
Table 3.
Effect of feature aggregation in HRLM on defect detection performance on the PQI dataset.
Table 4.
Effect of TQIB fusion strategy on defect detection performance on the PQI dataset.
Table 5.
Comparison with different attention modules on the PQI dataset. Bold values indicate the best performance among the compared methods.
F1det is calculated for each defect category and then macro-averaged across categories. Because Precisiondet and Recalldet are aggregated separately under the corresponding detection protocol, the reported macro-F1det is not necessarily equal to the harmonic mean calculated directly from the displayed aggregate precision and recall values.
The product, energy-label, and grade regions serve as hierarchical localization priors for the subsequent inspection branches; their localization AP values are not included in the defect-detection mAP reported in Table 2, Table 3, Table 4 and Table 5. Likewise, the energy-grade and position-abnormality outputs are not included in the displayed defect-detection metrics. Separate comprehensive evaluation of these auxiliary outputs is left for future work.
5.3. Ablation Study
5.3.1. Effect of Each Component
The reported Precision, Recall, and F1-score in Table 2 are calculated based on the defect detection task, while follows the standard object detection evaluation protocol. These metrics are not aggregated from different inspection tasks. Table 2 reports the ablation results of different components on the PQI dataset. The YOLOv8 baseline achieves 91.1% precision, 90.0% recall, 90.5% F1-score, and 67.2% . After introducing HRLM, all metrics are improved, with precision, recall, F1-score, and increasing by 2.2%, 2.9%, 2.1%, and 2.1%, respectively. This indicates that hierarchical region localization helps the model establish structured spatial priors for energy label quality inspection. When the task-oriented quality inspection branches (TQIB) are further added, the model obtains 97.6% precision, 96.1% recall, 97.4% F1-score, and 73.8% , demonstrating that position deviation estimation, defect inspection, and grade recognition provide complementary task-specific cues. Finally, by incorporating MSCO, the complete HRG-MTN achieves the best performance, with 99.3% precision, 99.7% recall, 99.5% F1-score, and 75.6% . Compared with the baseline, HRG-MTN improves precision, recall, F1-score, and by 8.2%, 9.7%, 9.0%, and 8.4%, respectively, verifying the effectiveness of the proposed hierarchical region-guided multi-task framework.
5.3.2. Feature Aggregation in HRLM
Table 3 reports the effect of different feature levels in the scale-aware region feature aggregation of HRLM. When only low-level features are used, the model achieves 94.2% precision, 93.6% recall, 93.1% F1-score, and 70.7% , indicating that high-resolution local details are useful for capturing small regions and fine-grained label cues. After introducing mid-level features, the model obtains 95.3% precision, 94.4% recall, 94.8% F1-score, and 71.1% , showing that intermediate semantic information further improves region representation. When high-level features are combined with low-level features, the performance is improved to 96.6% precision, 95.0% recall, 96.5% F1-score, and 72.5% , demonstrating that global structural cues are important for product-level perception and spatial localization. By jointly integrating low-, mid-, and high-level features, HRLM achieves the best performance, with 97.6% precision, 96.1% recall, 97.4% F1-score, and 73.8% . Compared with using only low-level features, the full scale-aware aggregation improves precision, recall, F1-score, and by 3.4%, 2.5%, 4.3%, and 3.1%, respectively, verifying the effectiveness of multi-level feature aggregation in HRLM.
5.3.3. Effect of TQIB Fusion Strategy
Table 4 reports the effect of different task-oriented branch fusion strategies on the PQI dataset. Compared with the single-branch setting, average fusion improves the F1-score from 97.4% to 98.0% and the from 73.8% to 74.1%, indicating that combining information from multiple inspection branches can provide complementary cues. Max fusion further improves the performance to 98.3% F1-score and 74.5% , showing that emphasizing strong branch responses is helpful for quality inspection. Compared with these simple fusion strategies, confidence-aware fusion achieves better results, with 98.8% precision, 98.7% recall, 98.6% F1-score, and 74.7% , demonstrating the importance of adaptively selecting reliable task-specific cues. Finally, the proposed HRG-MTN obtains the best performance, reaching 99.3% precision, 99.7% recall, 99.5% F1-score, and 75.6% . These results verify that hierarchical region-guided multi-task fusion can effectively integrate complementary information from position deviation estimation, defect inspection, and grade recognition.
5.3.4. Comparison with Attention Modules
To further evaluate the effectiveness of MSAE, we compare it with representative attention modules, including Squeeze-and-Excitation (SE) [28] and Convolutional Block Attention Module (CBAM) [29], under the same experimental settings. As shown in Table 5, both SE and CBAM improve the baseline performance by enhancing feature representation. However, they mainly rely on channel-wise or channel-spatial attention based on conventional feature statistics, which may be insufficient for modeling fine-grained defect patterns. In contrast, MSAE achieves the best performance with 99.3% precision, 99.7% recall, 99.5% F1-score, and 75.6% , outperforming SE and CBAM by 4.3% and 2.7% in , respectively. This improvement demonstrates that the proposed multi-statistic attention mechanism can better capture defect-sensitive features for industrial quality inspection.
Furthermore, recent attention-based industrial inspection architectures have also demonstrated the effectiveness of attention mechanisms for defect localization. For example, Efficient Attentive U-Net [30] integrates squeeze-and-excitation modules, attention gates, and multi-scale feature learning into a U-Net framework for photovoltaic defect segmentation using infrared thermography. Different from this segmentation-oriented architecture, our MSAE is designed for energy label quality inspection, where defect detection needs to be jointly optimized with hierarchical region localization and multiple quality assessment tasks. Therefore, Efficient Attentive U-Net is discussed as a representative attention-based industrial inspection method rather than a direct quantitative comparison due to the differences in task objectives and evaluation metrics.
5.4. Parameter Analysis
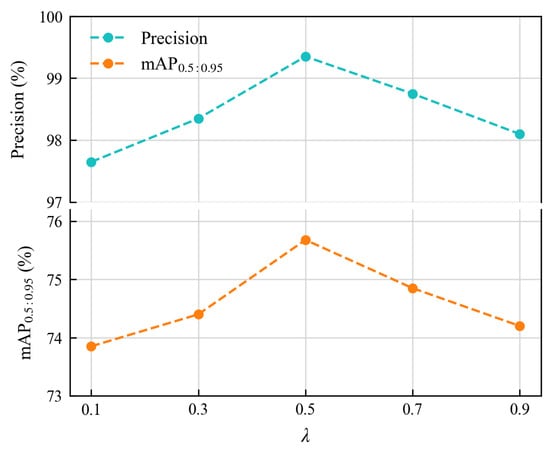
To determine the hyperparameter configuration, we performed parameter selection on the validation set rather than the test set. The search ranges were defined according to the characteristics of the proposed multi-task optimization framework. Specifically, , , , and were evaluated within reasonable ranges, while the ROI resolution was selected according to the trade-off between feature preservation and computational cost. The final configuration was determined based on the best validation performance. Figure 7 presents the sensitivity analysis of individual parameters, demonstrating that the proposed model maintains stable performance within a broad parameter range.
Figure 7.
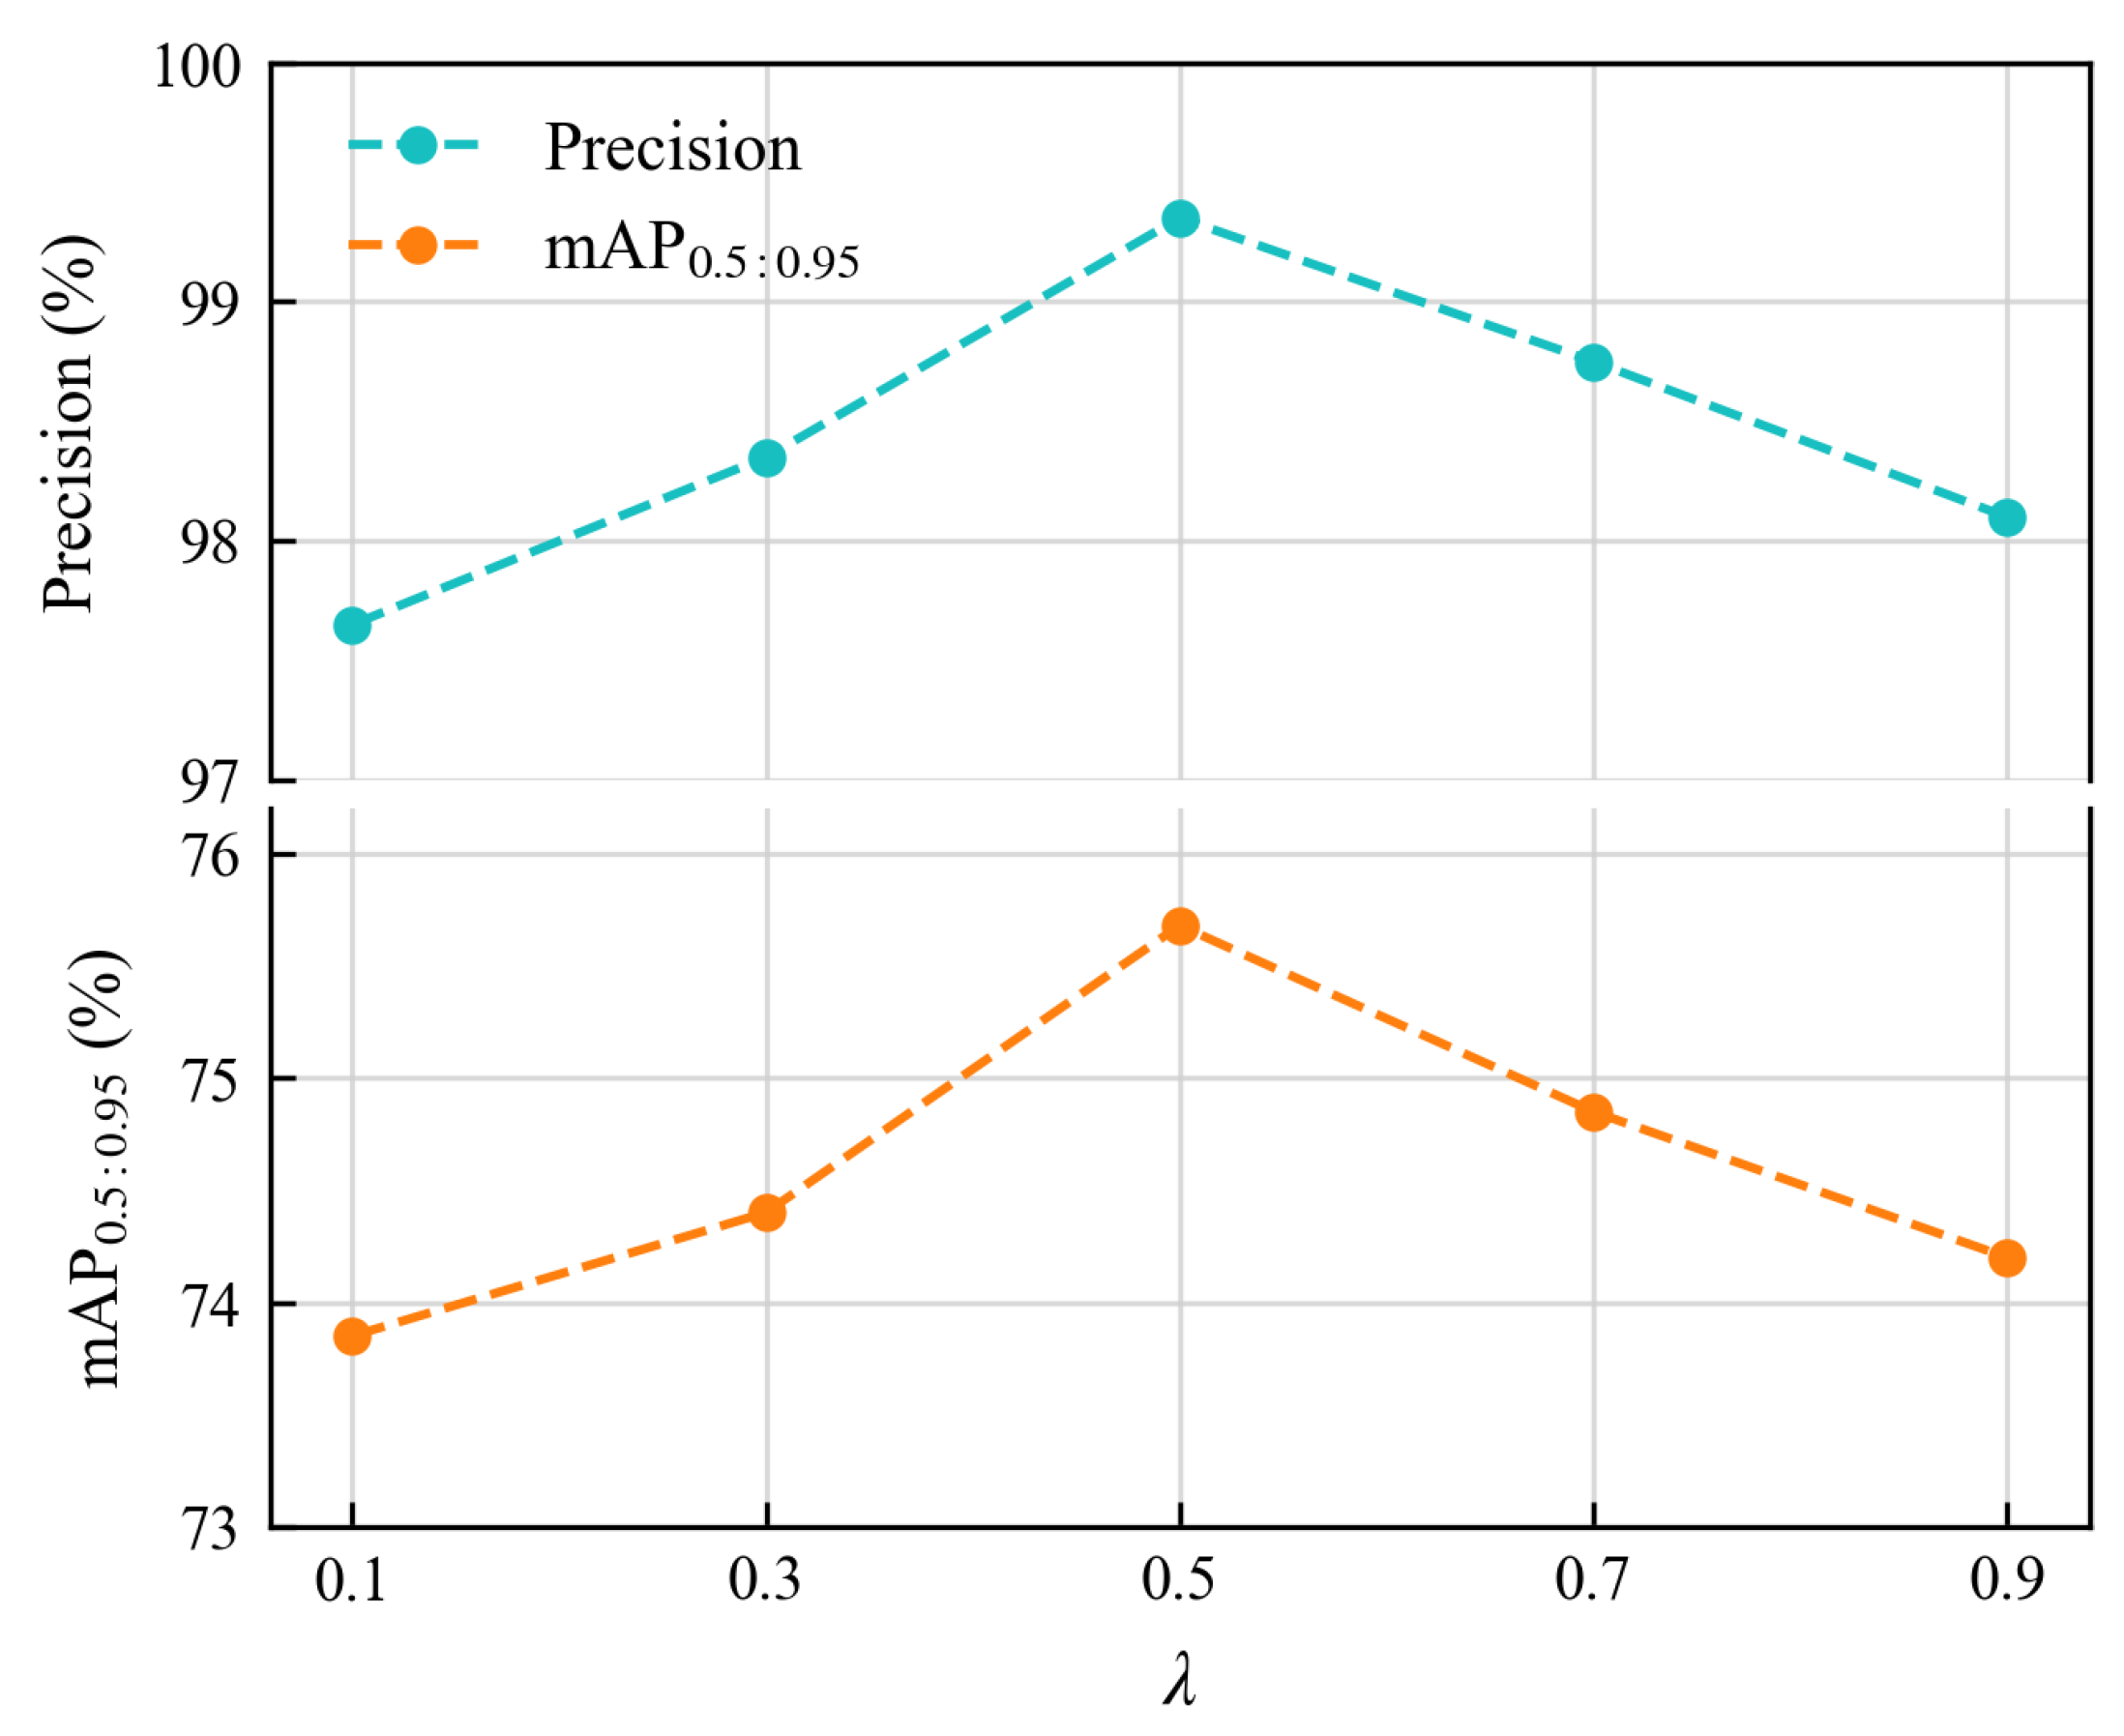
Parameter analysis of the balancing coefficient in the proposed structural consistency loss on the PQI dataset.
Figure 7 shows the influence of the balancing coefficient in the proposed structural consistency loss (SCL). When increases from 0.1 to 0.5, both precision and show a clear upward trend, indicating that introducing structural consistency constraints can effectively improve the inspection performance. The best result is achieved when , where the model obtains the highest precision and . However, when continues to increase, the performance gradually decreases. This is because an excessively large structural constraint may weaken the contribution of task-specific supervision, leading to less effective defect inspection and grade recognition. Therefore, we set to 0.5 in all experiments to achieve a better balance between task learning and structural consistency regularization.
5.5. Comparison with State-of-the-Art Methods
5.5.1. Results on PQI Dataset
Table 6 reports the quantitative comparison on the PQI dataset. The proposed method achieves the best performance across all evaluation metrics, with 99.3% precision, 99.7% recall, 99.5% F1-score, and 75.6% . Compared with ShortcutBreaker [31], our method improves precision, recall, F1-score, and by 1.2%, 2.4%, 1.8%, and 1.4%, respectively. Compared with INP-Former [32], the proposed method further improves these four metrics by 1.7%, 2.9%, 2.1%, and 2.3%, respectively. These results demonstrate that HRG-MTN can better handle complex package quality conditions by jointly modeling hierarchical regions, task-oriented inspection cues, and structural consistency.
5.5.2. Results on MVTec AD Dataset
Table 6 also presents the comparison results on the MVTec AD dataset. For image-level anomaly inspection, our method achieves 99.9% AU-ROC, 99.9% AP, and 99.8% F1-score. Compared with Dinomaly [33], our method improves AU-ROC, AP, and F1-score by 0.3%, 0.1%, and 0.8%, respectively. Compared with MambaAD [34], the proposed method further improves these three metrics by 1.3%, 0.3%, and 2.0%, respectively. For pixel-level anomaly localization, our method obtains 98.9% AU-ROC, 72.3% AP, and 71.6% F1-score, outperforming Dinomaly by 0.5%, 3.0%, and 2.4%, and outperforming MambaAD by 1.2%, 16.0%, and 12.4%, respectively. These results indicate that the proposed method shows strong generalization ability for both image-level anomaly inspection and pixel-level anomaly localization.
Table 6.
Quantitative comparison on the PQI and MVTec AD datasets. Bold values indicate the best performance among the compared methods.
5.6. Statistical Reliability and Deployment Analysis
To evaluate the robustness of the proposed method against random initialization, we conduct experiments with five independent random seeds under the same experimental settings. As reported in Table 7, the proposed framework achieves consistently stable performance across different runs. The variations of all evaluation metrics are relatively small, with standard deviations of 0.1% for Recalldet, and F1det, and 0.2% for Precisiondet and . These results demonstrate that the superior performance of HRG-MTN is not dependent on a specific random initialization, but reflects the effectiveness and reliability of the proposed architecture.
Table 7.
Stability analysis under different random seeds on the PQI dataset.
5.7. Computational Complexity and Deployment Analysis
To further evaluate the practical applicability of the proposed framework, we analyze its computational complexity and inference efficiency. The number of parameters, FLOPs, GPU memory consumption, end-to-end latency, and inference speed are reported in Table 8. All measurements are obtained under the same input resolution and inference settings. The proposed HRG-MTN achieves a favorable balance between inspection accuracy and computational efficiency. With moderate computational overhead and real-time inference capability, the proposed framework demonstrates its potential for practical industrial inspection applications.
Table 8.
Computational complexity and deployment efficiency of HRG-MTN on the PQI dataset.
5.8. Visualization
5.8.1. Visualization of Qualitative Inspection Results
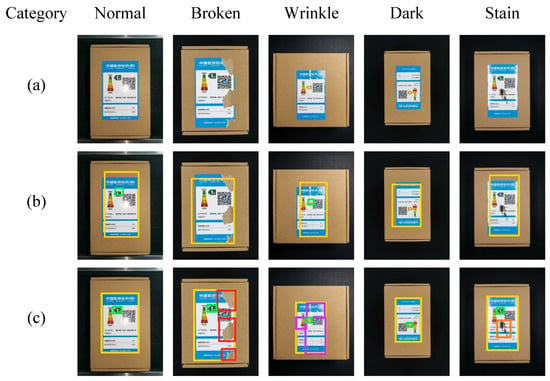
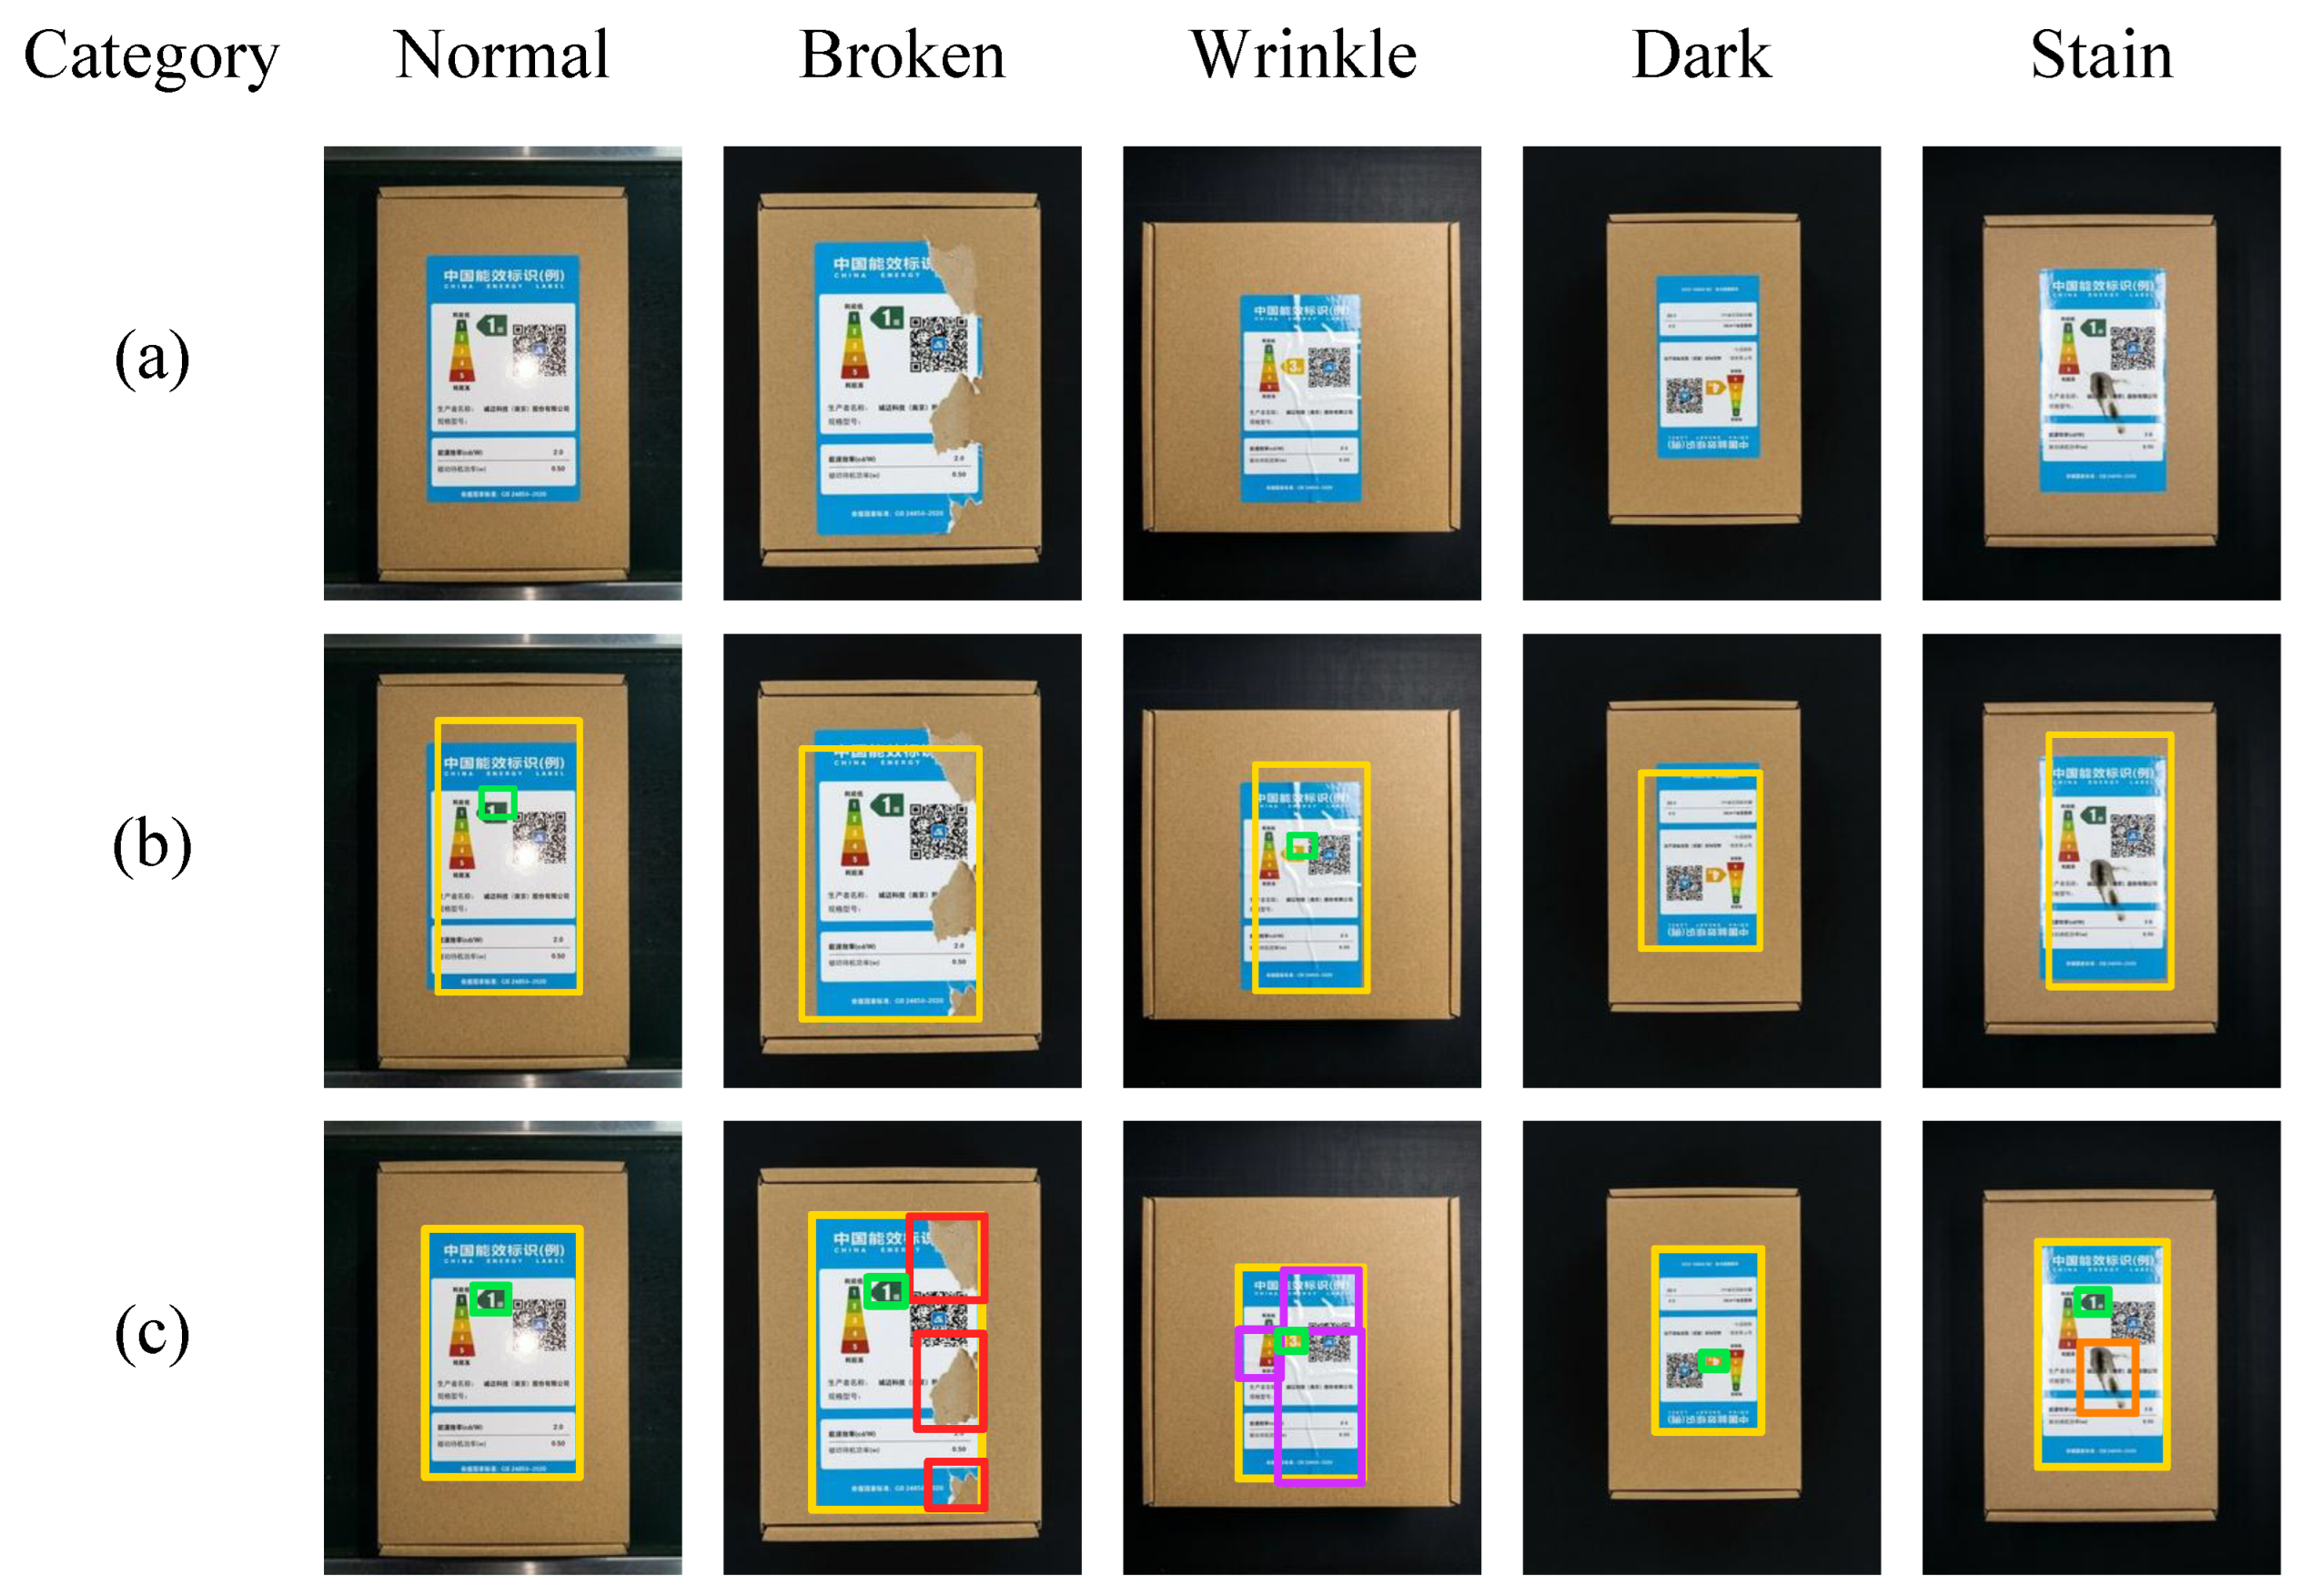
Figure 8 shows qualitative inspection examples under five representative package quality conditions, including normal, broken label, wrinkle, dark illumination, and stain. In Figure 8a, the original images are presented without any inspection annotations. In Figure 8b, the baseline method is shown to mainly focus on the primary energy label regions; however, it often fails to fully capture defect-related areas, such as broken regions, wrinkles, and stain, and suffers from incomplete localization under challenging conditions such as low illumination. In contrast, Figure 8c demonstrates the results of our proposed method, which can more accurately localize both the main energy label and diverse defect regions. The proposed approach consistently produces more complete and reliable inspection results across different quality conditions. This comparison clearly demonstrates the superiority of the proposed method in handling complex and diverse package inspection scenarios.
Figure 8.
Qualitative comparison under representative package quality conditions. (a) Original images. (b) Baseline method. (c) HRG-MTN. The yellow boxes indicate the detected package regions, while colored boxes denote the predicted defect regions of different categories.
5.8.2. Visualization of Feature Heatmaps
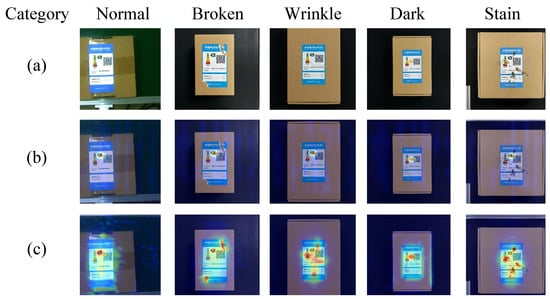
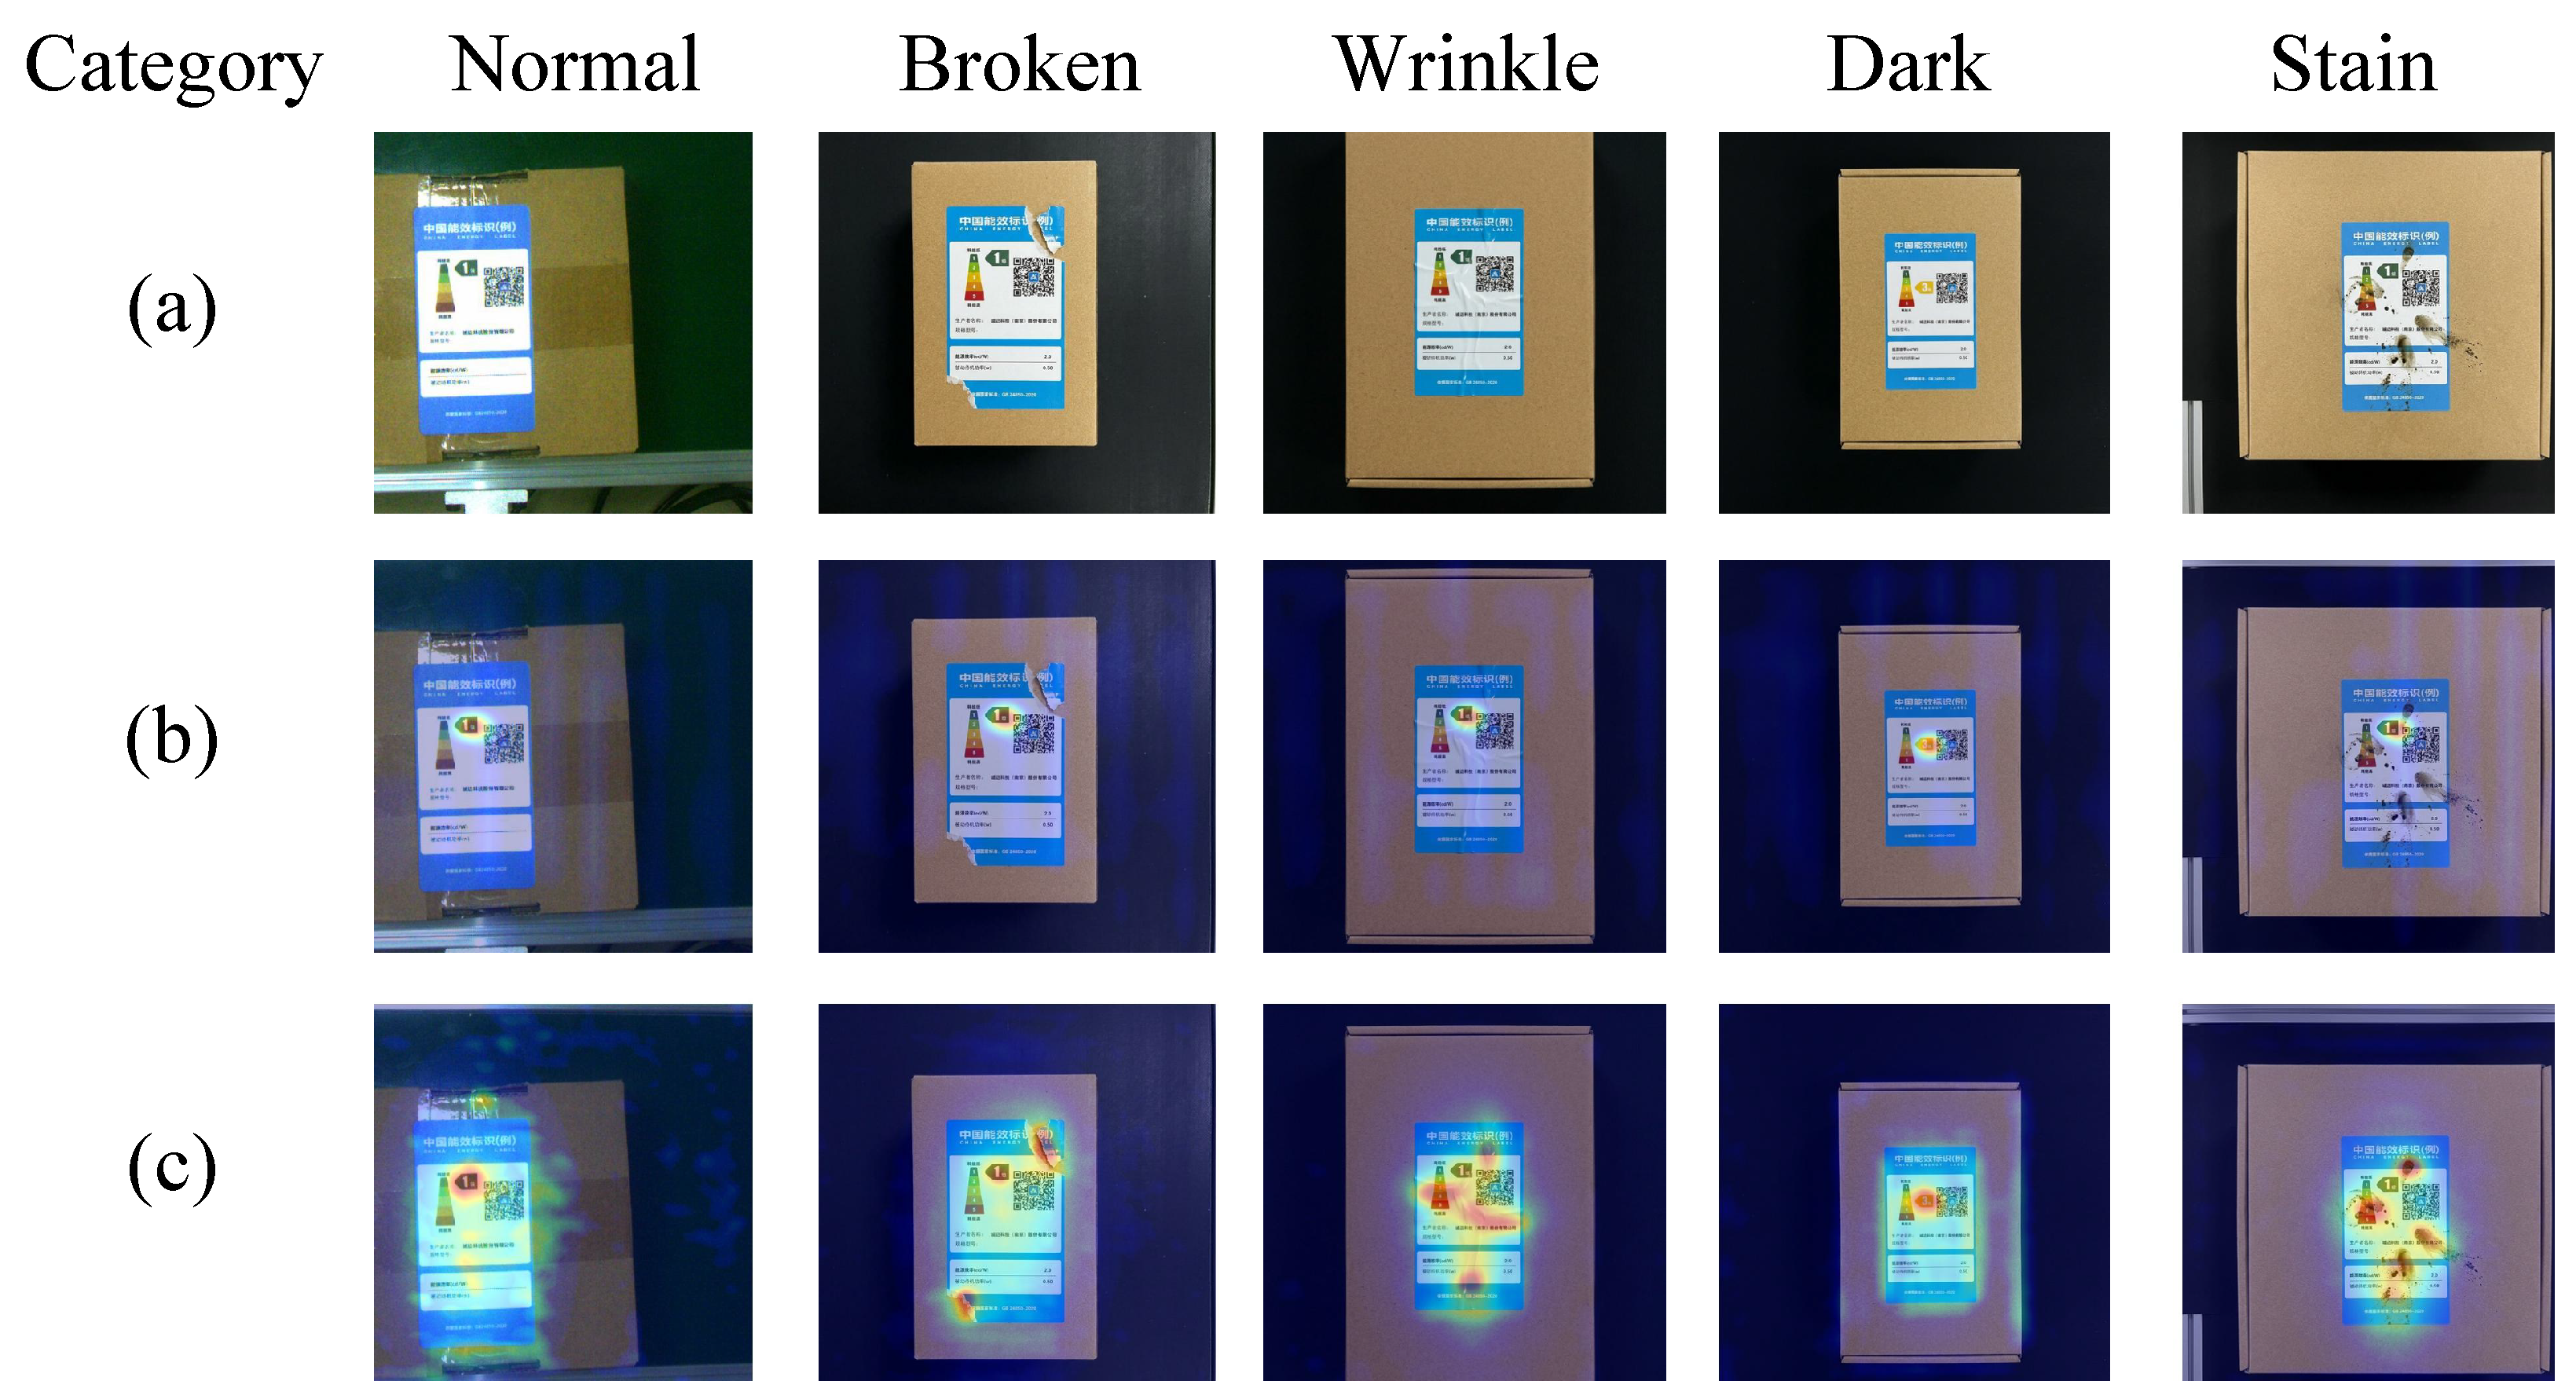
As shown in Figure 9, we present the visualization results under different package inspection scenarios. Compared with the original images in Figure 9a, the baseline method in Figure 9b produces relatively scattered and less accurate activation regions, especially under defect and low-illumination conditions. In contrast, our method in Figure 9c consistently focuses on the most discriminative regions, such as damaged labels and local defect areas, while effectively suppressing background noise. This improvement demonstrates that the proposed hierarchical region modeling and task-oriented quality inspection strategy significantly enhance the model’s ability to capture defect-related cues. As a result, the learned representations are more robust and semantically meaningful for package quality inspection under complex real-world conditions.
Figure 9.
Visualization of feature heatmaps under different package inspection conditions. (a) Original images. (b) Baseline method. (c) HRG-MTN. The heatmaps are generated based on the Grad-CAM visualization of the final convolutional feature representations. Warmer colors indicate regions with stronger feature responses, while cooler colors represent weaker responses.
5.8.3. Convergence Analysis of the HRG-MTN
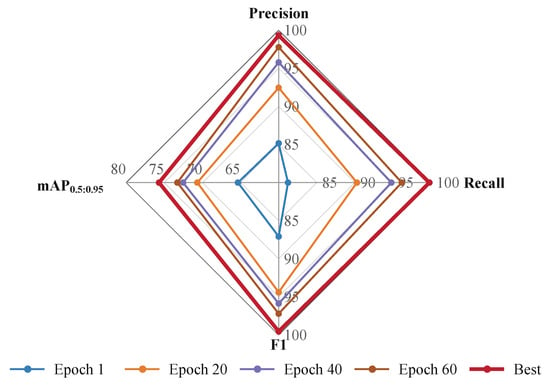
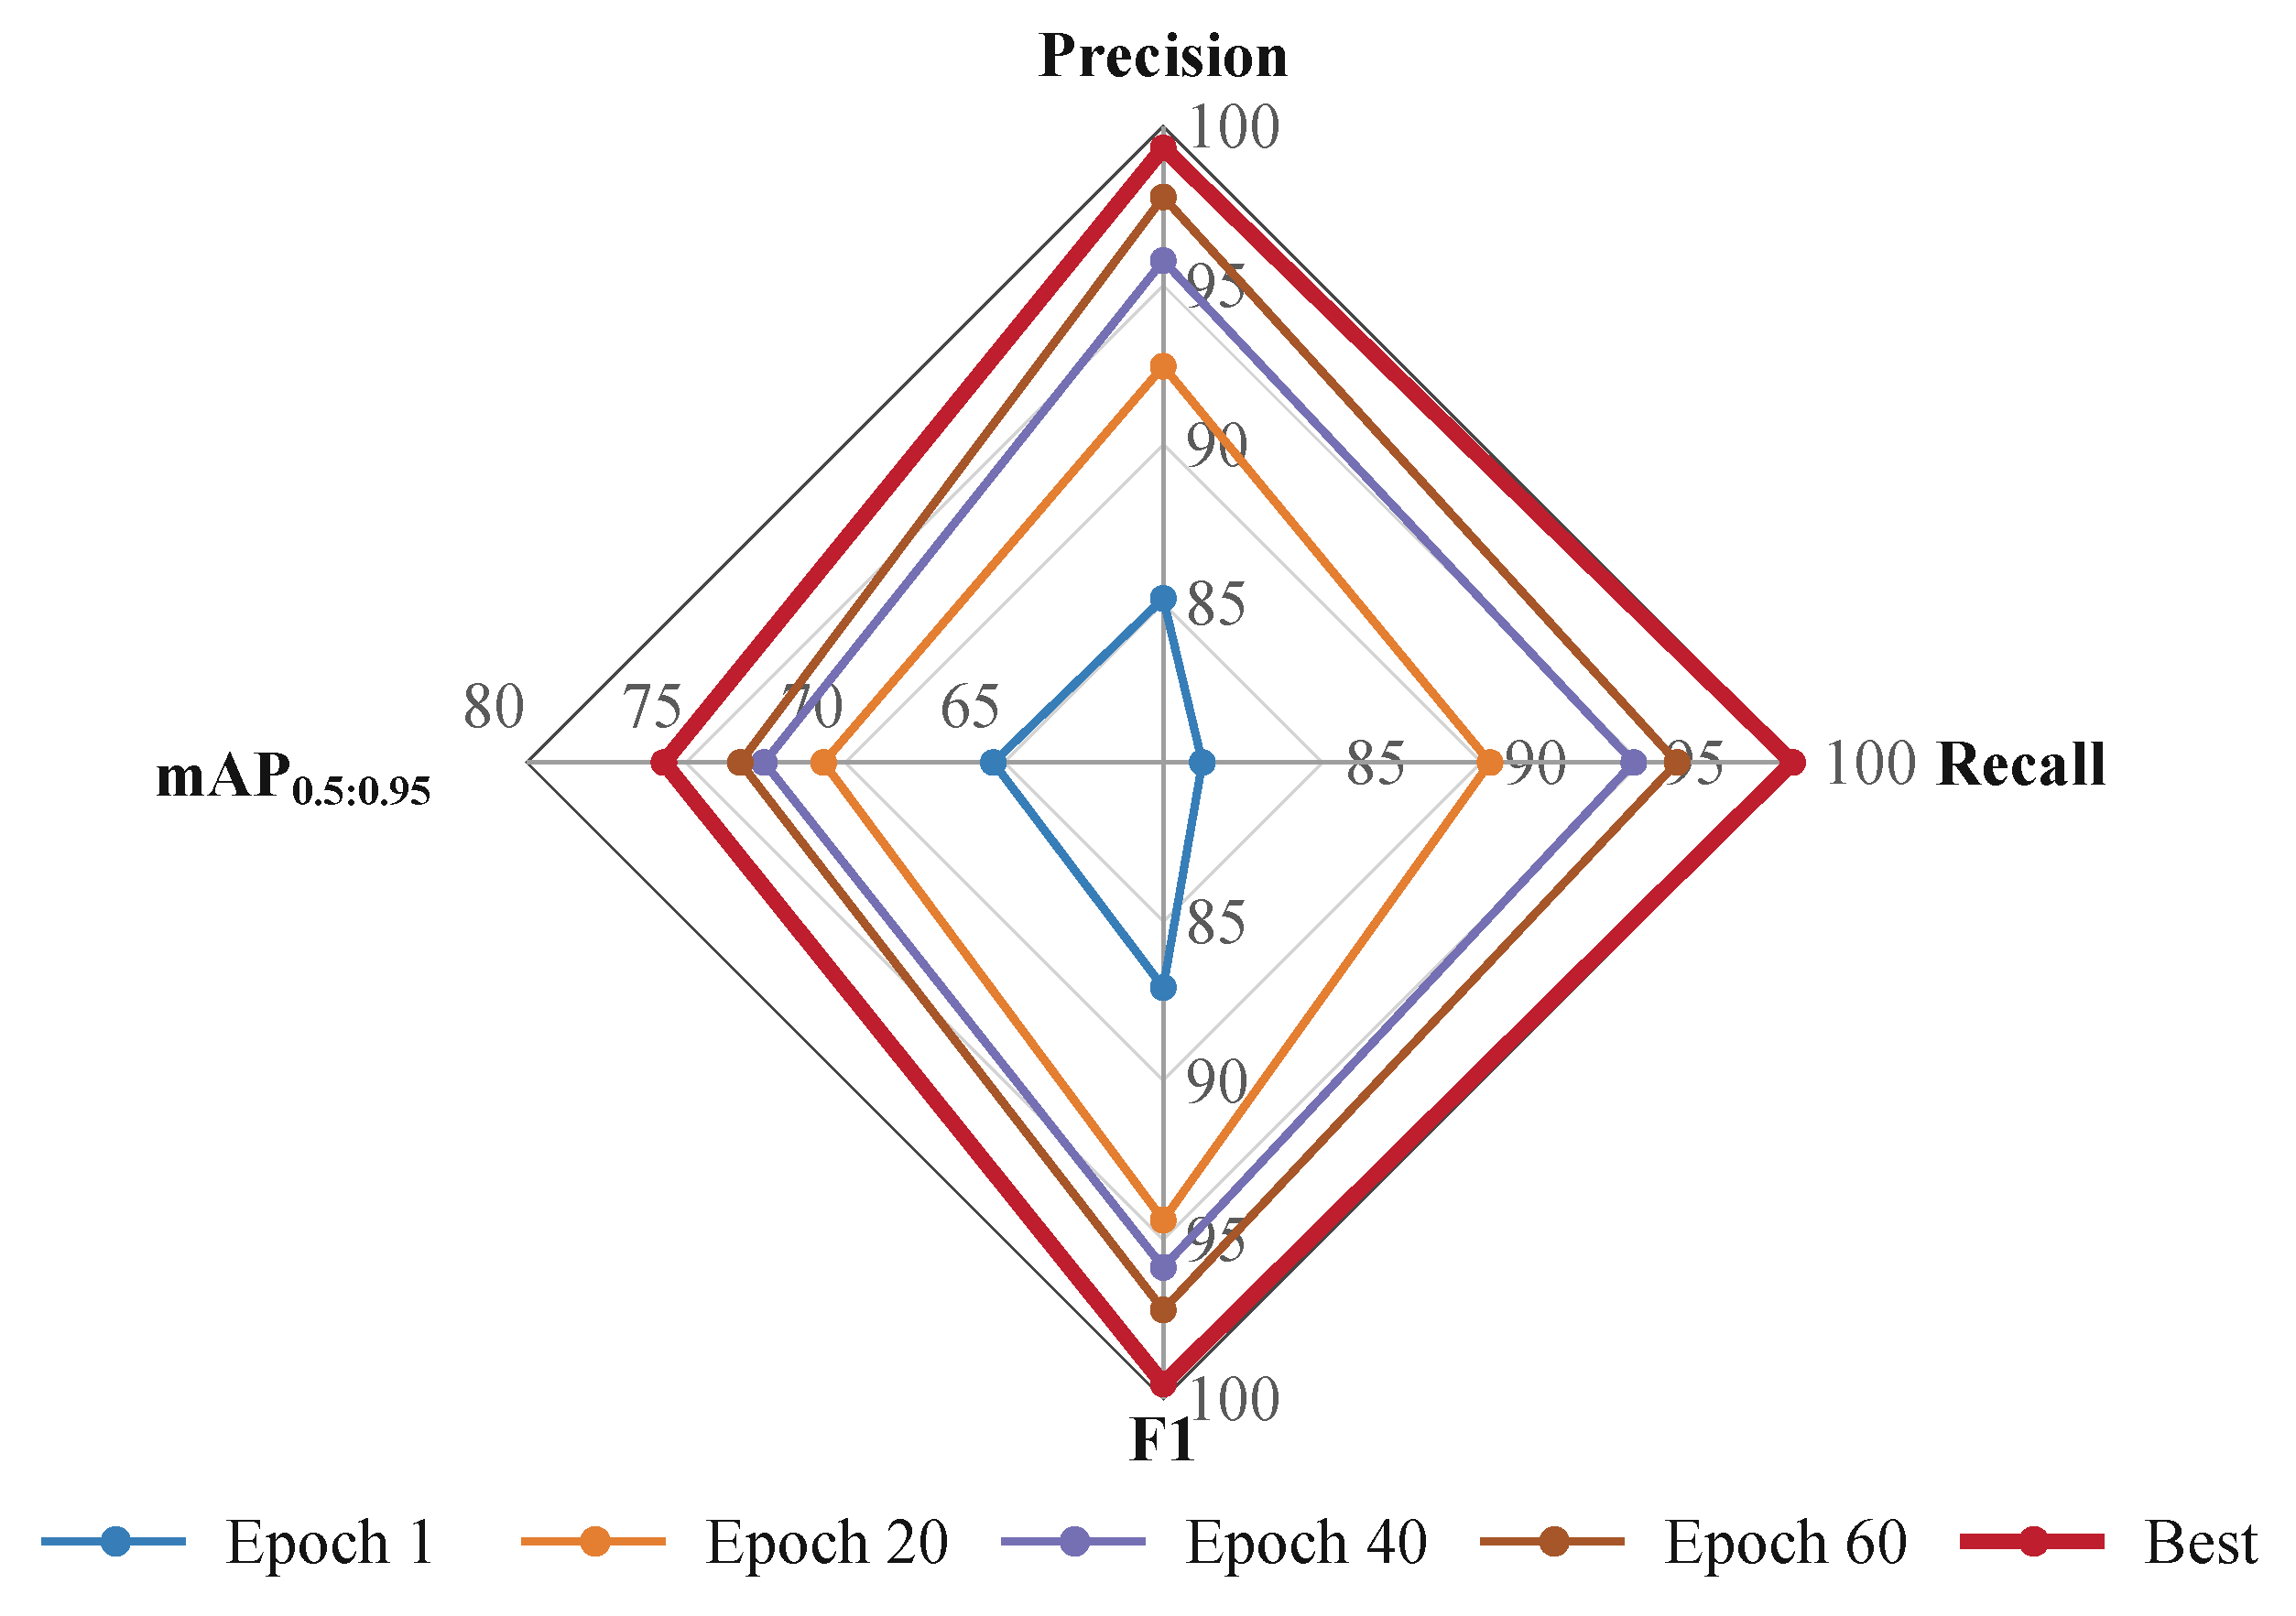
Figure 10 illustrates the performance evolution of the proposed method at different training stages, including Epoch 1, Epoch 20, Epoch 40, Epoch 60, and the best checkpoint. The results are evaluated in terms of Precision, Recall, F1-score, and . It can be observed that the model shows a consistent improvement across all metrics as training progresses. The performance at early epochs is relatively limited, while later epochs gradually achieve better balance among precision, recall, and overall accuracy. The best model achieves the highest values across all evaluation metrics, demonstrating stable convergence and strong generalization ability. Overall, this figure validates the effectiveness of the proposed optimization strategy and indicates that the model can steadily learn discriminative representations during training.
Figure 10.
Performance evolution of the proposed method during training across different epochs.
5.9. Training Stability and Convergence Analysis
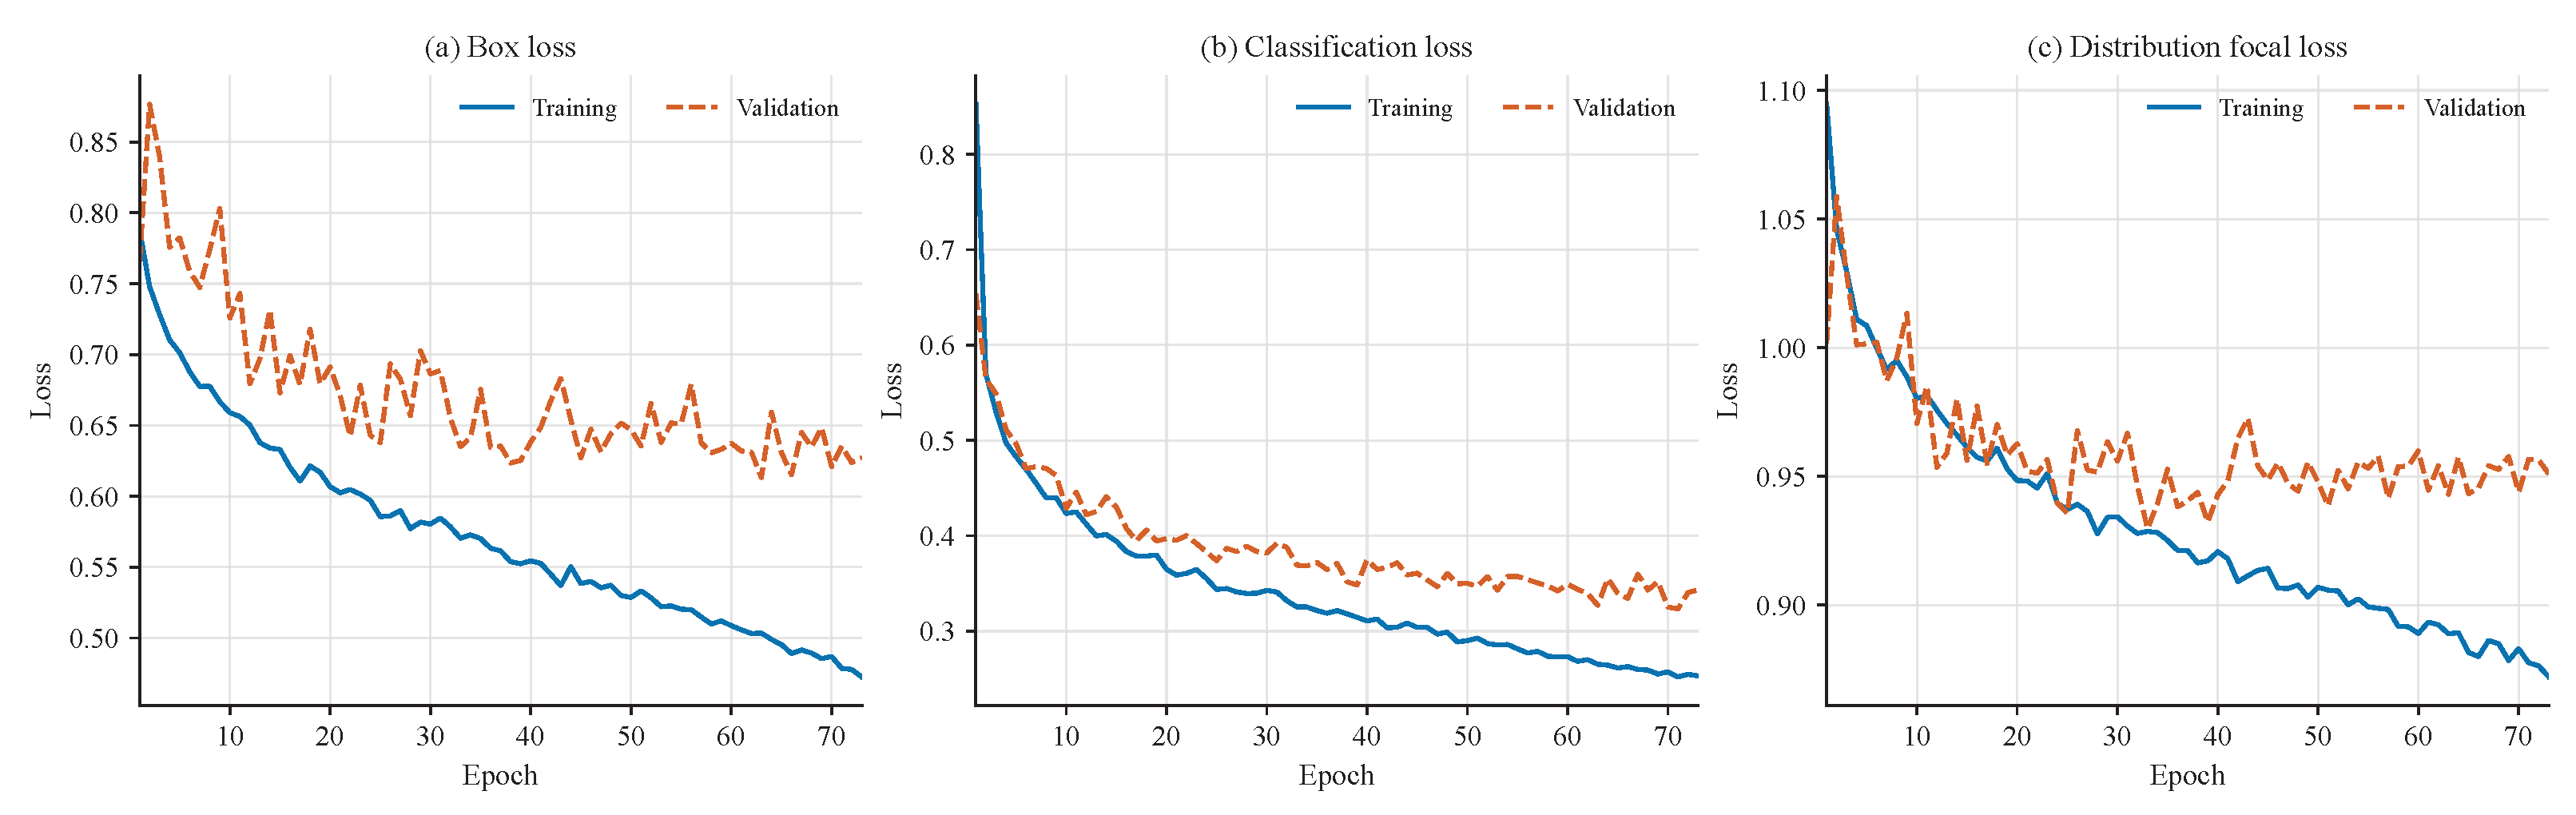
To further analyze the convergence behavior and training stability of the proposed HRG-MTN, we visualize the training and validation losses during the optimization process. As shown in Figure 11, the variations of box regression loss, classification loss, and distribution focal loss are recorded over different training epochs. All loss components consistently decrease during the training stage, indicating that the proposed multi-task optimization strategy can effectively balance localization, defect detection, and classification objectives. Although slight fluctuations exist in the validation curves due to the diversity of package quality conditions, the overall trends remain stable without obvious overfitting. Moreover, the narrow gap between training and validation losses demonstrates the good generalization capability of HRG-MTN on unseen inspection samples.
Figure 11.
Training convergence analysis of HRG-MTN on the PQI dataset. (a) Box regression loss. (b) Classification loss. (c) Distribution focal loss. The solid and dashed curves denote the training and validation losses, respectively.
6. Conclusions
In this paper, we proposed HRG-MTN for energy label quality inspection by treating package inspection as a structured multi-task visual understanding problem. The proposed HRLM progressively localizes product, label, and grade regions, TQIB performs task-specific inspection, and MSCO enhances the structural consistency among hierarchical regions. In addition, we constructed the PQI dataset to support comprehensive evaluation under complex package quality conditions. Experimental results demonstrate the effectiveness of the proposed framework, indicating that hierarchical region modeling and task-oriented inspection are important for reliable energy label quality inspection.
Author Contributions
Y.F.: writing—review and editing, writing—original draft preparation, software, methodology, investigation, formal analysis, and data curation; J.Y. (Jian Yu): writing—review and editing, writing—original draft preparation, methodology, investigation, formal analysis, and conceptualization; Y.Z.: conceptualization, resources, writing—review and editing, supervision, project administration, and funding acquisition; S.H.: software, validation, investigation, and visualization; X.F.: validation, data curation, and visualization; J.Y. (Jie Yu): resources, supervision, and project administration; Z.J.: supervision and funding acquisition. All authors have read and agreed to the published version of the manuscript.
Funding
This research was funded by the National Natural Science Foundation of China, grant number 62501256; the Basic Research Program of Jiangsu, grant numbers BK20251080 and BK20251084; the Natural Science Foundation of the Higher Education Institutions of Jiangsu Province, grant number 25KJB130005; and the Changzhou Leading Innovative Talent Introduction and Cultivation Project, grant number CQ20250058.
Institutional Review Board Statement
Not applicable.
Informed Consent Statement
Not applicable.
Data Availability Statement
The PQI dataset generated in this study is available from the corresponding author upon reasonable request. The publicly available MVTec AD dataset was obtained from the source cited in this article.
Conflicts of Interest
The authors declare no conflicts of interest.
References
- Semitela, Â.; Pereira, M.; Completo, A.; Lau, N.; Santos, J.P. Improving industrial quality control: A transfer learning approach to surface defect detection. Sensors 2025, 25, 527. [Google Scholar] [CrossRef] [Scilit] [PubMed]
- Wang, Q.; Yan, H. LHO-net: A Lightweight Steel Defect Detection Framework Based on Cross-Scale Feature Selection and Adaptive Optimization. Sensors 2026, 26, 1990. [Google Scholar] [CrossRef] [Scilit] [PubMed]
- Rao, K.; Zhao, F.; Shi, T. FP-YOLOv8: Surface defect detection algorithm for brake pipe ends based on improved YOLOv8n. Sensors 2024, 24, 8220. [Google Scholar] [CrossRef] [Scilit] [PubMed]
- Zhao, Y.; Liu, Q.; Su, H.; Zhang, J.; Ma, H.; Zou, W.; Liu, S. Attention-based multiscale feature fusion for efficient surface defect detection. IEEE Trans. Instrum. Meas. 2024, 73, 5013310. [Google Scholar] [CrossRef] [Scilit]
- Huang, Z.; Zhang, C.; Ge, L.; Chen, Z.; Lu, K.; Wu, C. Joining spatial deformable convolution and a dense feature pyramid for surface defect detection. IEEE Trans. Instrum. Meas. 2024, 73, 5012614. [Google Scholar] [CrossRef] [Scilit]
- Wang, J.; Zou, H.; Zhou, M.; Su, R. An efficient deep neural network for surface defect detection in industrial edge sensing. IEEE Trans. Ind. Inform. 2024, 21, 2560–2569. [Google Scholar] [CrossRef] [Scilit]
- Zhang, Z.; Niu, C.; Zhao, Z.; Zhang, X.; Chen, X. Small object few-shot segmentation for vision-based industrial inspection. IEEE Trans. Ind. Inform. 2025, 21, 4388–4399. [Google Scholar] [CrossRef] [Scilit]
- Zhu, W.; Wang, L.; Zhou, Z.; Wang, C.; Pan, Y.; Zhang, R.; Chen, Z.; Cheng, L.; Gao, B.B.; Zhang, J.; et al. Real-iad d3: A real-world 2d/pseudo-3d/3d dataset for industrial anomaly detection. In Proceedings of the Computer Vision and Pattern Recognition; IEEE: New York, NY, USA, 2025; pp. 15214–15223. [Google Scholar]
- Heckler-Kram, L.; Neudeck, J.H.; Scheler, U.; König, R.; Steger, C. The mvtec ad 2 dataset: Advanced scenarios for unsupervised anomaly detection. Int. J. Comput. Vis. 2026, 134, 175. [Google Scholar] [CrossRef] [Scilit]
- Li, Y.; Liu, F.; Liao, J.; Tian, S.; Foo, C.S.; Yang, X. FIND: Few-Shot Anomaly Inspection with Normal-Only Multi-Modal Data. In Proceedings of the International Conference on Computer Vision; IEEE: New York, NY, USA, 2025; pp. 23290–23299. [Google Scholar]
- Fang, X.; Liu, C.; Yang, H.; Zheng, X.; Chen, X. Noise-reduced anomaly attention transformer for intelligent microscale defects detection in metal materials. IEEE Trans. Instrum. Meas. 2024, 73, 6505313. [Google Scholar] [CrossRef] [Scilit]
- Zhang, Z.; Yang, B.; Ma, J. Multiple constraints flow for weakly observable defect detection based on defect-free samples. IEEE Trans. Instrum. Meas. 2024, 73, 3541513. [Google Scholar] [CrossRef] [Scilit]
- Liu, X.; Zhao, S.; Liu, A.; Xiong, N.; Vasilakos, A.V. Knowledge-aware proactive nodes selection approach for energy management in Internet of Things. Future Gener. Comput. Syst. 2019, 92, 1142–1156. [Google Scholar] [CrossRef] [Scilit]
- Zhou, Y.; Yuan, M.; Shi, D.; Xie, X.; Zhang, J.; Chen, H. Few-shot Defect Detection of Printed Circuit Board via Efficient Multi-scale Channel Attention Mechanism and Adaptive Weight. IEEE Trans. Instrum. Meas. 2026, 75, 5003114. [Google Scholar] [CrossRef] [Scilit]
- Liu, C.; Peng, S.; Liu, S.; Li, J. RT-DETR-LGP: An Effective Defect Detection Method for Light Guide Plates via Multiscale Feature Fusion and Knowledge Distillation. IEEE Trans. Instrum. Meas. 2025, 74, 2537418. [Google Scholar] [CrossRef] [Scilit]
- Feng, Y.; Chen, F.; Sun, G.; Wu, F.; Ji, Y.; Liu, T.; Liu, S.; Jing, X.Y.; Luo, J. Learning multi-granularity representation with transformer for visible-infrared person re-identification. Pattern Recognit. 2025, 164, 111510. [Google Scholar] [CrossRef] [Scilit]
- Raissi, M.; Perdikaris, P.; Karniadakis, G.E. Physics-informed neural networks: A deep learning framework for solving forward and inverse problems involving nonlinear partial differential equations. J. Comput. Phys. 2019, 378, 686–707. [Google Scholar] [CrossRef] [Scilit]
- Karniadakis, G.E.; Kevrekidis, I.G.; Lu, L.; Perdikaris, P.; Wang, S.; Yang, L. Physics-informed machine learning. Nat. Rev. Phys. 2021, 3, 422–440. [Google Scholar] [CrossRef] [Scilit]
- Baltrušaitis, T.; Ahuja, C.; Morency, L.P. Multimodal Machine Learning: A Survey and Taxonomy. IEEE Trans. Pattern Anal. Mach. Intell. 2019, 41, 423–443. [Google Scholar] [CrossRef] [Scilit] [PubMed]
- Shu, L.; Zhang, Y.; Yu, Z.; Yang, L.T.; Hauswirth, M.; Xiong, N. Context-aware cross-layer optimized video streaming in wireless multimedia sensor networks. J. Supercomput. 2010, 54, 94–121. [Google Scholar] [CrossRef] [Scilit]
- Yu, J.; Feng, Y.; You, S.; Jing, Z.; Wu, F.; Ji, Y.; Jing, X.Y. Occlusion-aware cross-modality completion network for occluded visible-infrared person re-identification. IEEE Trans. Circuits Syst. Video Technol. 2026, 36, 14314–14328. [Google Scholar] [CrossRef] [Scilit]
- Yu, J.; Feng, Y.; You, S.; Zhou, Z.; Wu, F.; Jing, Z.; Ji, Y. Spatial-Frequency Collaborative Learning for Occluded Visible-Infrared Person Re-Identification. In Proceedings of the IEEE/CVF Conference on Computer Vision and Pattern Recognition; IEEE: New York, NY, USA, 2026; pp. 4343–4352. [Google Scholar]
- Cheng, Y.; Chen, B.; Zhou, N.; Gu, F.; Allen, P.; Ball, A.; Zhang, W. Multiple signal blind deconvolution for fault feature enhancement of rolling element bearings. Struct. Health Monit. 2026, 14759217261464907. [Google Scholar] [CrossRef] [Scilit]
- Zhao, Z.; Yan, X.; Xiang, L.; Jiang, D. Fault diagnosis of rolling bearings in high-noise environments based on a variational gated hierarchical memory network. Meas. Sci. Technol. 2026, 37, 036104. [Google Scholar] [CrossRef] [Scilit]
- Lei, Y.; Yang, B.; Jiang, X.; Jia, F.; Li, N.; Nandi, A.K. Applications of machine learning to machine fault diagnosis: A review and roadmap. Mech. Syst. Signal Process. 2020, 138, 106587. [Google Scholar] [CrossRef] [Scilit]
- Jocher, G.; Chaurasia, A.; Qiu, J. Ultralytics YOLOv8, Version 8.0.0. 2023. Available online: https://github.com/ultralytics/ultralytics (accessed on 20 September 2026).
- Bergmann, P.; Fauser, M.; Sattlegger, D.; Steger, C. MVTec AD–A comprehensive real-world dataset for unsupervised anomaly detection. In Proceedings of the Computer Vision and Pattern Recognition; IEEE: New York, NY, USA, 2019; pp. 9592–9600. [Google Scholar]
- Hu, J.; Shen, L.; Sun, G. Squeeze-and-Excitation Networks. In Proceedings of the IEEE/CVF Conference on Computer Vision and Pattern Recognition; IEEE: New York, NY, USA, 2018; pp. 7132–7141. [Google Scholar]
- Woo, S.; Park, J.; Lee, J.Y.; Kweon, I.S. CBAM: Convolutional Block Attention Module. In Proceedings of the European Conference on Computer Vision; Springer International Publishing: Cham, Switzerland, 2018; pp. 3–19. [Google Scholar]
- Pratticò, D.; Laganà, F.; Versaci, M.; Franković, D.; Jakoplić, A.; La Foresta, F. Efficient Attentive U-Net for Fault Diagnosis and Predictive Maintenance of Photovoltaic Panels Through Infrared Thermography. Energies 2025, 18, 6472. [Google Scholar] [CrossRef] [Scilit]
- Tang, P.; Yan, X.; Hu, X.; Cui, Y.; Luo, D.; Zhang, J.; Xu, P.; Peng, J.; He, Q.; Huang, F.; et al. ShortcutBreaker: Low-Rank Noisy Bottleneck with Global Perturbation Attention for Multi-Class Unsupervised Anomaly Detection. arXiv 2025, arXiv:2510.18342. [Google Scholar]
- Luo, W.; Cao, Y.; Yao, H.; Zhang, X.; Lou, J.; Cheng, Y.; Shen, W.; Yu, W. Exploring intrinsic normal prototypes within a single image for universal anomaly detection. In Proceedings of the Computer Vision and Pattern Recognition; IEEE: New York, NY, USA, 2025; pp. 9974–9983. [Google Scholar]
- Guo, J.; Lu, S.; Zhang, W.; Chen, F.; Li, H.; Liao, H. Dinomaly: The less is more philosophy in multi-class unsupervised anomaly detection. In Proceedings of the Computer Vision and Pattern Recognition; IEEE: New York, NY, USA, 2025; pp. 20405–20415. [Google Scholar]
- He, H.; Bai, Y.; Zhang, J.; He, Q.; Chen, H.; Gan, Z.; Wang, C.; Li, X.; Tian, G.; Xie, L. Mambaad: Exploring state space models for multi-class unsupervised anomaly detection. Adv. Neural Inf. Process. Syst. 2024, 37, 71162–71187. [Google Scholar] [CrossRef] [Scilit]
- Deng, H.; Li, X. Anomaly detection via reverse distillation from one-class embedding. In Proceedings of the Computer Vision and Pattern Recognition; IEEE: New York, NY, USA, 2022; pp. 9737–9746. [Google Scholar]
- You, Z.; Cui, L.; Shen, Y.; Yang, K.; Lu, X.; Zheng, Y.; Le, X. A unified model for multi-class anomaly detection. Adv. Neural Inf. Process. Syst. 2022, 35, 4571–4584. [Google Scholar] [CrossRef] [Scilit]
- Liu, Z.; Zhou, Y.; Xu, Y.; Wang, Z. Simplenet: A simple network for image anomaly detection and localization. In Proceedings of the Computer Vision and Pattern Recognition; IEEE: New York, NY, USA, 2023; pp. 20402–20411. [Google Scholar]
- Zhang, X.; Li, S.; Li, X.; Huang, P.; Shan, J.; Chen, T. Destseg: Segmentation guided denoising student-teacher for anomaly detection. In Proceedings of the Computer Vision and Pattern Recognition; IEEE: New York, NY, USA, 2023; pp. 3914–3923. [Google Scholar]
- He, H.; Zhang, J.; Chen, H.; Chen, X.; Li, Z.; Chen, X.; Wang, Y.; Wang, C.; Xie, L. A diffusion-based framework for multi-class anomaly detection. In Proceedings of the AAAI Conference on Artificial Intelligence; AAAI: Singapore, 2024; Volume 38, pp. 8472–8480. [Google Scholar]
- Guo, J.; Lu, S.; Jia, L.; Zhang, W.; Li, H. Recontrast: Domain-specific anomaly detection via contrastive reconstruction. Adv. Neural Inf. Process. Syst. 2023, 36, 10721–10740. [Google Scholar] [CrossRef] [Scilit]
- Zhang, J.; Chen, X.; Wang, Y.; Wang, C.; Liu, Y.; Li, X.; Yang, M.H.; Tao, D. Exploring plain vit reconstruction for multi-class unsupervised anomaly detection. arXiv 2023, arXiv:2312.07495. [Google Scholar]
- Zhang, J.; Wang, C.; Li, X.; Tian, G.; Xue, Z.; Liu, Y.; Pang, G.; Tao, D. Learning Feature Inversion for Multi-class Anomaly Detection under General-purpose COCO-AD Benchmark: J. Zhang et al. Int. J. Comput. Vis. 2026, 134, 235. [Google Scholar]
- Fu, M.; Fu, Z. A unified multi-class anomaly detection model based on reverse distillation. IET Image Process. 2025, 19, e13309. [Google Scholar] [CrossRef] [Scilit]

Disclaimer/Publisher’s Note: The statements, opinions and data contained in all publications are solely those of the individual author(s) and contributor(s) and not of MDPI and/or the editor(s). MDPI and/or the editor(s) disclaim responsibility for any injury to people or property resulting from any ideas, methods, instructions or products referred to in the content. |
© 2026 by the authors. Licensee MDPI, Basel, Switzerland. This article is an open access article distributed under the terms and conditions of the Creative Commons Attribution (CC BY) license.