


Abstract
The traction converter is the core component of an electric multiple unit (EMU), with the Insulated-Gate Bipolar Transistor (IGBT) serving as the key element that directly determines the operational status of the entire traction system. Predicting IGBT service life is therefore essential for fault prediction and health management in trains, providing critical support for ensuring operational safety, guiding condition-based maintenance decisions, and reducing life-cycle costs. In this study, we summarize the basic structure and failure mechanisms of IGBTs and propose a theoretical relationship between their performance parameters and degrees of aging, subsequently developing a method for predicting IGBT service life based on void ratio and service time. Additionally, a DC power cycle aging test is designed and carried out on the IGBT module according to the actual working conditions and the range of acceptable junction temperatures. The life prediction method proposed in this paper is used to analyze the test data, providing the predicted service life of the traction converter’s IGBT module. The results show that a new IGBT module can be used for 29.66 years or 17.8 million km, which can be used to support future maintenance work.
1. Introduction
With the rapid development of rail transit in China, the safe operation of electric multiple units (EMUs) is a key area of study. The core component of an EMU is the traction converter [1], which in turn depends on an Insulated-Gate Bipolar Transistor (IGBT) [2,3]. A fault in the IGBT can impair the traction converter’s normal operation and may lead to serious accidents; therefore, being able to predict the remaining useful life of IGBTs is of enormous practical significance to ensure the intelligent operation and maintenance of EMUs, as this can improve the reliability of traction converters and reduce operational risks.
Analytical IGBT models can be established by fitting aging-related data. Although it cannot capture physical failure mechanisms during aging, the method is simple to apply and is presently the most widely used model for life estimation, while the literature indicates that the LESIT model is more commonly used to predict the lifetime of IGBT modules in converters [4]. A research team led by Lin Fei and Yang Zhongping adopted a mission profile-based method to predict the life of IGBT modules in traction converters, extracting the junction temperature characteristics of module thermal cycles by building an electro-thermal simulation model of the traction drive system and using the cumulative damage method [5]. However, the prediction results obtained by this method were based on simulation analysis, which contains a degree of uncertainty. Wang Lei et al. analyzed changes in temperature and thermal stress in the IGBT solder layer under different degrees of aging, based on the variations in power loss of the modules used in traction converters during domestic metro line operation, and established a mapping relationship between solder-layer stress and remaining service life [6]. Nevertheless, this method only considers the limited conditions of new state, 25% aging, and 50% aging, resulting in insufficient accuracy. Bayerer R et al. conducted a multiple regression analysis on the variables influencing junction temperature fluctuations—whether trains were running on time, chip thickness, bonding technology, bonding wire diameter, current per bonding wire, and package type—and proposed a Bayerer model for IGBT life assessment [7]. However, this model is overly complex and has limited practical value. Jiang N et al. established a finite element model of an IGBT, considered the impact of the power cycle load temperature level on the fatigue life of its solder layer, improved the Coffin–Manson model, and applied the improved model to IGBT life prediction [8]. However, this method used a small sample size and failed to establish a relationship between the number of failure cycles and the module’s actual life. More recently, Wei et al. [9] proposed a data-driven approach to predict the impact of void characteristics on IGBT junction temperature, further highlighting the importance of understanding solder-layer void evolution for accurate lifetime prediction.
Despite these advances, several critical gaps remain unaddressed in the existing literature. First, most lifetime models for traction converter IGBTs rely heavily on simulation-based junction temperature extraction or empirical parameter fitting, introducing significant uncertainty and preventing direct experimental validation of the degradation process. Second, the relationship between measurable degradation indicators—particularly solder-layer void-ratio evolution—and remaining useful life has not been systematically established using experimental data for traction-grade IGBT modules under realistic operating conditions. Third, existing accelerated aging studies typically employ limited degradation conditions or rely on finite element simulations without experimental validation of void-ratio evolution, and the conversion of accelerated test results to actual service life predictions remains inadequately addressed. Fourth, the statistical uncertainties arising from limited sample sizes in accelerated testing have not been quantitatively characterized in previous studies.
This paper focuses on the lifetime prediction of IGBT modules, key components of traction converters. We begin by analyzing the basic structure and failure mechanisms of IGBTs and identify solder-layer void-ratio degradation as the characteristic performance parameter for lifetime assessment. On this basis, a life prediction method that combines void-ratio evolution with a service-time model is proposed. A DC power-cycling aging test scheme is designed based on the actual operating conditions of traction converter IGBTs. The experimental data are analyzed using the proposed method, yielding the predicted service life of the IGBT modules.
The main contributions of this work are fourfold: (1) a data-driven lifetime prediction method based on experimentally measured void-ratio degradation, in contrast to traditional simulation-based approaches; (2) a statistical failure criterion (μ + 3σ criterion) integrated with a service-time model to support maintenance scheduling; (3) experimental validation of the proposed method through DC power-cycling tests under three different stress conditions; and (4) a quantitative bridge between accelerated aging test results and actual service life predictions, offering direct guidance for condition-based maintenance of EMUs.
The remainder of this paper is organized as follows. Section 2 analyzes the failure mechanism of IGBT modules and identifies the solder-layer void ratio as the key indicator of degradation. Section 3 presents the proposed lifetime assessment methodology, including the statistical failure criterion and the service-time conversion model. Section 4 describes the experimental setup and discusses the test results, followed by lifetime prediction and uncertainty analysis. Section 5 concludes the paper with a summary of findings and recommendations for future work.
2. Analysis of IGBT Failure Mechanism
2.1. Traction Converter Topology
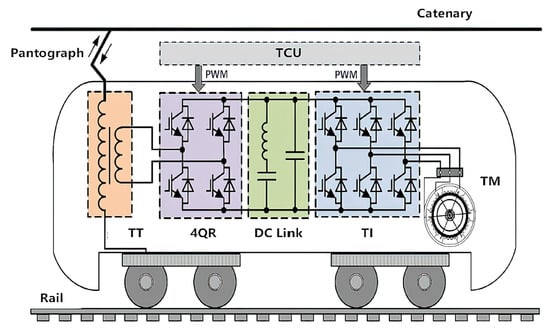
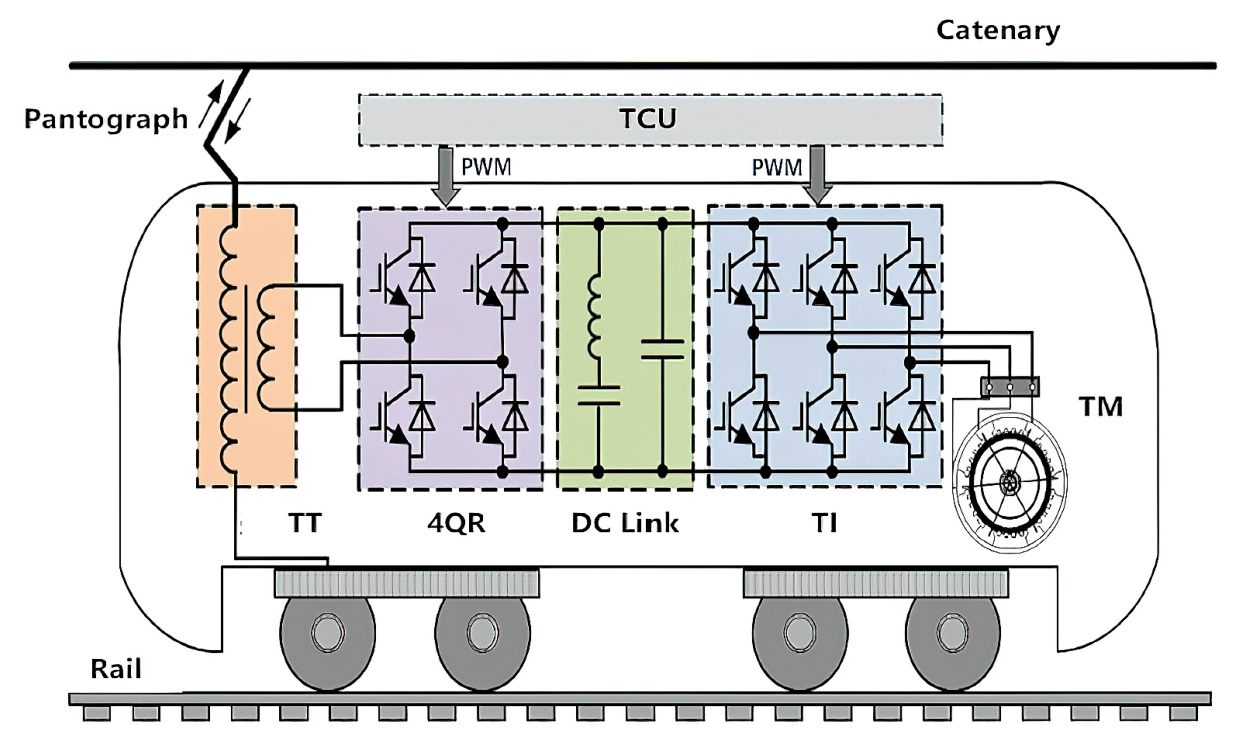
The traction converter serves as a vital component of a train’s traction power supply and operation. The device is generally composed of a four-quadrant rectifier, an inverter, an intermediate DC link, a set of traction control devices, and a cooling system, with each inverter connected to four traction motors [10]. The primary functions of the traction converter are to convert the single-phase alternating current from the pantograph into direct current via the rectifier, and then to convert the direct current into a three-phase alternating current through the inverter to supply power to the traction motors. By controlling the traction converter, the train can perform traction, cruising, coasting, and braking operations. The topology of the traction drive system is illustrated in Figure 1. Given the harsh operating environment, the performance of the key internal components generally degrades gradually over time until failure occurs. The failure of a single component may also cause the entire traction converter to malfunction, which manifests externally as a fault; this highlights the necessity of creating methods to predict the life of an EMU traction converter’s key components.
Figure 1.
Topological structure diagram of high-speed train charger.
2.2. Basic Structure and Failure Analysis of IGBT
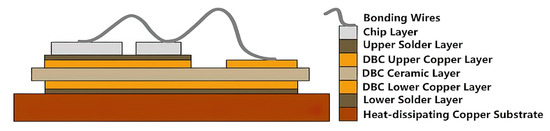
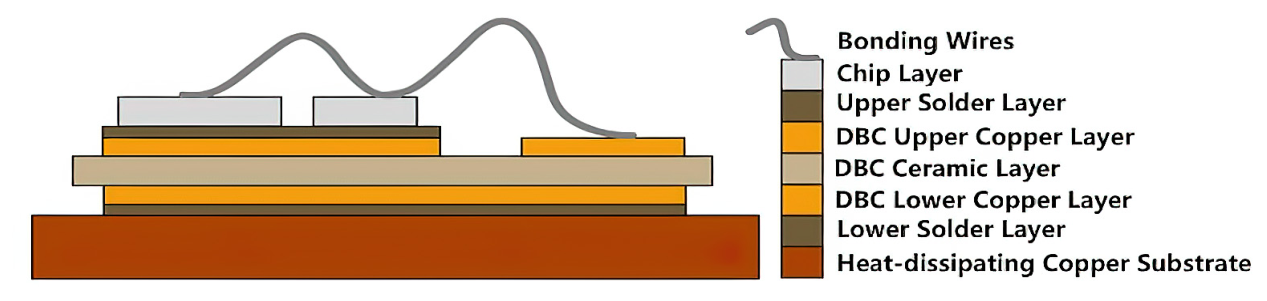
The IGBT module, a key component of the EMU traction converter, is welded. It integrates the advantages of Giant (GTRs) and Metal–Oxide–Semiconductor Field-Effect Transistors (MOSFETs) and exhibits excellent electrical characteristics. Inside the IGBT module, multiple IGBT chips and anti-parallel diode chips are connected to the external terminals via bonding wires. A cross-sectional view of its layered structure is shown in Figure 2, encompassing its stability and heat dissipation performance [11]. As shown in the figure, the IGBT module consists of bonding wires, silicon-based IGBT and diode chips, upper and lower solder layers, copper layers, a ceramic layer, and a heat-dissipating copper substrate. The bonding wires, typically made of aluminum or copper and with diameters of 300–500 μm, interconnect the chip pads to external terminals. The solder layers, made of lead-free SnAgCu alloys, enable mechanical attachment and thermal conduction between the chip and the direct-bonded copper substrate, as well as between the DBC substrate and the copper baseplate. The ceramic layer, typically alumina or aluminum nitride, ensures electrical insulation and thermal conductivity. The upper and lower copper layers form the DBC substrate, providing a low-thermal-resistance path for heat dissipation. In contrast, the copper baseplate serves as the primary thermal interface to the cooling system. Studies on solder-layer fatigue under power cycling have provided valuable insights into the reliability of these interconnections [12].
Figure 2.
Cross-sectional structure diagram of the IGBT module.
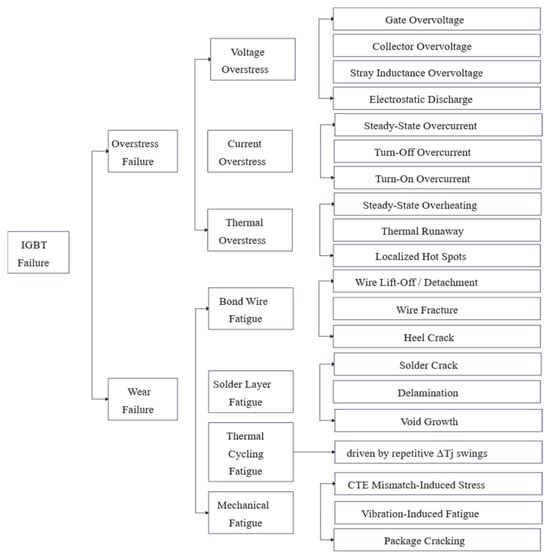
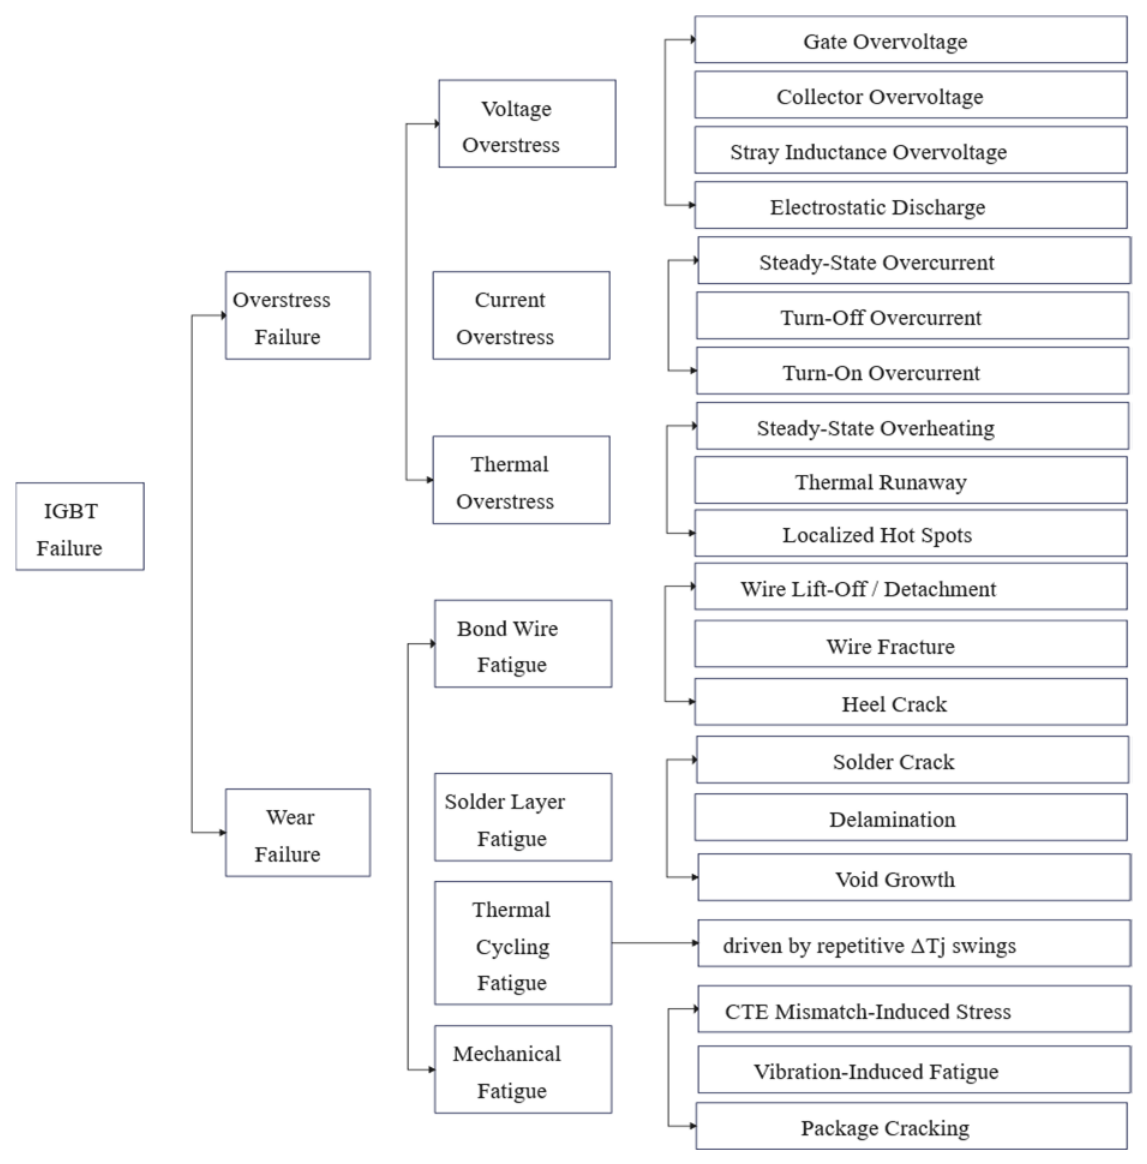
IGBT failures can generally be classified as overstress or wear-out failures [13], as illustrated in Figure 3. Overstress failures are instantaneous, and can be divided into three categories: voltage overstress, current overstress, and thermal overstress. Voltage overstress is typically caused by turn-off transients, stray inductance effects, or electrostatic discharge events, which can exceed the device’s breakdown voltage and cause immediate damage [13,14]. Current overstress occurs during short-circuit events or load faults, where the collector current exceeds the rated capability, leading to local heating and potential secondary breakdown [3,13]. Thermal overstress can be caused by steady-state overheating under prolonged high-current operation, which may exceed the maximum junction temperature; thermal runaway, caused by positive feedback between leakage current and losses; and localized hot spots resulting from non-uniform current distribution or degraded thermal interfaces.
Figure 3.
IGBT failure classification chart.
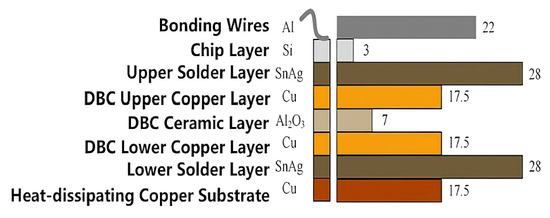
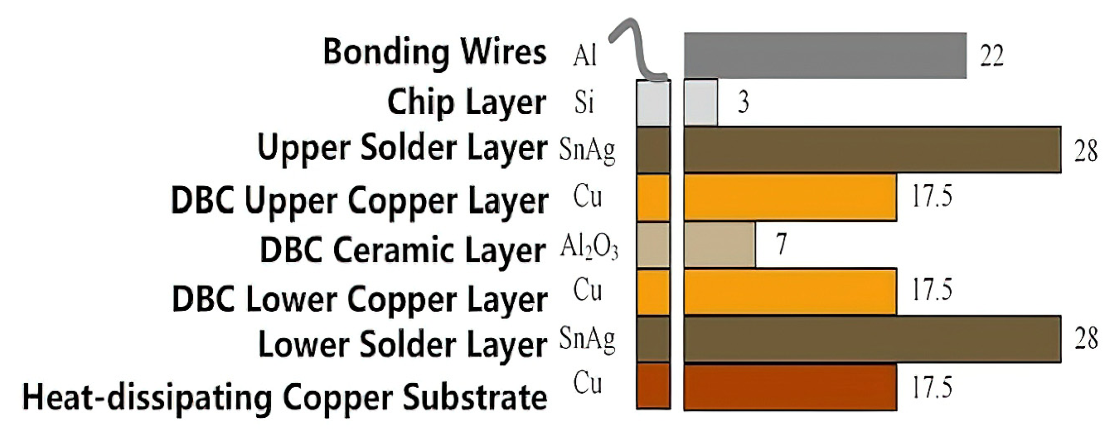
There are four main types of wear-out failure: bond wire fatigue, solder-layer fatigue, thermal cycling fatigue, and mechanical fatigue. The thermal expansion coefficients of the materials in each layer are shown in Figure 4. Bond wire and solder-layer failures mainly occur when continuous thermal stress is generated in IGBTs by coefficient mismatches under uninterrupted temperature cycles, leading to cumulative fatigue of the module until failure [15,16]; specifically, bond wire fatigue manifests as wire lift-off, wire fractures, and heel cracks, while solder-layer fatigue manifests as solder cracks, delamination, and void growth under cyclic thermal stress. Thermal cycling fatigue is driven by repetitive junction temperature swings that generate cumulative inelastic strain in the solder and interconnected materials. Mechanical fatigue arises from CTE mismatch-induced stress among packaging materials, vibration-induced fatigue during train operation, and package cracking caused by cumulative mechanical strain, all of which can compromise the module’s structural integrity and electrical insulation.
Figure 4.
Expansion coefficients of each IGBT layer.
The thermal expansion coefficients of materials in each IGBT layer are shown in Figure 4, demonstrating that the CTE values of silicon (chip), copper, ceramic (Al2O3/AlN), and solder differ significantly. Under uninterrupted temperature cycling, this CTE mismatch generates cyclic thermal stress at interfaces between layers, particularly between the DBC substrate and the heat-dissipating copper baseplate, leading to cumulative fatigue damage and ultimately to solder-layer void propagation and failure. This CTE mismatch is therefore the root cause of the thermal fatigue failure mechanism considered in this study.
2.3. IGBT Failure Performance Parameters
This paper mainly focuses on the process of wear-out failure. As the module degrades, its performance characteristics will also deteriorate. By analyzing variations in these parameters, the state of the IGBT module can be inferred, thereby enabling life prediction [17]. It should be noted that this study focuses specifically on solder-layer degradation, as this is the dominant failure mode in traction converter applications due to significant mismatches in the coefficient of thermal expansion (CTE) between the DBC substrate and the heat-dissipating copper baseplate, which generates the most severe thermal stress under power-cycling conditions. The IGBT performance characteristics most commonly used to assess this failure mode are static and dynamic parameters, void ratio, and thermal resistance.
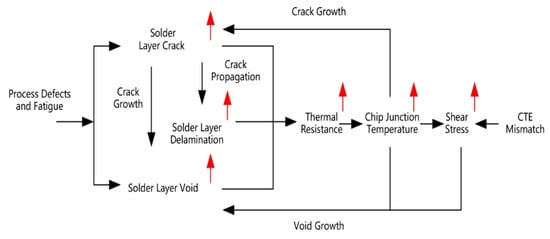
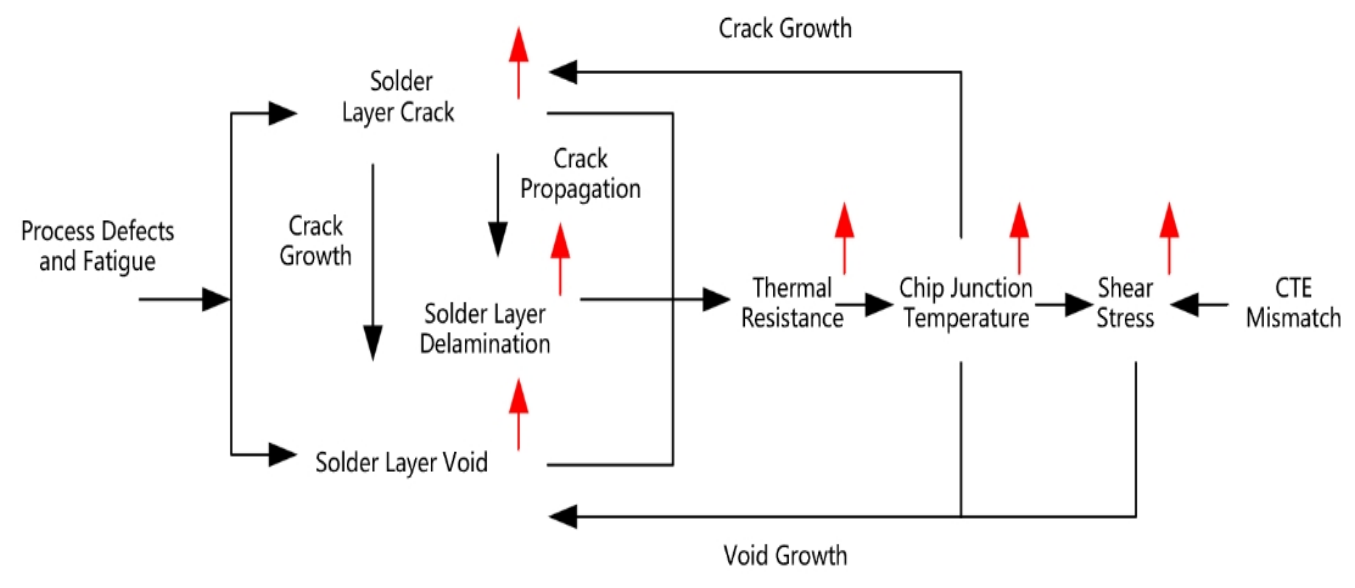
Static parameters include the collector–emitter saturation voltage drop and the gate–emitter threshold voltage, while dynamic parameters include turn-on and turn-off times. The formation of voids is mainly caused by gas leakage during reflow soldering in the packaging process [18,19]. Under cyclic thermal stress, these voids will continually initiate and propagate, thereby impairing the performance of the IGBT module. Meanwhile, continuous fluctuations in junction temperature will generate shear stress between layers, which may induce microcracks at weak points in the solder [20], thereby affecting the thermal resistance of the IGBT. The degradation follows a progressive sequence: thermal cycling generates cyclic thermomechanical strain due to coefficient-of-thermal-expansion mismatches among adjacent material layers, concentrating stress at interfacial regions and promoting microcrack initiation within the solder layer. As cycling continues, these microcracks propagate and coalesce, leading to macroscopic void growth that reduces the effective heat-conduction area and directly increases thermal resistance. This raises the junction temperature for the same power loss, which in turn accelerates crack propagation and void growth in a self-reinforcing loop. The elevated junction temperature also increases the forward voltage drop, reflecting the combined effect of these interrelated degradation mechanisms [21]. In this process, the IGBT module will fail when its temperature reaches the failure threshold [15,16]. A diagram of the solder layer’s failure process is shown in Figure 5.
Figure 5.
Solder-layer failure process.
Measurements of collector–emitter saturation voltage drops may be affected by junction temperature and collector current, while measuring the gate–emitter threshold voltage may damage the module structure. Additionally, measuring turn-on and turn-off times requires high-precision equipment [22]. In contrast, the steady-state thermal resistance of an IGBT can be more easily measured, and this method has thus been widely adopted. Although measuring the void ratio requires ultrasonic scanning equipment, it provides a more intuitive reflection of the degradation process. Therefore, to evaluate the degradation of IGBT modules, we used the void ratio of the IGBT solder layer as the measured performance characteristic. A correlation between void ratio and thermal resistance has been established in the literature, in which void growth reduces the effective heat-conduction area of the solder layer and directly increases thermal resistance. Studies have shown that junction-to-case thermal resistance increases approximately linearly with void ratio, with increases of ≥20% in thermal resistance (the test-stopping criterion in this study, following IEC 60749-34) corresponding to void-ratio levels at failure [4,8,20]. This relationship provides a physical basis for using the void ratio as a degradation indicator corresponding to the thermal resistance failure criterion. This selection is further supported by recent studies [9] which have demonstrated that void characteristics directly influence the junction temperature and thermal behavior of IGBT devices.
3. IGBT Life Assessment Method
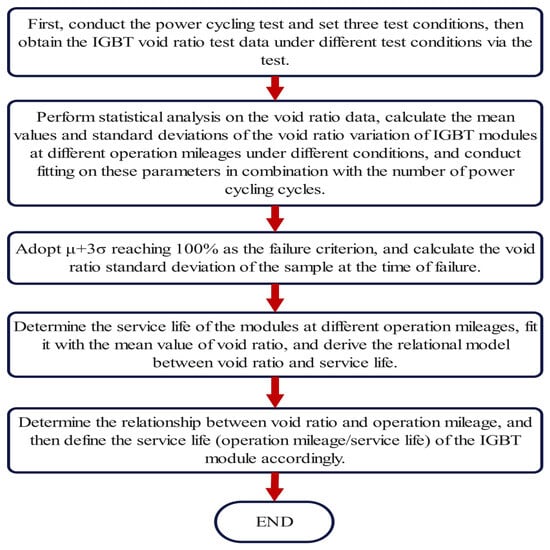
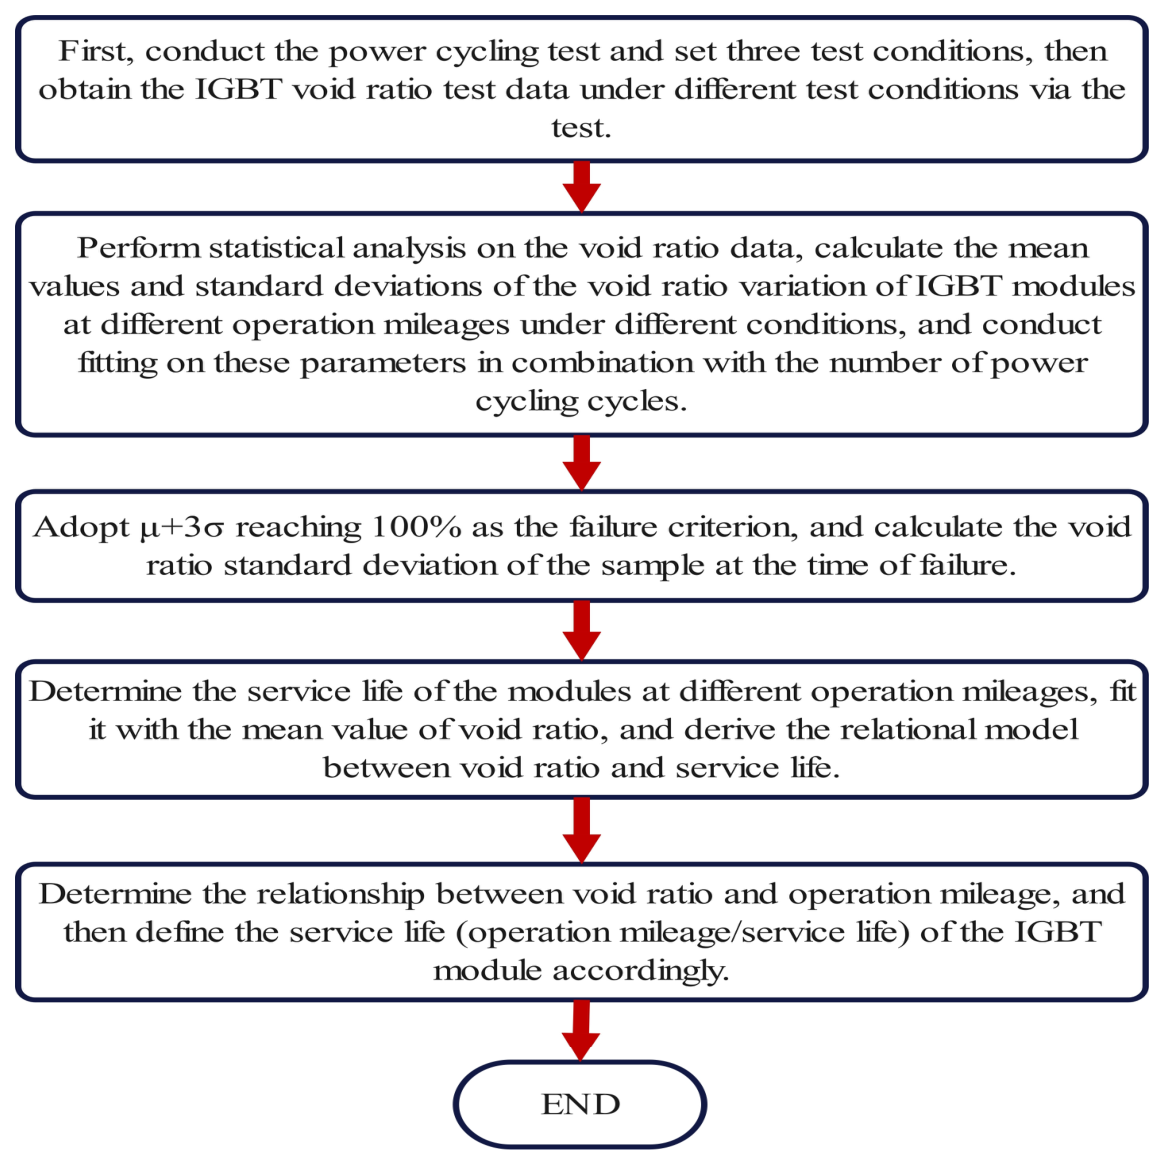
This paper adopts an IGBT life prediction method based on a cycle-number–service-time model derived from the void-ratio degradation of the solder layer. First, power-cycling tests were conducted under three conditions to obtain IGBT void-ratio data. Next, statistical analysis was performed on the void-ratio data to calculate the mean and standard deviation of the module’s void-ratio variations across different operating mileages and conditions, which were then fitted to the cycle number. The normality of the void-ratio distribution was verified using the Anderson–Darling test on the measured region-level data (p > 0.05), confirming that the normality assumption was statistically valid. The void ratio was measured in six predefined regions within each module to account for spatial variations in degradation, and the mean and standard deviation were calculated from region-level data. The failure criterion was defined as the upper limit of the void ratio μ + 3σ reaching 100% [23], i.e., the mean void ratio μ reaching the value of (100% − 3σ), where σ is the standard deviation of the void-ratio distribution. The standard deviation of the void ratio corresponding to the sample failure was calculated accordingly, and the failure threshold of the mean void ratio was then determined. Then, the service life of the module at different operating mileages was determined and fitted to the mean void ratio, yielding the relationship between the void ratio and service life. The conversion from accelerated test cycles to actual service life involves the following steps: First, the void ratio mean μ is fitted as an exponential function of power cycles N_cycle under each test condition: μ(N_cycle) = a·exp(b·N_cycle) + c. Second, the failure cycle number is obtained by substituting the failure mean μ_failure (derived from μ_failure = 100% − 3σ) into this fitted function. Third, the void ratio means of modules with different pre-existing service mileages (new, 2.4 Mkm, and 4.8 Mkm) are fitted against their corresponding service times t (0, 4, and 8 years) to obtain the service-time model: μ(t) = a·exp(b·t) + c. Finally, substituting μ_failure into this service-time model yields t_failure = ln[(μ_failure − c)/a]/b, and the operating mileage is obtained by multiplying t_failure by the annual mileage (600,000 km/year, based on 2000 km/day and 300 days/year). The detailed procedure is illustrated in the Figure 6.
Figure 6.
IGBT life assessment process based on solder-layer void rate degradation and service-time model.
The number of voids in the solder layers of modules with different service mileages follows a Poisson distribution, with the variance parameter λ of the Poisson distribution related to a device’s service mileage. As mileage increases, the value of λ gradually increases [24]. Furthermore, since the area of a single void in an aged IGBT is not affected by the areas of other voids, each one can be considered approximately mutually independent in engineering practice. According to the Central Limit Theorem, the void ratio of the heat-dissipating substrate solder layer in aged IGBTs follows a normal distribution.
- (a)
- According to the characteristics of the normal distribution and the 3σ criterion, μ + 3σ (where μ denotes the mean value and σ denotes the standard deviation) is regarded as the upper limit of the void ratio. That is, the failure initiation criterion is defined as when the upper limit of the void ratio (μ + 3σ) of the solder layer on the heat-dissipating substrate reaches 100%, meaning that the mean void ratio μ reaches the critical value of (100% − 3σ).
The 3σ criterion, also known as the Pauta Criterion, is based on the assumption that a set of test data contains only random errors. Standard deviation is obtained by calculating and processing the data, and an interval is determined with a specified probability. Errors exceeding this interval are considered to be gross errors rather than random ones, and the data containing such errors should be eliminated. For a normal distribution, the probability that values fall within the interval (μ − 3σ, μ + 3σ) is 0.9973. Thus, it can be concluded that the void ratio values are almost entirely concentrated within the interval (μ − 3σ, μ + 3σ), with the probability of values falling outside this range being less than 0.3%. Although the void ratio is inherently bounded between 0% and 100%, the probability mass of the normal distribution falling outside this interval is negligible at the degradation stages considered in this study (μ ± 3σ remains within the physical bounds up to the failure point).
- (b)
- The maximum standard deviation σ of the void ratio of the solder layer on the heat-dissipating substrate in the power-cycling test is calculated on the premise that the standard deviation σ of the void ratio of the solder layer in the 4.8 million km sample (Level 5 maintenance) basically tends towards a constant value.
To mitigate the impact of the limited parallel sample size (n = 4) on the statistical assumptions, region-level data from six predefined areas within each module were pooled to estimate μ and σ, increasing the effective sample size for each measurement interval. The high consistency of the predicted lifetimes across the three independent test conditions (CV = 0.66%) and the excellent goodness-of-fit of the degradation models (R2 > 0.97) further confirm the statistical robustness of the approach.
To establish the relationship between the mean void ratio and service life, first, the states of new products and those requiring Level 4 and Level 5 maintenance were converted to their corresponding service life. It is assumed that a high-speed train equipped with the module operates for 2000 km per day and 300 days per year. The corresponding service life is as follows: 0 years for new products; 4 years at an operating mileage of 2.4 million km; and 8 years at an operating mileage of 4.8 million km.
The relational model was obtained by fitting the above-mentioned service life to the corresponding mean void ratio. Then, the service life corresponding to the void ratio at module failure was derived using the above model calculation, and the operation mileage corresponding to the void ratio at module failure was obtained similarly, allowing the ultimate service life of the IGBT to be determined.
4. IGBT Life Assessment Results
4.1. IGBT DC Power-Cycling Aging Test
Based on our analysis of the IGBT module’s failure mechanism in Section 1, under power-cycling stress, the module undergoes varying degrees of thermal deformation due to the different material properties of each layer, ultimately leading to its failure; it can be concluded that conducting a DC power-cycling test on an IGBT module can accelerate its aging. The IGBT modules used in this study are rated at 1700 V/1200 A with a maximum junction temperature of 150 °C, matching the actual production batches used in EMU traction converters. The conditions of the DC power-cycling test are primarily reflected in the settings for the minimum and maximum junction temperatures, namely the junction temperature variation range and the average junction temperature. Based on the junction temperature range of the IGBT and the duration of the power-cycling aging test, the final parameters of the DC power-cycling aging test conditions set in this paper are as shown in Table 1. The junction temperature (Tj) was measured using the thermo-sensitive electrical parameter (TSEP) method, which relies on the linear relationship between the forward voltage drop (VCE(on)) and the junction temperature at a small sensing current. Before the power-cycling test, each module was calibrated in a thermal chamber to obtain the VCE(on)-Tj calibration curve over the temperature range of 25 °C to 150 °C. During the test, the junction temperature was monitored in real time by periodically injecting a small sensing current (100 mA) into the device during the off-state of the power cycle. The measurement accuracy was estimated at ±2 °C.
Table 1.
Condition settings in DC power-cycling aging tests.
The DC power-cycling aging tests were carried out in accordance with the conditions specified in Table 1. During the tests, the performance characteristic parameter (i.e., the void ratio of the solder layer) was measured, thereby facilitating subsequent predictive analysis of IGBT module service life. The void ratio was measured using a non-destructive ultrasonic scanning system (SAM, 100 MHz, 50 μm resolution). At each measurement interval, the modules were removed from the test bench and subjected to ultrasonic C-scan imaging over the entire area of the solder layer between the heat-dissipating substrate and the DBC substrate.
Each module was divided into six regions (N = 6) for ultrasonic C-scan measurement; when data from two modules were pooled, N = 12. The parallel sample size was maintained at n = 4 per group, as specified above.
In the cooling stage, forced-air cooling was utilized with the heatsink temperature maintained at 20 °C ± 2 °C. The heating and cooling times within each cycle were automatically controlled to achieve the target Tjmin and Tjmax (t_on ≈ t_off ≈ 30–45 s, varying by condition). The junction temperature was monitored in real time using the TSEP method based on the VCE(on)-Tj calibration curve, with a small sensing current (100 mA), yielding an estimated accuracy of ±22 °C. The tests were terminated when the thermal resistance increased by ≥20% relative to its initial value, in accordance with IEC 60749-34 for power cycling in semiconductor modules. The thermal resistance was measured at each measurement interval using a T3Ster thermal tester. From the measured cooling curves, structure functions were derived to resolve the junction-to-case thermal resistance and to separate the thermal resistance contributions of individual layers, including the solder layer. Both thermal resistance and void ratio were measured in the same modules at the same intervals; comparing these two datasets established a direct correlation between void growth and the rise in thermal resistance for the tested modules.
Considering several constraints—the cost of procuring high-power IGBT modules, the duration of the DC power-cycling aging test, ultrasonic scanning void detection expenses, and test platform resource availability—we configured four parallel samples each for new modules, fourth-level overhaul modules (2.4 Mkm), and fifth-level overhaul modules (4.8 Mkm) under each test condition.
From the perspective of current industry practices, increasingly high unit prices, long aging cycles, and non-reusable destructive testing are general drawbacks encountered when testing high-power traction-grade IGBT modules. Given the test conditions and budget constraints, a configuration of four parallel samples per group is a widely adopted and acceptable small-sample test setup for assessing the lifetime of rail transit IGBTs. The lifetime modeling approach used in this study does not rely on extreme values from individual samples; instead, it employs a mean–standard deviation statistical characterization combined with normal distribution fitting, using multi-condition and multi-aging-mileage gradient data to jointly fit the degradation trend, thereby compensating to a certain extent for the insufficient sample size within individual groups.
Due to sample size limitations, statistical sampling uncertainty remained in the mean and standard deviation of the void ratio, and may have led to a slight increase in statistical variance. However, the 3σ normal distribution boundary criterion adopted in this study inherently possesses strong statistical fault tolerance, and the high consistency among multi-condition results is sufficient to support engineering lifetime assessment and maintenance threshold formulation for EMU IGBTs. Future research may increase the number of parallel samples and aging-gradient measurement points, subject to the availability of test conditions, to further reduce statistical dispersion and enhance model generalization accuracy.
4.2. IGBT Life Assessment Result Analysis
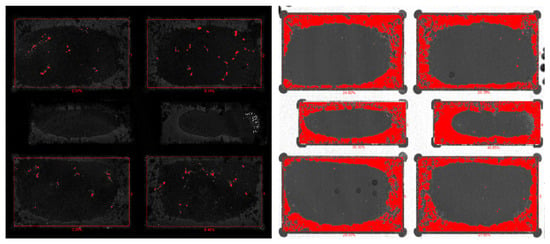
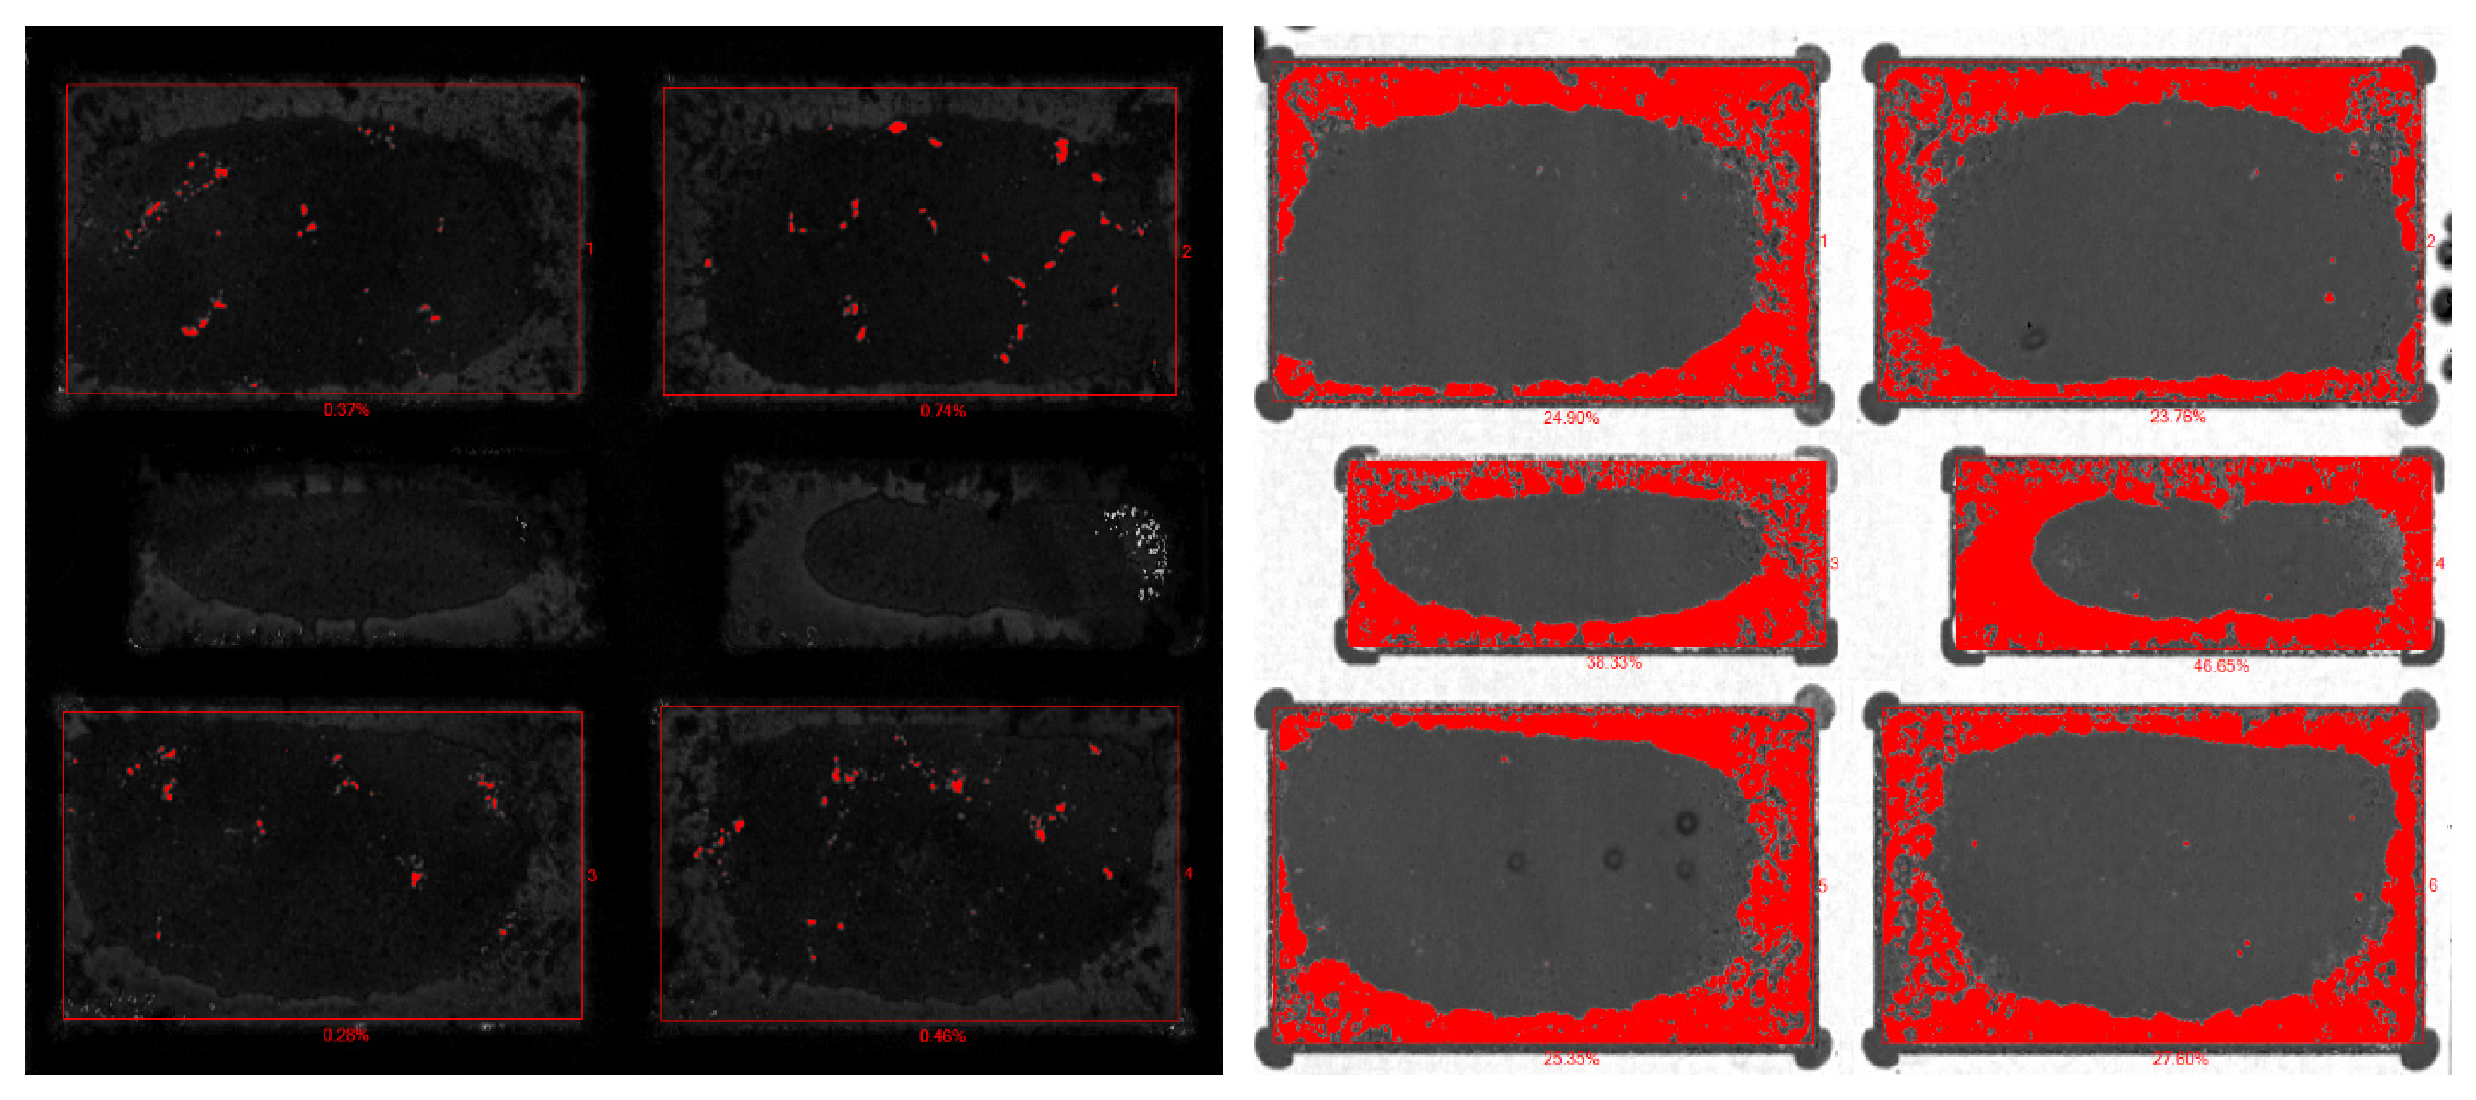
After long-term operation of the IGBT chips in the module, voids form between the heat-dissipating substrate and the DBC substrate. Figure 7 shows the degradation in the substrate solder layer’s void ratio from the start to the end of the test. The ultrasonic scanning results clearly show that the void defects between the heat-dissipating substrate and the DBC substrate become increasingly evident as the test progresses. Therefore, the void ratio of the solder layer between the two substrates was used to evaluate its service life in the IGBT module.
Figure 7.
Cavity rate degradation of substrate solder layer.
The void ratio (denoted as η, in %) induced by solder fatigue is calculated as η = (ΣA_void/A_total) × 100%, where ΣA_void is the sum of void areas within the solder layer between the substrates, and A_total is the total area of the solder layer between the substrates. As shown in Figure 7, the areas indicated by the red arrows are the void regions generated by solder fatigue, which were quantified using an automated image-processing algorithm with grayscale thresholding in which regions with acoustic impedance below a predefined threshold were classified as voids. The measurement error for void area calculation was estimated to be within ±0.5%. Statistical uncertainty due to the limited sample size is discussed in Section 4.3, and the standard deviation σ of the void ratio is used to quantify the dispersion of voids across different samples.
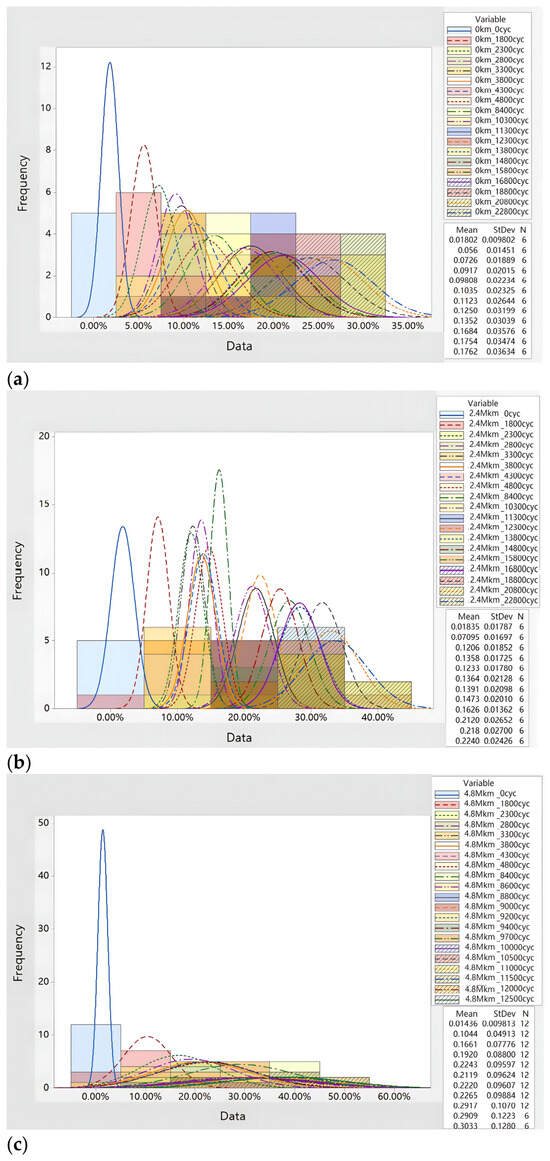
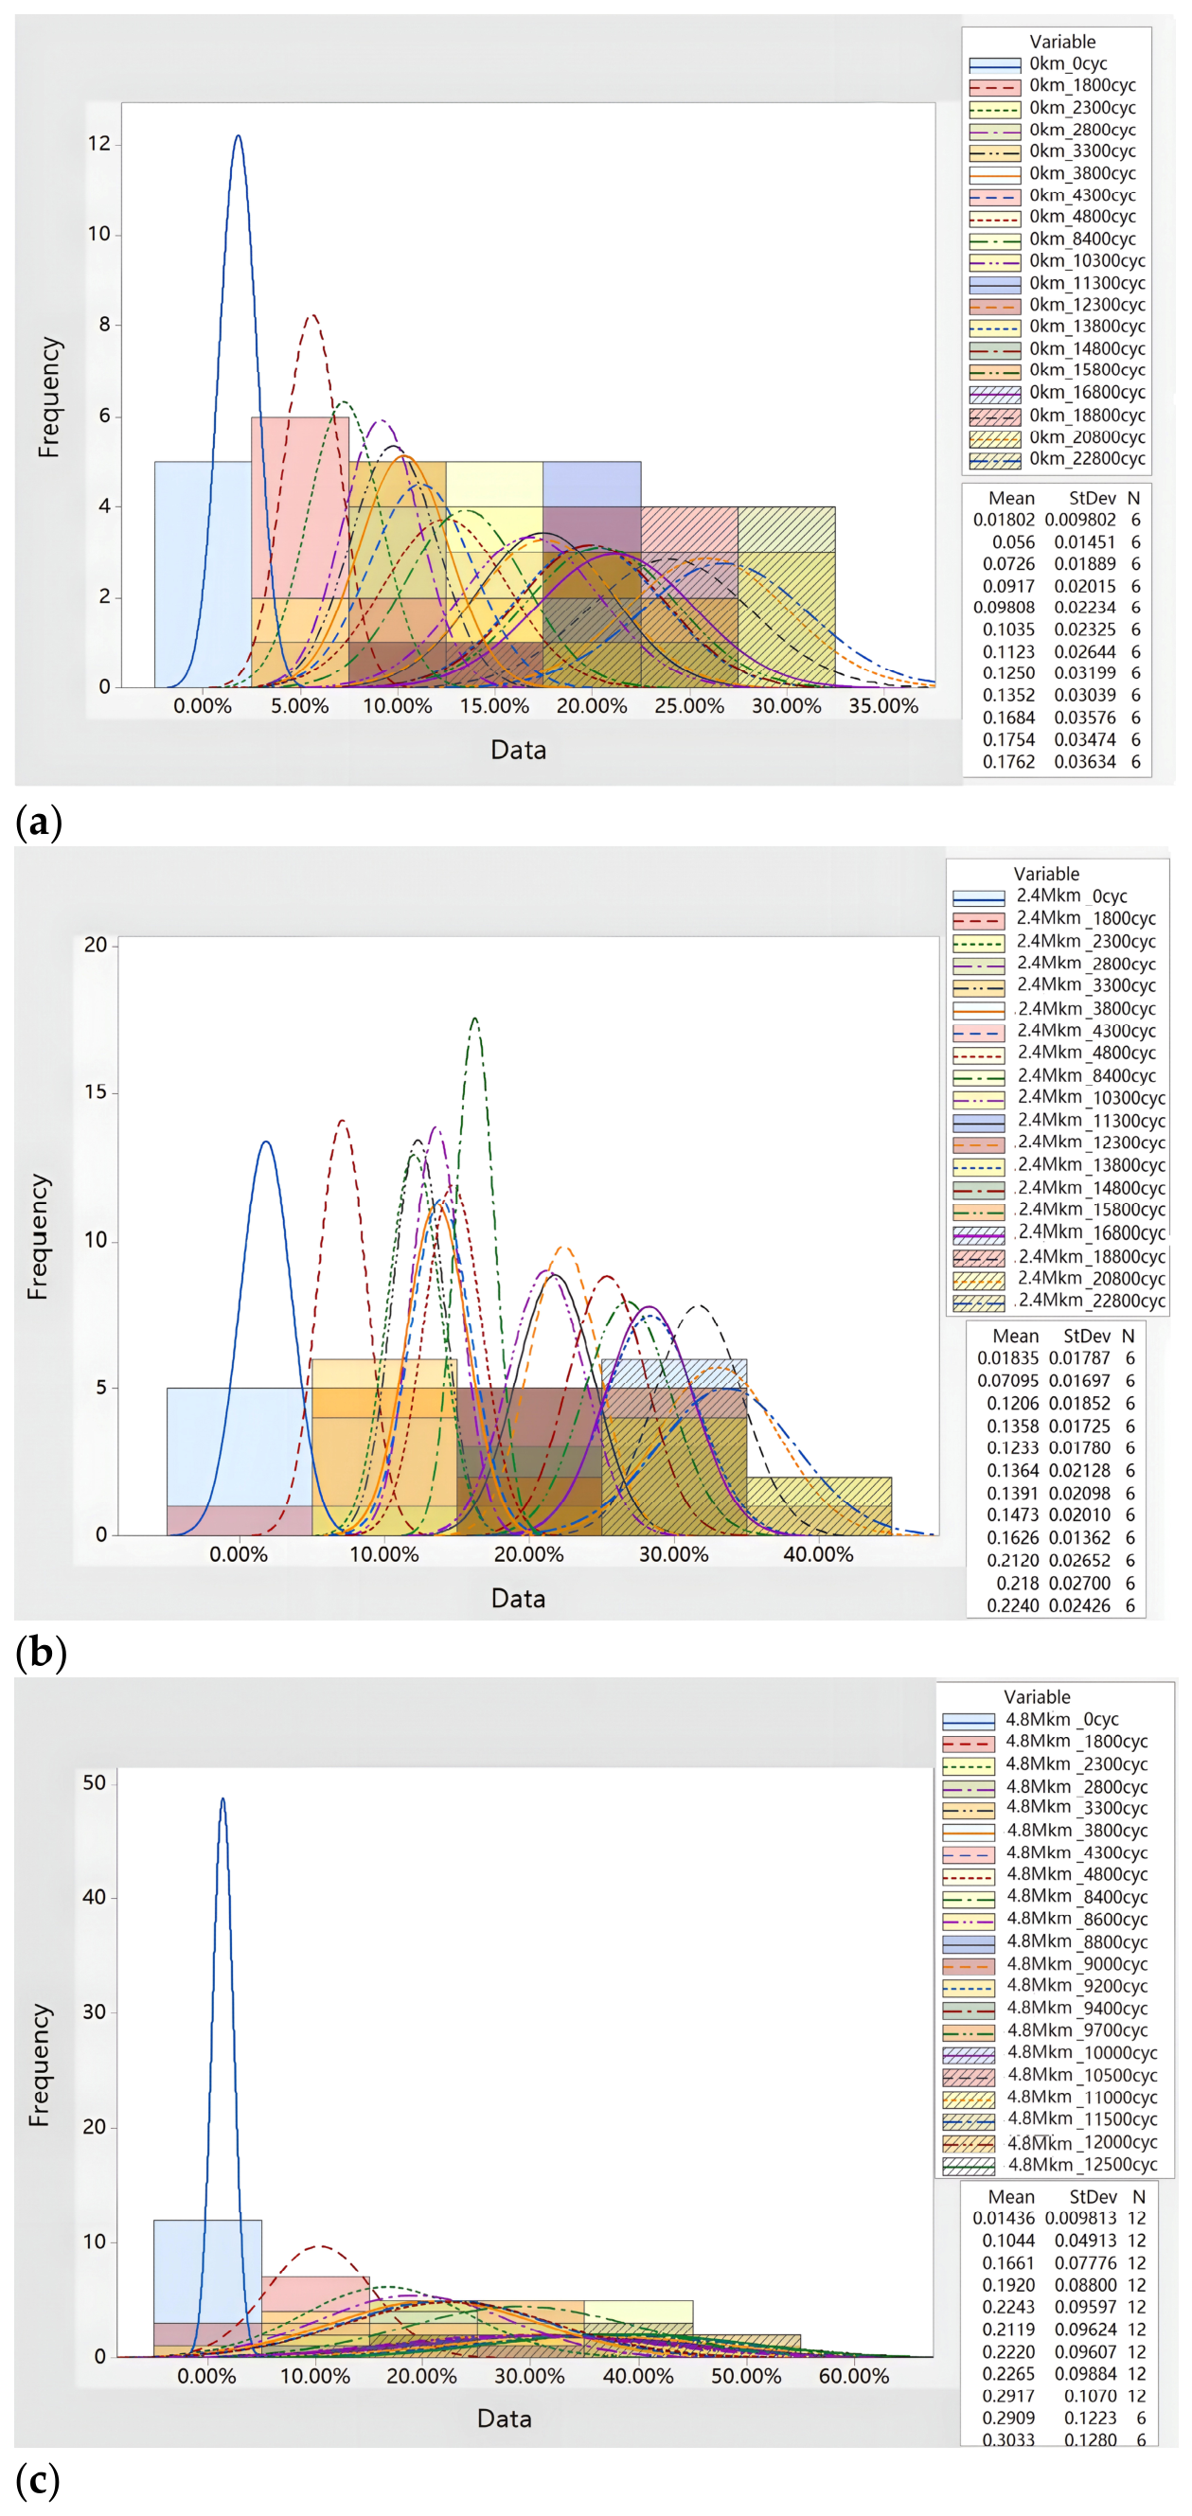
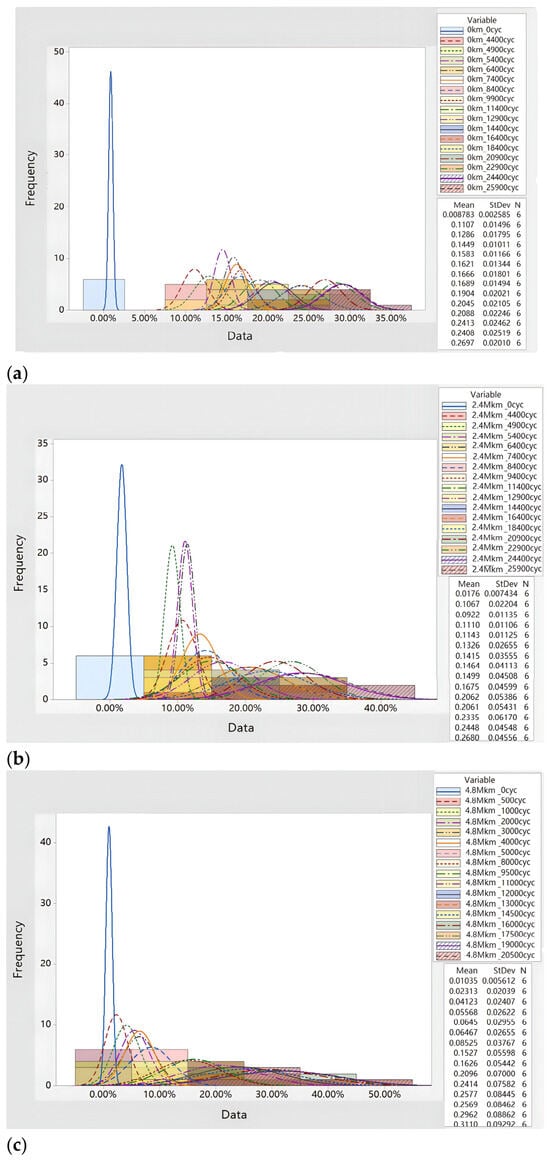
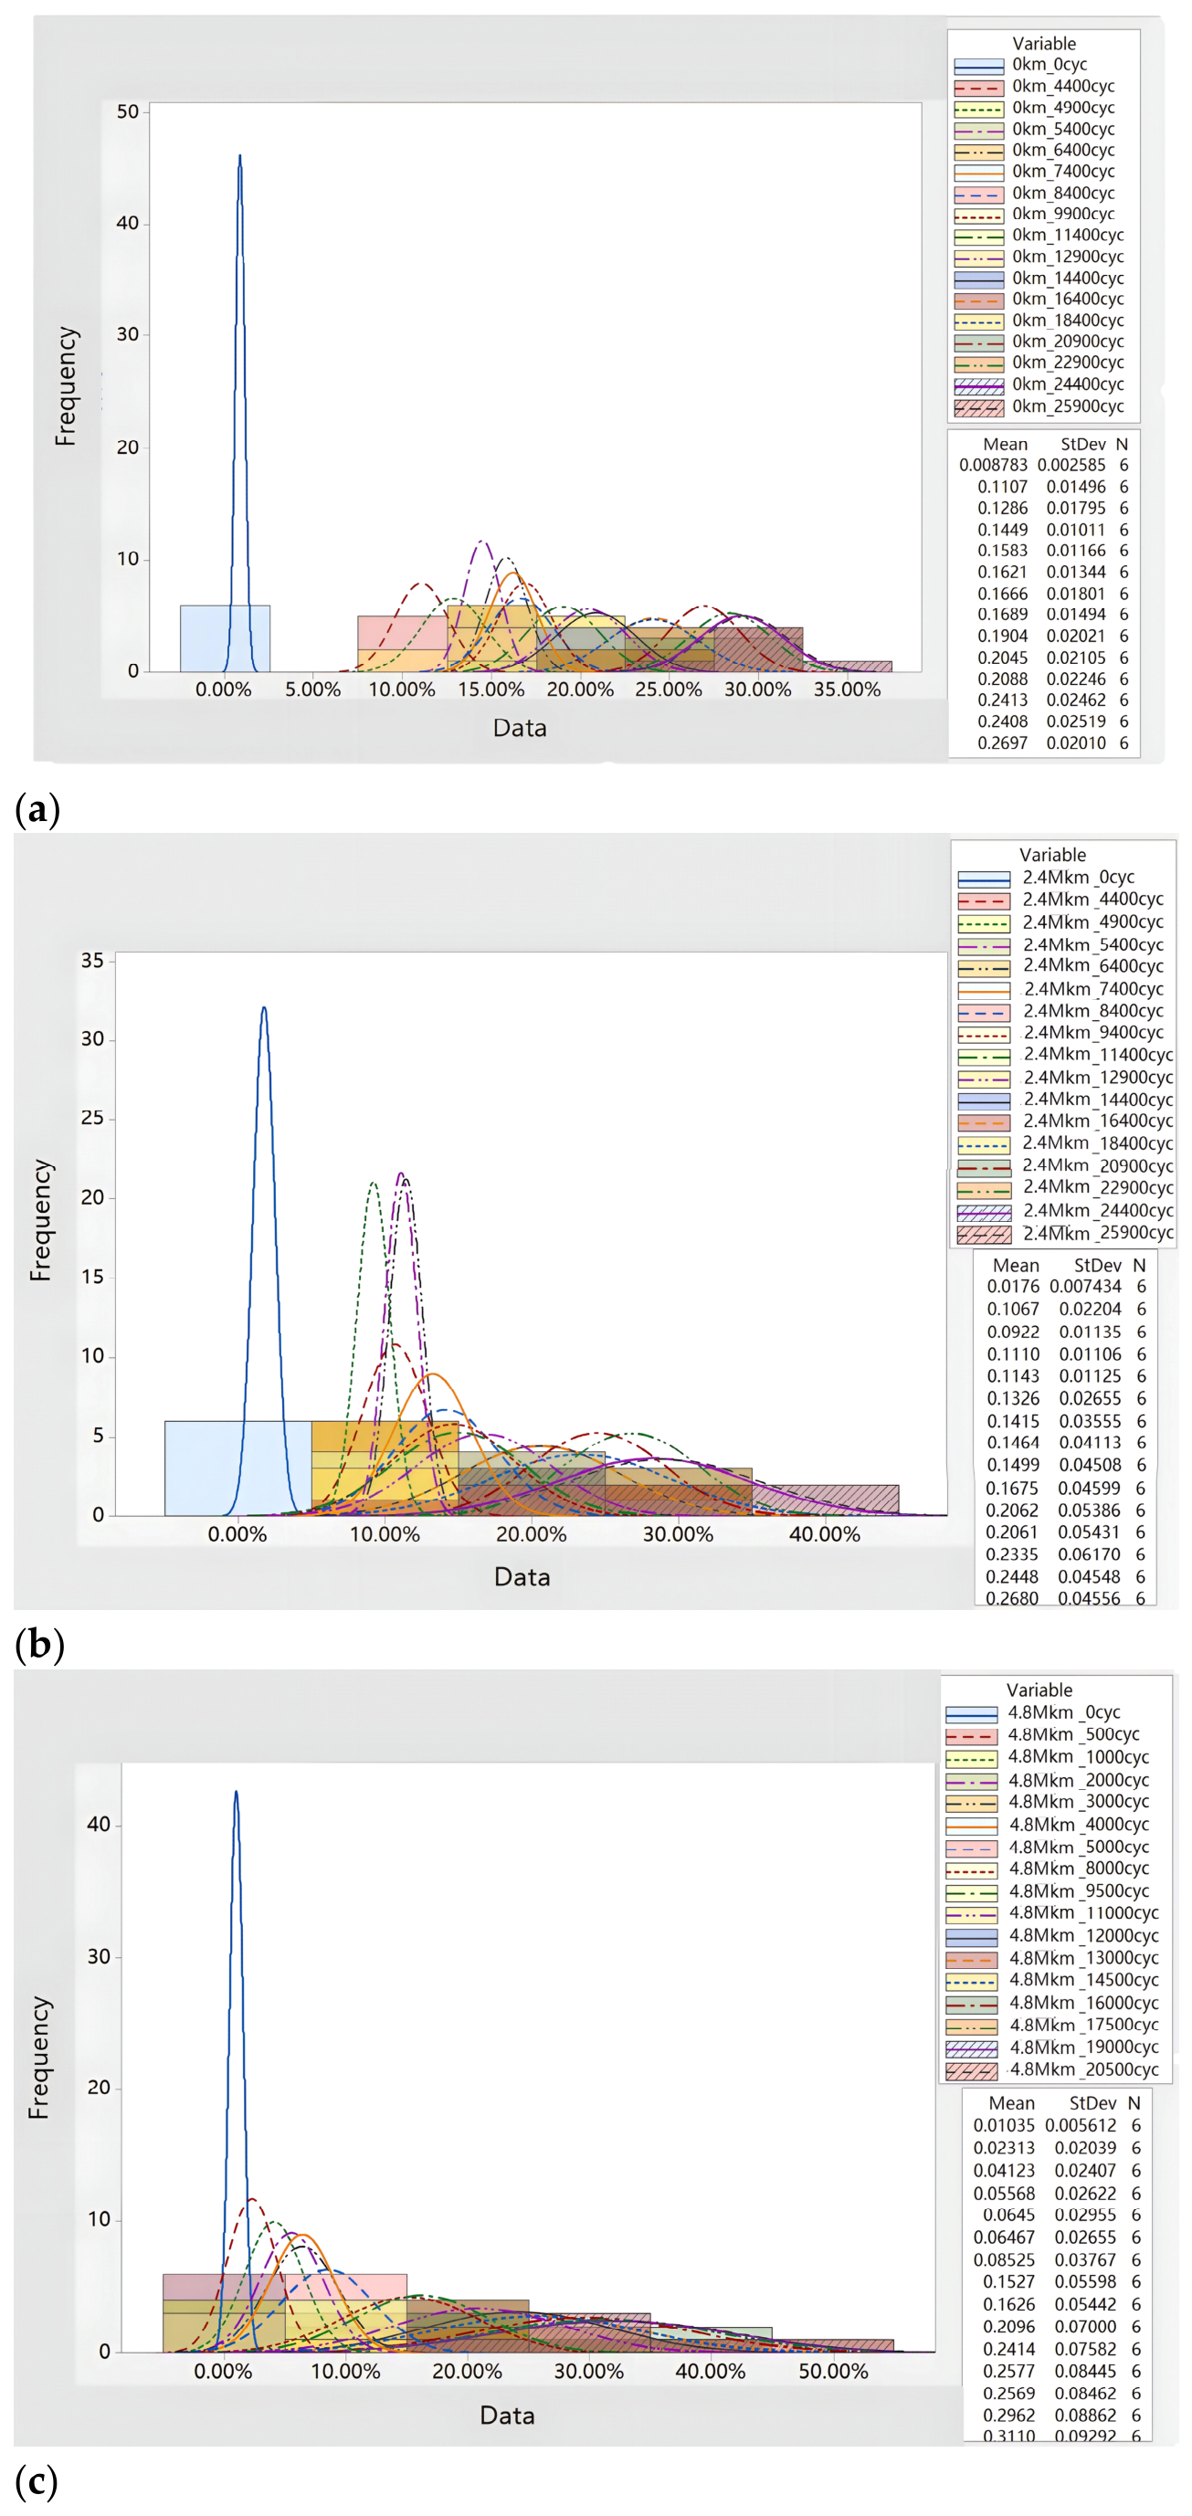
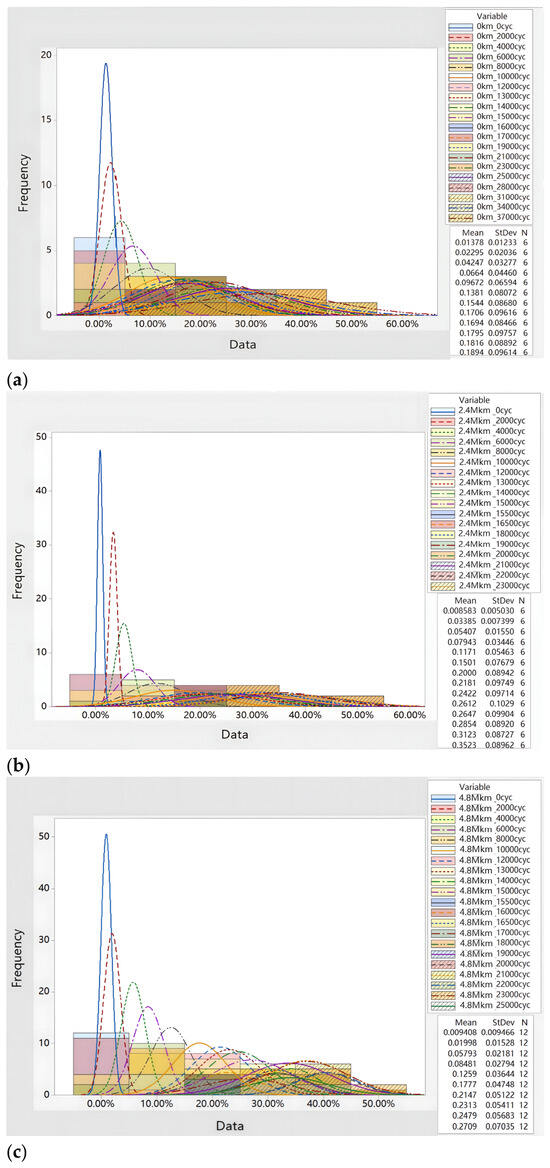
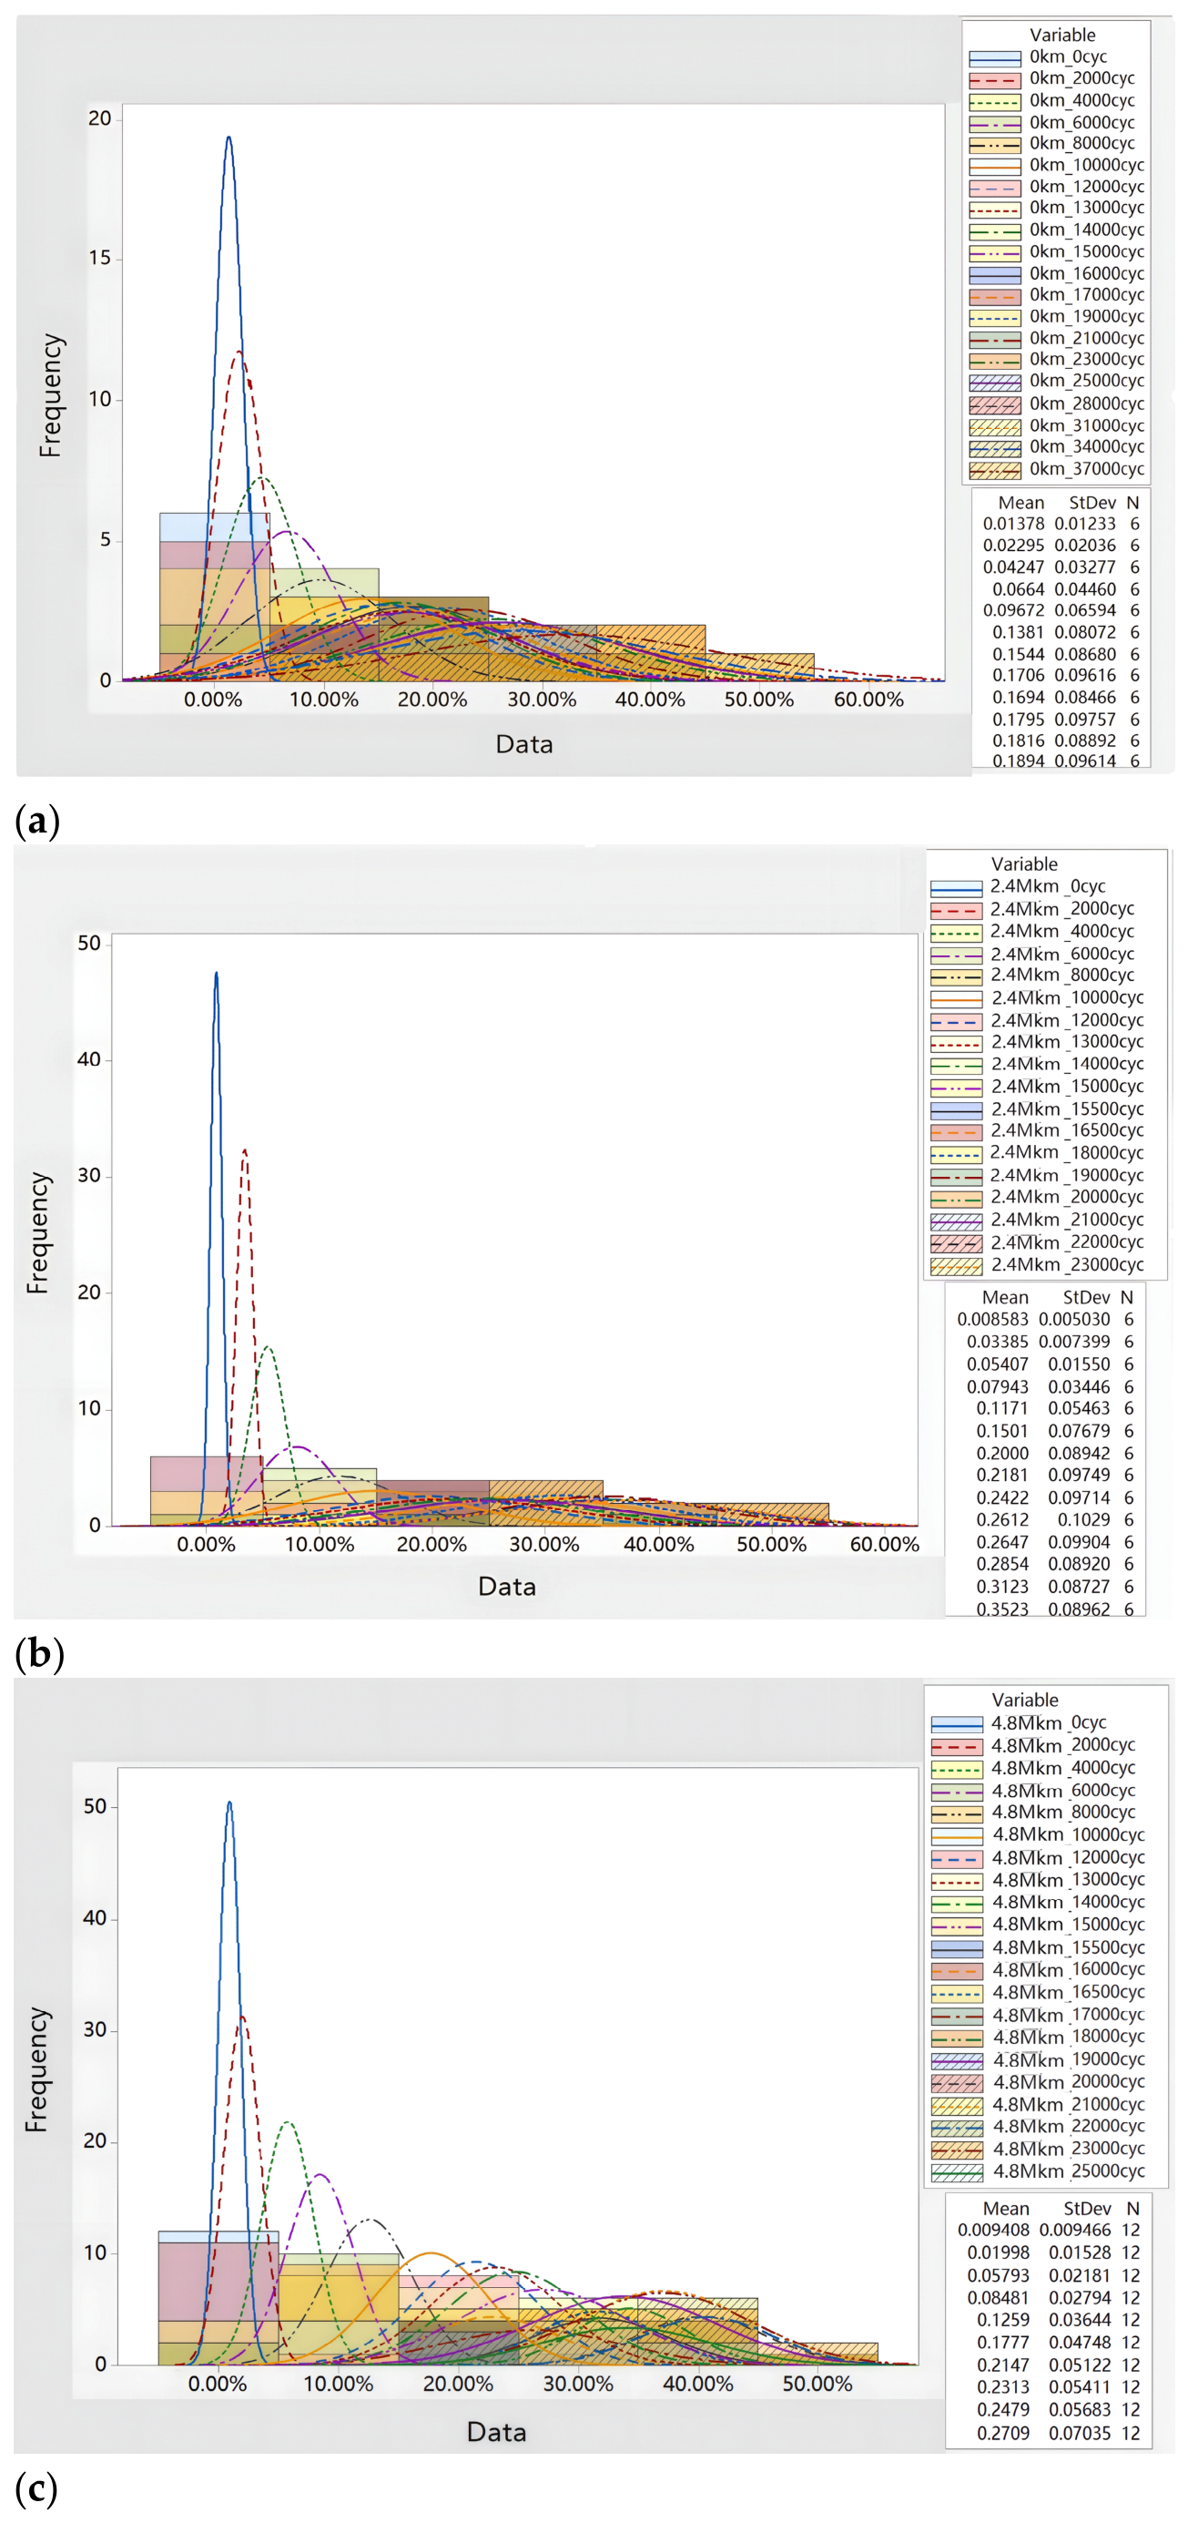
Subsequently, the samples under the three conditions were analyzed separately. The void ratio degradation trends for the solder layer on the heat-dissipating substrate in modules under each operating mileage are shown in Figure 8, Figure 9 and Figure 10.
Figure 8.
Histogram of void ratio degeneration of modules under Condition 1 (N denotes sampled regions; see Section 4.1 for details). (a) Histogram of void ratio degradation of the solder layer on the heat-dissipating substrate of the new module. (b) Histogram of void ratio degradation of the solder layer on the heat-dissipating substrate of the 2.4 million km module. (c) Histogram of void ratio degradation of the solder layer on the heat-dissipating substrate of the 4.8 million km module.
Figure 9.
Histogram of void ratio degeneration of modules under Condition 2 (N denotes sampled regions; see Section 4.1 for details). (a) Histogram of void ratio degradation of the solder layer on the heat-dissipating substrate of the new module. (b) Histogram of void ratio degradation of the solder layer on the heat-dissipating substrate of the 2.4 million km module. (c) Histogram of void ratio degradation of the solder layer on the heat-dissipating substrate of the 4.8 million km module.
Figure 10.
Histogram of void ratio degeneration of modules under Condition 3 (N denotes sampled regions; see Section 4.1 for details). (a) Histogram of void ratio degradation of the solder layer on the heat-dissipating substrate of the new module. (b) Histogram of void ratio degradation of the solder layer on the heat-dissipating substrate of the 2.4 million km module. (c) Histogram of void ratio degradation of the solder layer on the heat-dissipating substrate of the 4.8 million km module.
In our analysis of variations in the solder–void ratio between the module heat-dissipating substrate and the DBC substrate, we identified differences in the degradation rates between new modules, those that required Level 4 maintenance, and those that required Level 5 maintenance. Specifically, Level 5 maintenance modules degraded the fastest, followed by Level 4 modules, and new modules were the slowest. Meanwhile, it can be inferred that the degradation of the solder layer between the substrates is nonlinear.
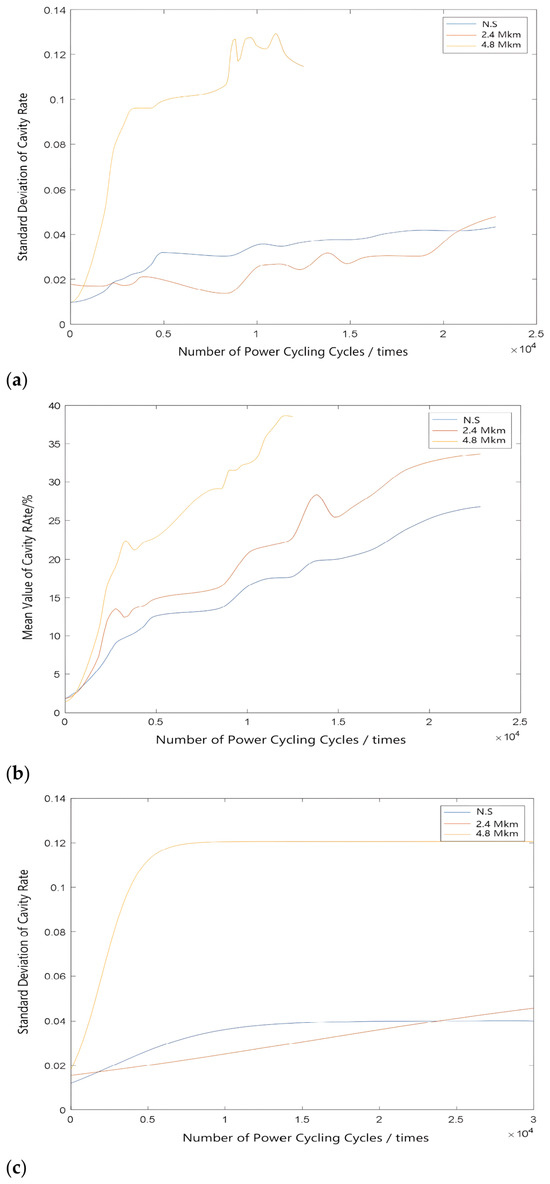
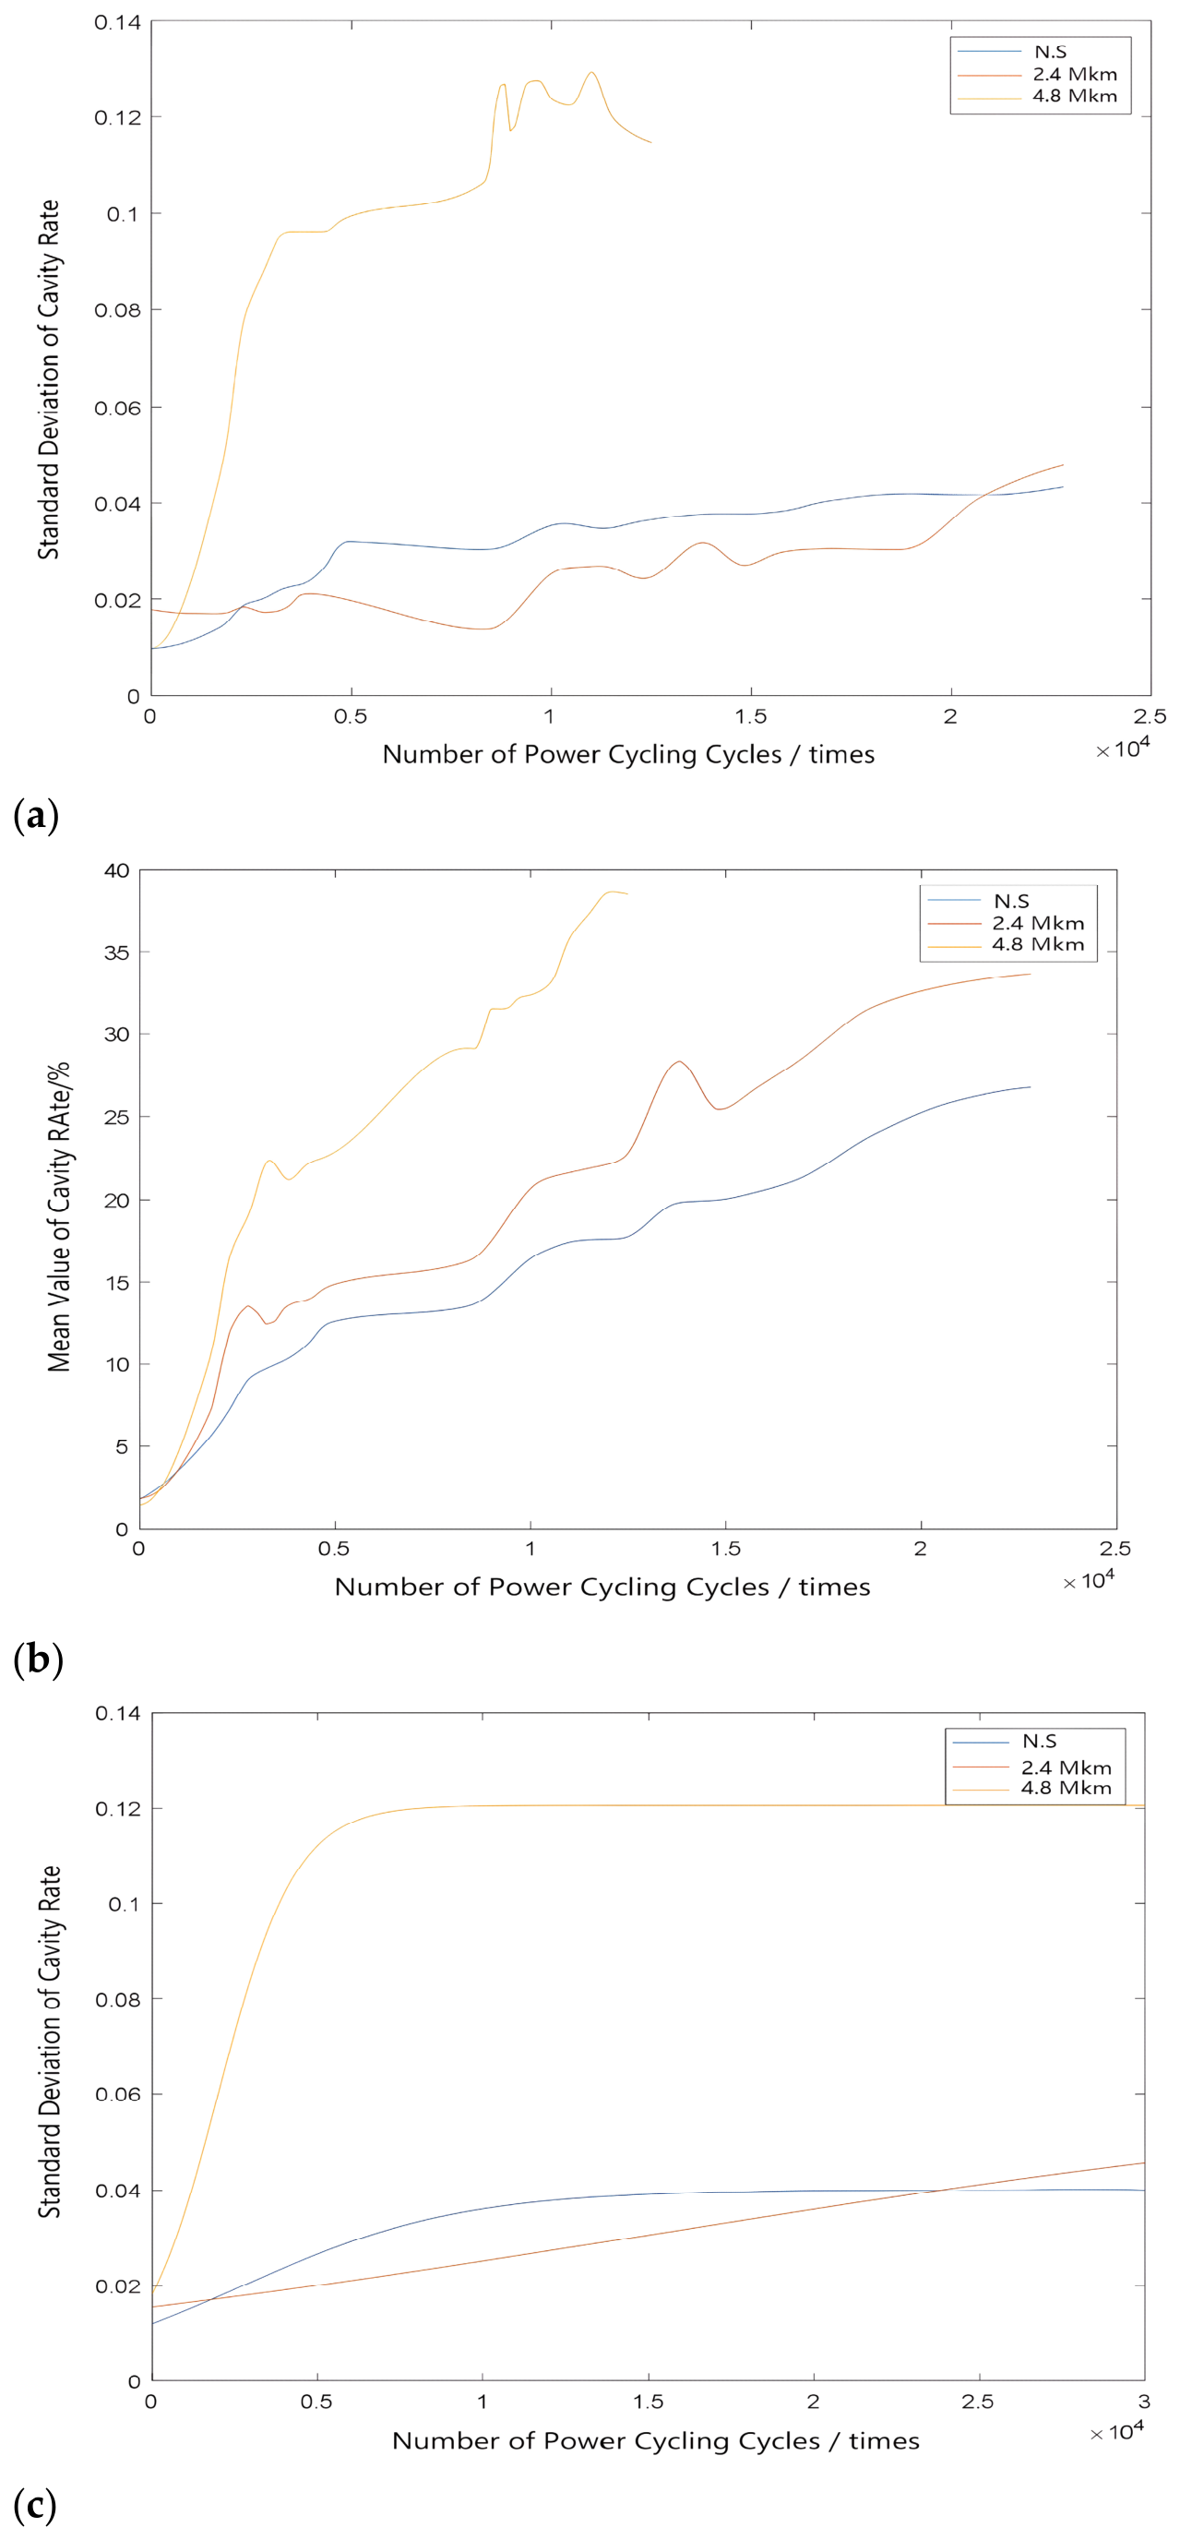
The analysis results indicate that the mean solder–void ratio increases with service life, and the standard deviation of the void ratio also rises accordingly. However, as service life increases, the growth trend of the mean solder–void ratio becomes more pronounced. In contrast, the rate of change in the standard deviation of the void ratio gradually slows. Based on the degradation law, exponential fitting was performed on the mean and standard deviation of the solder–void ratio between the heat-dissipating substrate and the DBC substrate. The fitting results for Condition 1 are presented in the Figure 11.
Figure 11.
Fitting curve of cavity rate degradation under Condition 1. (a) Actual curve of the void ratio standard deviation for the heat-dissipating substrate vs. the number of power cycles. (b) Measured curve of the void ratio mean value for the heat-dissipating substrate vs. the number of power cycles. (c) Fitted curve of the void ratio standard deviation for the heat-dissipating substrate vs. the number of power cycles.
The goodness-of-fit of the exponential models is as follows. For the void ratio mean μ vs. power-cycling cycles, the determination coefficients R2 are 0.9901, 0.9929, and 0.9908 for Conditions 1, 2, and 3, respectively. For the void ratio standard deviation σ vs. cycles, the R2 values are 0.9896 (new modules), 0.9772 (2.4 Mkm modules), and 0.9892 (4.8 Mkm modules). For the service-time model relating μ to actual service years, R2 = 0.9987. These high R2 values confirm the excellent fitting accuracy of the chosen models.
As the standard deviation σ of the void ratio of the solder layer on the heat-dissipating substrate in the 4.8 million km sample basically stabilized at a constant value, the maximum standard deviations σ in the power-cycling tests under the three conditions are 12.06%, 10.37%, and 11.3%, respectively.
When the upper limit of the void ratio of the solder layer on the heat-dissipating substrate (μ + 3σ) reaches 100%, the corresponding mean values μ under the three conditions are calculated as 63.82%, 68.89%, and 66.1%, respectively (derived from μ = 100% − 3σ, where σ = 12.06%, 10.37%, and 11.3% for the three conditions). This means that when the mean void ratio reaches the above values, some devices have reached the end of their service life.
Exponential fitting was performed on the mean void ratio of the solder layer between the heat-dissipating substrate and the DBC substrate, combining the service life and operation mileage of samples with varying operation mileage. The resulting relational models are shown in Table 2.
Table 2.
Model of the relationship between the average void ratio, service life, and mileage under three conditions (R2 = 0.9987 for all models).
Using the aforementioned results and the calculated mean value of the solder degradation trend, the corresponding service life and operating mileage of the solder layer between the substrates at failure under the three conditions can be obtained, as shown in the Table 3.
Table 3.
Service life and operating mileage under different conditions.
It should be noted that the failure criterion employed in this study (μ + 3σ = 100%) is equivalent to defining the 3σ upper bound of the void-ratio distribution as the failure threshold. This criterion is derived from the statistical properties of the void-ratio distribution (a normal distribution) and is consistent with engineering practice, where a solder layer is considered to have failed when its upper bound on the void ratio approaches 100% (complete delamination). The use of the 100% upper-bound criterion ensures that the lifetime prediction is conservative and statistically robust, as the mean void ratio of approximately 64–69% corresponds to the extensive solder layer degradation observed in the ultrasonic C-scan images (see Figure 7).
The table shows that the calculated service life and operating mileage across the three conditions do not differ significantly.
Their mathematical expectation is calculated and taken as the ultimate service life, yielding 29.66 years (17.8 million km). The coefficient of variation (CV) among the three condition-wise predictions is only 0.66%, indicating high consistency across different thermal stress conditions. Based on the three independent predictions (29.48, 29.86, and 29.66 years), the standard error of the mean is 0.113 years, and the 95% confidence interval for the predicted lifetime is 29.66 ± 0.49 years, corresponding to approximately 29.17 to 30.15 years (17.50 to 18.09 million km). To further quantify the uncertainty arising from the limited number of parallel samples used (n = 4 per group), a bootstrap resampling analysis was performed with 10,000 iterations on the pooled region-level data (N = 12) for each measurement interval. The resulting 95% confidence interval is consistent with the t-distribution-based estimate above. These results confirm that despite the limited number of parallel samples, region-level data aggregation and multi-condition validation yield statistically credible lifetime estimates for engineering applications.
4.3. Discussion
The experimental results presented above reveal several important physical insights into the degradation behavior of the IGBT solder layer. First, the exponential degradation of the void ratio with increasing power cycles reflects the cumulative fatigue damage in the solder layer under cyclic thermal stress. At the material level, this behavior is consistent with the classical Coffin–Manson fatigue law, in which the accumulation of inelastic strain during each thermal cycle leads to progressive crack initiation and propagation in the solder, eventually manifesting as void growth observed in ultrasonic scanning images.
Second, as shown in Figure 8, Figure 9 and Figure 10, the degradation rate of the void ratio was fastest for the 4.8 million km modules, followed by the 2.4 million km modules, and slowest for the new modules. This indicates that the solder layer has already accumulated initial fatigue damage during field service, which accelerates subsequent degradation under accelerated testing. This observation confirms the “memory effect” of cumulative damage, suggesting that the module’s prior service history significantly influences its remaining useful life under continued thermal cycling.
Third, the predicted lifetimes under the three test conditions (29.48, 29.86, and 29.66 years, respectively) show remarkably small deviation (<2%), despite the varying junction temperature swings (ΔTj = 110 °C, 100 °C, and 90 °C, respectively). This suggests that, within the tested temperature range and under the specific conditions of this study, the void-degradation behavior is primarily influenced by the cumulative number of thermal cycles rather than by the magnitude of the junction temperature swing. Physically, each thermal cycle produces a temperature fluctuation that induces cyclic thermomechanical stress in the solder layer due to CTE mismatches among adjacent materials; the accumulation of this stress over repeated cycles drives fatigue damage progression, regardless of moderate variations in cycle amplitude. However, this observation should be interpreted with caution, as the limited sample size (n = 4 per group) and the relatively narrow ΔTj range (90–110 °C) may not fully capture the temperature dependence of the degradation process. With these qualifications, this observation offers preliminary guidance for mission profile-based lifetime prediction, suggesting that cycle counting methods may be prioritized in the future development of models for this failure mechanism.
4.4. Comparative Analysis of Prediction Results from Different Lifetime Models
Based on the actual operating mission profile of the EMU traction converter IGBT and the DC power-cycling aging test conditions measured in this study, three classical IGBT lifetime analytical models—the modified Coffin–Manson model, the LESIT model, and the Bayerer multi-parameter lifetime model—were reproduced and calculated. Each model employed industry-recognized standard formulas and typical parameters recommended in the literature [7,25]. Key characteristic quantities, including the IGBT module average junction temperature, junction temperature fluctuation amplitude, and power cycle conduction duration, were extracted from the electro-thermal characteristics of the traction converter used in this study and substituted into the corresponding lifetime models to solve for the device fatigue failure cycle number. Subsequently, by combining the conversion relationships of the EMU average daily operating mileage and annual operating days, the failure cycle number was converted into equivalent service years and cumulative operating mileage. The prediction results of the three traditional models were quantitatively benchmarked against the lifetime assessment model established in this study, which is based on the normal-distribution statistical characteristics of the solder-layer void ratio and adopts the 3σ failure criterion. Comparative analysis was conducted from the perspectives of prediction numerical deviation, lifetime dispersion characterization capability, micro-scale degradation mechanism correlation, and engineering operating-condition adaptability. The comparison results are shown in Table 4.
Table 4.
Comparison of lifetime predictions from different models.
The formulas and key parameters of the three comparative models are as follows. The modified Coffin–Manson model can be expressed as
where (calibrated using Condition 1 as reference), [7,8], and . The LESIT model can be expressed as
where , , and , as reported in the LESIT project [25]. The Bayerer model can be expressed as
where , , , , , , and [7]. The input thermal parameters for all three models (, , , and ) were extracted from the power-cycling test conditions presented in Table 1.
The predictions of all three traditional models show notable deviations from the proposed method. The Coffin–Manson model exhibits the largest relative difference of +72.7%, followed by the LESIT model at +36.8%, while the Bayerer model shows the smallest relative difference at +19.4%. These differences reflect the distinct physical assumptions and parameterizations of each model. In contrast, the normal distribution method proposed in this study is based on directly measured void-degradation data, providing a more accurate correlation with the actual solder-layer failure mechanism. However, it should be emphasized that the reported deviations represent model-to-model differences rather than prediction errors, as independent experimental lifetime data are not yet available for direct validation. Future work will focus on validating these predictions against field failure data.
5. Conclusions
As the core of an electric multiple unit (EMU), the traction power supply system is directly linked to the EMU’s overall operating status and is a key guarantee of its safe and stable operation, and the traction converter’s reliability and service life directly affect the system’s normal operation. Therefore, predicting the service life of its key components holds significant practical importance. Starting with the internal structure and failure mechanism of the Insulated-Gate Bipolar Transistor (IGBT), a key component of the traction converter, we propose an IGBT service life prediction method based on degradation trends in the solder-layer void ratio and a service-time model and analyze its predictions for the IGBT power module. The following conclusions are drawn:
- (1)
- Targeting the IGBT module of a traction converter, we propose a prediction method based on the degradation trend of the solder-layer void ratio and the service-time model.
- (2)
- Based on the data from the power-cycling aging test, the void ratio of the IGBT module’s solder layer is adopted as the performance characteristic parameter. Using the failure threshold, service life prediction is performed for the module using the method proposed in this paper. It is determined that the service life of the IGBT, the key component of the traction converter studied in this paper, is 29.66 years under actual operating conditions, with a maximum operation mileage of 17.8 million km.
These prediction results can guide future EMU maintenance work. However, several limitations of the present study should be acknowledged. First, the proposed method is based on a single degradation indicator (void ratio) and does not yet account for other failure mechanisms, such as bond wire fatigue and chip degradation. This simplification is justified by the dominant role of solder-layer fatigue in this application, as discussed in Section 2.3. Second, the sample size is relatively small due to the high cost and long duration of power-cycling aging tests, which may affect the statistical robustness of the prediction. To compensate for this limitation, region-level data from multiple modules (six regions per module) were pooled to enhance the statistical robustness of estimates of the mean and standard deviation of void-ratio degradation. Third, the lifetime prediction is specifically applicable to the operational profile of the investigated EMU type and may not be directly generalizable to other train types without recalibration. Fourth, the failure threshold (μ + 3σ = 100%) is set based on the literature and engineering experience, and further validation with field failure data will be pursued when such data become available. Regarding the statistical assumptions, the 3σ criterion provides a conservative upper bound that naturally accounts for the bounded nature of the void ratio, with the failure point defined as the moment when this upper bound reaches the physical limit of 100%. The normality assumption is supported by the Anderson–Darling test results (p > 0.05) and the Central Limit Theorem applied to the region-level pooled data, which, when combined, justify using the μ + 3σ failure criterion despite the limited number of parallel samples. These limitations are recognized as directions for future research.
Author Contributions
Conceptualization, C.P.; methodology, C.P.; validation, C.P. and J.L.; formal analysis, C.P. and J.L.; investigation, C.P., J.L., X.F., N.J. and Z.Z.; data curation, C.P., J.L. and X.F.; writing—original draft preparation, C.P.; writing—review and editing, C.P., J.L., X.F., N.J., Z.Z. and Y.L.; visualization, C.P.; supervision, C.P. All authors have read and agreed to the published version of the manuscript.
Funding
This research received no external funding.
Data Availability Statement
The original contributions presented in this study are included in the article. Further inquiries can be directed to the corresponding author.
Conflicts of Interest
Authors Xuan Feng, Nan Jia and Zhiyuan Zhang were employed by the company CRRC (China). The remaining authors declare that the research was conducted in the absence of any commercial or financial relationships that could be construed as a potential conflict of interest.
References
- Ge, X.; Xie, D.; Deng, Q. Overview of fault diagnosis and fault-tolerant control methods for vehicular traction converter system. J. Power Supply 2020, 18, 28–44. (In Chinese) [Google Scholar]
- Wang, H.; Liserre, M.; Blaabjerg, F.; Rimmen, P.d.P.; Jacobsen, J.B.; Kvisgaard, T.; Landkildehus, J. Transitioning to Physics-of-Failure as a Reliability Driver in Power Electronics. IEEE J. Emerg. Sel. Top. Power Electron. 2014, 2, 97–114. [Google Scholar] [CrossRef]
- Yang, S.; Bryant, A.; Mawby, P.; Xiang, D.; Ran, L.; Tavner, P. An Industry-Based Survey of Reliability in Power Electronic Converters. IEEE Trans. Ind. Appl. 2011, 47, 1441–1451. [Google Scholar] [CrossRef]
- Bao, Y.; Jiang, Q. Summary of Life Prediction and Failure Analysis of IGBT Modules Based on Accelerated Aging Test. In Proceedings of the 2019 22nd International Conference on Electrical Machines and Systems (ICEMS), Harbin, China, 11–14 August 2019. [Google Scholar]
- Lin, S.; Fang, X.; Lin, F. Mission profile-based lifetime prediction for IGBT modules in traction inverter application. China Saf. Sci. J. 2019, 29, 56–61. [Google Scholar]
- Wang, L.; Zhou, M.; Guo, M.; Sha, Y.; Diao, L.; Dongye, Z.; Jiang, X.; Xu, C. A Mapping Method of Solder Layer Fatigue Stress and Remaining Useful Life for IGBT Module in a Traction Converter Based on the Mission Profile. Proc. CSEE 2022, 42, 269–278. [Google Scholar]
- Bayerer, R.; Hermann, T.; Licht, T.; Lutz, J.; Feller, M. Model for Power Cycling Lifetime of IGBT Modules-various Factors Influencing Lifetime. In Proceedings of the 5th International Conference on Integrated Power Electronics Systems (CIPS), Nuremberg, Germany, 11–13 March 2008; pp. 1–6. [Google Scholar]
- Jiang, N.; Chen, M.Y.; Xu, S.Y.; Lai, W.; Gao, B.; Chen, Y.G. Lifetime Evaluation of Solder Layer in an IGBT Module under Different Temperature Levels. In Proceedings of the 2016 IEEE 8th International Power Electronics and Motion Control Conference (IPEMC-ECCE Asia), Hefei, China, 22–26 May 2016; pp. 3137–3141. [Google Scholar]
- Wei, Y.; Yang, X.; Wu, P.; Liu, G. A Data-Driven Approach to Predict the Impact of Void Characteristics on IGBT Junction Temperature. IEEE Trans. Electron Devices 2026, 73, 2106–2115. [Google Scholar] [CrossRef]
- Feng, X. Power Traction AC Drive and Its Control System; Higher Education Press: Beijing, China, 2009. [Google Scholar]
- Oh, H.; Han, B.; McCluskey, P.; Han, C.; Youn, B.D. Physics-of-Failure, Condition Monitoring, and Prognostics of Insulated Gate Bipolar Transistor Modules: A Review. IEEE Trans. Power Electron. 2015, 30, 2413–2426. [Google Scholar] [CrossRef]
- Chen, J.; Liu, Y.; Liu, B.; Wu, Y. Structure and Temperature Dependence of Solder Layer and Electric Parameters in IGBT Modules. Micromachines 2025, 16, 1023. [Google Scholar] [CrossRef] [PubMed]
- Lu, G. A Study on the Lifetime Prediction Technique for the IGBT Power Module. Master’s Thesis, Chongqing University, Chongqing, China, 2013. [Google Scholar]
- Ahmad, F.; Vaccaro, L.; Nkembi, A.A.; Marchesoni, M.; Portesine, F. Surge Current Analysis of High-Power Press Pack Diodes: Junction Temperature and Forward-Voltage Modeling. Electronics 2025, 14, 4899. [Google Scholar] [CrossRef]
- Bouarroudj, M.; Khatir, Z.; Ousten, J.P.; Lefebvre, S. Temperature-level effect on solder lifetime during thermal cycling of power modules. IEEE Trans. Device Mater. Reliab. 2008, 8, 471–477. [Google Scholar] [CrossRef]
- Chen, M.; Chen, Y.; Gao, B.; Lai, W.; Huang, T.; Xu, S.Y. Lifetime evaluation of IGBT module considering fatigue accumulation of solder layers. Proc. CSEE 2018, 38, 6053–6061. (In Chinese) [Google Scholar]
- Haque, M.S.; Choi, S.; Baek, J. Auxiliary Particle Filtering-Based Estimation of Remaining Useful Life of IGBT. IEEE Trans. Ind. Electron. 2018, 65, 2693–2703. [Google Scholar] [CrossRef]
- Wang, Y.; Zhang, X.; She, S. Study on the Influence of the Deformation of Solder Layer on the Resistance of IGBT. Electron. Prod. Reliab. Environ. Test. 2015, 33, 20–23. [Google Scholar]
- Zheng, G.; Chen, S.; Hu, J. Effects of Void Area in Solder Layer on Resistance and Thermal Impedance of Power Devices. Semicond. Technol. 2010, 35, 1059–1063. [Google Scholar]
- Shinohara, K.; Yu, Q. Fatigue evaluation of power devices. In Proceedings of the 2009 International Conference on Electronic Packaging Technology & High Density Packaging, Beijing, China, 10–13 August 2009; pp. 1277–1283. [Google Scholar]
- Ahmad, F.; Vaccaro, L.; Nkembi, A.A.; Marchesoni, M.; Portesine, F.; Anyanwu, G. Junction Temperature and Failure Behavior of High-Power Press Pack vs. Module Diodes Under High Anomalous Surge Currents. Electronics 2026, 15, 121. [Google Scholar] [CrossRef]
- Wei, K.X.; Du, M.X.; Xie, L.L. Study of bonding wire failure effects on external measurable signals of IGBT module. IEEE Trans. Device Mater. Reliab. 2014, 14, 83–89. [Google Scholar] [CrossRef]
- Li, C.; Wang, G.; Niu, L.; Ma, J.; Zhao, Z.; Li, X. Research on defect criteria for ultrasonic testing of IGBT modules. Res. Prog. Solid State Electron. 2022, 42, 244–250. [Google Scholar]
- Li, H.; Lai, W.; Li, H.; Yao, R.; Yu, K.; An, J. Research on solder layer void evolution mechanism for IGBT module of electric locomotive in service. Electr. Drive Locomot. 2022, 65, 135–144. [Google Scholar]
- Held, M.; Jacob, P.; Nicoletti, G.; Scacco, P.; Poech, M.-H. Power cycling lifetime of high power IGBT modules for traction applications. In Proceedings of the Conference Record of the 1997 IEEE Industry Applications Conference Thirty-Second IAS Annual Meeting, Piscataway, New Orleans, LA, USA, 5–9 October 1997; IEEE: Piscataway, NJ, USA, 1997; Volume 2, pp. 1067–1074. [Google Scholar]

Disclaimer/Publisher’s Note: The statements, opinions and data contained in all publications are solely those of the individual author(s) and contributor(s) and not of MDPI and/or the editor(s). MDPI and/or the editor(s) disclaim responsibility for any injury to people or property resulting from any ideas, methods, instructions or products referred to in the content. |
© 2026 by the authors. Licensee MDPI, Basel, Switzerland. This article is an open access article distributed under the terms and conditions of the Creative Commons Attribution (CC BY) license.