


Abstract
Reliable temperature estimation in GaN high-electron-mobility transistors requires temperature-sensitive electrical parameters (TSEPs) that combine sufficient sensitivity with stable calibration behavior. This study compares on-state resistance (Rds(on)), threshold voltage (Vth), reverse-conduction voltage (Vsd), and gate-source voltage (Vgs) using three nominally identical 650 V enhancement-mode GaN HEMTs at three reference temperatures of 25, 50, and 75 °C. Each TSEP was repeatedly measured at each reference temperature, and the median value of the repeated measurements was used for calibration. Calibration performance was primarily assessed using temperature sensitivity, linearity, short-term repeatability, cross-device consistency, and leave-one-device-out calibration transferability, while a limited leave-one-temperature-out analysis was retained only as an additional internal-consistency check. Rds(on) showed a mean K-factor magnitude of 0.247 mΩ/°C, a mean R2 of 0.9974, and a K-factor coefficient of variation of 1.60%. Vgs provided the highest voltage-domain sensitivity, with a mean K-factor magnitude of 2.053 mV/°C, a mean R2 of 0.9980, and a coefficient of variation of 1.49%, whereas Vth and Vsd exhibited K-factor coefficients of variation of 5.93% and 46.11%, respectively, with the latter showing pronounced cross-device variation. The leave-one-device-out analysis yielded transfer RMSEs of 5.600 °C for Rds(on) and 6.324 °C for Vgs, substantially lower than 55.368 °C for Vth and 94.631 °C for Vsd, demonstrating that cross-device slope consistency and calibration transferability are related but distinct characteristics. These results demonstrate that robust TSEP selection should consider repeatability, cross-device consistency, and calibration transferability in addition to sensitivity and linearity.
1. Introduction
Wide-bandgap power semiconductors have become key enabling technologies for high efficiency and high-power-density energy conversion because their material properties permit higher critical electric fields, faster switching, and elevated-temperature operation compared with conventional silicon devices [1,2,3]. Among them, gallium nitride high-electron-mobility transistors (GaN HEMTs) are attractive for high-frequency power conversion because their two-dimensional electron gas channel and low device capacitances enable low conduction and switching losses. However, their small die dimensions, compact packaging, and high power density concentrate heat generation near the channel. The resulting temperature rise can alter on-state characteristics, threshold behavior, gate conduction, trapping response, and long-term reliability. Reliable temperature sensing is therefore essential for thermal management, device characterization, reliability assessment, and interpretation of temperature-dependent electrical degradation in GaN-based power systems [4,5,6].
The temperature of an operating semiconductor device can be investigated using optical thermometry, embedded sensors, electrothermal simulations, or temperature-sensitive electrical parameters (TSEPs). Optical techniques such as infrared thermography, thermoreflectance, and micro-Raman spectroscopy can provide spatially resolved temperature information and are particularly useful for identifying localized hot spots near the active channel [7,8,9]. Their application to packaged devices, however, may require optical access to the die, package modification, surface preparation, emissivity correction, or specialized instrumentation. Electrothermal models can estimate internal temperature distributions, but their predictive reliability depends on the accuracy of the device geometry, material properties, heat-source distribution, and boundary conditions. TSEP-based electrical thermometry offers a comparatively practical and nondestructive alternative because temperature-dependent electrical quantities can be measured through the external terminals of the device [10,11,12,13]. Nevertheless, the usefulness of a TSEP cannot be established solely by observing a monotonic response to temperature. A suitable parameter should exhibit sufficient temperature sensitivity, low calibration error, limited measurement noise, good repeatability, and stable behavior across nominally identical devices. Beyond device fitting quality, calibration robustness should also be examined in terms of measurement repeatability and consistency across nominally identical devices.
The selection of a TSEP is particularly challenging for GaN HEMTs because their electrical characteristics are strongly dependent on device structure, gate technology, sensing bias, and charge trapping history. Drain-source conduction quantities, including low-current drain-source voltage, drain current, channel resistance, and on-state resistance, have been used as temperature indicators because carrier mobility and channel resistance vary with temperature. However, their sensitivity can be limited in low-resistance devices, while an excessive sensing current may introduce self-heating and alter the measured response [14,15,16,17]. Threshold voltage is attractive because it can be extracted at a relatively low drain current, but the result depends on the selected current criterion, voltage step, sweep direction, gate-bias history, and trapping-induced threshold instability. Reverse-conduction voltage provides another possible temperature indicator. Unlike conventional silicon (Si) and silicon carbide (SiC) metal-oxide-semiconductor field-effect transistors (MOSFETs), GaN HEMTs do not contain an intrinsic body diode; their reverse conduction is instead governed by the channel under the applied gate-bias condition, and its temperature dependence can be strongly affected by reverse current and gate bias. Gate-related quantities, including gate-source voltage, gate current, gate leakage current, and gate resistance, may also exhibit pronounced temperature dependence, but their behavior can vary according to the gate contact and gate stack structures [18,19,20,21,22,23]. Accordingly, a meaningful comparison of on-state drain-source resistance (Rds(on)), threshold voltage (Vth), reverse-conduction drain-source voltage (Vsd), and gate-source voltage (Vgs) should consider not only their temperature coefficients and coefficients of determination, but also calibration residuals, short-term repeatability, device-to-device variation, and temperature-equivalent measurement dispersion.
Several studies have investigated electrical parameters for temperature sensing and thermal characterization of GaN HEMTs, including channel resistance and gate-related TSEPs under various sensing conditions [24,25,26]. Alternative approaches based on radio-frequency conductance, pulsed electrical measurements, and subthreshold characteristics have also been explored to improve temperature-dependent parameter extraction [27,28]. Comparative studies have further examined multiple steady-state electrical parameters, including on-state drain-source voltage, gate-source voltage, gate current, threshold voltage, and reverse-conduction-related voltage, demonstrating that their temperature sensitivity, linearity, and stability can differ considerably depending on the device structure and measurement condition [29,30]. These studies have established the feasibility of several GaN TSEPs; however, the combined evaluation of Rds(on), Vth, Vsd, and resistor-based Vgs sensing has received limited systematic assessment under a common experimental protocol that explicitly considers calibration robustness. In particular, a high coefficient of determination obtained from a complete calibration dataset does not necessarily indicate that a TSEP will provide stable repeated measurements, consistent calibration slopes across nominally identical devices, or a calibration relationship that can be transferred reliably between devices. Accordingly, a more comprehensive comparison requires calibration sensitivity and linearity to be considered together with short-term repeatability, cross-device consistency, and the extent to which calibration characteristics can be transferred across nominally identical devices.
This study comparatively evaluates Rds(on), Vth, Vsd, and Vgs as TSEPs using three nominally identical enhancement-mode GaN HEMTs under a common experimental protocol. Each parameter is repeatedly measured over a controlled reference temperature range and characterized in terms of temperature sensitivity, linearity, fitting residual, and short-term measurement dispersion. Cross-device calibration consistency is evaluated from the variation in the device-specific K-factors, and an additional leave-one-device-out analysis is used to examine whether a calibration relationship obtained from different devices can be transferred to an unseen device. Because only three reference temperatures were available, leave-one-temperature-out analysis is retained only as a supplementary internal-consistency check.
The principal contribution of this work is an integrated framework for comparing established TSEP principles using multiple aspects of calibration performance rather than sensitivity or linearity alone. The four TSEPs are evaluated using the same device type, measurement platform, temperature sequence, and data processing procedure, allowing short-term repeatability to be distinguished from cross-device consistency. In addition, the framework distinguishes device-specific slope consistency from the broader question of whether a calibration relationship can be transferred across nominally identical devices. The resulting framework provides a systematic basis for comparing Rds(on), Vth, Vsd, and Vgs for calibration-based temperature sensing in GaN HEMTs. The present study focuses on the robustness of the electrical calibration step rather than on direct extraction of junction-to-case thermal resistance, thereby providing a calibration basis for subsequent TSEP-based thermal characterization.
2. Materials and Methods
2.1. Device and Experimental Setup
Three nominally identical enhancement-mode GaN HEMTs were evaluated to compare the temperature-calibration characteristics of different temperature-sensitive electrical parameters. The devices had a rated drain-source voltage of 650 V and were assembled in a top-side-cooled TOLT package. The maximum drain current rating was 37 A, and the typical on-state resistance at 25 °C was approximately 45 mΩ. Repeated measurements at each reference temperature were used to evaluate short-term measurement repeatability, whereas the three nominally identical devices were used to assess cross-device calibration consistency. The principal characteristics relevant to the present TSEP measurements are summarized in Table 1.
Table 1.
Key characteristics of the evaluated GaN HEMTs.
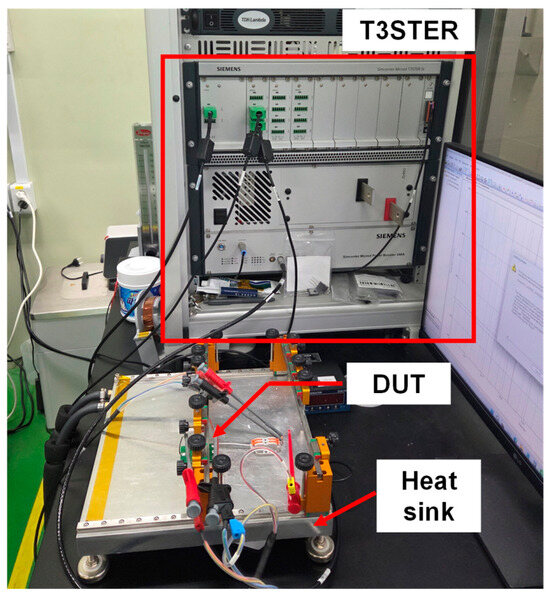
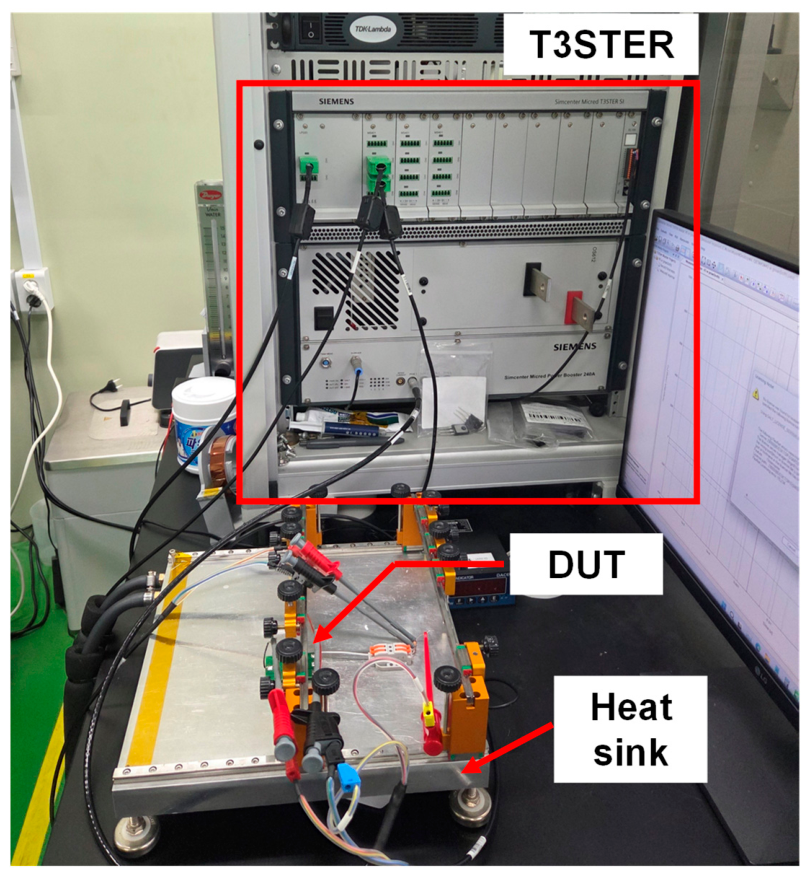
The electrical biasing, TSEP acquisition, and reference temperature control were implemented using the T3STER-based measurement platform configured according to the conditions listed in Table 2. As shown in Figure 1, each device was mounted on a dedicated fixture with its top-side-cooling surface in contact with the temperature-controlled heat sink. The terminal connections and mounting procedure were maintained consistently for all devices.
Table 2.
Electrical conditions for the four TSEP measurements.
Figure 1.
Experimental setup for TSEP calibration with the GaN HEMT mounted on the temperature-controlled heat-sink fixture.
For calibration, the heat-sink temperature was set to three reference temperatures of 25, 50, and 75 °C. The reference temperature was controlled using the temperature-controlled heat-sink stage of the T3STER measurement system. At each temperature set point, the device and fixture were allowed to reach thermal equilibrium before the electrical measurements were initiated. After thermal stabilization, the controlled heat-sink temperature was used as the reference temperature for electrical calibration. This reference condition was not intended to represent an independently verified junction temperature with sub-degree absolute accuracy. Residual temperature gradients associated with the device-to-heat-sink thermal interface and uncertainty of the temperature-control system were not independently quantified. The same temperature sequence, stabilization procedure, and measurement platform were used for all devices and TSEPs. The parameter-specific electrical conditions and extraction procedures are described in Section 2.2.
2.2. TSEP Measurement and Temperature Calibration
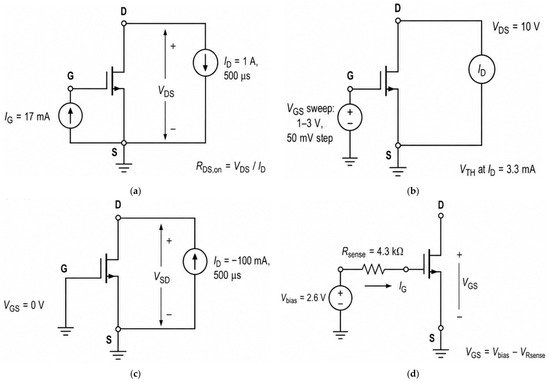
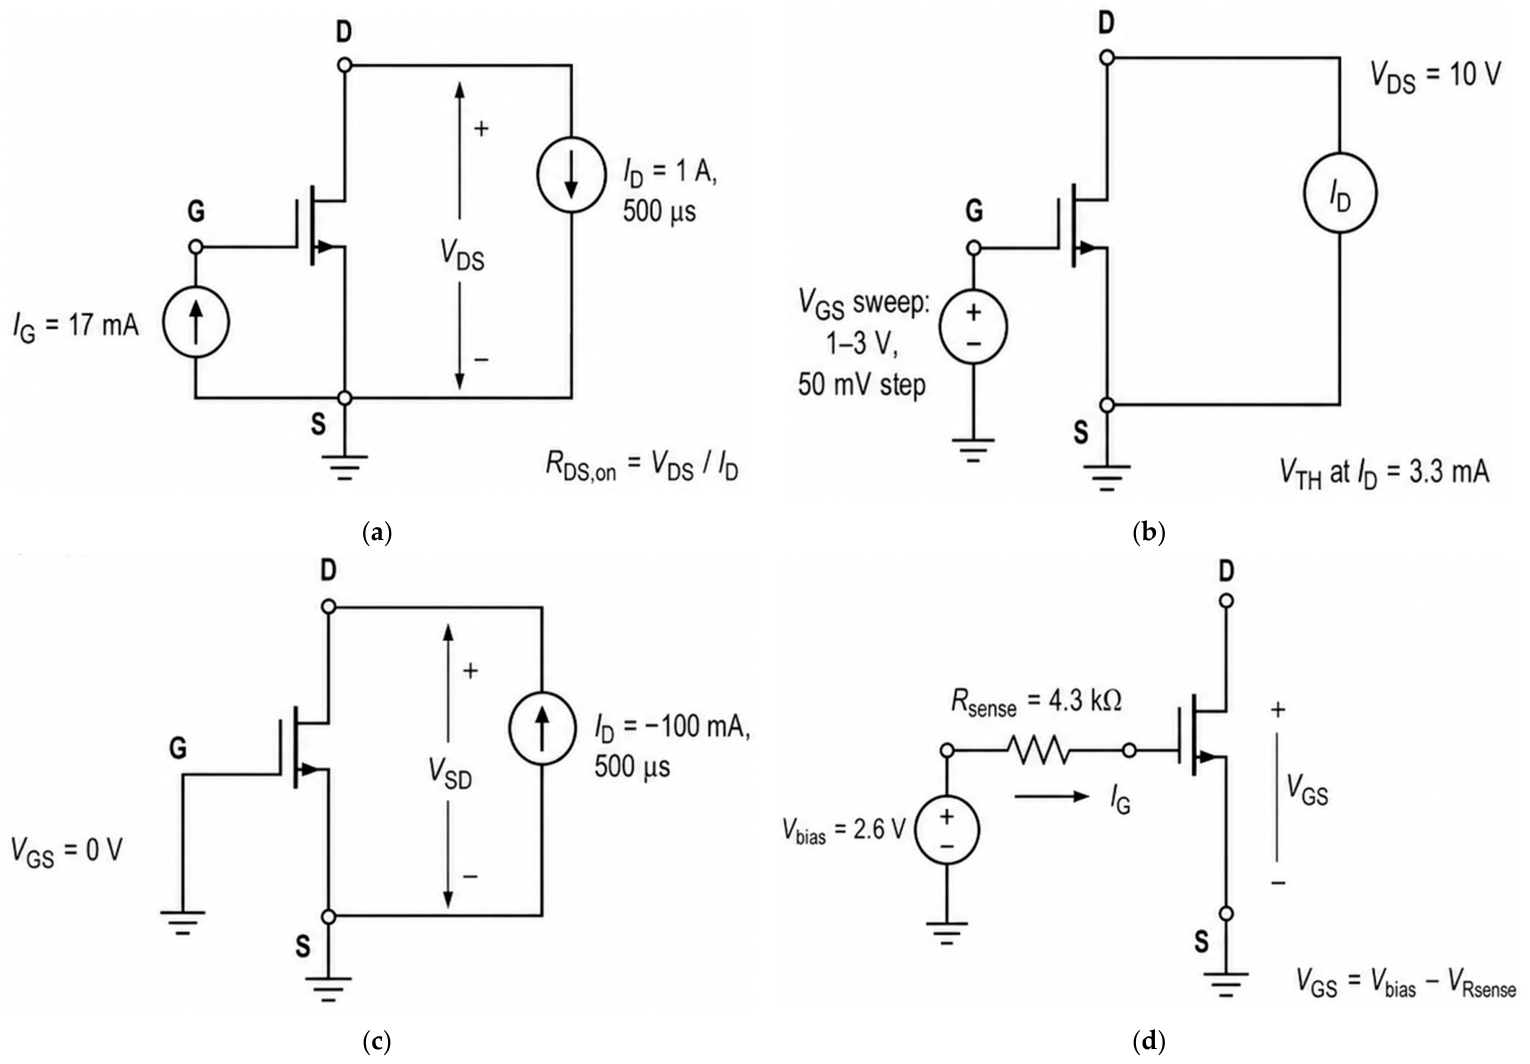
Four electrical parameters were evaluated as TSEPs: the on-state resistance Rds(on), threshold voltage Vth, reverse-conduction voltage Vsd, and gate-source voltage Vgs. Their measurement configurations are illustrated in Figure 2, and the corresponding bias, sensing, and extraction conditions are summarized in Table 2. All measurements were performed using the same device mounting, temperature sequence, and data acquisition platform. For each device, each TSEP was measured 30 times at each reference temperature under identical parameter-specific sensing conditions. All 30 individual measurements were retained for short-term repeatability analysis, whereas the median of the 30 measurements was used as the representative value for constructing the temperature calibration relationship.
Figure 2.
Electrical configurations used for the four TSEP measurements: (a) pulsed Rds(on) measurement, (b) Vth extraction from the transfer characteristic, (c) reverse-conduction Vsd measurement, and (d) Vgs measurement using a gate-series resistor.
For the Rds(on)-based method, the device was driven into forward conduction using a gate current of 17 mA, and a drain current pulse of 1 A with a duration of 500 μs was applied. A current-controlled gate condition was adopted because the evaluated device requires a finite steady-state gate current during on-state operation; the 17 mA condition was therefore used to establish a reproducible on-state conduction condition during sensing. The drain-source voltage was measured using a Kelvin-sensing configuration at the device terminals during the current pulse to minimize the contribution of fixture and contact resistance, and the on-state resistance was calculated as
The short sensing pulse was used to limit measurement-induced self-heating. Conduction-related electrical parameters and channel resistance have previously been employed for GaN HEMT temperature estimation because of their temperature-dependent transport characteristics [14,15,16,17]. Accordingly, the Rds(on) calibration evaluated here represents a controlled quasi-static sensing condition and does not characterize dynamic RON under high-voltage switching operation.
For Vth, the transfer characteristic was measured at Vds = 10 V while Vgs was swept from 1 to 3 V in 50 mV increments. For each sweep, the two adjacent gate-voltage points bracketing Id = 3.3 mA were identified, and linear interpolation between these points was used to determine Vth. Thus, the 50 mV step represented the voltage acquisition interval rather than the numerical resolution of the extracted threshold voltage. Thirty transfer characteristic measurements were performed at each reference temperature, and the median-extracted Vth value was used for calibration. The same sweep range, voltage step, extraction rule, and measurement sequence were maintained for all devices. Threshold voltage-based temperature sensing has also been investigated for GaN HEMTs, although its calibration can be affected by the extraction criterion, gate-bias history, and trapping-related instability [22,23].
For Vsd, Vgs was fixed at 0 V and a reverse drain current pulse of −100 mA with a duration of 500 μs was applied. The resulting reverse-conduction voltage was recorded as Vsd. Because GaN HEMTs do not contain the intrinsic body diode found in conventional Si and SiC MOSFETs, the measured voltage represents channel-based reverse conduction under the applied bias condition. Thirty measurements were performed at each reference temperature, and the median Vsd value was retained for calibration. Reverse-conduction voltage has likewise been investigated as a GaN HEMT TSEP, with its temperature sensitivity reported to depend on the device structure and sensing bias [29,30].
For the Vgs-based method, a gate-bias voltage (Vbias) of 2.6 V was applied through a 4.3 kΩ sensing resistor. The gate-source voltage was obtained from the applied bias voltage and the voltage drop across the sensing resistor as follows:
The sensing resistor limited the gate current and converted the temperature-dependent response of the gate-conduction path into a measurable variation in Vgs. Thirty measurements were performed at each reference temperature, and the median Vgs value was used for calibration. Previous studies have demonstrated pronounced temperature dependence in gate-related electrical quantities of enhancement-mode GaN HEMTs, supporting their potential use as TSEPs [20,21].
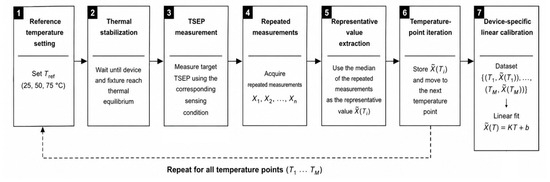
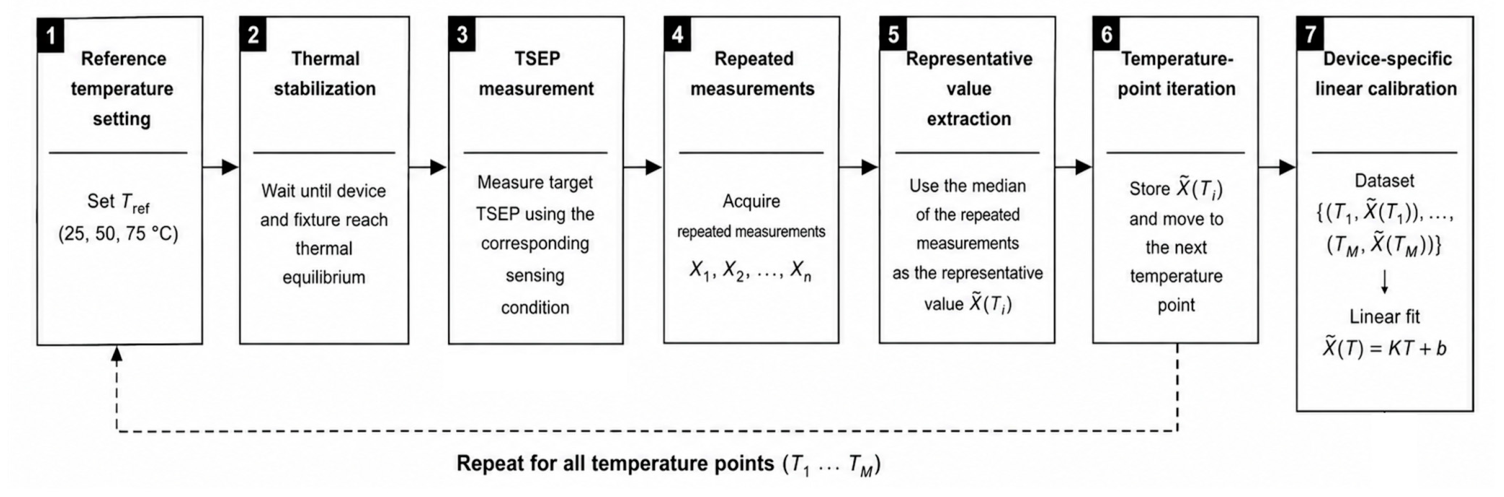
The overall temperature-calibration and data processing procedure is summarized in Figure 3. At each reference temperature, the device was thermally stabilized before 30 repeated measurements of the corresponding TSEPs were acquired. The median of the 30 measurements was retained as the representative value, after which the reference temperature was changed to the next set point. The sensing conditions were selected to limit measurement-induced self-heating.
Figure 3.
Temperature-calibration and data processing workflow applied independently to each device and TSEP, including reference temperature control, thermal stabilization, repeated measurement, median extraction, temperature point iteration, and device-specific linear calibration.
For each device d and TSEP j, the representative electrical parameter was fitted using a first-order calibration relationship:
where is the representative TSEP value; d denotes the device index; j denotes the TSEP method; T is the reference temperature; Kd,j is the device-specific temperature coefficient, and bd,j is the fitted intercept. The temperature coefficient Kd,j, hereafter referred to as the K-factor, corresponds to the change in the measured electrical parameter per unit temperature. It was expressed in mΩ/°C for Rds(on) and in mV/°C for the voltage-based TSEPs. Signed K-factors were retained in the calibration equations and used for temperature conversion. For sensitivity and cross-device comparisons, however, the absolute slope magnitude, |K|, was used because Rds(on) and Vsd exhibited positive temperature coefficients, whereas Vth and Vgs exhibited negative temperature coefficients.
The calibration relationship was rearranged to estimate temperature from a measured TSEP value:
Separate calibration models were retained for each device and TSEP rather than pooling the measurements from the three devices. Equation (4) was applied within the investigated calibration range, and the resulting calibration characteristics were further evaluated using the metrics described in Section 2.3.
2.3. Calibration Robustness Evaluation
Calibration robustness was evaluated using temperature sensitivity, linearity, fitting residuals, short-term repeatability, cross-device consistency, and cross-device calibration transferability. The metrics and their interpretations are summarized in Table 3.
Table 3.
Metrics used for calibration robustness evaluation.
The device-specific K-factor obtained from Equation (3) was used as the measure of temperature sensitivity. Calibration linearity was quantified using the coefficient of determination:
where M is the number of reference temperature points; Xd,j(Ti) is the representative measured value at Ti; Xd,j(Ti) is the value predicted by the linear calibration model, and Xd,j is the average of the representative values over all reference temperatures. An R2 value approaching unity indicates that the measured temperature dependence is well represented by the first-order calibration model. However, R2 was interpreted only as a descriptive linearity metric and not as evidence of absolute temperature-measurement accuracy. Because only three reference temperature points were used, the R2 values should be interpreted together with the fitting residuals, short-term repeatability, and cross-device consistency rather than as standalone indicators of calibration robustness.
The residual fitting error was quantified in the electrical parameter domain using the root-mean-square error:
The unit of is identical to that of the corresponding TSEP. Therefore, direct comparison of this metric between resistance-based and voltage-based TSEPs is inappropriate. To express the calibration residual on a common temperature scale, the temperature-equivalent fitting error was calculated as
The resulting value is expressed in degrees Celsius and represents the electrical-model residual converted through the device-specific calibration slope. It should be interpreted as the internal consistency of the linear calibration model rather than as independently verified temperature accuracy. A TSEP with a small K-factor can exhibit a low electrical residual while still producing a relatively large temperature-equivalent fitting error.
Short-term repeatability was evaluated using all 30 individual measurements acquired at each device-temperature condition. Although the median of the 30 measurements was used as the representative value for calibration fitting, all 30 individual measurements were retained for dispersion analysis. The sample standard deviation, , was calculated from the 30 repeated measurements for device d, TSEP j, and reference temperature Ti, and was converted to an equivalent temperature variation as
For each TSEP, the mean equivalent temperature variation was calculated by averaging the values obtained from the nine device-temperature conditions, whereas the maximum equivalent temperature variation was defined as the largest value among these conditions. Both the average and maximum values over the calibration range were retained to represent typical and worst case repeated-measurement dispersion. The equivalent temperature variation defined here represents only the short-term electrical measurement dispersion converted through the device-specific K-factor and does not constitute a complete uncertainty estimate of absolute temperature. Uncertainties associated with reference temperature control, electrical source and measurement accuracy, and external sensing components were not separately propagated into this metric. Residual thermal-contact effects and sensing-induced self-heating were likewise not included in this metric. Therefore, the equivalent temperature variation should be interpreted as a short-term electrical repeatability metric under the present calibration conditions rather than as a measure of absolute temperature accuracy, resolution, or total measurement uncertainty.
Cross-device consistency was assessed from the absolute K-factor magnitudes obtained from the three devices. The mean, sample standard deviation, minimum-to-maximum range, and coefficient of variation were calculated for each TSEP. The coefficient of variation was defined as
where the mean and sample standard deviation were calculated from the absolute device-specific K-factor magnitudes. Cross-device statistics were calculated using the full-precision regression slopes prior to rounding the K-factor values for presentation. A lower CVK,j indicates more consistent temperature sensitivity among nominally identical devices. Because the coefficient of variation becomes highly sensitive when the mean K-factor approaches zero, the absolute standard deviation and full K-factor range were examined together with the coefficient of variation. Given the use of three devices, these statistics were treated as descriptive indicators of cross-device behavior rather than as population-level estimates.
The fitted intercepts were retained for temperature conversion but were not used as primary cross-device comparison metrics. Differences in the intercept mainly represent baseline electrical offsets, whereas variation in the K-factor directly affects the conversion between an electrical change and a temperature change. No weighted composite robustness score was assigned because such a score would require arbitrary weighting among sensitivity, linearity, repeatability, cross-device consistency, and transferability. Instead, the individual metrics were considered together to identify the relative strengths and limitations of each TSEP. A leave-one-temperature-out analysis was additionally performed as a limited internal-consistency check of the three-point calibration dataset, as described in Section 2.4.
2.4. Leave-One-Temperature-Out Internal-Consistency Analysis
A leave-one-temperature-out (LOTO) analysis was performed as a supplementary internal-consistency check of the three-point calibration relationship. For each device and TSEP, one reference temperature and its corresponding median TSEP value were omitted, and a first-order calibration relationship was constructed from the remaining two temperature points. The measured TSEP value at the omitted temperature was then converted back to temperature using the reduced calibration relationship. This procedure was repeated until each of the three reference temperatures had been omitted once.
Because only three reference temperatures were available, each reduced calibration was necessarily based on two points. Therefore, the resulting LOTO errors were not interpreted as an independent validation of predictive accuracy. Instead, they were used only as descriptive indicators of how strongly the fitted calibration relationship depended on the inclusion of an individual temperature point. The resulting errors were summarized using MAE, RMSE, signed bias, and maximum absolute error. More rigorous validation of temperature-prediction robustness would require additional calibration temperatures and independent validation temperatures.
2.5. Cross-Device Calibration Transferability
The cross-device K-factor statistics described in Section 2.3 quantify similarity in temperature sensitivity among nominally identical devices but do not directly establish whether a complete calibration relationship can be transferred from one device to another. To distinguish slope consistency from actual calibration transferability, a leave-one-device-out analysis was therefore performed for each TSEP.
At each iteration, one of the three devices was excluded as a held-out test device. A common first-order calibration relationship was constructed using the median TSEP values of the remaining two devices at all three reference temperatures, yielding six calibration points. The resulting calibration model was then applied directly to the median TSEP values of the held-out device at 25, 50, and 75 °C without device-specific refitting. The procedure was repeated until each device had served once as the held-out device.
For each TSEP, the procedure produced nine cross-device temperature-prediction errors, corresponding to three reference temperatures for each of the three held-out devices. Transferability was summarized using the mean absolute error (MAE), root-mean-square error (RMSE), signed bias, and maximum absolute error (MaxAE). Because only three devices from a single device technology were evaluated, these metrics were interpreted as descriptive indicators of within-set calibration transferability rather than as population-level estimates.
3. Results
3.1. Calibration Performance and Cross-Device Consistency of the Four TSEPs
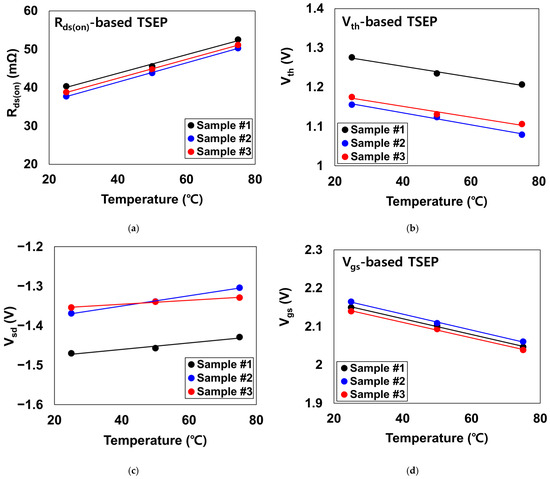
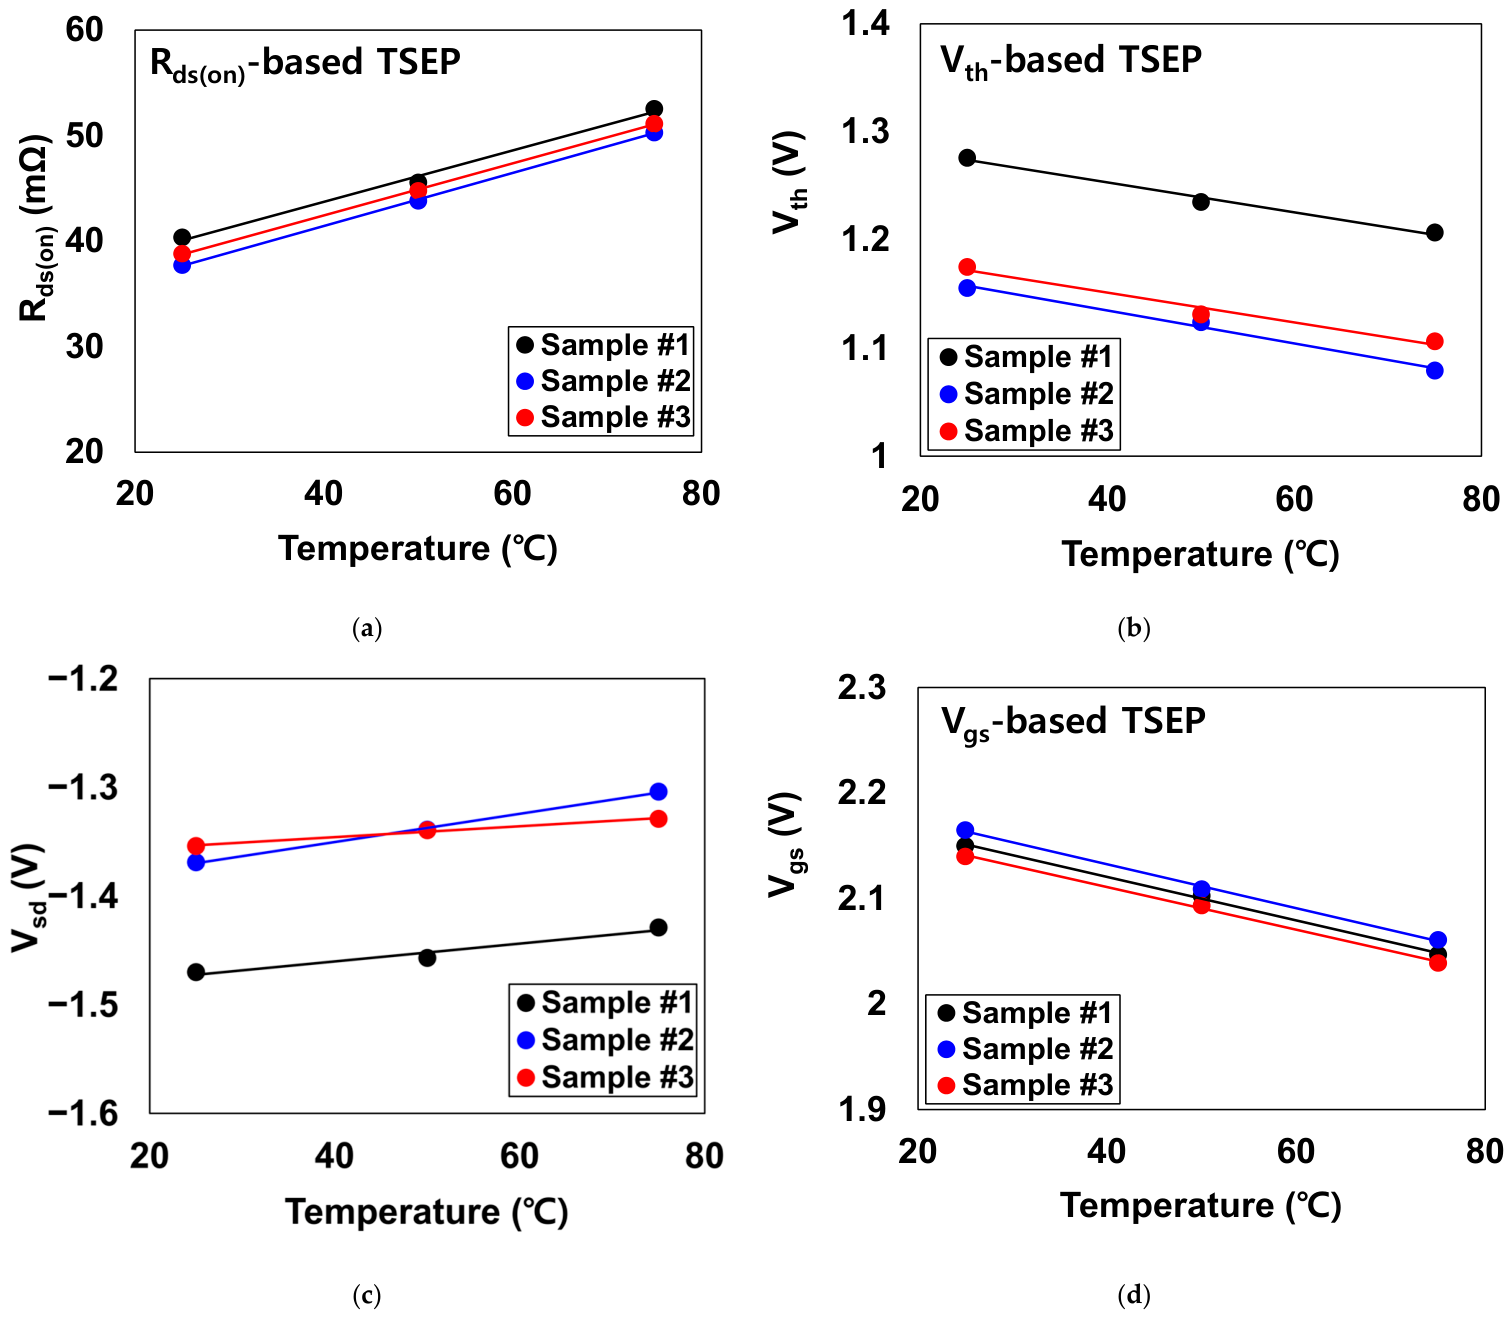
Figure 4 presents the temperature-dependent calibration characteristics of the four investigated TSEPs for the three evaluated devices. For each device and TSEP, 30 repeated measurements were performed at each reference temperature, and the median of the 30 measurements was used to construct the calibration relationship. The temperature dependence was evaluated over the controlled heat-sink temperature range of 25 to 75 °C. Distinct differences were observed among the four TSEPs in both temperature sensitivity and consistency among nominally identical devices.
Figure 4.
Temperature-dependent calibration characteristics of (a) Rds(on), (b) Vth, (c) Vsd, and (d) Vgs for the three evaluated devices. Symbols represent the median values obtained from 30 repeated measurements at each reference temperature.
The Rds(on)-based method exhibited highly consistent temperature sensitivity among the three devices. The extracted K-factors were 0.244, 0.251, and 0.246 mΩ/°C for Devices 1, 2, and 3, respectively, corresponding to a mean value of 0.247 mΩ/°C. The sample standard deviation was approximately 0.0040 mΩ/°C, resulting in a coefficient of variation of 1.60%. The corresponding coefficients of determination were 0.9929, 0.9997, and 0.9996, indicating that the temperature dependence of Rds(on) was well represented by the first-order calibration model for all three devices.
A moderately larger cross-device variation was observed for Vth compared with Rds(on) and Vgs. The extracted K-factor magnitudes were 1.385, 1.527, and 1.375 mV/°C for Devices 1, 2, and 3, respectively, yielding a mean value of 1.429 mV/°C and a coefficient of variation of 5.93%. The corresponding R2 values were 0.9888, 0.9902, and 0.9755. Although Vth maintained reasonably high linearity for all three devices, its calibration slope showed greater device-to-device variation than those of Rds(on) and Vgs.
The largest cross-device variation was observed for Vsd. The K-factors obtained from Devices 1, 2, and 3 were 0.820, 1.300, and 0.500 mV/°C, respectively. The mean K-factor was 0.873 mV/°C, with a coefficient of variation of approximately 46.11%. The R2 values were 0.9573, 0.9980, and 0.9915, with Device 1 exhibiting the lowest linearity. Thus, Vsd showed markedly greater device dependence than the other three TSEPs in terms of calibration slope.
The Vgs-based method exhibited the largest voltage-domain temperature coefficient and a high degree of consistency among the three devices. The extracted K-factor magnitudes were 2.060, 2.080, and 2.020 mV/°C, corresponding to a mean of 2.053 mV/°C, a sample standard deviation of approximately 0.031 mV/°C, and a coefficient of variation of approximately 1.49%. All three devices also exhibited high linearity, with R2 values between 0.9978 and 0.9981. These measured results indicate that Vgs provided the strongest combination of voltage-domain sensitivity and cross-device consistency among the evaluated voltage-based TSEPs.
Table 4 summarizes the device-specific K-factors and linearity metrics together with the cross-device statistics. Notably, Rds(on) and Vgs showed similar K-factor coefficients of variation of 1.60% and 1.49%, respectively, whereas Vth showed a moderately higher variation of 5.93% and Vsd exhibited a substantially larger variation of 46.11%. These results demonstrate that calibration linearity and cross-device consistency represent distinct characteristics of TSEP performance and should therefore be evaluated separately.
Table 4.
Calibration sensitivity, linearity, and cross-device consistency of the four TSEPs.
Comparison of the K-factor statistics further shows that within-device linearity and cross-device slope consistency provide different information regarding calibration behavior. Rds(on) and Vgs maintained K-factor coefficients of variation near 1.5%, whereas Vth showed a moderate variation of 5.93% and Vsd exhibited a substantially larger variation of 46.11%. In particular, the mean R2 of Vsd remained above 0.98 despite the large spread in its K-factor. This indicates that the temperature dependence can remain approximately linear within each individual device even when the corresponding calibration slope varies considerably among nominally identical devices. Therefore, the K-factor variation provides information relevant to cross-device calibration consistency that cannot be inferred directly from R2 alone.
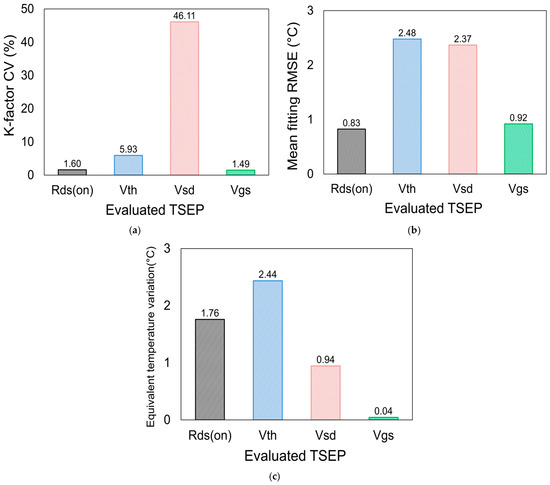
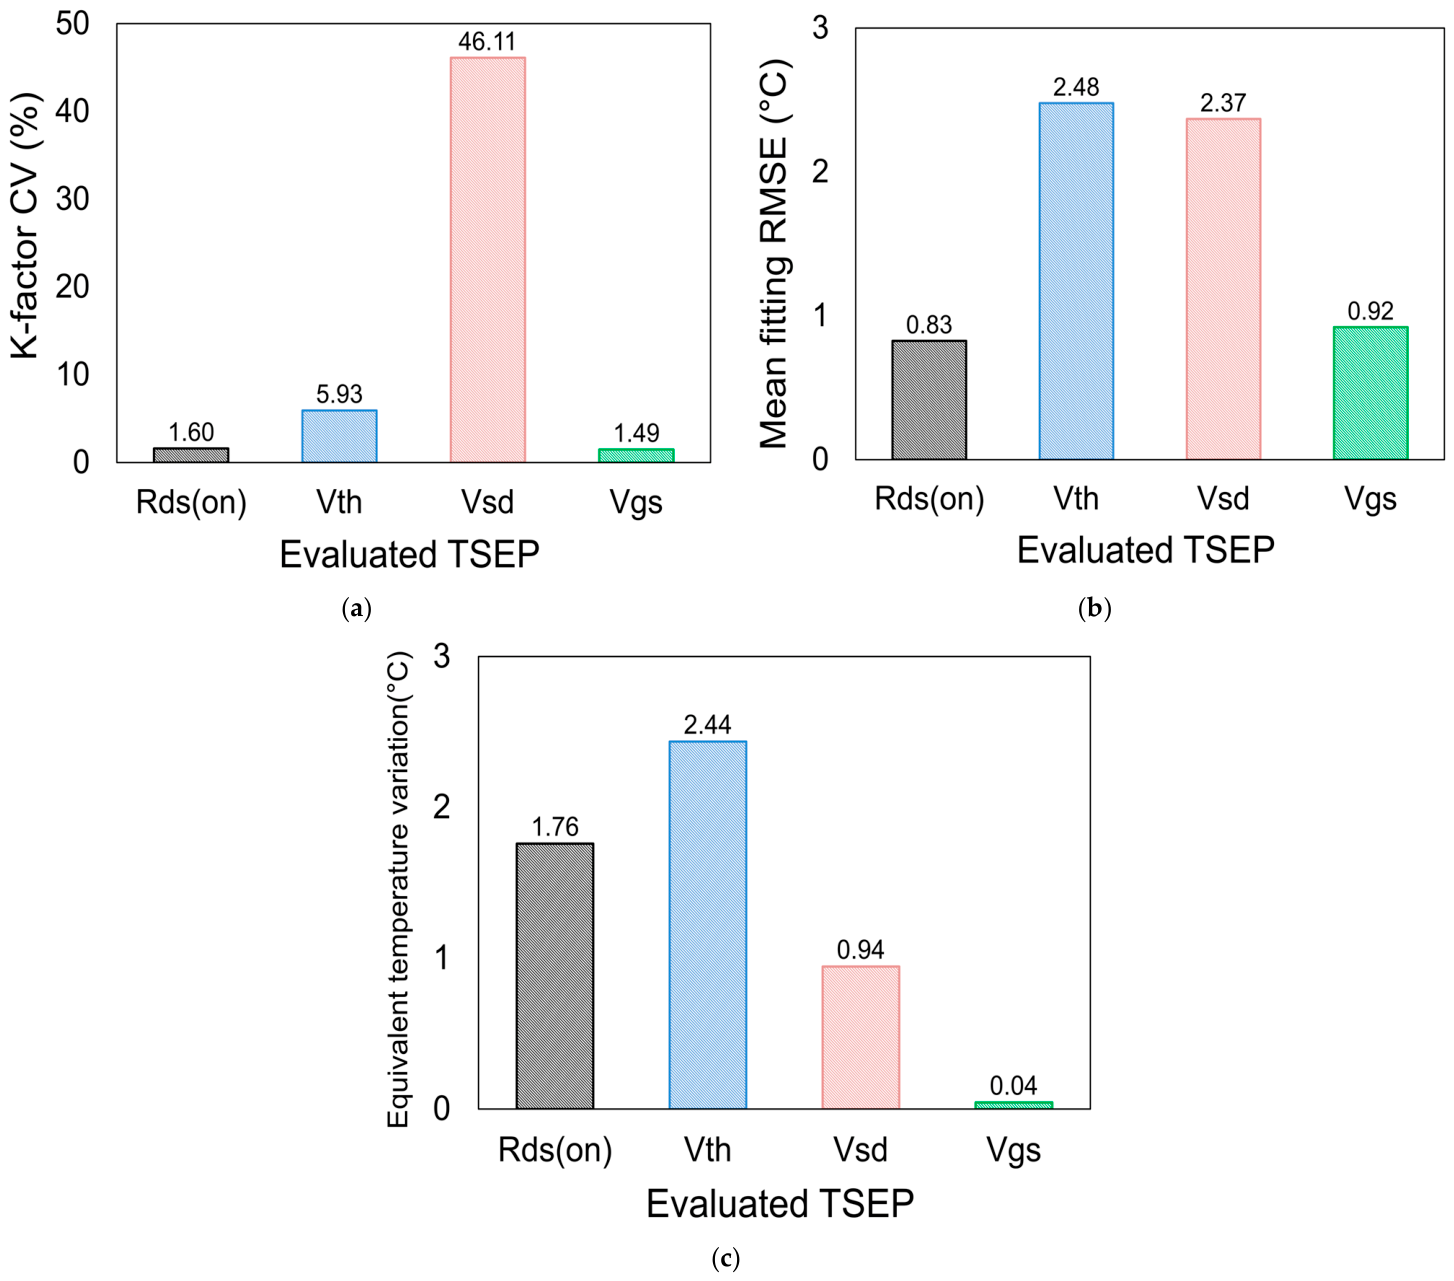
The mean temperature-equivalent fitting RMSE values across the three devices were 0.826, 2.478, 2.368, and 0.921 °C for Rds(on), Vth, Vsd, and Vgs, respectively. Rds(on) and Vgs therefore exhibited smaller temperature-equivalent residuals from the first-order calibration model than Vth and Vsd. The repeated measurements were analyzed by converting the sample standard deviation at each condition through the corresponding device-specific K-factor. The mean equivalent temperature variations were 1.760, 2.436, 0.944, and 0.043 °C for Rds(on), Vth, Vsd, and Vgs, respectively. The corresponding maximum values were 2.351, 4.181, 1.767, and 0.055 °C. Although Vgs exhibited the lowest mean equivalent temperature variation of 0.043 °C, this value represents the short-term electrical repeatability metric defined in Section 2.3 and should not be interpreted as an absolute temperature accuracy or measurement uncertainty of 0.043 °C.
Figure 5 summarizes the principal calibration-robustness metrics for the four TSEPs. Figure 5a highlights the substantially lower cross-device K-factor variation in Rds(on) and Vgs; Figure 5b compares the temperature-equivalent fitting errors, and Figure 5c shows the equivalent temperature variation derived from repeated measurements, with Vgs exhibiting the lowest short-term measurement dispersion.
Figure 5.
Quantitative comparison of calibration robustness for the four TSEPs: (a) coefficient of variation in the device-specific K-factors, (b) temperature-equivalent fitting RMSE, and (c) equivalent temperature variation derived from repeated measurements.
A comparison of the electrical-domain dispersion and temperature-equivalent dispersion further showed that a small absolute electrical variation does not necessarily correspond to a high temperature-sensing capability. Because the equivalent temperature variation depends on both the measurement dispersion and the K-factor, robust TSEP calibration requires a sufficiently large temperature coefficient together with stable repeated measurements.
3.2. LOTO-Based Internal-Consistency Results
The LOTO analysis was retained as a descriptive internal-consistency check rather than as an independent assessment of predictive accuracy. For each device and TSEP, one reference temperature was omitted and reconstructed using the two remaining calibration points, as described in Section 2.4. The pooled error metrics are summarized in Table 5.
Table 5.
LOTO-based internal-consistency error metrics of the four TSEPs.
The pooled RMSE values were 3.938 °C for Rds(on), 10.061 °C for Vth, 11.941 °C for Vsd, and 3.413 °C for Vgs. Rds(on) and Vgs showed smaller omitted-point errors than Vth and Vsd within the present three-temperature dataset. However, because each reduced calibration was constructed from only two points, these differences should be interpreted only as descriptive sensitivity of the calibration relationship to omission of an individual temperature point, rather than as evidence of general predictive accuracy.
Accordingly, the LOTO results were used only as supporting information and were not included as a principal basis for ranking the four TSEPs in Section 4.
3.3. Cross-Device Calibration Transferability
Cross-device calibration transferability was evaluated using the leave-one-device-out procedure described in Section 2.5. For each TSEP, the calibration relationship obtained from two devices was applied directly to the held-out third device without device-specific recalibration. This analysis therefore evaluates a different characteristic from K-factor consistency: whether a calibration established from nominally identical devices can be directly transferred to another device. The resulting cross-device transferability metrics are summarized in Table 6.
Table 6.
Leave-one-device-out cross-device calibration-transferability metrics.
The pooled transfer RMSE values were 5.600 °C for Rds(on), 55.368 °C for Vth, 94.631 °C for Vsd, and 6.324 °C for Vgs. Rds(on) and Vgs therefore exhibited substantially smaller cross-device transfer errors than Vth and Vsd. This trend is broadly consistent with the relatively small K-factor coefficients of variation observed for Rds(on) and Vgs.
However, the transfer analysis also shows that similarity in calibration slope does not imply calibration-free device interchangeability. Although Rds(on) and Vgs exhibited K-factor coefficients of variation of only 1.60% and 1.49%, respectively, direct application of a calibration obtained from different devices still resulted in transfer RMSE values of several degrees Celsius. This difference arises because temperature conversion depends on both the calibration slope and intercept; therefore, device-dependent baseline electrical offsets can produce appreciable temperature errors even when the slopes are similar.
Accordingly, the present transferability results should be interpreted as a direct within-set assessment based on three nominally identical devices rather than as evidence that a universal calibration can be applied across a broader device population.
3.4. Physical Interpretation and Comparative Assessment of the Four TSEPs
The combined results demonstrate that the four TSEPs exhibit distinctly different calibration characteristics despite being evaluated using the same device type, reference temperature range, measurement platform, and data processing procedure. Table 7 summarizes the principal performance indicators obtained from the calibration, repeatability, cross-device consistency, and cross-device transferability analyses. Among the evaluated parameters, Rds(on) and Vgs exhibited the strongest cross-device consistency, with K-factor coefficients of variation of 1.60% and 1.49%, respectively, whereas Vth showed a moderately higher variation of 5.93%, and Vsd exhibited a substantially larger variation of 46.11%. These differences indicate that calibration linearity within an individual device and consistency of the calibration slope across nominally identical devices represent distinct aspects of TSEP performance.
Table 7.
Overall comparison of the calibration performance of the four TSEPs.
The comparison between Rds(on) and Vgs further illustrates the importance of considering multiple calibration metrics simultaneously. Both parameters exhibited mean R2 values above 0.996 and K-factor coefficients of variation close to 1.5%, indicating highly consistent calibration relationships among the three devices. Vgs additionally provided the largest voltage-domain temperature coefficient, with a mean K-factor magnitude of 2.053 mV/°C. Vth and Vsd also maintained mean R2 values above 0.98; however, their K-factor coefficients of variation increased to 5.93% and 46.11%, respectively. Therefore, a high coefficient of determination obtained from an individual calibration curve should not be interpreted as evidence that the same temperature sensitivity will be reproduced across different devices.
The repeatability and cross-device transferability results summarized in Table 7 provide additional criteria for distinguishing TSEPs that exhibit similarly favorable sensitivity and linearity. The equivalent temperature variation reflects short-term electrical measurement dispersion under a fixed calibration condition, whereas the leave-one-device-out transfer RMSE reflects the error introduced when a calibration relationship obtained from different devices is applied to a held-out device. Together with the cross-device K-factor variation, these metrics characterize complementary aspects of calibration robustness. A TSEP with a large K-factor and high R2 may therefore still provide limited practical robustness if repeated measurements exhibit substantial dispersion or if device-dependent baseline offsets result in poor calibration transferability.
When the primary calibration metrics and cross-device transfer results were considered together, Rds(on) and Vgs exhibited the most favorable overall behavior among the four TSEPs. Vgs combined the highest voltage-domain temperature sensitivity, a mean R2 of 0.9980, a low K-factor coefficient of variation of 1.49%, and the lowest mean equivalent temperature variation of 0.043 °C. Rds(on), meanwhile, exhibited the lowest cross-device transfer RMSE of 5.600 °C, compared with 6.324 °C for Vgs, while also maintaining high linearity and low cross-device K-factor variation. These results indicate that Vgs provided the most favorable combination of sensitivity, linearity, and short-term repeatability, whereas Rds(on) showed slightly better calibration transferability within the three evaluated devices.
The favorable Rds(on) calibration behavior can be related to the temperature dependence of carrier transport in the GaN HEMT channel. As temperature increases, reduced carrier mobility increases the channel resistance, providing a monotonic electrical response suitable for temperature sensing [14,15,16,17]. Wang et al. [30] reported favorable linearity and stability for low current saturation voltage as a steady-state TSEP, while also showing that its sensitivity depends on the electrical sensing condition. In contrast, the present study evaluates pulsed Rds(on) using Kelvin-sensing and further examines short-term repeatability, cross-device slope consistency, and calibration transferability. In the present measurements, the Kelvin-sensing configuration reduced the contribution of fixture and contact resistance, while the 500 μs sensing pulse was used to limit measurement-induced self-heating. These measurement conditions likely improved the reproducibility of the extracted Rds(on) values by reducing extrinsic resistance contributions and sensing-induced self-heating. Nevertheless, because the mean K-factor magnitude of Rds(on) was smaller than that of Vgs, a given electrical-domain variation resulted in a larger temperature-equivalent variation for Rds(on).
The Rds(on) calibration considered in this study should also be distinguished from dynamic RON behavior under actual switching operation. The present measurements were performed after thermal stabilization using a defined 500 μs sensing pulse and therefore represent a controlled quasi-static calibration condition. In high-voltage GaN switches, charge trapping associated with preceding blocking and switching conditions can modify the dynamic RON relative to its static value. Alemanno et al. [31] demonstrated that dynamic RON degradation depends on operating conditions including blocking voltage, gate-driving voltage, temperature, and switching frequency. Consequently, an Rds(on)-based TSEP implemented during converter operation may contain both temperature-induced and trapping-induced resistance variations. Practical online application would therefore require a controlled sensing sequence or an application-specific dynamic calibration that minimizes or accounts for bias history-dependent dynamic RON effects.
The favorable Vgs response can be interpreted in relation to the temperature-dependent gate-conduction path of the evaluated current-driven GaN HEMT. Under the resistor-biased sensing configuration, a temperature-induced change in gate conduction modifies the voltage drop across Rsense and is consequently converted into a measurable shift in Vgs. Borghese et al. [21] demonstrated pronounced temperature dependence of gate current in p-GaN HEMTs, while Pirosca et al. [29] identified gate-source voltage as a favorable TSEP for GaN HEMT thermal characterization. These observations are consistent with the relatively large |K| and low short-term electrical dispersion obtained for Vgs in the present study. Beyond these prior observations, the present analysis additionally examines the cross-device consistency and calibration transferability of the resistor-biased Vgs response under the same experimental framework used for the other three TSEPs. However, because gate-conduction mechanisms and contact structures differ among enhancement-mode GaN technologies, the present Vgs behavior should be regarded as specific to the evaluated current-driven gate architecture rather than as a universal property of GaN HEMTs. Accordingly, the very low equivalent temperature variation obtained for Vgs primarily reflects the stability of the electrical readout under the present controlled conditions. Because thermal-interface effects, reference-temperature uncertainty, and residual sensing-induced self-heating were not included in this metric, the 0.043 °C value does not imply sub-0.1 °C absolute thermometry capability.
The overall comparison presented in Table 7 should be interpreted within the investigated calibration range of 25–75 °C and the limited set of three nominally identical devices. In particular, the cross-device transferability results represent a within-set assessment and should not be interpreted as evidence that a universal calibration can be applied across a broader device population. In addition, the calibration behavior of gate-related TSEPs may depend on the specific gate architecture. Therefore, the favorable Vgs characteristics observed in this study should be interpreted within the context of the evaluated device technology rather than directly generalized to all enhancement-mode GaN HEMTs. Further evaluation using a denser and wider temperature range, a larger device population, and additional GaN device technologies would be required to determine the generalizability of the observed TSEP performance ranking and cross-device transferability.
4. Conclusions
This study comparatively evaluated the calibration robustness of four temperature-sensitive electrical parameters, Rds(on), Vth, Vsd, and Vgs, using three nominally identical enhancement-mode GaN HEMTs under a common measurement framework. Rds(on) exhibited a mean K-factor magnitude of 0.247 mΩ/°C, a mean R2 of 0.9974, and a K-factor coefficient of variation of 1.60%. Vgs provided the highest voltage-domain sensitivity, with a mean K-factor magnitude of 2.053 mV/°C, a mean R2 of 0.9980, and a similarly low K-factor coefficient of variation of 1.49%. Vth showed moderate cross-device variation of 5.93%, whereas Vsd exhibited substantially larger variation of 46.11%. The leave-one-device-out analysis further yielded cross-device transfer RMSEs of 5.600 °C for Rds(on) and 6.324 °C for Vgs, compared with 55.368 °C for Vth and 94.631 °C for Vsd. These results demonstrate that similar calibration slopes do not necessarily imply calibration-free device interchangeability, because device-dependent baseline offsets can also contribute substantially to transfer error. Overall, a large K-factor magnitude or high R2 alone is insufficient to determine the practical suitability of a TSEP; short-term repeatability, cross-device consistency, and calibration transferability should also be considered. Among the four measured parameters, Vgs provided the most balanced calibration performance within the investigated 25–75 °C range. Because the study used only three reference temperatures and three devices, further validation over a denser and wider temperature range and a larger device population is required before the observed ranking can be generalized.
Author Contributions
Conceptualization, K.L. and H.L.; methodology, K.L.; validation, K.L.; formal analysis, K.L.; investigation, K.L.; data curation, K.L.; visualization, K.L.; writing—original draft preparation, K.L.; writing—review and editing, K.L. and H.L.; supervision, H.L.; project administration, H.L.; funding acquisition, H.L. All authors have read and agreed to the published version of the manuscript.
Funding
This research was funded by the Ministry of Trade, Industry and Energy (MOTIE, Republic of Korea) through the Gate Driver Integrated Power Module Development for Electric Vehicle program (RS-2026-25536963).
Data Availability Statement
The data supporting the findings of this study are available from the corresponding author upon reasonable request.
Acknowledgments
During the preparation of this manuscript, the authors used OpenAI ChatGPT (GPT-5.6) for language editing, refinement of manuscript structure and clarity, and consistency checking. The authors reviewed and edited all AI-assisted outputs and take full responsibility for the content of this publication.
Conflicts of Interest
The authors declare no conflicts of interest.
References
- Millán, J.; Godignon, P.; Perpiñà, X.; Pérez-Tomás, A.; Rebollo, J. A Survey of Wide Bandgap Power Semiconductor Devices. IEEE Trans. Power Electron. 2014, 29, 2155–2163. [Google Scholar] [CrossRef] [Scilit]
- Amano, H.; Baines, Y.; Beam, E.; Borga, M.; Bouchet, T.; Chalker, P.R.; Charles, M.; Chen, K.J.; Chowdhury, N.; Chu, R.; et al. The 2018 GaN Power Electronics Roadmap. J. Phys. D Appl. Phys. 2018, 51, 163001. [Google Scholar] [CrossRef] [Scilit]
- Mishra, U.K.; Parikh, P.; Wu, Y.F. AlGaN/GaN HEMTs: An Overview of Device Operation and Applications. Proc. IEEE 2002, 90, 1022–1031. [Google Scholar] [CrossRef] [Scilit]
- Jones, E.A.; Wang, F.F.; Costinett, D. Review of Commercial GaN Power Devices and GaN-Based Converter Design Challenges. IEEE J. Emerg. Sel. Top. Power Electron. 2016, 4, 707–719. [Google Scholar] [CrossRef] [Scilit]
- Meneghesso, G.; Verzellesi, G.; Danesin, F.; Rampazzo, F.; Zanon, F.; Tazzoli, A.; Meneghini, M.; Zanoni, E. Reliability of GaN High-Electron-Mobility Transistors: State of the Art and Perspectives. IEEE Trans. Device Mater. Reliab. 2008, 8, 332–343. [Google Scholar] [CrossRef] [Scilit]
- Islam, N.; Mohamed, M.F.P.; Khan, M.F.A.J.; Falina, S.; Kawarada, H.; Syamsul, M. Reliability, Applications and Challenges of GaN HEMT Technology for Modern Power Devices: A Review. Crystals 2022, 12, 1581. [Google Scholar] [CrossRef] [Scilit]
- Blackburn, D.L. Temperature Measurements of Semiconductor Devices: A Review. In Proceedings of the 20th Annual IEEE Semiconductor Thermal Measurement and Management Symposium, San Jose, CA, USA, 9–11 March 2004; pp. 70–80. [Google Scholar] [CrossRef] [Scilit]
- Kuball, M.; Hayes, J.M.; Uren, M.J.; Martin, T.; Birbeck, J.C.H.; Balmer, R.S.; Hughes, B.T. Measurement of Temperature in Active High-Power AlGaN/GaN HFETs Using Raman Spectroscopy. IEEE Electron Device Lett. 2002, 23, 7–9. [Google Scholar] [CrossRef] [Scilit]
- Bagnall, K.R.; Moore, E.A.; Badescu, S.C.; Zhang, L.; Wang, E.N. Simultaneous Measurement of Temperature, Stress, and Electric Field in GaN HEMTs with Micro-Raman Spectroscopy. Rev. Sci. Instrum. 2017, 88, 113111. [Google Scholar] [CrossRef] [Scilit] [PubMed]
- Avenas, Y.; Dupont, L.; Khatir, Z. Temperature Measurement of Power Semiconductor Devices by Thermo-Sensitive Electrical Parameters: A Review. IEEE Trans. Power Electron. 2012, 27, 3081–3092. [Google Scholar] [CrossRef] [Scilit]
- Baker, N.; Liserre, M.; Dupont, L.; Avenas, Y. Improved Reliability of Power Modules: A Review of Online Junction Temperature Measurement Methods. IEEE Ind. Electron. Mag. 2014, 8, 17–27. [Google Scholar] [CrossRef] [Scilit]
- Isa, R.; Mirza, J.; Ghafoor, S.; Mustafa Khan, M.Z.; Qureshi, K.K. Junction Temperature Optical Sensing Techniques for Power Switching Semiconductors: A Review. Micromachines 2023, 14, 1636. [Google Scholar] [CrossRef] [Scilit] [PubMed]
- Joh, J.; del Alamo, J.A.; Chowdhury, U.; Chou, T.M.; Tserng, H.Q.; Jimenez, J.L. Measurement of Channel Temperature in GaN High-Electron Mobility Transistors. IEEE Trans. Electron Devices 2009, 56, 2895–2901. [Google Scholar] [CrossRef] [Scilit]
- Martin-Horcajo, S.; Wang, A.; Romero, M.F.; Tadjer, M.J.; Calle, F. Simple and Accurate Method to Estimate Channel Temperature and Thermal Resistance in AlGaN/GaN HEMTs. IEEE Trans. Electron Devices 2013, 60, 4105–4111. [Google Scholar] [CrossRef] [Scilit]
- Wu, M.; Ma, X.H.; Ling, Y.; Zhu, Q.; Zhang, M.; Yang, L.A.; Hao, Y. Accurate Measurement of Channel Temperature for AlGaN/GaN HEMTs. IEEE Trans. Electron Devices 2018, 65, 4792–4799. [Google Scholar] [CrossRef] [Scilit]
- Xu, Z.; Mandal, S.; Gao, J.; Surdi, H.; Li, W.; Yamaoka, Y.; Piao, G.; Tabuchi, T.; Li, H.; Matsumoto, K.; et al. Discrete-Pulsed Current Time Method to Estimate Channel Thermal Resistance of GaN-Based Power Devices. IEEE Trans. Electron Devices 2018, 65, 5301–5306. [Google Scholar] [CrossRef] [Scilit]
- Li, X.; Feng, S.; Liu, C.; Zhang, Y.; Bai, K.; Xiao, Y.; Zheng, X.; He, X.; Pan, S.; Lin, G.; et al. A Drain-Source Connection Technique: Thermal Resistance Measurement Method for GaN HEMTs Using TSEP at High Voltage. IEEE Trans. Electron Devices 2020, 67, 5454–5459. [Google Scholar] [CrossRef] [Scilit]
- Pavlidis, G.; Pavlidis, S.; Heller, E.R.; Moore, E.A.; Vetury, R.; Graham, S. Characterization of AlGaN/GaN HEMTs Using Gate Resistance Thermometry. IEEE Trans. Electron Devices 2017, 64, 78–83. [Google Scholar] [CrossRef] [Scilit]
- Hara, T.; Funaki, T. Transient Thermal Characterization for GaN HEMTs with p-Type Gate. Trans. Jpn. Inst. Electron. Packag. 2020, 13, E19-002-1–E19-002-13. [Google Scholar] [CrossRef] [Scilit]
- Borghese, A.; Riccio, M.; Longobardi, G.; Maresca, L.; Breglio, G.; Irace, A. Gate Leakage Current Sensing for In Situ Temperature Monitoring of p-GaN Gate HEMTs. Microelectron. Reliab. 2020, 114, 113762. [Google Scholar] [CrossRef] [Scilit]
- Borghese, A.; Di Costanzo, A.; Riccio, M.; Maresca, L.; Breglio, G.; Irace, A. Gate Current in p-GaN Gate HEMTs as a Channel Temperature Sensitive Parameter: A Comparative Study between Schottky- and Ohmic-Gate GaN HEMTs. Energies 2021, 14, 8055. [Google Scholar] [CrossRef] [Scilit]
- Alim, M.A.; Rezazadeh, A.A.; Gaquière, C. Temperature Dependence of the Threshold Voltage of AlGaN/GaN/SiC High Electron Mobility Transistors. Semicond. Sci. Technol. 2016, 31, 125016. [Google Scholar] [CrossRef] [Scilit]
- Etoz, B.; Ortiz-Gonzalez, J.; Deb, A.; Jahdi, S.; Alatise, O. Impact of Threshold Voltage Shifting on Junction Temperature Sensing in GaN HEMTs. In Proceedings of the 2022 24th European Conference on Power Electronics and Applications, Hanover, Germany, 5–9 September 2022. [Google Scholar]
- Shan, Y.; Gao, W.; Huang, Z.; Kuang, W.; Wu, Z.; Zhang, B. Test Methods and Principles of Thermal Resistance for GaN HEMT Power Devices. In Proceedings of the 2020 21st International Conference on Electronic Packaging Technology, Guangzhou, China, 12–15 August 2020. [Google Scholar] [CrossRef] [Scilit]
- Sárkány, Z.; Musolino, M.; Sitta, A.; Calabretta, M.; Németh, M.; Farkas, G.; Rencz, M. Thermal Transient Testing Alternatives for the Characterisation of GaN HEMT Power Devices. In Proceedings of the 2022 28th International Workshop on Thermal Investigations of ICs and Systems, Dublin, Ireland, 28–30 September 2022. [Google Scholar] [CrossRef] [Scilit]
- Lu, S.; Zhang, Z.; Buttay, C.; Ngo, K.D.T.; Lu, G.Q. Improved Measurement Accuracy for Junction-to-Case Thermal Resistance of GaN HEMT Packages by Gate-to-Gate Electrical Resistance and Stacking Thermal Interface Materials. IEEE Trans. Power Electron. 2022, 37, 6285–6289. [Google Scholar] [CrossRef] [Scilit]
- González, B.; Lázaro, A.; Rodríguez, R. RF Extraction of Thermal Resistance for GaN HEMTs on Silicon. IEEE Trans. Electron Devices 2022, 69, 2307–2312. [Google Scholar] [CrossRef] [Scilit]
- Luo, N.; Wen, H.; Liu, W.; Jiang, L. High-Accuracy Thermal Resistance Measurement Method for GaN HEMTs Based on Harmonic Pulsewidth Subthreshold. IEEE Trans. Electron Devices 2025, 72, 186–192. [Google Scholar] [CrossRef] [Scilit]
- Pirosca, A.V.; Vecchio, M.; Rizzo, S.A.; Iannuzzo, F. Evaluation of the Thermal Resistance in GaN HEMTs Using Thermo-Sensitive Electrical Parameters. Energies 2023, 16, 2779. [Google Scholar] [CrossRef] [Scilit]
- Wang, K.; Zhu, Y.; Zhao, H.; Zhao, R.; Zhu, B. Steady-State Temperature-Sensitive Electrical Parameters’ Characteristics of GaN HEMT Power Devices. Electronics 2024, 13, 363. [Google Scholar] [CrossRef] [Scilit]
- Alemanno, A.; Angelotti, A.M.; Gibiino, G.P.; Santarelli, A.; Sangiorgi, E.; Florian, C. A Reconfigurable Setup for the On-Wafer Characterization of the Dynamic RON of 600 V GaN Switches at Variable Operating Regimes. Electronics 2023, 12, 1063. [Google Scholar] [CrossRef] [Scilit]

Disclaimer/Publisher’s Note: The statements, opinions and data contained in all publications are solely those of the individual author(s) and contributor(s) and not of MDPI and/or the editor(s). MDPI and/or the editor(s) disclaim responsibility for any injury to people or property resulting from any ideas, methods, instructions or products referred to in the content. |
© 2026 by the authors. Licensee MDPI, Basel, Switzerland. This article is an open access article distributed under the terms and conditions of the Creative Commons Attribution (CC BY) license.