


Abstract
With the increasing penetration of inverter-based resources (IBRs), maintaining converter-driven stability has become a critical challenge. Static synchronous compensators (STATCOMs) are widely deployed for voltage regulation through rapid injection or absorption of reactive power, making their capability crucial in IBR-dominated systems. However, harmonic resonance between STATCOMs and the grid is a critical concern, since interactions between converter control dynamics and grid impedance can span from sub-synchronous to harmonic frequencies. Most existing impedance-based studies focus on grid-following inverters and seldom capture the combined influence of communication delay, current-controller gain, and grid impedance; they do not address passive-filter-based mitigation. This paper examines the converter-driven stability of a grid-connected STATCOM using impedance-based small-signal analysis, considering inner and outer control loops, communication delay, and grid impedance. Using a modified IEEE nine-bus system, we investigate resonance migration and stability sensitivity to control delay and the current-controller proportional gain, and evaluate a C-type passive filter that improves delay robustness by damping the dominant current-control-loop resonance. The framework is validated through nonlinear electromagnetic-transient (EMT) simulations in MATLAB/Simulink, corroborating the small-signal delay-stability margin within 19.7%.
1. Introduction
The increasing integration of IBRs, such as wind and photovoltaic systems, has significantly altered the dynamic characteristics of modern power systems. As inverter-based generation units lack intrinsic electromechanical inertia and damping, voltage and harmonic stability become increasingly sensitive to control dynamics and network impedance variations [1]. Therefore, maintaining stability and robust control performance under diverse operating conditions has become essential.
STATCOMs are widely used to provide reactive power support and voltage regulation in modern power systems. However, in weak or converter-dominated grids, multiple converters interact through their impedances, and even small variations in controller delay, proportional gain, or passive filter parameters can trigger harmonic resonance and reduce stability margins [1,2,3,4].
Such resonance may occur not only near switching frequencies but also in higher frequency regions influenced by control-loop coupling. To analyze these phenomena, impedance-based frequency-domain modeling and eigenvalue analysis provide a computationally efficient and physically transparent alternative to electromagnetic transient (EMT) simulations. Impedance-domain analysis allows resonance characteristics to be evaluated using the Nyquist criterion and frequency response techniques, while eigenvalue analysis provides insight into dominant oscillatory modes and parameter sensitivity.
Impedance-based stability assessment has become a standard tool for converter-dominated grids since Sun formulated the stability criterion for grid-connected inverters [1]. Building on this framework, cascade-system stability has been examined through source–load impedance interactions [5,6], and passivity-based admittance modeling has been developed to assess grid-connected voltage-source converters (VSCs), including behavior above the Nyquist frequency [7,8]. Foundational analyses of AC/DC system dynamic stability [9] and grid-forming converter operation [10] established modeling practices later extended to inverter-based resources. For STATCOMs specifically, the device topology and reactive-power control have been reviewed extensively [2,3], while more recent studies have revisited small-signal modeling to capture fast dynamic interactions in converter-dominated systems [11], and have analyzed modal propagation using participation factors of complex frequency variables [12]. The stability limits of high-VSC-penetration systems [13] and converter–grid resonance in VSC-HVDC links [14] have also been investigated, and, most directly related to the present study, converter-driven harmonic-resonance instability in VSC-STATCOMs has recently been reported [15]. However, these studies primarily address grid-following VSCs or steady-state resonance and typically treat communication delay as a fixed parameter rather than a stability-determining variable, even though its impact on network-based droop-controlled microgrids has been analyzed [16]. On the mitigation side, C-type passive filters have been designed mainly for steady-state harmonic suppression [17,18] rather than for delay robustness, and existing network-modeling guidance for harmonic studies [19] does not address closed-loop delay margins. Beyond STATCOM-based reactive support, other VSC-based flexible interconnection devices such as soft open points (SOPs) have also been explored for enhancing distribution-system resilience and renewable integration [20,21]. Consequently, the combined influence of communication delay, current-controller gain, and grid impedance on STATCOM harmonic stability—together with its mitigation through passive-filter design—remains insufficiently explored.
In converter-dominated grids, communication delay in digital control can significantly modify system dynamics by shifting critical eigenmodes. While recent studies have advanced impedance-based STATCOM analysis, three critical gaps remain: (i) most works treat communication delay as a fixed nominal value rather than sweeping it to locate the stability boundary, so delay margins are not quantified; (ii) sensitivity analyses are typically conducted on standalone converters, missing the qualitatively different behavior that emerges when the STATCOM interacts with a transmission grid; and (iii) passive-filter design for delay robustness—as opposed to steady-state harmonic mitigation—has rarely been reported. A clear understanding of how dominant oscillatory modes approach and eventually cross into the right-half plane (RHP) as delay increases is essential for determining practical delay margins and ensuring robust controller design.
This paper develops an integrated impedance-domain small-signal framework that incorporates control delay, current-loop dynamics, and grid impedance interaction to analyze STATCOM harmonic stability. The effects of key control parameters—communication delay and current-controller proportional gain—are systematically examined. In addition, the stabilizing effect of a C-type passive filter is evaluated, demonstrating how passive damping can mitigate resonance and extend the allowable delay margin. The proposed analysis is demonstrated on a modified IEEE nine-bus test system representative of transmission-level applications.
The main contributions of this paper are summarized below:
- (1)
- An integrated impedance-domain small-signal framework is formulated for a grid-connected STATCOM, incorporating the inner current loop, DC-link voltage loop, PLL, communication delay (using a second-order Padé approximation), and grid impedance dynamics within a single state-space representation.
- (2)
- The framework is applied to systematically quantify the sensitivity of the dominant resonance mode to (i) the inner-current-controller proportional gain and (ii) the communication delay, revealing a two-sided grid-connected stability window 0.0558 ≤ ≤ 1.22 and a delay margin of 127.30 μs.
- (3)
- A C-type passive filter is designed (100 Hz trap, R = 25 kΩ) to extend the small-signal delay-stability margin by a factor of 1.69 (127.30 → 214.65 μs) without introducing a new low-frequency interaction mode. Nonlinear EMT simulation confirms that the filter-enabled configuration remains stable well beyond the no-filter margin (Section 3.6).
The primary methodological contribution is the integrated state-space framework that couples communication delay, current-loop dynamics, and grid impedance within a single small-signal model (Contribution 1). The C-type filter (Contribution 3) is a specific application of this framework to delay-margin extension, not a claim of filter-design novelty per se—its parameters are derived from, and validated within, the same delay-sensitivity framework.
The remainder of this paper is organized as follows. Section 2 develops the impedance-based small-signal model of the grid-connected STATCOM, including control and communication-delay modeling, the modified IEEE nine-bus configuration, the C-type filter model, and the sensitivity-analysis cases. Section 3 presents the small-signal and nonlinear EMT results, covering the communication-delay and proportional-gain sensitivities, the C-type-filter stability improvement, and the quantitative delay-margin validation. Finally, Section 4 concludes the paper and outlines directions for future work.
2. Methodology for Impedance-Based Modeling
2.1. Impedance-Based Modeling for Electrical Systems
The impedance-based modeling method describes the small-signal voltage–current relationships of each subsystem using a linearized state-space representation around a steady-state operating point. For a generic subsystem, the dynamics can be expressed as
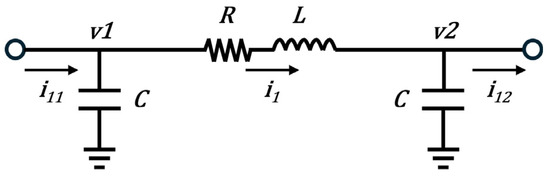
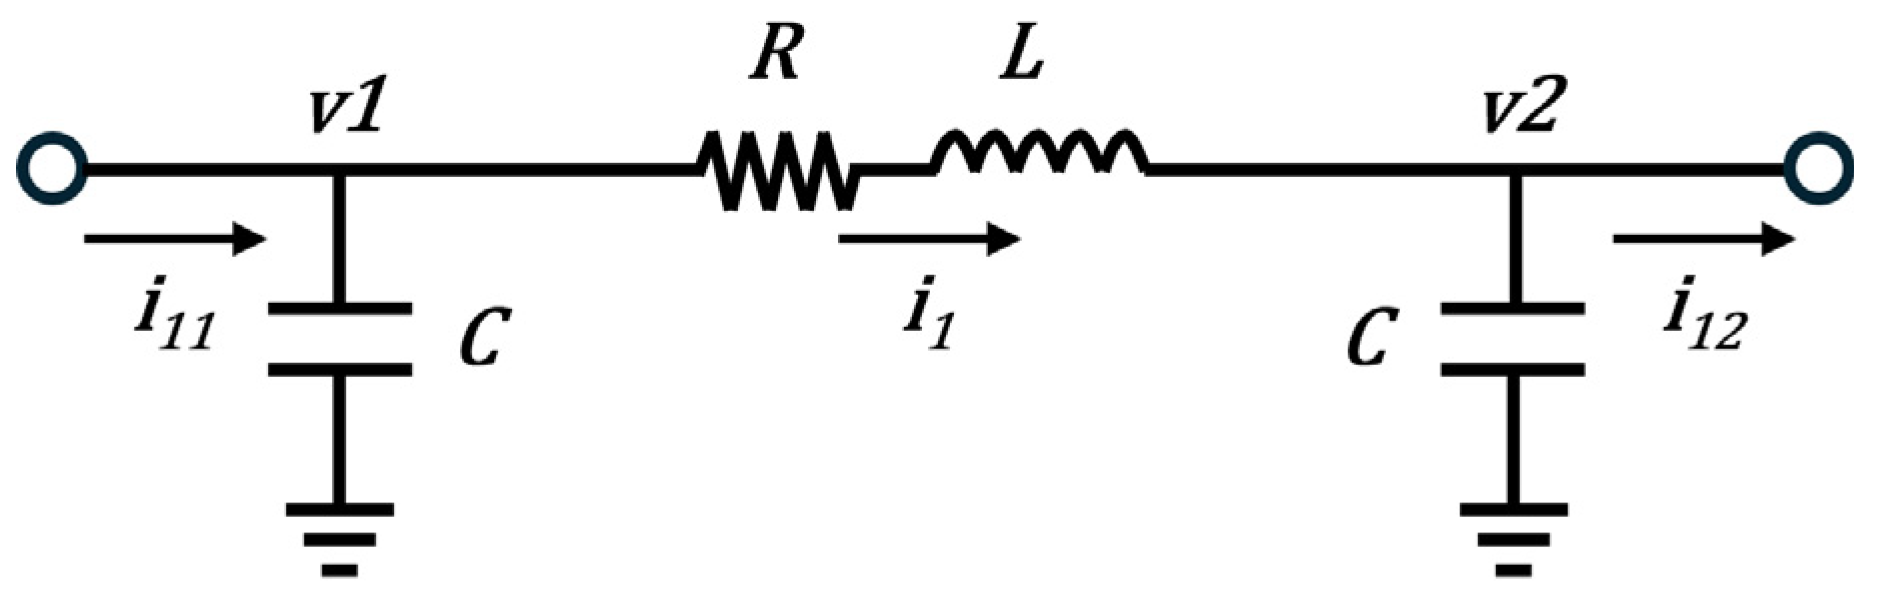
As a representative example, the π-section transmission line is formulated in the synchronous d-q reference frame. The dynamic states originate from the energy storage elements of the shunt capacitors and the series inductor (Figure 1).
Figure 1.
-section line diagram for the state-space representation.
By expressing the differential voltage–current relationships of these elements and linearizing them around the steady-state operating point, the subsystem can be represented in state-space form. This formulation enables modular interconnection with other subsystems through their input–output relationships.
The state, input, and output vectors of the π-line are defined as follows:
where v1 and v2 denote the terminal capacitor voltages at both ends of the π-section, and i1 represents the series inductor current. All variables are expressed in the synchronous d-q reference frame rotating at angular frequency ω [4].
In this formulation, the state variables represent the dynamic quantities associated with the energy storage elements of the subsystem, while the inputs correspond to external current injections and the outputs represent terminal voltages. When voltage is selected as the output variable, the resulting transfer function can be expressed in impedance form [5,6]. Each subsystem—grid equivalent, transmission line, passive elements, and converter control—is modeled individually in state-space form and is interconnected through its input–output relationships. This modular structure enables systematic assembly of the overall small-signal model [9].
The impedance-domain representation provides a convenient framework for harmonic stability analysis, as it directly reveals resonance characteristics and their sensitivities to control parameters through eigenvalue and frequency-domain analysis.
2.2. Control and Delay Modeling
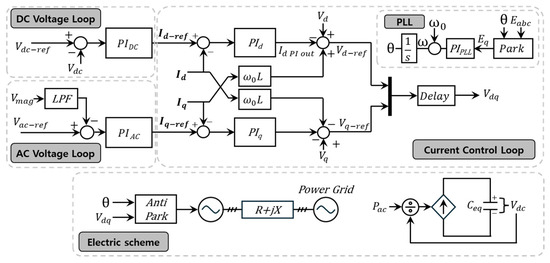
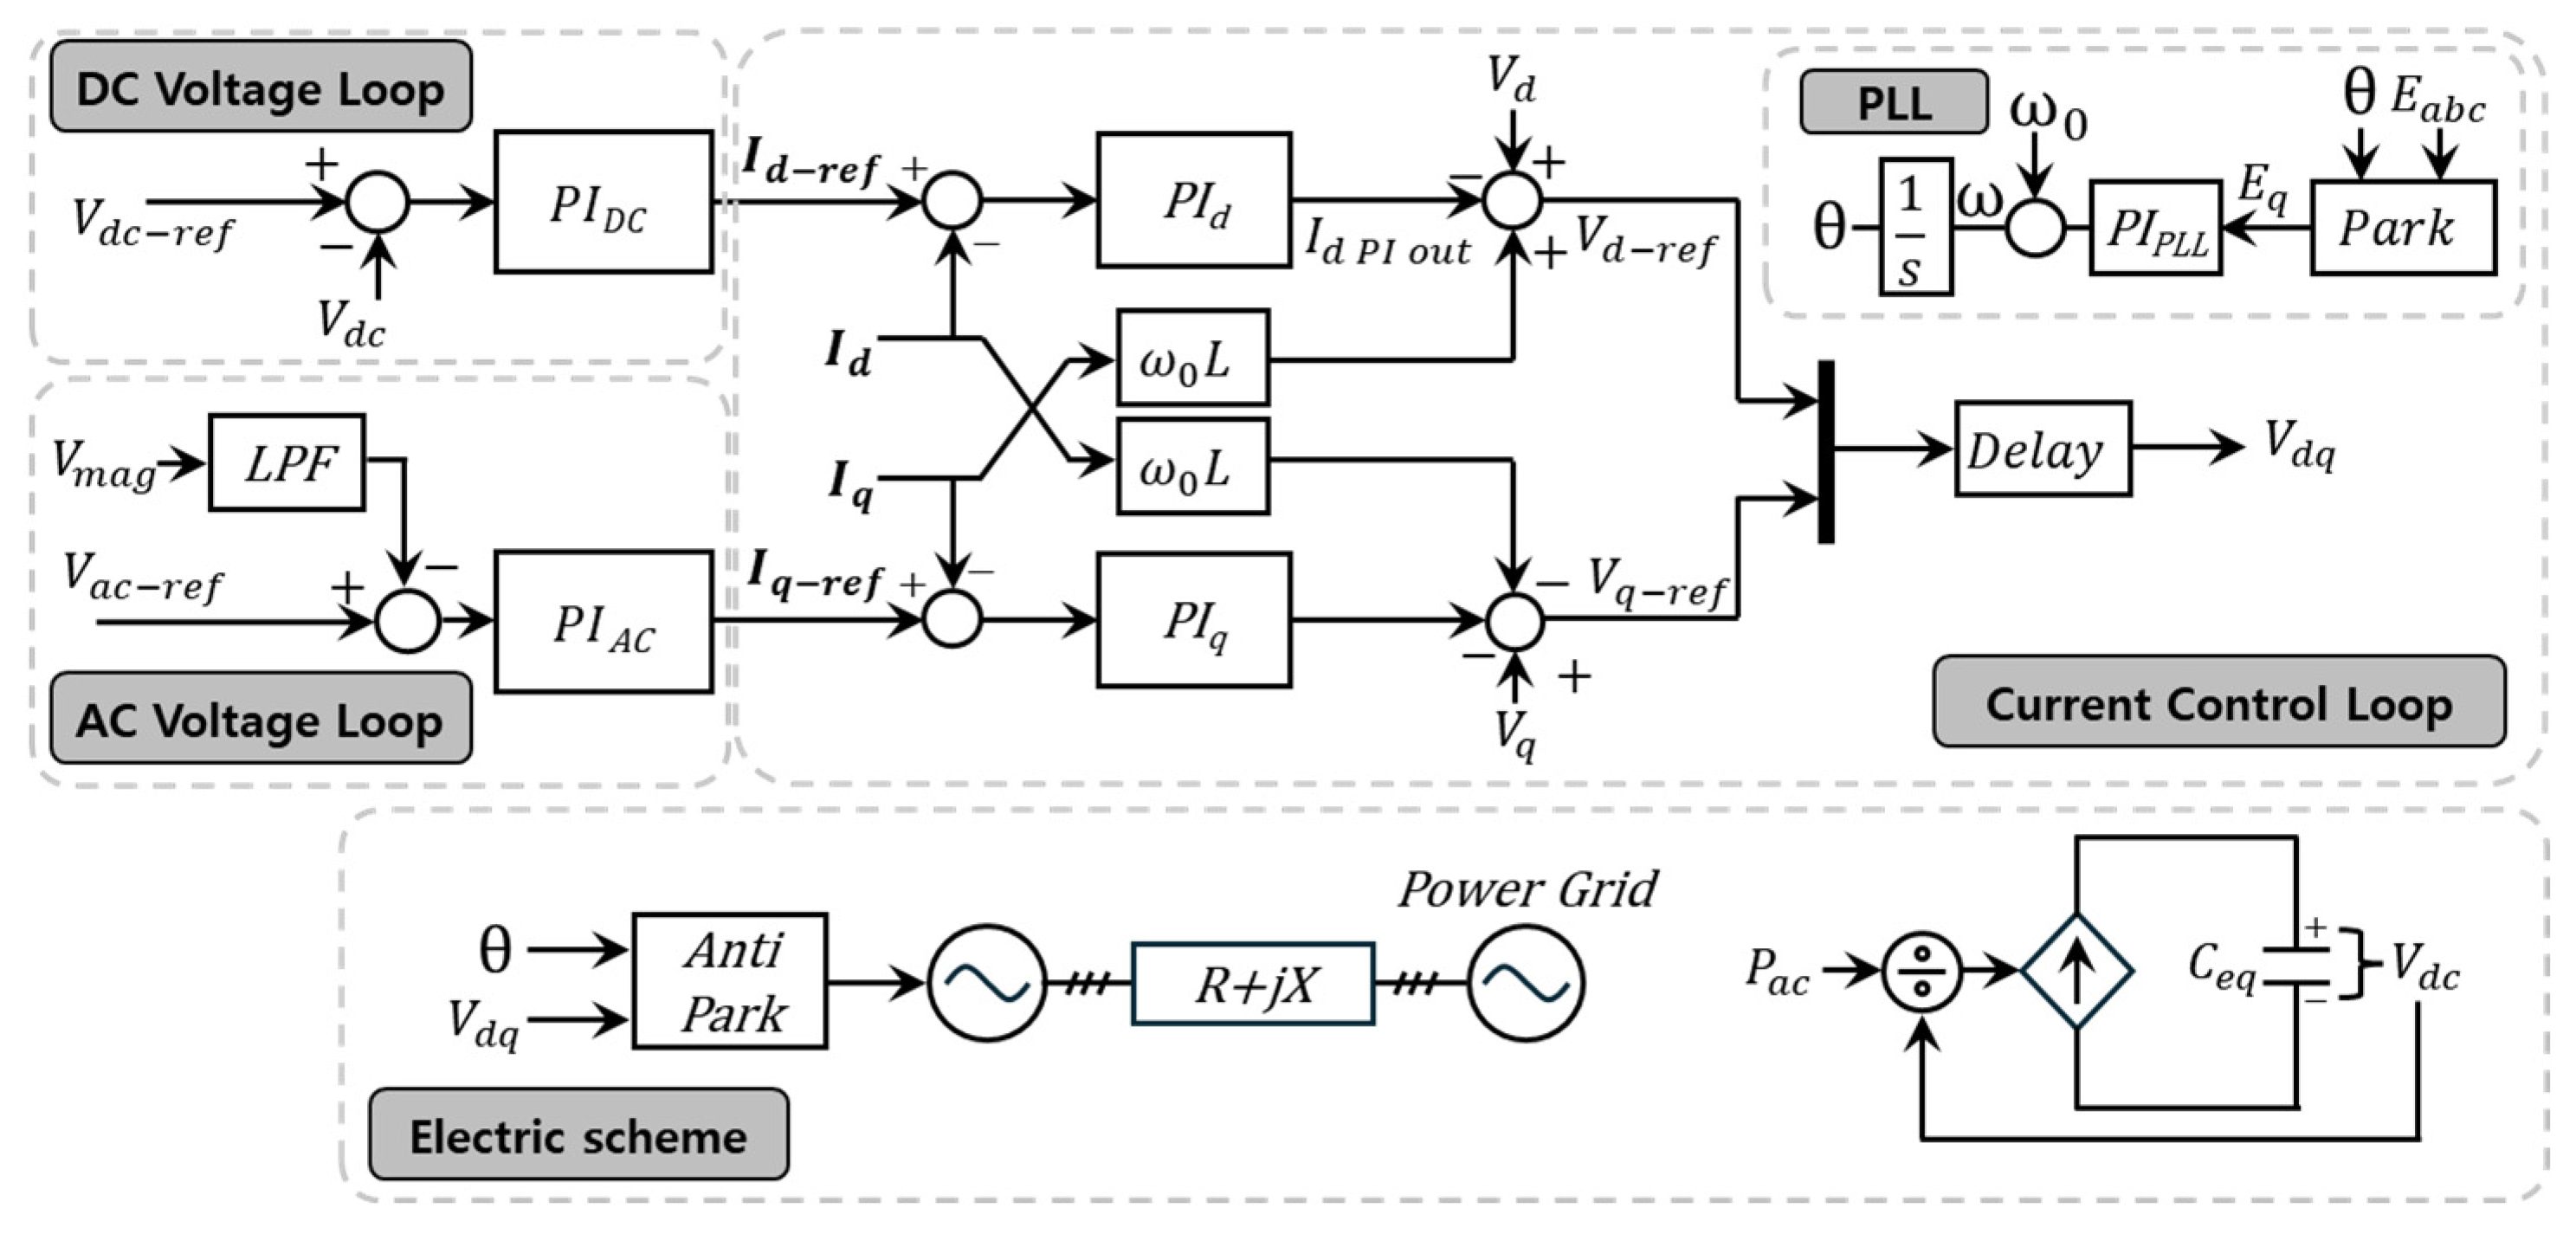
The STATCOM control system consists of an inner current control loop, a DC-link voltage controller, an AC voltage support loop, DC power conversion, and an external average voltage source model, as illustrated in Figure 2. All control components are formulated in the synchronous d-q reference frame and linearized around the steady-state operating point [10,11].
Figure 2.
Control scheme of the STATCOM.
The AC voltage support loop uses the voltage magnitude at the point of common coupling (PCC). In the d-q frame, the small-signal perturbation of the voltage magnitude around the operating point can be approximated as follows:
Here, and denote the steady-state d- and q-axis components of the PCC voltage at the linearization operating point. where represents the steady-state voltage magnitude at the PCC [12].
To attenuate measurement noise and high-frequency disturbances, the resulting signal is processed through a first-order low-pass filter.
The LPF dynamics are explicitly included in the state-space model because they introduce additional phase lag that may influence harmonic stability in the intermediate frequency range.
The DC-link voltage controller and the AC voltage controller are implemented as proportional-integral (PI) regulators:
The DC controller generates the q-axis current reference based on the DC-link voltage error, while the AC voltage controller regulates the d-axis current reference according to the PCC voltage deviation. These outer loops operate at a lower bandwidth than the inner current loop, and they introduce additional low-frequency dynamics into the system.
The inner current controller is also implemented as a PI regulator:
where and are the proportional and integral gains of the inner current controller, respectively. Cross-coupling compensation terms () are included to decouple the d- and q-axis dynamics under steady-state conditions. The bandwidth of the current loop is significantly higher than that of the outer voltage loops [13].
Since the STATCOM is digitally controlled and operates at frequencies of up to several kilohertz, communication and processing delays must be considered. A pure delay is expressed as
However, this exponential form cannot be implemented directly in state-space representation. Therefore, the delay term is approximated using a second-order Padé approximation expression:
The second-order Padé approximation preserves the dominant phase-lag behavior of the delay while avoiding non-rational terms, enabling state-space realization for eigenvalue and impedance analysis [15]. A second-order approximation was adopted in preference to the first-order form because it more accurately reproduces the phase lag of the true delay near the frequencies relevant to the current-control-loop resonance, thereby improving the fidelity of the eigenvalue-based delay-margin prediction while remaining low-order enough to avoid spurious poles.
A synchronous reference frame phase-locked loop (SRF-PLL) is employed to synchronize the converter d-q reference frame with the grid voltage. The d-axis voltage component is used as the phase error signal:
The loop filter is implemented as a PI controller:
The electrical angle is obtained by integrating the frequency deviation:
Thus, the small-signal transfer function from the phase error to the angle perturbation is
The PLL introduces additional dynamic coupling between voltage perturbations and current control loops. Under weak-grid conditions, this interaction may significantly affect harmonic stability and damping characteristics.
2.3. IEEE 9-Bus System Configuration
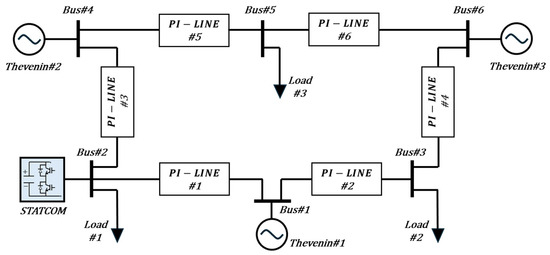
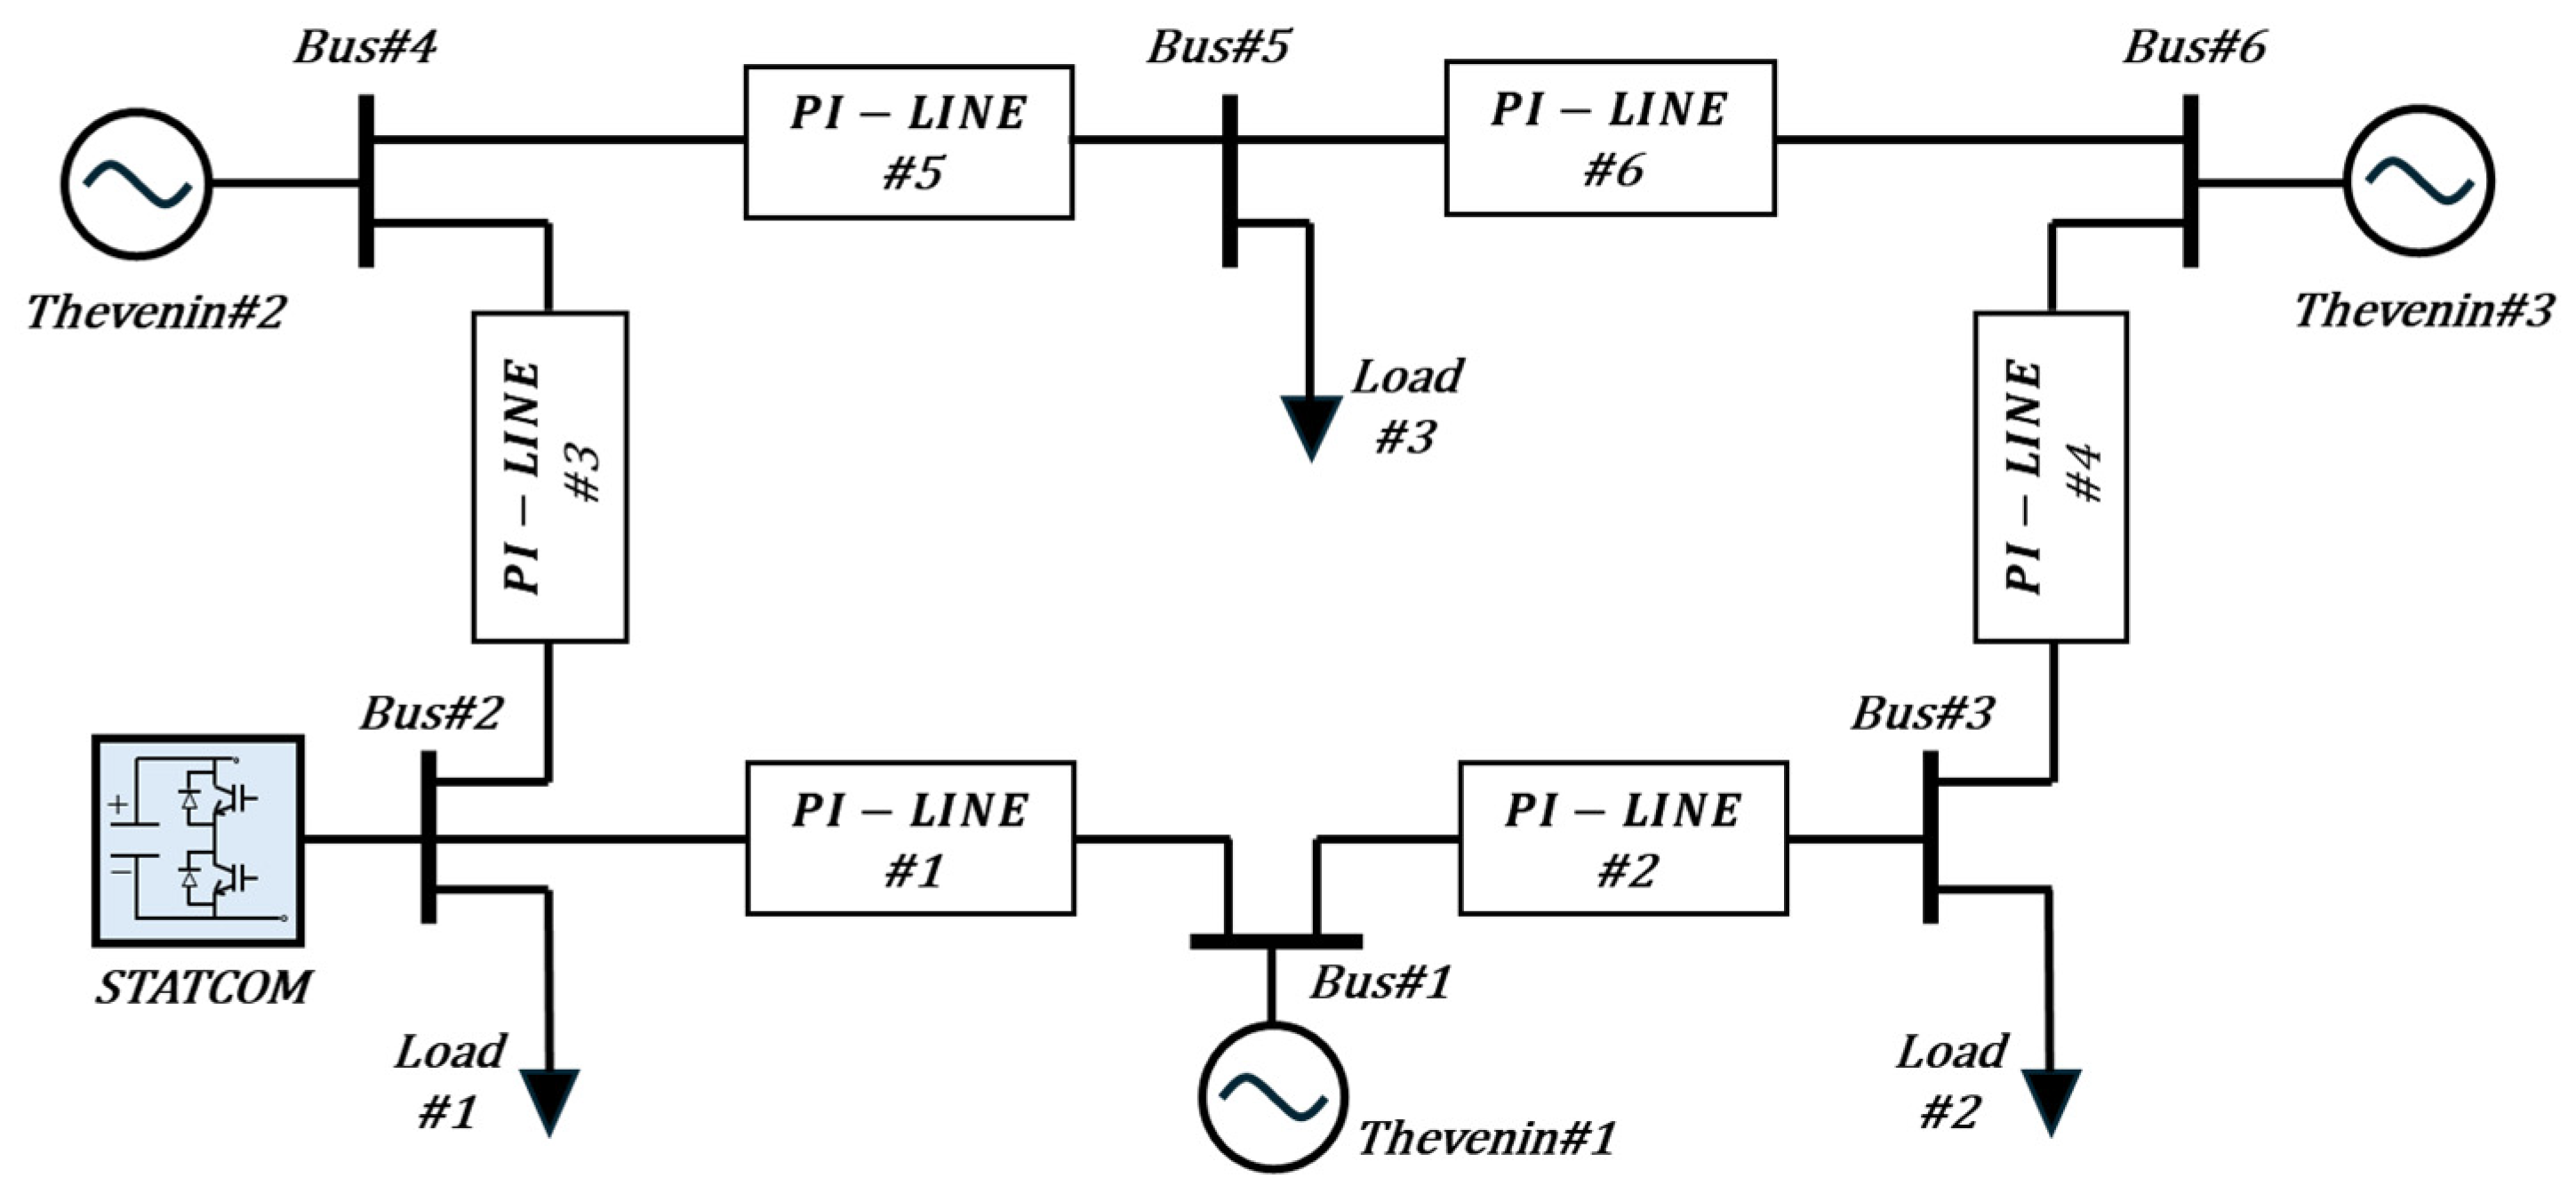
The analytical study is conducted on a STATCOM connected to the modified IEEE 9-bus test system, as illustrated in Figure 3 [4]. The electrical parameters of the equivalent source, transmission line, and loads are listed in Table 1. To represent a weak-grid scenario relevant to renewable energy integration, the equivalent Thevenin source reactance is chosen as X = 1.0 p.u. on the system base, resulting in reduced short-circuit strength at the point of common coupling [19].
Figure 3.
Single-line diagram of the modified IEEE 9-bus test system with a STATCOM connection.
Table 1.
IEEE 9-bus system parameters.
The STATCOM is rated at 200 MVA and is connected at 138 kV. The base quantities are 200 MVA (STATCOM side) and 100 MVA (transmission network). The steady-state operating point is obtained from a power-flow solution, and the small-signal linearization is performed around this equilibrium condition. This configuration enables comparative harmonic-resonance and eigenvalue analysis for both the STATCOM and the grid-connected system.
2.4. C-Type Filter Modeling
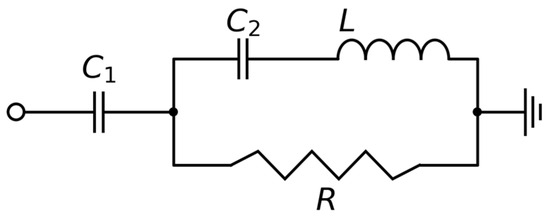
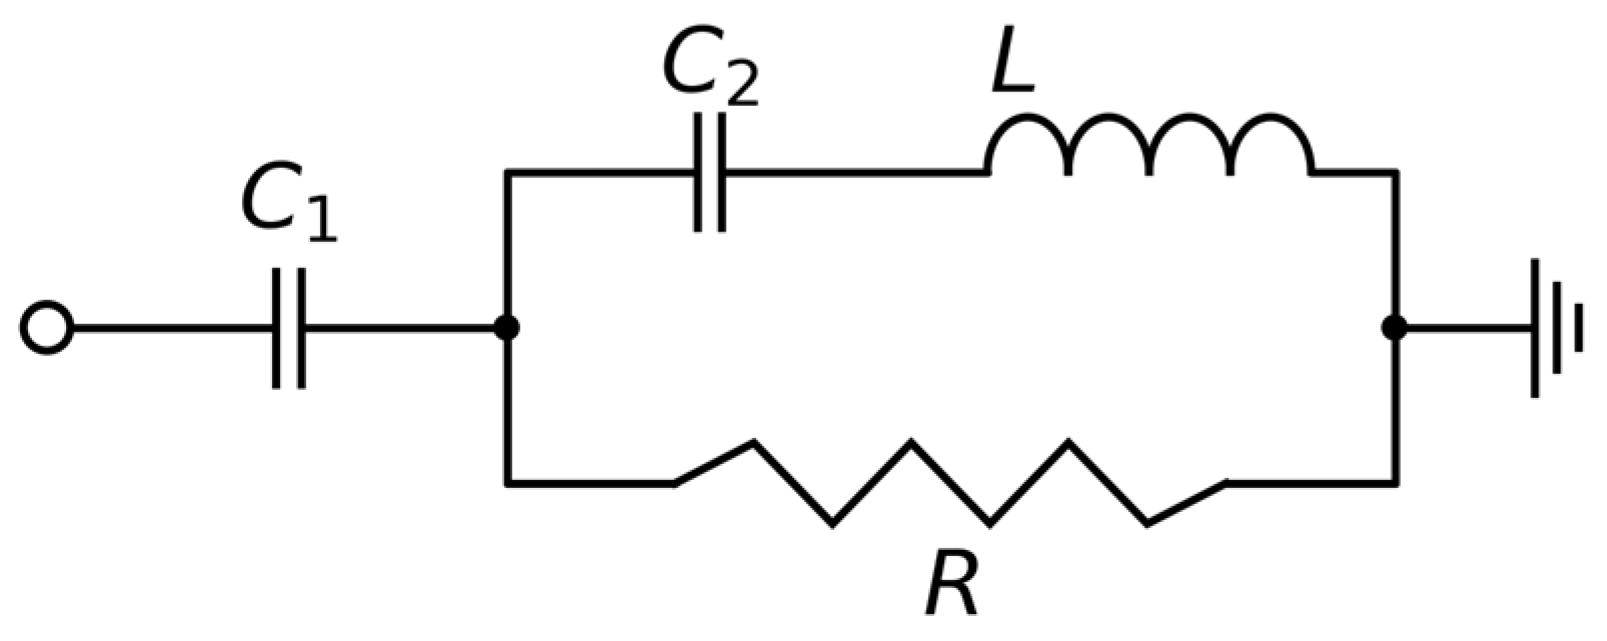
Figure 4 illustrates the structure of the C-type passive filter connected at the STATCOM terminal. The filter consists of a series capacitor C1, followed by a parallel network formed by a series L–C2 branch and a damping resistor R [17]. The filter parameters are selected as , , , and .
Figure 4.
C-type filter diagram.
The filter mitigates harmonic interaction and improves robustness against the delay-induced instability identified above. The L–C2 branch is designed to approach resonance at the trap frequency (100 Hz), thereby bypassing the damping resistor R at that frequency and minimizing resistive losses. Meanwhile, the overall characteristic forms a frequency-selective, low-impedance path near the targeted harmonic order.
Within the impedance-domain modeling framework, the filter is represented as an additional shunt admittance at the point of common coupling, directly influencing the system’s admittance characteristics and subsequent eigenvalue analysis.
2.5. Sensitivity Analysis Cases
Table 2 summarizes the STATCOM control parameters considered in the sensitivity analysis. Three cases are investigated: (i) variation in communication delay applied to the digital control signal at the output of the inner current controller, (ii) variation in the proportional gain of the inner current controller, and (iii) communication delay variation with the C-type filter enabled. The communication delay is swept up to 300 μs without the filter and up to 240 μs with the C-type filter, with the exact delay-stability margins localized within these ranges by bisection; the admittance sensitivity plots (Section 3.1 and Section 3.2) use a representative 60 μs to 120 μs sub-range in 10 μs increments, corresponding to realistic delays in digital control and communication interfaces of medium-voltage converter systems. The proportional gain of the inner current controller is varied from 0.1 to 1.5 to examine its influence on damping characteristics and resonance migration. All other control parameters and network conditions are maintained at their nominal values unless otherwise specified. This approach evaluates the impact of each parameter on eigenvalue migration and harmonic-resonance characteristics, enabling systematic identification of stability-sensitive regions.
Table 2.
STATCOM control parameters for sensitivity analysis.
3. Results
This section presents the small-signal admittance- and eigenvalue-based analysis of the grid-connected STATCOM, followed by nonlinear electromagnetic-transient (EMT) validation, for the sensitivity cases defined in Section 2.5. All analyses in this section are performed for a single coordinated STATCOM control-gain set, so that the reported resonance behavior, delay margins, and gain sensitivities all characterize the same validated controller design. The coordinated gains, and the rationale used to derive them, are described next and summarized in Table 3.
Table 3.
Coordinated STATCOM control-gain settings.
The STATCOM’s outer AC-voltage control loop (low-pass filter time constant , feed-forward gain , integral gain ), the phase-locked loop, the inner current-control loop, and the DC-link voltage control loop were coordinated as a single tuned set rather than adjusted independently. and were tuned to 75 and 750 (system-base per-unit), respectively, through coordinated design across the STATCOM’s DC-link and AC-side control loops to achieve a well-damped closed-loop response. The DC-link capacitance time constant, = 0.01 s, corresponds to the converter’s physical submodule design (7 mF per submodule) referred to the DC-link base. The resulting coordinated gain set is listed in Table 3.
The delay parameter , modeled as a second-order Padé approximation of a pure time delay, is used to represent the combined effect of the inter-controller communication delay and the controller’s own execution/processing delay as a single equivalent time delay, since the present model does not implement a separately discretized zero-order-hold controller-execution stage. The measurement delay is modeled independently as a fixed first-order lag (50 μs) and held constant throughout the analysis below.
3.1. Sensitivity Analysis of Communication Delay
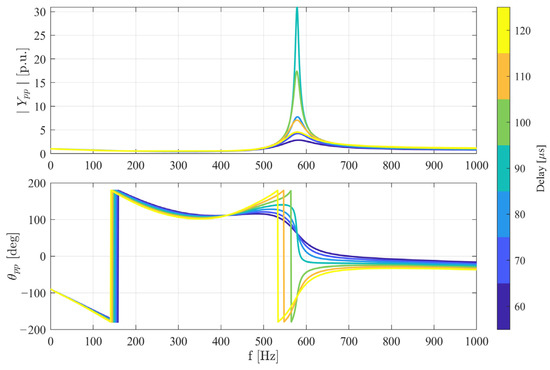
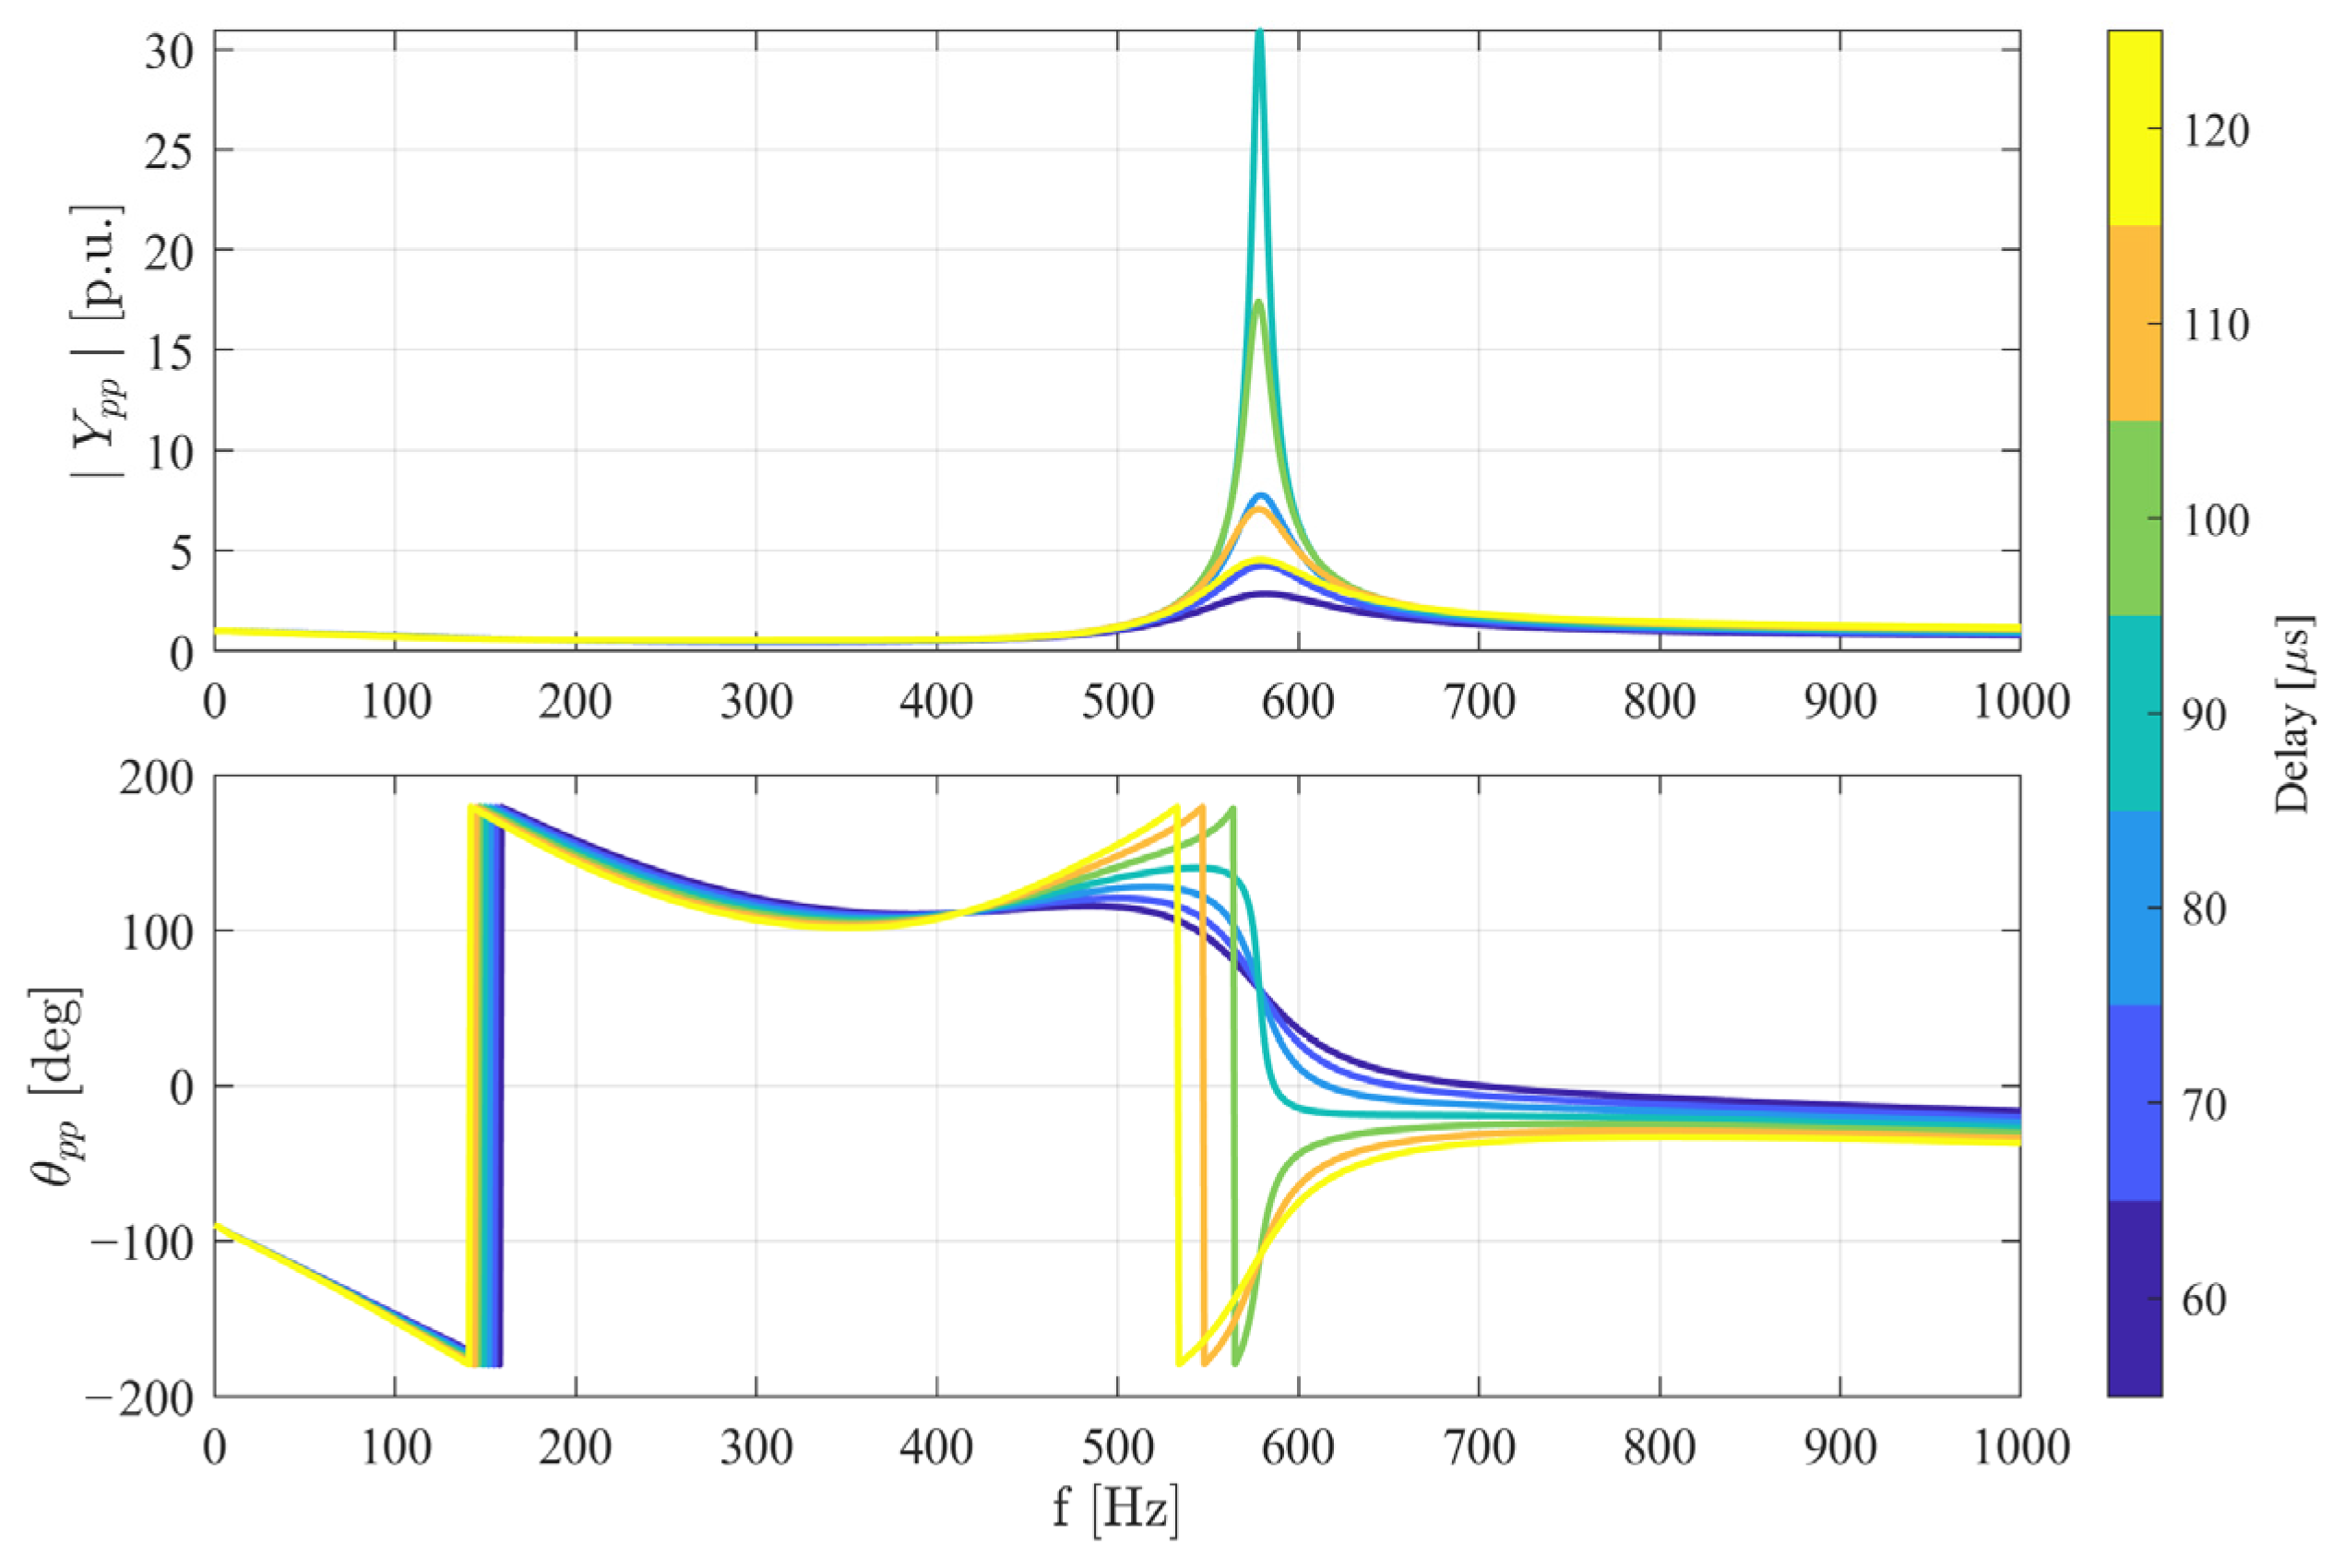
With the coordinated gain set and no C-type filter, the standalone STATCOM terminal admittance exhibits a pronounced resonance peak near 580 Hz, as shown in Figure 5. As the communication delay is increased from 60 μs to 120 μs, the resonance frequency remains almost unchanged (the peak stays close to 579 Hz), whereas the peak magnitude varies non-monotonically with delay: || grows sharply as the delay approaches the standalone stability boundary, reaching its maximum for the 90 μs curve—the sampled delay closest to the 93.51 μs instability threshold identified below—and then diminishes for the 100–120 μs curves, which lie beyond that threshold and therefore represent the frequency response of the already-unstable standalone model as the dominant poles migrate deeper into the right-half plane. The admittance phase rotates most steeply through the resonance near this boundary delay. This behavior reflects the additional phase lag introduced by the communication delay in the control interconnection: the delay does not move the resonance frequency appreciably but erodes its damping, driving the associated dominant poles toward the right-half plane (RHP) and increasing the risk of oscillatory instability [16].
Figure 5.
Standalone STATCOM terminal admittance (magnitude || and phase ) for communication delays from 60 μs to 120 μs, computed with the coordinated control-gain set and no C-type filter.
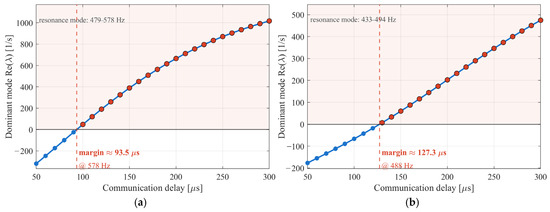
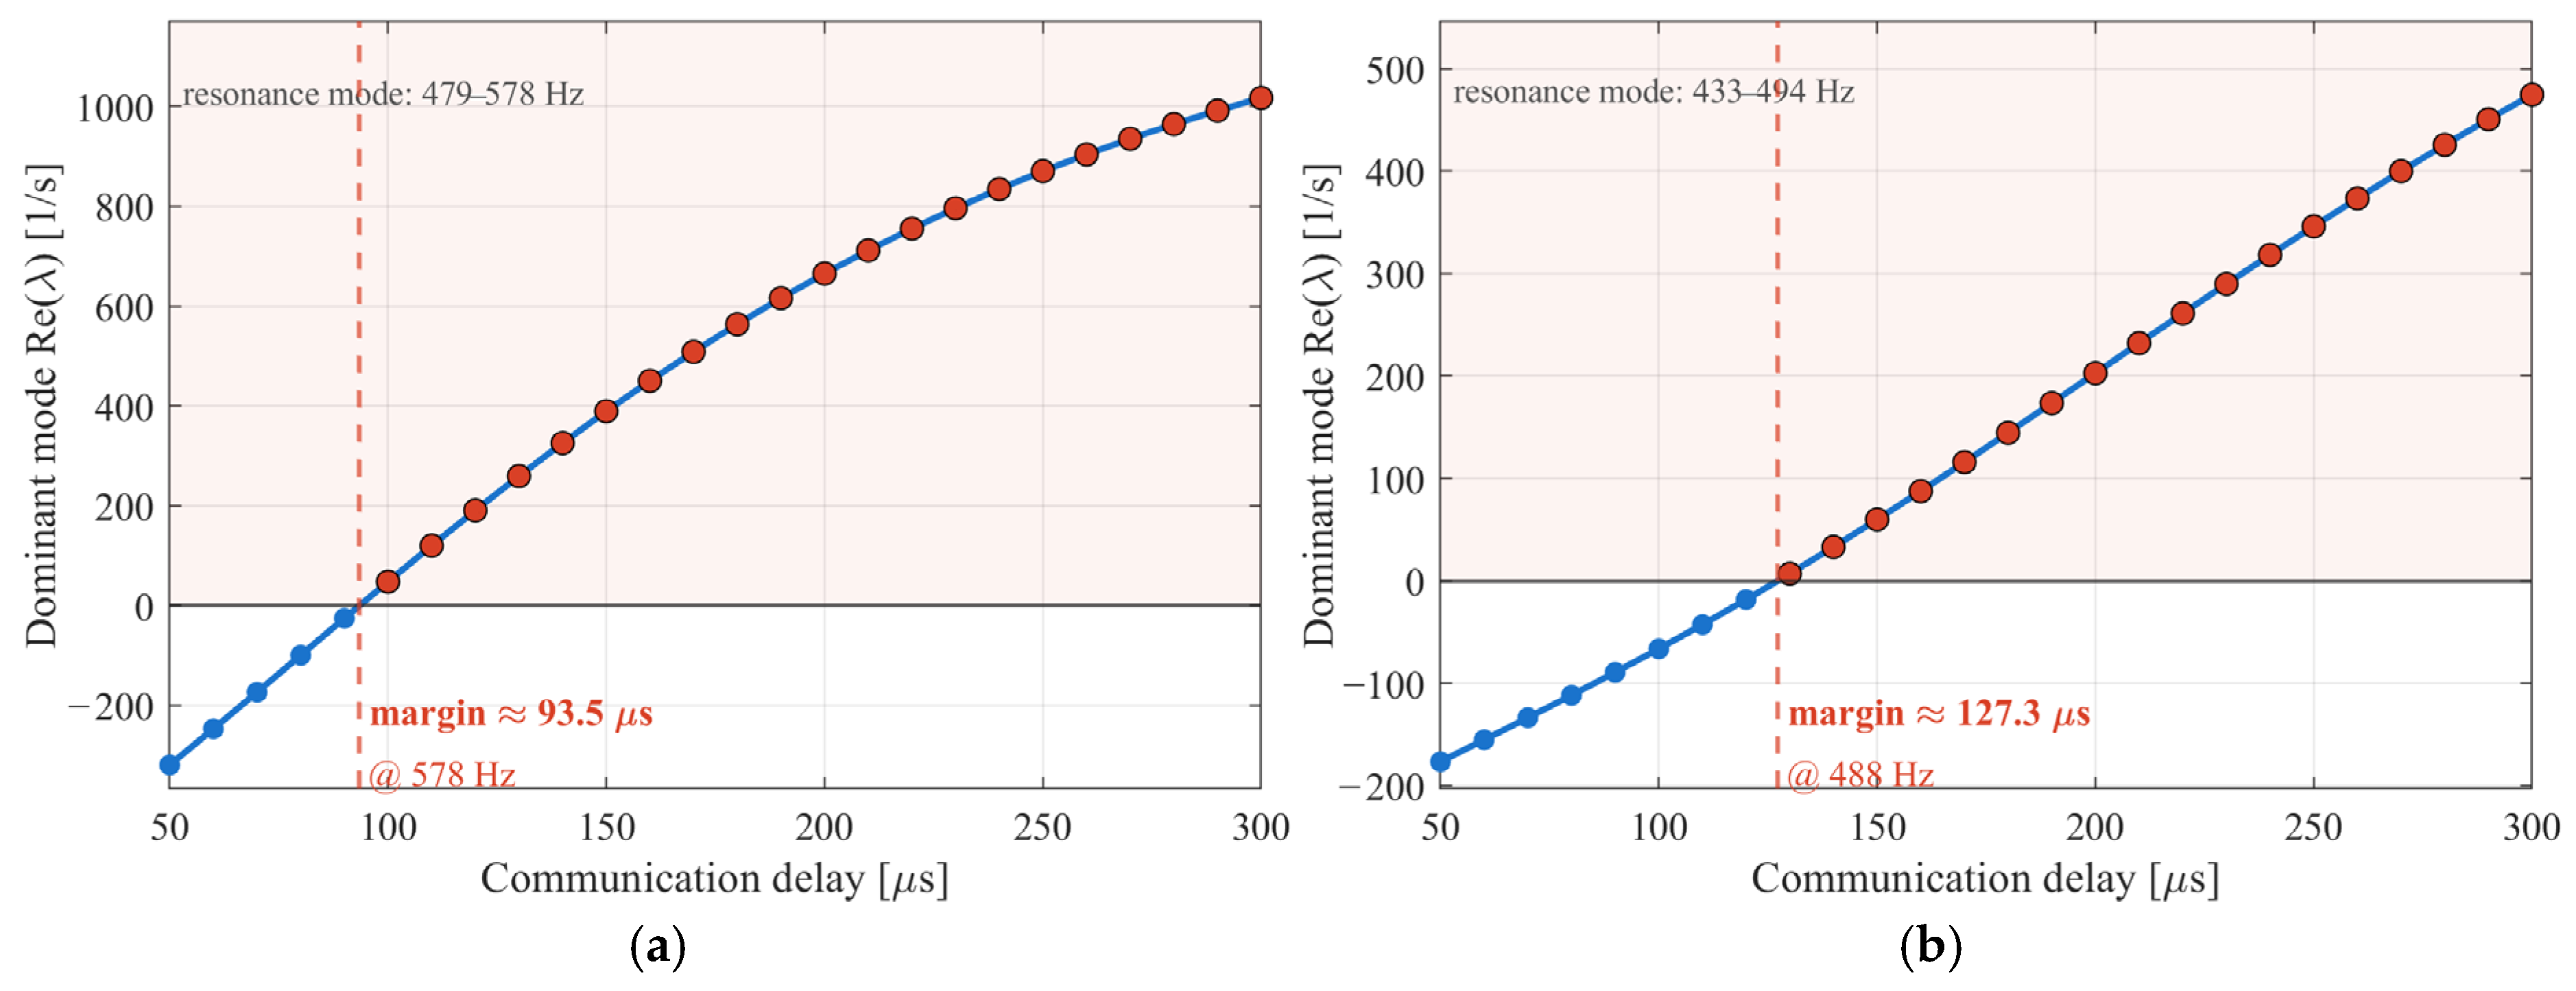
Eigenvalue analysis quantitatively confirms this loss of damping. For the standalone STATCOM, the dominant resonance mode—a lightly damped complex-conjugate pole pair near 578 Hz—migrates steadily toward the RHP as the communication delay increases, as shown in Figure 6a. Its real part crosses the imaginary axis at a communication delay of approximately 93.51 μs, at an oscillation frequency of about 578.29 Hz; beyond this delay, the standalone converter is small-signal unstable. As the delay is increased further, the oscillation frequency of this pole pair decreases gradually (from about 578 Hz near the margin toward 479 Hz at 300 μs), reflecting the continued migration of the dominant poles deeper into the right-half plane.
Figure 6.
Migration of the dominant resonance-mode real part with communication delay, computed with the coordinated control-gain set and no C-type filter: (a) standalone STATCOM, delay-stability margin ≈ 93.51 μs at ≈578 Hz; (b) STATCOM connected to the IEEE 9-bus system, delay-stability margin ≈ 127.30 μs at ≈488 Hz. Markers denote the sampled communication delays; blue: stable (Re(λ) < 0), red: unstable (Re(λ) > 0). Red dashed line: delay-stability margin; shading: unstable region.
When the STATCOM is connected to the modified IEEE nine-bus transmission system, interaction with the grid impedance modifies the resonance characteristics [14]. The dominant crossing frequency shifts to approximately 487.75 Hz, reflecting the combined effect of the converter admittance and the external network impedance, and the migration of this mode toward the RHP is illustrated in Figure 6b. In the grid-connected configuration, the delay-stability margin is approximately 127.30 μs—larger than the 93.51 μs of the standalone converter—indicating that the external grid impedance adds effective damping to the current-control-loop resonance and extends the allowable delay. Eigenvector participation analysis identifies this crossing as a communication/control-delay-driven current-control-loop resonance, dominated by the current-loop delay states and the associated interface-reactor states, with only minor participation from the DC-link voltage state and negligible participation from the PLL states, rather than a DC-voltage-loop or PLL instability. Notably, no separate low-frequency grid-interaction mode approaches the imaginary axis over the swept delay range: the maximum real part of any eigenvalue in the 5–80 Hz band remains deeply damped, so the binding constraint in the grid-connected case is the same ≈488 Hz current-loop resonance.
This counter-intuitive extension of the margin can be understood from the frequency at which the instability occurs. The additional series impedance of the external network—beyond the STATCOM’s own interface reactor—raises the effective loop inductance seen by the current controller. As a result, the dominant current-loop crossover frequency decreases from about 578 Hz in the standalone case to about 488 Hz when grid-connected. Because the phase loss to a fixed communication delay is proportional to frequency (phase lag ≈ delay × frequency), a lower-frequency loop can tolerate a larger delay before its phase margin is exhausted. This is why grid connection extends rather than reduces the delay margin here. However, the trend is a consequence of the delay-limiting instability of this particular design being current-loop-dominated, with negligible PLL participation in the critical mode. Systems whose delay-limiting mechanism is instead PLL-bandwidth-dominated, as is common in weak-grid voltage-source-converter studies, can exhibit the opposite behavior. Connection to a weak grid can then destabilize the PLL loop. The present result should therefore not be generalized to other STATCOM or converter control designs, or to other grid strengths, without case-specific verification.
These results show that communication delay erodes the damping of the STATCOM’s current-control-loop resonance in both the standalone and grid-connected configurations, and that grid interaction—rather than introducing a new low-frequency instability—actually relaxes the delay limit for this coordinated design, from 93.51 μs standalone to 127.30 μs grid-connected. The 127.30 μs grid-connected small-signal margin established here serves as the reference delay margin for the coordinated design and is validated against nonlinear EMT simulations in Section 3.4 and Section 3.5.
3.2. Sensitivity Analysis on the Effect of Current Controller P Gain
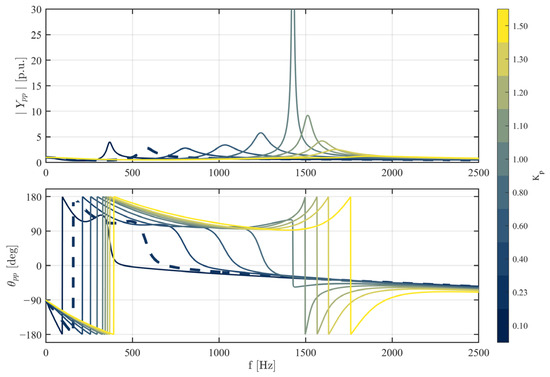
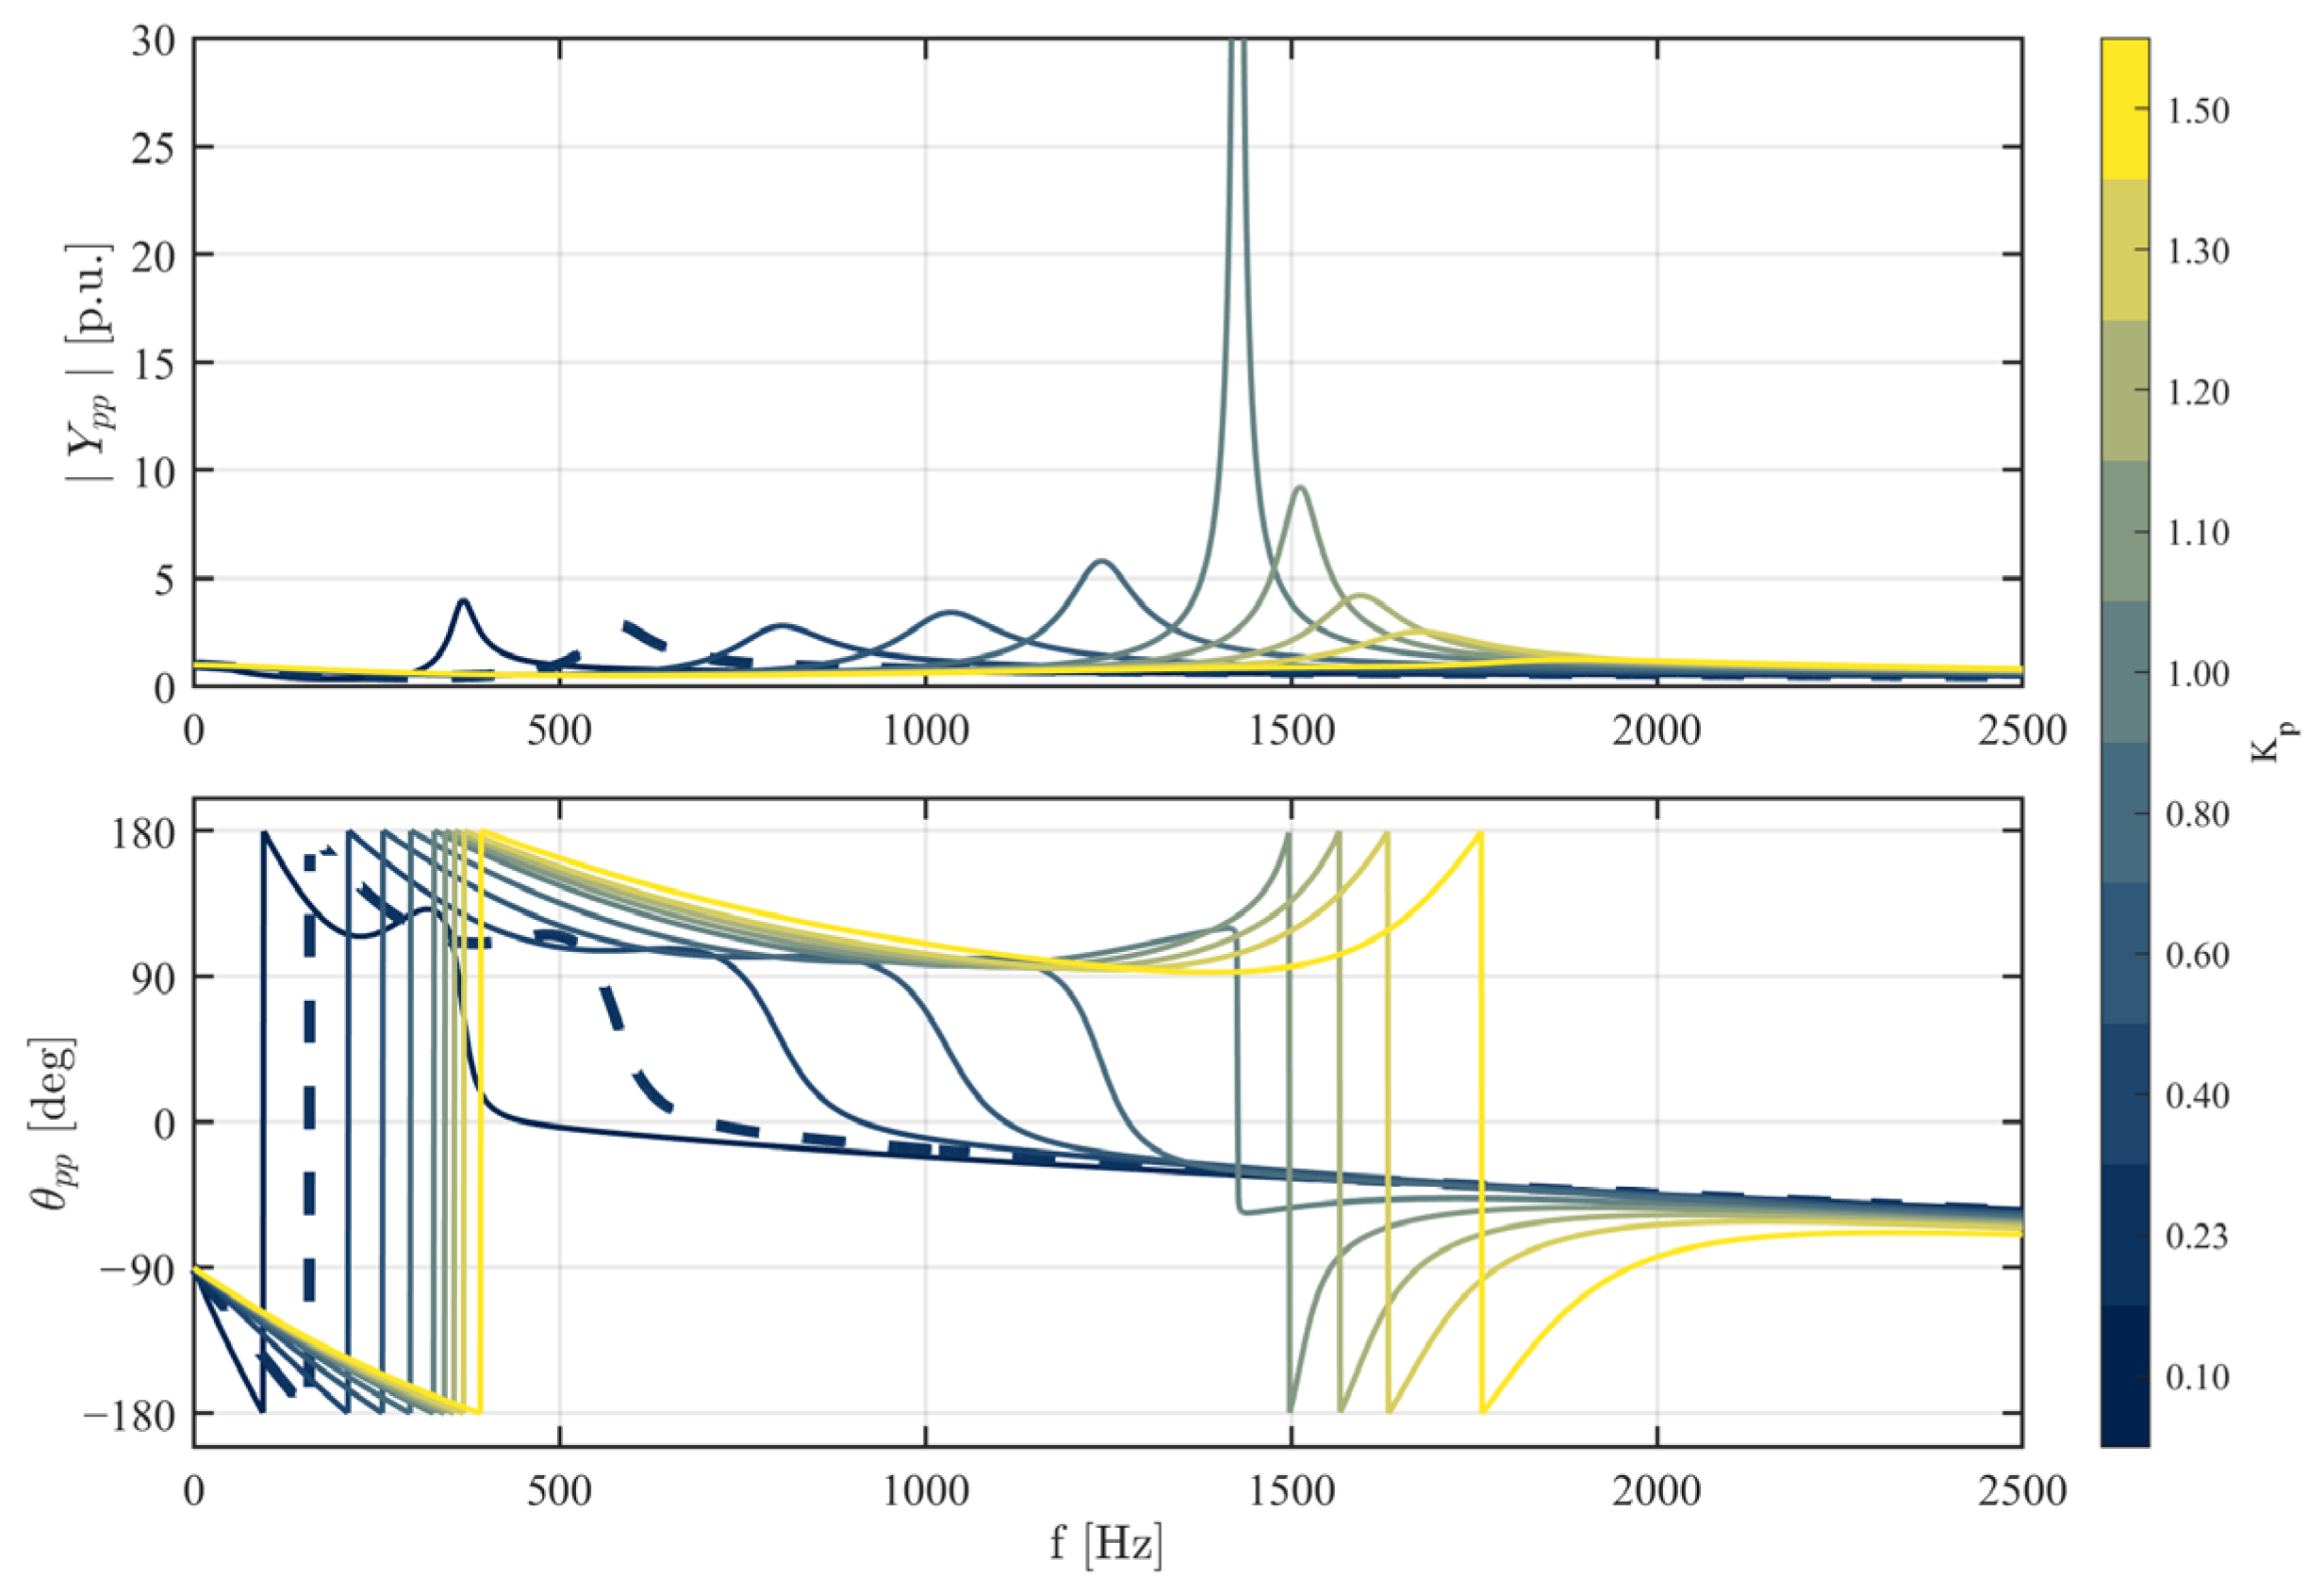
The second sensitivity considered is the proportional gain of the inner current controller (), varied about its coordinated operating value of 0.23 while all other gains are held at their coordinated values and the communication delay is fixed at the nominal 60 μs. Figure 7 shows the standalone STATCOM admittance as is swept from 0.1 to 1.5. As increases, the dominant admittance resonance peak migrates monotonically toward higher frequencies—from approximately 369 Hz at = 0.1, through 582 Hz at the coordinated value = 0.23, to about 1.8 kHz at = 1.5. This shift shows that raising the current-loop proportional gain stiffens the inner-loop dynamics and pushes the dominant resonance mode into a higher-frequency range [7,14]; the coordinated value = 0.23 places this resonance near 580 Hz, consistent with Figure 5 and Figure 6.
Figure 7.
Standalone STATCOM terminal admittance (magnitude || and phase ) as the inner current-controller proportional gain () is varied from 0.1 to 1.5, with all other gains at their coordinated values and the communication delay fixed at 60 μs. The coordinated operating value = 0.23 is highlighted. Line color: proportional gain per the colorbar (0.10 to 1.50, dark blue to yellow); thick dashed dark-blue curve: coordinated operating value.
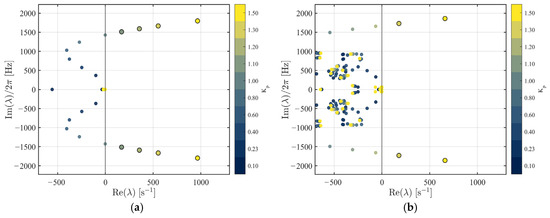
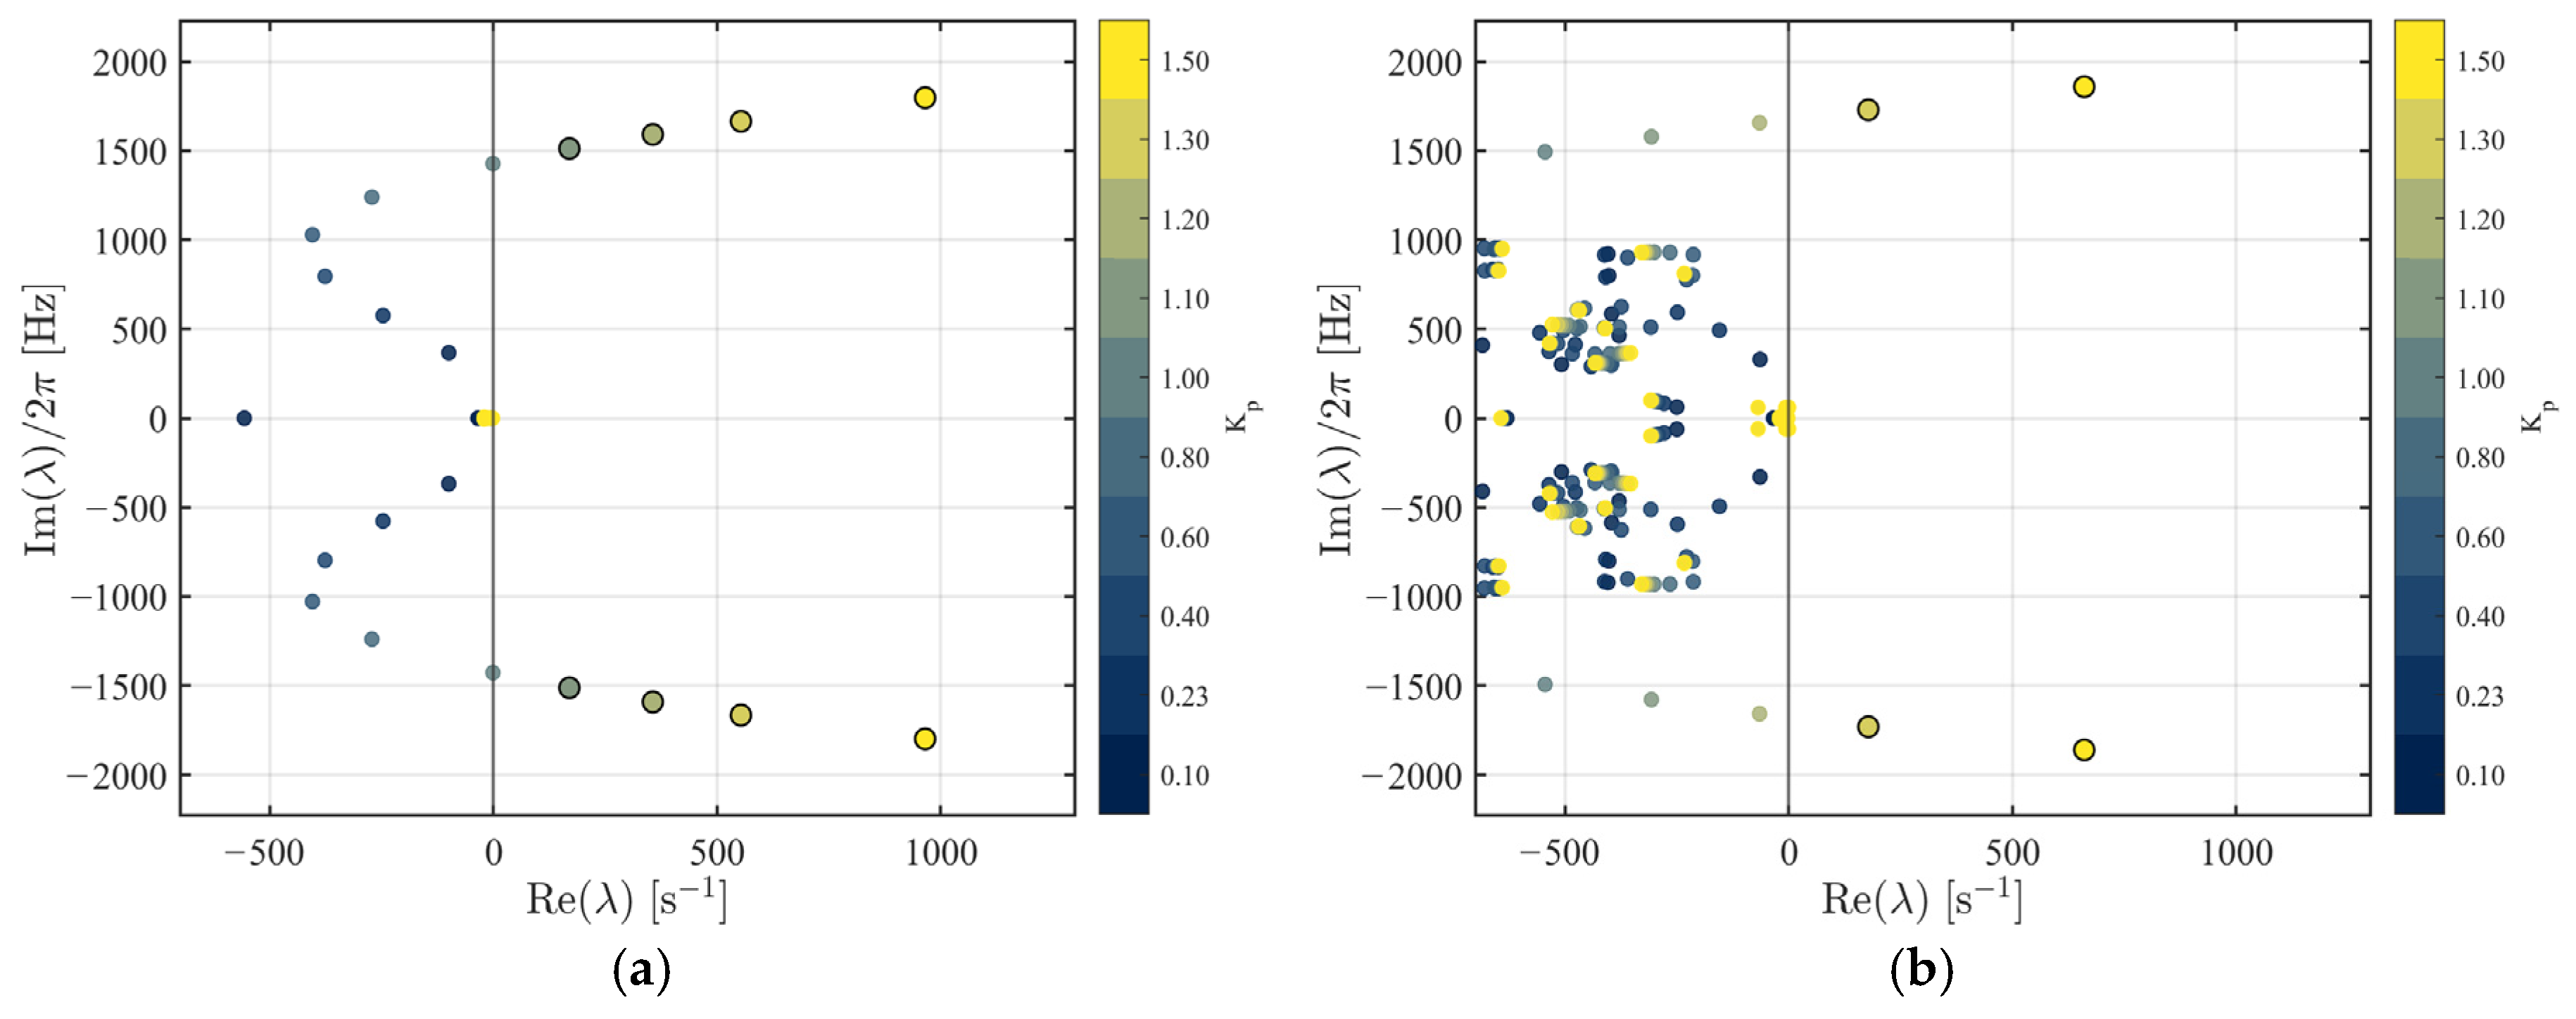
The eigenvalue migration of the standalone STATCOM is shown in Figure 8a. All dominant poles remain in the left-half plane for proportional gains up to approximately = 1.02; when is increased beyond this value, a complex-conjugate pole pair crosses into the right-half plane, marking the onset of small-signal instability in the standalone configuration. The imaginary part of this critical pole pair increases with , so the oscillation frequency of the unstable mode also rises with gain. This upward frequency trend is consistent with the migration of the admittance resonance peak in Figure 7, confirming that the instability originates from the high-frequency inner-current-control mode [8].
Figure 8.
Eigenvalue migration with the inner current-controller proportional gain (), computed with the coordinated control-gain set and the communication delay fixed at 60 μs: (a) standalone STATCOM, stable up to ≈ 1.02; (b) STATCOM connected to the IEEE 9-bus system, stable over approximately 0.0558 ≤ ≤ 1.22. The coordinated operating value = 0.23 (highlighted); color indicates .
At , the unstable mode is located at approximately
which corresponds to an oscillation frequency of
The positive real part () indicates a loss of damping, while the large imaginary component reflects the high-frequency oscillatory mode dominated by the current control loop.
When the STATCOM is connected to the IEEE nine-bus transmission system, the eigenvalue trajectories are modified, as shown in Figure 8b. At the upper end, the grid-connected system remains stable for proportional gains up to approximately = 1.22, somewhat higher than the standalone limit of about 1.02; as in the delay study of Section 3.1, the external grid impedance adds effective damping to the high-frequency current-control mode and extends the allowable gain. However, at the lower end, a distinct low-gain grid-interaction instability appears below approximately = 0.0558, oscillating near 252 Hz at onset; this lower boundary does not exist for the standalone converter and reflects a genuine converter–grid interaction that emerges only when the current loop is made very soft. Because this lower boundary lies below the 0.1–1.5 sweep range of Figure 8b and Table 2, it was located using a separate finer low-gain sweep; Figure 8b itself displays the upper-boundary crossing. The grid-connected stable window is therefore bounded on both sides, approximately 0.0558 ≤ ≤ 1.22, and the coordinated operating value = 0.23 lies well inside it, leaving a large margin in both directions.
These results demonstrate that proportional-gain tuning cannot be determined from standalone converter analysis alone. Grid interaction shifts both the upper and lower stability boundaries of the current-loop gain, so gain selection must be conducted from a system-level harmonic-stability perspective that explicitly accounts for converter–grid interactions. For the coordinated design, the operating gain = 0.23 is comfortably centered within the grid-connected stable window.
3.3. Stability Improvement Using a C-Type Filter
The effect of the C-type filter on the delay-stability margin of the coordinated design is now evaluated through eigenvalue migration under varying communication delay. The filter is connected at the STATCOM terminal as described in Section 2.4, modifying the equivalent shunt admittance seen at the point of common coupling. Its per-unit parameters are those specified for the coordinated gain set (100 Hz trap, R = 25,000 Ω), and the design rationale for these values is given in Section 3.6.
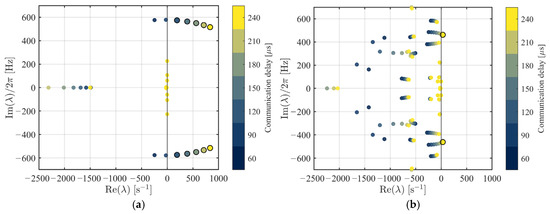
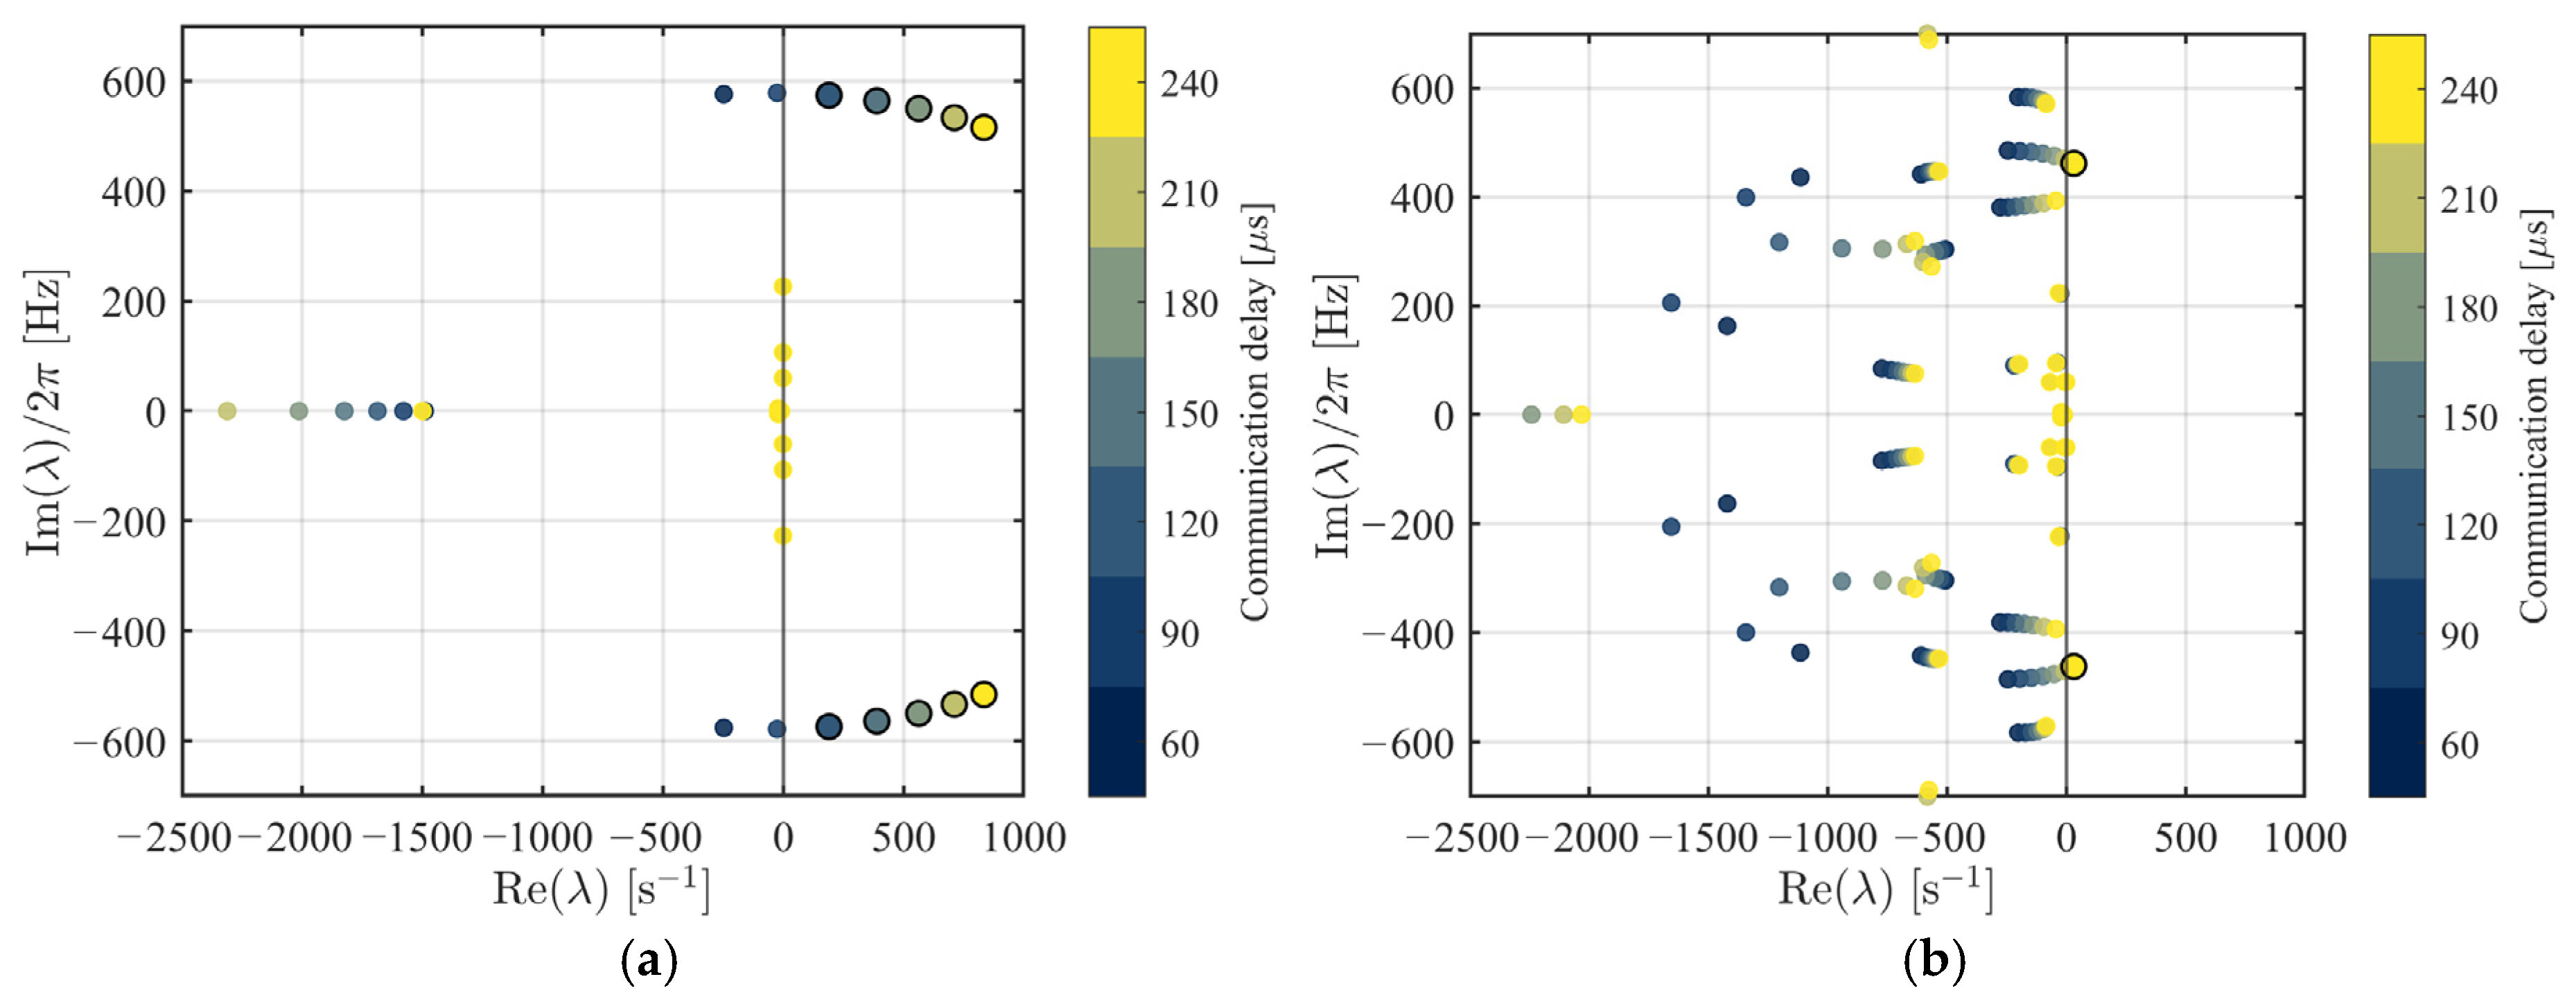
Figure 9 shows the eigenvalue trajectories of the dominant modes with the C-type filter enabled. For the standalone STATCOM (Figure 9a), the binding mode is the same internal current-loop/delay resonance near 515–574 Hz identified in Section 3.1; the C-type filter barely moves it, so the standalone delay-stability margin remains approximately 93.51 μs—essentially identical to the no-filter value. The filter does introduce a separate, lightly damped resonance near 227 Hz, but this mode remains well damped over the entire delay range and never becomes the binding constraint. For the grid-connected configuration (Figure 9b), by contrast, the filter has a strong stabilizing effect: the dominant ≈ 469–488 Hz current-loop mode crosses the imaginary axis only at a communication delay of approximately 214.65 μs (at ≈469 Hz), compared with 127.30 μs without the filter (Section 3.1). The C-type filter therefore extends the grid-connected small-signal delay-stability margin by approximately 87 μs, a factor of about 1.69.
Figure 9.
Eigenvalue migration with communication delay for the coordinated gain set with the C-type filter enabled: (a) standalone STATCOM + C-type; (b) STATCOM in the IEEE 9-bus system + C-type. The color indicates the communication delay (60–240 μs).
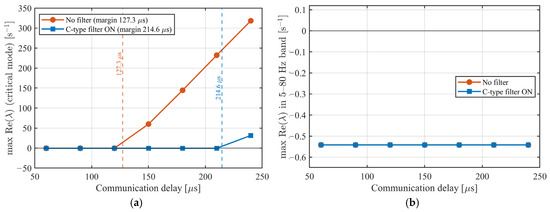
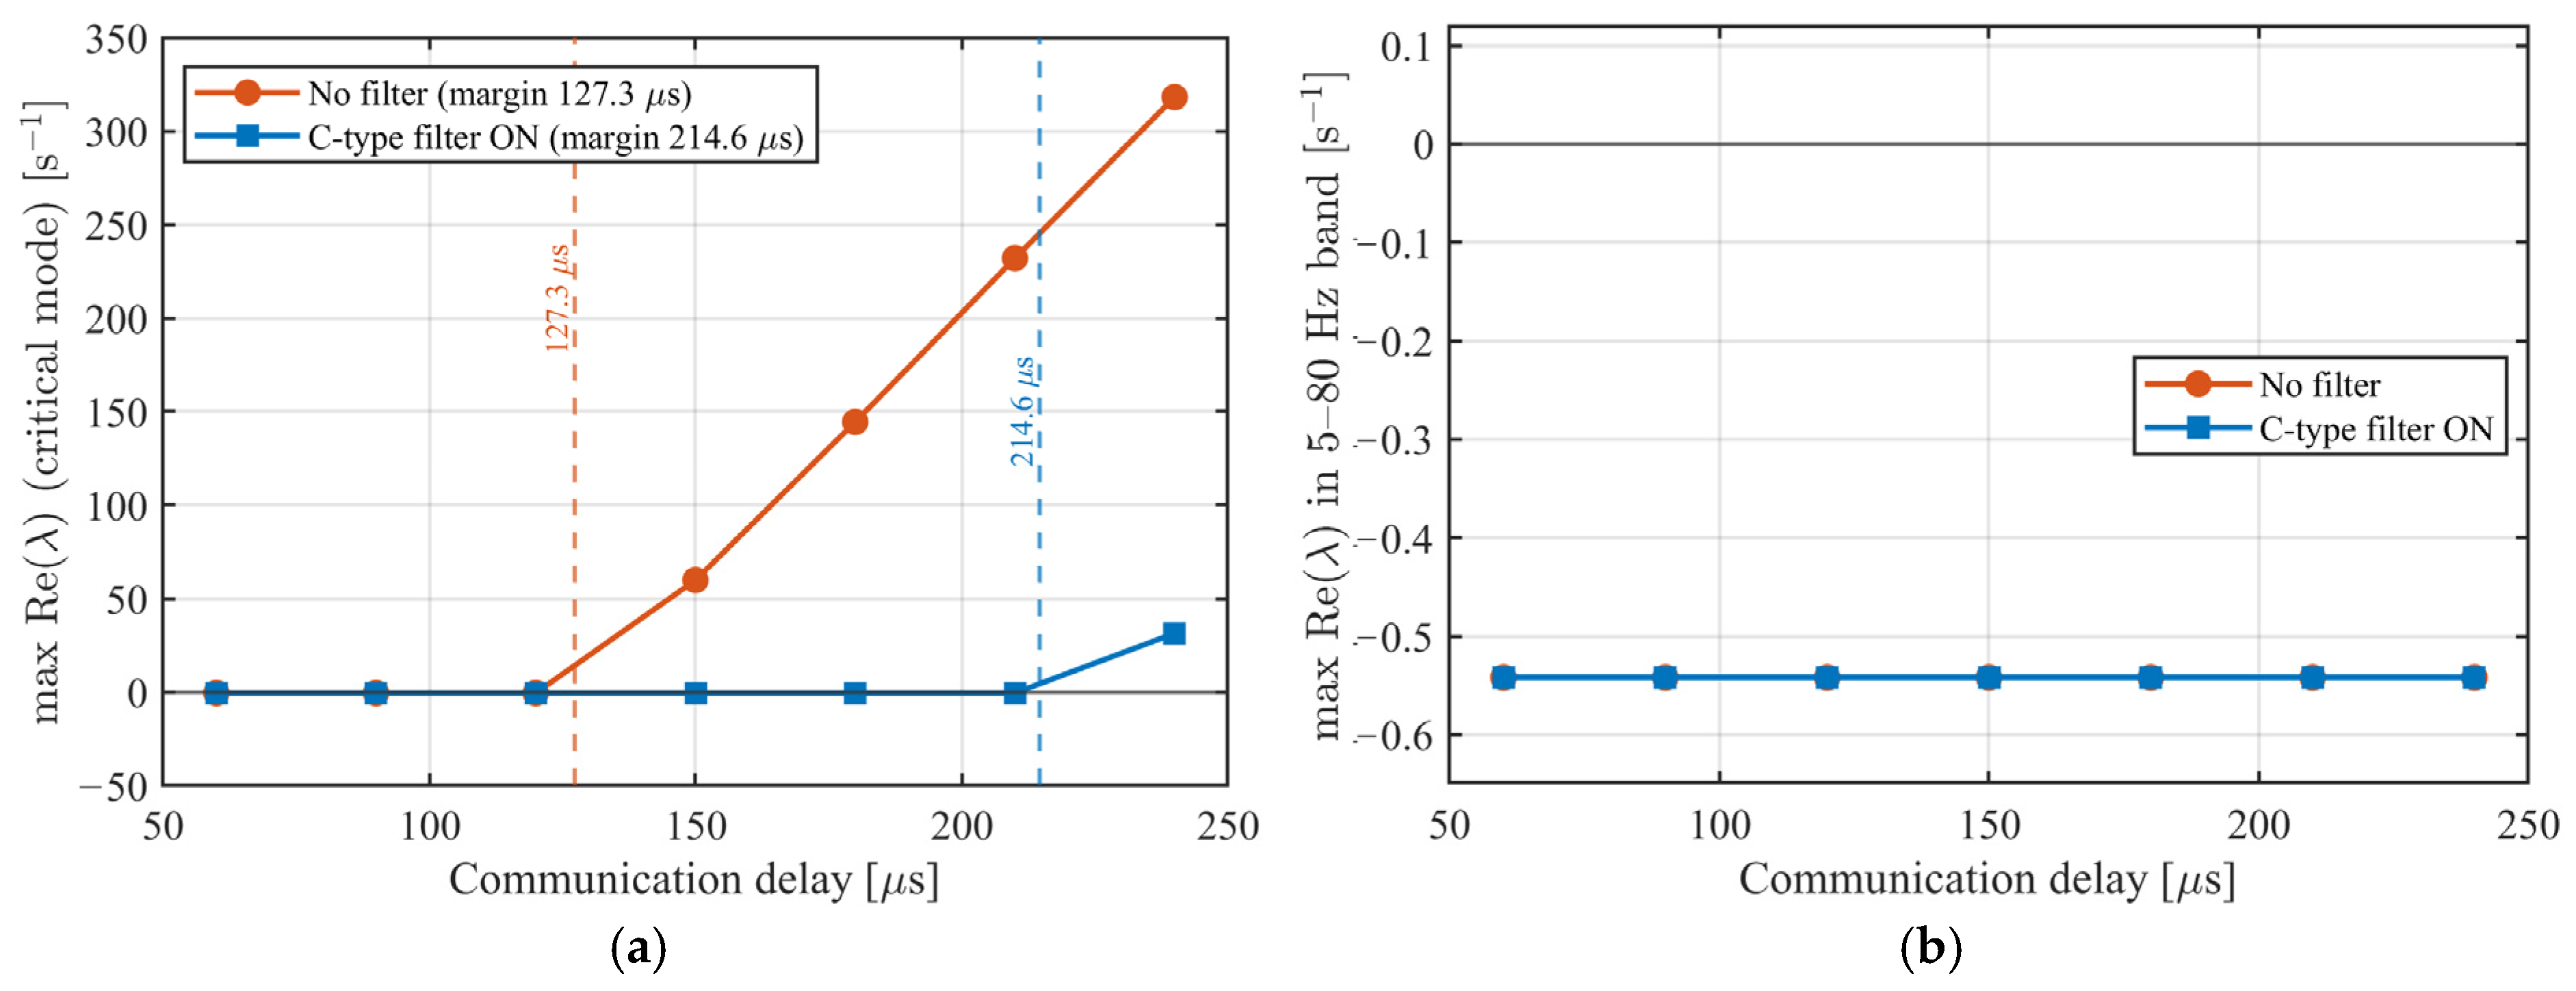
The influence of the C-type filter is examined further in Figure 10, which separates the two candidate limiting mechanisms of the delay sweep. Figure 10a tracks the real part of the single binding mode—the ≈ 488/469 Hz current-loop resonance—as a function of communication delay, for the no-filter and filter-ON cases. The filter shifts the zero-crossing of this mode from 127.30 μs to 214.65 μs, confirming that one current-loop resonance governs the delay limit in both cases and that the filter acts by damping this mode precisely. Figure 10b plots the maximum real part of any eigenvalue within the 5–80 Hz band over the same delay sweep: it stays flat and deeply damped (near −0.54 s−1) for both filter states, showing that no low-frequency grid-interaction mode approaches the imaginary axis. The coordinated design therefore eliminates the low-frequency interaction mode as a limiting factor, and the benefit of the C-type filter is realized entirely through improved damping of the higher-frequency current-loop resonance.
Figure 10.
Communication-delay dependence of the two candidate limiting mechanisms for the coordinated gain set, without and with the C-type filter: (a) real part of the binding ≈ 488/469 Hz current-loop mode; (b) maximum real part of any eigenvalue in the 5–80 Hz band.
These results confirm that, for the coordinated design, the C-type filter enhances delay robustness by damping the dominant high-frequency current-control resonance, extending the grid-connected delay-stability margin from 127.30 μs to 214.65 μs. Because the low-frequency grid-interaction mode is already well damped by the coordinated tuning, the filter’s benefit is concentrated on the high-frequency resonance. As passive filtering reshapes the frequency-dependent impedance seen by the converter across a wide band, its stability impact must be assessed at the integrated system level rather than through standalone converter analysis.
3.4. Nonlinear Time-Domain (EMT) Validation
To complement the small-signal admittance and eigenvalue analyses, nonlinear electromagnetic-transient (EMT) simulations of the modified IEEE nine-bus system were performed for the grid-connected, non-filtered configuration with the coordinated control-gain set, using the discrete specialized power systems solver. The inter-controller communication delay is represented in the EMT model as a continuous transport delay acting on the converter voltage commands, consistent with the pure-time-delay (Padé) form used in the small-signal model. Each case was run on a single continuous timeline: the model first reached genuine steady state at the nominal operating delay ( = 60 μs) for 300 ms, after which the communication delay was stepped to a target value and the response was followed over an extended hold (up to ≈ 1.3 s) so that near-marginal growth or decay could be resolved.
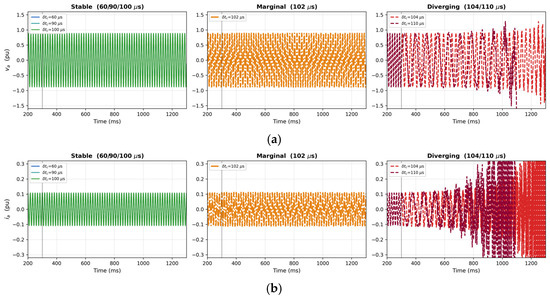
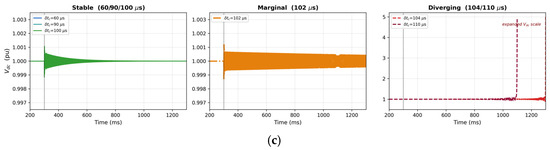
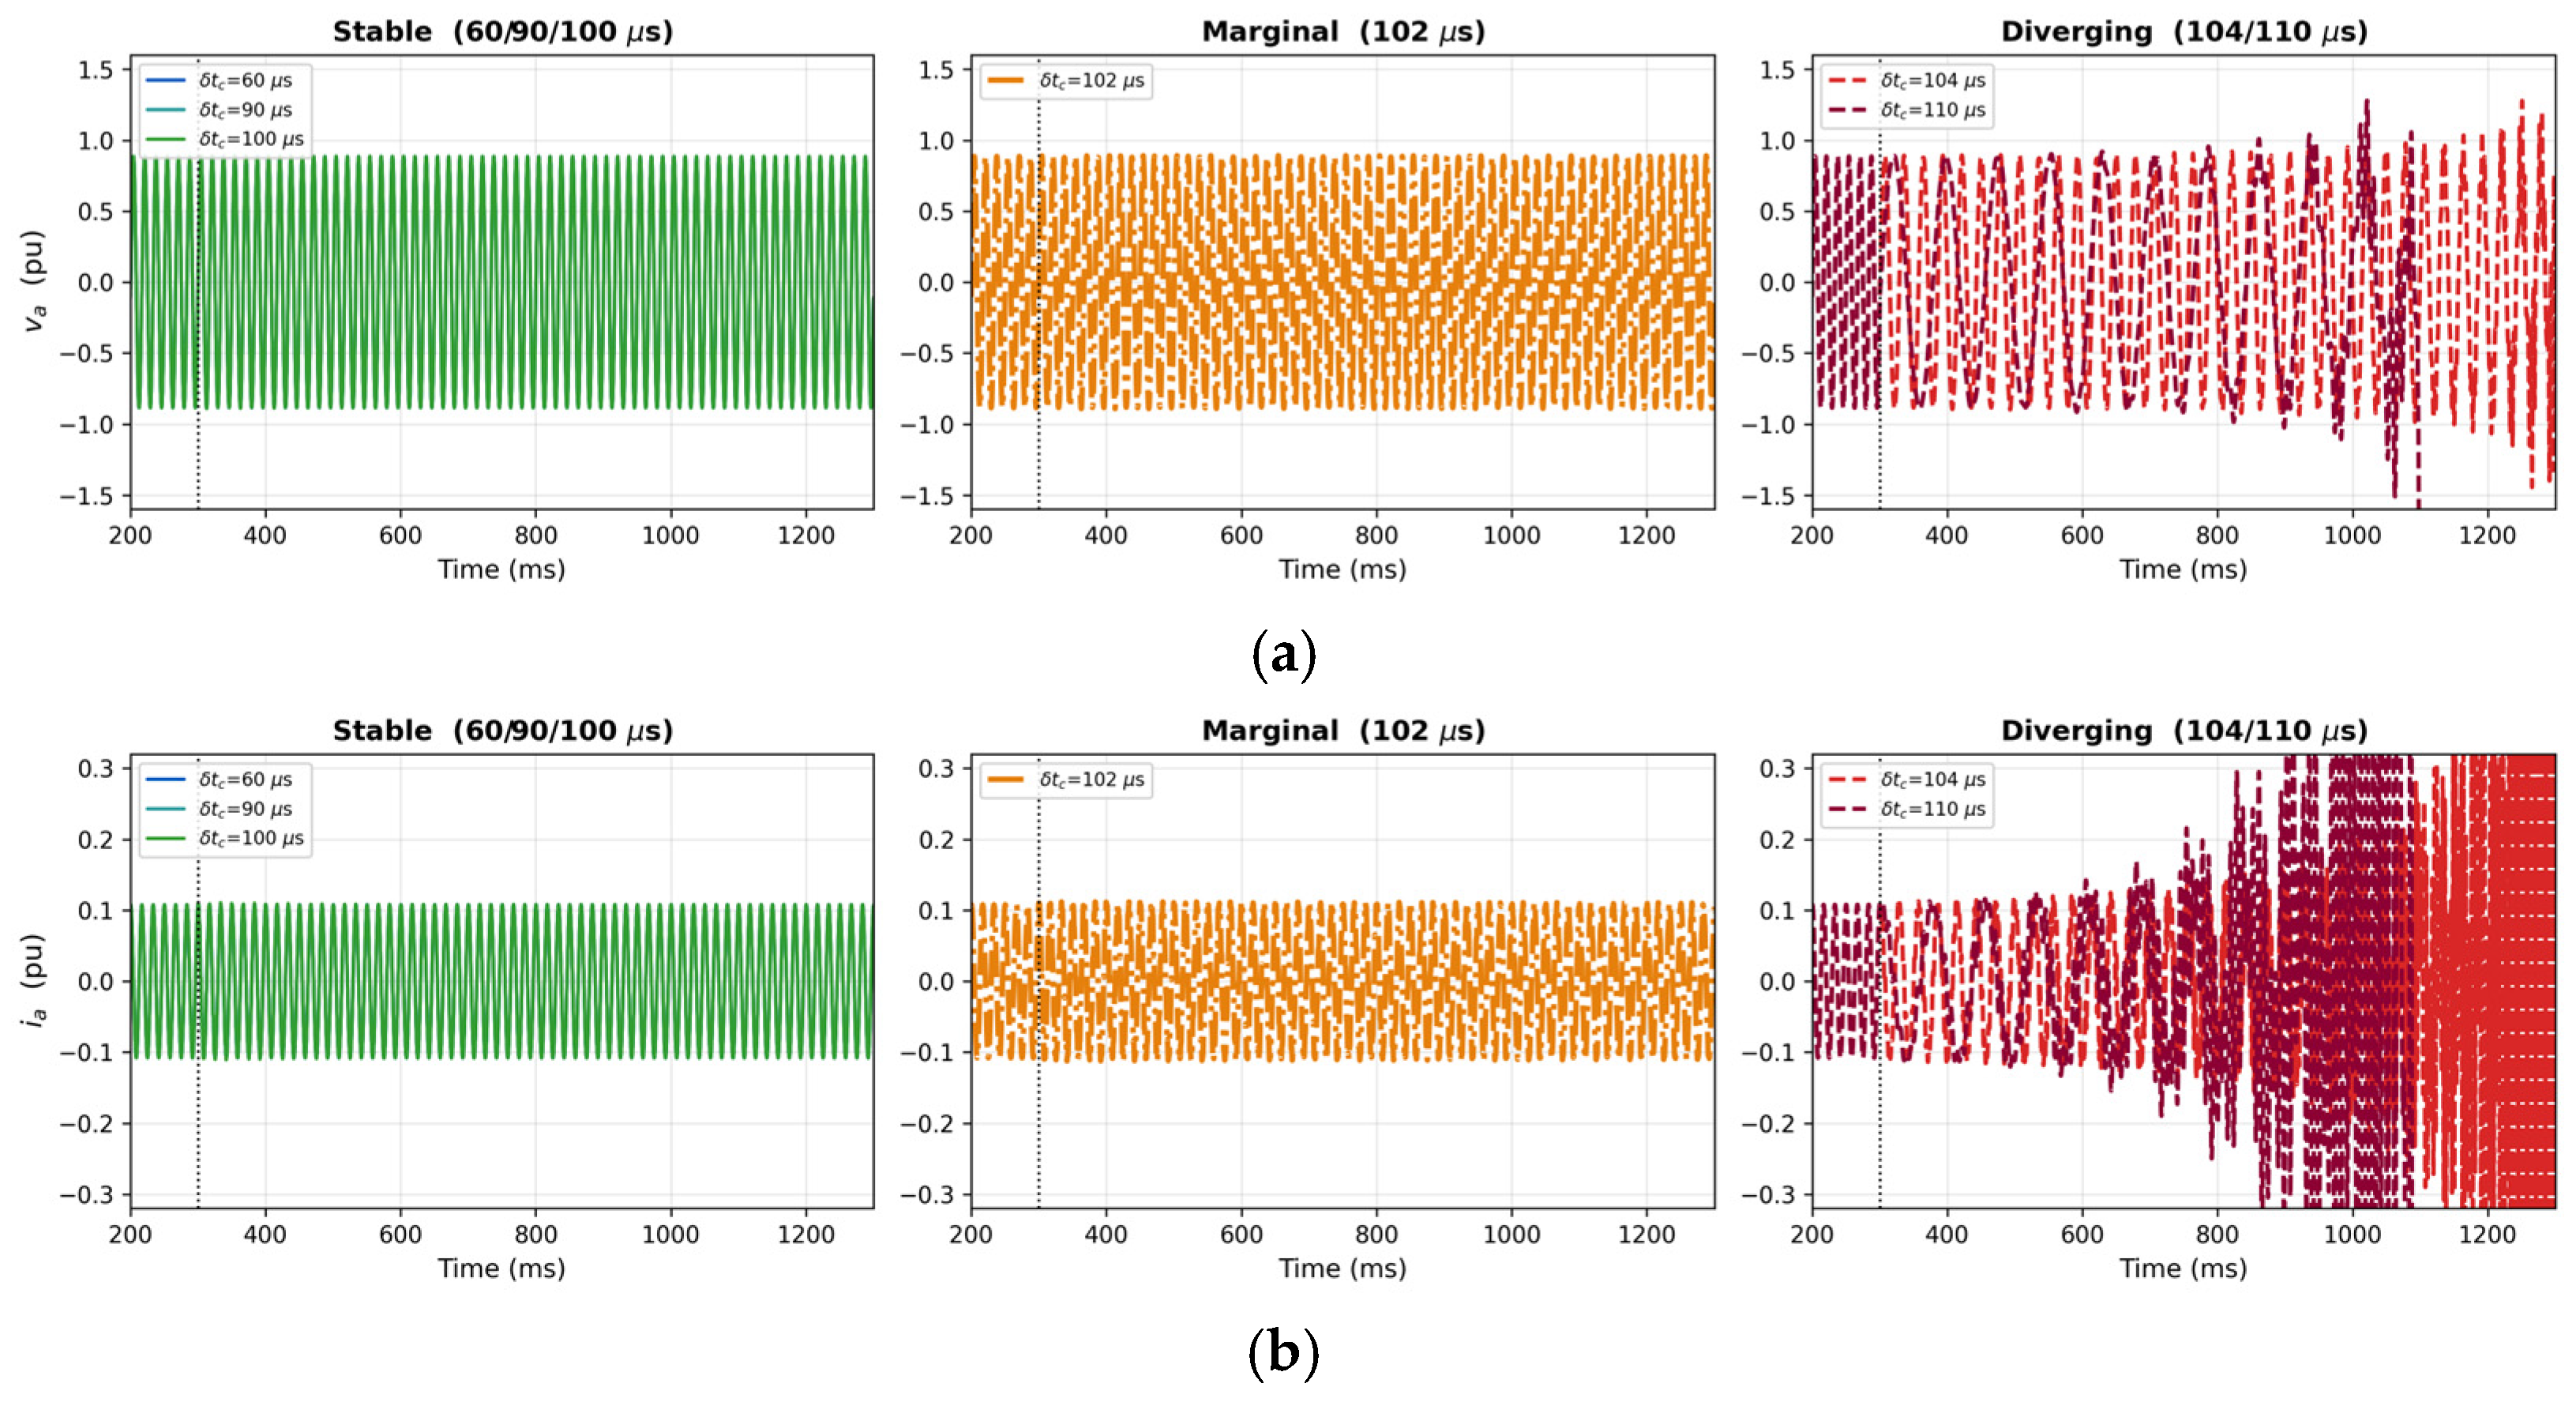
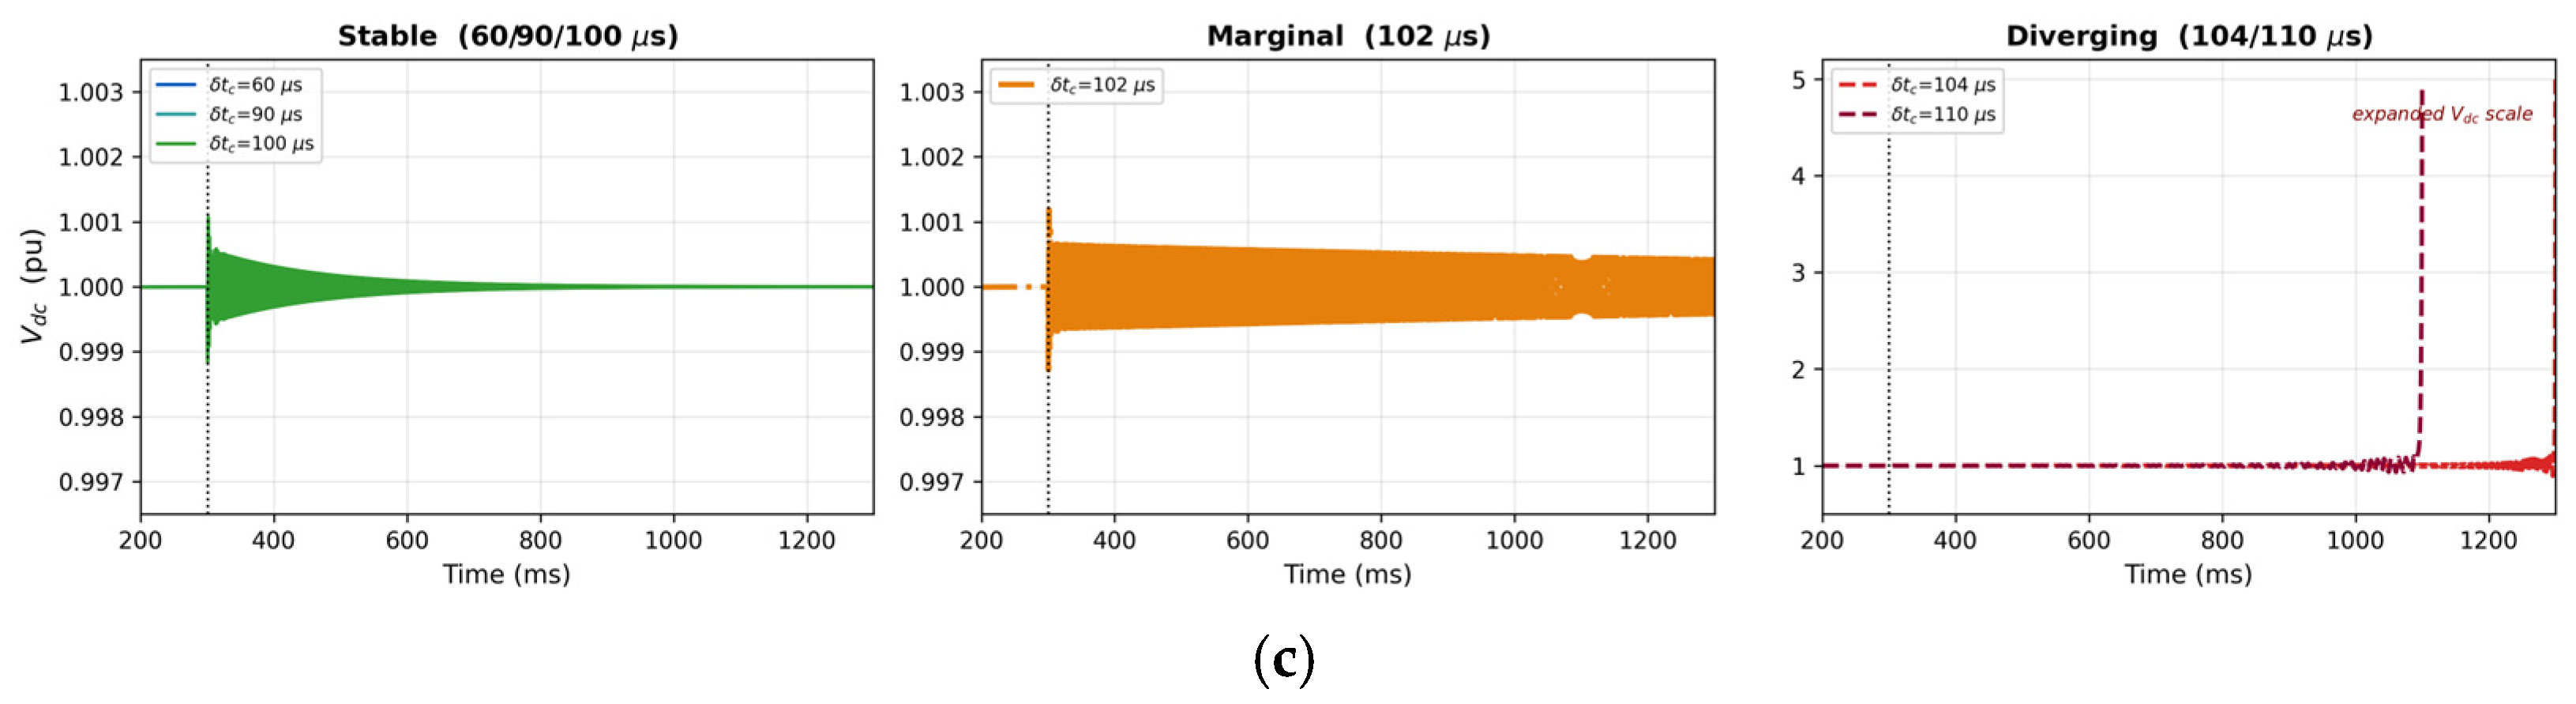
Figure 11 shows the communication-delay sweep for the coordinated, non-filtered configuration in terms of the physical phase-A waveforms. During the settling phase (0–300 ms at = 60 μs), all signals converge to a common steady state. holds at 1.000 pu, and the phase-A terminal voltage and converter current settle into clean, bounded sinusoids. The 60 μs control case remains unchanged across the step junction, confirming that the state reload at the delay step is seamless. After the step, the responses remain bounded for = 60, 90, and 100 μs and stay essentially bounded at = 102 μs (marginal). By contrast, clearly growing, divergent oscillations develop in , , and for = 104 and 110 μs, with the larger delay departing from equilibrium earlier. The time-domain stability boundary therefore lies at approximately 102 μs. Once instability sets in, the growing oscillation drives the converter away from a valid operating point. Because the STATCOM’s AC–DC power-balance and modulation equations depend on 1/ terms, the nonlinear solver can no longer maintain a physical equilibrium as departs from its nominal value, consistent with a genuine loss of stability rather than a solver artifact.
Figure 11.
Nonlinear EMT time-domain validation of the coordinated gain set (grid-connected, no C-type filter), grouped by stability classification. Rows shown as separate sub-figures (top to bottom): (a) phase-A terminal voltage , (b) phase-A converter current , and (c) DC-link voltage , all in per-unit. Columns (left to right): stable cases ( = 60, 90, and 100 μs), the marginal case ( = 102 μs, at the corrected delay margin), and diverging cases ( = 104 and 110 μs). Traces: solid green = stable, dashed orange = marginal, dashed red and dark red = diverging. In the stable column the three responses overlap, so only the last-plotted (green) curve is visible, with each case settled at the nominal communication delay of 60 μs and the delay stepped to its target value at t = 300 ms (dotted line). The bounded columns share a fine vertical scale, whereas the diverging-column panel uses an expanded scale to reveal the full runaway.
The EMT boundary near 102 μs corroborates, in the full nonlinear model, the delay-margin trend obtained from the small-signal analysis of Section 3.1. A rigorous, growth-rate-based determination of the marginal stability point localizes the nonlinear EMT margin at approximately 102.2 μs; the quantitative comparison between this value and the 127.30 μs small-signal prediction, together with the underlying destabilization mechanism, is examined in Section 3.5. This validation was performed for the grid-connected, non-filtered configuration; a full EMT characterization of the C-type-filter configuration is presented in Section 3.6.
3.5. Quantitative Delay-Margin Validation: Small-Signal Versus EMT
As established in Section 3.1 (Figure 6), small-signal eigenvalue analysis of the grid-connected, non-filtered configuration with the coordinated gain set predicts a communication-delay stability margin of approximately 127.30 μs, at which a lightly damped current-control-loop resonance crosses the imaginary axis near 487.8 Hz. This subsection validates that small-signal margin in the time domain and quantifies the gap between it and the full nonlinear response.
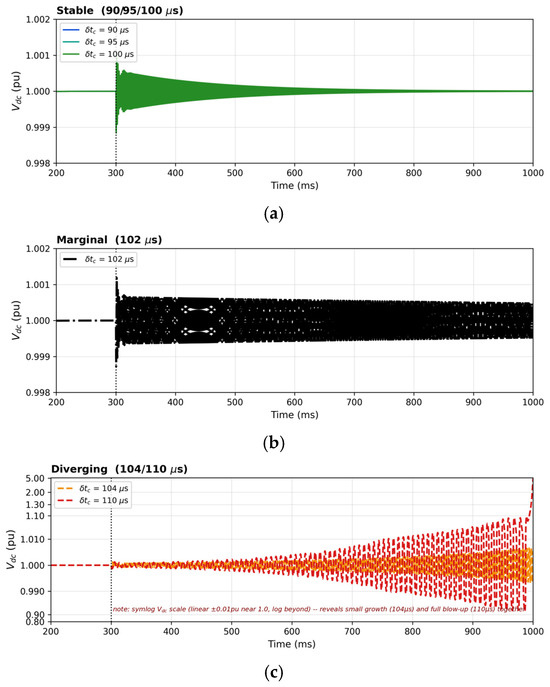
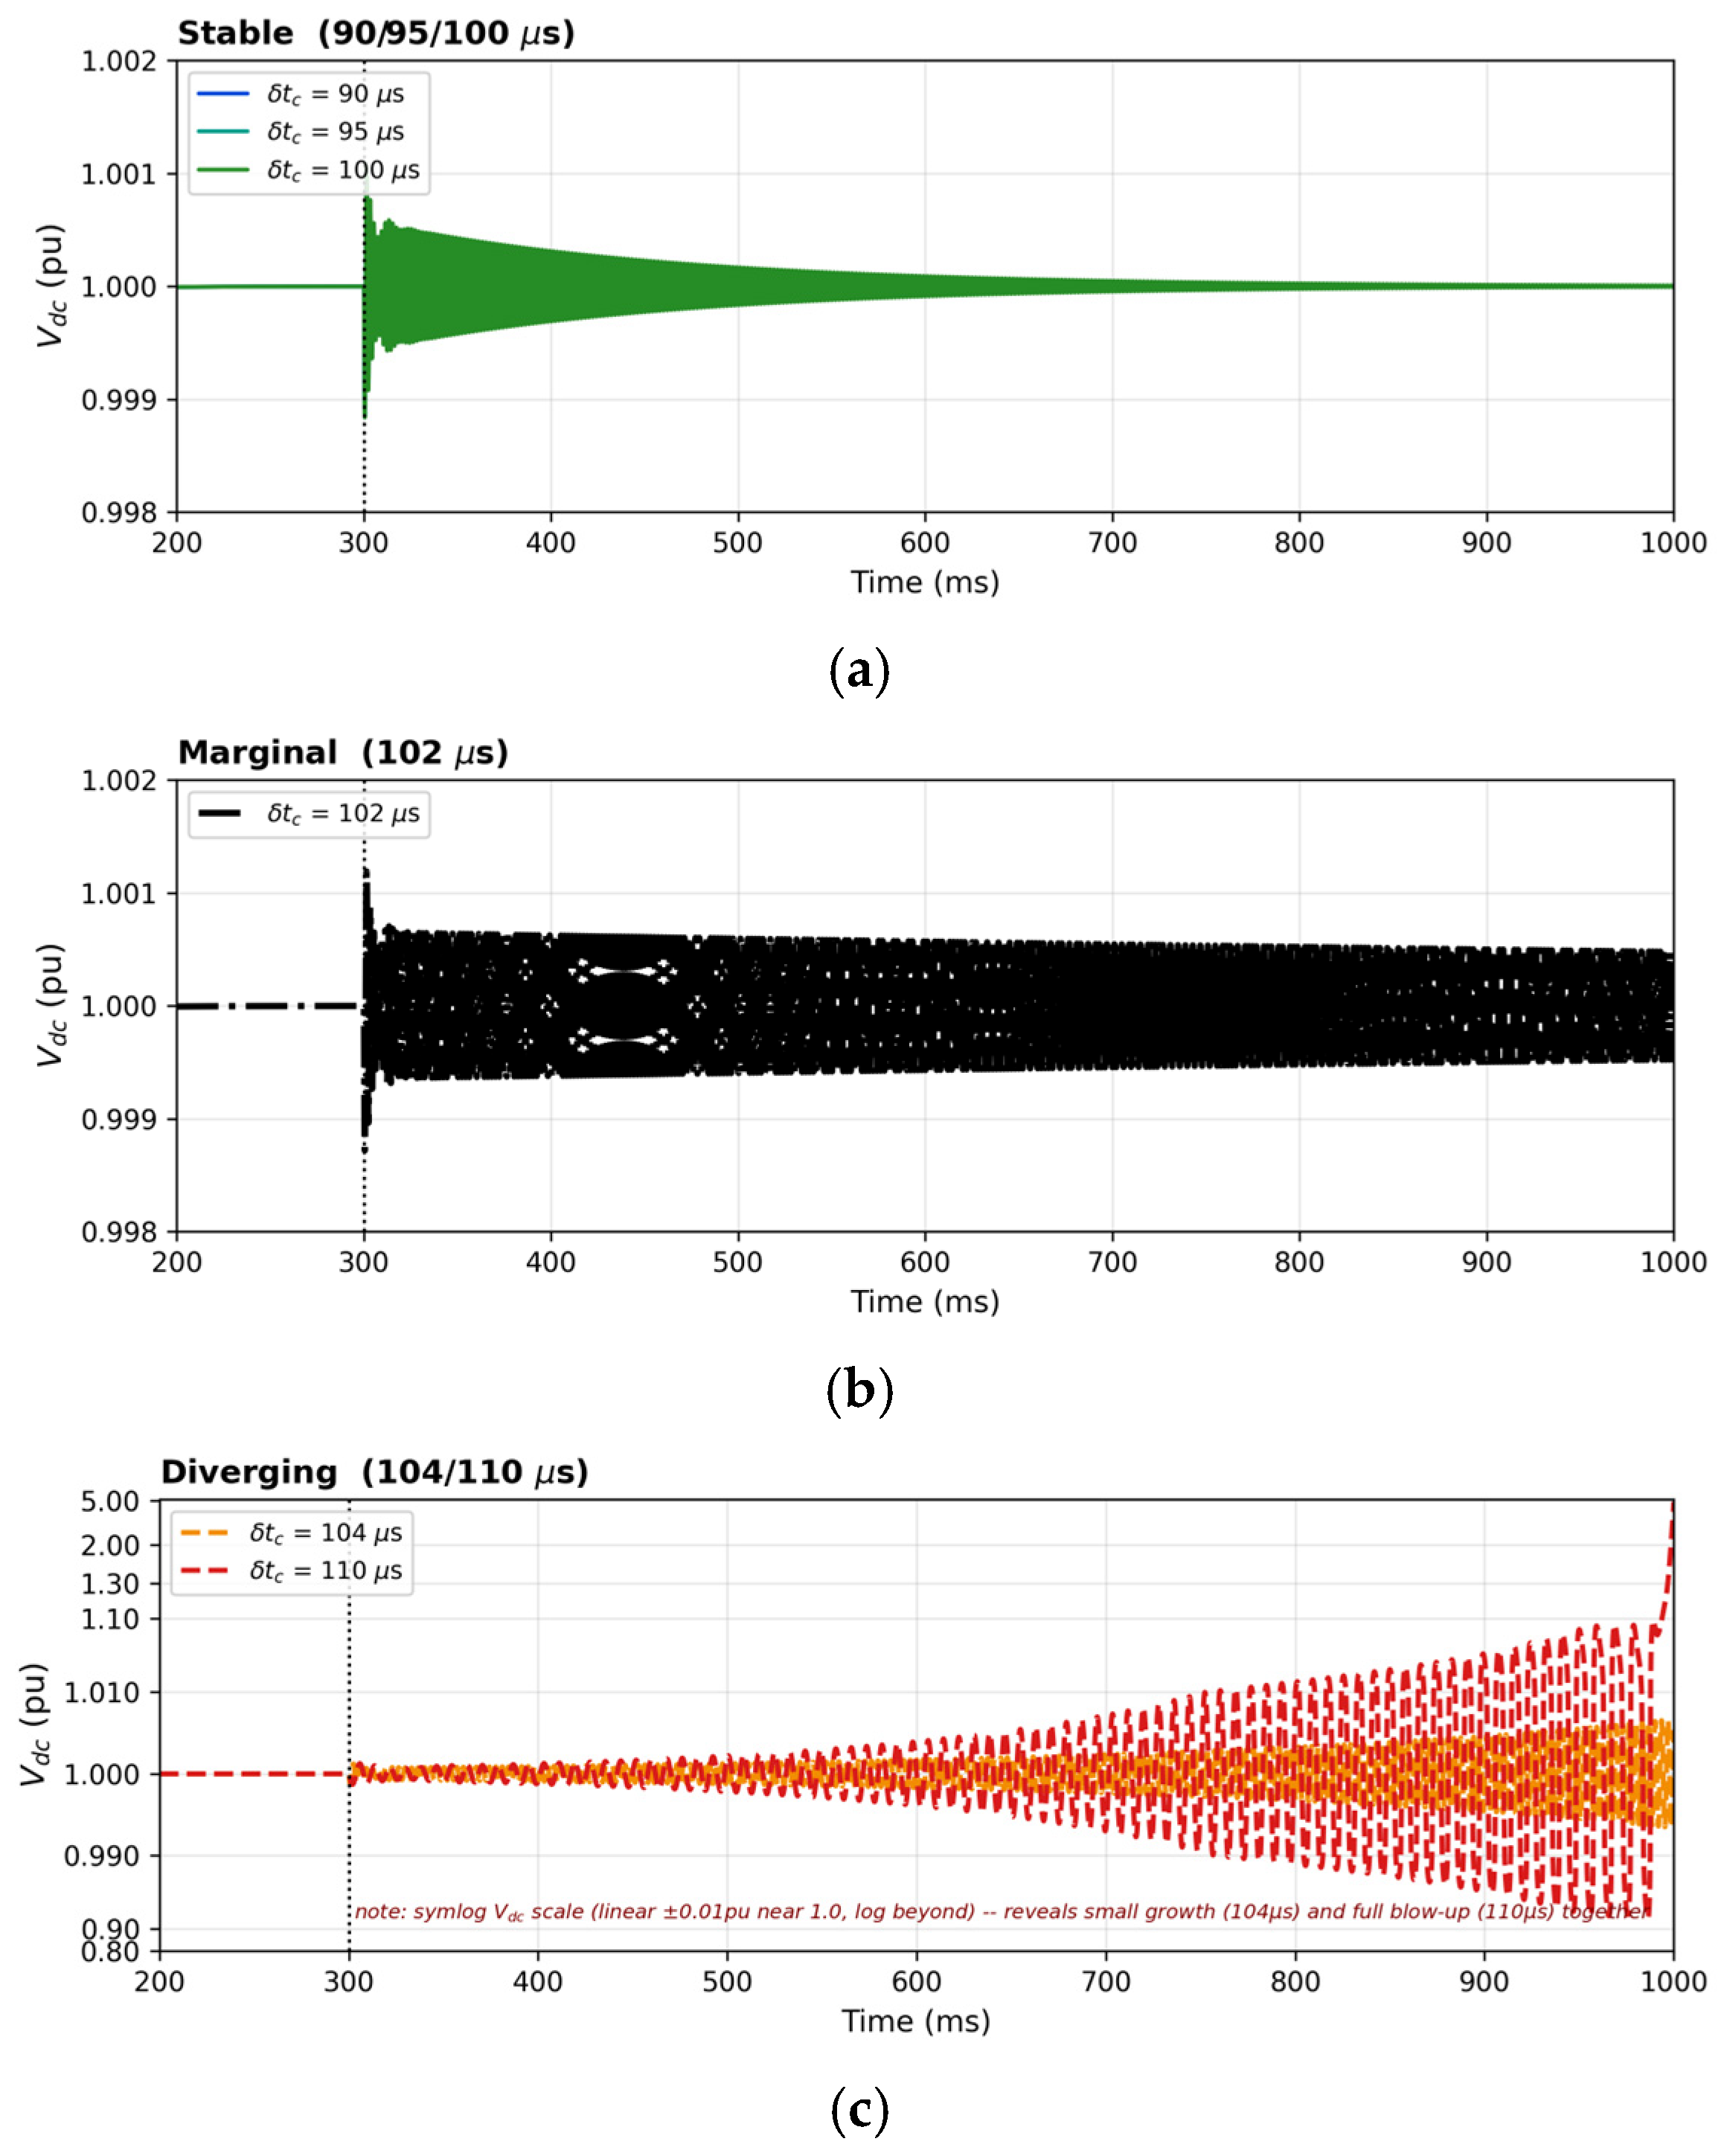
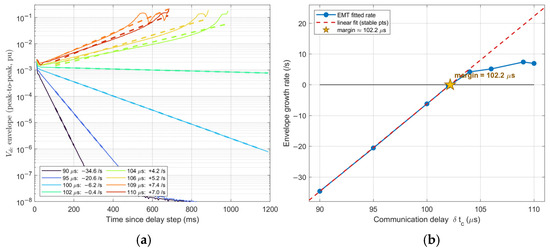
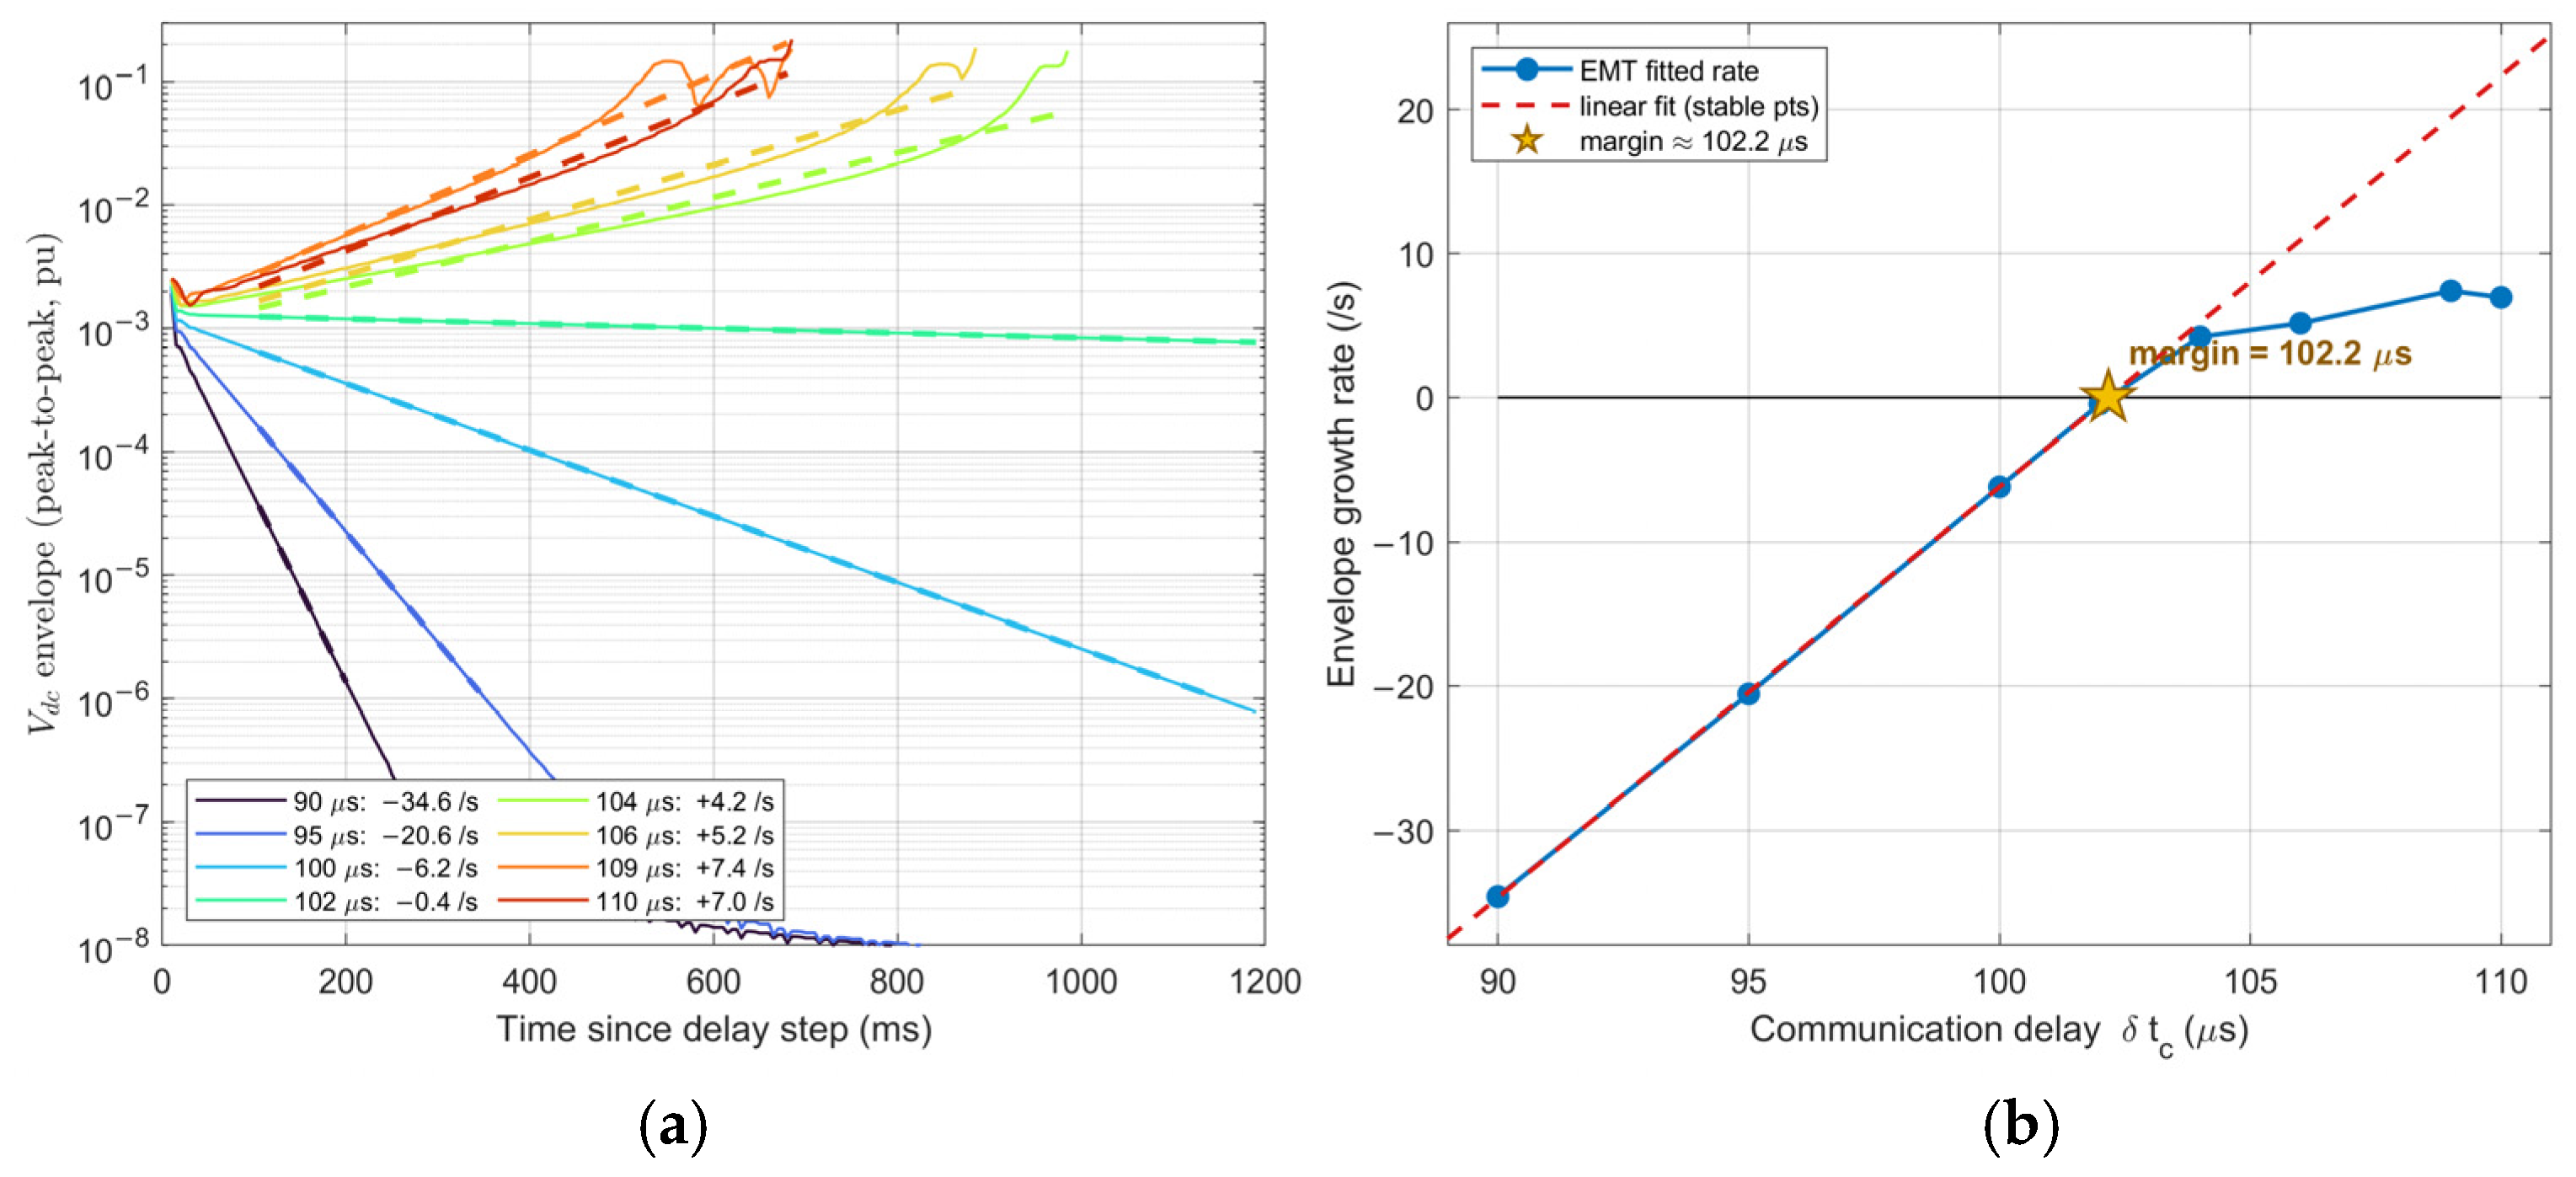
Building on the delay sweep of Section 3.4, the delay-stability margin was localized precisely using a growth-rate criterion: for each candidate communication delay, the model was settled at the nominal delay, the delay was then stepped to the target value and held, and the exponential growth rate of the DC-link-voltage oscillation envelope was fitted; the marginal-stability point is that at which this growth rate crosses zero (decaying for smaller delays, growing for larger). This locates the nonlinear EMT margin at approximately 102.2 μs (±0.5 μs): the envelope decays at = 100 μs (−6.2 s−1, stable), is essentially flat at = 102 μs (marginal), and grows at = 104 μs (+4.2 s−1, unstable). Figure 12 shows representative responses spanning the stable, marginal, and divergent regimes as the communication delay is increased through this boundary, and Figure 13 shows the growth-rate fits from which the margin is determined.
Figure 12.
Nonlinear EMT time-domain validation of the delay-stability margin for the grid-connected STATCOM with no C-type filter with the coordinated control-gain set, shown as the DC-link voltage response (time referenced to the delay step) and grouped by stability classification into three stacked panels: (a) stable cases ( = 90, 95, and 100 μs); (b) the marginal case ( = 102 μs); and (c) diverging cases ( = 104 and 110 μs). In (a) the three stable-delay responses overlap, so only the last-plotted (green) curve is visible. All panels share a continuous 200–1000 ms timeline with the delay stepped to its target value at t = 300 ms (dotted line). The stable and marginal panels use a tight 0.998–1.002 pu vertical zoom to resolve the ripple envelope, whereas the diverging panel uses a symmetric-log (symlog) scale.
Figure 13.
Growth-rate-based determination of the nonlinear EMT delay-stability margin for the grid-connected STATCOM with no C-type filter, with the coordinated control-gain set: (a) semilog plot of the DC-link-voltage oscillation-envelope evolution after the delay step for several communication delays, with exponential fits whose slope gives the envelope growth rate (negative = decaying/stable, positive = growing/unstable); (b) the fitted growth rate versus communication delay, which crosses zero at ≈102.2 μs. In (a): solid = measured envelopes, dashed (same color) = exponential fits; the legend gives the delay and fitted growth rate. In (b): red dashed line = linear fit through the stable points, star = zero-crossing.
The small-signal analysis predicts a communication-delay stability margin of 127.30 μs (at 487.75 Hz, no filter, coordinated gains), whereas the nonlinear EMT model—using a rigorous determination of the marginal-stability point, at which the exponential growth rate of the -oscillation envelope crosses zero—establishes the true margin at 102.2 μs (±0.5 μs). This corresponds to a difference of approximately 19.7%, consistent with the additional conservatism expected of a full nonlinear time-domain validation relative to a linearized small-signal prediction. This gap is not attributable to the order of the Padé approximation: at the operating point (τ = 127.30 μs, f = 487.75 Hz, ω ≈ 3064 rad/s), the normalized delay ωτ ≈ 0.39 rad is small enough that even a first-order Padé approximation reproduces the exact delay’s phase with an error of only ≈0.27°, an order of magnitude too small to account for a ~20% margin discrepancy. Instead, the gap likely reflects a fundamental limitation of small-signal linearization near a growth-rate-based marginal-stability point: the EMT model’s nonlinear AC–DC power-balance and modulation terms (∝1/Vdc) engage as the operating point departs from nominal, an effect the linearized eigenvalue-crossing criterion cannot capture by construction.
3.6. C-Type Filter Design Rationale for the Coordinated Gain Set
Section 2.4 and Section 3.3 introduced the C-type filter and showed that, with the coordinated gain set, it raises the grid-connected delay-stability margin from 127.30 μs to 214.65 μs. This subsection sets out the design rationale behind the filter parameters. A C-type trap tuned purely for steady-state harmonic mitigation, without regard to delay-margin sensitivity, cannot simply be adopted here: when a trap is tuned to a lower frequency near the target harmonic order and combined with the coordinated gain set, eigenvalue analysis reveals a new unstable oscillatory mode near 36 Hz, even though the coordinated gains without any filter are stable up to 127.30 μs (Section 3.1). The trap resonance frequency must therefore be chosen with the delay-margin sensitivity of the coordinated design in mind.
A parametric sweep of the trap resonance frequency, performed with the C1 capacitance held fixed at its Section 2.4 value (preserving the filter’s fundamental-frequency reactive-power rating) and R selected for high-frequency damping, identifies a stable window between approximately 91 Hz and 114 Hz; outside this window, either the low-frequency interaction mode reappears (below ~91 Hz) or a distinct high-frequency mode (above ~114 Hz, oscillating near 238–240 Hz at onset) becomes unstable. A trap frequency of 100 Hz, centered within this window, together with R = 25,000 Ω (whereas a C-type trap tuned purely for steady-state harmonic mitigation would use R ≈ 9094 Ω), defines the filter parameters adopted in this paper (Section 2.4). While some studies employ dedicated optimization algorithms to select C-type filter parameters for harmonic mitigation [18], the present filter parameters are instead fixed from a trap-frequency sweep constrained by the delay-margin sensitivity established in Section 3.3, prioritizing small-signal delay robustness of the coordinated STATCOM design.
With this filter combined with the coordinated gain set, the full closed-loop eigenvalue analysis (network, STATCOM, and filter dynamics jointly) shows the dominant pole well within the left-half plane (no unstable poles), matching the fully damped result obtained without the filter. This confirms that the filter and the coordinated gain set are compatible in the small-signal sense.
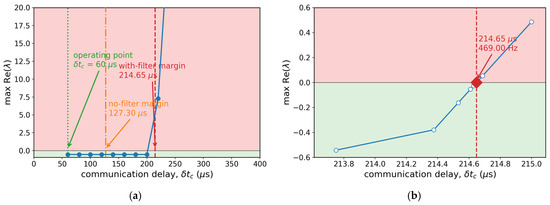
As reported in Section 3.3 (Figure 9 and Figure 10), the C-type filter combined with the coordinated gain set remains stable up to ≈ 214.65 μs, where a complex-conjugate pole pair crosses the imaginary axis at approximately 469.00 Hz—an increase of about 87 μs (a 1.69× improvement) over the 127.30 μs no-filter margin of Section 3.1. Eigenvector participation-factor analysis shows that this crossing is the same current-loop-dominated mode identified in Section 3.1 and Section 3.3 for the no-filter case, shifted from ≈487.8 Hz to ≈469.00 Hz by the filter’s loading effect on the network impedance seen by the current controller, with only minor direct participation (≈1–3%) from the C-type filter’s own energy-storage states (the C1 and C2 capacitor voltages and the L inductor current). Although this direct participation is small, enabling the filter nonetheless shifts the mode’s frequency (487.8 → 469.0 Hz) and substantially increases the small-signal delay-stability margin (127.30 → 214.65 μs). Figure 14 shows the delay sweep together with the bisection detail that localizes this margin.
Figure 14.
Small-signal delay-margin analysis of the grid-connected STATCOM with the C-type filter (100 Hz trap, R = 25,000 Ω) combined with the coordinated control-gain set: (a) full-range delay sweep comparing the no-filter and with-filter margins; (b) detailed bisection view near the with-filter margin. Green band = stable region (max Re(λ) < 0), red band = unstable region (max Re(λ) > 0). Vertical lines: green dotted = operating point (60 μs), orange dash-dot = no-filter margin (127.30 μs), red dashed = with-filter margin (214.65 μs).
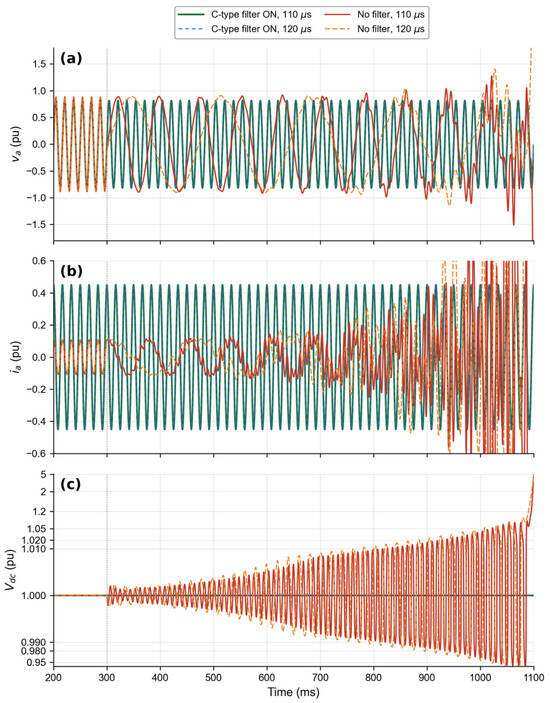
To validate this significant margin extension in the full nonlinear model, EMT simulations were performed with the C-type filter enabled at communication delays of 110 μs and 120 μs—both beyond the no-filter EMT margin of 102.2 μs (Section 3.5)—and compared against the no-filter EMT response at the same delays. Figure 15 compares the resulting phase-A terminal voltage, phase-A converter current, and DC-link voltage responses.
Figure 15.
Nonlinear EMT time-domain validation of the C-type filter’s stabilizing effect at communication delays beyond the no-filter margin, grouped by row (top to bottom): (a) phase-A terminal voltage , (b) phase-A converter current , and (c) DC-link voltage , comparing the no-filter and filter-enabled responses at = 110 μs and 120 μs. All panels share a continuous 200–1100 ms timeline, with the delay stepped from the nominal 60 μs to its target value at t = 300 ms (dotted line). The and panels use a fixed vertical scale that clips the no-filter divergence tail to keep the bounded filter-enabled traces resolved; the panel uses a symmetric-log scale to show both the no-filter growth and the flat, unity filter-enabled response on one axis.
Without the filter, both the 110 μs and 120 μs cases diverge: and develop growing oscillations and depart from bounded sinusoidal operation, and grows correspondingly, consistent with the instability mechanism identified in Section 3.4. With the C-type filter enabled, by contrast, all three quantities remain fully bounded over the entire simulated window at both 110 μs and 120 μs: and settle into clean sinusoids at essentially the pre-step amplitude, and remains flat at 1.000 pu. Moreover, the filter-enabled responses at 110 μs and 120 μs are visually indistinguishable from one another, indicating that once the filter is active, the STATCOM’s stability is no longer sensitive to communication delay over this range. This nonlinear result directly confirms, in the full EMT model, the small-signal prediction of Section 3.3 that the C-type filter removes the dominant current-loop resonance responsible for the no-filter instability.
4. Conclusions
This paper presented an integrated impedance-domain small-signal framework to analyze the harmonic stability of a grid-connected STATCOM under variations in control parameters and network conditions. By combining admittance-based analysis with eigenvalue migration tracking, the proposed approach enables systematic identification of resonance modes and stability boundaries in converter-dominated transmission systems.
The results showed that communication delay and the inner current-controller proportional gain strongly influence the STATCOM’s resonance characteristics. For communication delay, the standalone converter remains stable up to approximately 93.51 μs, whereas the grid-connected system tolerates delays up to approximately 127.30 μs. Grid interaction thus adds effective damping to the current-control-loop resonance and extends the delay margin. For the current-controller proportional gain, the standalone STATCOM is stable up to about = 1.02, whereas the grid-connected system is stable over a two-sided window of approximately 0.0558 ≤ ≤ 1.22. These observations show that converter–grid interaction can either extend or restrict stability margins depending on the parameter considered—a behavior that reflects the current-loop-dominated instability mechanism of this design and need not carry over to PLL-bandwidth-dominated designs—so controller tuning must be performed at the system level, explicitly accounting for STATCOM–grid impedance interaction rather than relying on standalone converter analysis alone [11,12].
The C-type passive filter further improved the delay robustness of the coordinated design. With the C-type filter (100 Hz trap, R = 25,000 Ω), the grid-connected delay-stability margin increased from approximately 127.30 μs to approximately 214.65 μs in small-signal eigenvalue analysis—a factor of about 1.69—achieved by damping the dominant high-frequency current-control resonance.
Nonlinear EMT simulation of the coordinated, grid-connected, non-filtered configuration, with the communication delay represented as a continuous transport delay, independently placed the delay-stability margin at approximately 102.2 μs—about 19.7% below the 127.30 μs small-signal prediction, which is an expected level of agreement between a linearized analytical model and a full nonlinear time-domain validation. The small-signal margin is thus interpreted as an efficient, slightly optimistic predictor of the delay robustness, and the EMT result as the more conservative, physically complete estimate.
It is demonstrated that, for the coordinated design, the grid-connected delay-stability margin is 127.30 μs in small-signal analysis and 102.2 μs in nonlinear EMT simulation (a 19.7% conservative reduction), and that the C-type filter extends the small-signal margin by a factor of 1.69 to 214.65 μs. Therefore, the proposed framework provides practical guidance for selecting communication-delay limits, current-controller gains, and passive-filtering strategies to ensure robust harmonic stability in converter-dominated transmission networks. Although the present analysis represents renewable-energy-relevant grid conditions through a reduced short-circuit ratio at the STATCOM’s point of common coupling (X = 1.0 p.u., Section 2.3), it does not explicitly model the control dynamics of inverter-based resources (e.g., grid-following or grid-forming converters). The interaction of such converter-level dynamics with the STATCOM’s own delay-sensitive current loop is left for future investigation. Future work will focus on multi-converter systems and experimental characterization of the C-type-filter configuration to further verify the analytical findings.
Author Contributions
Conceptualization, J.J.; methodology, J.J.; software, J.J.; validation, J.J. and N.K.; formal analysis, J.J.; investigation, J.J.; resources, J.J. and N.K.; data curation, J.J.; writing—original draft preparation, J.J.; writing—review and editing, J.J., N.K., S.H.L. and D.C.; visualization, J.J.; supervision, S.H.L. and D.C.; project administration, S.H.L. and D.C. All authors have read and agreed to the published version of the manuscript.
Funding
This research was supported in part by the Basic Science Research Program through the National Research Foundation of Korea (NRF), funded by the Ministry of Education (RS-2022-NR071801), and in part by the Korea Institute of Energy Technology Evaluation and Planning (KETEP) and the Ministry of Climate, Energy and Environment (MCEE) of the Republic of Korea (No. RS-2026-25543600).
Data Availability Statement
The data presented in this study are available from the corresponding authors upon reasonable request.
Conflicts of Interest
Authors JooYong Jung and NamKyu Kim were employed by the company Hyosung Corporation. The remaining authors declare that the research was conducted in the absence of any commercial or financial relationships that could be construed as a potential conflict of interest.
References
- Sun, J. Impedance-based stability criterion for grid-connected inverters. IEEE Trans. Power Electron. 2011, 26, 3075–3078. [Google Scholar] [CrossRef] [Scilit]
- Singh, B.; Saha, R.; Chandra, A.; Al-Haddad, K. Static synchronous compensators (STATCOM): A review. IET Power Electron. 2009, 2, 297–324. [Google Scholar] [CrossRef] [Scilit]
- Dixon, J.; Moran, L.; Rodriguez, J.; Domke, R. Reactive Power Compensation Technologies: State-of-the-Art Review. Proc. IEEE 2005, 93, 2144–2164. [Google Scholar] [CrossRef] [Scilit]
- Kundur, P. Power System Stability and Control; McGraw-Hill: New York, NY, USA, 1994. [Google Scholar]
- Liu, F.; Liu, J.; Zhang, H.; Xue, D. Stability issues of Z+Z type cascade system in hybrid energy storage system (HESS). IEEE Trans. Power Electron. 2014, 29, 5846–5859. [Google Scholar] [CrossRef] [Scilit]
- Liu, F.; Liu, J.; Zhang, H.; Xue, D.; Ul, H.S.; Zhou, L. Stability Issues of Z+Z or Y+Y Type Cascade System. In Proceedings of the IEEE Energy Conversion Congress and Exposition (ECCE 2013), Denver, CO, USA, 15–19 September 2013; pp. 434–441. [Google Scholar] [CrossRef] [Scilit]
- Harnefors, L.; Finger, R.; Wang, X.; Bai, H.; Blaabjerg, F. VSC input-admittance modeling and analysis above the Nyquist frequency for passivity-based stability assessment. IEEE Trans. Ind. Electron. 2017, 64, 6362–6370. [Google Scholar] [CrossRef] [Scilit]
- Harnefors, L.; Wang, X.; Yepes, A.G.; Blaabjerg, F. Passivity-based stability assessment of grid-connected VSCs—An overview. IEEE J. Emerg. Sel. Top. Power Electron. 2016, 4, 116–125. [Google Scholar] [CrossRef] [Scilit]
- Gaba, G.; Lefebvre, S.; Mukhedkar, D. Comparative analysis and study of the dynamic stability of AC/DC systems. IEEE Trans. Power Syst. 1988, 3, 978–985. [Google Scholar] [CrossRef] [Scilit] [PubMed]
- Sanchez-Sanchez, E.; Prieto-Araujo, E.; Gomis-Bellmunt, O. The role of the internal energy in MMCs operating in grid-forming mode. IEEE J. Emerg. Sel. Top. Power Electron. 2020, 8, 949–962. [Google Scholar] [CrossRef] [Scilit]
- Kelada, F.; Buire, J.; HadjSaid, N. Revisiting small-signal modeling for analyzing fast dynamic interactions in converter-dominated power systems. IEEE Trans. Power Syst. 2025, 40, 3819–3832. [Google Scholar] [CrossRef] [Scilit]
- Moutevelis, D.; Tzounas, G.; Roldan-Pérez, J.; Milano, F. Modal propagation analysis with participation factors of complex frequency variables. Electr. Power Syst. Res. 2024, 230, 110295. [Google Scholar] [CrossRef] [Scilit]
- Collados-Rodriguez, C.; Cheah-Mané, M.; Prieto-Araujo, E.; Gomis-Bellmunt, O. Stability analysis of systems with high VSC penetration: Where is the limit? IEEE Trans. Power Deliv. 2020, 35, 2021–2031. [Google Scholar] [CrossRef] [Scilit]
- Zou, C.; Rao, H.; Xu, S.; Li, Y.; Li, W.; Chen, J.; Zhao, X.; Yang, Y.; Lei, B. Analysis of resonance between a VSC-HVDC converter and the AC grid. IEEE Trans. Power Electron. 2018, 33, 10157–10168. [Google Scholar] [CrossRef] [Scilit]
- Arevalo-Soler, J.; Moutevelis, D.; Cheah-Mané, M.; Gomis-Bellmunt, O.; Jung, J.; Kim, N.; Kwon, Y.J. Converter-driven harmonic resonance instability in VSC-STATCOMs. In Proceedings of the IEEE 33rd International Symposium on Industrial Electronics (ISIE 2024), Ulsan, Republic of Korea, 18–21 June 2024; IEEE: New York, NY, USA, 2024; pp. 1–6. [Google Scholar] [CrossRef] [Scilit]
- Zhang, Y. Analysis methodology for evaluation of time-delay impact on network-based system for droop-controlled AC microgrid. Electronics 2019, 8, 380. [Google Scholar] [CrossRef] [Scilit]
- Xiao, Y.; Zhao, J.; Mao, S. Theory for the design of C-type filter. In Proceedings of the 11th International Conference on Harmonics and Quality of Power (ICHQP 2004), Lake Placid, NY, USA, 12–15 September 2004; IEEE: New York, NY, USA, 2004. [Google Scholar] [CrossRef] [Scilit]
- Tamaskani, R.; Khodsuz, M.; Yazdani-Asrami, M. Optimal design of C-type filter in harmonics polluted distribution systems. Energies 2022, 15, 1587. [Google Scholar] [CrossRef] [Scilit]
- CIGRE Joint Working Group C4/B4.38. Network Modeling for Harmonic Studies; CIGRE Technical Brochure No. 766; CIGRE: Paris, France, 2019. [Google Scholar]
- Yang, X.; Li, Z.; Ding, L.; Hu, Z.; Fang, H.; Sun, W.; Wu, Q.; Wen, J. Reconfigurable converter-formed soft open point-assisted dynamic restoration for distribution systems with cold-load pickup. IEEE Trans. Sustain. Energy 2025, 16, 2271–2285. [Google Scholar] [CrossRef] [Scilit]
- Sun, Q.; Li, X.; Zhao, J.; Zhu, J.; Wu, Z.; Gao, T.; Yuan, Y. Joint planning of transportable and flexible resources in distribution systems for renewable integration and resilience enhancement. Sustain. Energy Grids Netw. 2026, 46, 102292. [Google Scholar] [CrossRef] [Scilit]

Disclaimer/Publisher’s Note: The statements, opinions and data contained in all publications are solely those of the individual author(s) and contributor(s) and not of MDPI and/or the editor(s). MDPI and/or the editor(s) disclaim responsibility for any injury to people or property resulting from any ideas, methods, instructions or products referred to in the content. |
© 2026 by the authors. Licensee MDPI, Basel, Switzerland. This article is an open access article distributed under the terms and conditions of the Creative Commons Attribution (CC BY) license.