


Abstract
To address the challenges of insufficient feature representation and the difficulty of detecting sparse and distant objects in UAV-borne LiDAR point clouds—which exhibit significantly lower point density than terrestrial/mobile LiDAR scans—this paper proposes an enhanced detection algorithm built upon the PointPillars framework. First, a coordinate attention mechanism is incorporated to enhance the network’s ability to capture spatial geometric information. Furthermore, the backbone network is redesigned with a dual-path structure and a feature modulation fusion module, enabling adaptive integration of multi-scale features. Experimental evaluations conducted on a custom simulated UAV-borne LiDAR point cloud dataset demonstrate that the proposed method achieves 85.35% 3D mAP and 88.26% BEV mAP, corresponding to absolute improvements of 21.61 and 7.85 percentage points compared with the original PointPillars model. In addition, the proposed approach demonstrates consistent performance on the publicly available KITTI benchmark through preliminary cross-dataset validation. The results indicate that the proposed method can effectively improve the detection accuracy and robustness of LiDAR-based 3D object detection in complex environments.
1. Introduction
The burgeoning low-altitude economy, encompassing domains such as UAV logistics, urban air mobility, and infrastructure inspection, imposes stringent demands on intelligent perception and autonomous navigation. Similarly, autonomous driving—a cornerstone of intelligent ground transportation—relies heavily on high-fidelity environmental perception for safe decision-making and control. Within complex dynamic scenes, 3D object detection constitutes a critical component of the perception stack, directly influencing the performance of downstream prediction and planning modules. Light Detection and Ranging (LiDAR) sensors are indispensable due to their ability to capture direct 3D spatial information with robustness to varying illumination conditions. Nevertheless, accurately detecting 3D objects from inherently unordered, sparse, and non-uniform LiDAR point clouds remains a significant research challenge.
Point cloud sparsity and density variation with distance result in minimal point returns for distant objects, complicating their detection. Concurrently, ubiquitous occlusions in complex scenes further exacerbate data incompleteness. Moreover, the sheer volume of point cloud data imposes substantial computational burdens if processed natively.
To overcome the intrinsic limitations of the PointPillars framework and to incorporate state-of-the-art design principles from the field, this paper proposes an enhanced 3D object detection algorithm. The proposed framework is primarily designed for UAV LiDAR point cloud detection scenarios, where sparse and distant object detection remains challenging. Meanwhile, since the proposed architecture is built upon general point cloud feature extraction and fusion mechanisms, it has the potential to be extended to other LiDAR platforms. The primary contributions are as follows:
- A coordinate attention (CoordAtt) mechanism is introduced into the PointPillars framework to enhance spatial geometric perception and improve feature representation for sparse and distant objects.
- A dual-path backbone network equipped with a modulation fusion module (MFM) is designed to achieve adaptive multi-scale feature aggregation and improve feature utilization efficiency.
- An orientation refinement strategy based on angle-bin classification and residual regression is incorporated into the detection head to alleviate angular ambiguity and improve orientation estimation accuracy.
2. Related Work
2.1. Point-Based 3D Object Detection
To mitigate these challenges, researchers have proposed diverse 3D detection paradigms, broadly categorized into point-based, voxel-based, and multi-view fusion methods.
Point-based methods operate directly on raw point clouds. PointNet [1] pioneered a deep learning architecture for unordered point sets, achieving permutation invariance via shared multi-layer perceptrons (MLPs) and global max pooling. PointNet++ [2] extended this with hierarchical feature learning through recursive sampling, grouping, and aggregation to capture local-to-global contextual information. PointRCNN [3] introduced a two-stage detector, in which the first stage utilizes PointNet++ for pointwise feature extraction, foreground segmentation, and initial proposal generation, while the second stage refines proposals by transforming points to canonical coordinates and fusing local geometry with global semantics. These methods circumvent quantization errors inherent in voxelization, excelling in the detection of sparse and distant objects.
2.2. Voxel-Based and Pillar-Based 3D Object Detection
Voxel-based methods discretize point clouds into regular grids. VoxelNet [4] combined voxelization with 3D convolutions for end-to-end detection. SECOND [5] introduced sparse convolution, operating exclusively on non-empty voxels to substantially accelerate inference without sacrificing accuracy. PointPillars [6] partitions the point cloud into vertical pillars and projects features onto a bird’s-eye view (BEV) plane, employing 2D convolutions in lieu of 3D convolutions for lightweight detection. Part-A2 [7] adopts a two-stage strategy, leveraging a part-aware aggregation mechanism on foreground points to refine bounding box regression precision.
Among voxel-based approaches, PointPillars stands as a seminal work, achieving a favorable balance between efficiency and accuracy through vertical pillar partitioning and pseudo-image generation. However, PointPillars exhibits limitations in learning spatial geometric structures during feature extraction, inadequately represents sparse distant targets, and employs relatively simplistic multi-scale feature fusion. These shortcomings result in elevated miss rates for small and occluded objects. Furthermore, its orientation prediction module, which combines discrete classification and regression, leaves room for improvement in angular estimation precision.
2.3. Multi-Modal Fusion and Recent Advances in LiDAR Detection
Multi-modal fusion methods integrate complementary information from images and point clouds. MV3D [8] projects point clouds into front and bird’s-eye views to combine them with RGB imagery. AVOD [9] utilizes BEV maps and RGB images, introducing geometric constraints to reduce regression complexity. PointFusion [10] employs parallel branches of image CNNs and pointwise PointNets. Frustum PointNet [11] leverages 2D detections to generate frustum proposals, constraining the 3D search space. These strategies synergize image semantics with point cloud geometry to significantly boost 3D detection performance in complex environments.
Recent research has addressed the inherent challenges of point cloud sparsity, distant object detection, and limited feature representation through diverse strategies. Hu et al. [12] proposed a point-density-aware voxelization method that adaptively adjusts feature aggregation within voxels, mitigating feature extraction biases caused by non-uniform point density and improving the detection of distant and small objects. Kumar et al. [13] explored reconstructing dense point clouds from sparse LiDAR returns, integrating the completed point cloud with 2D imagery to enhance detection accuracy. Representative works focused on representation enhancement include 3DSSD [14], Voxel-RCNN [15], CenterPoint [16], and PillarNet [17]. Wu et al. [18] designed a spatial information-enhanced multi-scale feature aggregation network employing foreground voxel proposals and a multi-scale Transformer framework to integrate contextual information, achieving notable gains in distant object detection. Liu et al. [19] proposed SPBA-Net, which utilizes keypoint-guided sparse attention to enhance semantic information and suppress noise, coupled with instance-level bounding box alignment for precise matching. Addressing the computational complexity of Transformers for long-range dependency modeling, Liu et al. [20] introduced LION, a framework based on linear grouped RNNs, achieving efficient long-range feature interaction with low computational overhead and state-of-the-art performance on large-scale benchmarks. Zhang et al. [21] developed TransMRE, which decomposes 3D voxel scenes into multiple observation planes and employs Transformers for intra- and inter-plane feature interaction, enhancing scene understanding while maintaining sparsity. In cross-modal fusion, Shi et al. [22] presented a regional feature fusion strategy that utilizes 2D detection regions for adaptive fusion of image and point cloud features via cross-attention, thereby improving the detection of small objects.
3. Methods
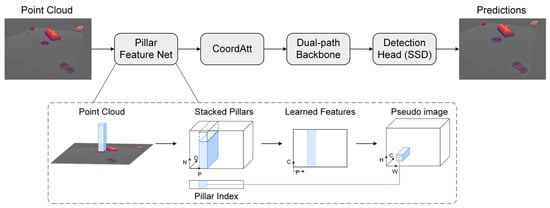
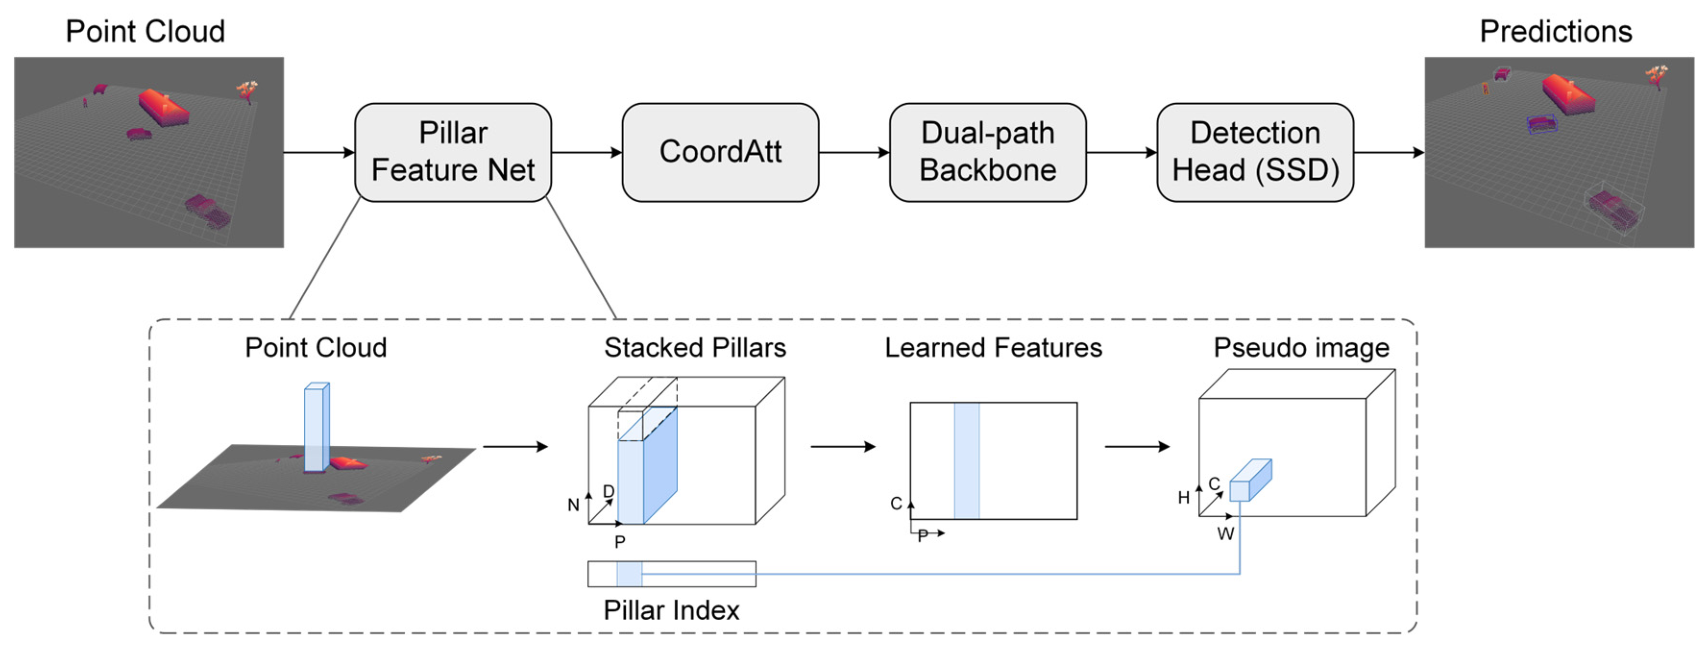
To address the shortcomings of the PointPillars algorithm in feature representation and multi-scale information fusion, this paper integrates a coordinate attention mechanism and reconstructs the backbone network while retaining the original pillar encoding and single-stage detection framework. The overall architecture of the improved algorithm is illustrated in Figure 1. Point clouds undergo pillar partitioning and feature encoding to generate a pseudo-image. This pseudo-image is then processed by the coordinate attention mechanism to emphasize positional information of targets before being fed into the enhanced backbone network for hierarchical feature extraction and fusion. Finally, the detection head predicts 3D bounding boxes based on the fused features.
Figure 1.
Improved PointPillars network architecture, including the coordinate attention (CoordAtt) module, dual-path backbone, and feature fusion module.
3.1. Coordinate Attention Module
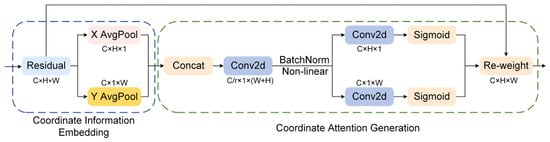
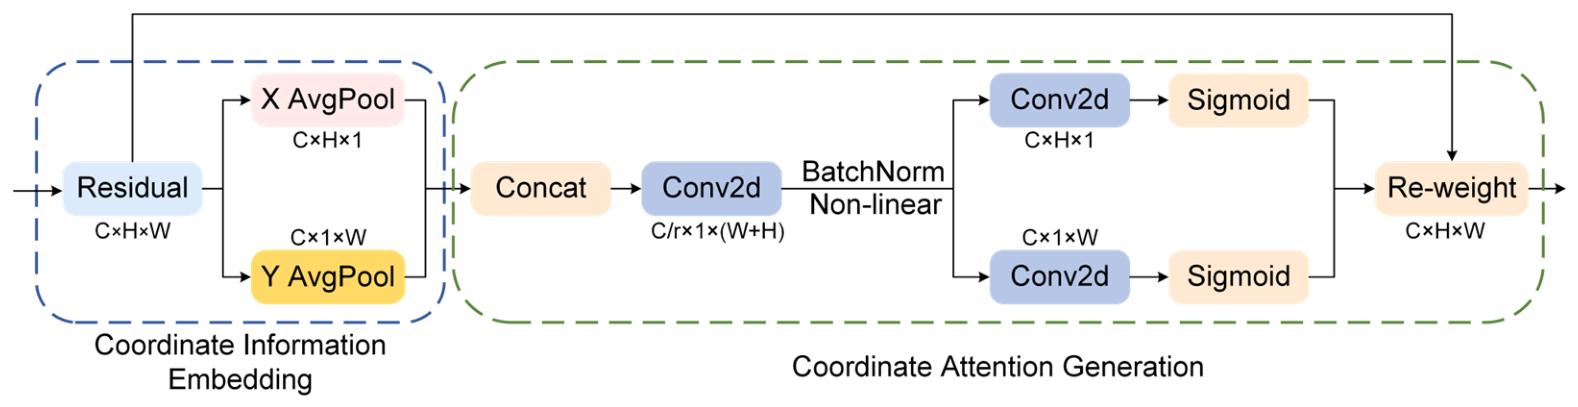
Pillar-based pseudo-images retain the 2D spatial layout of the bird’s-eye view but lose explicit geometric continuity due to vertical compression. Unlike channel attention (e.g., SE), which globally pools spatial information, or CBAM [23], which applies average/max pooling independently on height and width, CoordAtt decomposes attention into two 1D directional encodings, thereby preserving precise positional information. This is particularly beneficial for sparse point cloud detection, where the location of a few points relative to the pillar grid is critical for distinguishing distant objects from the background. To improve the detection of dense objects in complex scenes, a coordinate attention (CoordAtt) mechanism is inserted between the pillar feature encoding network output and the convolutional backbone network input [24]. This module enhances the model’s perception of spatial distribution during the forward pass. CoordAtt decomposes channel attention along spatial dimensions—specifically, height (H) and width (W)—performing one-dimensional feature encoding along each direction. When pooling is conducted along one spatial axis, the coordinate information along the orthogonal axis is preserved, thereby encoding positional information into the generated feature vectors.
The CoordAtt module receives the pseudo-image feature map from the pillar encoder and outputs an attention-augmented feature map of identical dimensions. The module structure, depicted in Figure 2, comprises two primary stages: coordinate information embedding and coordinate attention generation.
Figure 2.
Network architecture of the CoordAtt, which generates direction-aware attention weights by encoding spatial information along horizontal and vertical directions.
3.1.1. Coordinate Information Embedding
The module performs 1D global average pooling along the height and width dimensions. For height-wise encoding, a pooling kernel of size (H, 1) is applied to each column. For the c-th channel and w-th column, the calculation is
This operation aggregates information across all heights for column w, producing a feature vector that encodes horizontal positional context and global vertical information. Similarly, for width-wise encoding, a kernel of size (1, W) is applied to each row. For the c-th channel and h-th row:
This yields a feature vector that encodes vertical positional context and global horizontal information.
3.1.2. Coordinate Attention Generation
The resulting height-wise feature and width-wise feature are concatenated along the spatial dimension to form . This tensor is subsequently processed by a shared 1 × 1 convolutional transform F1 followed by a non-linear activation function for feature transformation and dimensionality reduction.
A reduction ratio r of 32 is employed to curtail computational overhead. The shared transformation facilitates interaction between height and width information to jointly determine the attention distribution.
Subsequently, the interacted feature is split back into independent height and width components. Two separate 1 × 1 convolutions restore the original channel dimension, and a Sigmoid function maps the outputs to the [0, 1] interval, yielding the vertical attention weights and horizontal attention weights .
Finally, these directional attention weights are applied to the input feature map via element-wise multiplication.
3.2. Multi-Scale Fusion Backbone Network
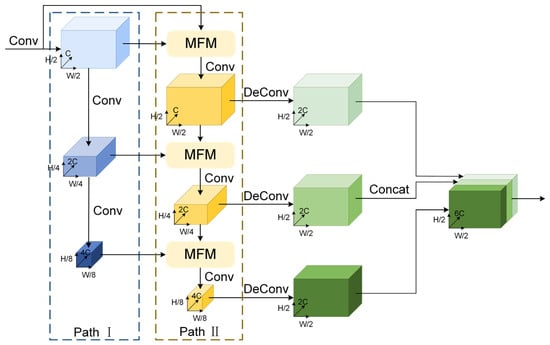
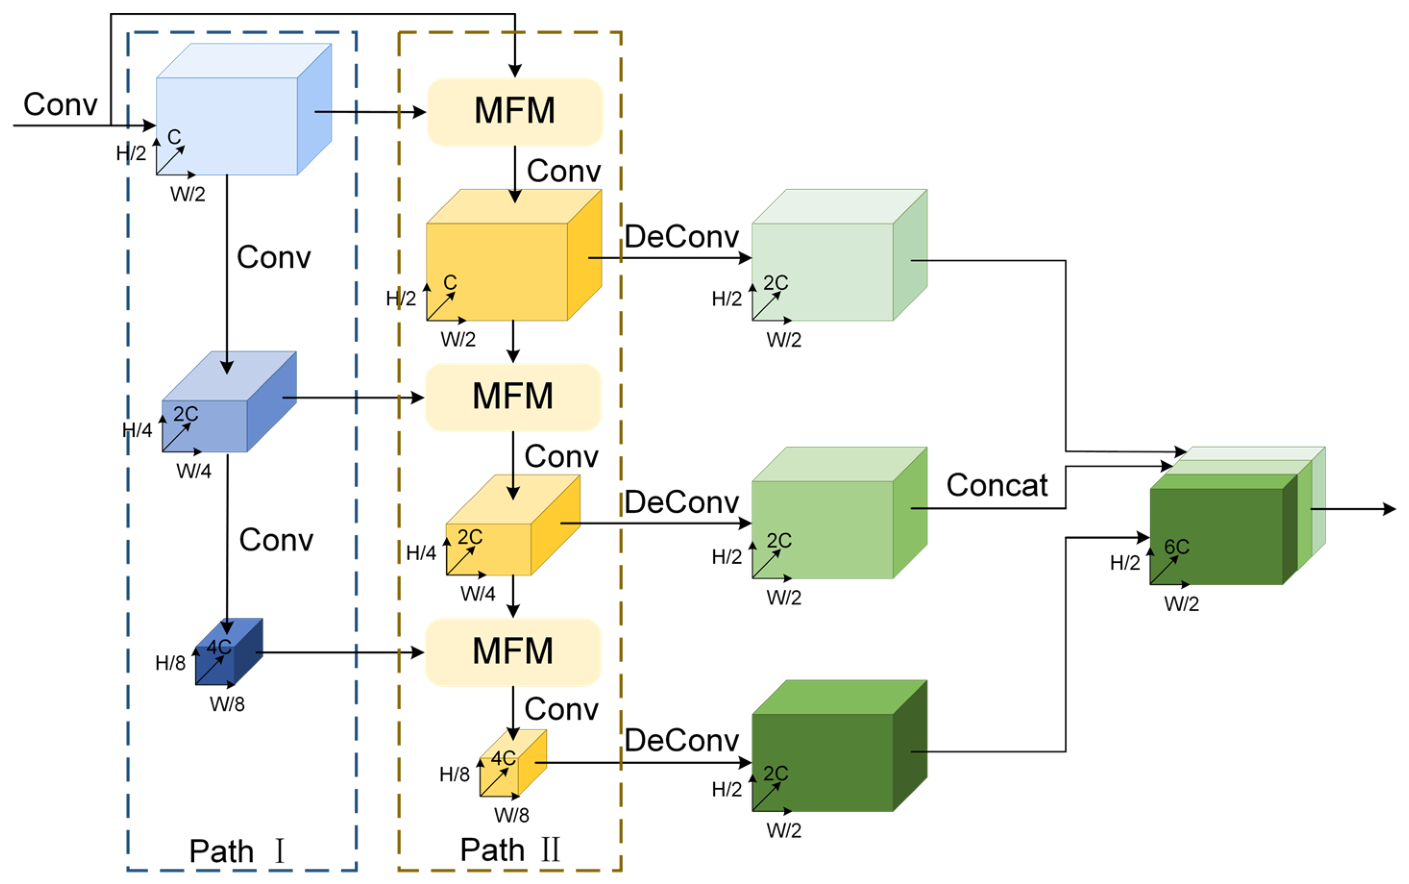
The dual-path backbone network proposed in this section improves object detection capability through two mechanisms. First, Path I and Path II work in parallel at multiple scales, where the auxiliary Path II transforms and fuses features from different levels, enlarging the receptive field without increasing network depth. Second, the modulation fusion module (MFM) dynamically adjusts channel weights based on global context information, enhancing weak yet informative signals from sparse objects while suppressing noise. This selective enhancement is crucial for distant objects that return only a few LiDAR points.
3.2.1. Backbone Architecture
The dual-path backbone network comprises two parallel feature extraction pathways with identical structural configurations, as shown in Figure 3. Path I serves as the primary path, extracting holistic semantic information from the input data. Path II functions as an auxiliary path, responsible for transforming and fusing features across different hierarchical levels.
Figure 3.
Architecture of the dual-path backbone network with parallel feature extraction pathways and MFM-based feature fusion.
The backbone constructs multi-scale feature representations through convolution and down-sampling operations. At each feature extraction stage, Path I generates the current scale’s feature map . Path II takes its output from the previous stage , applies a feature transformation to produce , and aggregates it with the feature generated by Path I at the current stage. The aggregated result is then integrated by a modulation fusion module (MFM) to produce the current stage output of Path II . Mathematically, this is expressed as
The input feature channel is set to 64. The network comprises three feature extraction stages, containing 3, 5, and 5 convolutional blocks with output channels of 128, 128, and 256, respectively. A stride of 2 is applied for down-sampling at each stage.
The architecture of the dual-path backbone network comprises parallel primary and auxiliary feature extraction pathways with multi-scale feature fusion through modulation fusion modules (MFMs).
3.2.2. Modulation Fusion Module
In this module, the two feature paths perform hierarchical feature extraction and multi-scale feature fusion. Conventional feature fusion methods, such as concatenation or element-wise addition, possess inherent limitations. Concatenation preserves all information but inflates channel dimensionality and computational cost. Element-wise addition implicitly assumes perfect spatial and channel alignment and equal contribution from both paths—an assumption that is often overly idealistic, particularly when fusing features with disparate semantic origins.
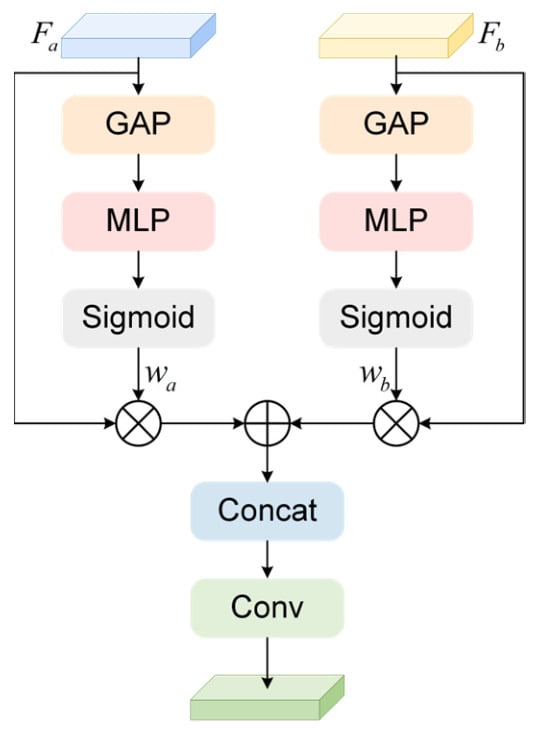
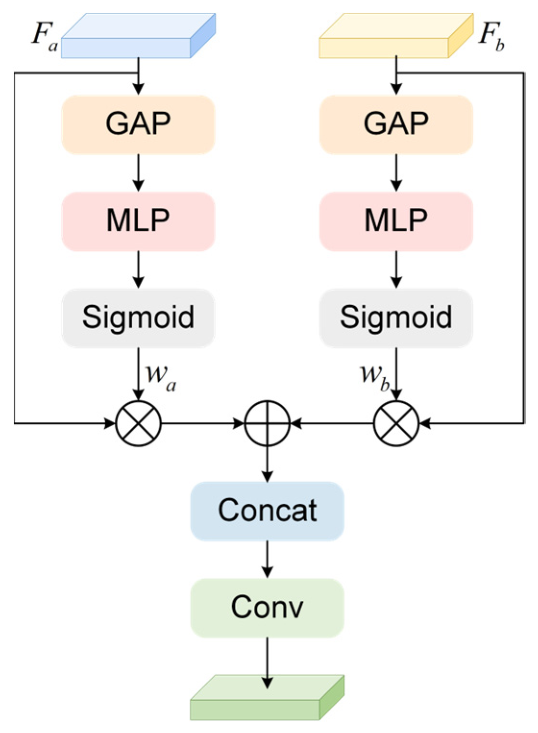
To address these limitations, we introduce the modulation fusion module (MFM). The MFM dynamically generates channel-wise attention weights based on the global context of the input features. These weights adaptively modulate the fusion process, amplifying salient information and attenuating less relevant contributions. The structure of the MFM is detailed in Figure 4.
Figure 4.
Network architecture of the MFM, which adaptively recalibrates channel responses for feature fusion.
For two feature maps to be fused, and , global average pooling compresses them into channel descriptor vectors and . These vectors are passed through a two-layer MLP with shared parameters to generate independent channel weight vectors and , which encode channel importance specific to and , respectively. The computation is as follows:
where , and , are the shared weights and biases of the MLP, denotes the ReLU activation function, and denotes the Sigmoid function, which constrains the weights to the interval (0, 1). A channel reduction ratio of 16 is applied in the implementation to minimize computational complexity.
These channel weights are spatially expanded and multiplied element-wise with the original features and . The modulated features are then fused via element-wise addition to produce the final output.
3.3. Loss Function
The SSD-based detection head performs dense prediction on the fused feature map output by the backbone. At each spatial location, the head evaluates a set of predefined 2D anchor boxes with varying dimensions and orientations. For each anchor, two tasks are performed: classification, predicting the probability of a specific object class; and regression, predicting seven parameters to refine the anchor into a 3D bounding box matching the ground truth. These seven parameters include center point offsets (), dimension residuals (), and orientation offset ().
where and denote the ground truth box and anchor box, respectively, and is the diagonal length of the anchor’s base.
The network is trained under the supervision of a multi-task loss function, which is the weighted sum of classification loss, localization loss, and orientation loss.
The classification loss employs focal loss to mitigate the class imbalance between foreground and background samples.
where is the predicted class probability for the anchor, and and are hyperparameters of the focal loss.
The regression loss utilizes smooth L1 loss to optimize the seven bounding box regression parameters.
To address the cyclic ambiguity of continuous angle regression, a joint prediction method based on angle binning is adopted. The 0–360° range is partitioned into 12 overlapping bins, each with a center interval of 30° and a coverage of 45° (15° overlap between adjacent bins). For each prediction, the network determines the target’s bin classification and predicts a continuous residual relative to the bin center.
In the implementation, the classification loss, localization loss, and orientation loss are first accumulated element-wise over valid positive anchors. Here, denotes the number of valid positive anchors involved in the loss computation for the current batch. The accumulated losses are subsequently normalized by the number of positive anchors during the final loss aggregation stage. To avoid division by zero when no positive anchors are generated, the normalization factor is defined as
The orientation loss function is formulated as follows:
where represents the orientation bin classification loss, which uses focal loss to address the imbalance of samples across different directions. denotes the orientation residual regression loss, which uses smooth L1 loss. The balancing weights and are set to 1.0 and 0.5, respectively.
The total loss function is formulated as follows:
where represents the number of positive anchors, and , , and are the weighting coefficients for the respective loss terms (set to , , and ).
4. Results
This section validates the efficacy of the proposed enhanced PointPillars algorithm. Ablation studies on a custom UAV LiDAR point cloud dataset first evaluate the individual contributions of the CoordAtt module, the improved dual-path backbone, and the orientation prediction refinement. Subsequently, the complete model is benchmarked against the original PointPillars and other state-of-the-art point cloud detectors to demonstrate its overall superiority. Finally, experiments on the public KITTI [25] benchmark further verify the algorithm’s generalization capability and practical applicability.
4.1. Dataset Construction
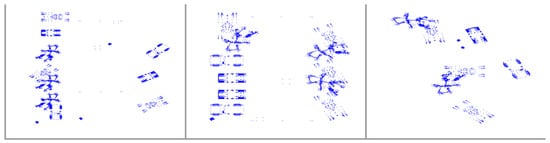
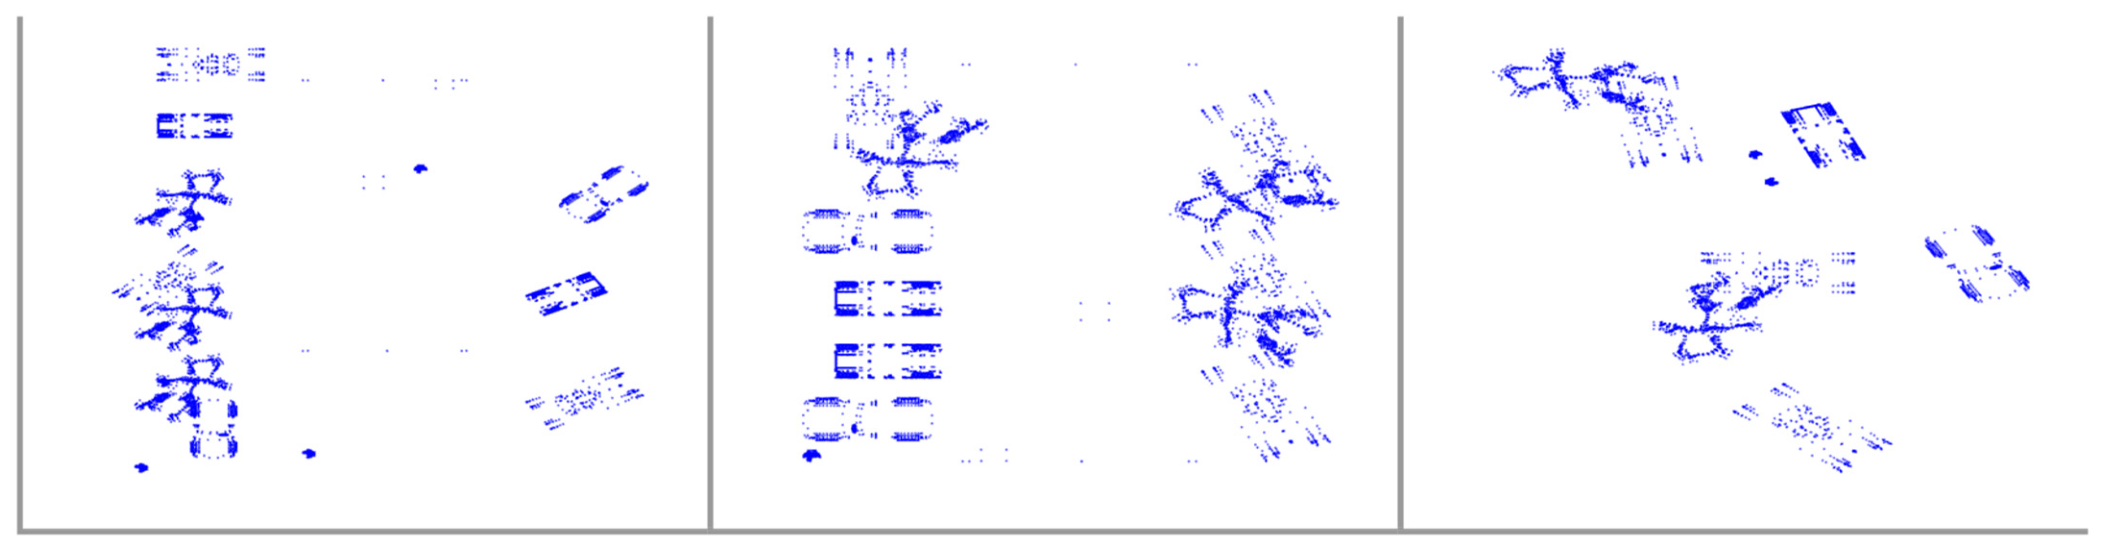
The objects in the custom simulated UAV-borne LiDAR point cloud dataset are sourced from the Princeton Shape Benchmark (PSB) [26], which contains 1814 models across 90 categories. Each model is provided with a polygonal geometry file stored in Object File Format (.off), a model information file, and a JPEG image containing a thumbnail view of the model. From this benchmark, cars, trucks, pedestrians, and tanks are selected as detection targets, with each class accounting for approximately 25% of the dataset. Houses and trees are additionally incorporated as background elements to enhance scene realism. Diverse scenes featuring arbitrary layouts and occlusions are generated by applying random Euler-angle rotations and translation vectors to each object instance. Examples of bird’s-eye view (BEV) projections from the dataset are shown in Figure 5.
Figure 5.
Example of a BEV point cloud image randomly generated by a LiDAR simulation mode.
This study adopts a random generation scheme to construct the dataset. First, 13 distinct models are randomly selected from the PSB for each of the four target categories—cars, trucks, pedestrians, and tanks—as the model samples used for dataset construction. For each category, the model samples are then randomly partitioned into training, validation, and test sets at a ratio of 70%:15%:15%. Accordingly, the training set contains nine models per category, while the validation and test sets each contain two models per category. The model samples in the three subsets are mutually exclusive, ensuring that no model appears in more than one subset. Point cloud scenes are subsequently generated using a simulation algorithm. As shown in Table 1, all key simulation parameters—including target types and quantities, UAV attitude angles, sampling scale, and noise intensity—are randomly and independently sampled from predefined reasonable ranges. This design ensures the diversity and uniform distribution of the generated data samples in the feature space. Following this procedure and using the same split ratio as that applied to the model samples, 2243 point cloud frames are generated for the training set, 480 for the validation set, and 480 for the test set.
Table 1.
Parameter ranges for randomly generated range profiles.
To facilitate model training, the generated point cloud data were manually annotated with 3D bounding boxes using the open-source labelCloud tool(version 1.1.1). The annotations follow the KITTI format, which is compatible with PointPillars. Each annotation is stored as a plain-text file, with each line corresponding to one object and containing 15 fields: class (pedestrian, tank, car, or truck), truncation, occlusion, observation angle, 2D bounding box coordinates (top-left and bottom-right corners), 3D dimensions (height, width, and length), 3D location (the x, y, and z coordinates of the bottom center in the LiDAR coordinate system), and rotation angle around the Y-axis. Because the custom dataset does not contain image data and does not adopt the difficulty-level stratification of the original KITTI benchmark, Fields 2–8 are all set to zero.
4.2. Experimental Setup and Training Parameters
Experiments were conducted on an Ubuntu 18.04 system using Python 3.8 and the PyTorch 1.10.0 deep learning framework with CUDA 11.3. The hardware configuration included an NVIDIA RTX 3080Ti GPU (NVIDIA Corporation, Santa Clara, CA, USA) with 12 GB of memory. The detailed training hyperparameters and point cloud preprocessing settings are summarized in Table 2. In addition, the anchor configurations for different object categories, including detection ranges, anchor sizes, and rotation angles, are provided in Table 3.
Table 2.
Experimental parameter settings.
Table 3.
Anchor configuration for different object categories.
The OneCycleLR policy was employed for learning rate scheduling, with the learning rate increasing for the first 40% of the total iterations and then decreasing via a cosine annealing strategy for the remaining 60%.
4.3. Evaluation Metrics
Average precision (AP) and average orientation similarity (AOS) were adopted as the primary evaluation metrics. AP quantified performance in both 3D and BEV detection, calculated using 40-point interpolation:
where denotes the precision at recall , and represents the recall value at one of the 40 equally spaced recall positions. The intersection over union (IoU) threshold for matching predictions to ground truth is set to 0.7 for car, truck, and tank, and 0.5 for pedestrian.
AOS was computed as the cosine similarity between the predicted angle and the ground truth angle :
where denotes the number of valid matches. A higher AOS indicates superior orientation estimation accuracy.
4.4. Ablation Study
Ablation experiments were conducted to systematically assess the contribution of each proposed component. Starting from the original PointPillars baseline, the CoordAtt module, the dual-path backbone, and the refined orientation prediction head were incrementally integrated. All model variants were trained and evaluated on the custom point cloud dataset.
The results, summarized in Table 4 and Table 5, confirm that all modifications positively impact model performance. The dual-path backbone yields the most substantial improvement. Other components provide targeted enhancements: the CoordAtt module notably improves BEV detection accuracy, while the orientation prediction refinement enhances AOS with a marginal impact on overall 3D mAP. The complete model, combining all modules, achieves the best overall performance.
Table 4.
Comparison of 3D precision and average orientation similarity across different modules.
Table 5.
Comparison of BEV average precision across different modules.
Analysis of the 3D detection results shows that adding only the CoordAtt module improves AOS from 0.96 to 0.98 but decreases the mean average precision (mAP) from 63.74% to 62.25%, corresponding to an absolute decrease of 1.49 percentage points. This indicates that although CoordAtt enhances angular consistency, its lack of a multi-scale receptive field may disturb the deep feature distribution of the original backbone when used alone. In contrast, introducing only the dual-path backbone network yields a more significant effect, raising mAP to 84.56%, demonstrating its effectiveness in enhancing feature learning. Optimizing only the orientation prediction head has a negligible impact on mAP but increases AOS to 0.9848, confirming its role in improving orientation consistency. The complete model achieves the highest 3D mAP of 85.35%, with an AOS of 0.9812. Although its AOS is slightly lower than that of the orientation-refinement-only variant, it remains higher than that of the baseline. These results indicate that integrating the three proposed modules can further improve overall detection performance, although the model configuration yielding the highest overall detection accuracy does not necessarily achieve the highest AOS.
For BEV detection, the baseline model achieves an mAP of 80.41%. Adding only the CoordAtt module improves the mAP by 5.33 percentage points, indicating that it effectively enhances the model’s awareness of 2D planar spatial information. The dual-path backbone further improves the detection performance to 87.84%. The orientation refinement module has only a limited effect on BEV detection. The full model achieves the highest BEV mAP of 88.26%, representing a 7.85-percentage-point improvement over the baseline and further validating the effectiveness of combining the three modules.
Overall, the experimental results demonstrate the individual contributions of the three modules. CoordAtt introduces spatial location priors, the dual-path backbone provides rich multi-scale features, and the orientation refinement module improves angle prediction. However, a more comprehensive evaluation of the pairwise interactions among these modules remains an important topic for future work.
4.5. Comparative Experiments
Following the validation of individual components, the complete proposed model is benchmarked against several mainstream 3D point cloud detection algorithms, including PointRCNN, SECOND, and Part-A2.
4.5.1. Performance Comparison on Custom Dataset
Detection results on the custom dataset are presented in Table 6, where the proposed method demonstrates a significant overall performance advantage.
Table 6.
Comparison of various 3D object detectors on a custom dataset.
Analysis reveals that the proposed method achieves substantial overall gains. In the 3D detection task, the proposed method attains a leading mAP of 85.35%, with particularly pronounced advantages for the truck and tank categories. In the BEV detection task, the proposed method also secures the highest mAP of 88.26%, exhibiting more balanced performance across all classes.
Pedestrian detection remains challenging due to small object size and point cloud sparsity. The Part-A2 model excels in this category, achieving an 81.86% 3D AP and 97.74% BEV AP, outperforming the proposed method. This is attributable to Part-A2’s two-stage framework, which leverages fine-grained point cloud segmentation and local attention for precise structural perception of small objects. In contrast, single-stage models like SECOND and PointPillars exhibit comparatively weaker pedestrian detection performance.
As can be seen from Table 7, the baseline model has the smallest number of parameters, the lowest computational cost, and the lightest structure. After introducing the accuracy-improving modules, the computational cost of the proposed improved model increases, but it remains lower than that of PointRCNN and SECOND. Compared with Part-A2, which has similar accuracy, the proposed method has lower computational overhead and a smaller model size.
Table 7.
Comparison of complexity for various 3D object detectors.
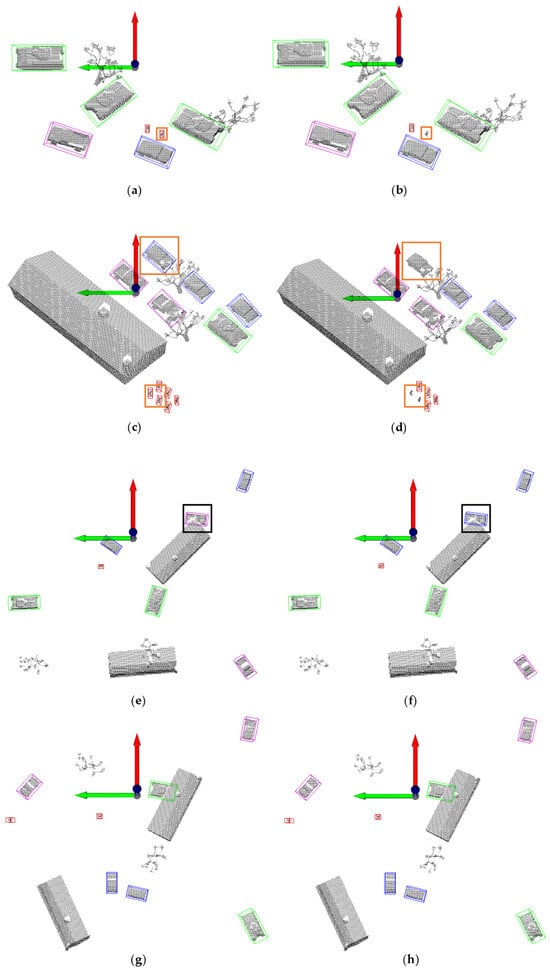
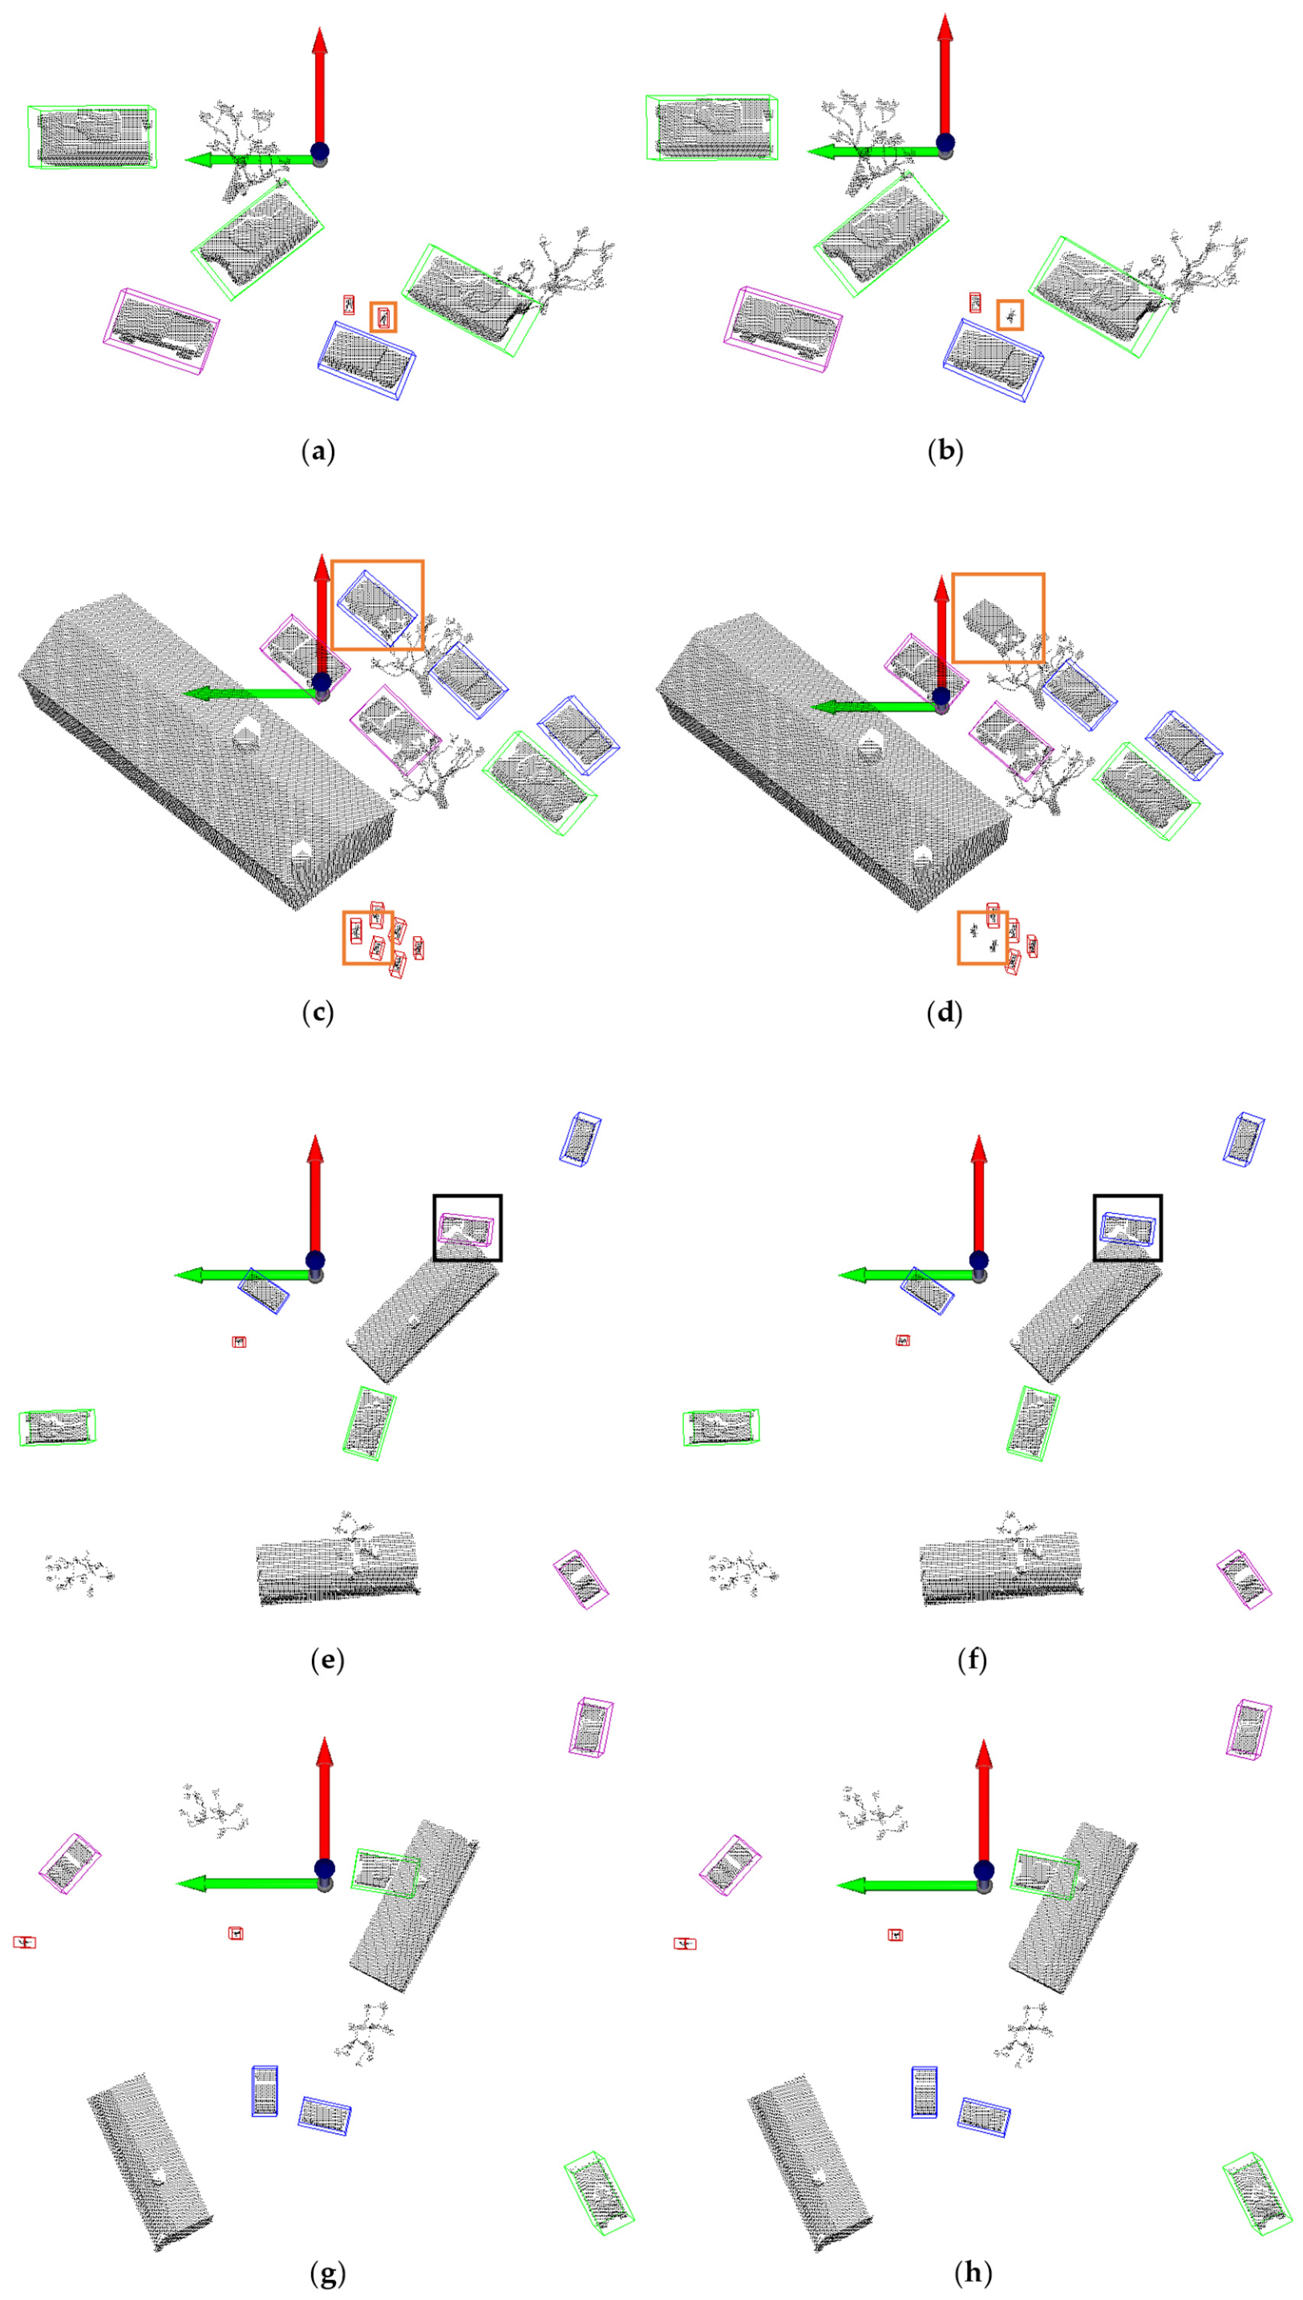
Figure 6 provides a qualitative comparison between the proposed method and the baseline PointPillars on the custom dataset. Figure 6a,c,e,g depict results from the proposed method, while Figure 6b,d,f,h show the baseline’s output on the same point clouds. The proposed method successfully detects numerous vehicles and pedestrians missed by the baseline (highlighted with orange boxes). Black boxes in the baseline visualizations indicate misclassifications, specifically instances where trucks are erroneously identified as cars. These visualizations corroborate the quantitative improvements in recall and localization precision.
Figure 6.
Visualization results of a custom dataset on 3D object detection algorithms: (a) detection result of the proposed method in Scene 1; (b) detection result of PointPillars in Scene 1; (c) detection result of the proposed method in Scene 2; (d) detection result of PointPillars in Scene 2; (e) detection result of the proposed method in Scene 3; (f) detection result of PointPillars in Scene 3; (g) detection result of the proposed method in Scene 4; (h) detection result of PointPillars in Scene 4. Orange boxes highlight objects missed by PointPillars, while black boxes indicate objects misclassified by PointPillars.
4.5.2. Preliminary Cross-Dataset Validation on the KITTI Dataset
To further conduct a preliminary cross-dataset validation of the improved algorithm, experiments were conducted on the public KITTI dataset, and the results are shown in Table 8. It should be noted that the primary purpose of this set of experiments is not to directly demonstrate the method’s adaptability to UAV-view scenarios—because the KITTI dataset is collected from ground-based vehicle-mounted LiDAR, whose perspective is fundamentally different from the aerial BEV of UAVs—but rather to validate the effectiveness of the proposed feature extraction modules on a widely adopted public benchmark, and this validation does not depend on a specific data distribution.
Table 8.
Comparison of our method with PointPillars on the KITTI dataset.
Experimental results show that, for the car category in the KITTI dataset, the proposed method achieves 3D AP values of 89.21%, 80.62%, and 78.65% under the Easy, Moderate, and Hard difficulty levels, respectively, corresponding to an mAP of 82.83%. This represents an improvement of 2.00 percentage points over the 80.83% achieved by the PointPillars baseline. These results provide preliminary evidence that the proposed modules do not rely entirely on the specific distribution of the customized simulated dataset and can still improve performance on public point cloud data collected from a different platform.
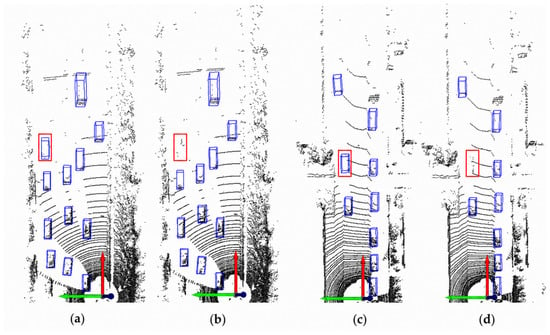
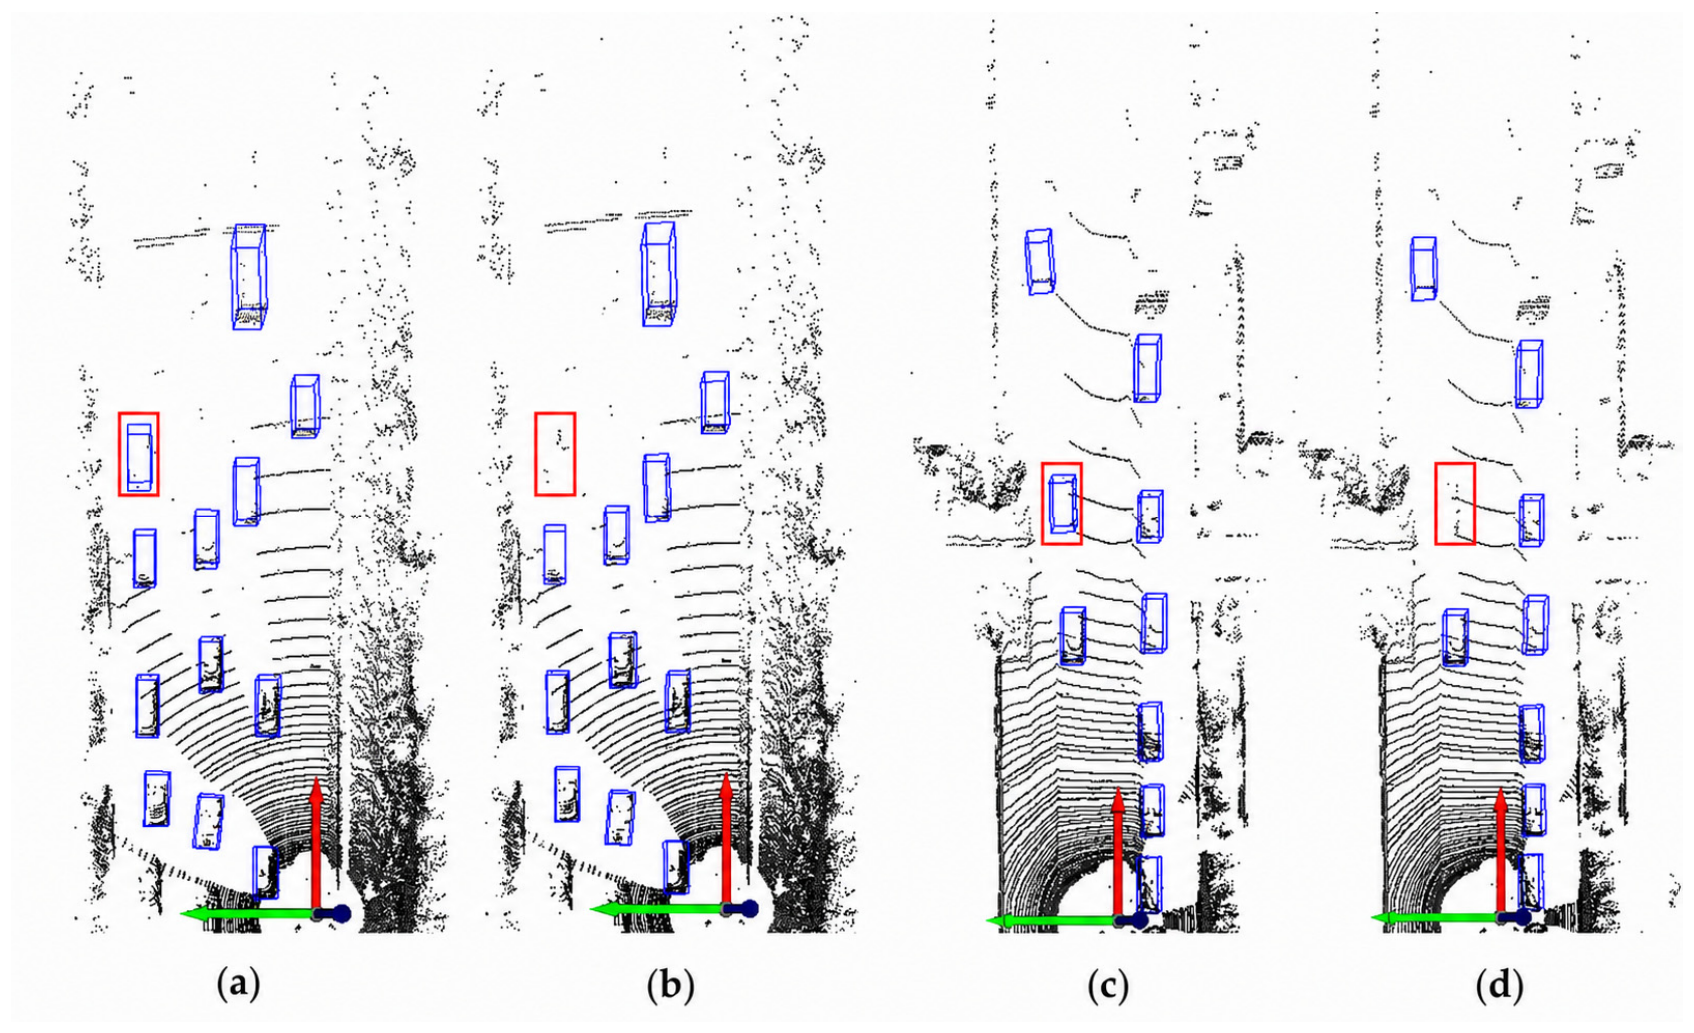
Figure 7 presents a visual comparison on the KITTI dataset. In the highlighted regions, the proposed method (Figure 7a,c) demonstrates a greater ability to accurately detect distant objects with sparse point returns compared to the baseline model (Figure 7b,d).
Figure 7.
Visualization results of the KITTI dataset on 3D object detection algorithms: (a) detection result of the proposed method in Scene 1; (b) detection result of PointPillars in Scene 1; (c) detection result of the proposed method in Scene 2; (d) detection result of PointPillars in Scene 2. Red rectangles highlight distant objects detected by the proposed method but missed by PointPillars.
5. Conclusions
This paper addresses the limitations of the PointPillars algorithm in complex point cloud scenes, namely insufficient feature representation and suboptimal multi-scale information fusion. Two principal enhancements are proposed: the integration of a coordinate attention mechanism to bolster spatial geometric perception and the design of a dual-path backbone network with a modulation fusion module to improve multi-scale feature expressiveness. On a custom UAV LiDAR point cloud dataset, the complete model achieves a 3D mean average precision (mAP) of 85.35%, a substantial increase of 21.61 percentage points over the original PointPillars (63.74%). The bird’s-eye view mAP reaches 88.26%, marking a 7.85 percentage point improvement over the baseline (80.41%). Ablation studies show that, when applied independently, the orientation refinement module increases AOS from 0.9603 to 0.9848. The complete model achieves an AOS of 0.9812 and the highest 3D mAP of 85.35%, indicating a favorable balance between orientation consistency and overall detection accuracy. Experimental results on the public KITTI benchmark provide preliminary cross-dataset validation of the proposed modules under a different LiDAR acquisition scenario. Nevertheless, detection accuracy for extremely small targets like pedestrians warrants further improvement, and the scale of the custom dataset is limited. Future research will focus on conducting systematic comparative experiments using more object categories, larger-scale datasets, more advanced baseline methods, and different module combinations to further validate the generalization ability of the proposed method.
Author Contributions
Conceptualization, Y.Z. and S.G.; methodology, Y.Z., S.X. and W.L.; validation, S.L., W.L. and X.L. (Xiuli Luo); formal analysis, Y.Z. and X.L. (Xuan Li); investigation, Y.Z., S.X., W.L., S.L. and X.L. (Xiuli Luo); resources, L.W. and S.G.; data curation, Y.Z. and S.X.; writing—original draft preparation, Y.Z.; writing—review and editing, Y.Z., S.X., W.L., S.L., X.L. (Xuan Li), X.L. (Xiuli Luo), S.G. and L.W.; visualization, Y.Z. and S.X.; supervision, S.G.; project administration, S.G.; funding acquisition, S.G. All authors have read and agreed to the published version of the manuscript.
Funding
This research was funded by the Fundamental Research Program of Shanxi Province, grant number 202303021212207, and the Joint Funding Project of the Fundamental Research Program of Shanxi Province, grant number 202503011212008.
Data Availability Statement
The data presented in this study are available upon request from the corresponding author.
Conflicts of Interest
The authors declare no conflicts of interest.
References
- Qi, C.R.; Su, H.; Mo, K.; Guibas, L. PointNet: Deep learning on point sets for 3D classification and segmentation. In Proceedings of the IEEE Conference on Computer Vision and Pattern Recognition, Honolulu, HI, USA, 21–26 July 2017; pp. 652–660. [Google Scholar]
- Qi, C.R.; Yi, L.; Su, H.; Guibas, L. PointNet++: Deep hierarchical feature learning on point sets in a metric space. In Proceedings of the 2017 IEEE Conference on Computer Vision and Pattern Recognition (CVPR), Honolulu, HI, USA, 21–26 July 2017; pp. 5099–5108. [Google Scholar]
- Shi, S.; Wang, X.; Li, H. PointRCNN: 3D object proposal generation and detection from point cloud. In Proceedings of the IEEE/CVF Conference on Computer Vision and Pattern Recognition, Long Beach, CA, USA, 16–20 June 2019; pp. 770–779. [Google Scholar]
- Zhou, Y.; Tuzel, O. VoxelNet: End-to-end learning for point cloud based 3D object detection. In Proceedings of the IEEE Conference on Computer Vision and Pattern Recognition, Salt Lake City, UT, USA, 18–22 June 2018; pp. 4490–4499. [Google Scholar]
- Yan, Y.; Mao, Y.; Li, B. Second: Sparsely embedded convolutional detection. Sensors 2018, 18, 3337. [Google Scholar] [CrossRef] [Scilit] [PubMed]
- Lang, A.H.; Vora, S.; Caesar, H.; Zhou, L.; Yang, J.; Beijbom, O. PointPillars: Fast encoders for object detection from point clouds. In Proceedings of the IEEE/CVF Conference on Computer Vision and Pattern Recognition, Long Beach, CA, USA, 16–20 June 2019; pp. 12697–12705. [Google Scholar]
- Shi, S.; Wang, Z.; Wang, X.; Li, H. Part-A2 net: 3D part-aware and aggregation neural network for object detection from point cloud. arXiv 2019, arXiv:1907.03670v1. [Google Scholar]
- Chen, X.; Ma, H.; Wan, J.; Li, B.; Xia, T. Multi-view 3D object detection network for autonomous driving. In Proceedings of the IEEE Conference on Computer Vision and Pattern Recognition, Honolulu, HI, USA, 21–26 July 2017; pp. 1907–1915. [Google Scholar]
- Ku, J.; Mozifian, M.; Lee, J.; Harakeh, A.; Waslander, S.L. Joint 3D proposal generation and object detection from view aggregation. In Proceedings of the 2018 IEEE/RSJ International Conference on Intelligent Robots and Systems (IROS), Madrid, Spain, 1–5 October 2018; pp. 1–8. [Google Scholar]
- Xu, D.; Anguelov, D.; Jain, A. PointFusion: Deep sensor fusion for 3D bounding box estimation. In Proceedings of the IEEE Conference on Computer Vision and Pattern Recognition, Salt Lake City, UT, USA, 18–22 June 2018; pp. 244–253. [Google Scholar]
- Qi, C.R.; Liu, W.; Wu, C.; Su, H.; Guibas, L. Frustum PointNets for 3D object detection from RGB-D data. In Proceedings of the IEEE Conference on Computer Vision and Pattern Recognition, Salt Lake City, UT, USA, 18–22 June 2018; pp. 918–927.26. [Google Scholar]
- Hu, J.S.; Kuai, T.; Waslander, S.L. Point density-aware voxels for lidar 3D object detection. In Proceedings of the IEEE/CVF Conference on Computer Vision and Pattern Recognition, New Orleans, LA, USA, 19–24 June 2022; pp. 8469–8478. [Google Scholar]
- Kumar, A.; Chen, C.; Mian, A.; Lobo, N.; Shah, M. Sparse points to dense clouds: Enhancing 3D detection with limited LiDAR data. In Proceedings of the 2024 IEEE/RSJ International Conference on Intelligent Robots and Systems (IROS), Abu Dhabi, United Arab Emirates, 14–18 October 2024; pp. 12963–12970. [Google Scholar]
- Yang, Z.; Sun, Y.; Liu, S.; Jia, J. 3DSSD: Point-based 3D single stage object detector. In Proceedings of the IEEE/CVF Conference on Computer Vision and Pattern Recognition, Seattle, WA, USA, 13–19 June 2020; pp. 11040–11048. [Google Scholar]
- Deng, J.; Shi, S.; Li, P.; Zhou, W.; Zhang, Y.; Li, H. Voxel R-CNN: Towards high performance voxel-based 3D object detection. In Proceedings of the AAAI Conference on Artificial Intelligence, Virtual, 2–9 February 2021; pp. 1201–1209. [Google Scholar]
- Yin, T.; Zhou, X.; Krahenbuhl, P. Center-based 3D object detection and tracking. In Proceedings of the IEEE/CVF Conference on Computer Vision and Pattern Recognition, Virtual, 19–25 June 2021; pp. 11784–11793. [Google Scholar]
- Shi, G.; Li, R.; Ma, C. PillarNet: Real-time and high-performance pillar-based 3D object detection. In Proceedings of the European Conference on Computer Vision, Tel Aviv, Israel, 23–27 October 2022; pp. 35–52. [Google Scholar]
- Li, H.; Tao, H.; Deng, Q.; Xiao, S.; Zhou, J. Spatial Information Enhancement with Multi-Scale Feature Aggregation for Long-Range Object and Small Reflective Area Object Detection from Point Cloud. Remote Sens. 2024, 16, 2631. [Google Scholar] [CrossRef] [Scilit]
- Sha, H.; Gao, Q.; Zeng, H.; Li, K.; Li, W.; Zhang, X.; Wang, X. SPBA-Net point cloud object detection with sparse attention and box aligning. Sci. Rep. 2024, 14, 28420. [Google Scholar] [CrossRef] [Scilit] [PubMed]
- Liu, Z.; Hou, J.; Wang, X.; Ye, X.; Wang, J.; Zhao, H.; Bai, X. Lion: Linear group RNN for 3D object detection in point clouds. Adv. Neural Inf. Process. Syst. 2024, 37, 13601–13626. [Google Scholar] [CrossRef] [Scilit]
- Zhu, Z.; Zhu, Y.; Zhang, K.; Li, H.; Ling, X. Measurement. TransMRE: Multiple Observation Planes Representation Encoding with Fully Sparse Voxel Transformers for 3-D Object Detection. IEEE Trans. Instrum. Meas. 2024, 73, 2535913. [Google Scholar] [CrossRef] [Scilit]
- Shi, Y.; Ma, L.; Li, J.; Wang, X.; Yang, Y. A region feature fusion network for point cloud and image to detect 3D object. IET Collab. Intell. Manuf. 2024, 6, e12100. [Google Scholar] [CrossRef] [Scilit]
- Woo, S.; Park, J.; Lee, J.-Y.; Kweon, I.S. CBAM: Convolutional block attention module. In Proceedings of the European Conference on Computer Vision (ECCV), Munich, Germany, 8–14 September 2018; pp. 3–19. [Google Scholar]
- Hou, Q.; Zhou, D.; Feng, J. Coordinate Attention for Efficient Mobile Network Design. In Proceedings of the IEEE/CVF Conference on Computer Vision and Pattern Recognition (CVPR), Nashville, TN, USA, 20–25 June 2021; pp. 13708–13717. [Google Scholar]
- Geiger, A.; Lenz, P.; Urtasun, R. Are we ready for autonomous driving? The KITTI vision benchmark suite. In Proceedings of the 2012 IEEE Conference on Computer Vision and Pattern Recognition, Providence, RI, USA, 16–21 June 2012; pp. 3354–3361. [Google Scholar]
- Shilane, P.; Min, P.; Kazhdan, M.; Funkhouser, T. The Princeton shape benchmark. In Proceedings of the Shape Modeling Applications, Genova, Italy, 7–9 June 2004; pp. 167–178. [Google Scholar]

Disclaimer/Publisher’s Note: The statements, opinions and data contained in all publications are solely those of the individual author(s) and contributor(s) and not of MDPI and/or the editor(s). MDPI and/or the editor(s) disclaim responsibility for any injury to people or property resulting from any ideas, methods, instructions or products referred to in the content. |
© 2026 by the authors. Licensee MDPI, Basel, Switzerland. This article is an open access article distributed under the terms and conditions of the Creative Commons Attribution (CC BY) license.