


Abstract
The rapid proliferation of Internet of Things (IoT) devices and their integration into increasingly interconnected applications have substantially expanded the attack surface of modern networked systems. The heterogeneous nature and high volume of IoT traffic make timely and reliable identification of malicious activities increasingly important for maintaining the security and resilience of IoT-enabled environments. This study investigates the effectiveness of maching learning approaches for supervised malicious traffic classification in IoT networks using the ACI-IoT-2023 dataset. A comparative experimental study is conducted across binary and eleven-class classification tasks to examine the capability of different learning approaches to distinguish benign and malicious traffic and identify diverse attack categories. The results demonstrate strong classification performance across the evaluated approaches, with XGBoost achieving the highest ROC-AUC in binary classification and the Decision Tree delivering the best overall performance in eleven-class classification. Further analysis of feature importance identifies several flow-level features that contribute substantially to classification performance. Overall, the findings demonstrate the effectiveness of machine learning-based approaches for accurate and efficient malicious traffic classification in IoT networks.
1. Introduction
Modern transportation infrastructures are rapidly evolving into highly connected cyber-physical systems that rely on continuous communication between vehicles, roadside infrastructure, and cloud-based services. Through the integration of embedded sensors, wireless communication protocols, and distributed computing platforms, intelligent transportation infrastructures now enable real-time data collection [1], vehicle-to-vehicle (V2V) communication [2], and automated decision-making [3]. These capabilities support advanced applications such as traffic optimization, autonomous driving, predictive maintenance, and smart mobility services [4]. As transportation networks continue to evolve toward fully connected and autonomous environments, reliable and secure data exchange has become a critical requirement for maintaining system efficiency and public safety.
Despite these advancements, the increasing reliance on interconnected IoT devices introduces substantial cybersecurity challenges. Transportation systems built on distributed networks and diverse communication protocols significantly expand the potential attack surface. Malicious actors may exploit vulnerabilities within networked components to launch attacks such as distributed denial-of-service (DDoS), spoofing, or manipulation of sensor data within V2V communication channels. These attacks can disrupt network functionality, compromise system integrity, and potentially lead to dangerous real-world consequences, including incorrect vehicle behavior or failures in traffic management systems [5]. Prior work has demonstrated that IoT-enabled transportation infrastructure is susceptible to cyber-physical attacks at the sensing layer due to inherent vulnerabilities of embedded IoT devices [6]. Malware targeting IoT-enabled intelligent transportation systems represents a particularly active threat vector, as recent work has shown that deep learning techniques can be applied to detect such attacks with high accuracy [7].
Traditional network security approaches, including rule-based intrusion detection systems and static filtering techniques, often struggle to address the dynamic and high-volume nature of IoT transportation traffic. These systems typically rely on predefined attack signatures and therefore lack the flexibility to detect novel or evolving threats [8]. Furthermore, IoT transportation environments often involve resource-constrained devices with limited computational capacity, making it challenging to deploy complex security mechanisms without affecting system performance [8]. The challenge is compounded in maritime and other specialized transportation domains, where IoT devices are resource-constrained and traditional offline or batch-based detection systems are difficult to deploy effectively [9].
Machine learning (ML) has emerged as a promising solution for addressing these limitations by enabling adaptive and data-driven anomaly detection. ML-based classification models can analyze large volumes of network traffic data to identify patterns associated with both normal and malicious behavior. By learning from labeled datasets, these models can detect previously unseen attack patterns while maintaining efficient operation suitable for real-time environments. In the context of intelligent transportation systems, lightweight ML approaches offer the potential to improve threat detection while remaining compatible with the computational limitations of embedded IoT devices. Recent evaluations of anomaly detection methods in intelligent transportation systems have highlighted the importance of selecting approaches that balance detection effectiveness with computational practicality [10]. ML methods applied to transportation traffic data must also contend with class imbalance, as labeled datasets frequently contain large volumes of common traffic classes alongside very few samples of rare attack types [11]. Prior work on intrusion detection in IoT transportation networks has also noted that deep learning models can produce high false positive rates and that the interpretability of model decisions is an important practical concern [12].
Recent research on intrusion detection has increasingly focused on machine learning-based approaches for IoT networks, where the diversity of devices [13], traffic patterns [14], and attack behaviors makes conventional rule-based detection insufficient [15]. In V2X environments, security is further complicated by highly dynamic communication [16], stringent latency requirements, and threats [17] such as message manipulation, impersonation, and privacy attacks. A major challenge across IoT and vehicular intrusion detection is severe class imbalance, where common attacks dominate the training data while rare attacks remain difficult to detect; techniques such as SMOTE [18], attention mechanisms, and imbalance-aware learning have therefore been investigated to improve minority-class detection [19]. At the same time, explainable machine learning (XAI) has gained attention because high-performing ML/DL-based IDSs can be difficult to interpret [20], while explanations can improve transparency, trust, and understanding of attack-related features [21]. Finally, edge-based IDS deployment has emerged as a promising direction [22] for reducing communication latency and cloud dependence [23] while enabling real-time detection close to IoT [24] and vehicular devices [25]. Sheng et al. provided a comprehensive survey of network traffic fingerprinting for IIoT device identification, organizing the field around three persistent challenges: an underspecified fingerprint feature space, limited generalizability to previously unseen devices, and a scarcity of public datasets suitable for benchmarking [26]. These studies collectively motivate lightweight, interpretable, and imbalance-aware IDS models that can operate effectively under the resource and latency constraints of edge-enabled IoT and V2X environments.
This research investigates the application of machine learning classification techniques for anomaly detection in IoT-enabled transportation networks. Using publicly available datasets containing labeled IP-based network traffic flows across multiple application types, the project analyzes traffic characteristics to distinguish between benign and suspicious network behavior. Several classification models are evaluated to assess their effectiveness in terms of detection accuracy, computational efficiency, and adaptability to transportation-specific networking conditions. By identifying practical approaches for detecting anomalous traffic patterns, this work continues to improve the cybersecurity resilience of connected transportation infrastructures. The results support the development of scalable security solutions capable of protecting next-generation intelligent transportation systems while maintaining operational efficiency.
The remainder of this paper is organized as follows. Section 2 describes the dataset, preprocessing pipeline, and model configurations. Section 3 reports binary and multi-class results, Receiver Operating Characteristic (ROC) analysis, feature importance, and per-class performance. Section 4 presents an error analysis across all five models and discusses deployment implications. Section 5 concludes the paper and outlines future work.
2. Methodology
2.1. Dataset
We evaluate all models on the ACI-IoT-2023 dataset, released by the Army Cyber Institute [27]. The raw dataset contains 1,231,411 network flow records, each described by 78 numerical and categorical features extracted from flow-level statistics. The label space contains eleven retained classes: Port Scan, Benign, ICMP Flood, Ping Sweep, DNS Flood, Vulnerability Scan, OS Scan, Slowloris, SYN Flood, Dictionary Attack, and UDP Flood. The class distribution is highly imbalanced, as shown in Table 1.
Table 1.
ACI-IoT-2023 class distribution after rare-class filtering.
Port Scan alone accounts for more than one-third of all records, while UDP Flood comprises only 0.06% of the dataset. This imbalance has direct consequences for minority-class detection, as discussed in Section 4.
2.2. Preprocessing Pipeline
The preprocessing pipeline is designed to prevent data leakage, preserve proportional class representation across splits, and enable controlled comparison across all five algorithms. It consists of the following nine steps.
(1) Data ingestion and rare-class removal. Classes with fewer than 100 total samples (specifically ARP Spoofing) are removed, leaving eleven reliably sampled classes.
(2) Label engineering. Two parallel label arrays are constructed: an integer-encoded multi-class array (0–10) and a binary array (). Non-predictive identifier columns such as IP addresses, timestamps, and flow IDs are removed at this stage.
(3) Categorical encoding and cleaning. All categorical columns are integer-encoded independently using LabelEncoder. NaN values are imputed with the column-wise mean; infinite values, which arise when flow denominators approach zero, are replaced with NaN and then filled with zero.
(4) Stratified downsampling. Because training K-Nearest Neighbors (KNNs) and Random Forest on more than one million records is computationally prohibitive, we draw a stratified sample of exactly 500,000 records with random_state=42, preserving each class’s proportional representation.
(5) Train/validation/test split. Two sequential stratified splits produce approximately 350,000 training, 75,000 validation, and 75,000 test records (70/15/15). The test set is isolated before any model fitting and accessed exactly once, at final evaluation.
(6) Feature scaling. All features are standardized to zero mean and unit variance. The StandardScaler is fit exclusively on the training set and applied—without refitting—to the validation and test sets. Although tree-based models are scale-invariant, uniform scaling ensures that KNN distance computations, eXtreme Gradient Boosting (XGBoost) gradient updates, and Convolutional Neural Network (CNN) gradient flow all operate on comparable feature magnitudes, so that observed performance differences reflect algorithmic properties rather than preprocessing artifacts.
(7–8) Training. All five classifiers are trained on the binary-labeled training set and subsequently retrained on the multi-class labels. For the multi-class task, XGBoost switches to multi:softmax with num_class=11, and the CNN output layer changes from a single sigmoid unit to an 11-unit softmax. All other hyperparameters remain identical to enable controlled comparison.
(9) Evaluation. For each model and task we compute accuracy, weighted precision, weighted recall, weighted F1-score, AUC-ROC (binary), per-class classification reports, and wall-clock training time, all evaluated on the held-out test set.
2.3. Models
Five classifiers with distinct inductive biases are evaluated:
Decision Tree. A deterministic depth-20 tree trained with scikit-learn’s default Gini impurity splitting criterion. It creates explicit, inspectable axis-aligned decision rules.
Random Forest. An ensemble of 100 bootstrapped depth-20 trees with majority voting. Bagging is expected to improve calibration over a single tree at the cost of slower training.
XGBoost. A gradient-boosted ensemble of 100 trees with max_depth=10 and learning_rate=0.1 [28]. Sequential boosting focuses learning capacity on previously misclassified examples.
KNN. A lazy learner with using Euclidean distance. KNN has no training phase; classification cost is incurred at inference time.
1D CNN. A deep model that treats the preprocessed flow-level feature vector as a one-dimensional sequence and applies three Conv1D blocks with kernel size 3 (64, 128, and 64 filters), each followed by batch normalization and ReLU activation. Two MaxPooling1D layers progressively reduce the sequence length, followed by a GlobalAveragePooling1D layer that collapses the sequence dimension entirely. Two dense layers (128 and 64 units) with Dropout(0.3) follow the pooling stage. The output layer is a single sigmoid unit for binary classification or an 11-unit softmax for multi-class classification. The dense layers account for the majority of the network’s learnable parameters, which number in the tens of thousands. Training uses early stopping with a small train/validation loss gap throughout, indicating that the architecture—not overfitting—limits performance.
2.4. Computational Environment
All experiments were conducted on an Apple MacBook Pro equipped with an Intel Core i7 quad-core processor, 16 GB RAM, and a 512 GB SSD, running macOS. All experiments were performed using CPU-based computation without a dedicated GPU. The implementation used Python 3.x, with NumPy and pandas for data processing, scikit-learn and XGBoost for conventional machine learning models, and TensorFlow/Keras for the 1D CNN. The same computational environment was used for all five models to ensure a consistent comparison.
3. Results
3.1. Binary Classification
Table 2 summarizes binary classification performance on the held-out test set of approximately 75,000 records. Each model’s confusion matrix is presented individually below alongside a discussion of its classification behavior. In addition to accuracy, precision, recall, and F1-score, we report the false positive rate (FPR) and false negative rate (FNR) derived from the corresponding confusion matrices.
Table 2.
Binary classification results (benign vs. attack).
The FPR measures the proportion of benign flows that are incorrectly classified as malicious and is defined as
where (FP) denotes the number of benign flows incorrectly classified as malicious and (TN) denotes the number of benign flows correctly classified as benign.
The FNR measures the proportion of malicious flows that are incorrectly classified as benign and is defined as
where (FN) denotes the number of malicious flows incorrectly classified as benign and (TP) denotes the number of malicious flows correctly classified as malicious.
These definitions differ from the percentage of the entire test set represented by each confusion-matrix cell. Therefore, the FPR and FNR reported below are calculated using the corresponding conditional denominators rather than the total number of test samples.
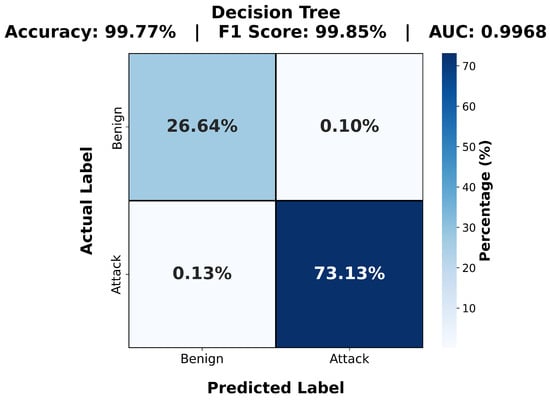
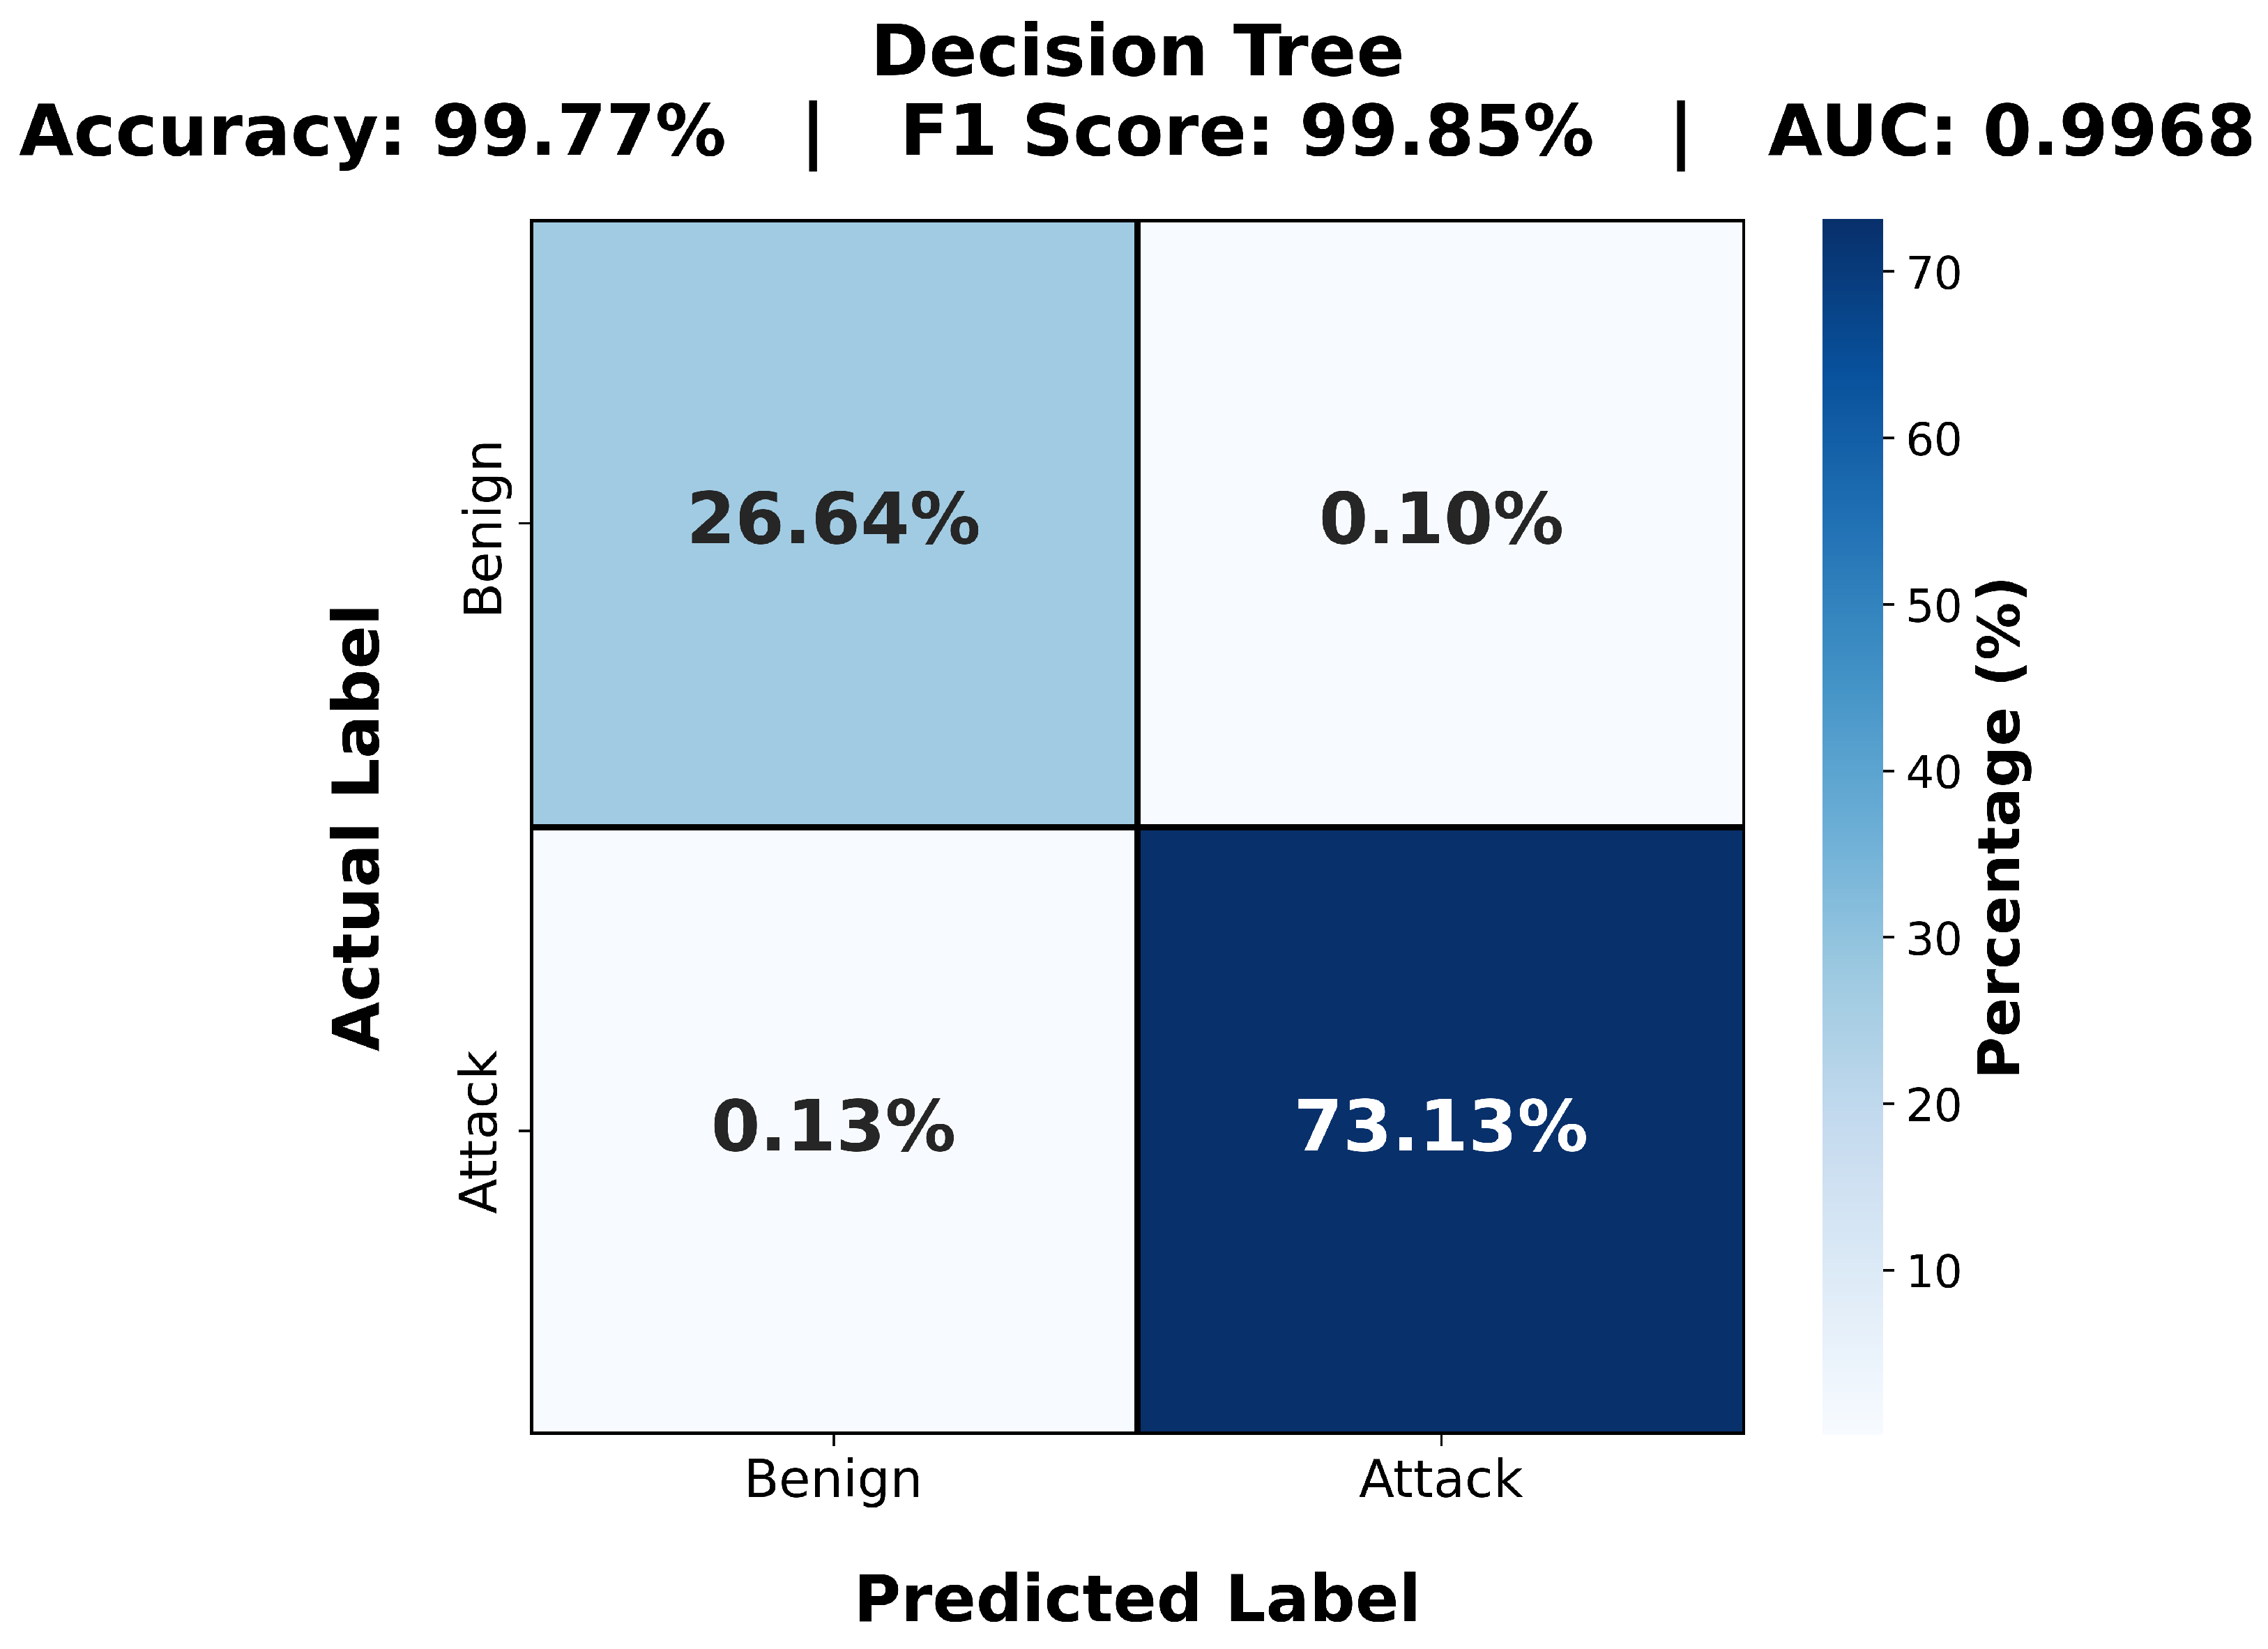
Decision Tree. As shown in Figure 1, the Decision Tree correctly classifies 26.64% of flows as benign and 73.13% as attacks, with a false positive rate of only 0.10% and a false negative rate of 0.13%. It achieves the highest F1-score of all five models (99.85%) and the fewest false positives overall. Its axis-aligned splitting on dominant features such as RST Flag Count allows it to route the vast majority of flows correctly in a single deterministic pass, with no ensemble overhead.
Figure 1.
Decision Tree binary confusion matrix.
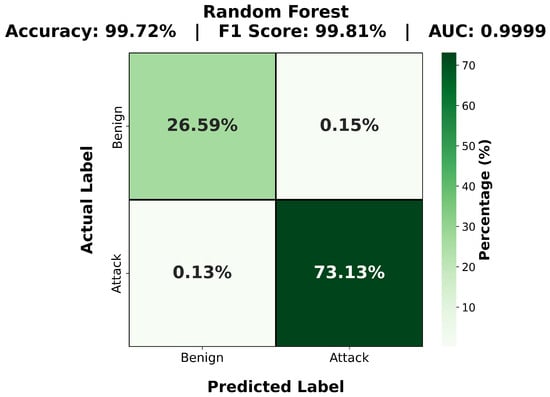
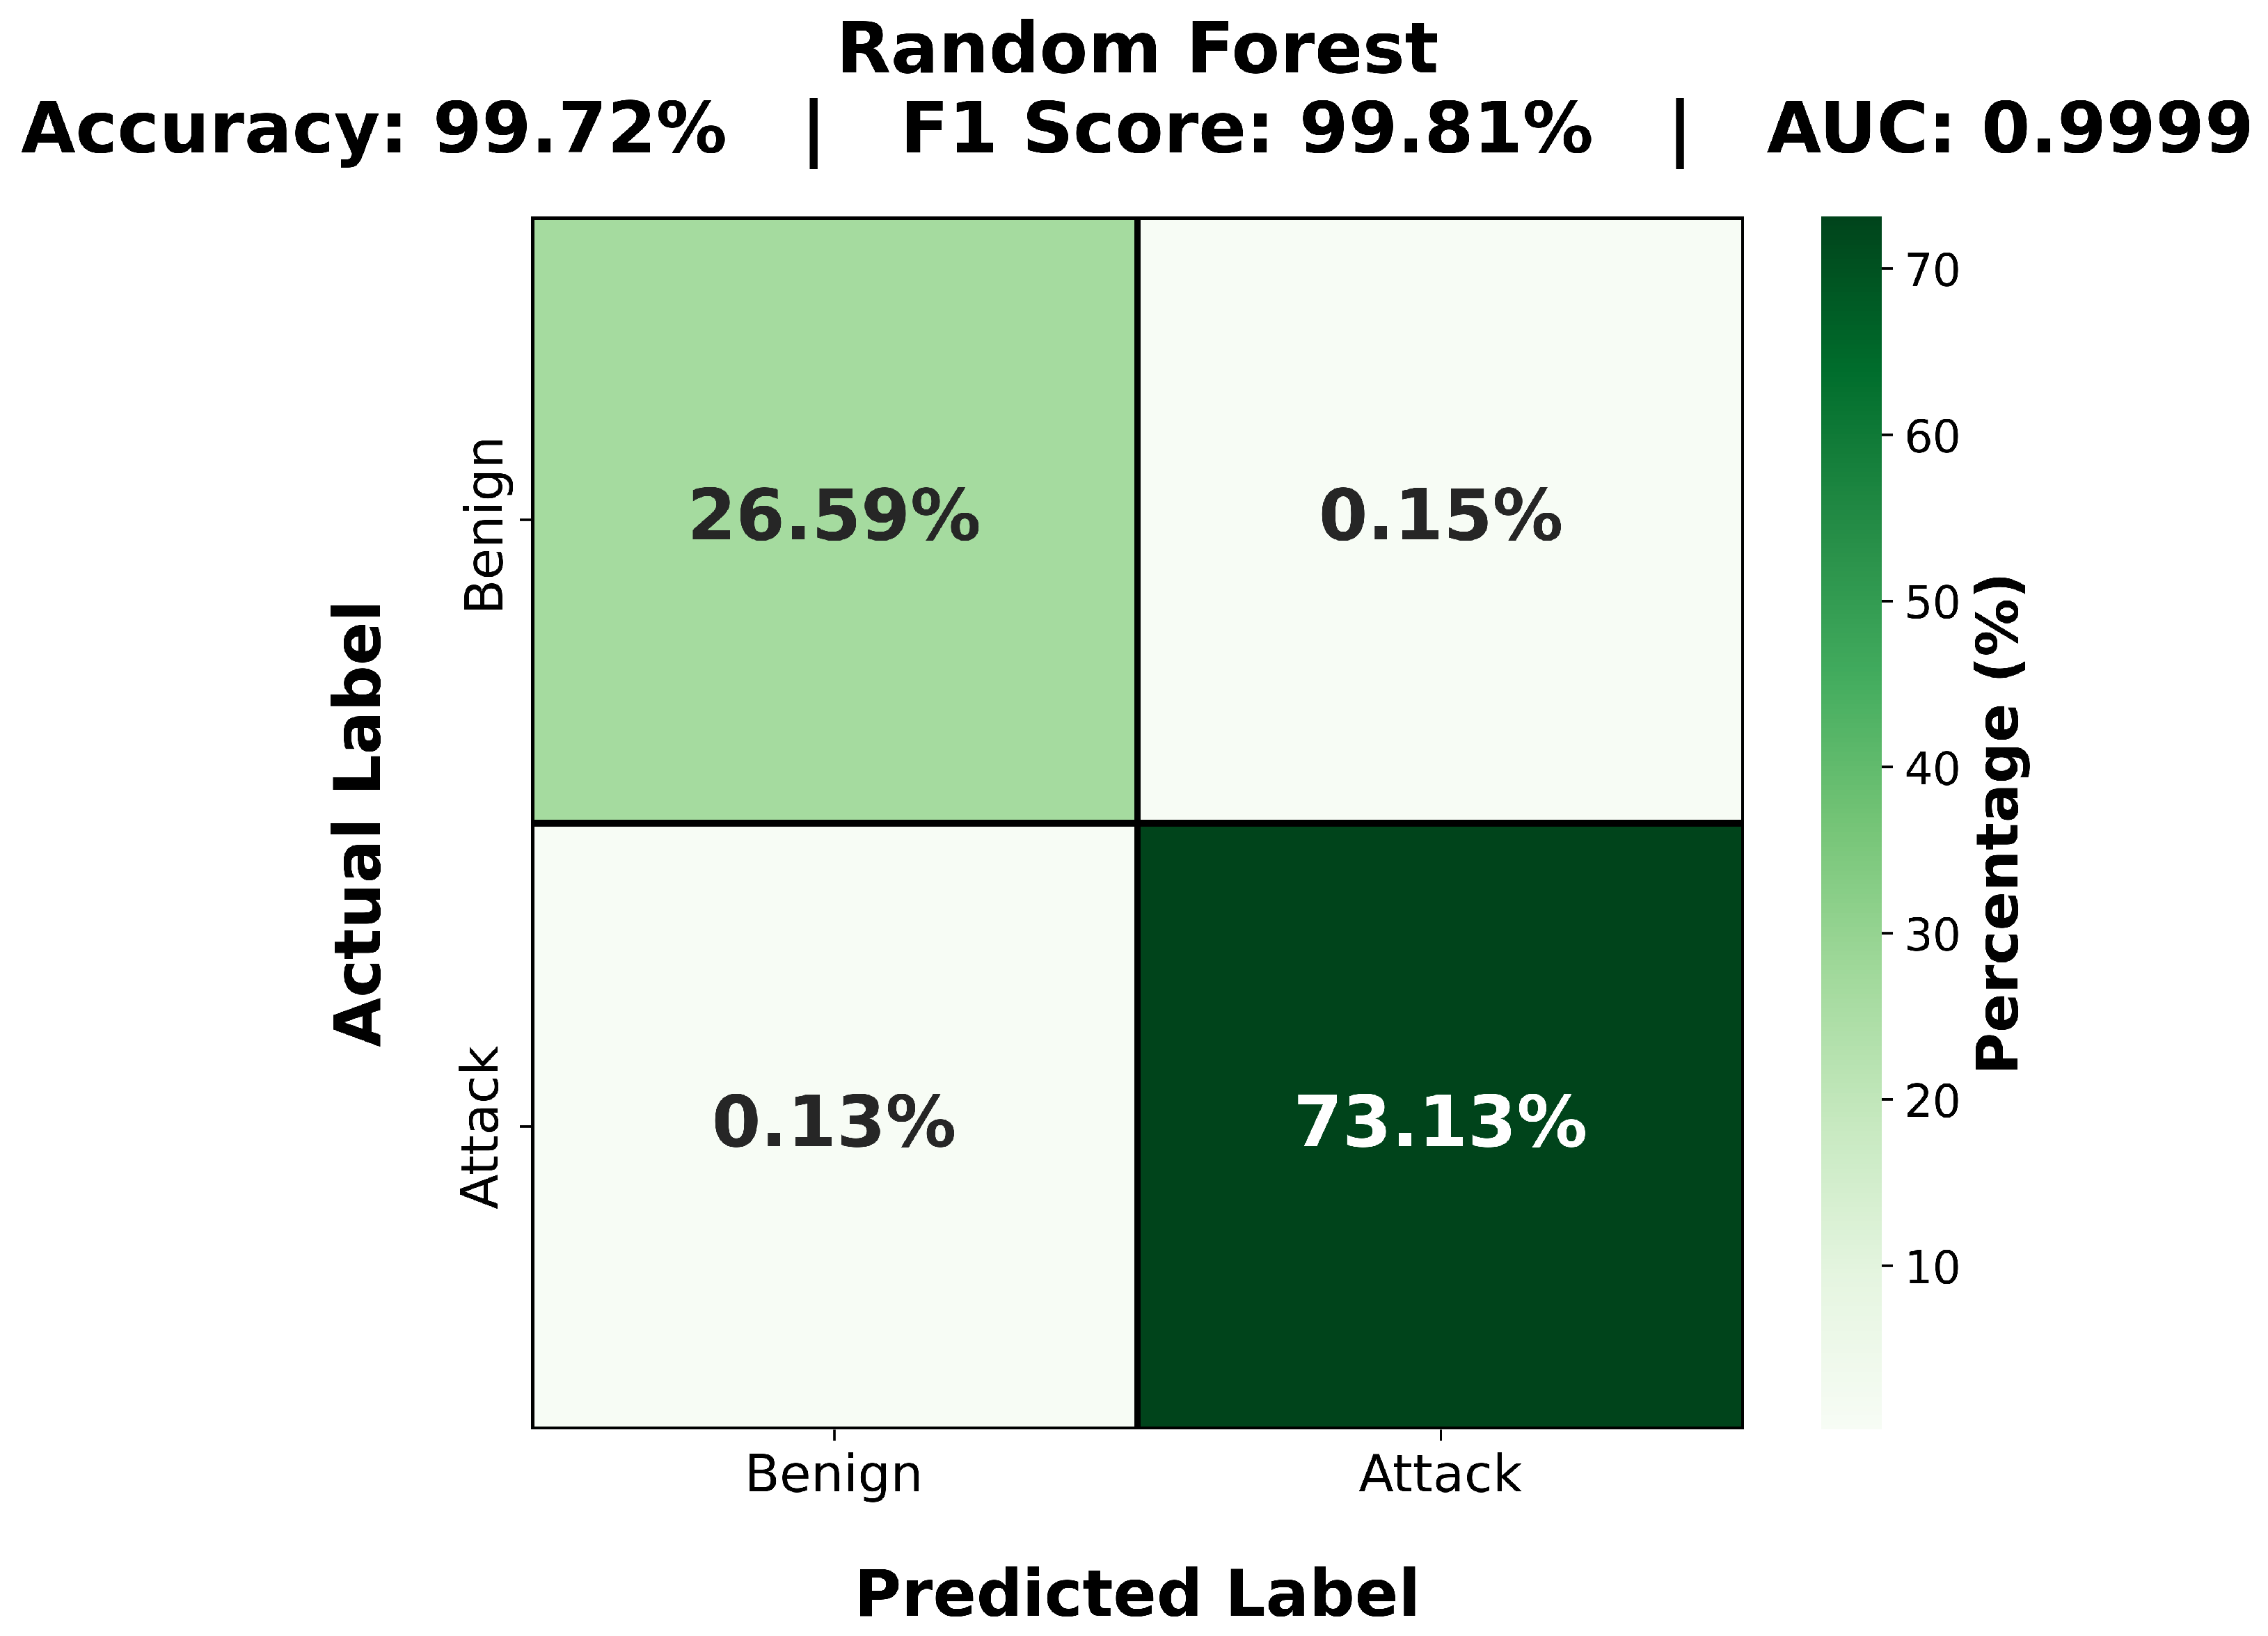
Random Forest. Random Forest (Figure 2) produces nearly identical cell counts to the Decision Tree—26.59% true benign, 73.13% true attack—but with a slightly higher false positive rate of 0.15%. It ties XGBoost for the best AUC-ROC (0.9999), indicating near-perfect probability calibration across all thresholds. The marginal increase in false positives relative to the Decision Tree reflects ensemble voting behavior, where slim attack majorities on borderline benign flows override what a single tree would route correctly.
Figure 2.
Random Forest binary confusion matrix.
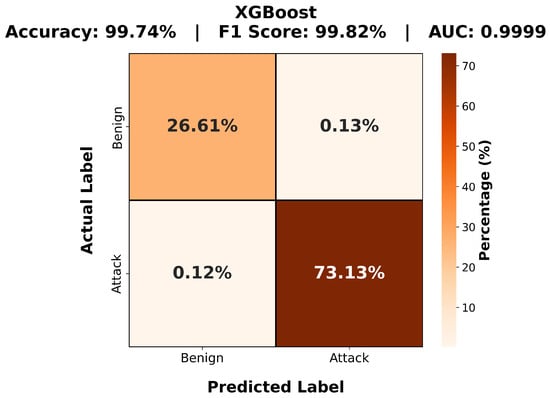
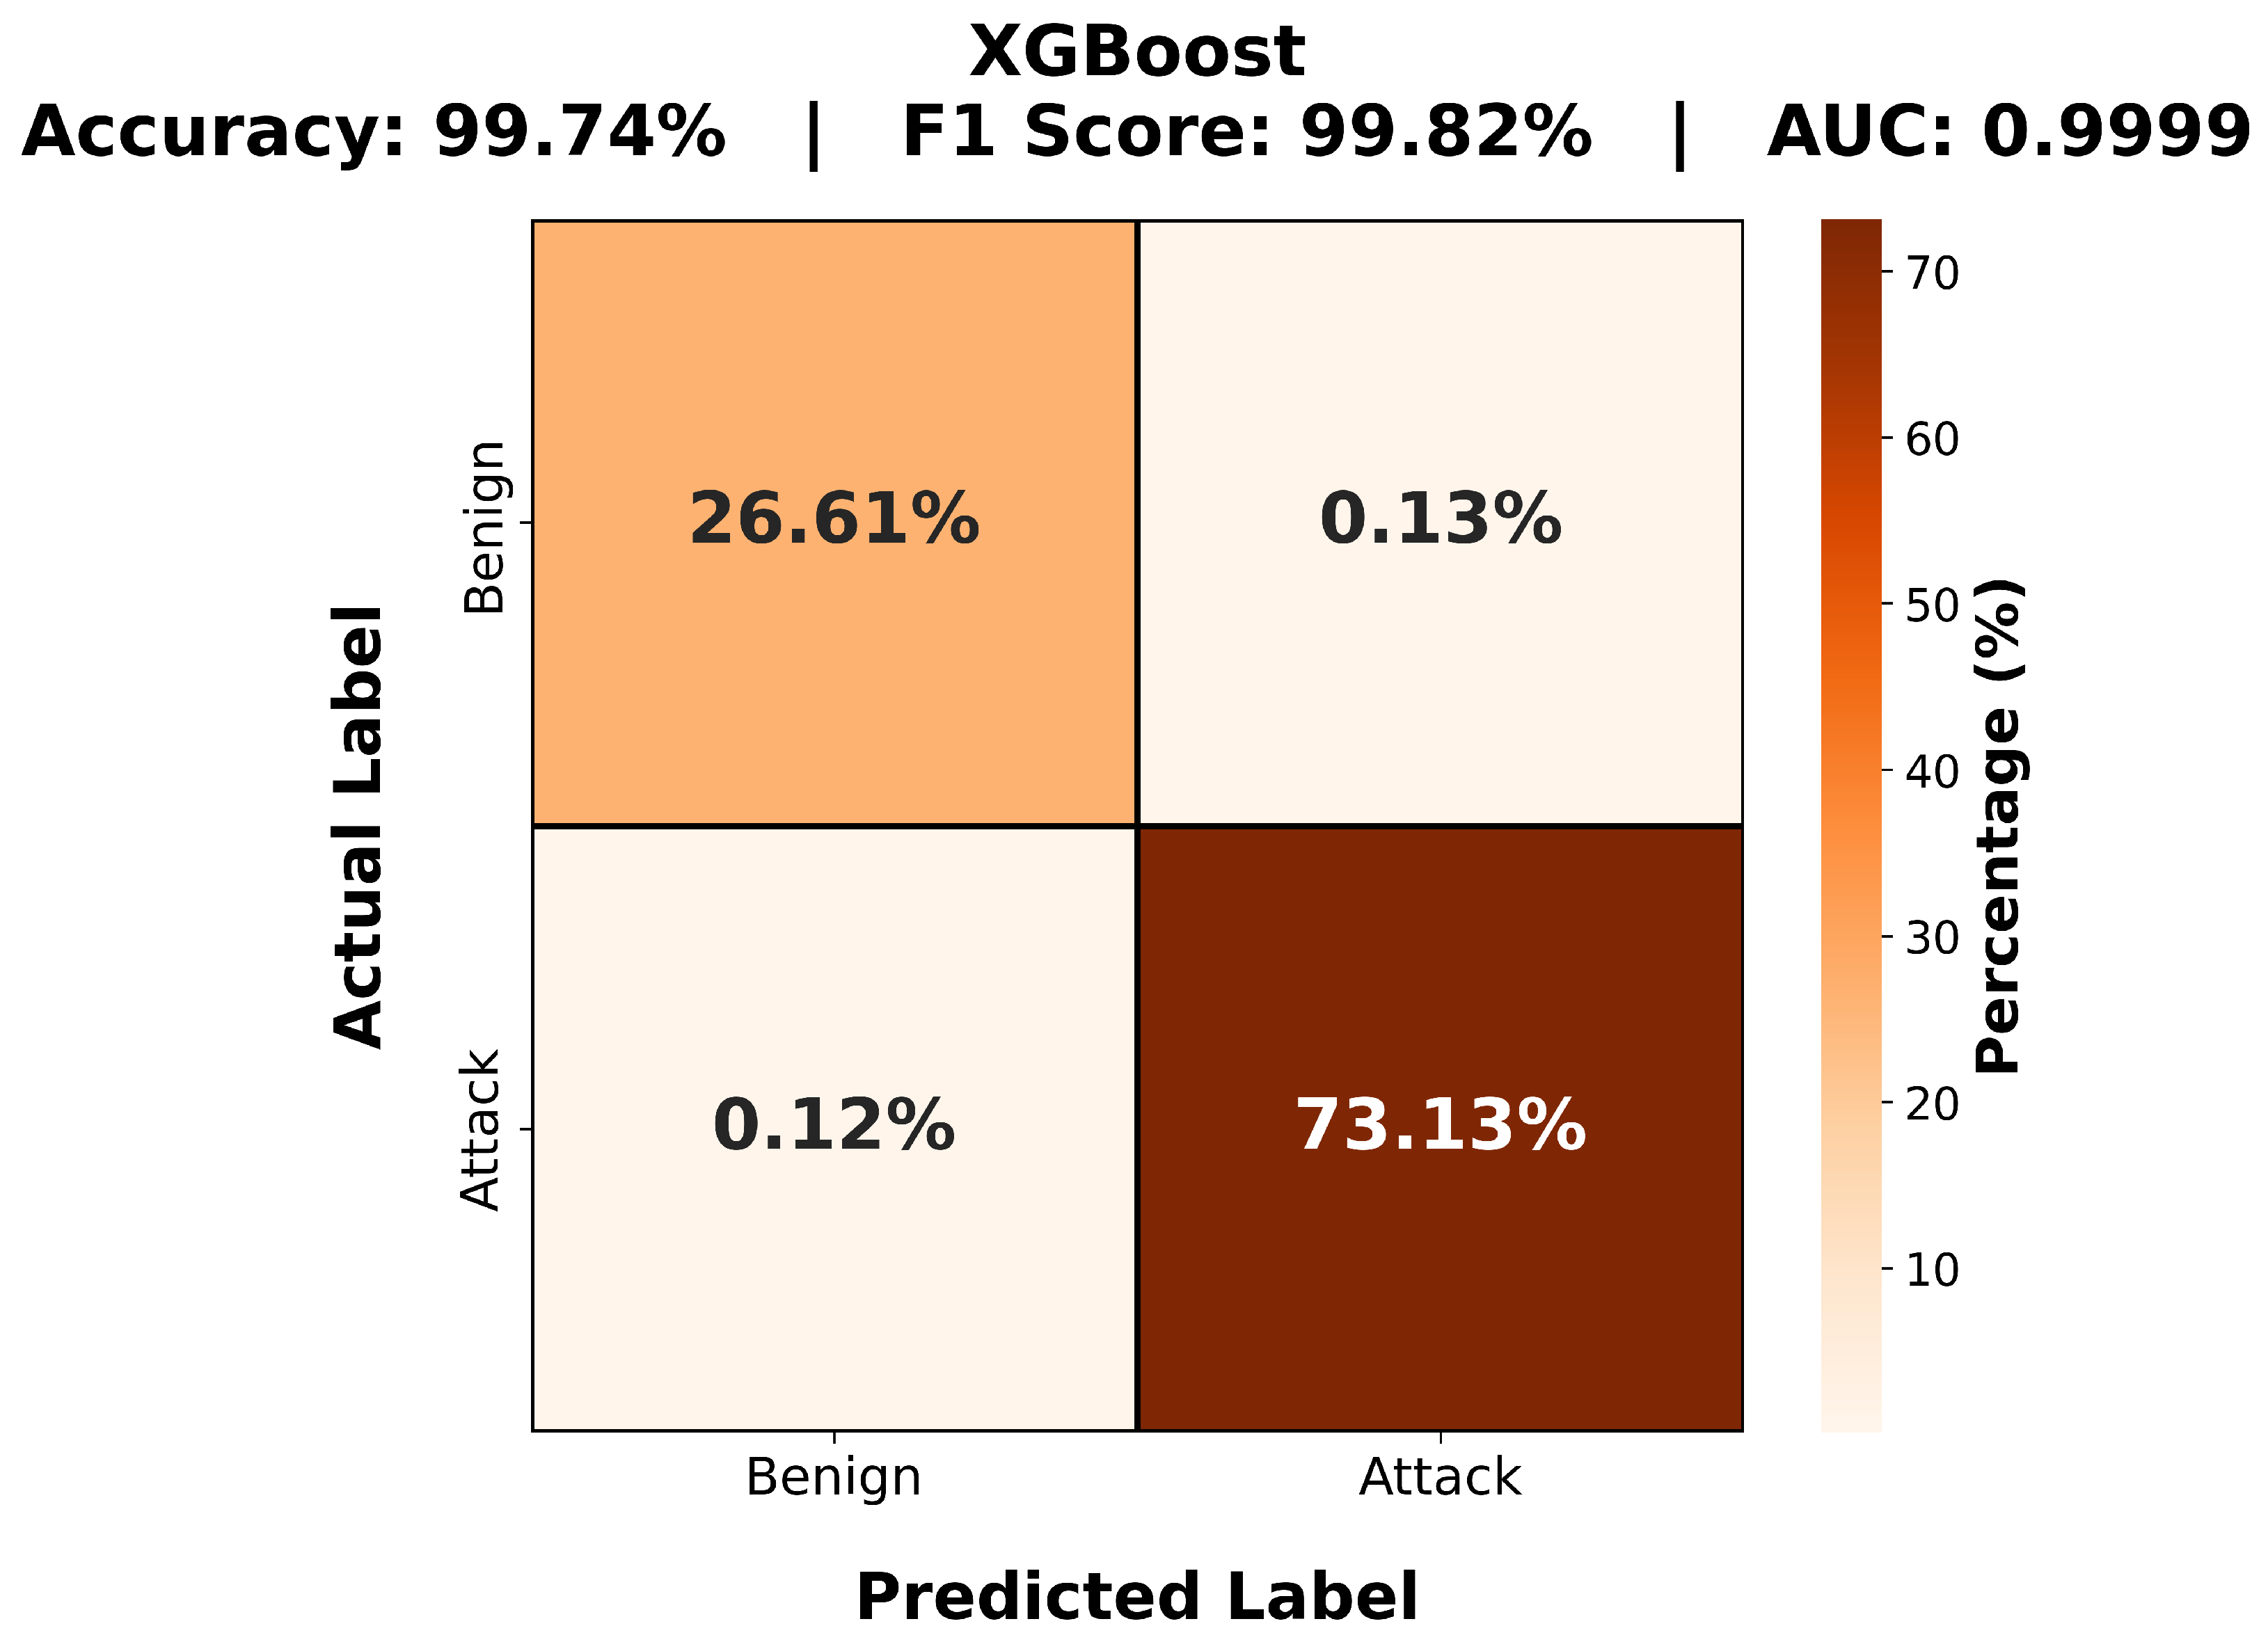
XGBoost. XGBoost (Figure 3) achieves 26.61% true benign and 73.13% true attack, with a false positive rate of 0.13% and a false negative rate of 0.12%—the lowest false negative rate among all five models. It matches Random Forest on AUC-ROC (0.9999) while training in only 0.08 min, making it approximately faster than the Decision Tree and faster than the CNN. This combination of near-perfect discrimination and minimal training time makes XGBoost the strongest candidate for the first stage of a two-stage deployment pipeline.
Figure 3.
XGBoost binary confusion matrix.
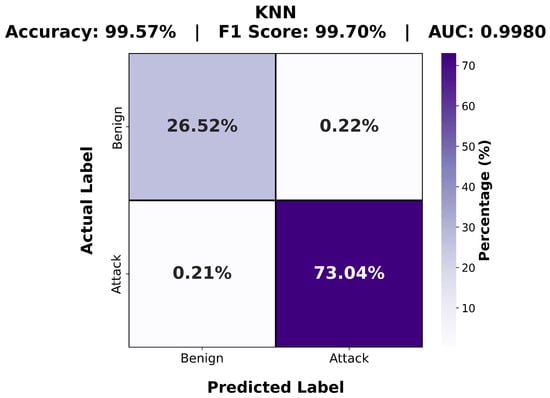
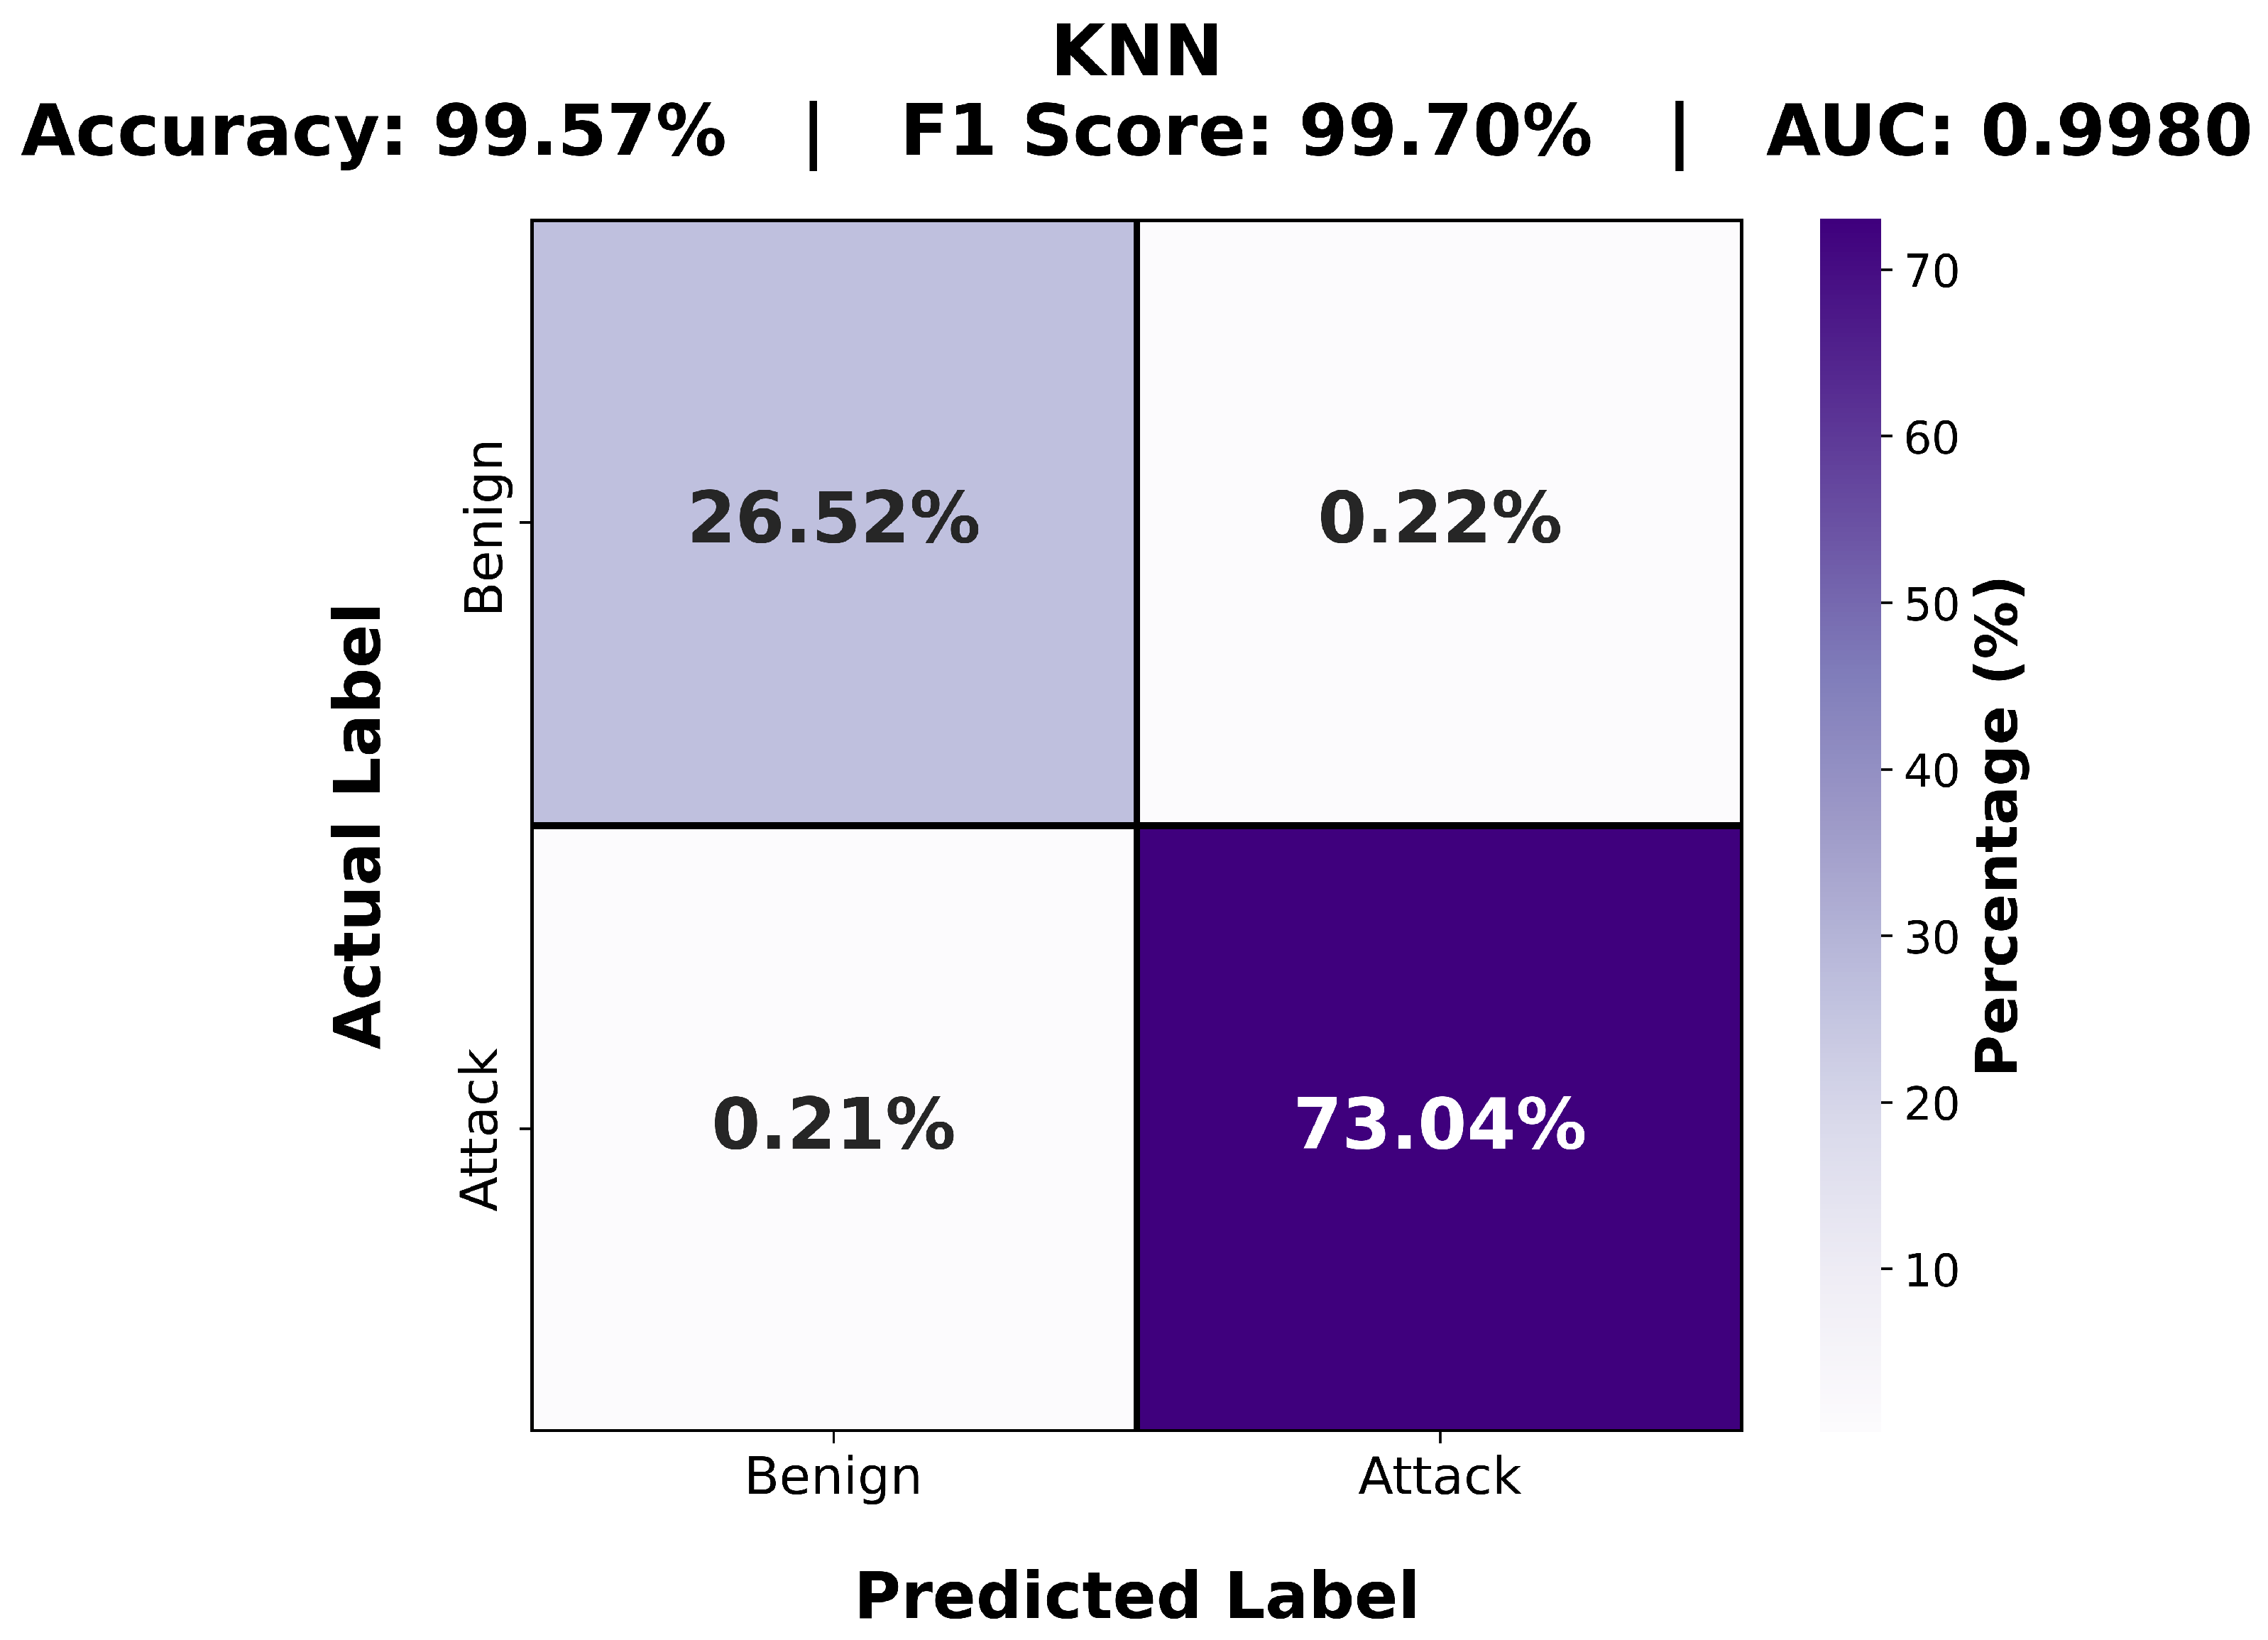
KNN. The KNN classifier (Figure 4) correctly identifies 26.52% of flows as benign and 73.04% as attacks. Its false positive rate of 0.22% and false negative rate of 0.21% are the highest among the classical models, reflecting the known sensitivity of uniform-distance KNN to low-importance features diluting the signal from dominant ones such as RST Flag Count. Because KNN has no training phase, all classification cost is incurred at inference time and scales linearly with the training set size, which limits its suitability for real-time deployment on resource-constrained V2X edge devices.
Figure 4.
KNN binary confusion matrix.
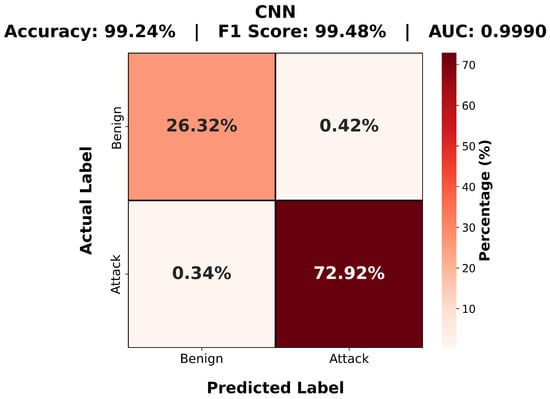
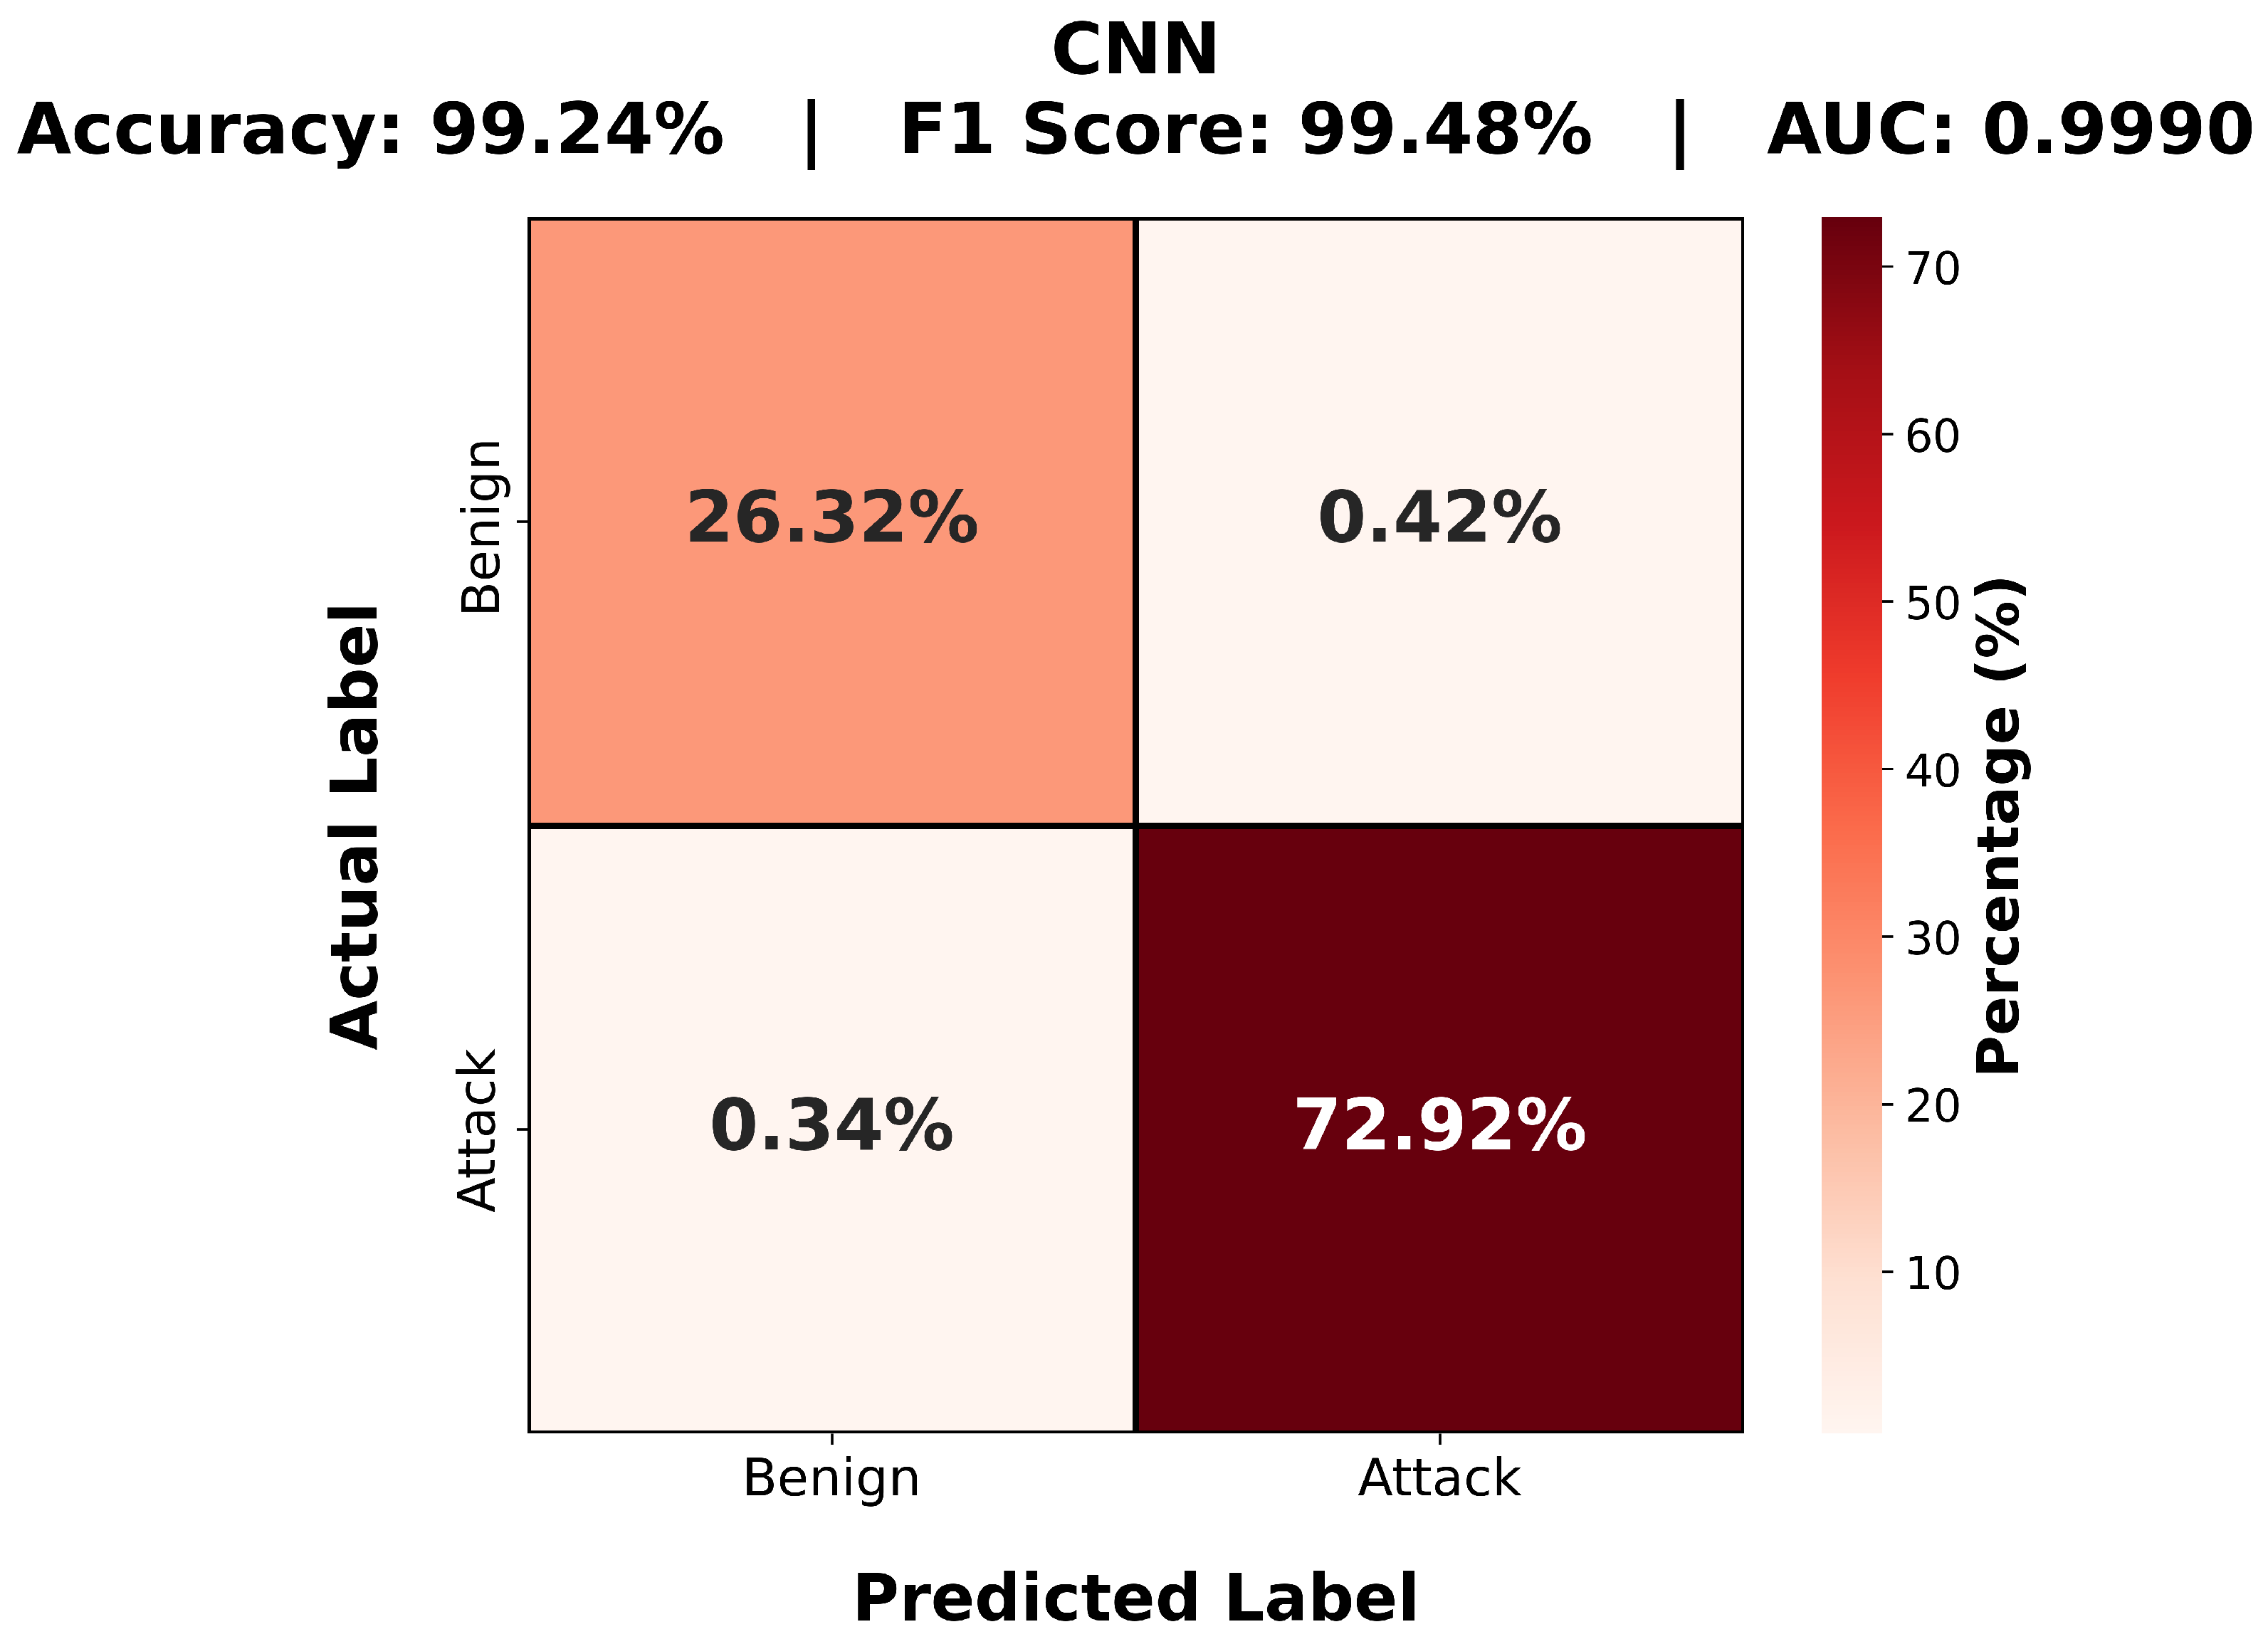
1D CNN. The CNN (Figure 5) correctly classifies 26.32% of flows as benign and 72.92% as attacks, with the highest false positive rate (0.42%) and false negative rate (0.34%) of all five models. Despite trailing on hard classification metrics, its AUC-ROC of 0.9990 indicates that its underlying probability ranking remains highly informative. The gap between AUC and threshold-based F1 performance is a calibration issue rather than a representational failure, and is analyzed further in Section 4.
Figure 5.
1D CNN binary confusion matrix.
3.2. ROC Analysis
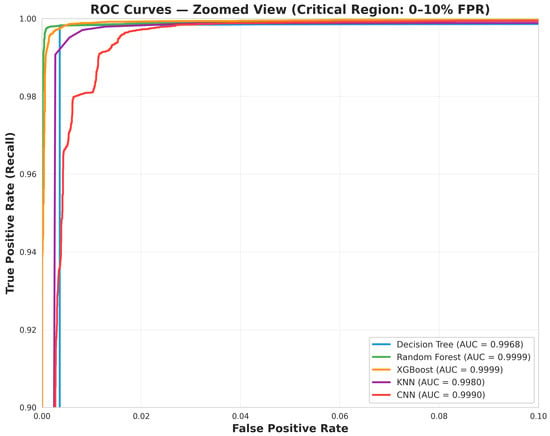
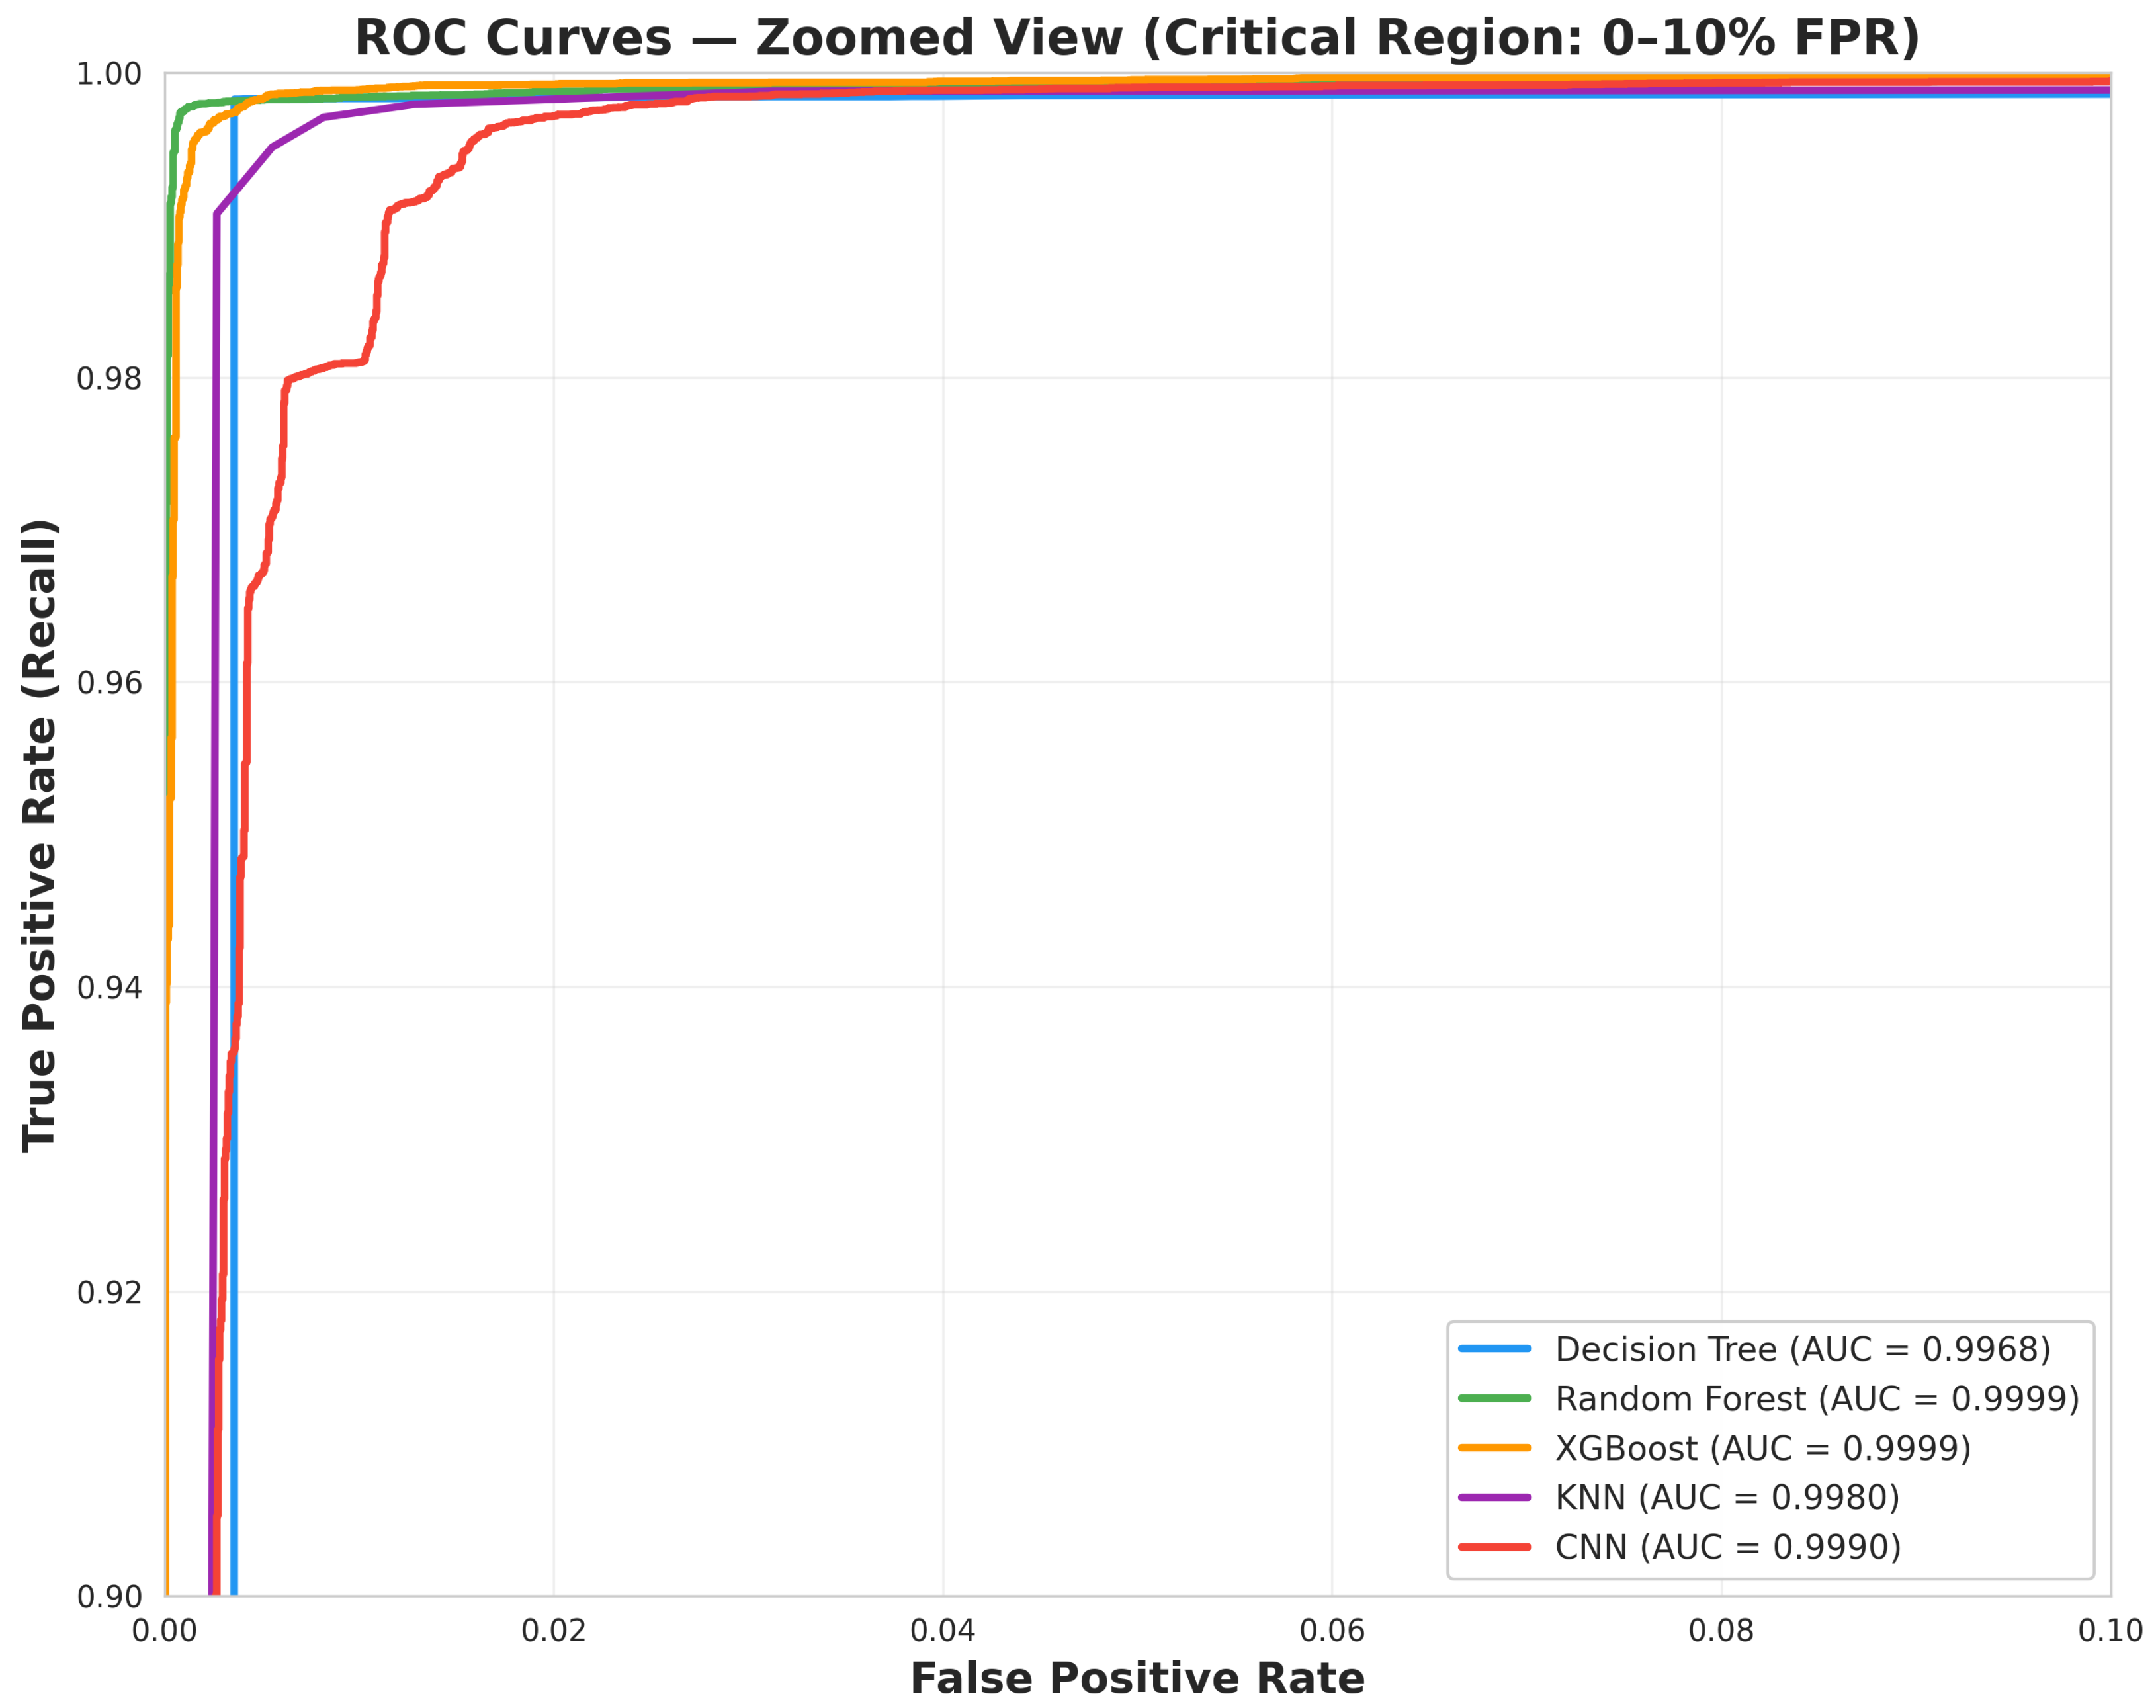
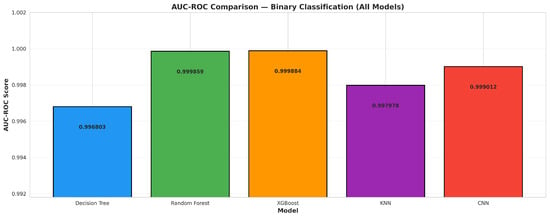
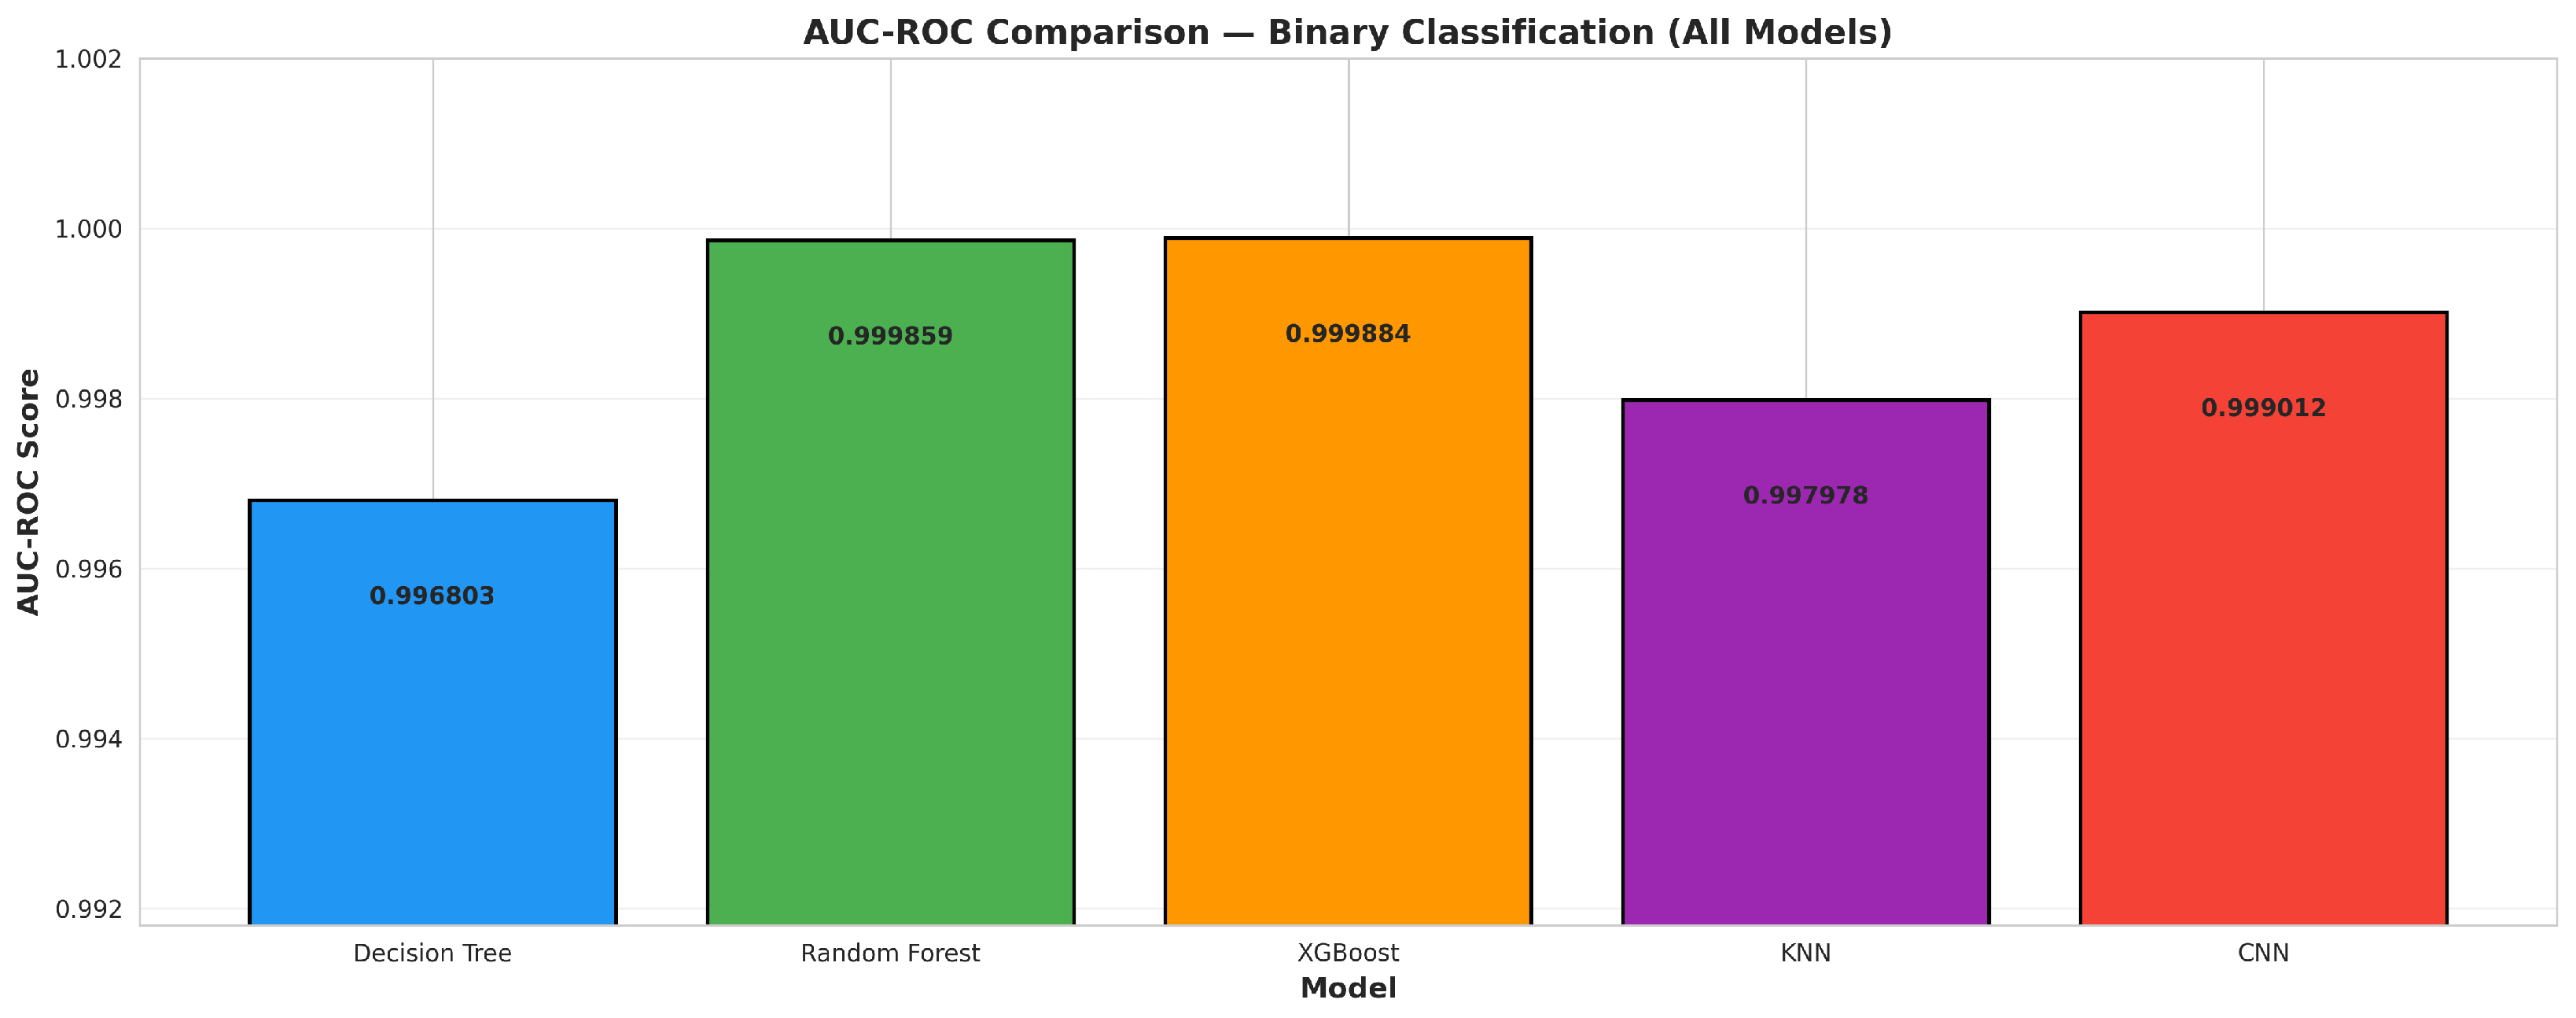
Figure 6 shows the ROC curves for all five models zoomed into the operationally relevant low false positive rate (FPR) region, which is the most meaningful range for deployment in safety-critical transportation systems where false alarms carry real operational cost. Random Forest and XGBoost reach essentially 100% true positive rate (TPR) at FPR , demonstrating that both models can detect nearly all attacks before accumulating meaningful false positives. The Decision Tree requires approximately FPR to reach 99% TPR, and the KNN requires FPR , reflecting its sensitivity to low-importance features in the distance computation. The CNN, despite its lower hard-classification F1, maintains a competitive trajectory in this region consistent with its AUC of 0.9990. Figure 7 summarizes the full AUC-ROC ranking, with XGBoost () narrowly ahead of Random Forest ().
Figure 6.
ROC curves zoomed into the low-FPR operating region for all five models.
Figure 7.
AUC-ROC ranking across all five models (binary task).
A practical implication is that XGBoost’s superior AUC combined with the Decision Tree’s slightly better F1 at the default 0.5 threshold reflects a well-known distinction: AUC measures discrimination across all thresholds, while F1 measures performance at a single threshold. XGBoost’s better probability calibration makes it the stronger choice for deployments that require adaptive threshold tuning based on operational safety requirements, while the Decision Tree remains preferable when a fixed, interpretable decision boundary is needed.
3.3. Multi-Class Classification
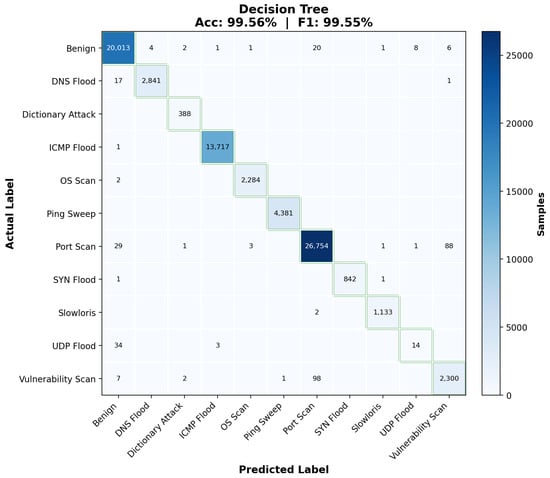
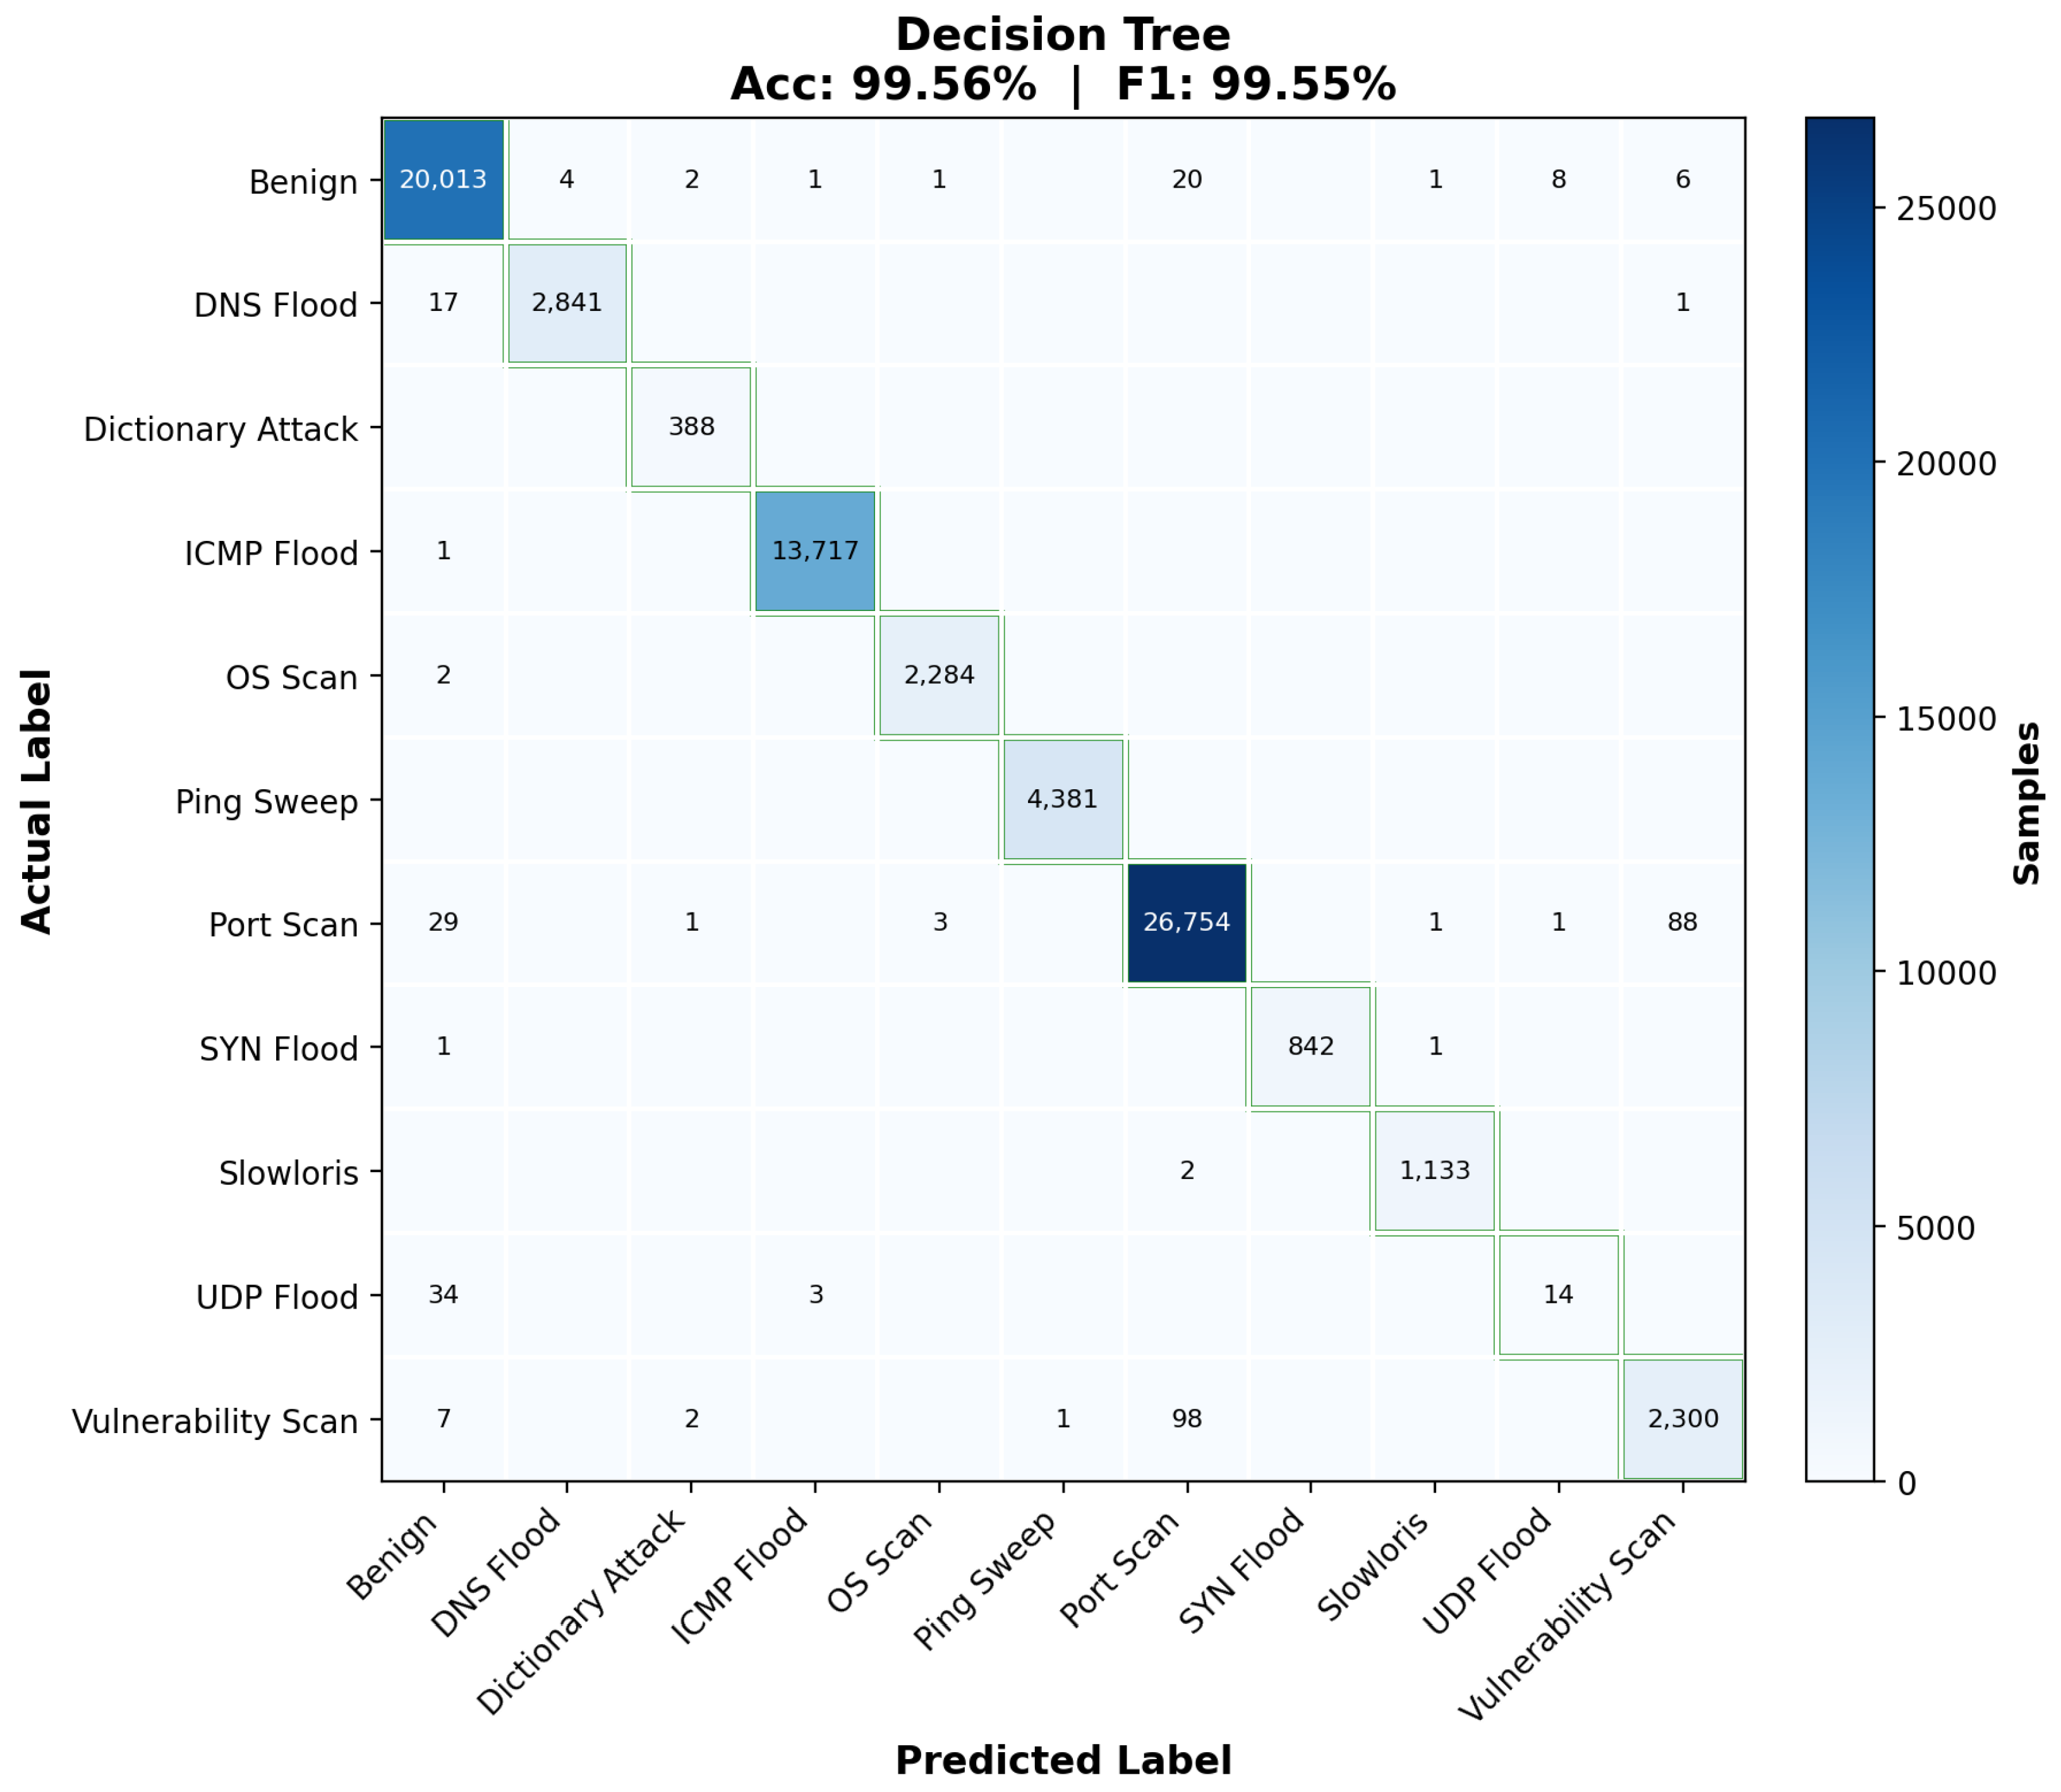
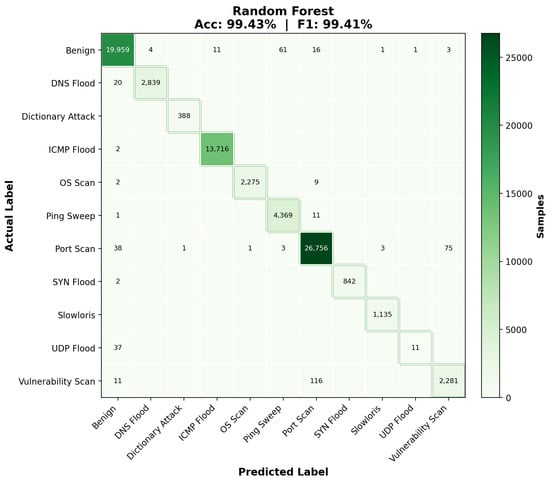
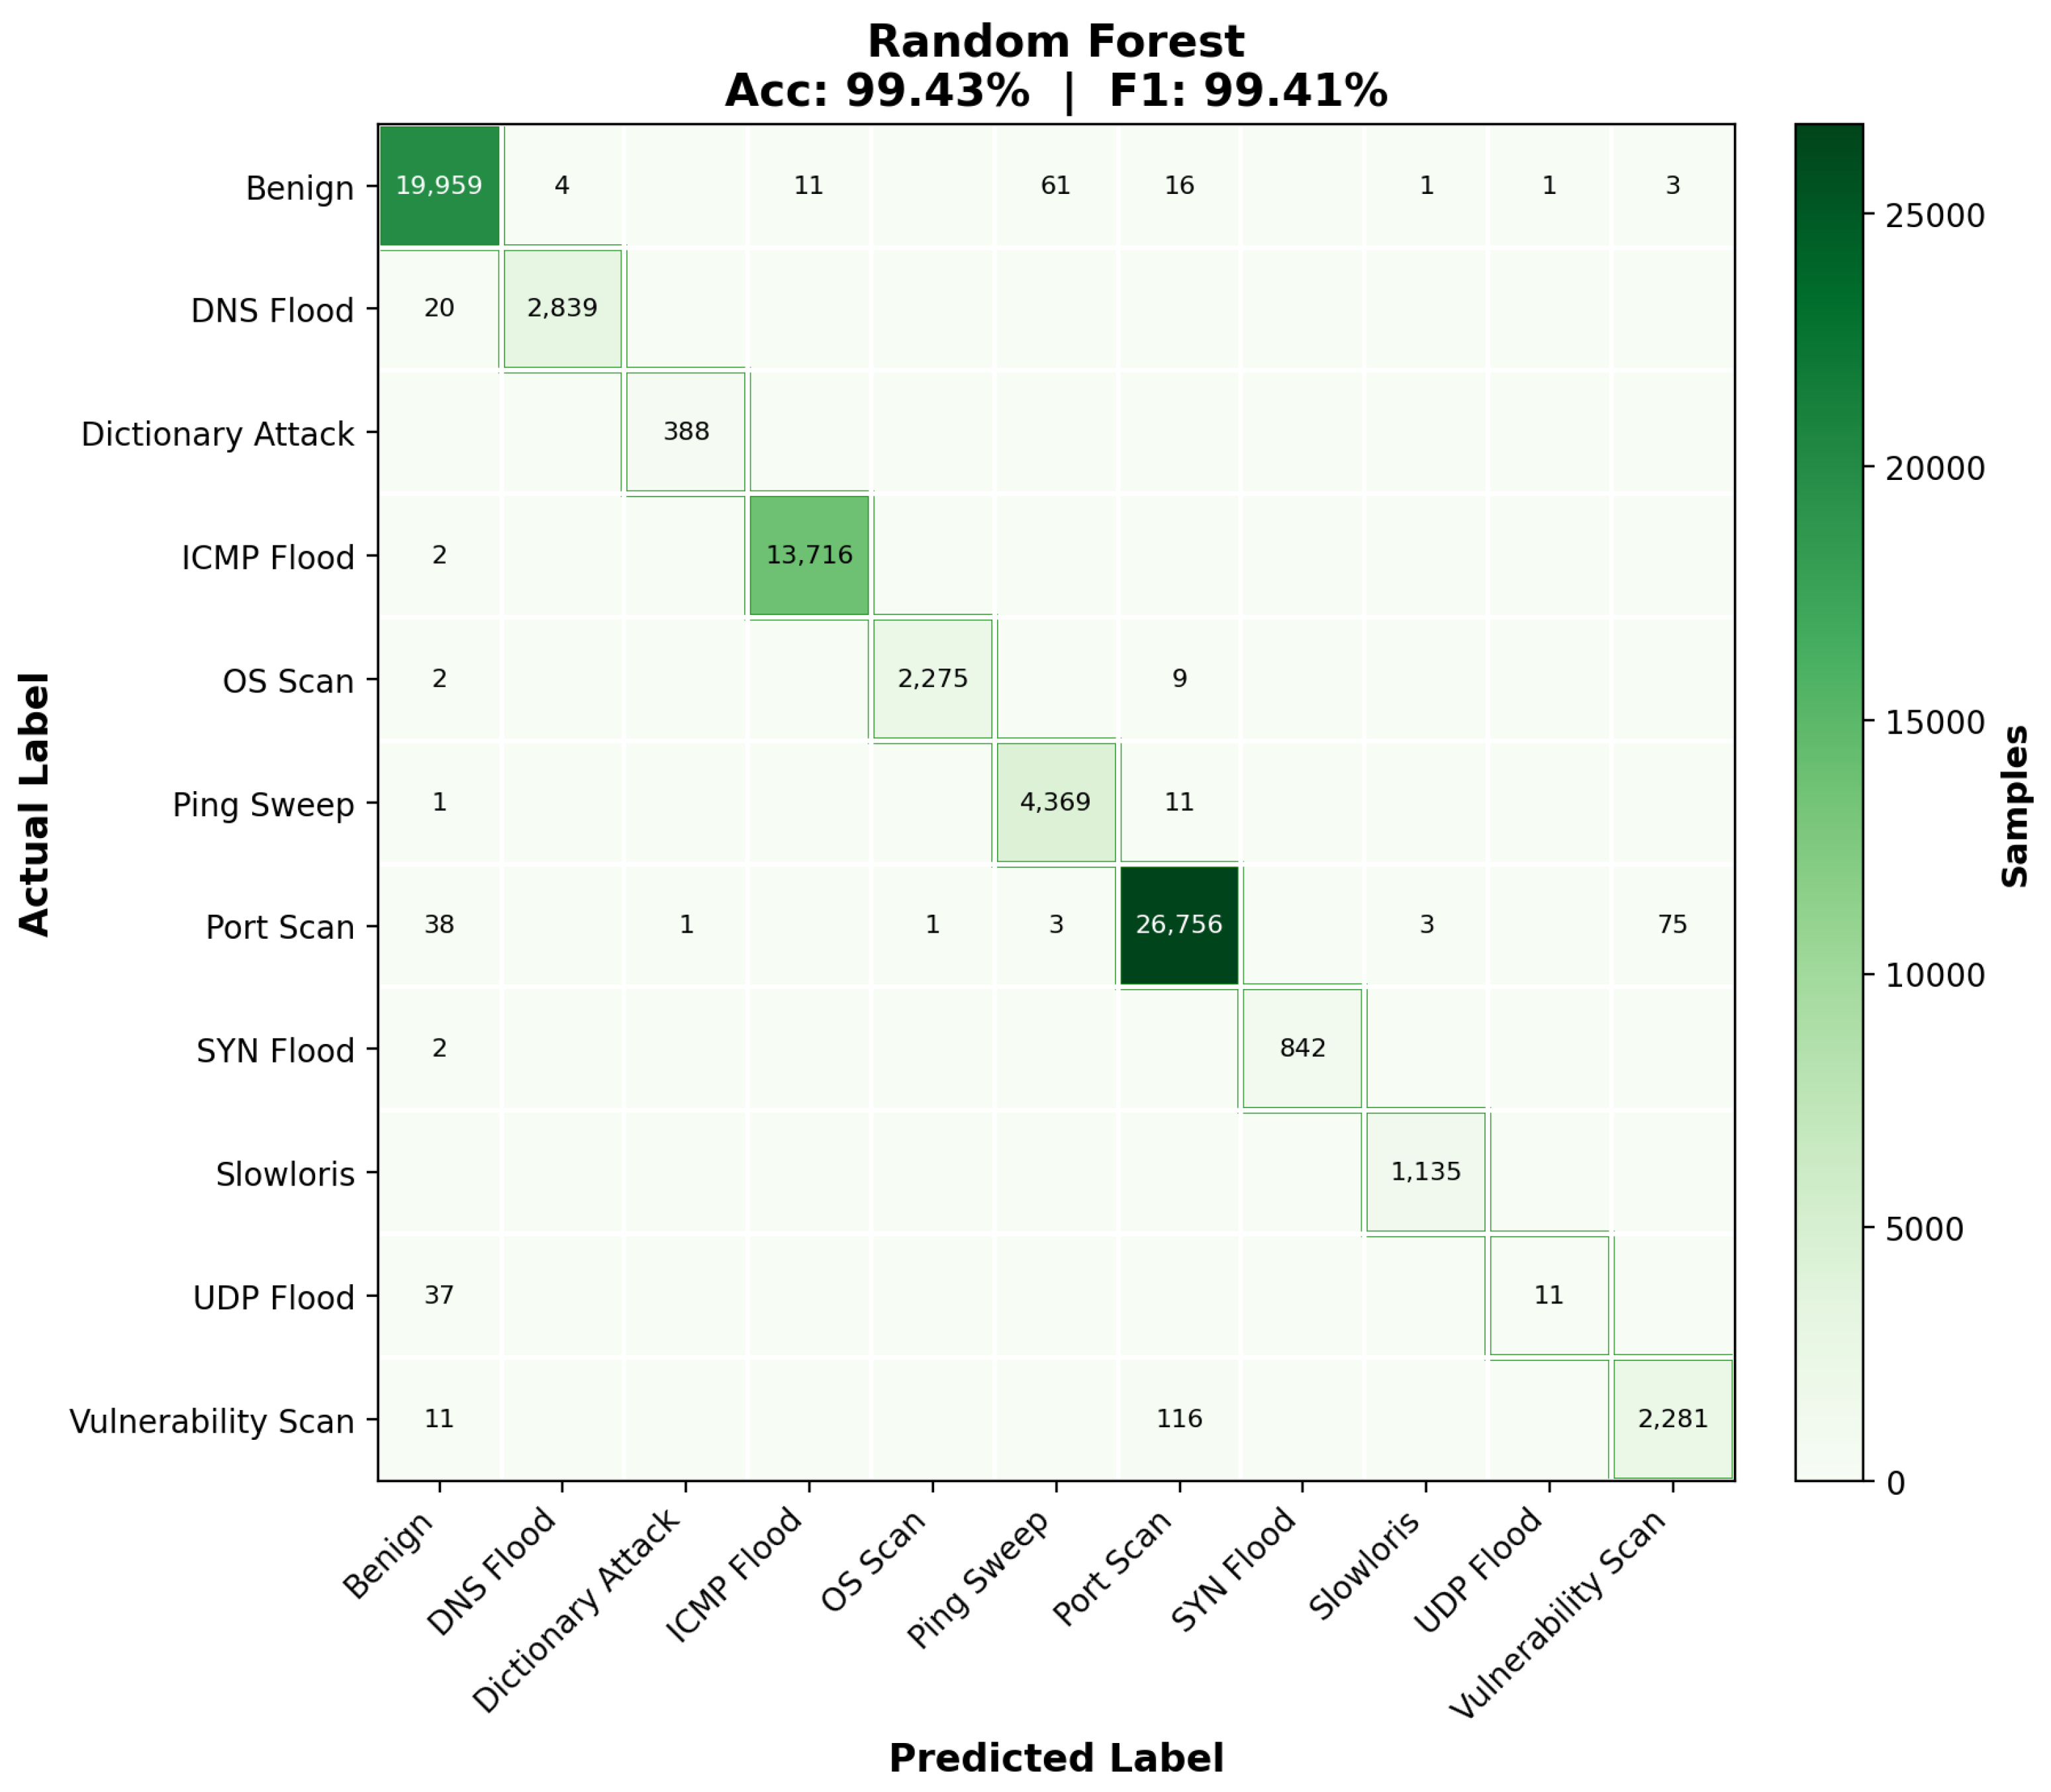
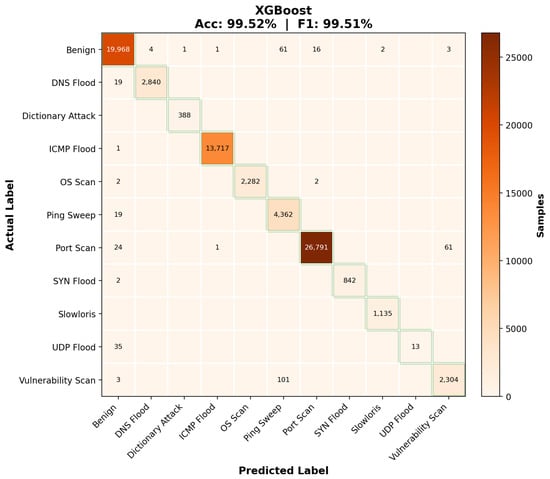
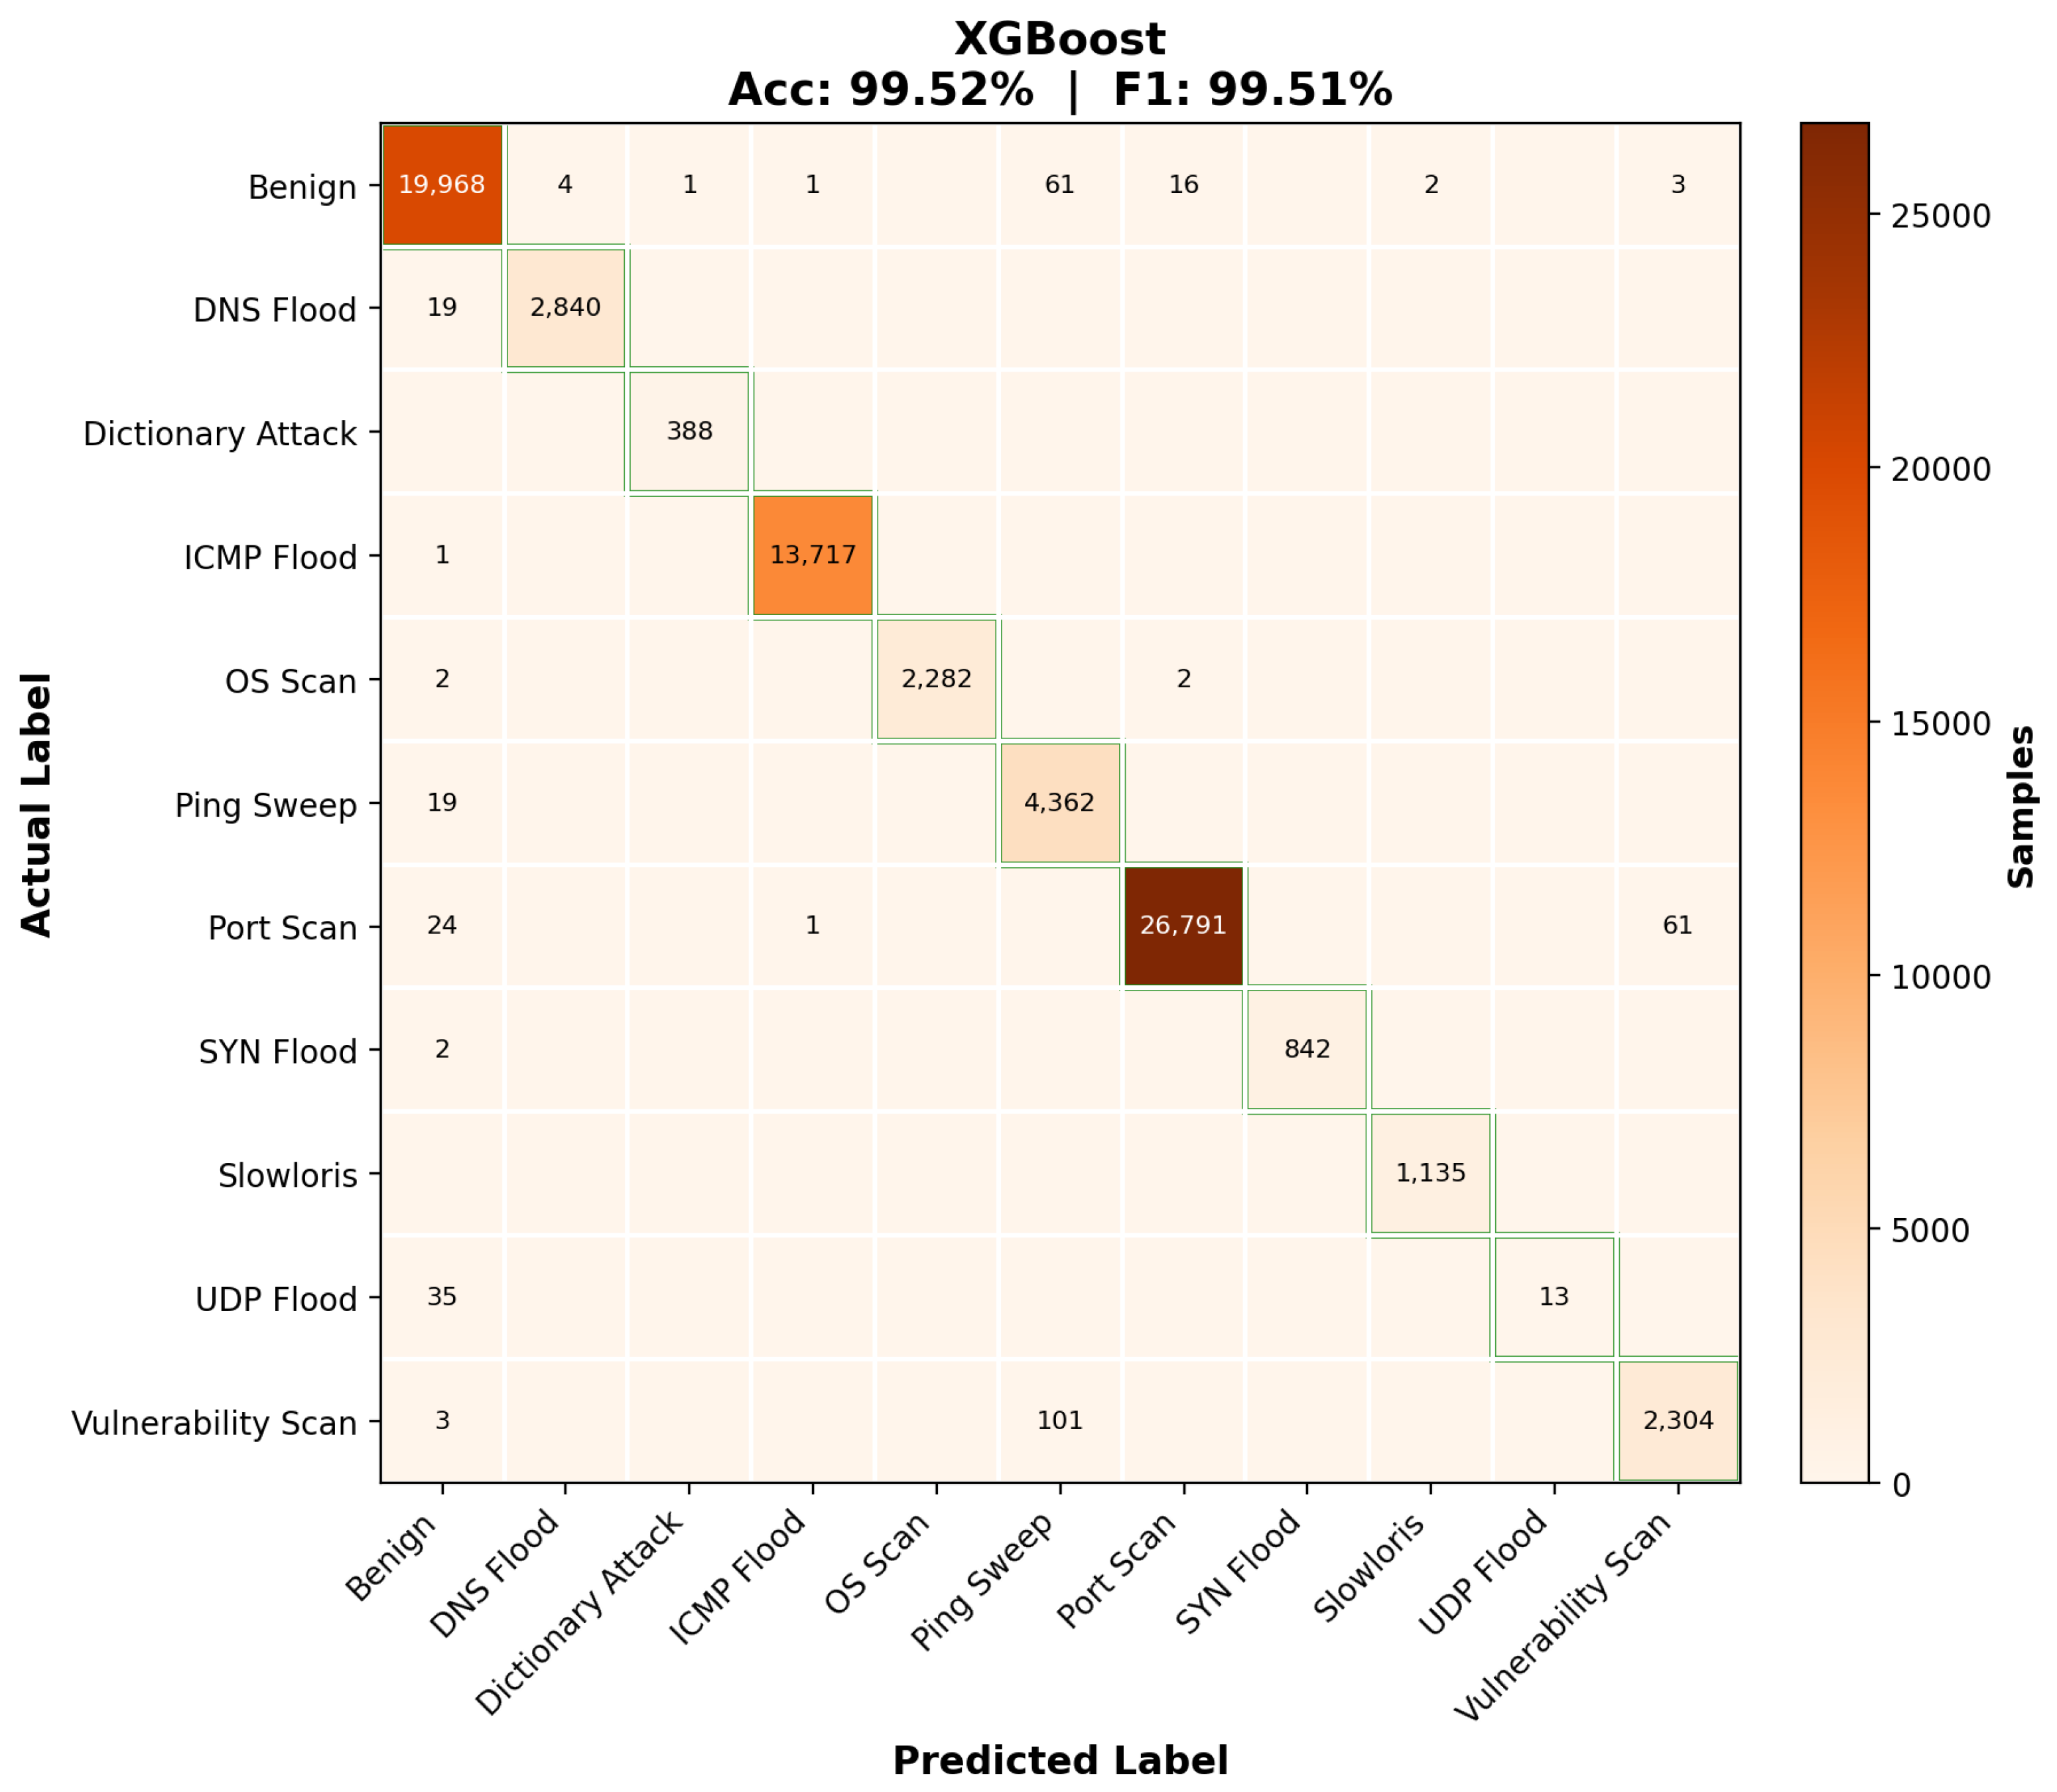
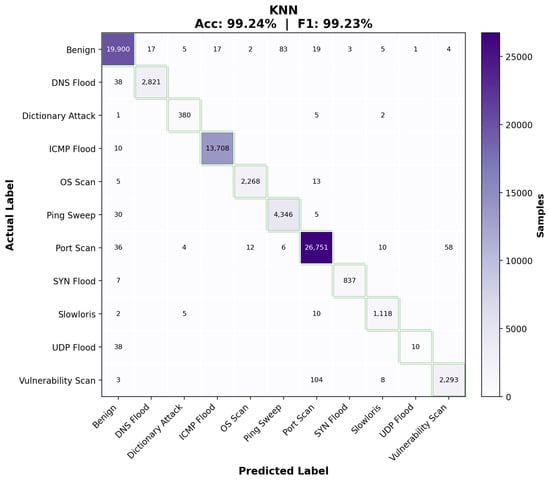
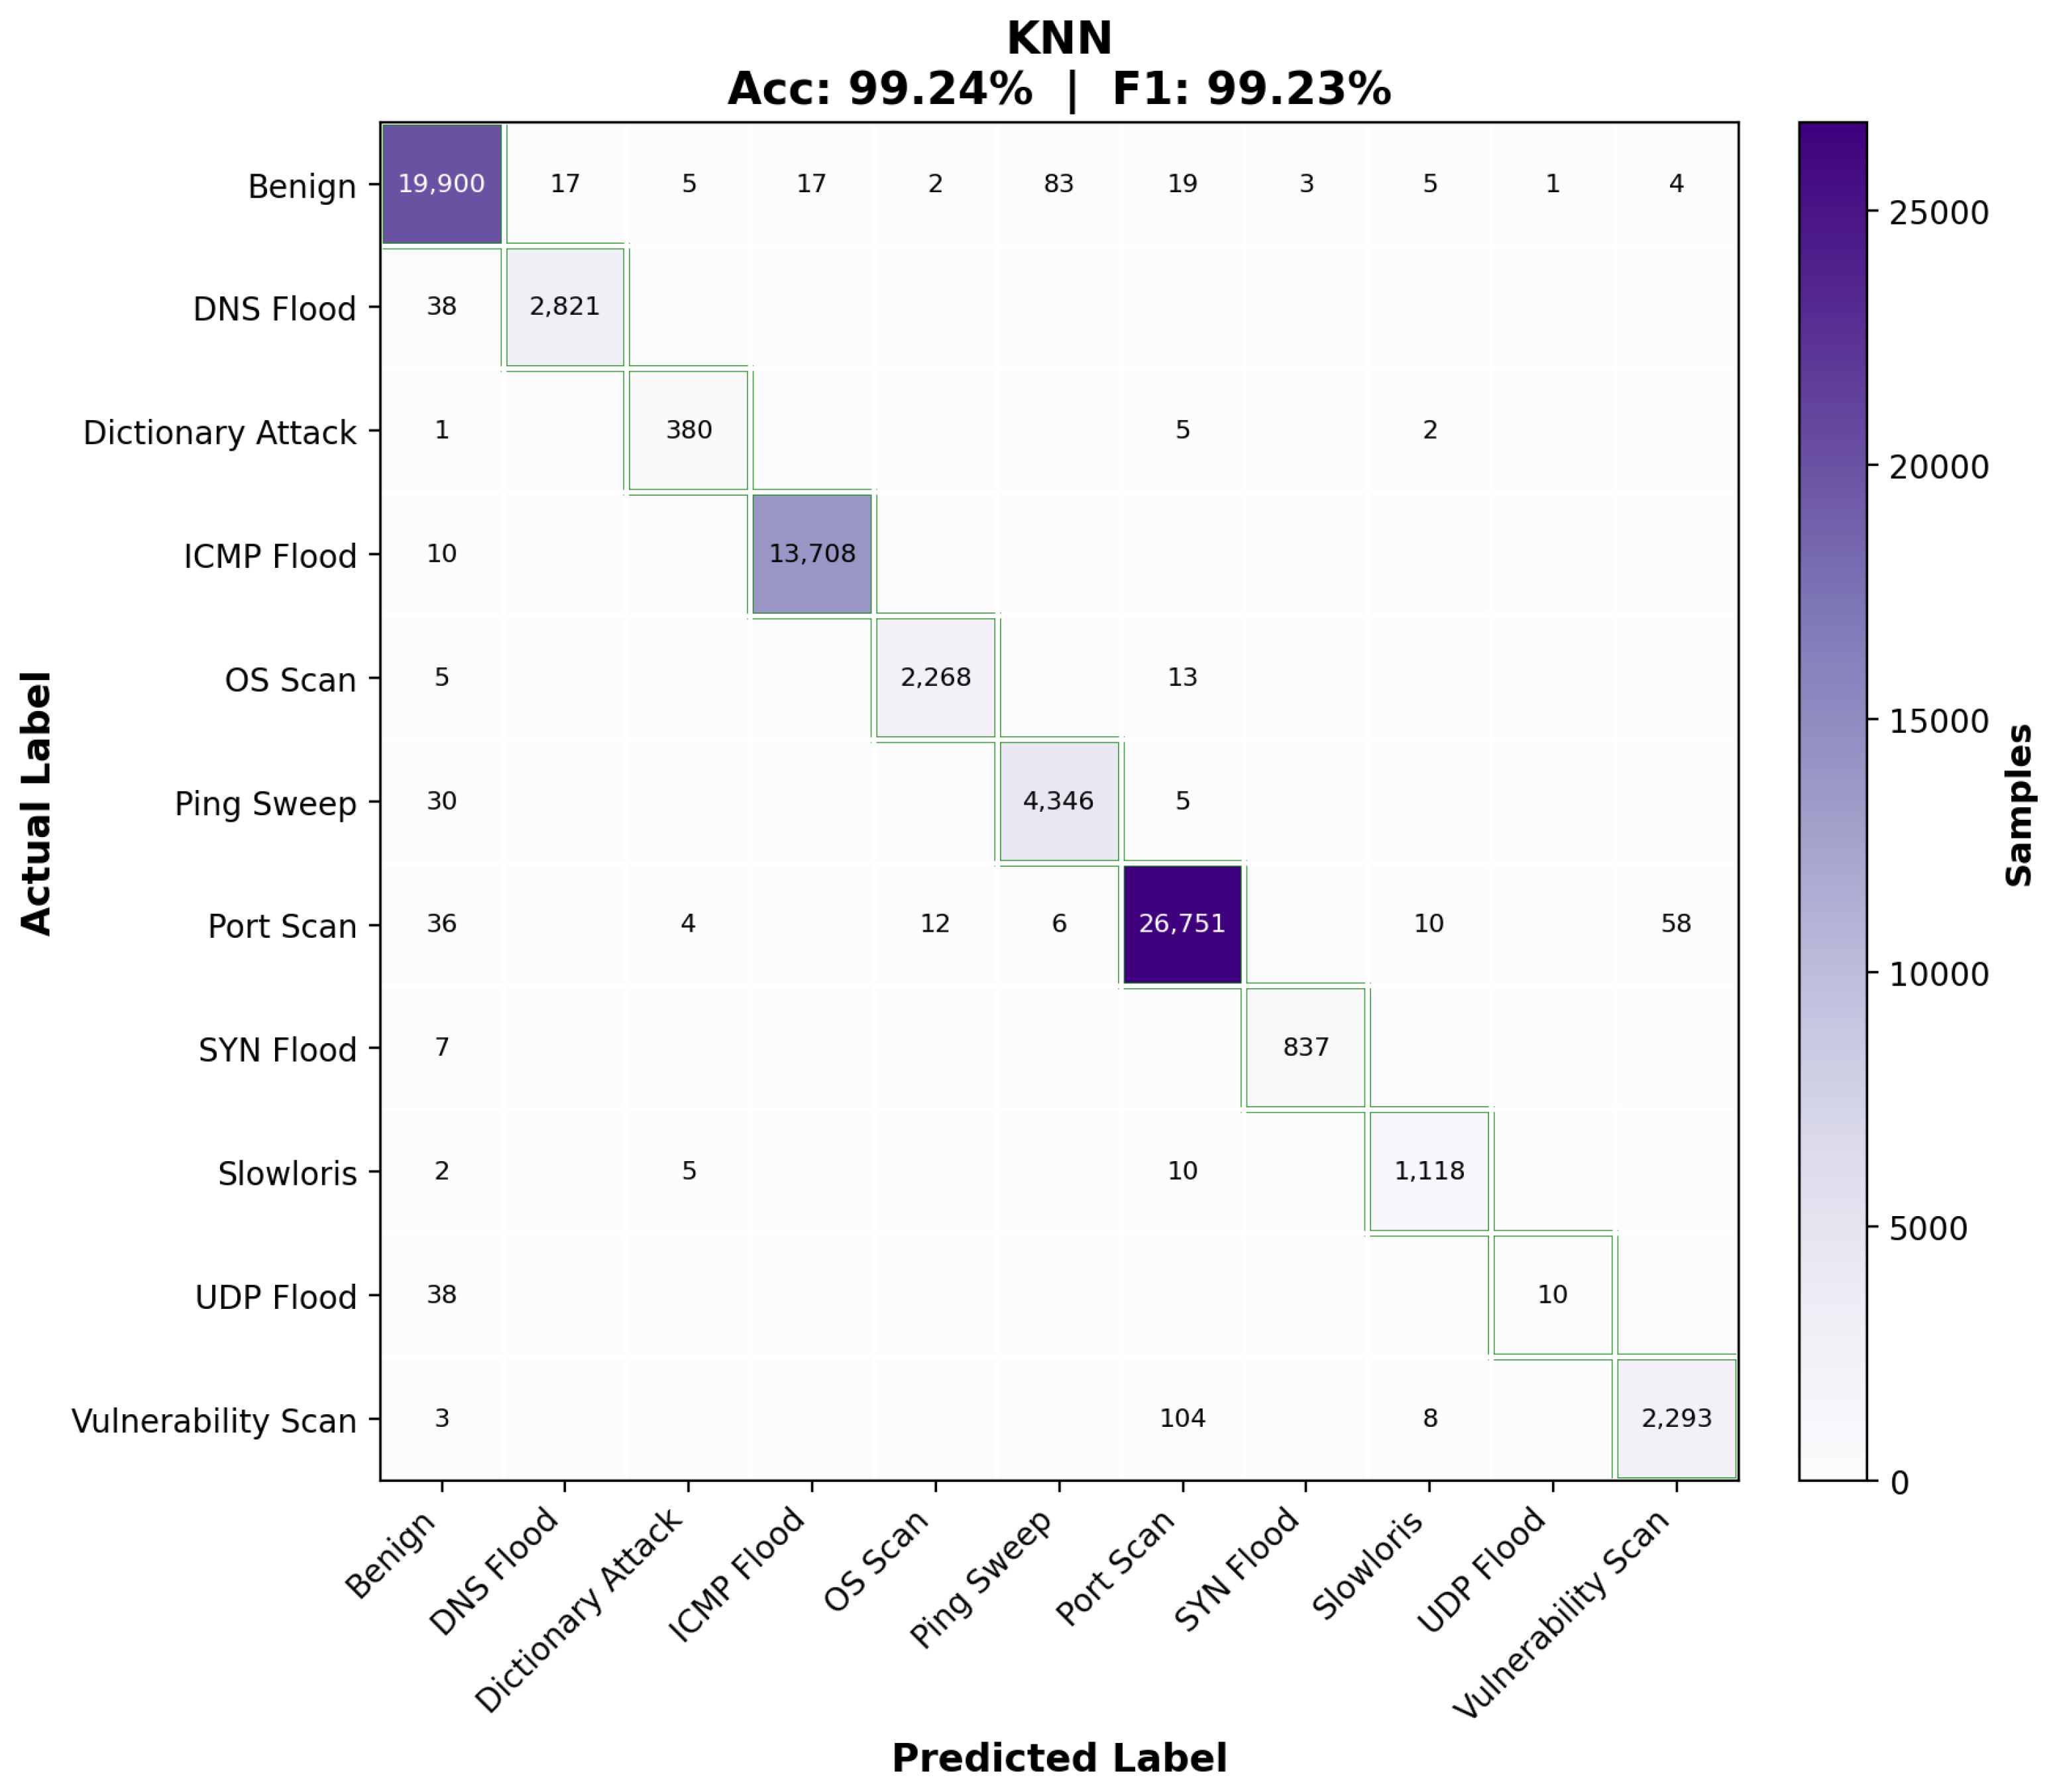
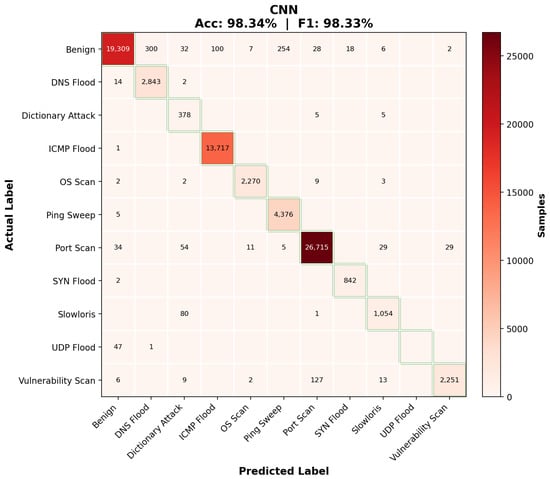
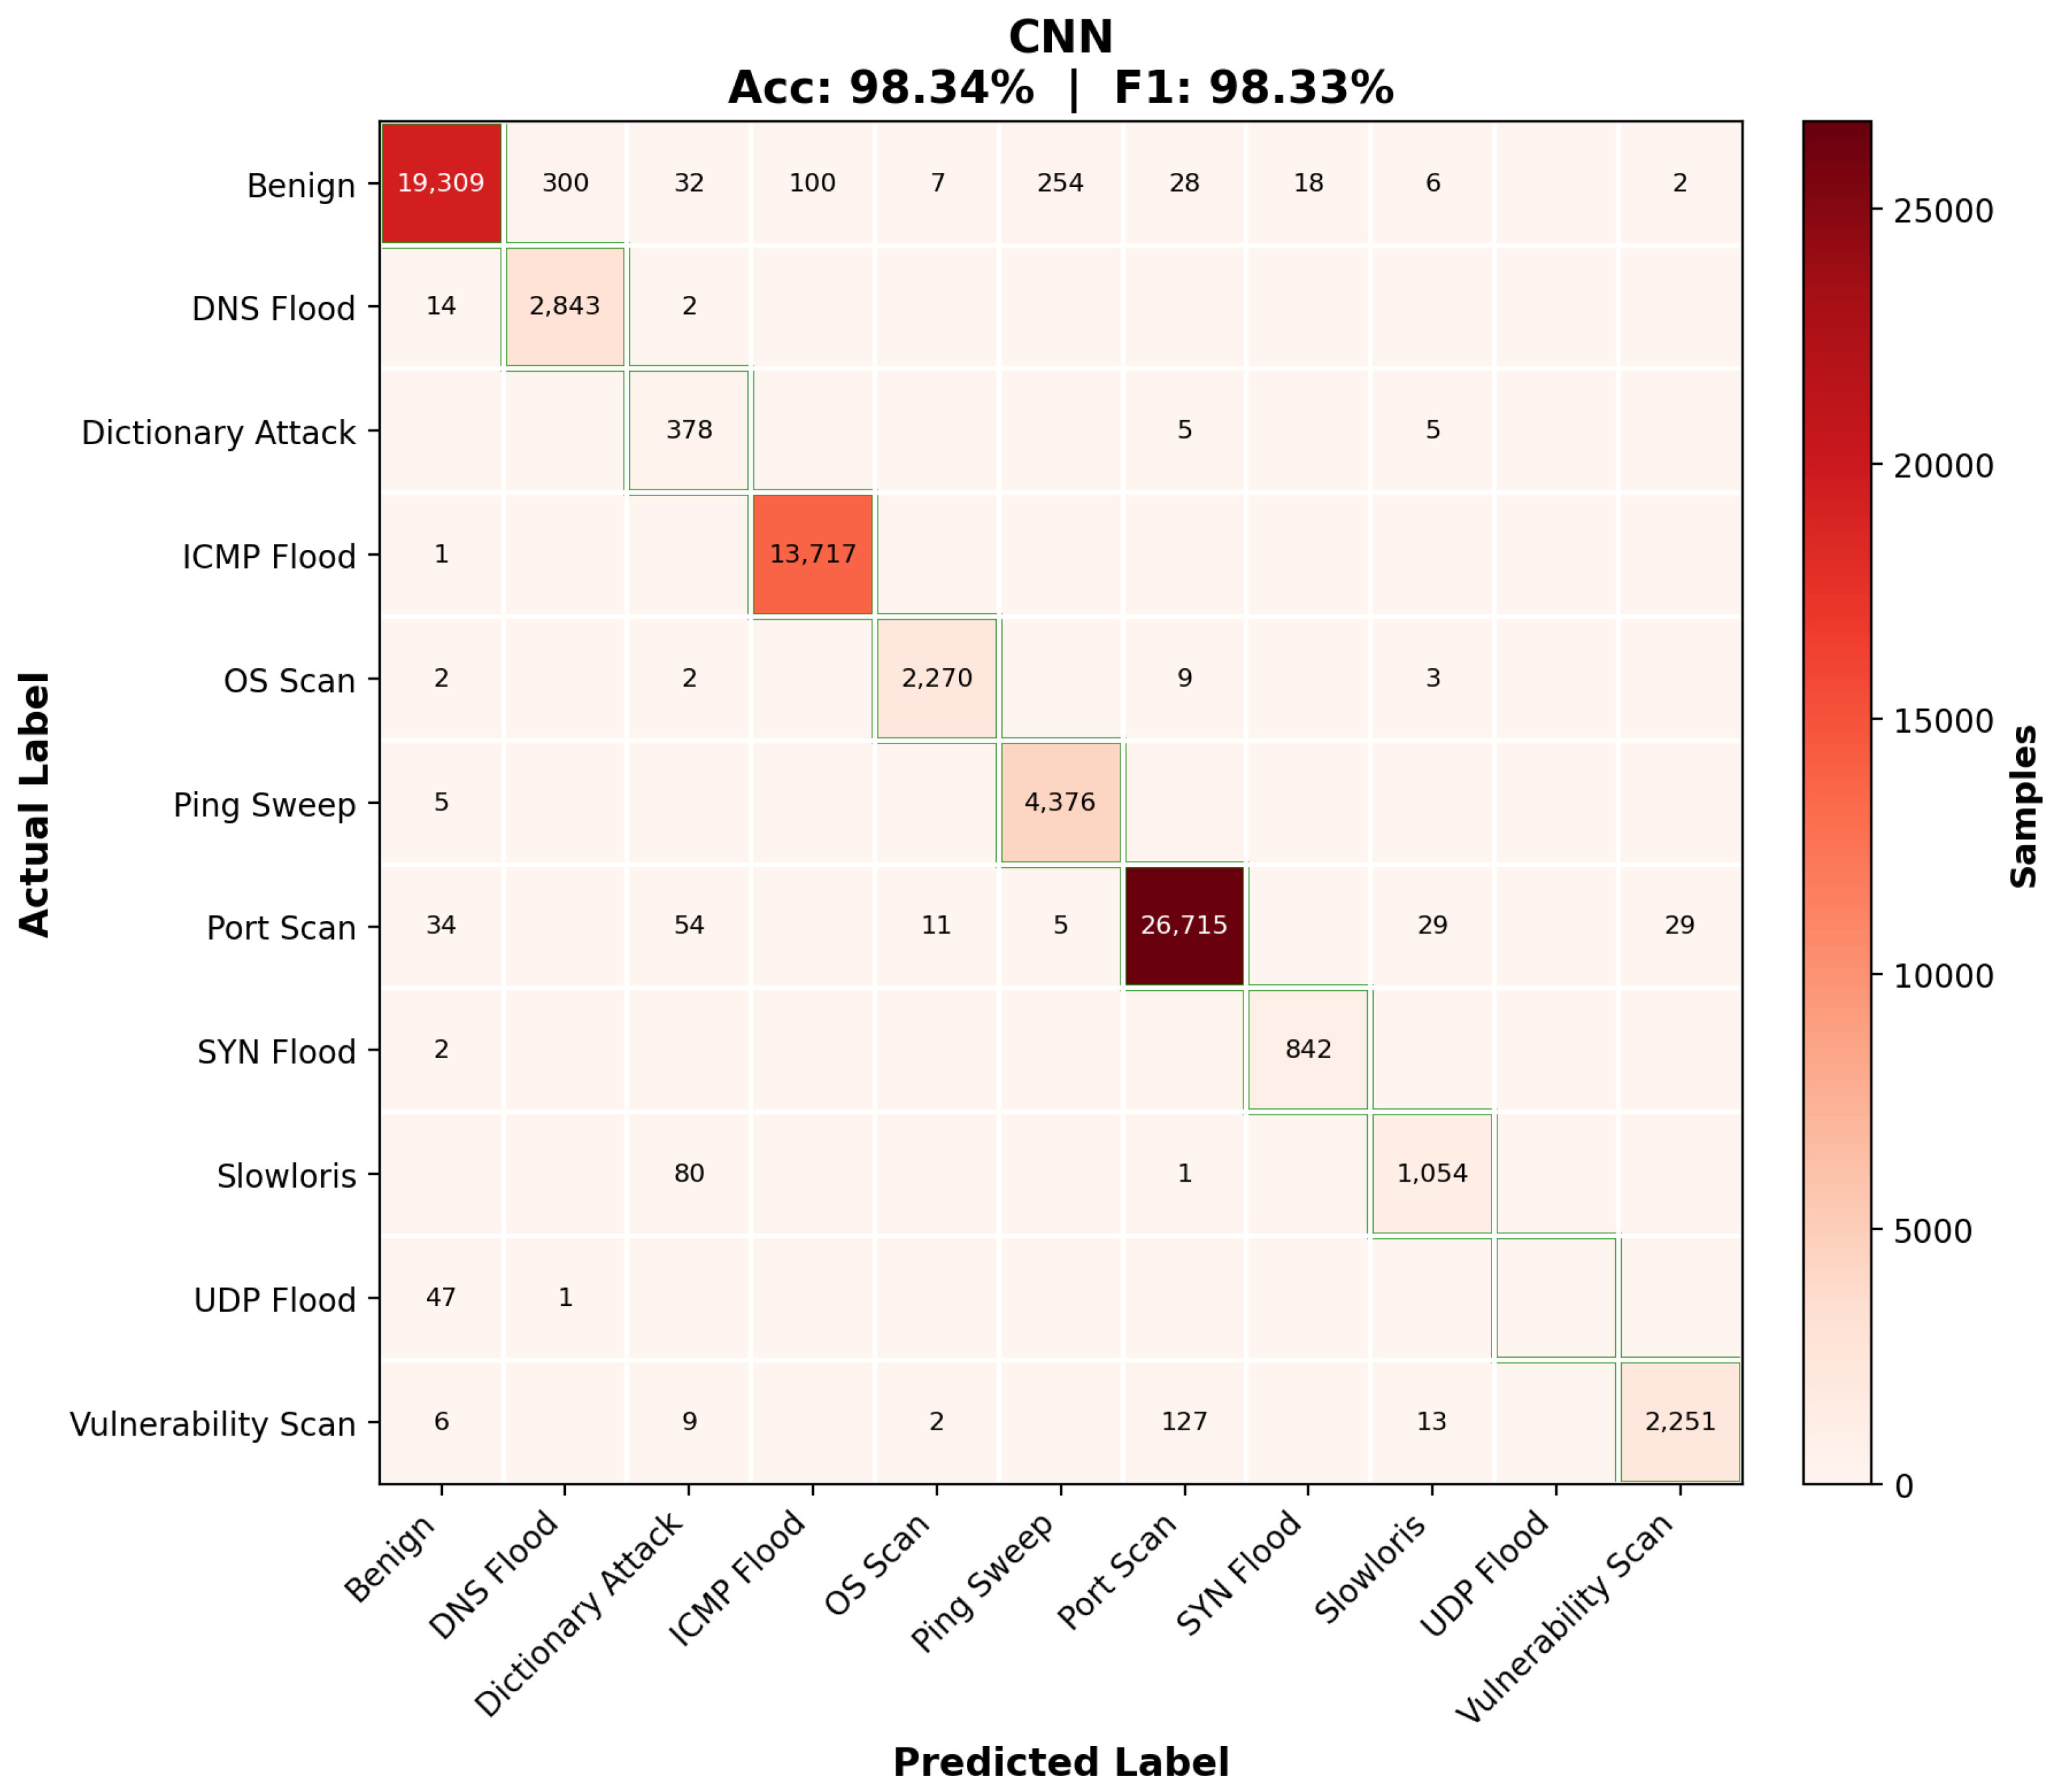
Table 3 reports performance on the eleven-class attack-identification task, and Figure 8, Figure 9, Figure 10, Figure 11 and Figure 12 show the corresponding confusion matrices.
Table 3.
Multi-class classification results (11 attack classes).
Figure 8.
Confusion matrix of the Decision Tree for multi-class classification.
Figure 9.
Confusion matrix of Random Forest for multi-class classification.
Figure 10.
Confusion matrix of XGBoost for multi-class classification.
Figure 11.
Confusion matrix of the KNN for multi-class classification.
Figure 12.
Confusion matrix of the 1D CNN for multi-class classification.
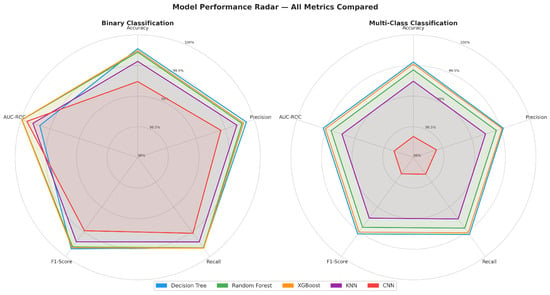
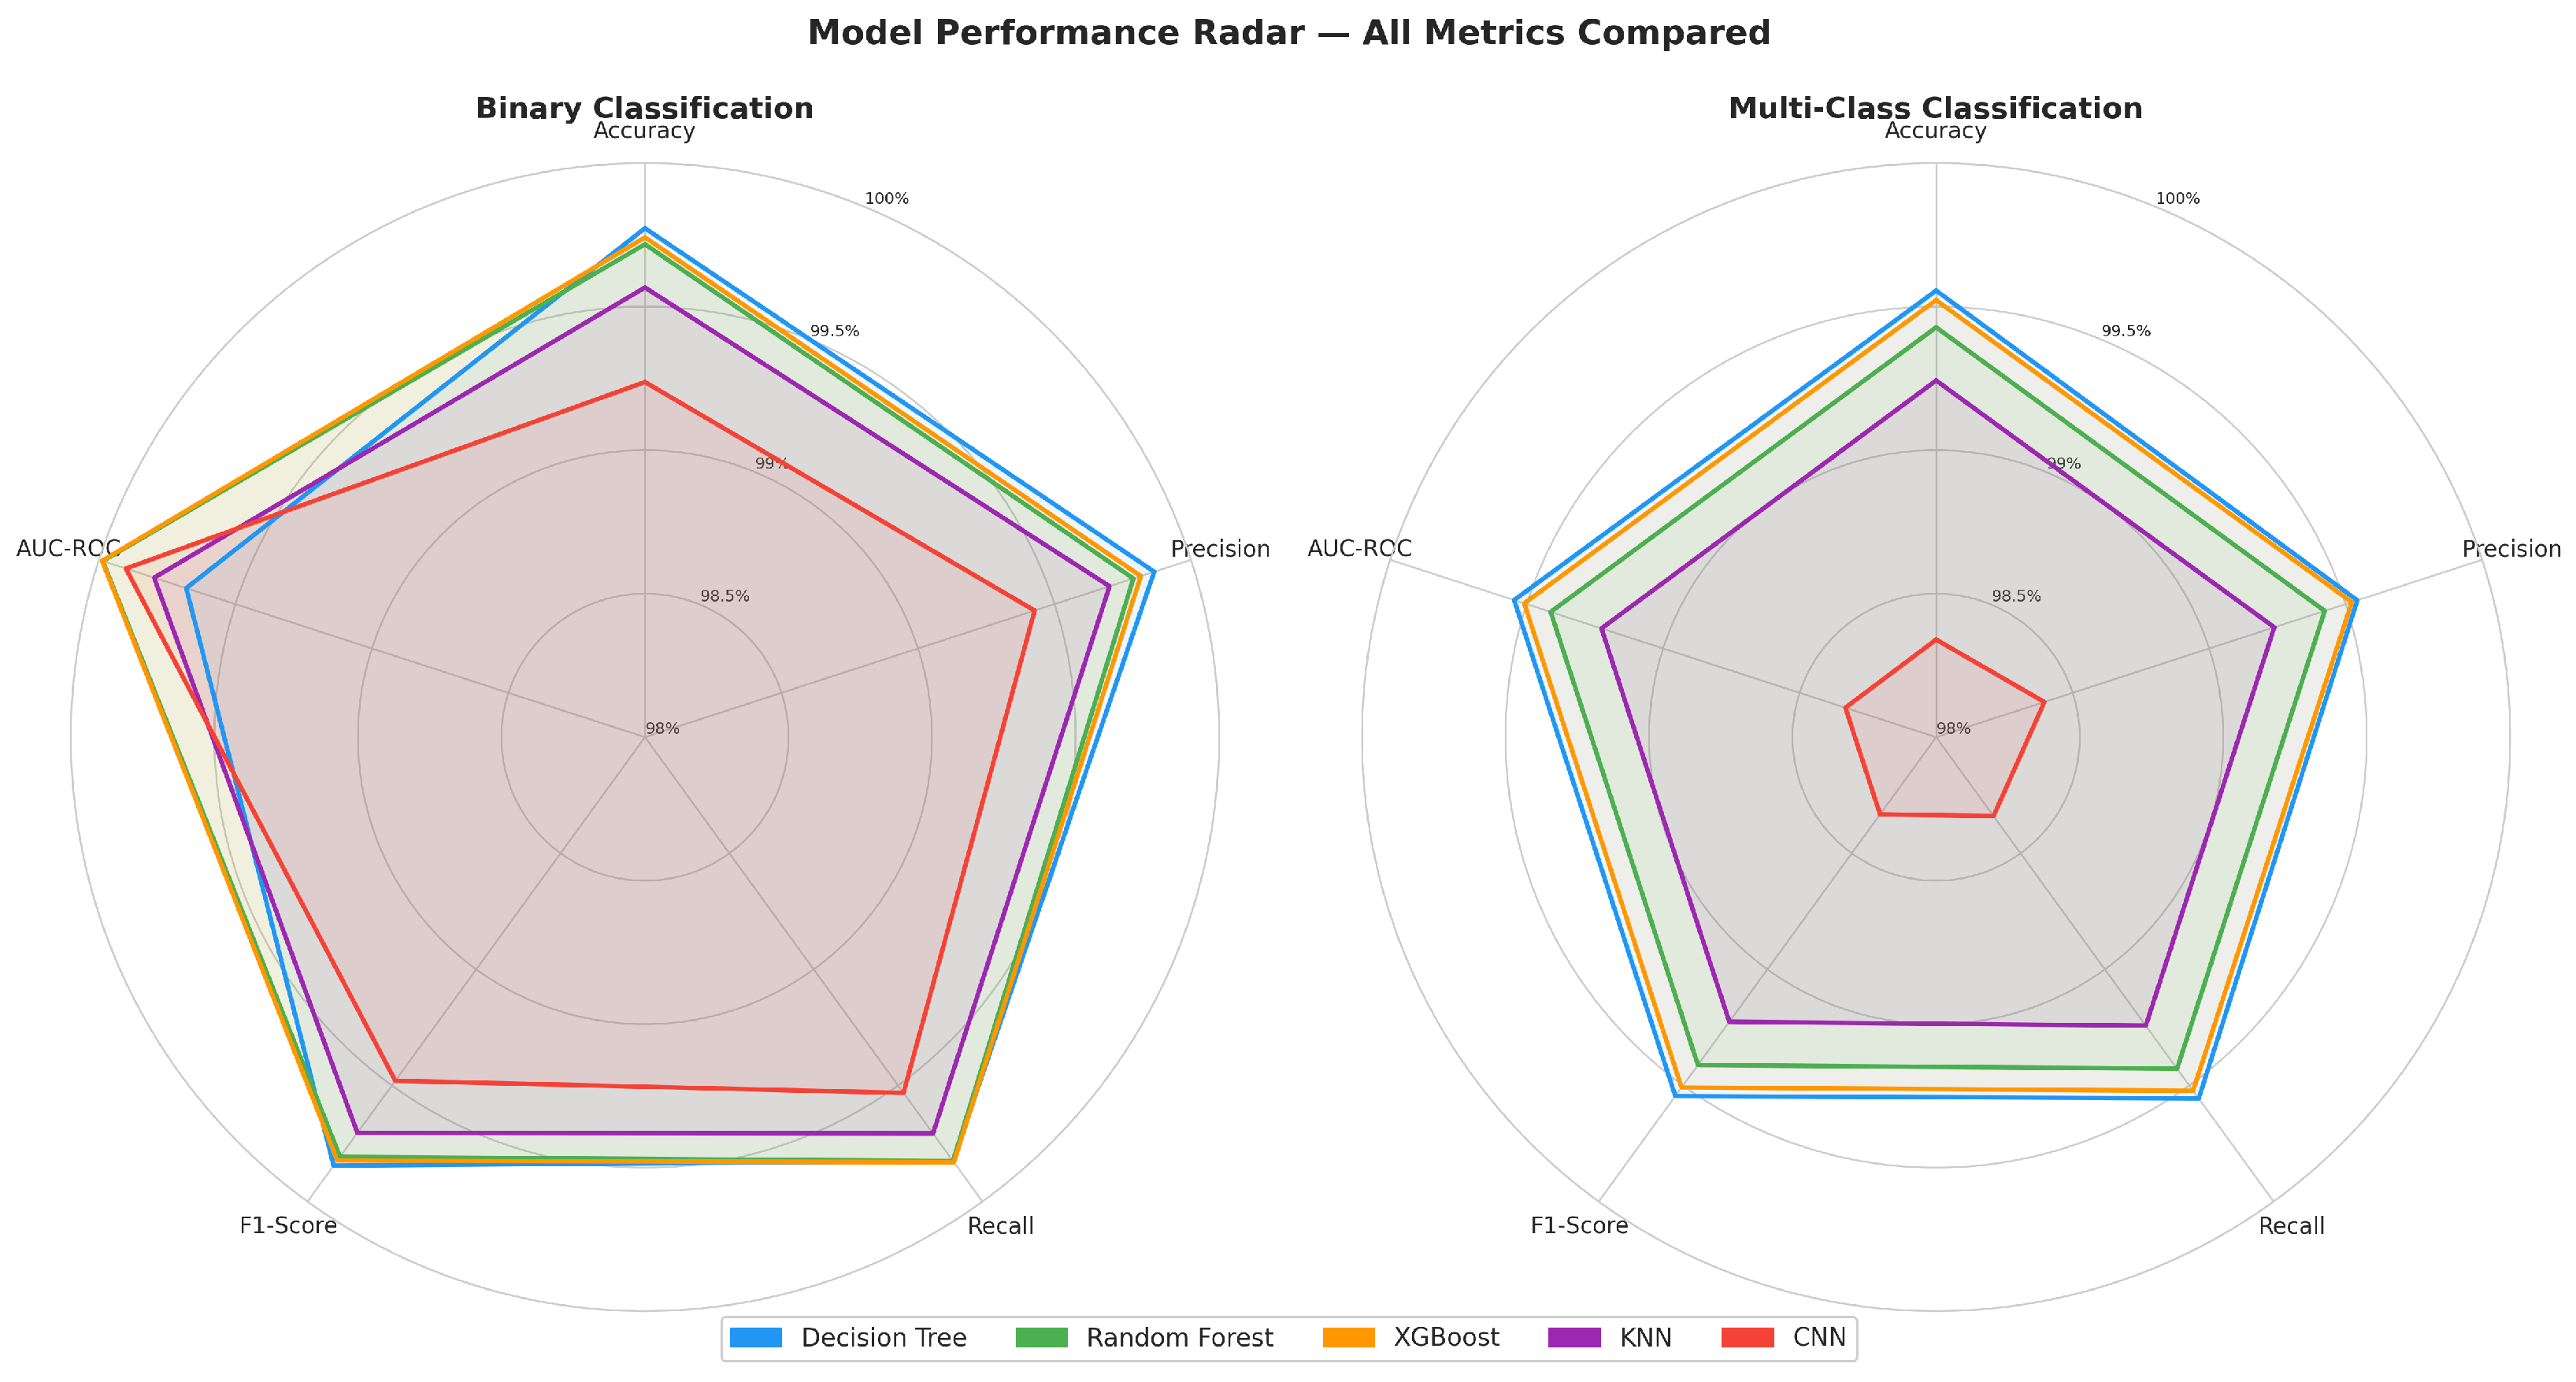
A notable result is that the single Decision Tree outperforms both ensemble methods and the CNN on the multi-class task. Section 4 analyzes this outcome. A radar comparison across all metrics for both tasks is provided in Figure 13.
Figure 13.
Radar chart comparing all five models across accuracy, precision, recall, F1, and AUC-ROC for both tasks.
3.4. Per-Class Performance
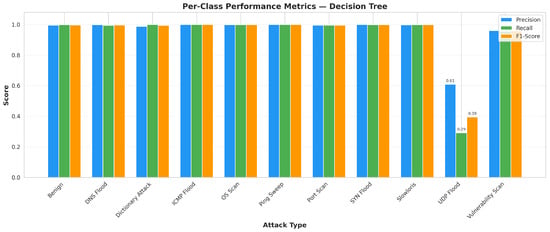
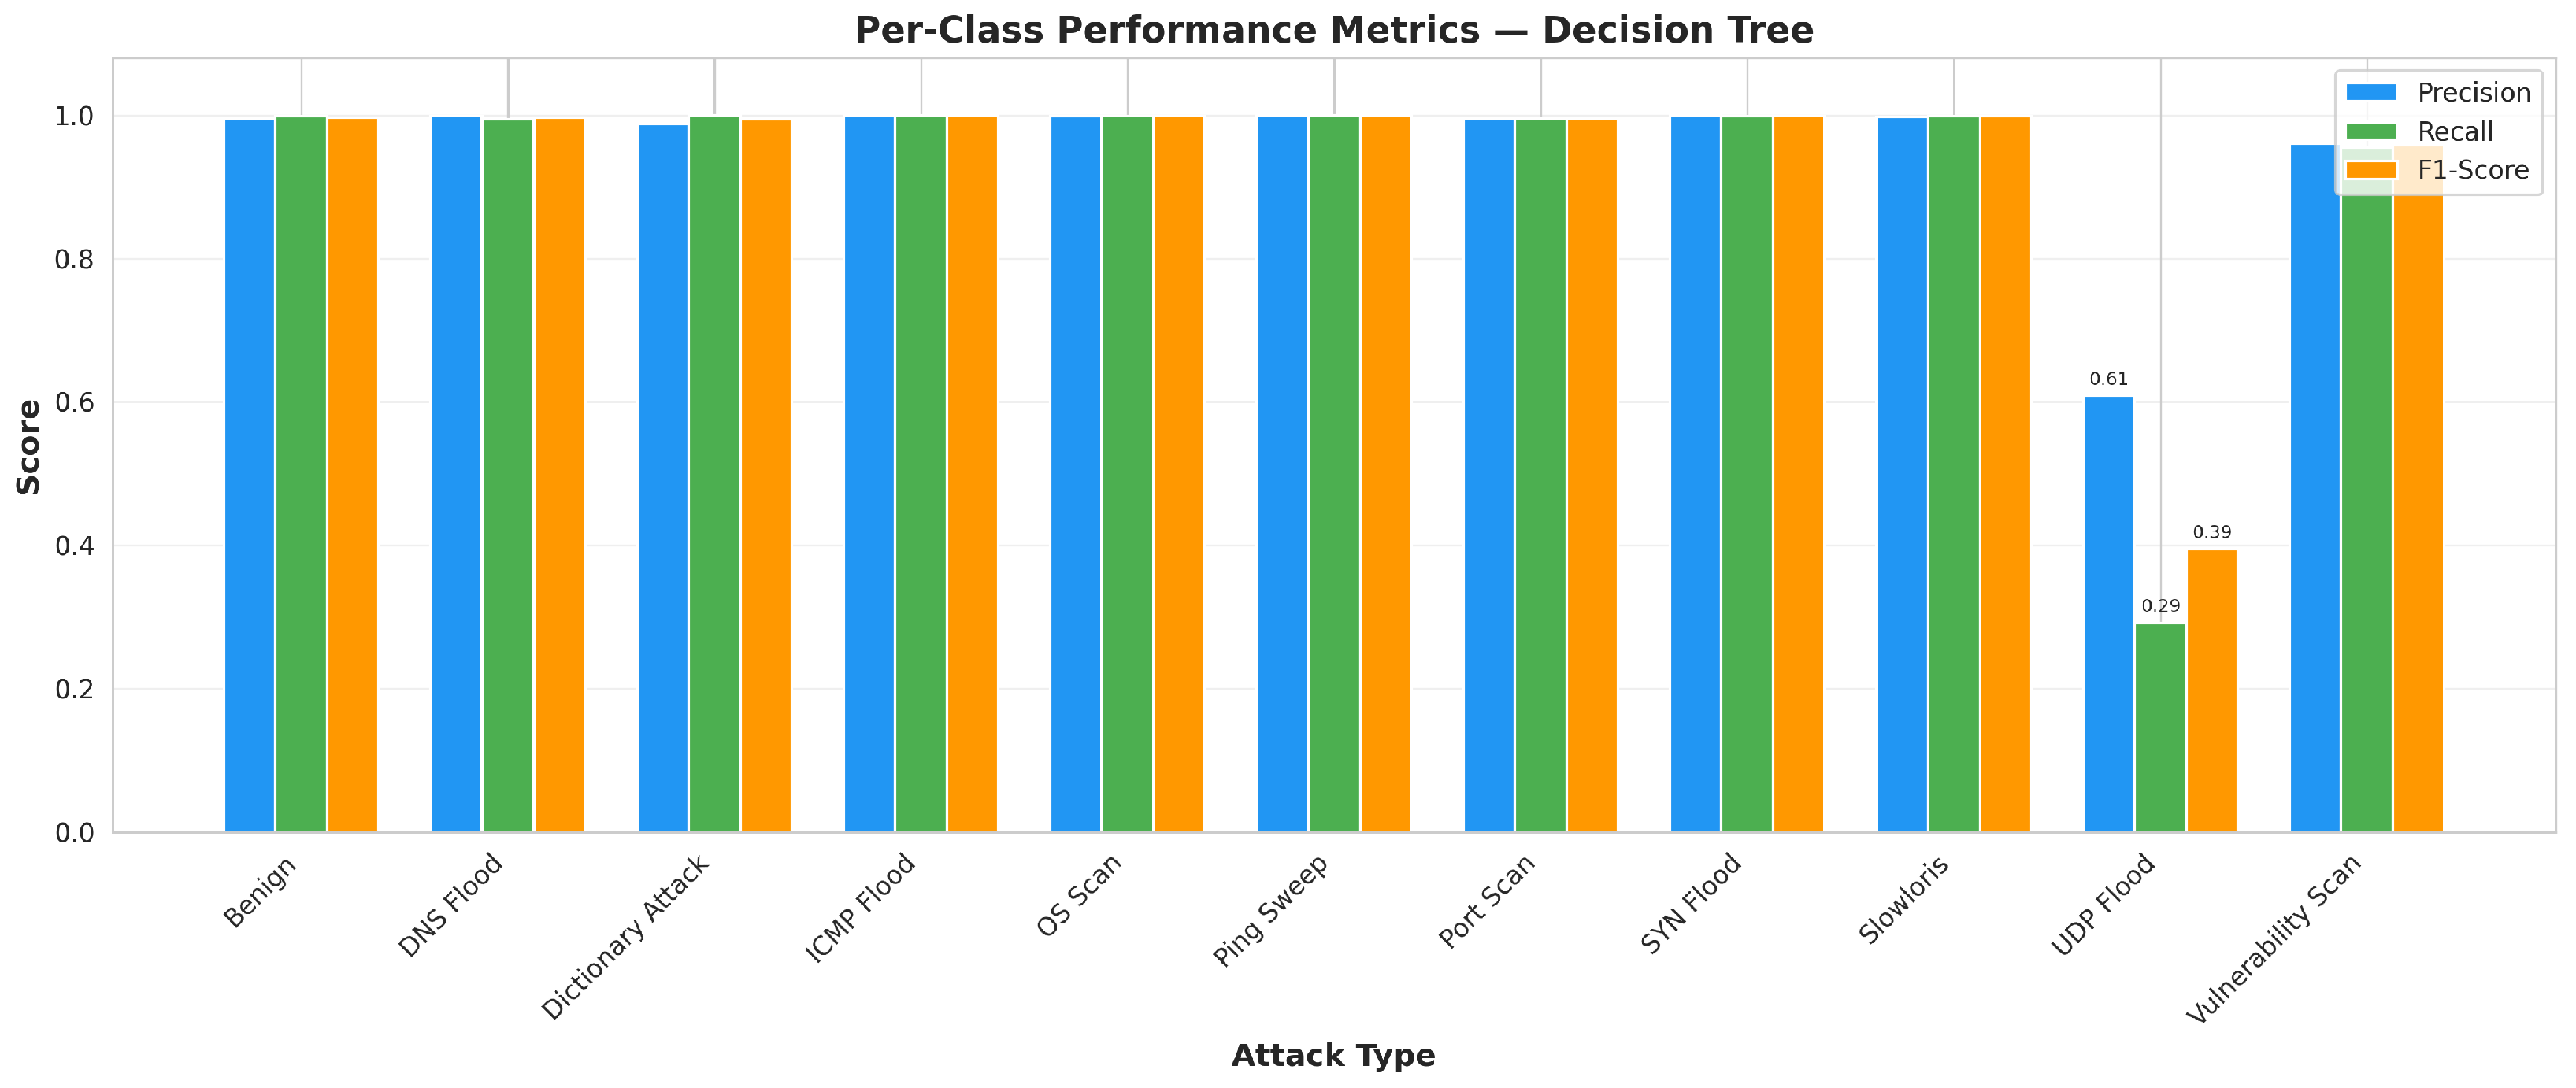
Table 4 reports per-class precision, recall, and F1-score for the best-performing multi-class model (Decision Tree). Most classes are detected with F1 . Vulnerability Scan shows slightly reduced performance (F1 ) due to expected confusion with Port Scan, as both produce elevated RST flag counts and varied source ports. UDP Flood is a severe outlier (F1 ); its failure mode is analyzed in Section 4. Figure 14 visualizes these results.
Table 4.
Per-class performance (Decision Tree, multi-class task).
Figure 14.
Per-class precision, recall, and F1-score for the Decision Tree on the multi-class task.
3.5. Feature Importance
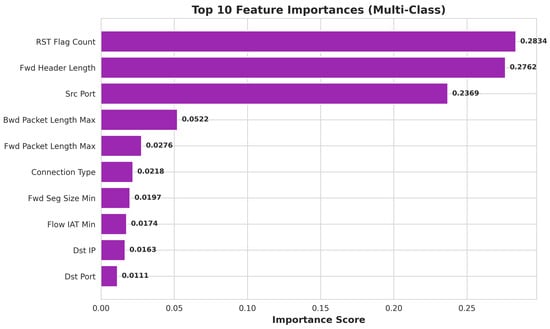
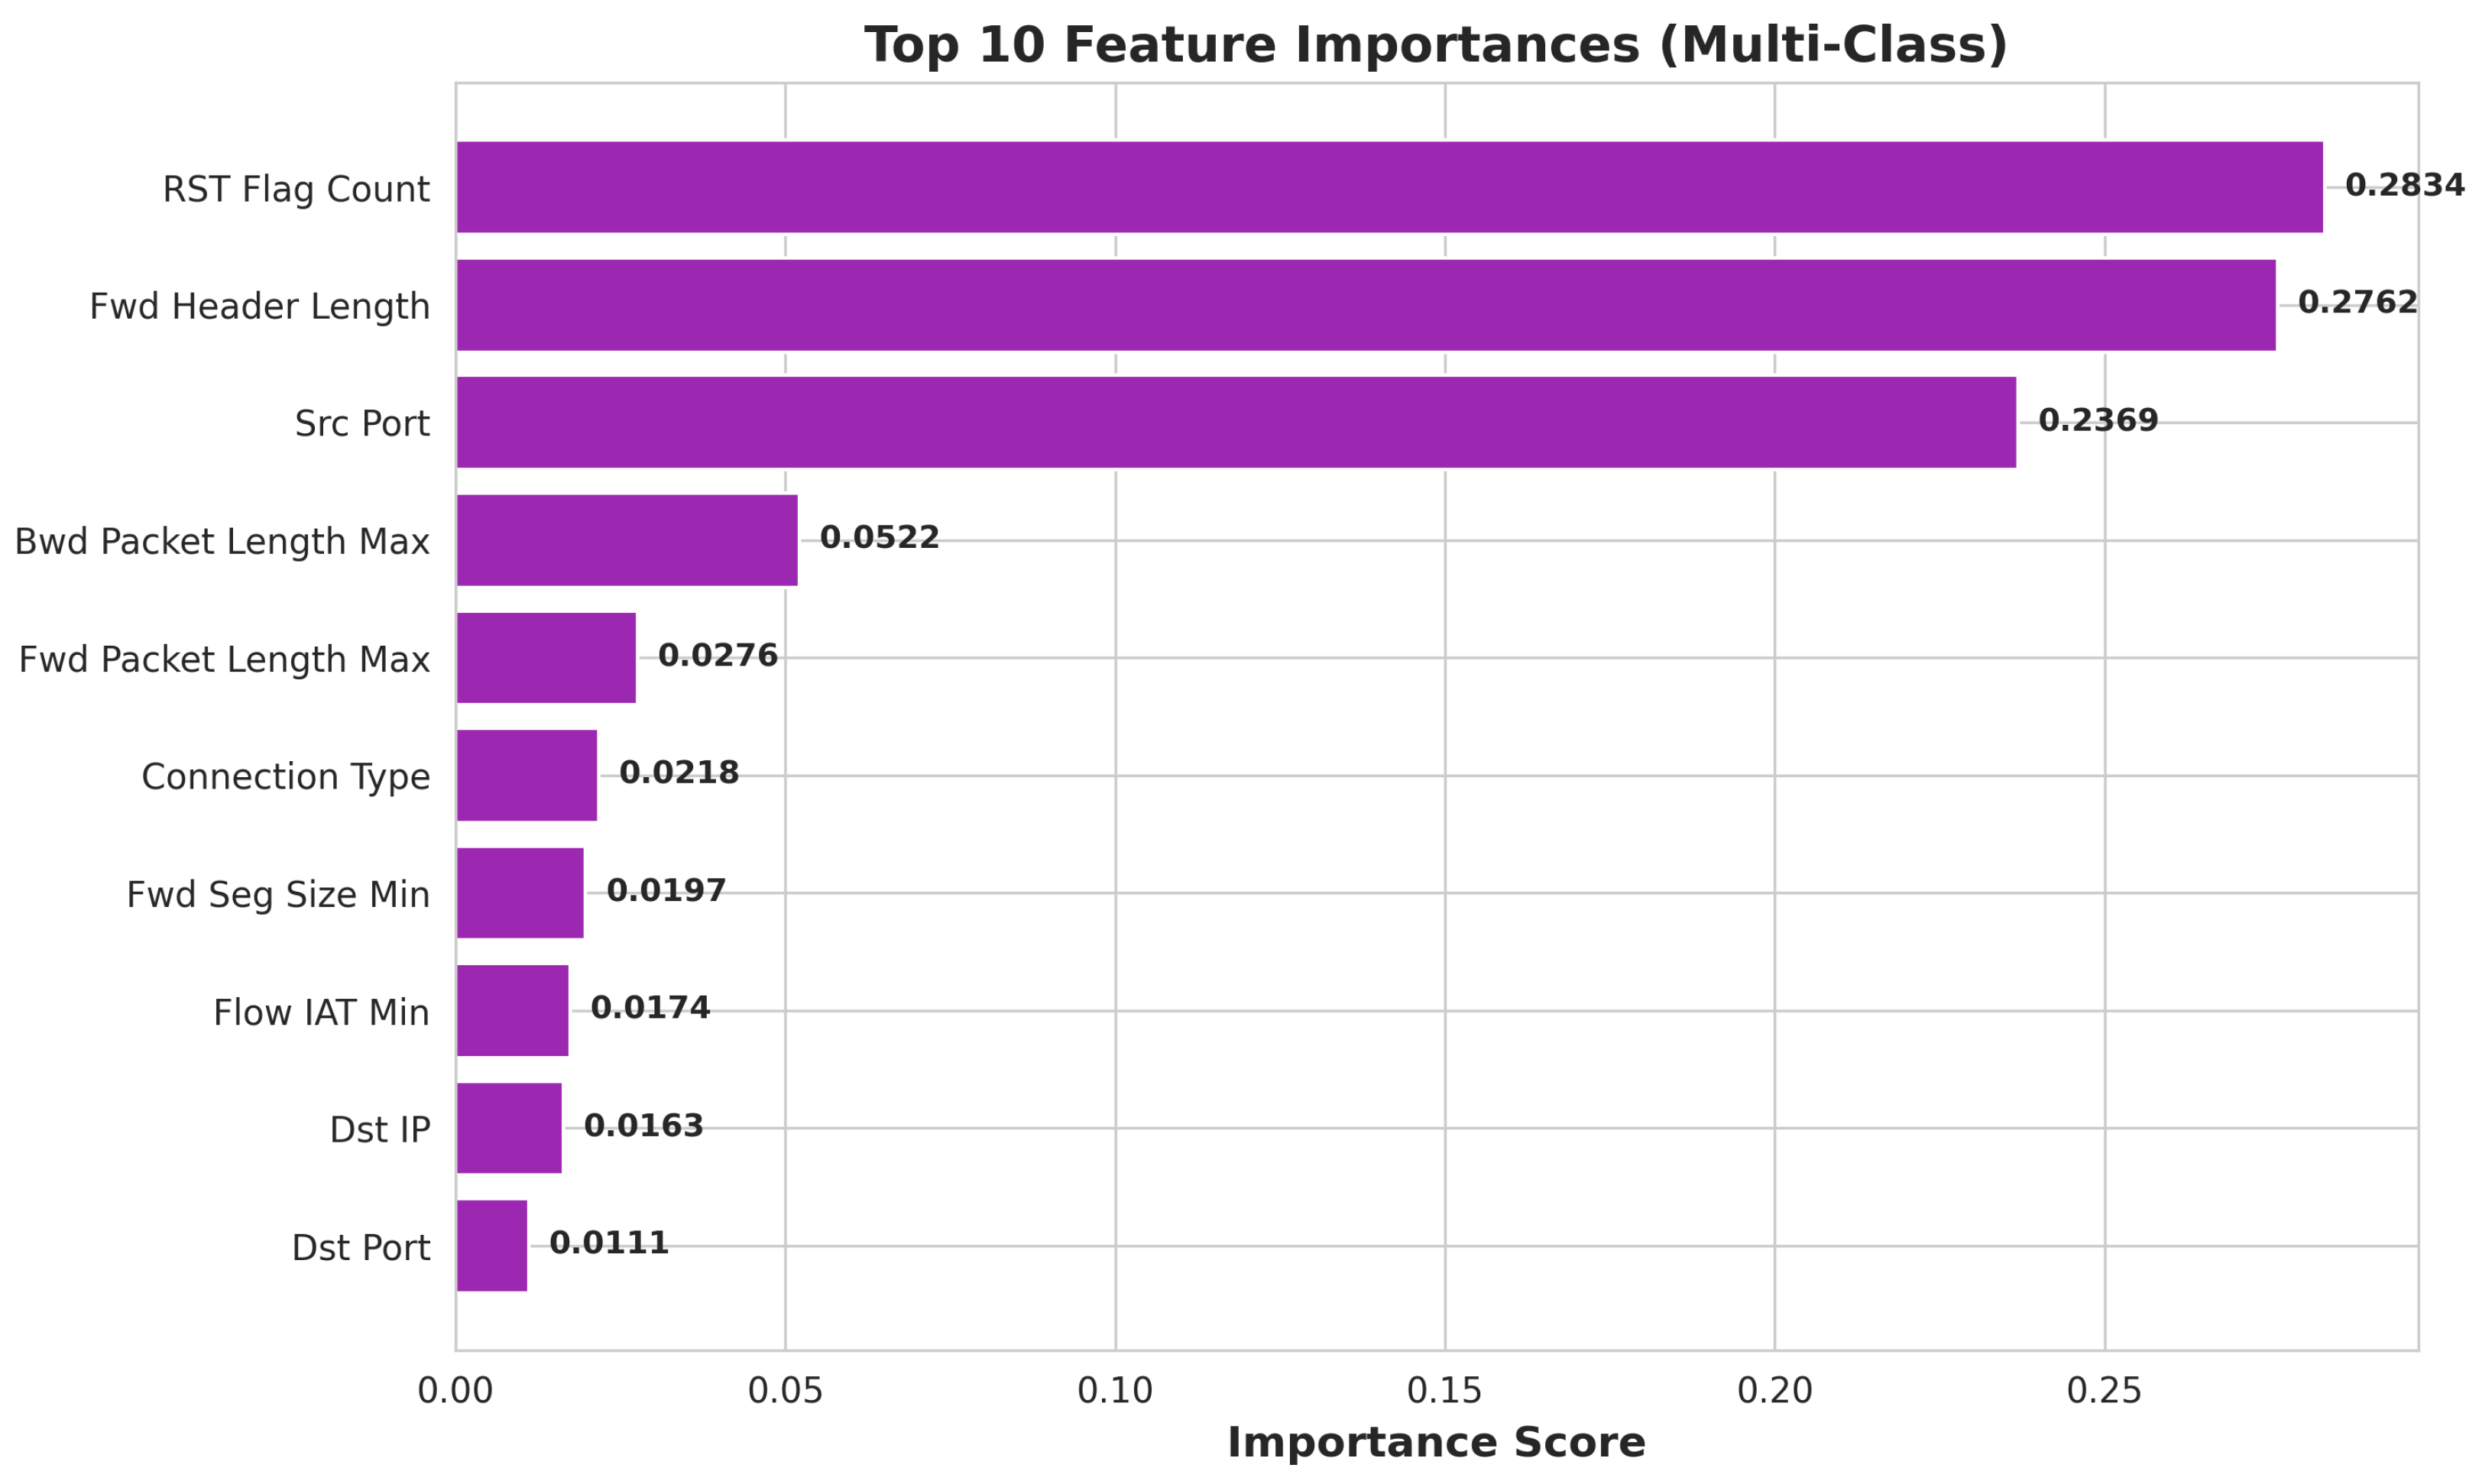
Random Forest Gini impurity feature importances (Figure 15) reveal a striking concentration: only three packet-header features—RST Flag Count (28.34%), Forward Header Length (27.62%), and Source Port (23.69%)—jointly account for 79.65% of the total Gini importance. The remaining top-10 features (Bwd Packet Length Max, Fwd Packet Length Max, Connection Type, Fwd Seg Size Min, Flow IAT Min, Dst IP, Dst Port) each contribute less than 6%.
Figure 15.
Top-10 Random Forest feature importances (multi-class task).
Because all three top features are obtainable from packet headers alone, no deep packet inspection (DPI) is required for accurate detection. This has direct deployment consequences: header-only inspection can be performed at line rate on resource-constrained V2X edge devices, and the model itself can be compact enough to fit within the memory and latency budget constraints of embedded vehicular hardware.
4. Discussion and Error Analysis
4.1. Why the CNN Underperforms
The 1D CNN achieves strong absolute accuracy (99.24% binary, 98.34% multi-class) but trails every classical model. Three mechanisms explain this outcome.
First, a Conv1D layer with kernel size of 3 assumes that features at positions N, , and are spatially correlated, as are adjacent pixels in an image. For ACI-IoT-2023, however, the 78 features are independently computed flow statistics arranged in an arbitrary column order, so the convolutional kernels learn correlations across meaningless neighbor groupings. This mismatch between inductive bias and data structure is consistent with recent tabular deep learning findings [29].
Second, the GlobalAveragePooling1D layer averages 19 post-convolution positions into a single 64-dimensional vector, diluting the signal from the single most predictive feature (RST Flag Count at 28.3% importance). Tree-based models, by contrast, can split on RST Flag Count alone at the root of the tree.
Third, at the default 0.5 sigmoid threshold, benign flows with legitimately elevated RST counts (from normal TCP teardown) produce sigmoid scores clustered near 0.52 and are misclassified. This is a threshold-calibration issue rather than a representational one: the CNN’s AUC-ROC of 0.9990 ranks third overall, above the KNN (0.9980) and the Decision Tree (0.9968), which indicates that its ranking of flows is informative even though its hard classifications at 0.5 are not optimal.
4.2. Why the Decision Tree Wins Multi-Class
Despite being the simplest model evaluated, the Decision Tree achieves the best overall multi-class performance, with 99.56% accuracy and a 99.55% F1-score. Its strong performance suggests that the ACI-IoT-2023 flow features are well suited to the axis-aligned decision boundaries learned by decision trees. In particular, RST Flag Count, Forward Header Length, and Source Port contribute substantially to the Gini importance and provide strong signals for distinguishing several attack classes. Thus, individual tree splits can capture the dominant class-discriminative patterns without requiring ensemble averaging or convolutional representations.
However, the high overall performance masks poor results for minority classes. For UDP Flood, the Decision Tree achieves only 60.87% precision, 29.17% recall, and a 39.44% F1-score. This is likely related to the severe class imbalance: UDP Flood accounts for only 791 samples (approximately 0.06%) in the full dataset, with just 48 samples in the test set. Therefore, the Decision Tree should not be considered uniformly superior across all attack types. Rather, it effectively classifies the majority classes, while extremely underrepresented classes such as UDP Flood remain challenging. Further evaluation with class-imbalance mitigation techniques, such as class weighting and training-set-only oversampling, is needed to assess whether minority-class performance can be improved without compromising the evaluation protocol.
4.3. Class Imbalance and the UDP Flood Failure
UDP Flood exhibits substantially lower detection performance than the other traffic classes across the evaluated models. The primary factor is the severe class imbalance in the ACI-IoT-2023 dataset. Only 791 UDP Flood records are available in the complete dataset, yielding 48 UDP Flood samples in the held-out test set after stratified sampling and partitioning. This limited representation makes it difficult for supervised classifiers to learn a sufficiently generalizable decision boundary for the minority class.
Class-imbalance mitigation methods, such as the Synthetic Minority Over-Sampling Technique (SMOTE) [30], may provide a solution. However, oversampling must be performed only on the training data after the train/validation/test partition has been established. In particular, synthetic samples must not be generated from the validation or test sets, because doing so could introduce information leakage and lead to an overly optimistic evaluation. Therefore, the present study does not apply SMOTE to the held-out validation or test data. Evaluating SMOTE, class-weighting strategies, and other imbalance-aware learning methods exclusively on the training set is an important direction for future work.
4.4. Model-Specific Error Modes
Each model exhibits characteristic error modes beyond the shared UDP Flood failure:
- Decision Tree: Benign TCP teardowns with elevated RST counts occasionally cross the root split threshold and land in the attack subtree with no recovery path. Port Scan and Vulnerability Scan are confused at the exact Fwd Header Length boundary.
- Random Forest: Ensemble voting on borderline benign flows produces slim attack majorities (e.g., 60/40 splits) that the single Decision Tree routes more confidently.
- XGBoost: The learning rate of 0.1 causes later boosting rounds to overfit on hard borderline cases; a lower rate (0.01–0.05) with more estimators is likely to smooth these boundaries without harming overall accuracy.
- KNN: Uniform feature weighting gives RST Flag Count (28.3% importance) the same distance weight as Dst IP (1.6%), so flows can appear “close” to the wrong class purely from matching low-importance features. In addition, the overwhelming density of Port Scan in feature space systematically biases borderline flows toward a Port Scan label.
4.5. Deployment Implications
Three findings bear directly on deployment for IoT-enabled transportation networks:
Two-stage pipeline. XGBoost is recommended for the first-stage binary benign-vs-attack decision, based on its best-in-class AUC (0.9999) and fastest classical training time (0.08 min). A Decision Tree is recommended for the second-stage attack-type identification, based on its best-in-class multi-class F1 (99.55%) and interpretable decision rules.
Header-only inspection. Because 79.65% of classification decisions derive from three header-level features, deployment does not require DPI. This is critical for encrypted V2X channels and for edge devices where payload inspection is computationally or legally infeasible.
Edge-feasible retraining. Sub-minute classical training times (XGBoost at 0.08 min binary; Decision Tree at 0.12 min multi-class) support periodic on-device retraining as attack patterns evolve, without requiring cloud offload and without violating the latency and bandwidth constraints of V2V/V2I environments [31].
Table 5 situates this work within the broader landscape of traffic-analysis research, comparing the dataset, traffic representation, evaluation protocol, imbalance handling, and generalization setting across studies. This work occupies the closed-set classification setting common to much of this literature, evaluated under a stratified random train/validation/test split with no resampling applied. Related studies span a range of alternative settings, including closed-set classification with post hoc explainability, online/adaptive learning for evolving attack patterns, and broader surveys identifying open generalization challenges across the field.
Table 5.
Comparison of representative traffic-analysis studies against this work.
5. Conclusions
This paper presented a controlled comparison of five machine learning classifiers—Decision Tree, Random Forest, XGBoost, KNN, and 1D CNN—for anomaly detection on the ACI-IoT-2023 dataset in the context of IoT-enabled networks. All four classical models achieved greater than 99.5% accuracy on binary benign-versus-attack classification, with XGBoost producing the best AUC-ROC (0.9999) and the fastest classical training time (0.08 min). On the eleven-class attack-identification task, a single Decision Tree (99.56% accuracy, 99.55% F1) outperformed every ensemble and the CNN (98.34% F1), demonstrating that sharp, axis-aligned decision boundaries are well matched to tabular network flow statistics. Feature importance analysis showed that three packet-header features—RST Flag Count, Forward Header Length, and Source Port—account for 79.65% of all classification decisions, which enables lightweight real-time deployment on V2X edge devices without deep packet inspection.
The principal limitation identified in this study is class imbalance. The UDP Flood recall of approximately 29% across all models is not an algorithmic failure but a direct consequence of only 48 test-set samples after stratified partitioning. Addressing this limitation through synthetic minority oversampling is the most important single improvement for future work. Additional directions include (i) evaluating lower learning rates and probability-calibrated objectives (multi:softprob) for XGBoost, (ii) integrating the two-stage XGBoost-then-Decision-Tree pipeline into a deployable V2X edge prototype, (iii) extending the evaluation to adversarial robustness, including the adversarial perception attacks that motivated this work, and (iv) validating generalization across additional IoT traffic datasets beyond ACI-IoT-2023.
Author Contributions
Conceptualization, C.G., L.J.P., Y.L. and J.W.; Methodology, C.G. and J.W.; Software, C.G., C.L. and J.W.; Validation, J.M., B.N., C.L. and Y.L.; Formal analysis, J.M., B.N., C.L. and Y.L.; Investigation, M.C., J.M. and C.L.; Resources, J.M., Y.L. and J.W.; Data curation, C.G., Y.L. and J.W.; Writing—original draft, M.C., Y.L. and J.W.; Writing—review & editing, J.W.; Supervision, L.J.P. and J.W.; Project administration, L.J.P., Q.W. and J.W.; Funding acquisition, Y.L. and J.W. All authors have read and agreed to the published version of the manuscript.
Funding
This research received no external funding.
Data Availability Statement
The ACI-IoT-2023 dataset used in this study is publicly available through IEEE DataPort [32].
Conflicts of Interest
The authors declare no conflicts of interest.
References
- Dui, H.; Zhang, S.; Liu, M.; Dong, X.; Bai, G. IoT-Enabled Real-Time Traffic Monitoring and Control Management for Intelligent Transportation Systems. IEEE Internet Things J. 2024, 11, 15842–15854. [Google Scholar] [CrossRef] [Scilit]
- Sodhro, A.H.; Obaidat, M.S.; Abbasi, Q.H.; Pace, P.; Pirbhulal, S.; Yasar, A.U.H.; Fortino, G.; Imran, M.A.; Qaraqe, M. Quality of Service Optimization in an IoT-Driven Intelligent Transportation System. IEEE Wirel. Commun. 2019, 26, 10–17. [Google Scholar] [CrossRef] [Scilit]
- Bui, K.H.N.; Jung, J.J. ACO-Based Dynamic Decision Making for Connected Vehicles in IoT System. IEEE Trans. Ind. Inform. 2019, 15, 5648–5655. [Google Scholar] [CrossRef] [Scilit]
- Song, Y.; Yu, F.R.; Zhou, L.; Yang, X.; He, Z. Applications of the Internet of Things (IoT) in Smart Logistics: A Comprehensive Survey. IEEE Internet Things J. 2021, 8, 4250–4274. [Google Scholar] [CrossRef] [Scilit]
- Hewa, T.; Siriwardhana, Y.; Ylianttila, M. Leveraging explainable AI for adaptive adversarial DoS attack detection in 6G IoT networks. In Proceedings of the 2025 IEEE Wireless Communications and Networking Conference (WCNC); IEEE: Milan, Italy, 2025; pp. 1–7. [Google Scholar]
- Ntafloukas, K.; Pasquale, L.; Martinez-Pastor, B.; McCrum, D.P. Identification of Vulnerable IoT Enabled Transportation Infrastructure into a Cyber-Physical Transportation Network. In Proceedings of the 2023 IEEE International Conference on Cyber Security and Resilience (CSR); IEEE: Venice, Italy, 2023; pp. 400–405. [Google Scholar]
- Wazid, M.; Singh, J.; Pandey, C.; Sherratt, R.S.; Das, A.K.; Giri, D.; Park, Y. Explainable deep Learning-Enabled malware attack detection for IoT-Enabled intelligent transportation systems. IEEE Trans. Intell. Transp. Syst. 2025, 26, 7231–7244. [Google Scholar] [CrossRef] [Scilit]
- He, Y.; Kong, M.; Du, C.; Yao, D.; Yu, M. Communication Security Analysis of Intelligent Transportation System Using 5G Internet of Things From the Perspective of Big Data. IEEE Trans. Intell. Transp. Syst. 2023, 24, 2199–2207. [Google Scholar] [CrossRef] [Scilit]
- Gyamfi, E.; Ansere, J.A.; Kamal, M.; Tariq, M.; Jurcut, A. An adaptive network security system for iot-enabled maritime transportation. IEEE Trans. Intell. Transp. Syst. 2022, 24, 2538–2547. [Google Scholar] [CrossRef] [Scilit]
- Cheng, Q.; Hong, K.; Huang, K.; Liu, Z. Evaluating Effectiveness and Identifying Appropriate Methods for Anomaly Detection in Intelligent Transportation Systems. IEEE Trans. Intell. Transp. Syst. 2025, 26, 11442–11453. [Google Scholar] [CrossRef] [Scilit]
- Chen, C.; Liu, B.; Wan, S.; Qiao, P.; Pei, Q. An edge traffic flow detection scheme based on deep learning in an intelligent transportation system. IEEE Trans. Intell. Transp. Syst. 2020, 22, 1840–1852. [Google Scholar] [CrossRef] [Scilit]
- Oseni, A.; Moustafa, N.; Creech, G.; Sohrabi, N.; Strelzoff, A.; Tari, Z.; Linkov, I. An explainable deep learning framework for resilient intrusion detection in IoT-enabled transportation networks. IEEE Trans. Intell. Transp. Syst. 2022, 24, 1000–1014. [Google Scholar] [CrossRef] [Scilit]
- Deorankar, A.V.; Thakare, S.S. Survey on anomaly detection of (iot)-internet of things cyberattacks using machine learning. In Proceedings of the 2020 Fourth International Conference on Computing Methodologies and Communication (ICCMC); IEEE: Erode, India, 2020; pp. 115–117. [Google Scholar]
- Samita, S.; Chhabra, I.; Gautam, N. Survey Paper on IoT based Intrusion Detection System: Datasets and Techniques. In Proceedings of the 2022 3rd International Conference on Computing, Analytics and Networks (ICAN); IEEE: Rajpura, India, 2022; pp. 1–9. [Google Scholar]
- Abdelhameed, D.M.; Hedar, A.R.; Elomda, B.M.; Hassan, H.A. ML-Based Intrusion Detection Systems in IoT Networks: A Survey. In Proceedings of the 2023 Eleventh International Conference on Intelligent Computing and Information Systems (ICICIS); IEEE: Cairo, Egypt, 2023; pp. 283–289. [Google Scholar]
- Hasan, M.; Mohan, S.; Shimizu, T.; Lu, H. Securing vehicle-to-everything (V2X) communication platforms. IEEE Trans. Intell. Veh. 2020, 5, 693–713. [Google Scholar] [CrossRef] [Scilit]
- Lundberg, H.; Mowla, N.I.; Abedin, S.F.; Thar, K.; Mahmood, A.; Gidlund, M.; Raza, S. Experimental analysis of trustworthy in-vehicle intrusion detection system using explainable artificial intelligence (XAI). IEEE Access 2022, 10, 102831–102841. [Google Scholar] [CrossRef] [Scilit]
- Mirsadeghi, S.M.H.; Bahsi, H.; Vaarandi, R.; Inoubli, W. Learning from few cyber-attacks: Addressing the class imbalance problem in machine learning-based intrusion detection in software-defined networking. IEEE Access 2023, 11, 140428–140442. [Google Scholar] [CrossRef] [Scilit]
- Jiao, X.; Li, J. An effective intrusion detection model for class-imbalanced learning based on smote and attention mechanism. In Proceedings of the 2021 18th International Conference on Privacy, Security and Trust (PST); IEEE: Auckland, New Zealand, 2021; pp. 1–6. [Google Scholar]
- Mallick, R.; Rout, S.; Biswas, S.; Vashishtha, L.; Sahu, S.K. Intrusion Detection using Explainable Machine Learning Techniques. In Proceedings of the 2023 OITS International Conference on Information Technology (OCIT); IEEE: Raipur, India, 2023; pp. 564–569. [Google Scholar]
- Nascita, A.; Aceto, G.; Ciuonzo, D.; Montieri, A.; Persico, V.; Pescapé, A. A survey on explainable artificial intelligence for internet traffic classification and prediction, and intrusion detection. IEEE Commun. Surv. Tutor. 2024, 27, 3165–3198. [Google Scholar] [CrossRef] [Scilit]
- Yu, W.; Liang, F.; He, X.; Hatcher, W.G.; Lu, C.; Lin, J.; Yang, X. A survey on the edge computing for the Internet of Things. IEEE Access 2017, 6, 6900–6919. [Google Scholar] [CrossRef] [Scilit]
- Premsankar, G.; Di Francesco, M.; Taleb, T. Edge computing for the Internet of Things: A case study. IEEE Internet Things J. 2018, 5, 1275–1284. [Google Scholar] [CrossRef] [Scilit]
- Li, D.; Majd, N.E. Intrusion detection in iot leveraged by multi-access edge computing using machine learning. In Proceedings of the 2023 IEEE International Performance, Computing, and Communications Conference (IPCCC); IEEE: Anaheim, CA, USA, 2023; pp. 441–446. [Google Scholar]
- Hinojosa, A.; Majd, N.E. Edge computing network intrusion detection system in IoT using deep learning. In Proceedings of the 2024 33rd International Conference on Computer Communications and Networks (ICCCN); IEEE: Big Island, HI, USA, 2024; pp. 1–6. [Google Scholar]
- Sheng, C.; Zhou, W.; Han, Q.L.; Ma, W.; Zhu, X.; Wen, S.; Xiang, Y. Network traffic fingerprinting for IIoT device identification: A survey. IEEE Trans. Ind. Inform. 2025, 21, 3541–3554. [Google Scholar] [CrossRef] [Scilit]
- Nack, E.A.; McKenzie, M.C.; Bastian, N.D. ACI-IoT-2023: A Robust Dataset for Internet of Things Network Security Analysis. In Proceedings of the MILCOM 2024—2024 IEEE Military Communications Conference (MILCOM), Washington, DC, USA, 28 October–1 November 2024; pp. 1–6. [Google Scholar] [CrossRef] [Scilit]
- Chen, T.; Guestrin, C. XGBoost: A Scalable Tree Boosting System. In Proceedings of the 22nd ACM SIGKDD International Conference on Knowledge Discovery and Data Mining, New York, NY, USA, 13–17 August 2016; KDD ’16. pp. 785–794. [Google Scholar] [CrossRef] [Scilit]
- Shwartz-Ziv, R.; Armon, A. Tabular data: Deep learning is not all you need. Inf. Fusion 2022, 81, 84–90. [Google Scholar] [CrossRef] [Scilit]
- Chawla, N.V.; Bowyer, K.W.; Hall, L.O.; Kegelmeyer, W.P. SMOTE: Synthetic minority over-sampling technique. J. Artif. Intell. Res. 2002, 16, 321–357. [Google Scholar] [CrossRef] [Scilit]
- Chen, J.; Ran, X. Deep learning with edge computing: A review. Proc. IEEE 2019, 107, 1655–1674. [Google Scholar] [CrossRef] [Scilit]
- Bastian, N.; Bierbrauer, D.; McKenzie, M.; Nack, E. ACI IoT Network Traffic Dataset 2023. IEEE DataPort 2023. [Google Scholar] [CrossRef]

Disclaimer/Publisher’s Note: The statements, opinions and data contained in all publications are solely those of the individual author(s) and contributor(s) and not of MDPI and/or the editor(s). MDPI and/or the editor(s) disclaim responsibility for any injury to people or property resulting from any ideas, methods, instructions or products referred to in the content. |
© 2026 by the authors. Licensee MDPI, Basel, Switzerland. This article is an open access article distributed under the terms and conditions of the Creative Commons Attribution (CC BY) license.