


Abstract
This paper presents a thermal and power characterization of the NVIDIA Jetson AGX Orin deployed in a realistic outdoor edge AI enclosure, integrated with power supplies, a Long Term Evolution (LTE) module, and a thermostat-controlled fan, across an ambient temperature range from −20 °C to +40 °C. The device was tested in a climate chamber under two workloads: a synthetic CPU and GPU stress test, and a YOLOv8s inference workload (TensorRT FP16, 640 × 640 input). Internal temperatures were recorded using four calibrated platinum Resistance Temperature Detectors (RTD)—PT100/PT1000, while Jetson chip temperatures and power consumption were logged via tegrastats and jtop. At sub-zero ambient temperatures, heat dissipated by the device itself kept all components within their operating ranges down to −20 °C. At the +40 °C setpoint, the stress test triggered Jetson thermal throttling at GPU and CPU temperatures of +95.6 °C and +99.0 °C, respectively. Under the same conditions, the YOLOv8s inference workload sustained 108.8 frames per second (FPS) at 19.1 W average power, approximately half of the 36.5 W consumed under the stress test, with chip temperatures well below the throttling threshold. These findings indicate that synthetic stress tests substantially overestimate the thermal and power demands of the tested inference workload, and that the enclosure retains sufficient thermal headroom for outdoor edge device deployment.
1. Introduction
Edge computing is an approach where data is processed directly on local devices, close to the data source. Unlike cloud computing, it does not require a constant internet connection and can provide lower latency, better data privacy, and more reliable operation in remote or mobile environments [1].
These advantages make edge computing a suitable choice for running neural networks in applications such as object detection, autonomous navigation, and video analysis [2,3]. The NVIDIA Jetson platform is one of the most common hardware choices for such tasks [4]. It combines a GPU and a CPU in a small and energy-efficient board, which makes it well-suited for real-time Artificial Intelligence (AI) workloads. In particular, the NVIDIA Jetson Orin provides high computing power while keeping energy consumption at a reasonable level [5].
The operating temperature of an embedded device depends not only on the workload, but also on the environmental conditions. In real-world Internet of Things (IoT) deployments, edge devices can be placed in locations with very different ambient temperatures, such as outdoor enclosures, industrial facilities, or vehicles. Higher environmental temperature makes it harder for the device to cool down, which can lead to higher chip temperatures. Many modern embedded devices can use dynamic voltage and frequency scaling (DVFS) to manage power consumption during normal operation [6]. When the temperature becomes too high, the hardware may also activate thermal throttling, which forces the clock speed to decrease in order to reduce heat [7,8]. This can protect the device from damage, but it also reduces performance. Previous studies [9,10] have shown that thermal stress can change the CPU and GPU usage, make inference slower, and increase energy consumption. Other benchmarking studies [11,12] have also shown that devices without proper cooling can have unstable performance when the temperature reaches high levels.
Although there are many studies [13,14] on benchmarking edge AI devices and measuring their energy consumption, only a few of them focus on the effect of temperature on performance and energy consumption. Some works [9,15,16] report temperature as an additional metric, but they do not study how temperature changes directly affect the benchmark results. Therefore, there is a lack of research on how temperature changes influence both performance and energy consumption on devices like the Jetson AGX.
This paper investigates the impact of environmental temperature on benchmark performance and energy consumption on the NVIDIA Jetson AGX platform. The NVIDIA Jetson AGX Orin was selected as the device under test because among currently available Jetson modules it offers the highest sustained compute capacity (up to 200 TOPS at INT8 in MAXN mode), making it the target platform when a single edge node must run multiple concurrent camera streams and detection pipelines, and to our best knowledge, the AGX Orin has not been characterized under varying ambient temperatures in prior work.
A series of experiments was conducted in which the ambient temperature around the device was varied, and the influence on several important metrics, such as Frames per Second (FPS), GPU and CPU usage, power consumption, and device temperature, was observed over time. The experimental setup involved placing the Jetson AGX Orin within an additional enclosure, along with a power circuit and communication modules, to represent a realistic edge device deployment under controlled temperature conditions provided by a climate chamber. The results of this study can help developers and engineers to better understand how edge AI devices behave when deployed in environments with different temperature conditions.
The contributions of this paper are as follows:
- A thermal and power characterization of the NVIDIA Jetson AGX Orin in a closed, realistic outdoor enclosure, integrated with power supplies, communication modules, and active cooling that would be present in a typical field deployment.
- A direct comparison of synthetic stress and YOLOv8s inference workload at the same ambient temperatures, quantifying the gap between worst-case and tested deployment conditions.
- Identification of the Jetson module itself, rather than the enclosure or surrounding components, as the thermal bottleneck at +40 °C ambient under worst-case load.
The rest of the paper is organized as follows: Section 2 describes related work, Section 3 provides the system description and introduces the methodology, in Section 4 we present the experimental results and discuss the findings, which are summarized in Section 5, and Section 6 concludes the article.
2. Related Work
In this section, we review previous studies that are related to our work.
In “Profiling Energy Consumption of Deep Neural Networks on NVIDIA Jetson Nano” [13], the authors measured power, latency, and energy of DNN inference on the Jetson Nano. They used onboard sensors and checked their accuracy with an external oscilloscope and a shunt resistor. They ran a MobileNetV2 model and changed four settings: number of CPU cores, CPU frequency, GPU frequency, and sync mode. They also measured power for individual layers of the network. The results showed that GPU frequency has the greatest effect on speed, and that lowering CPU frequency saves power but increases latency. The study found significant trade-off points for low energy use. All tests were carried out at a stable temperature, and the effect of heat was not studied.
In “NVIDIA Jetson Platform Characterization” [14], the authors studied the NVIDIA Jetson TK1 and TX1 platforms. They built micro-benchmarks for both CPU and GPU and used the Roofline model to show the performance limits of each platform. They also measured power with an external power meter. The study covered the full range of CPU and GPU frequencies and included a matrix multiplication case study. The results showed that the GPU is much faster than the CPU on both platforms. They also found that changing the frequency can help find a better balance between speed and energy use. However, the study did not look at how temperature affects performance.
In “Performance Evaluation of the NVIDIA Jetson Nano Through a Real-Time Machine Learning Application” [9], the authors tested the Jetson Nano for vehicle detection in real traffic in Quito, Ecuador. They used YOLO with OpenDataCam and tested at three locations at different times of day. They measured CPU, GPU, RAM usage, together with temperature and power consumption, using Jetson Stats. The GPU stayed at 99% usage in all tests, power changed with traffic intensity, and temperature went above 70 °C during long runs. The environmental temperature was not controlled during the experiments.
In “Evaluation of Thermal Stress on Heterogeneous IoT-Based Federated Learning” [15], the authors tested how thermal stress affects federated learning on Jetson Nano and Raspberry Pi boards. They heated up the devices and measured training time, CPU and GPU usage, temperature, and energy. The results showed that stress made training slower and used more energy. Even when only a few devices were stressed, the whole system was affected. This study is closely related to our work, but it focuses on training, not inference, and the stress was created by software, not by changing the environmental temperature.
In “Benchmarking Edge AI Platforms: Performance Analysis of NVIDIA Jetson and Raspberry Pi 5 with Coral TPU” [16], the authors compared Jetson Orin NX, Jetson Nano, and Raspberry Pi 5 with Coral TPU using YOLOv5. They ran three tests: inference speed, resource usage, and a one-hour thermal stress test at a fixed ambient temperature of 25 °C. The Orin was the fastest, and the Nano used the least power. The Raspberry Pi 5 reached up to 80 °C and showed signs of throttling, while the Jetson devices stayed much cooler. The ambient temperature was not changed during the experiments.
In “Hot Under the Hood: An Analysis of Ambient Temperature Impact on Heterogeneous Edge Platforms” [17], the authors directly study how ambient temperature affects the power consumption and runtime of machine learning inference on an NVIDIA Jetson TX2. They argue that most existing characterization studies of edge platforms are carried out without considering environmental factors, even though edge devices are often deployed in places where the ambient temperature cannot be controlled. To address this, the authors run a set of benchmarking experiments at different ambient temperatures and apply a careful statistical methodology to separate the temperature effect from other sources of variability. The results show that ambient temperature has a clear and significant impact on power consumption, with an average difference of about 20% and up to 40% for some workloads. The impact on runtime was smaller, up to about 5%. This paper is the closest to our work because it directly combines benchmarking, energy measurement, and ambient temperature variation. However, the experiments were carried out on the older Jetson TX2 platform, while our work targets the more recent NVIDIA Jetson AGX, which has a different architecture, higher computing capacity, and a different thermal profile.
In “Experimental Evaluation of NB-IoT Power Consumption and Energy Source Feasibility for Long-Term IoT Deployments” [18], the authors experimentally characterized NB-IoT power consumption on a commercial System-on-Module across payload size, signal attenuation, and ambient temperature from °C to °C, and reported that temperature had a minimal effect on per-packet transmission energy within that range. While that work targets the communication subsystem rather than the compute platform, it underscores that ambient temperature characterization of IoT/edge components is increasingly seen as deployment-relevant. Our work focuses on the compute side of the same problem on the more recent NVIDIA Jetson AGX Orin.
These studies cover different aspects of benchmarking, energy profiling, and thermal effects on embedded devices. Some measure performance and energy under stable conditions, others study thermal stress created by software, and one [17] directly varies the ambient temperature on the older TX2 platform. Our work differs from these in three respects that determine what questions can be answered. First, the device under test is the current top-tier Jetson AGX Orin, which has a different architecture, higher sustained compute capacity, a higher power envelope (15–60 W versus ≤15 W for TX2 and ≤10 W for Nano), and consequently a different thermal profile than the platforms used in [9,13,14,15,16,17]. Second, the DUT is characterized as a fully integrated outdoor deployment, Jetson module, power supplies, LTE module, PoE injector, thermostat-controlled fan, and cameras inside a closed polyester enclosure, rather than as a bare development board on a bench. Third, the ambient sweep is performed in a controlled climate chamber across −20 °C to +40 °C, chosen so that the upper bound coincides with the onset of Jetson thermal throttling under the worst-case workload, and the lower bound matches the minimum rated temperature of the integrated components.
3. Methodology
The test involved evaluating a device designed for edge computing, which processes video streams from cameras and transmits data over a mobile network. The device is intended for outdoor installation on a pole and operates from a 220 V alternating current (AC) power supply.
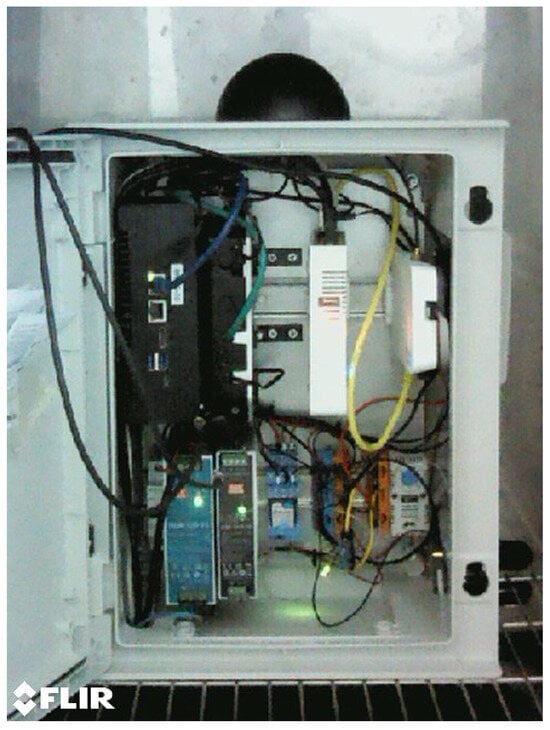
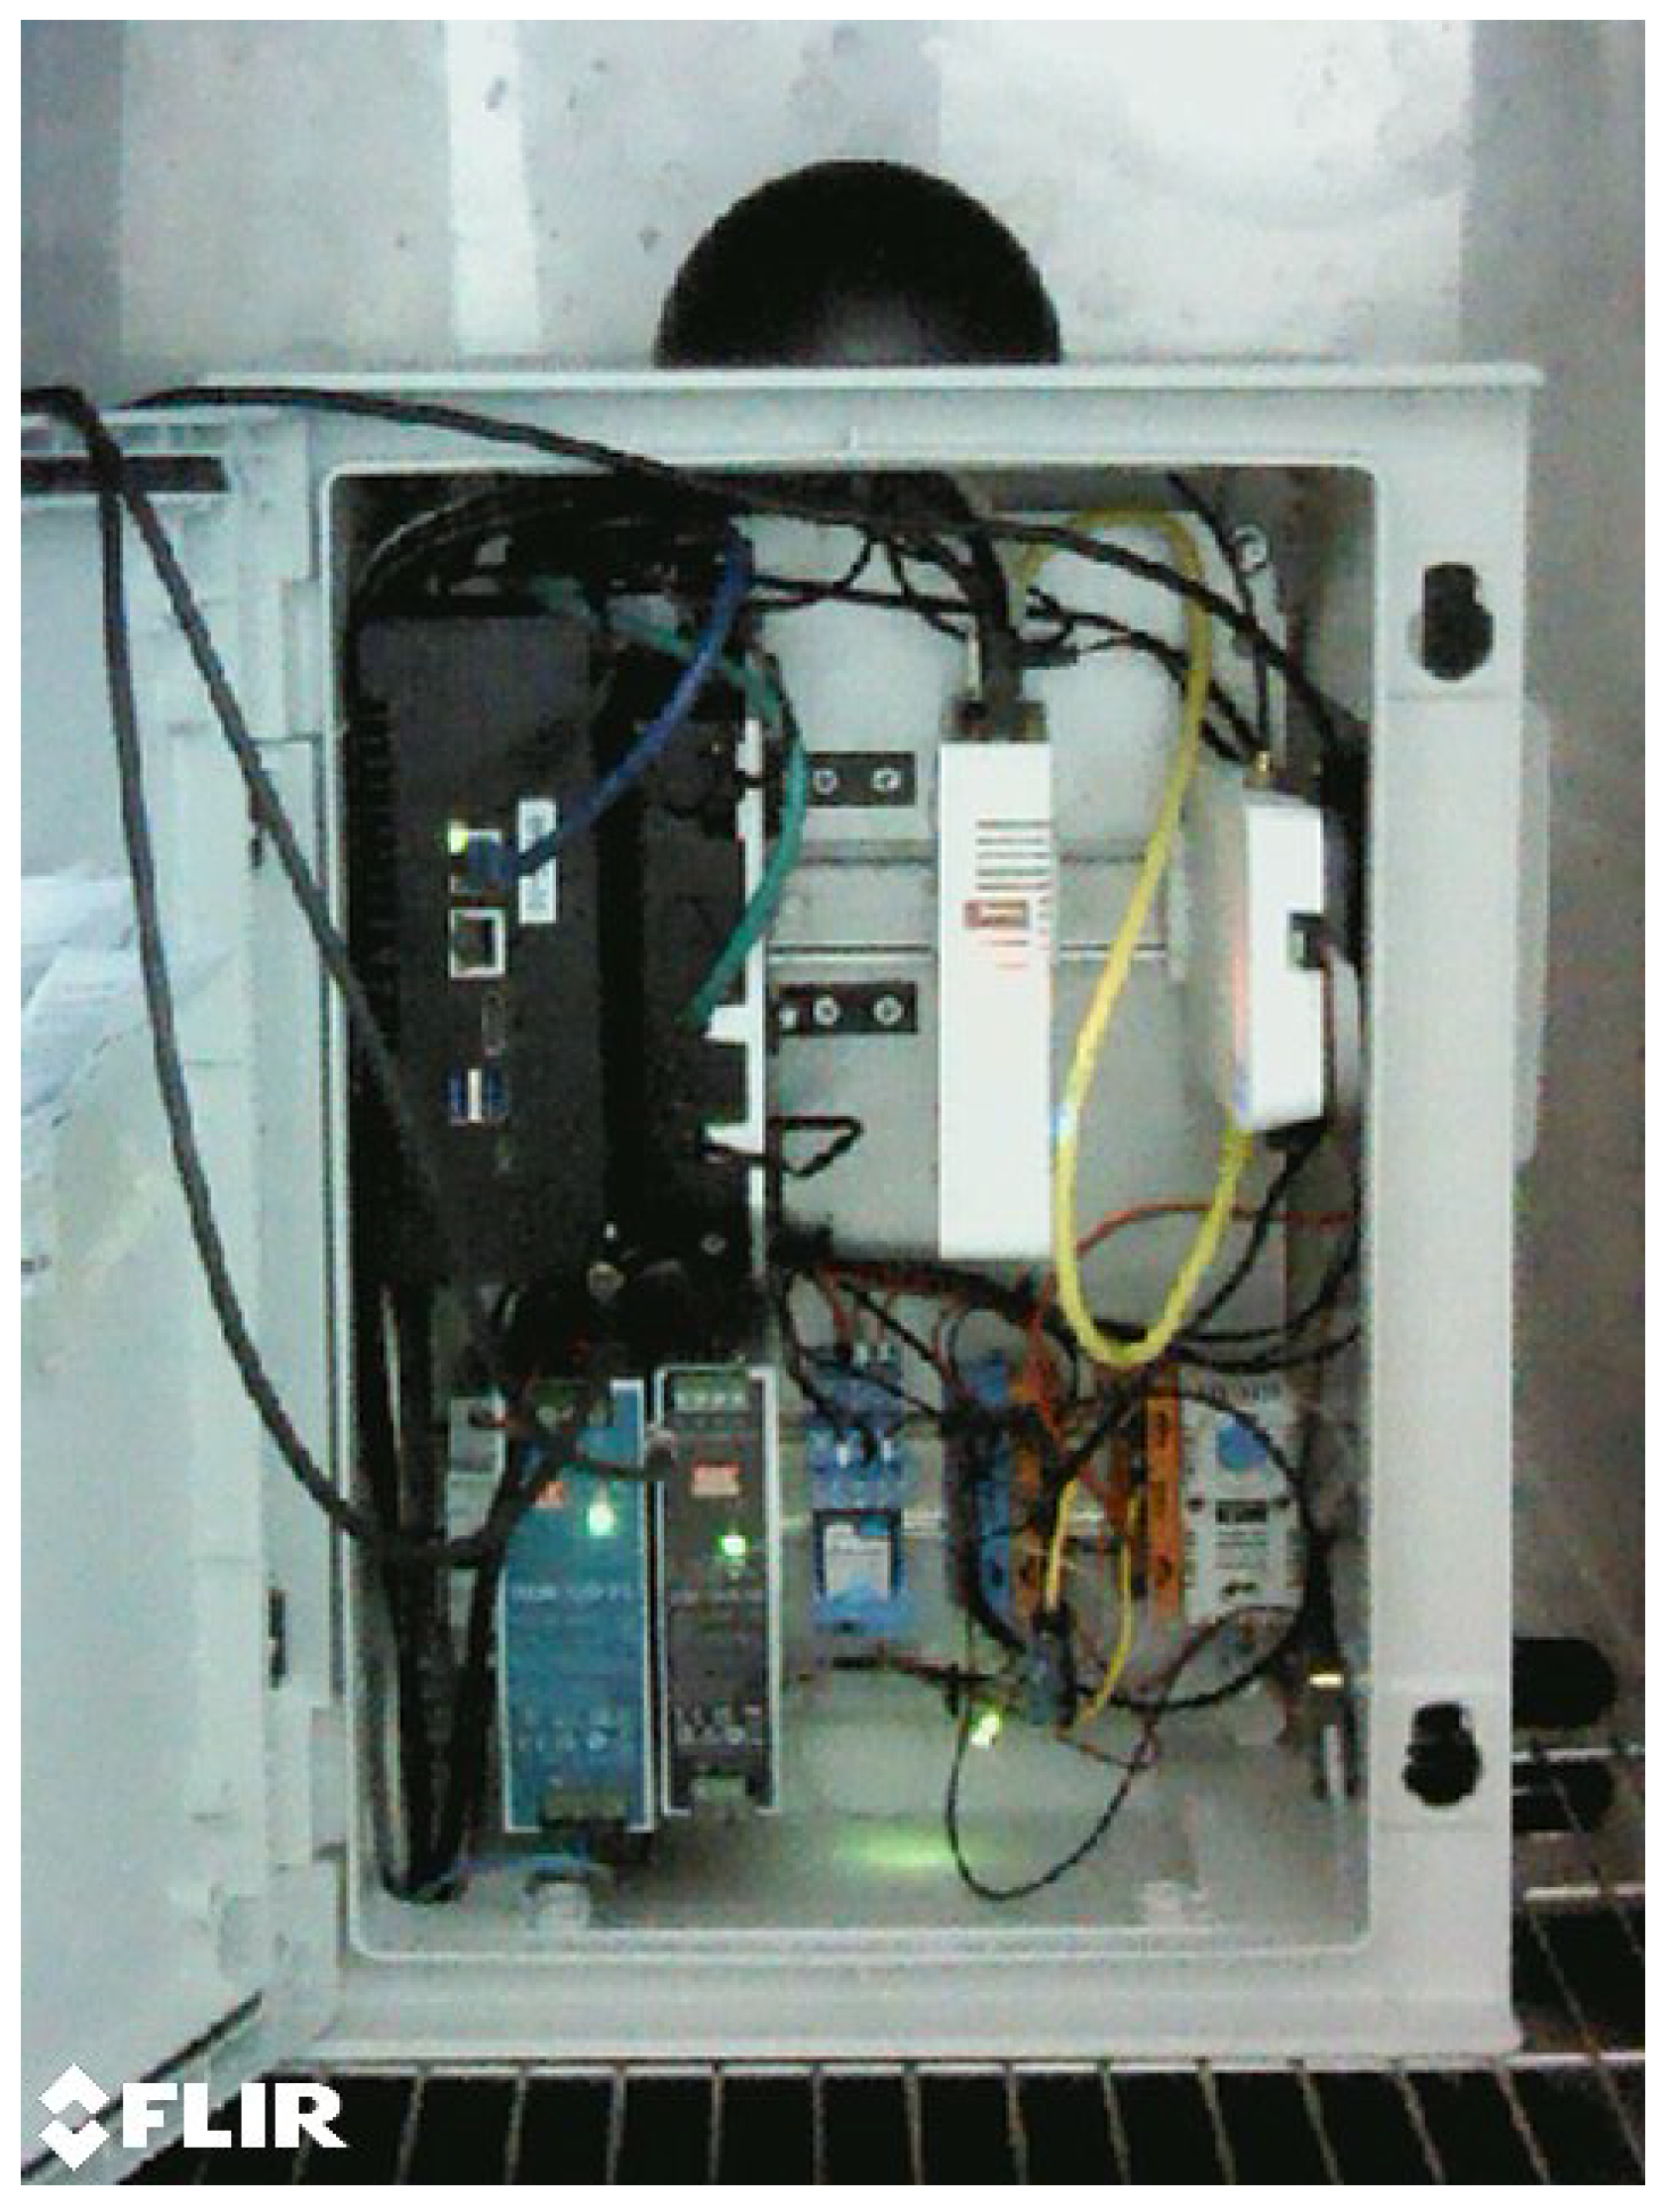
The system consists of a modified polyester enclosure housing the Jetson AGX Orin module, power supply units, an LTE module, a Power over Ethernet (PoE) injector, and other hardware. Additionally, two cameras and an infrared illuminator are connected to the system. The compute module is the Auvidea ES-X230D embedded system housing the NVIDIA Jetson AGX Orin 32 GB module: 12-core Arm Cortex-A78AE v8.2 64-bit CPU (3 MB L2, 6 MB L3), NVIDIA Ampere GPU with 2048 CUDA cores and 64 Tensor cores, two NVDLA v2.0 deep learning accelerators, 32 GB 256-bit Low-Power Double Data Rate 5 (LPDDR5) (204.8 GB/s), configurable power envelope 15–60 W. Storage: 2 TB NVMe Solid State Drive (SSD). Enclosure: industrial aluminum, 190 × 154 × 60 mm. The module was operated in MAXN power mode throughout the experiments to load it at its maximum rated thermal envelope. An internal view of the enclosure is shown in Figure 1, and all components are listed in Table 1.
Figure 1.
Internal view of the enclosure.
Table 1.
DUT components.
The polyester enclosure housing all internal electronics was modified by adding active cooling: a fan controlled by a thermostat [19]. The thermostat is set to activate at +30 °C or higher. This means that when the internal enclosure temperature exceeds +30 °C, the fan draws in fresh air, cooling the internal components. The enclosure also includes an air outlet that allows hot air to exit freely, creating a cooling airflow. The positions of the air inlet and outlet openings can be seen in Figure 1. Since two cameras and an infrared illuminator need to be connected to the system, additional cable entries were made at the bottom left of the enclosure. The air inlet for the fan is square-shaped, measuring 9 cm by 9 cm. The air outlet is circular, with a diameter of 3 cm, and the cable entry opening is oval-shaped with an approximate area of 6 cm2. All openings are protected against water ingress.
Two cameras are connected to the device: AXIS P3807-PVE and AXIS Q1700-LE. The AXIS P3807-PVE is a panoramic Internet Protocol (IP) camera with a 180° field of view, designed for outdoor use (−30 °C to +50 °C) and featuring a high level of environmental protection (IP66, IP67). The AXIS Q1700-LE is a specialized IP camera for license plate recognition, optimized for road applications and built for outdoor operation (−40 °C to +60 °C, IP66).
Since the system consists of many different components with varying specifications and operating temperature ranges, the overall operating temperature range is more limited. The lowest temperature at which all components are specified to operate is °C. The highest overall operating temperature according to the documentation is °C.
The experimental design used a discrete set of chamber setpoints (−20 °C, −10 °C, 0 °C, +20 °C, and +40 °C) rather than a continuous sweep. Two practical constraints motivated this choice. First, the climate chamber used in this study does not expose a programmable interface for logging or remote control: setpoints must be set manually on the chamber’s front panel, and the chamber itself has high thermal inertia, which, in practice, limited the experiments to one or two stabilized setpoints per working day. A continuous sweep is therefore not feasible within a reasonable experiment duration on this equipment. Second, the selected points were chosen to span the deployment-relevant range while remaining within hardware limits: −20 °C represents the lower bound at which all DUT components are rated to operate, and going below this risks damaging the components rated only to that minimum; intermediate points (−10 °C, 0 °C, +20 °C) cover sub-zero, freezing-point, and indoor/room-temperature conditions; +40 °C represents the upper bound at which the Jetson module already enters thermal throttling (Section 4.1), so higher setpoints would only reproduce the throttled regime without providing additional information about the device’s nominal operating envelope. The data-logging system records continuously during each setpoint phase, so within-phase dynamics (warm-up, equilibrium, cool-down) are fully resolved; what is discrete is the set of stabilized ambient setpoints, not the measurement itself.
3.1. Identification and Measurement of Heat Sources
To identify heat sources, a thermographic analysis of the device was performed at the beginning of the study in idle mode at an ambient temperature of approximately +20 °C, using a FLIR T650SC thermal camera to detect critical heat sources (hotspots). During a two-hour observation period, three main heat sources were identified: the NVIDIA Jetson module, the power supply units (PS1/PS2), and the PoE injector.
The internal temperature of the enclosure was measured using a measurement system consisting of three PT100 and one PT1000 Resistance Temperature Detectors (RTDs) connected to an nRF52840-Dongle module. The sensor types were chosen based on availability and both provide equivalent accuracy after individual calibration. The module provides raw voltage readings, which are recorded via the EDI TestBed [20,21,22,23] data acquisition system.
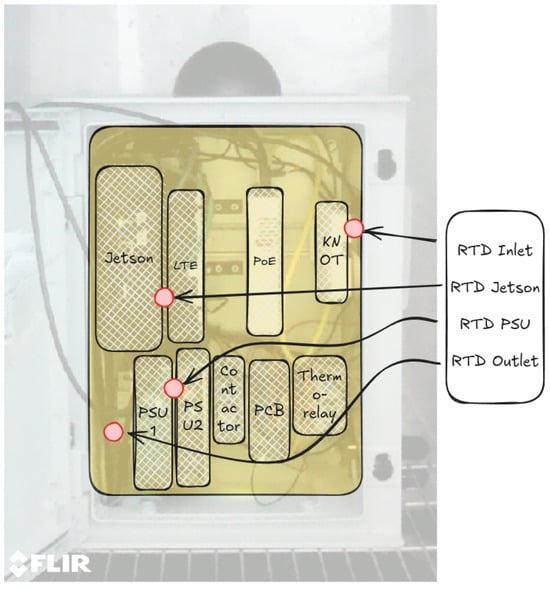
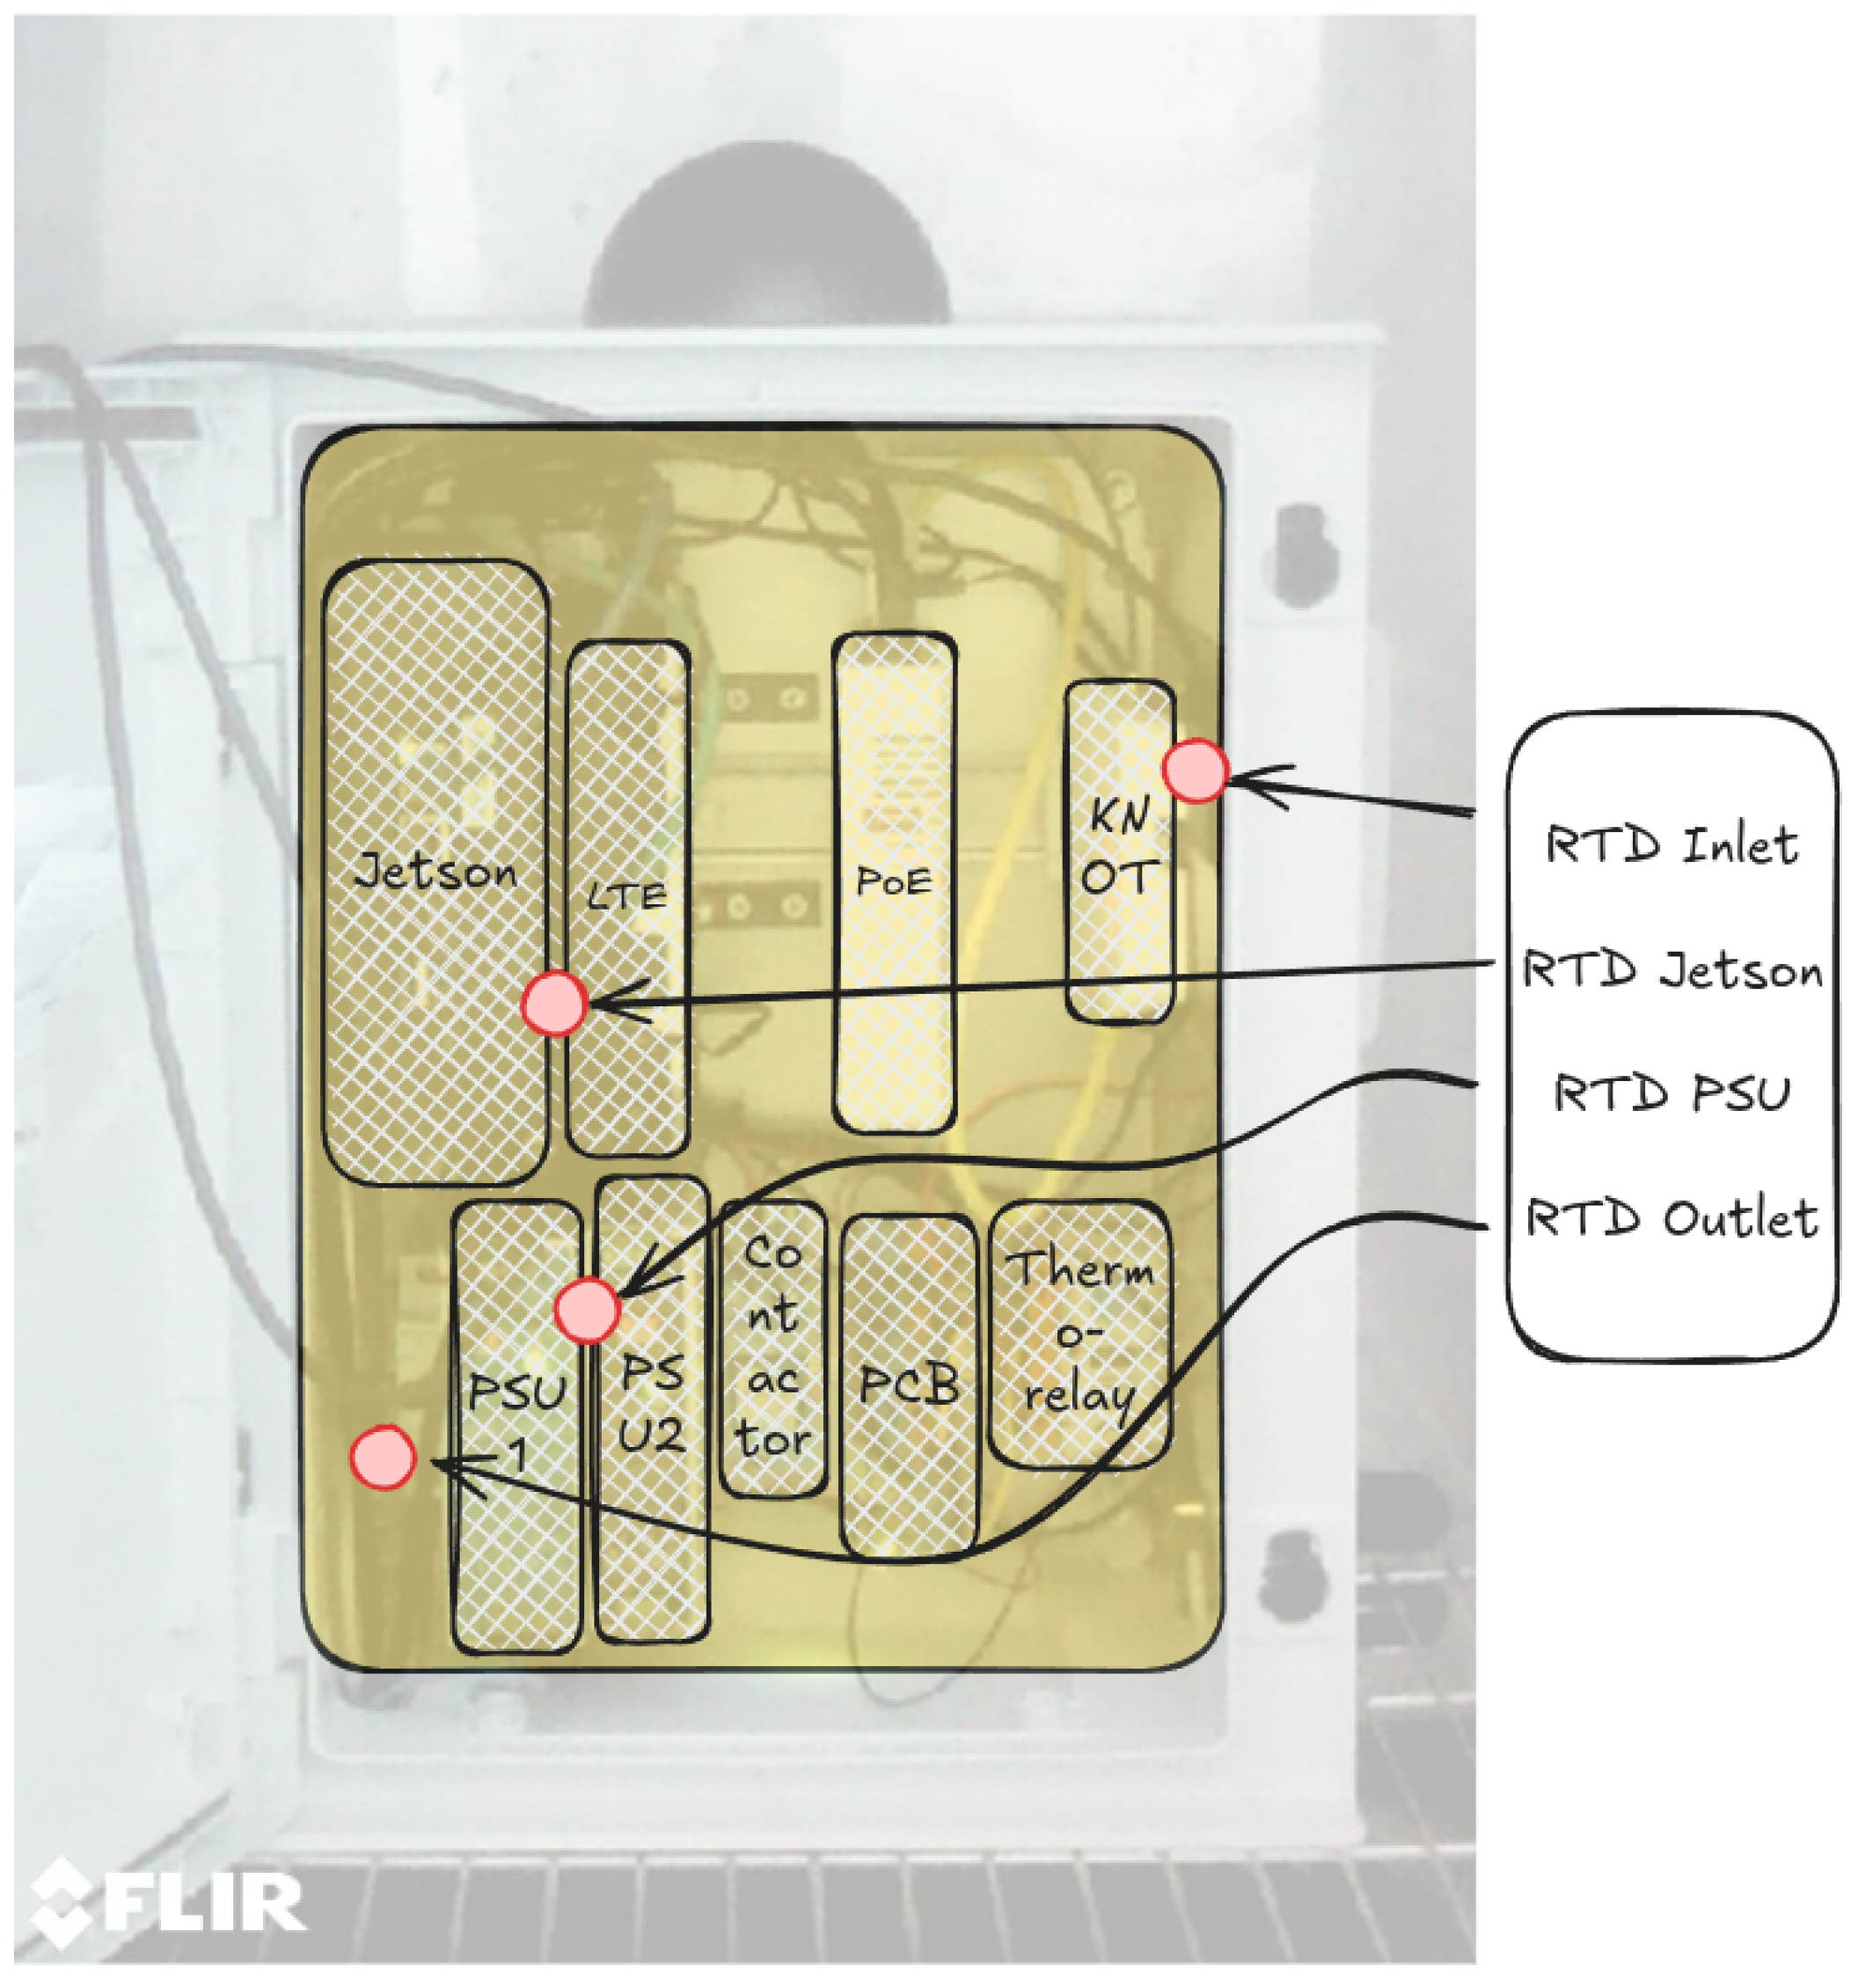
Using data from the thermal analysis, the sensors were arranged as follows: one PT100 was placed between the NVIDIA Jetson and the LTE module, the second PT100 was placed between the two power supplies (PS1 and PS2), the PT1000 sensor was mounted near the air inlet, next to the MikroTik KNOT and the fan, to measure the internal air temperature, and the third PT100 was positioned near the air outlet. The location of the sensors in the Device Under Test (DUT) is shown in Figure 2.
Figure 2.
RTD sensor placement in the enclosure.
3.2. Sensor Calibration and Temperature Validation
To ensure measurement accuracy, calibration and validation were performed in two stages. The first stage was performed with the DUT device powered off inside a climate chamber set to specific temperatures. The procedure included a set of temperature points: +40 °C, +25 °C, 0 °C, and −20 °C. At each temperature point, the system was allowed to reach thermal equilibrium, defined as a state in which sensor readings do not vary by more than ±0.5 °C over the last 30 min. The raw voltage data recorded during this process was used to generate individual voltage–temperature calibration curves for each sensor over the range from −20 °C to +40 °C, enabling conversion of raw voltage readings into accurate temperature values during testing.
Since, at this stage, the DUT is switched off and the system is in thermal equilibrium, the internal temperature of the climate chamber serves as a reliable reference measurement. By comparing the calibrated sensor readings with the chamber temperature, both the thermal contact between the temperature sensors and the measured components and the overall accuracy of the measurement system relative to the true temperature are validated. Additionally, at positive temperatures ( °C and +40 °C), where infrared reflection error is negligible [24], the sensor readings are also compared with thermal images from the FLIR T650SC camera, providing independent validation using an alternative measurement method.
In the second stage, validation was performed under load test conditions with the enclosure lid open to evaluate component heating at maximum load. The DUT was placed in a climate chamber set to temperatures of −20 °C, 0 °C, +25 °C, and +40 °C, and the device was powered on with the load test running. The load test ensured maximum utilization of the Jetson CPU and GPU and provided streaming from two video cameras.
In this stage of validation, readings from calibrated PT sensors and data from the FLIR T650SC thermal camera were used. The comparison was based on the analysis of temperature differences () between sensor positions, which made it possible to verify measurement consistency without relying on an absolute temperature reference, since the powered device generates localized and non-uniform heat dissipation. At a chamber temperature of +25 °C, the sensor located between the Jetson and LTE module recorded ≈+45 °C, corresponding to a temperature increase of °C. Similarly, the temperature between the power supplies reached +42 °C ( °C). A third sensor, located further away from the main heat sources, showed a smaller increase ( °C).
3.3. Jetson System Temperature and Power Consumption Measurement
For measuring temperature, power consumption, and other parameters of the Jetson, the tools tegrastats [25] and jtop [26] were used. The jtop tool has a Python library, which was used to write a script for logging data and saving it to a CSV file [27]. Python V3.8.10 was used in the work. Both tools recorded data every second. The AGX Orin was set to MAXN power mode during the tests.
3.4. Synthetic Stress Test
The synthetic stress test is designed to maximize heat output rather than to represent any realistic workload. Its purpose is to establish the upper bound of thermal and power behavior achievable on the DUT under the given enclosure and cooling design, providing a worst-case baseline against which realistic inference workloads can be compared.
To fully load the system so that power consumption is maximized and the device reaches its maximum sustained temperature, a synthetic stress test (source code in Appendix A) was executed. The synthetic test consists of CPU load, GPU load, and video streaming from cameras on the Jetson, while also recording system data using tegrastats and a Python script based on the jtop library.
The stress tool loads the CPU with tasks, ensuring continuous maximum utilization of the processor. The jetson-gpu-burn utility fills most of the GPU’s video memory and performs continuous computations on CUDA cores, thereby loading the GPU to its maximum capacity [28]. In the stress test, streaming of the video feed from cameras is handled using the ffmpeg tool.
3.5. Inference Workload
Since the real workload on the Jetson does not always fully utilize the CPU and GPU, an inference task based on the YOLOv8s [29] object detection model was selected to represent a realistic workload. The model was exported to a TensorRT FP16 engine and executed continuously on 640 × 640 input frames from the default coco8 dataset, performing GPU inference followed by post-processing. We used a similar approach to [30], ensuring a sustained computational load on the GPU, enabling the evaluation of system performance, power consumption, and thermal characteristics under conditions representative of real-world edge deployments. A similar TensorRT FP16 deployment of YOLOv8 variants on the smaller Jetson Orin NX has been characterized in [31], providing a comparison point on a lower-tier Orin module; our setup uses the same model family and precision but targets the higher-power AGX Orin under varying ambient temperature.
System data logging was performed using the same tools as in the stress test: tegrastats and a Python script based on the jtop library. During the inference test, additional metrics were also recorded, including the average frame processing time and the frame rate (FPS).
4. Experiments
The experimental campaign consisted of two workload tests on the same DUT and instrumentation: a synthetic stress test across five chamber setpoints (−20, −10, 0, +20, and +40 °C) to characterize thermal limits, followed by a YOLOv8s inference workload at the worst-case setpoint (+40 °C) to characterize deployment behavior. Both tests used identical sensor placement, calibration, and logging configuration. Each phase was held after the chamber reached its setpoint, ensuring the system reached thermal equilibrium before measurements were collected.
4.1. Synthetic Stress Test Results
The experiment using a synthetic stress test was conducted with climate chamber setpoints of −20 °C, −10 °C, 0 °C, +20 °C, and +40 °C.
The obtained measurement results are summarized in Table 2. Note that starting from +20 °C, the inlet fan was activated by the thermal relay, so the component temperatures decreased. Several conclusions can be drawn from the collected data.
Table 2.
Results of temperature measurements in climate chamber tests.
Components with high power consumption (Jetson, LTE module, and power supplies) generate a significant amount of heat. As reported in Section 3.2 under open-enclosure validation conditions, local temperatures rise by 15–20 °C above the ambient at a chamber setpoint of +25 °C. Under closed-enclosure stress-test conditions (Table 2), the same values are larger when the cooling fan is inactive: at sub-zero setpoints, the Jetson/LTE sensor sits 30–50 °C above ambient. Once the chamber setpoint exceeds the +30 °C internal-air threshold and the fan activates, forced airflow reduces the same delta to 10–21 °C, visible in the +20 and +40 °C rows of Table 2.
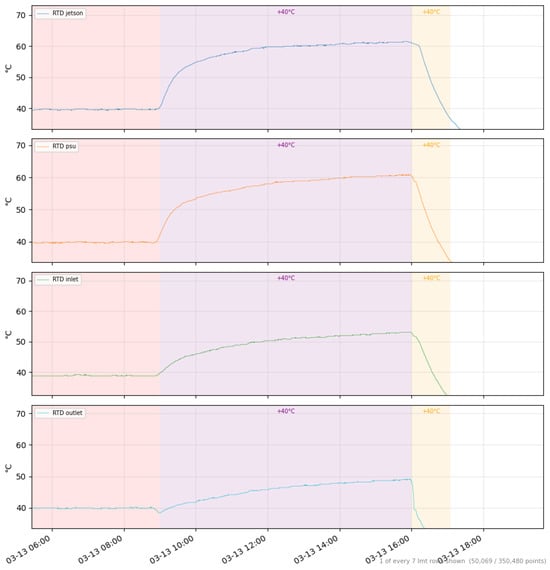
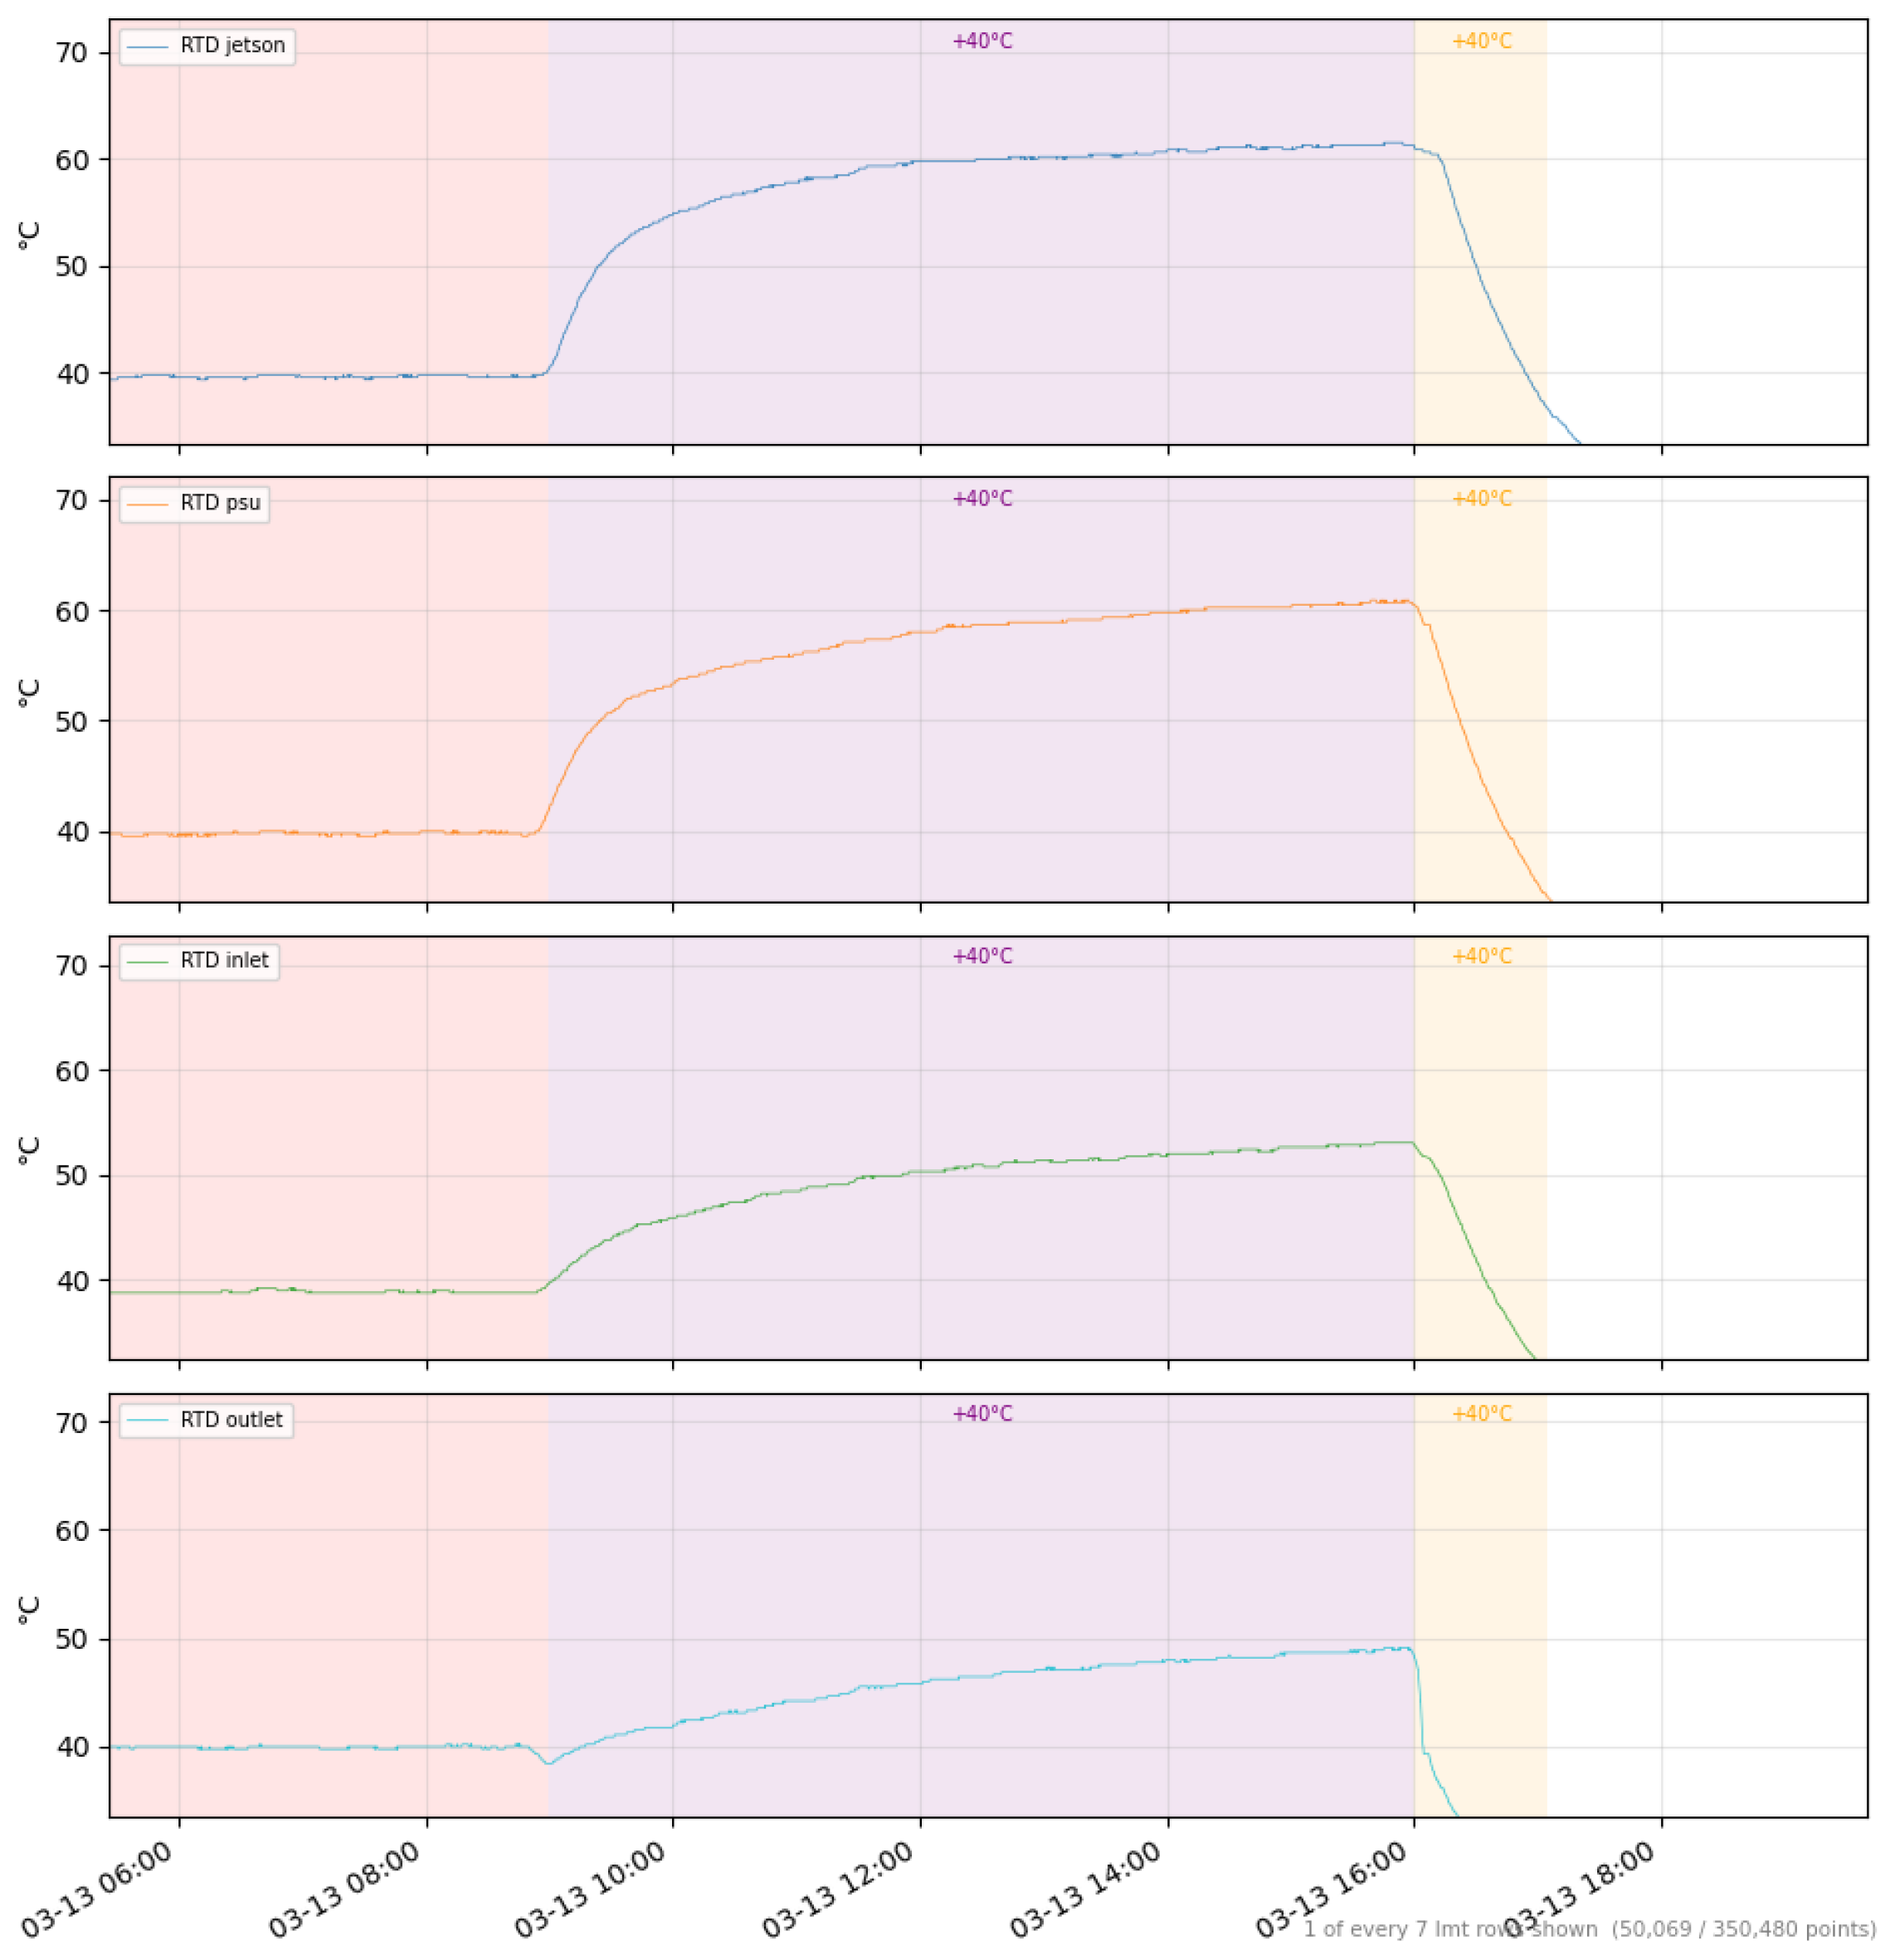
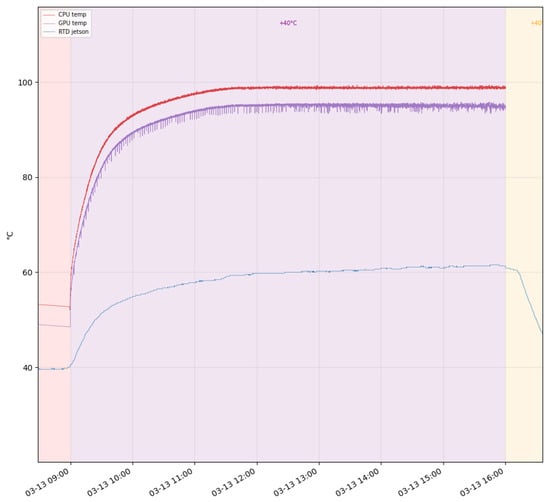
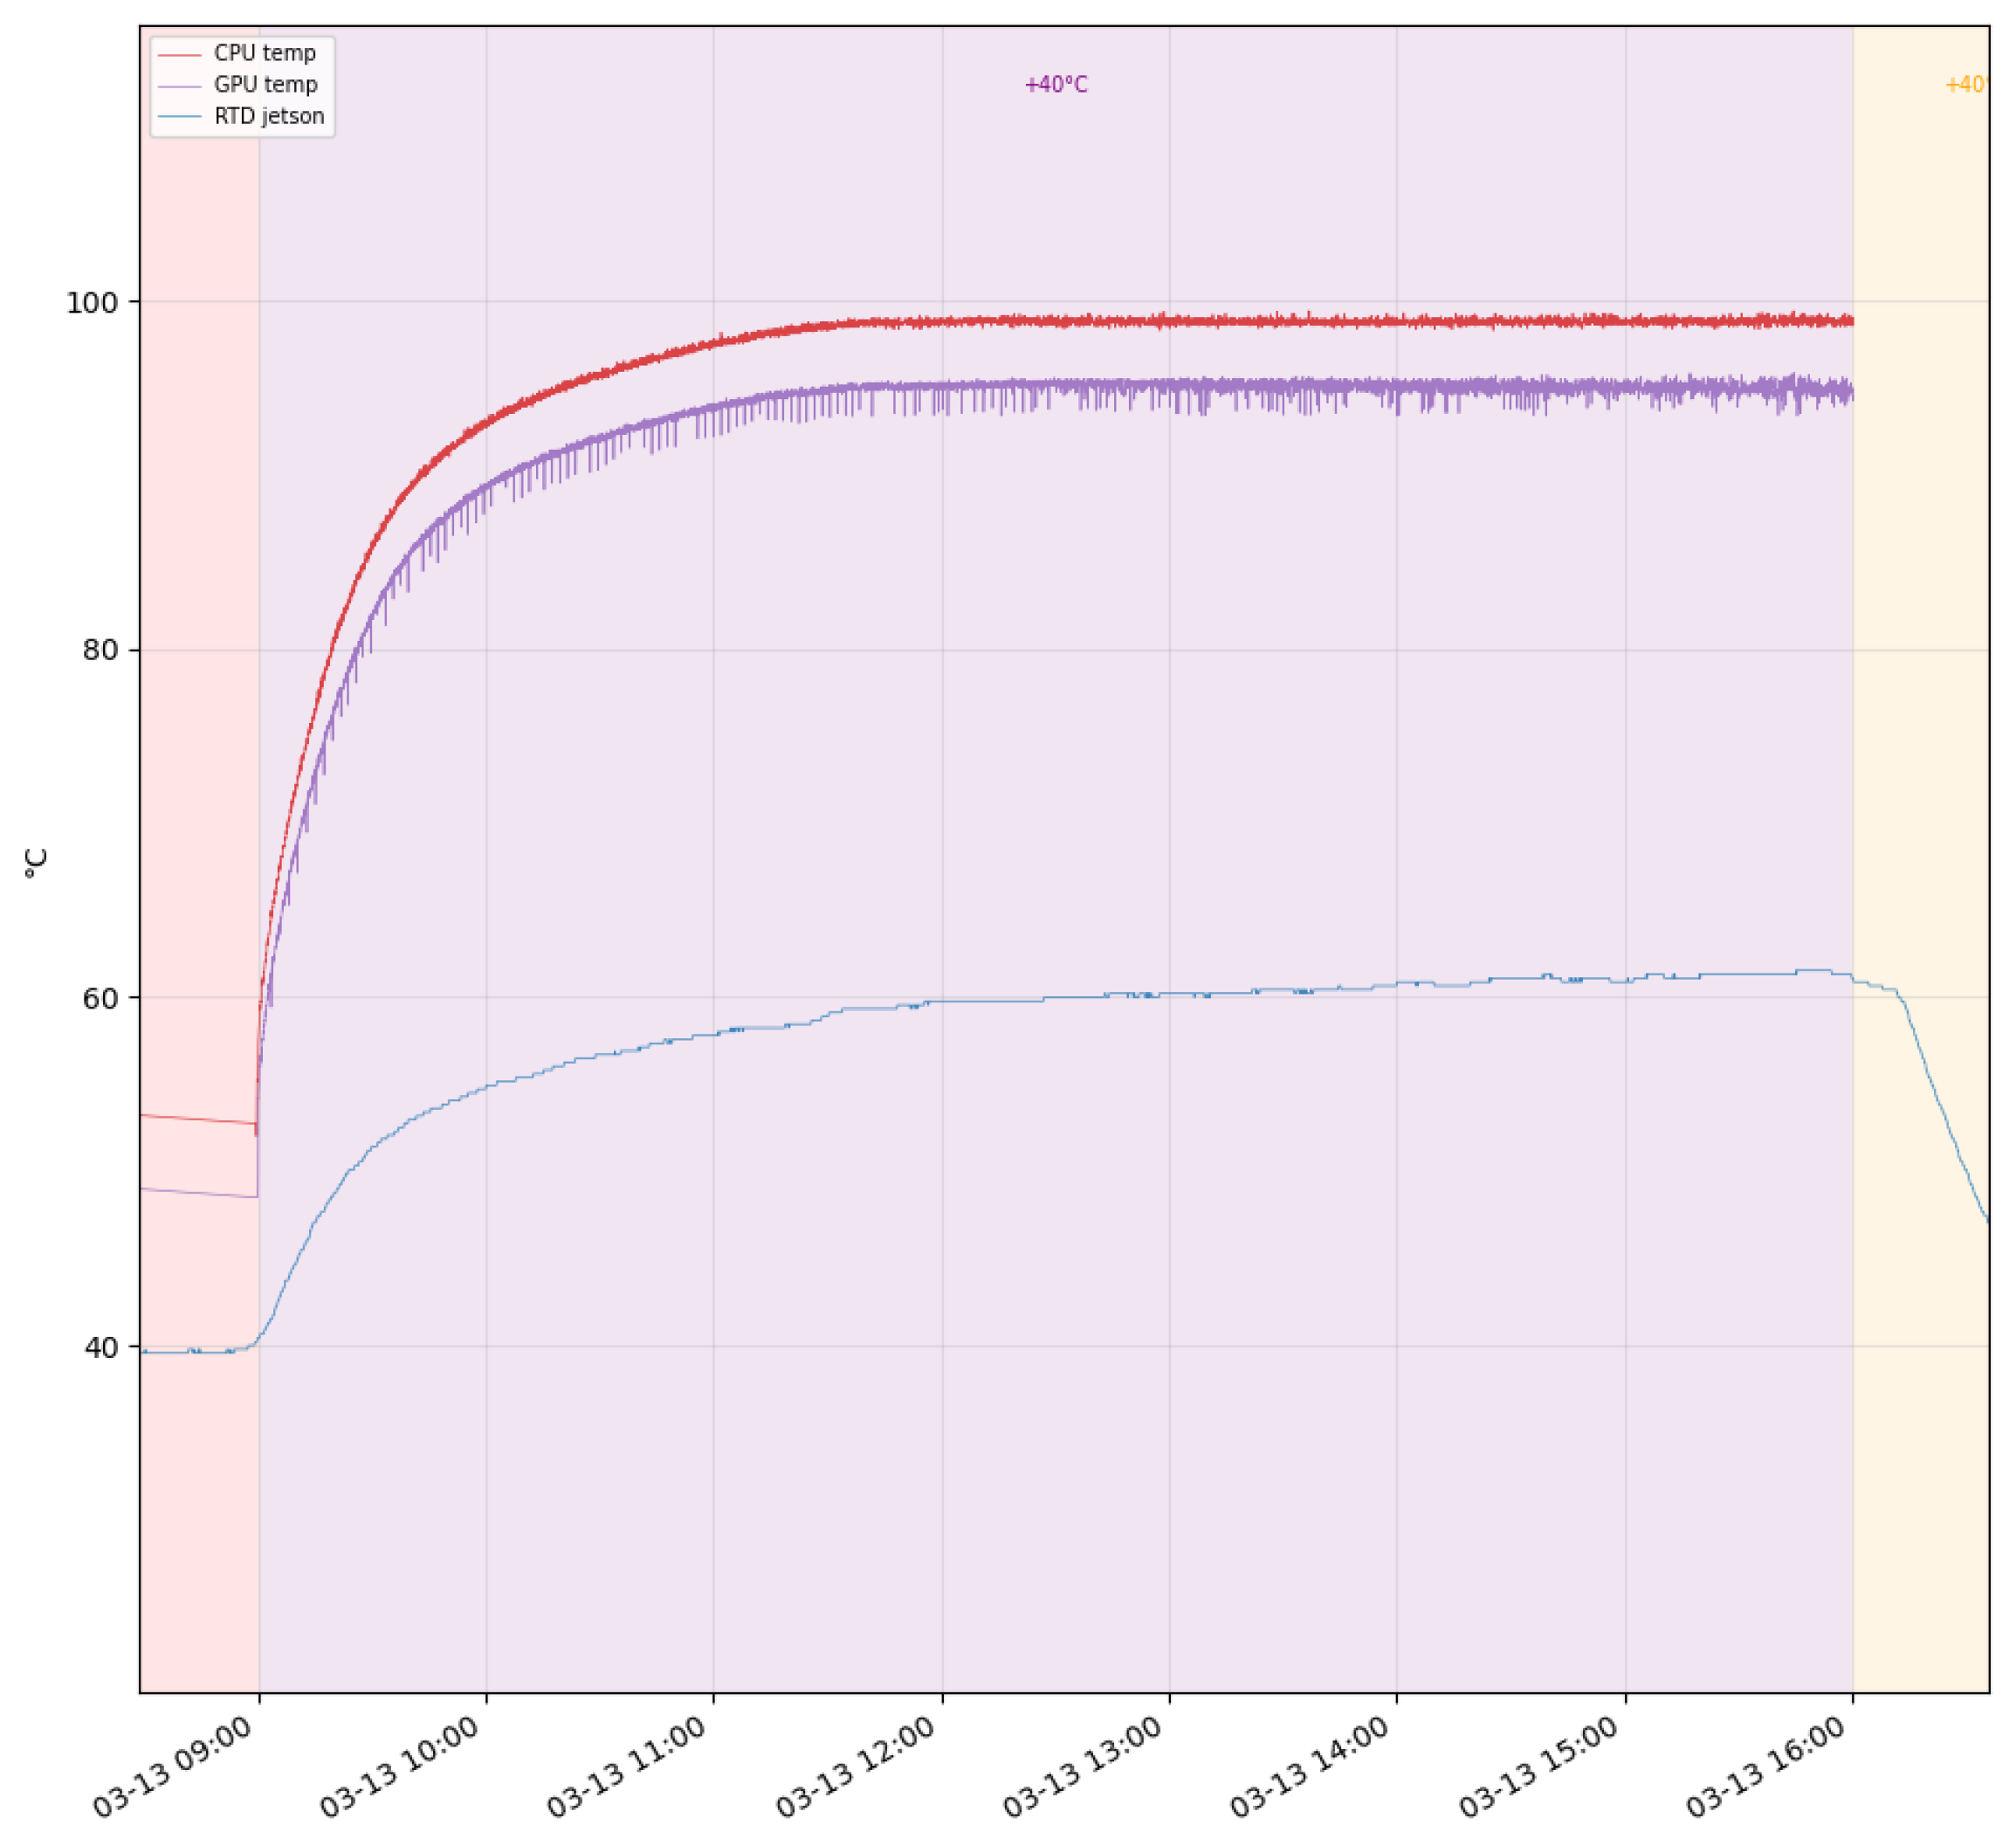
Referring to Figure 3, at the setpoint temperature of +40 °C, the internal temperature of the DUT is approximately +5 °C higher than the ambient temperature. Continuous measurements of the chamber temperature were not recorded. The temperatures of all device enclosures remained within their operational limits, and the system as a whole continued to function as intended. However, as shown in Figure 4, at +40 °C, the Jetson CPU temperature approaches the +99 °C throttling threshold, which also coincides with the manufacturer’s recommended Orin SoC operating temperature limit [32].
Figure 3.
RTD measurements of the four enclosure positions during the stress test at a chamber setpoint of +40 °C. From top to bottom: RTD Jetson, RTD PSU, RTD Inlet, and RTD Outlet. The pre-test phase (left) shows pre-heating of the chamber; the central +40 °C region is the active stress test; the right segment shows the cool-down. The thermostat-controlled fan is active throughout this run.
Figure 4.
Jetson chip temperatures (CPU and GPU) and RTD Jetson during the +40 °C stress test. Both CPU and GPU rise rapidly during the first 30 min and stabilize near their respective throttling thresholds (CPU ≈ +99 °C, GPU ≈ +95.6 °C). RTD Jetson, located in the surrounding air, plateaus around +60 °C, illustrating the large gradient between the silicon junction and ambient enclosure temperature.
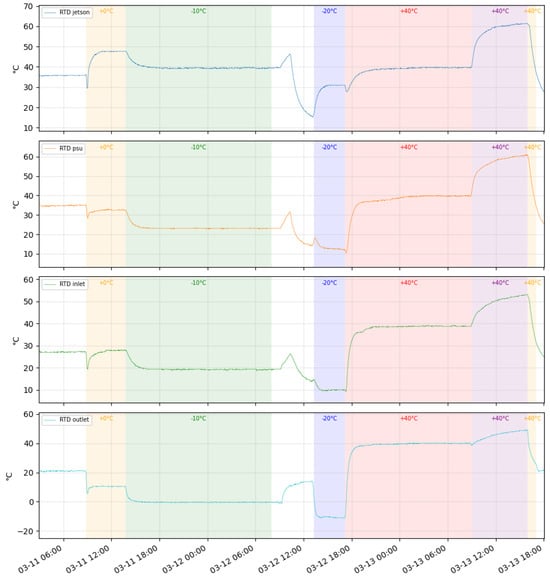
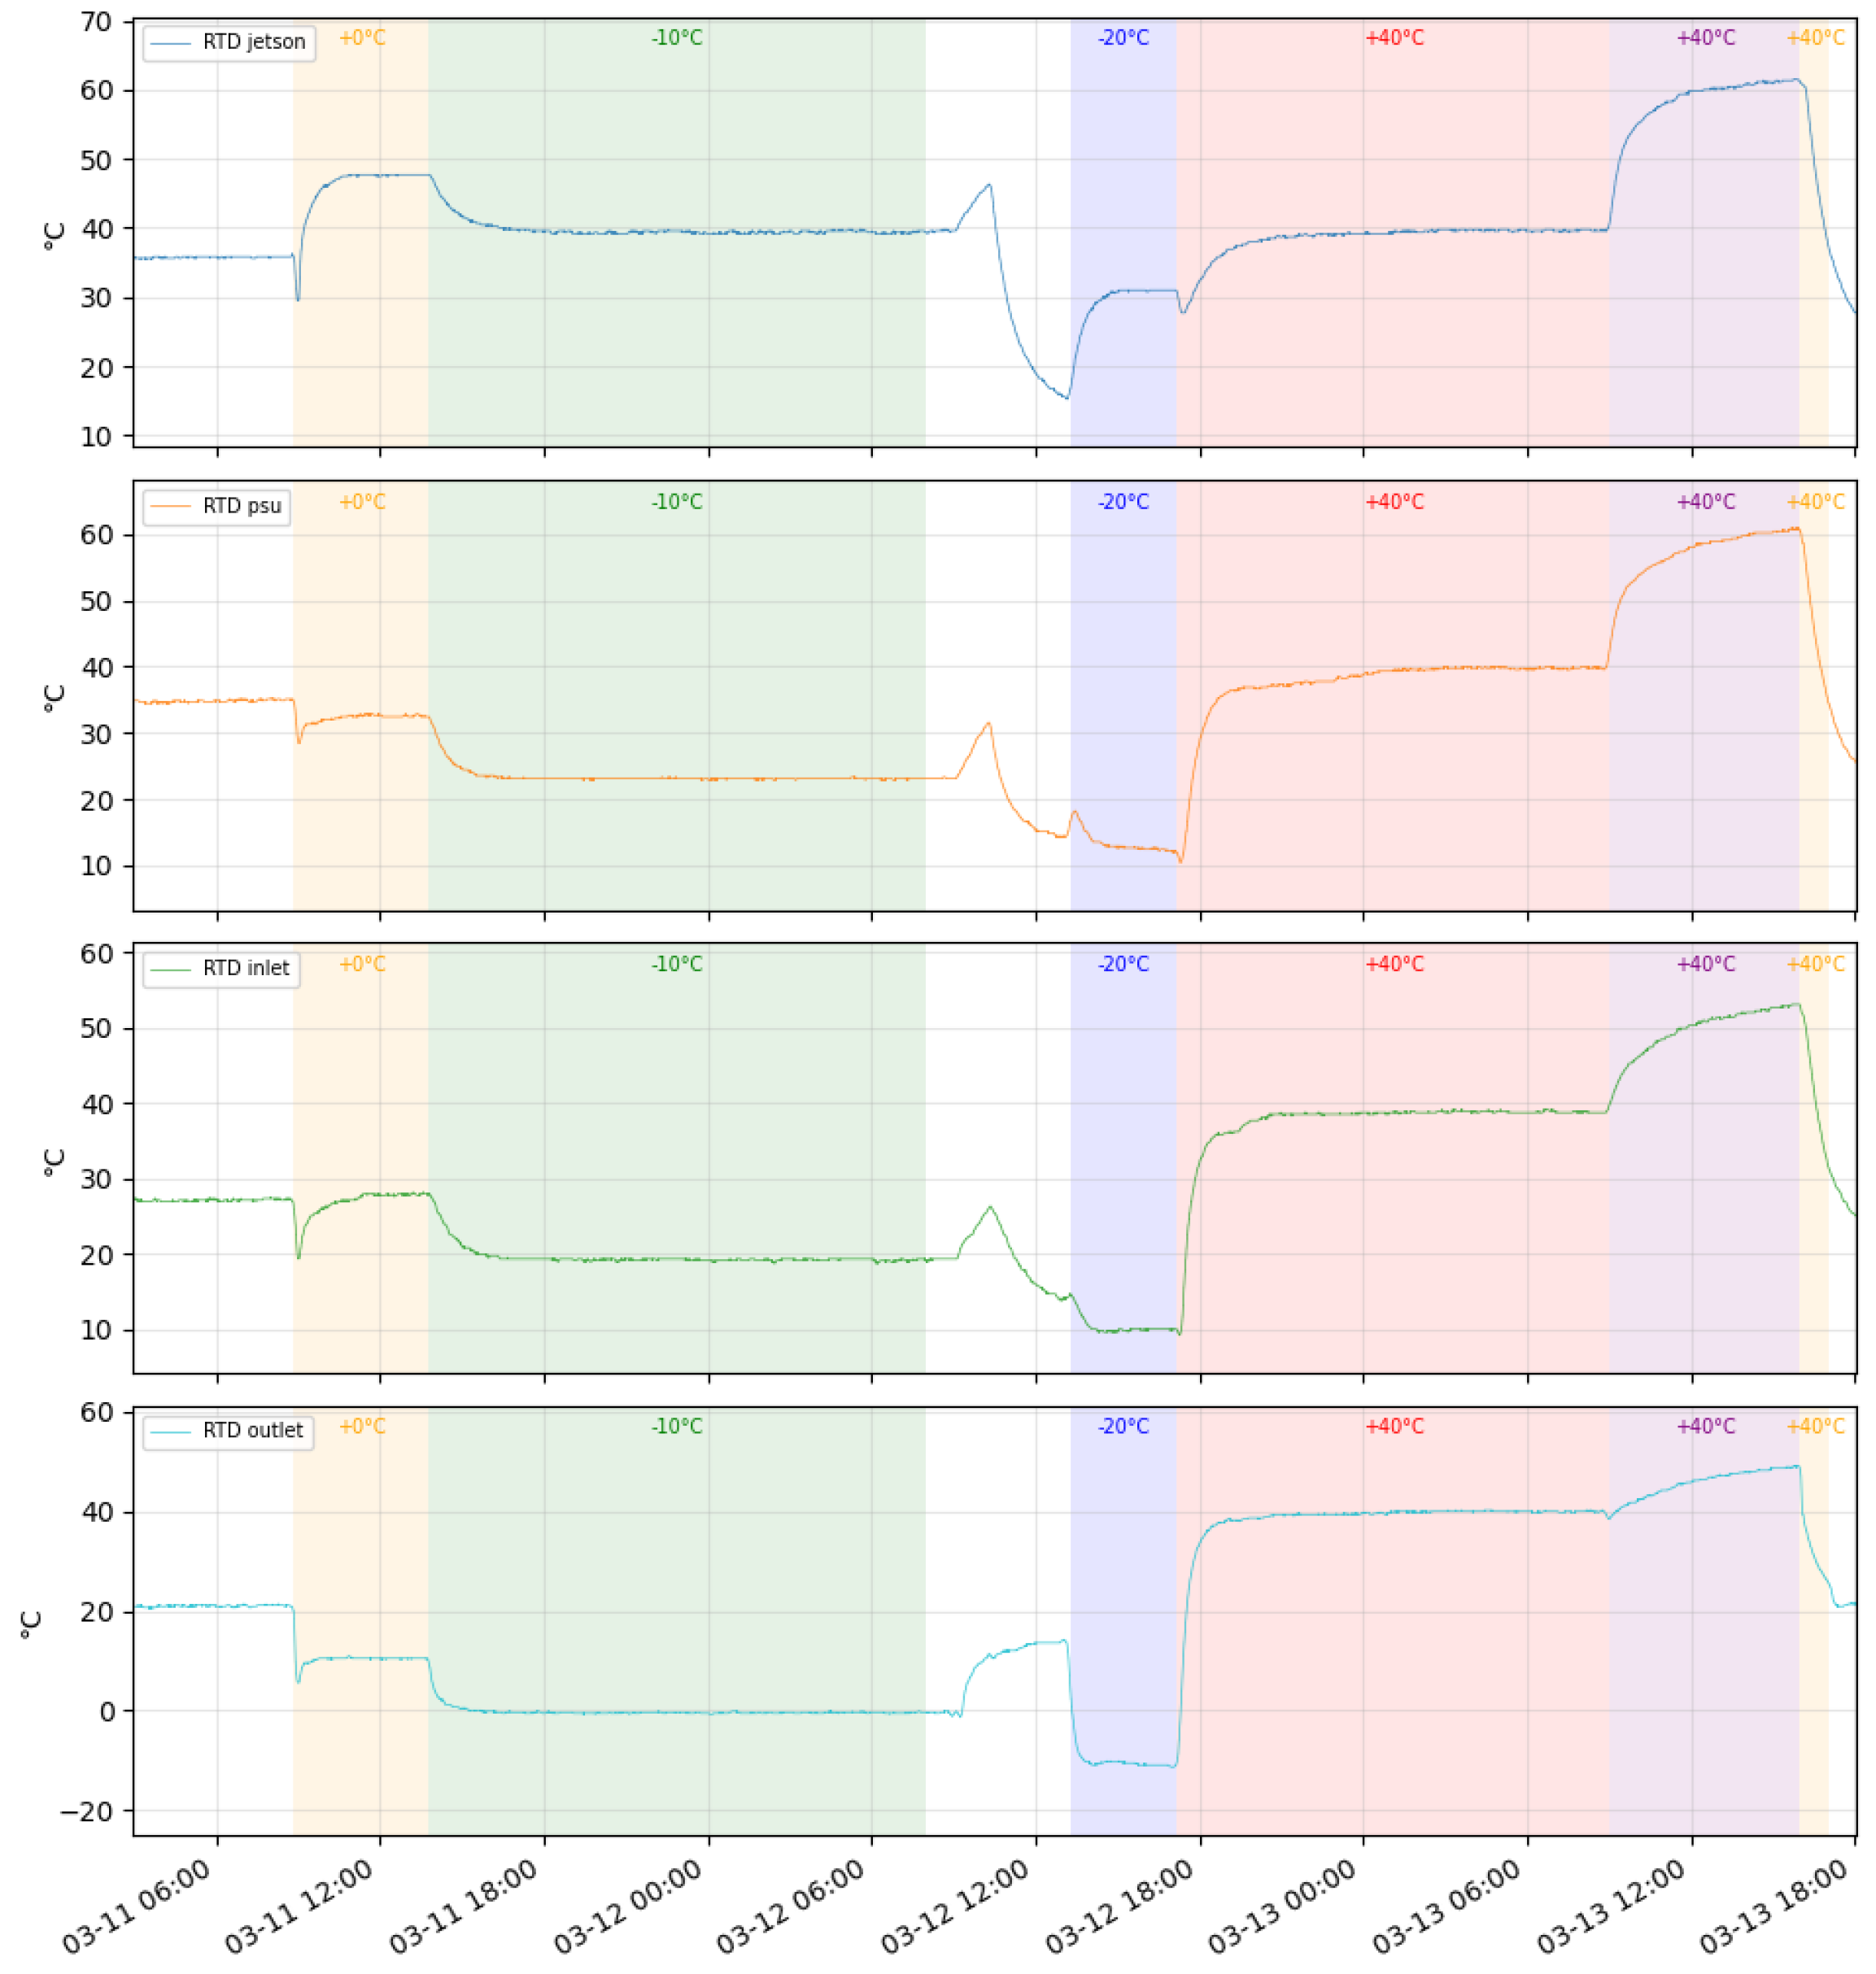
As can be seen in Figure 5, the internal enclosure air temperature stabilizes approximately 30 °C above the chamber setpoint as long as the cooling fan remains off, which is the case in all sub-zero tests. This delta drives the internal temperature toward the +30 °C thermostat threshold when the chamber setpoint reaches roughly +15 °C to +20 °C, at which point the thermal relay activates the fan. Once the fan is active, forced airflow reduces the internal-to-ambient delta to only +5 °C to +7 °C, as seen in the +40 °C portion of the figure where, the RTD inlet tracks the chamber temperature closely.
Figure 5.
Internal RTD readings (Jetson, PSU, Inlet, Outlet) across the full stress-test sequence. Background colors mark the chamber setpoint for each phase. With the cooling fan inactive at sub-zero setpoints, internal air temperature stabilizes approximately °C above ambient. Once the chamber setpoint reaches roughly +15 to +20 °C, the thermal relay activates the fan, and the internal-to-ambient delta collapses to +5 to +7 °C, visible in the +40 °C phases on the right.
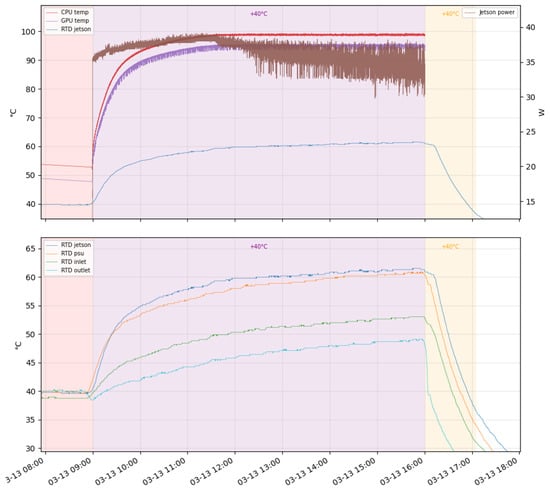
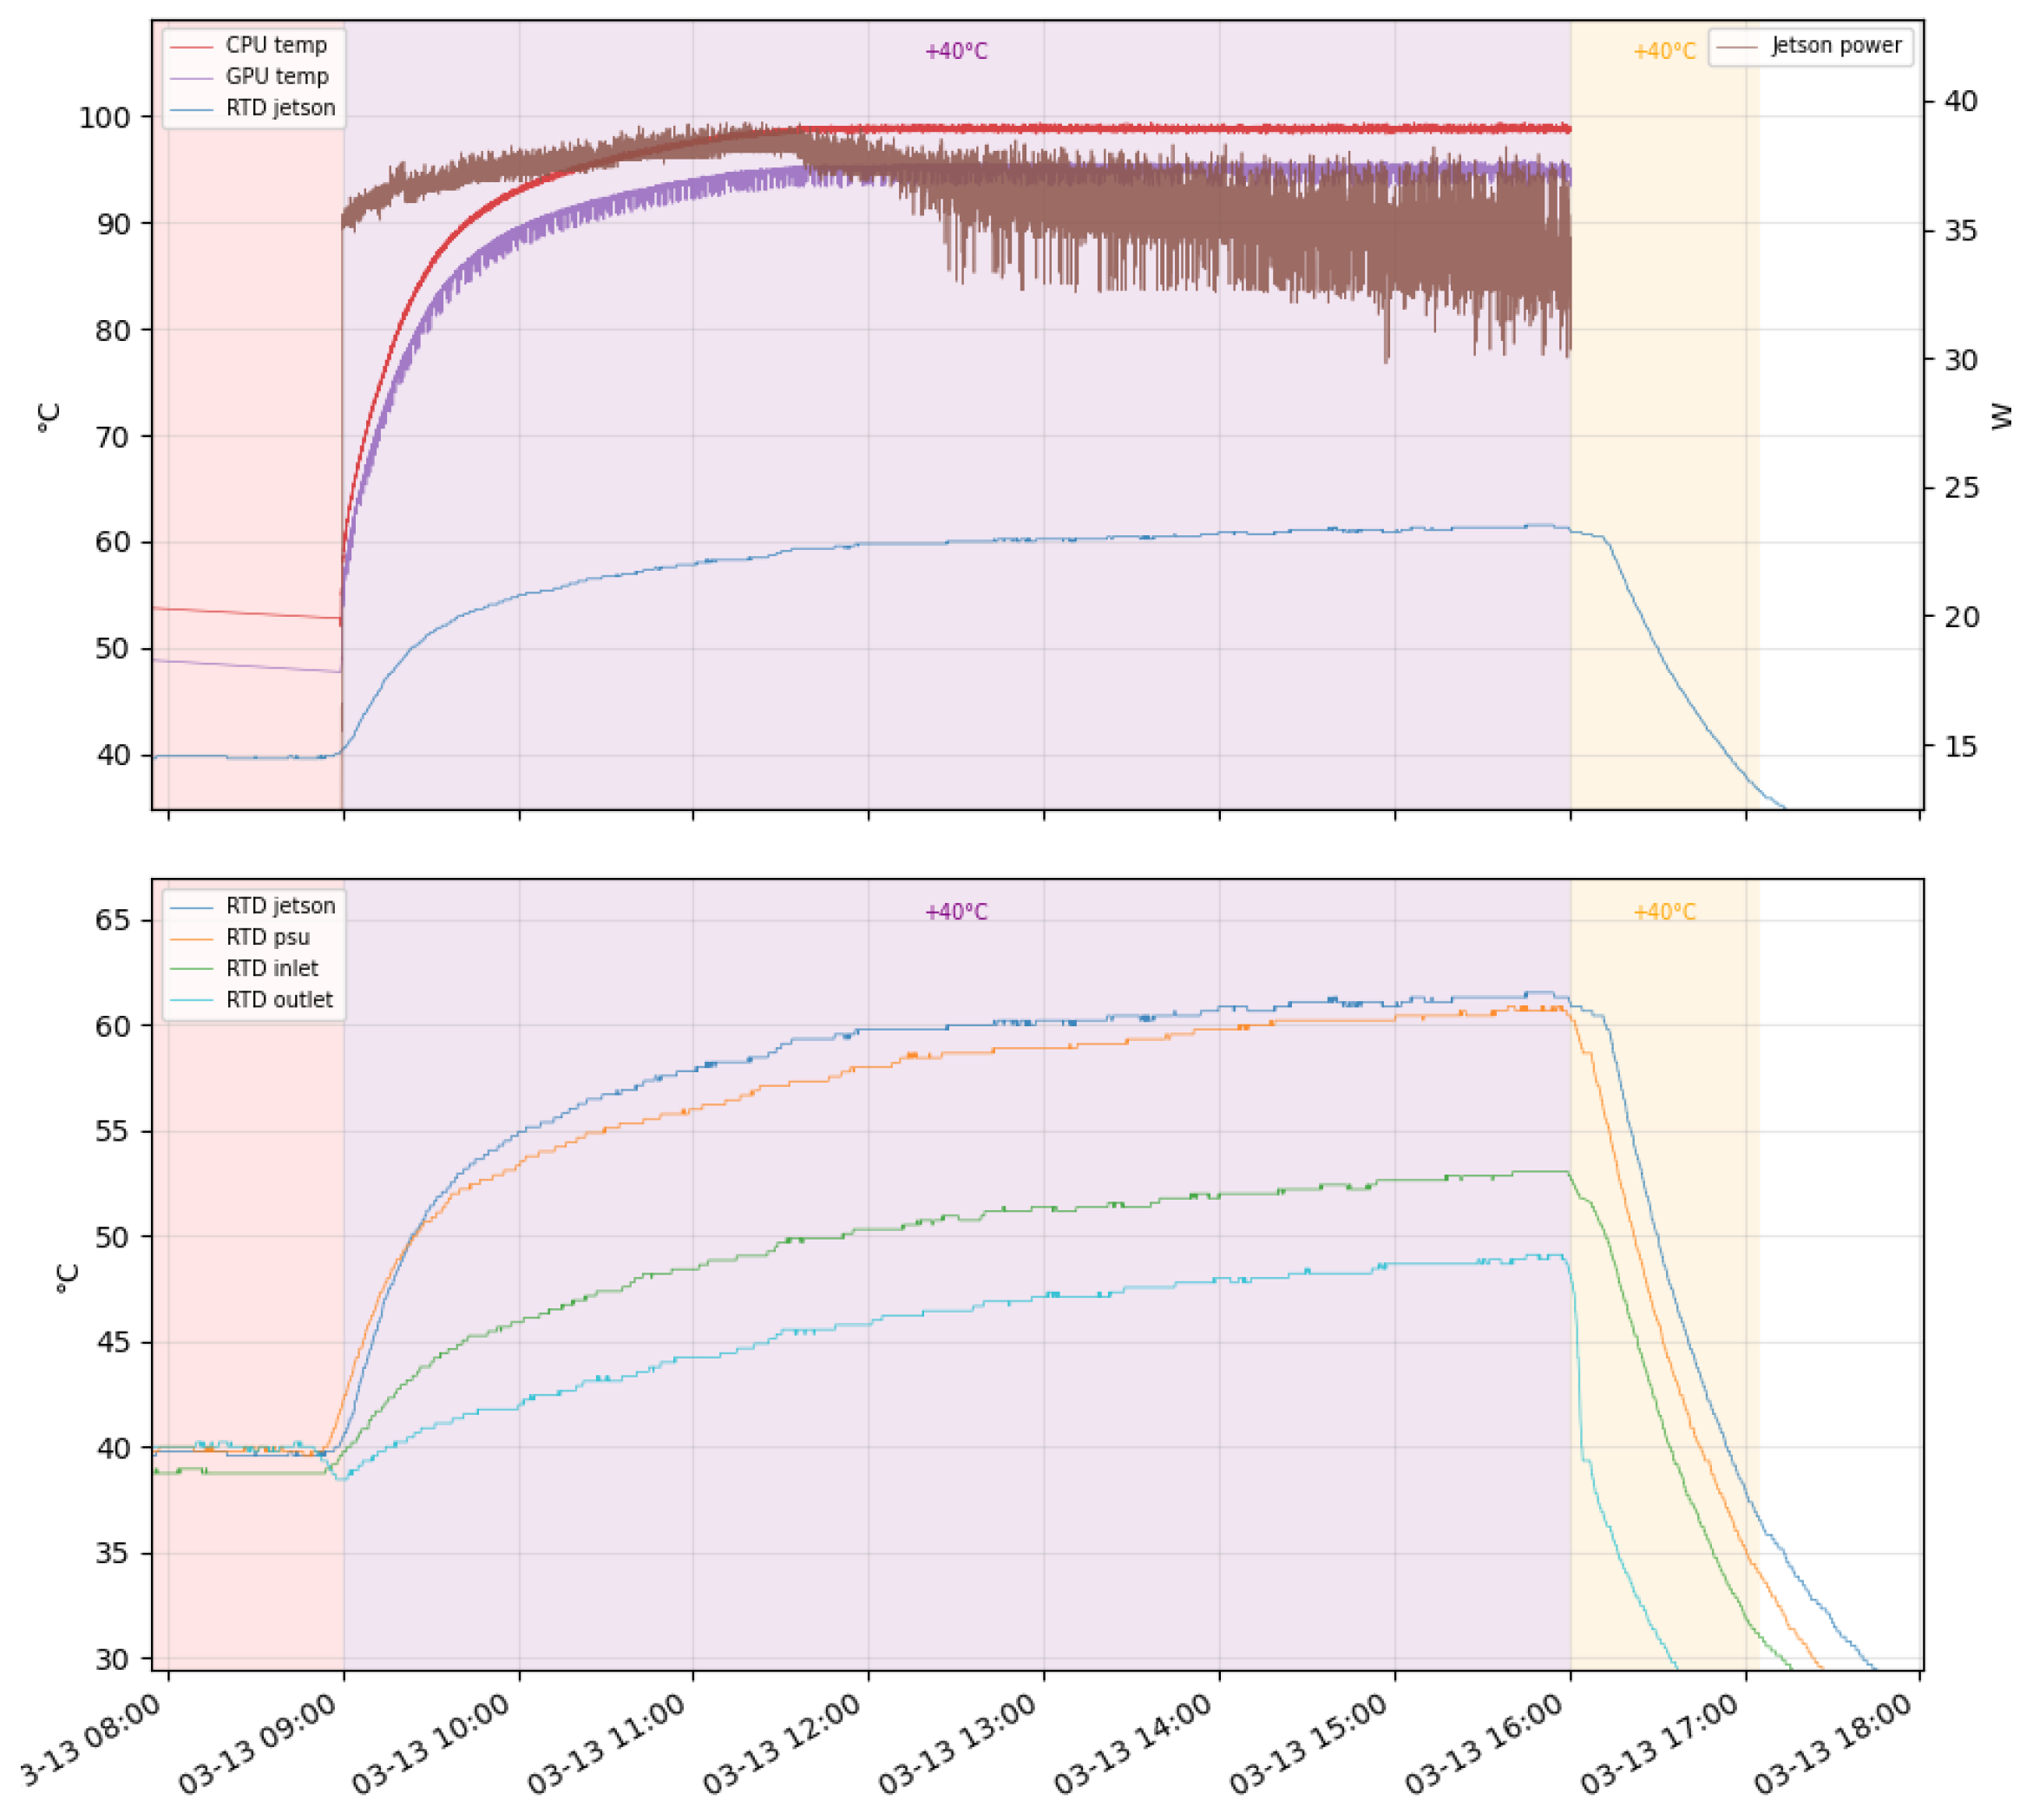
Figure 6 shows that thermal throttling of the Jetson begins when the GPU temperature reaches approximately +95.6 °C and the CPU temperature about +99.0 °C. This behavior is evident from a noticeable drop in power consumption accompanied by significant fluctuations, indicating that the system is actively reducing performance to prevent exceeding critical temperature limits. After throttling is initiated, both CPU and GPU temperatures stabilize. At the same time, the figure demonstrates that the temperatures of other system components continue to rise despite the stabilization of the Jetson CPU and GPU temperatures.
Figure 6.
Combined view of the °C stress test: top panel shows Jetson CPU temperature, GPU temperature, RTD Jetson, and total Jetson power consumption (right axis); bottom panel shows the four enclosure RTDs. After approximately two and a half hours, the system reaches the throttling threshold; the resulting drop and oscillation in power consumption are clearly visible at the right of the top panel. RTDs in the lower panel continue to rise even after CPU/GPU temperatures stabilize.
These results indicate that, in the current configuration, the upper limit of the ambient temperature (+40 °C) is constrained by the cooling capability of the Jetson system.
4.2. Inference Workload Results
In real-world operation, the workload on the Jetson does not always fully utilize the CPU and GPU, resulting in lower heat generation. To evaluate how much less heat is produced and how power consumption differs under an inference workload compared to a synthetic stress test, a maximum ambient temperature of °C was selected based on the previous experiment.
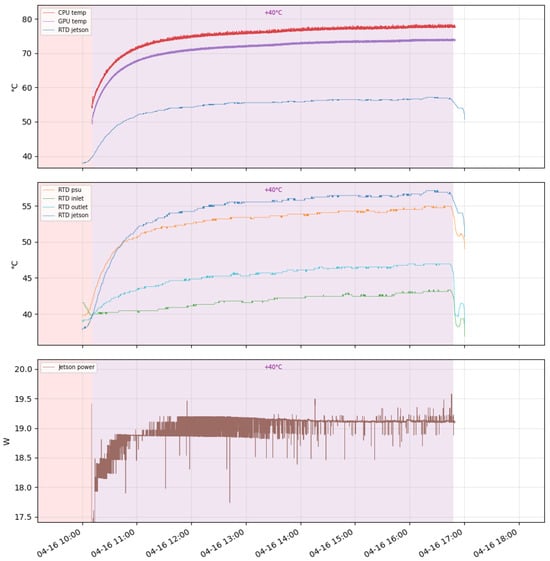
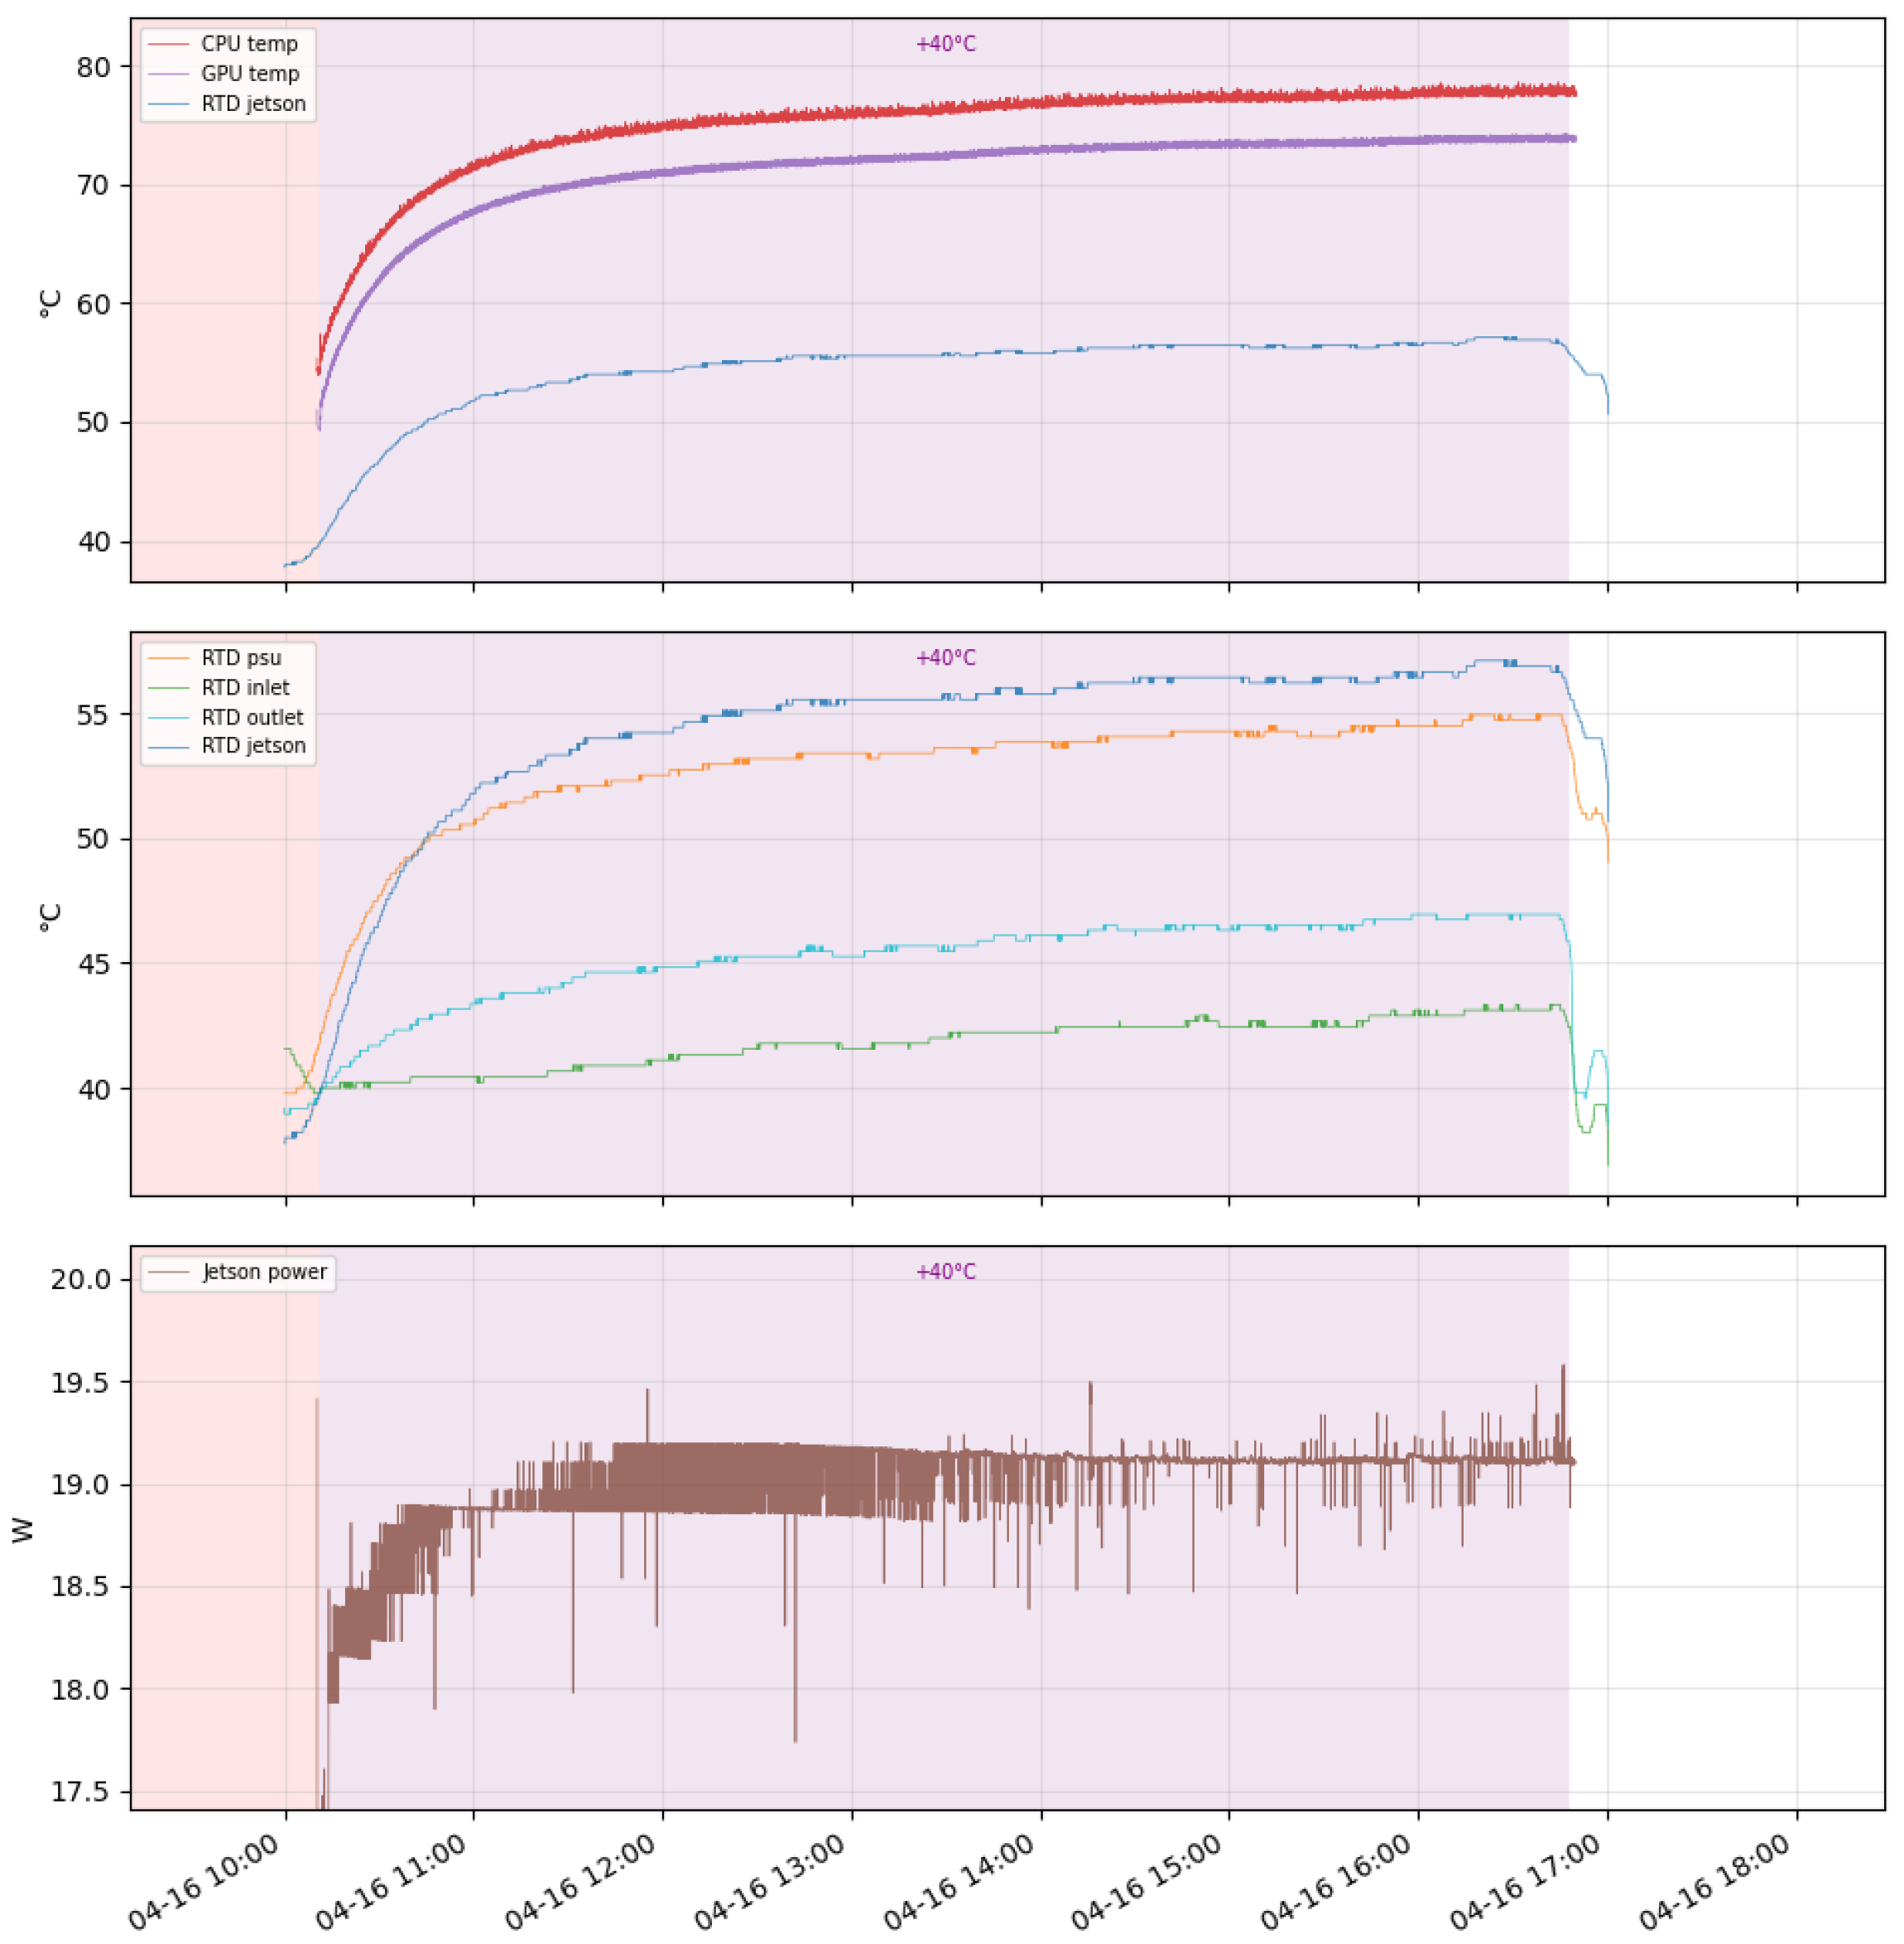
Figure 7 shows the internal DUT and Jetson temperatures, as well as Jetson power consumption during the YOLO benchmark. Compared to Figure 6, CPU and GPU temperatures are well below the throttling threshold and power consumption is approximately halved.
Figure 7.
Inference workload (YOLOv8s, TensorRT FP16, 640 × 640) at +40 °C ambient. Top panel: Jetson CPU and GPU temperatures, and RTD Jetson; middle panel: enclosure RTDs; bottom panel: zoomed-in view of Jetson power consumption (≈19 W steady state). Compared to the stress test (Figure 6), CPU and GPU temperatures plateau around +75 °C, well below the throttling threshold, and total power is approximately halved.
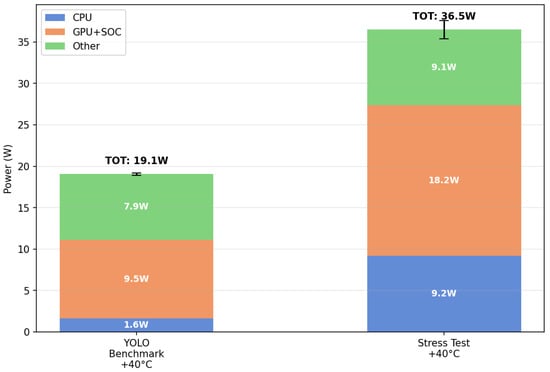
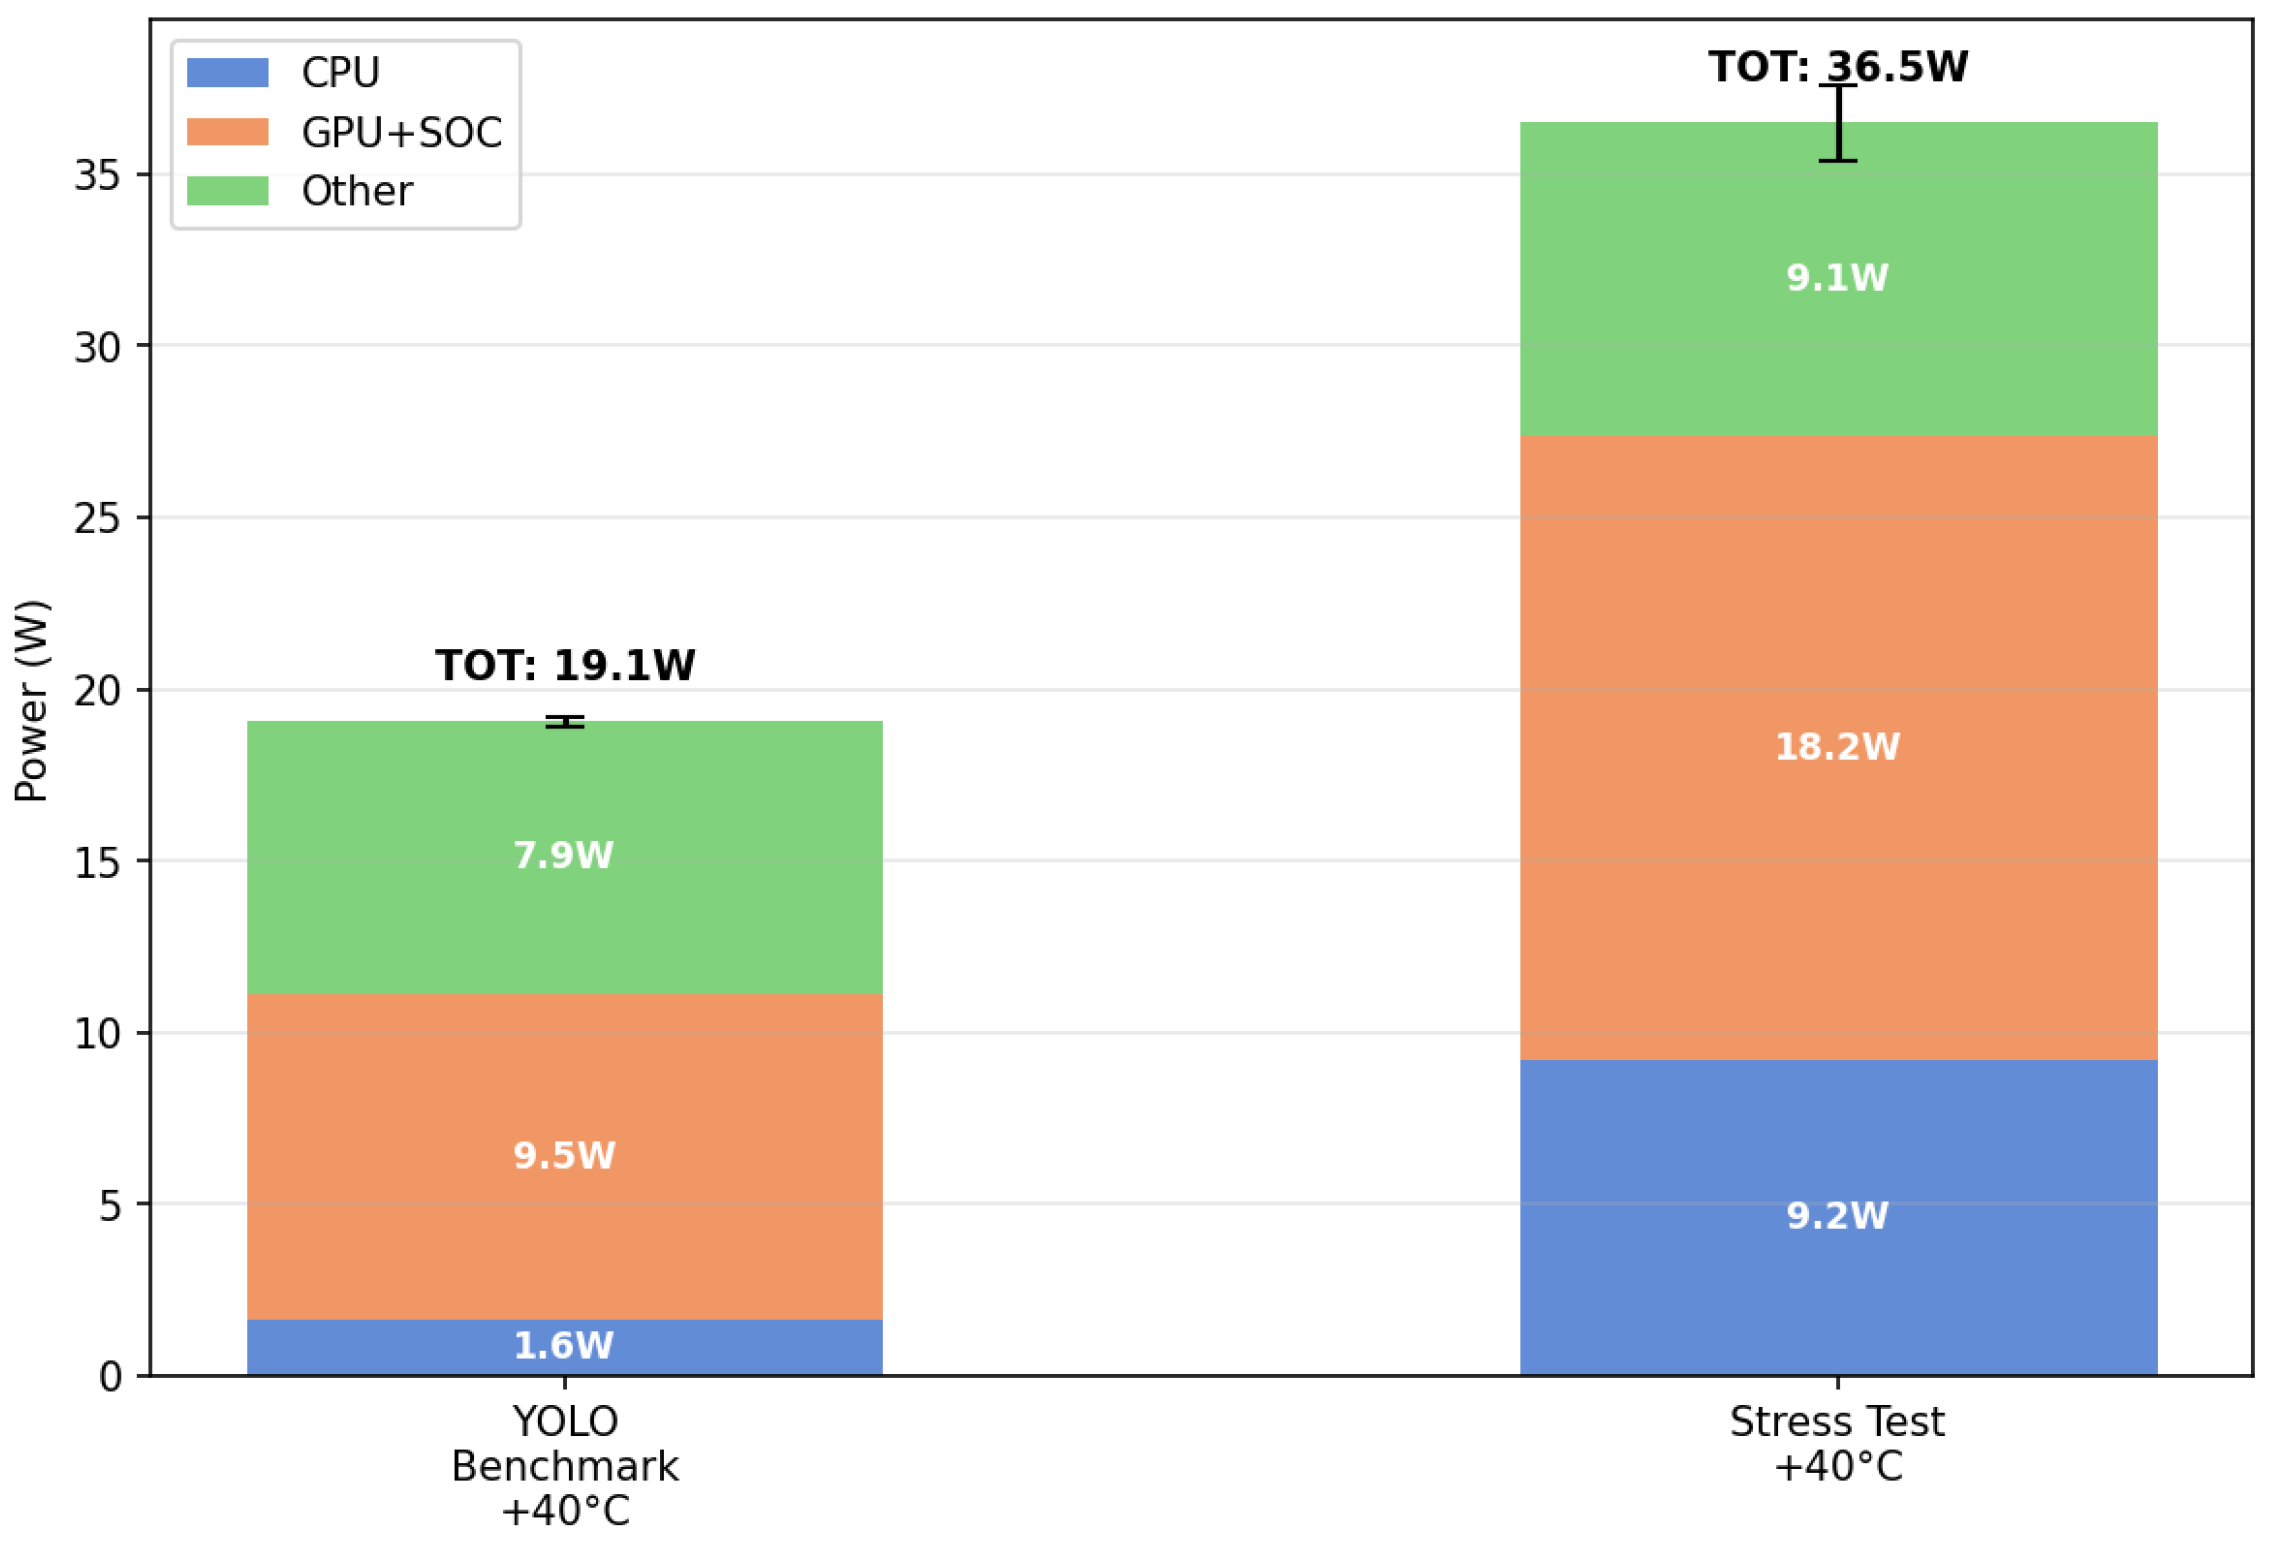
Figure 8 shows how power consumption differs between the stress test and YOLO benchmark. As observed during the inference test, the CPU consumes less than 10% of the total power, while the GPU consumes about half. This is consistent with the workload only partially exercising both compute units: under YOLOv8s, the CPU and GPU operate at lower sustained utilization, compared to the near-100% utilization driven by the synthetic stress test.
Figure 8.
Mean power breakdown of the Jetson AGX Orin during the YOLO inference workload (left, 19.1 W total) and the synthetic stress test (right, 36.5 W total) at +40 °C ambient. Stacked bars decompose total power into CPU, GPU + SoC, and “Other” rails (memory, I/O, system overhead). Error bars indicate the standard deviation of the steady-state interval. The CPU rail drops ≈5.7× between workloads, GPU + SoC drops ≈1.9×, while “Other” is nearly unchanged, indicating that most of the workload-dependent variation comes from the CPU and GPU compute rails.
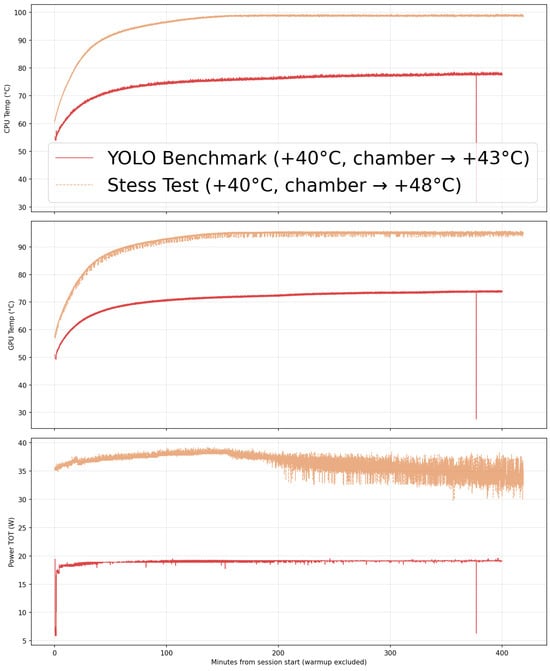
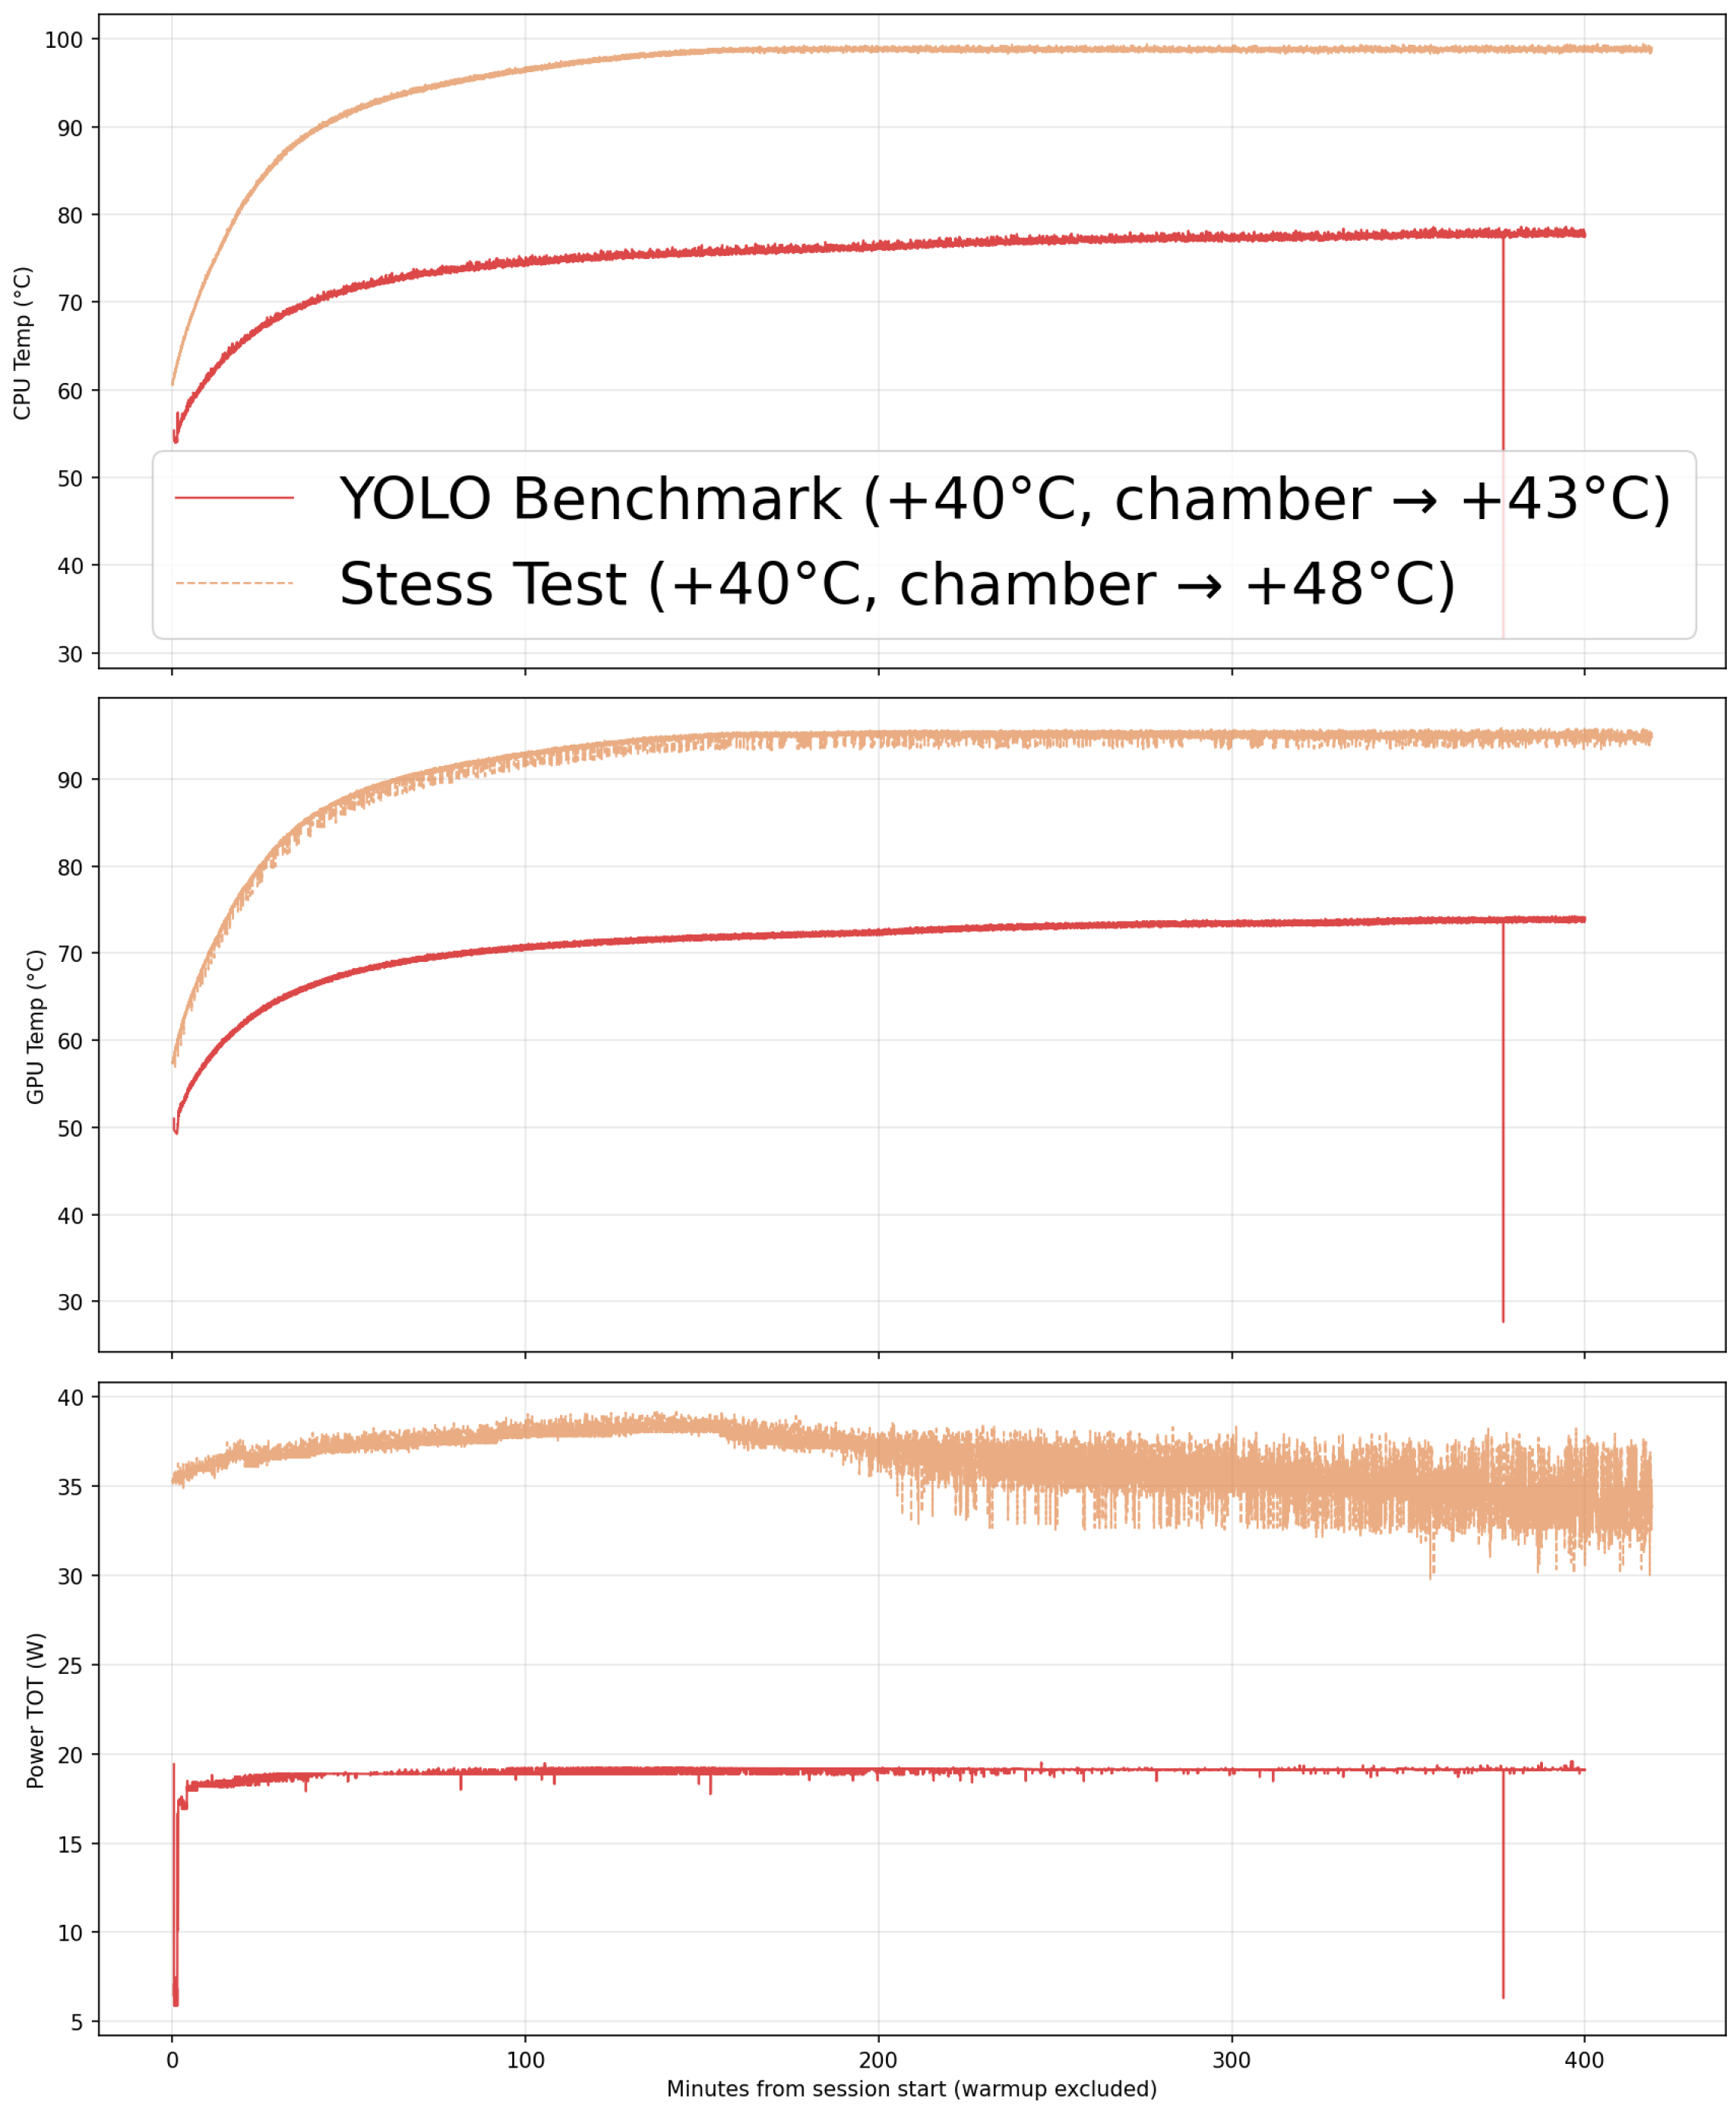
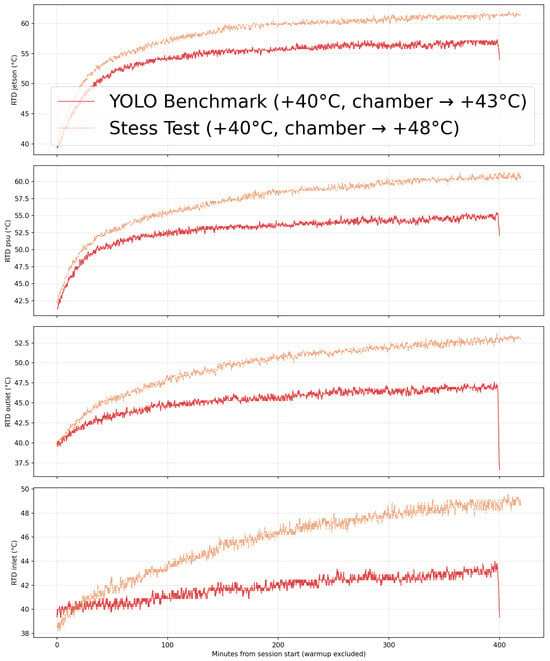
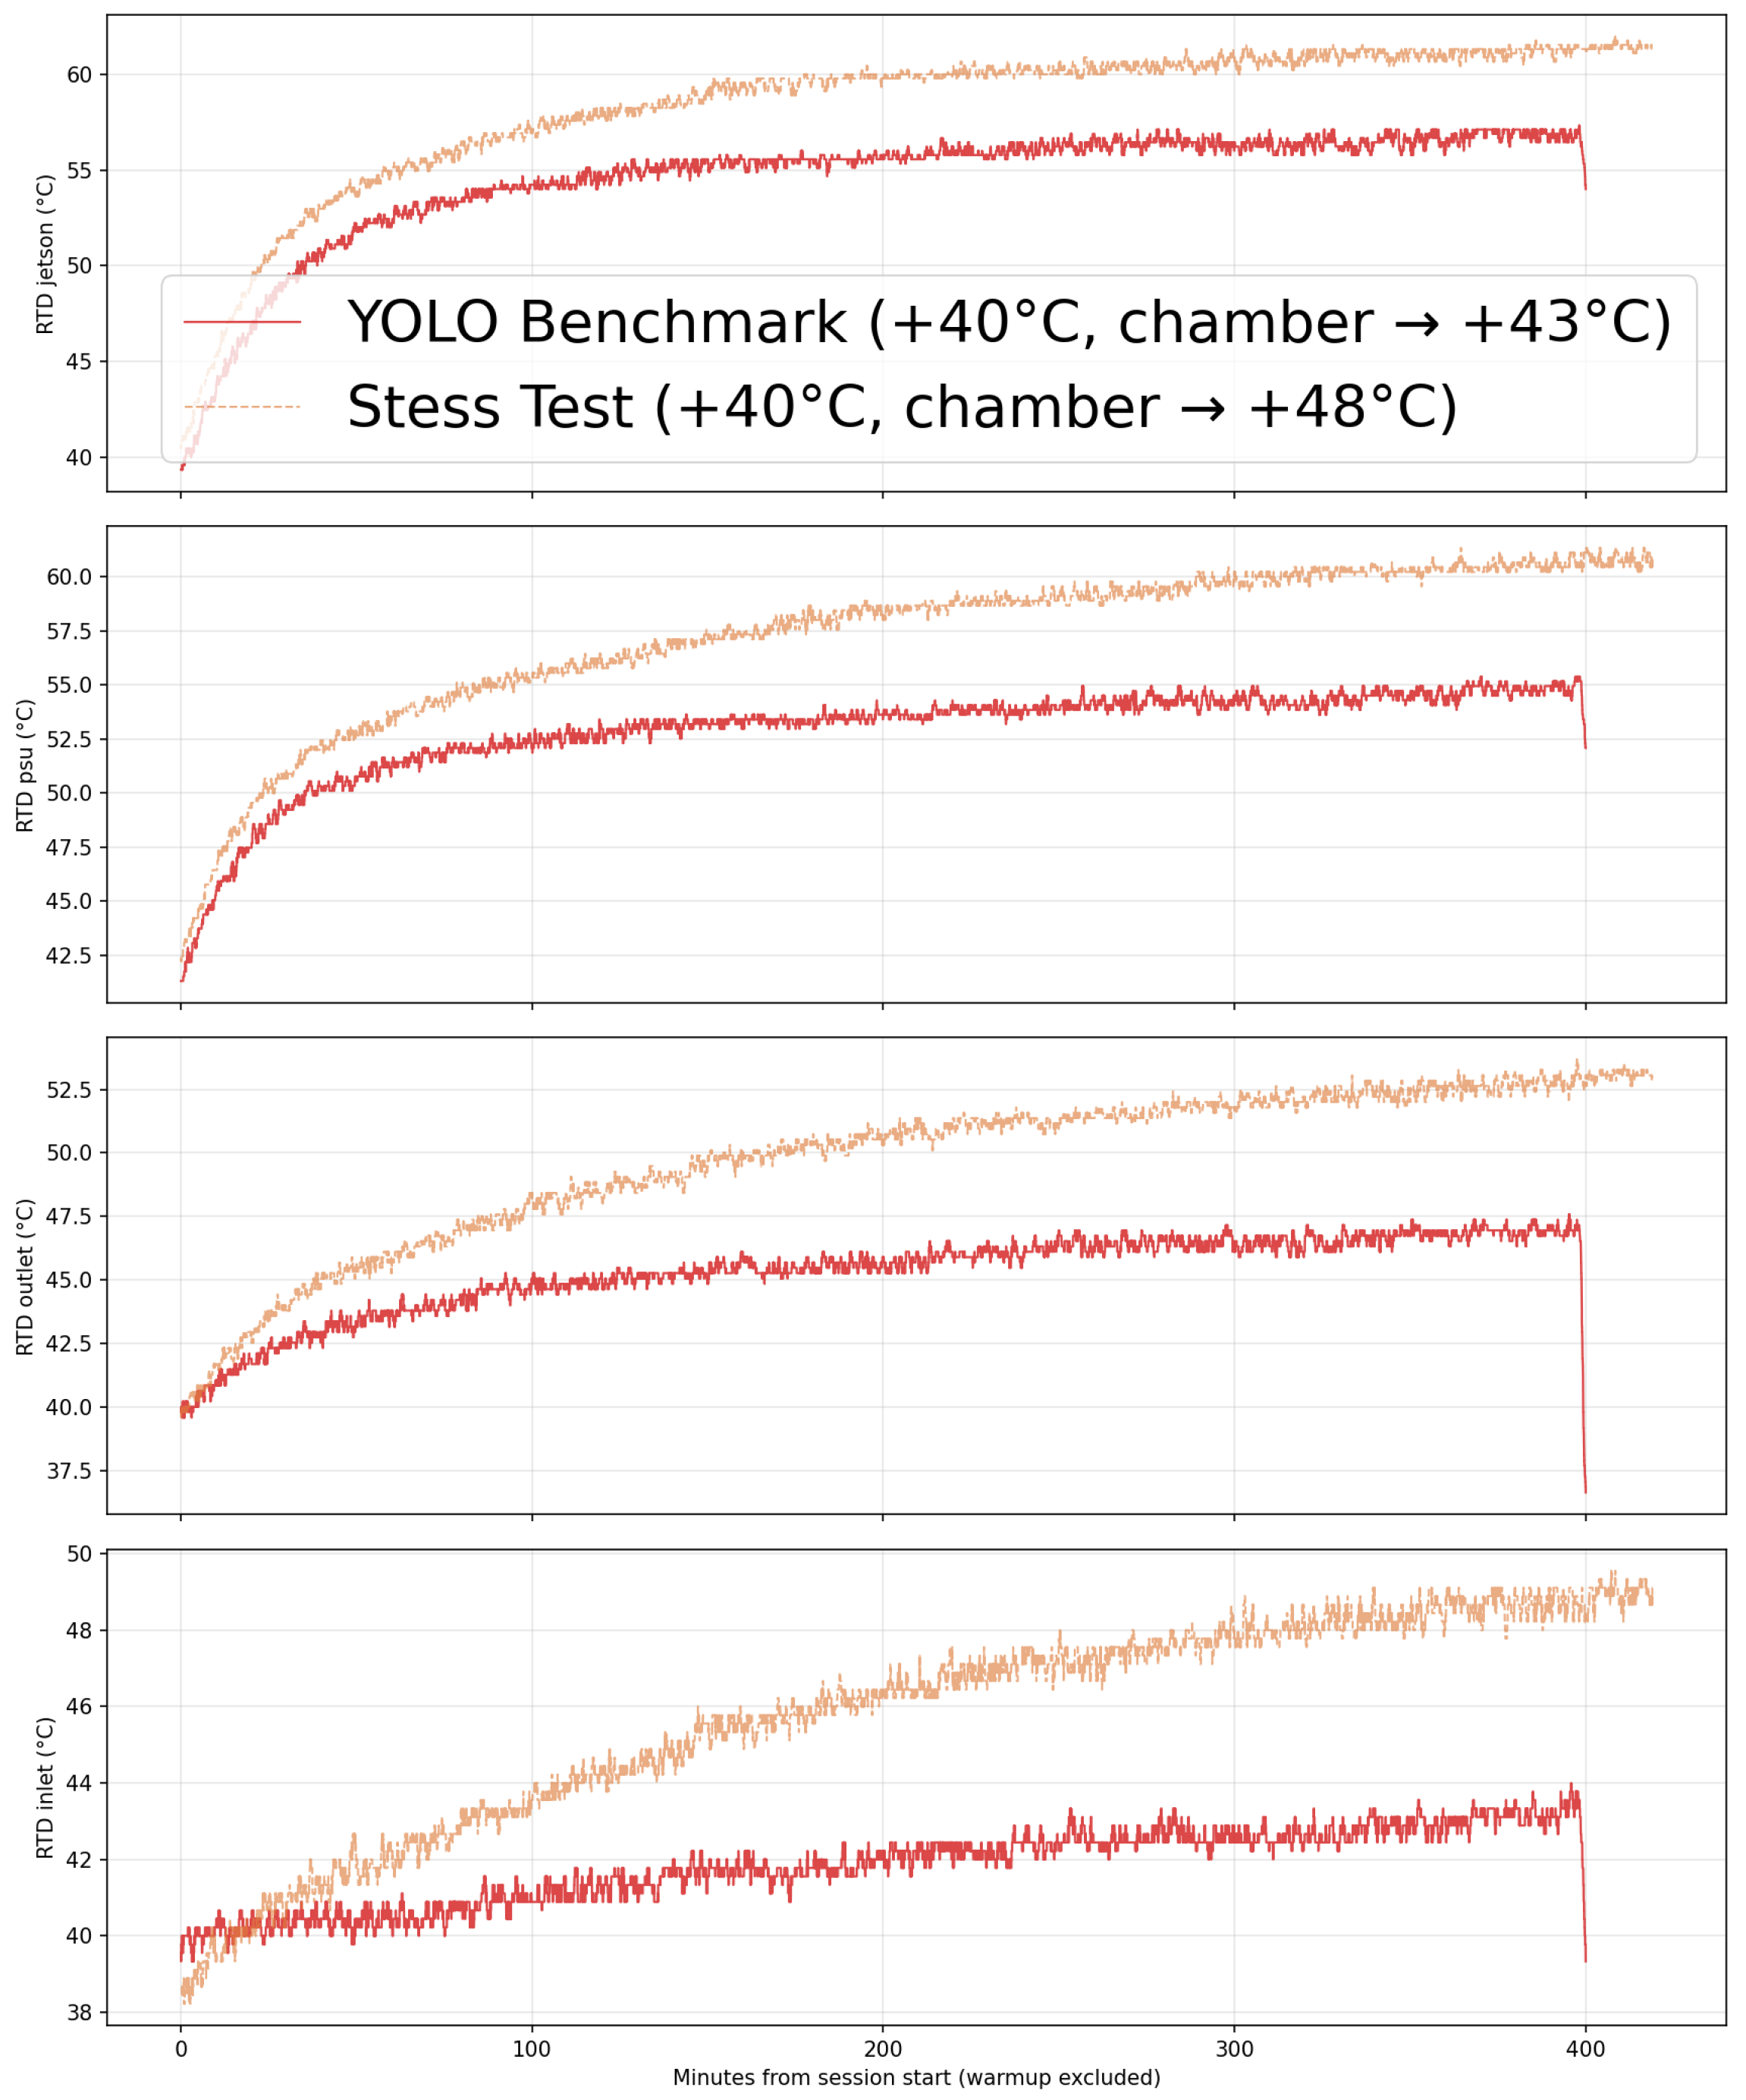
Figure 9 and Figure 10 show that across all temperature and consumption parameters (Inner DUT and Inner Jetson), the YOLO benchmark applies less load to the system. As expected, at an ambient temperature of °C, where the Jetson began thermal throttling during the stress test, in this test, the CPU and GPU do not reach the throttling threshold. Additionally, due to the lower workload and reduced power demand, the power supply units also generate less heat.
Figure 9.
Side-by-side thermal response of the Jetson chip during the YOLO inference workload (red) and the stress test (orange), both at +40 °C ambient. Top to bottom: CPU temperature, GPU temperature, and total Jetson power consumption. The stress test reaches the throttling threshold within ≈150 min, while inference plateaus well below it for the entire test.
Figure 10.
Side-by-side RTD response during the YOLO inference workload (red) and the stress test (orange) at +40 °C ambient. Top to bottom: RTD Jetson, RTD PSU, RTD Outlet, RTD Inlet. All four sensors show consistently lower equilibrium temperatures under inference, reflecting reduced heat generation across the entire enclosure rather than just at the Jetson module.
Because the YOLO benchmark loads the system far less than the stress test, the platform operates with substantial thermal margin under this workload, suggesting that the Jetson AGX Orin is a suitable choice for similar inference applications.
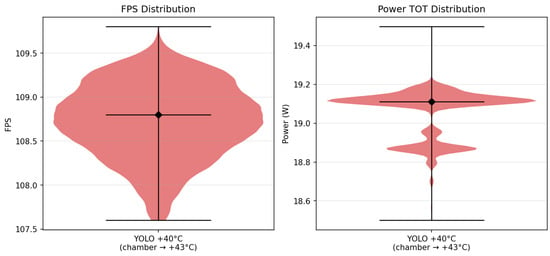
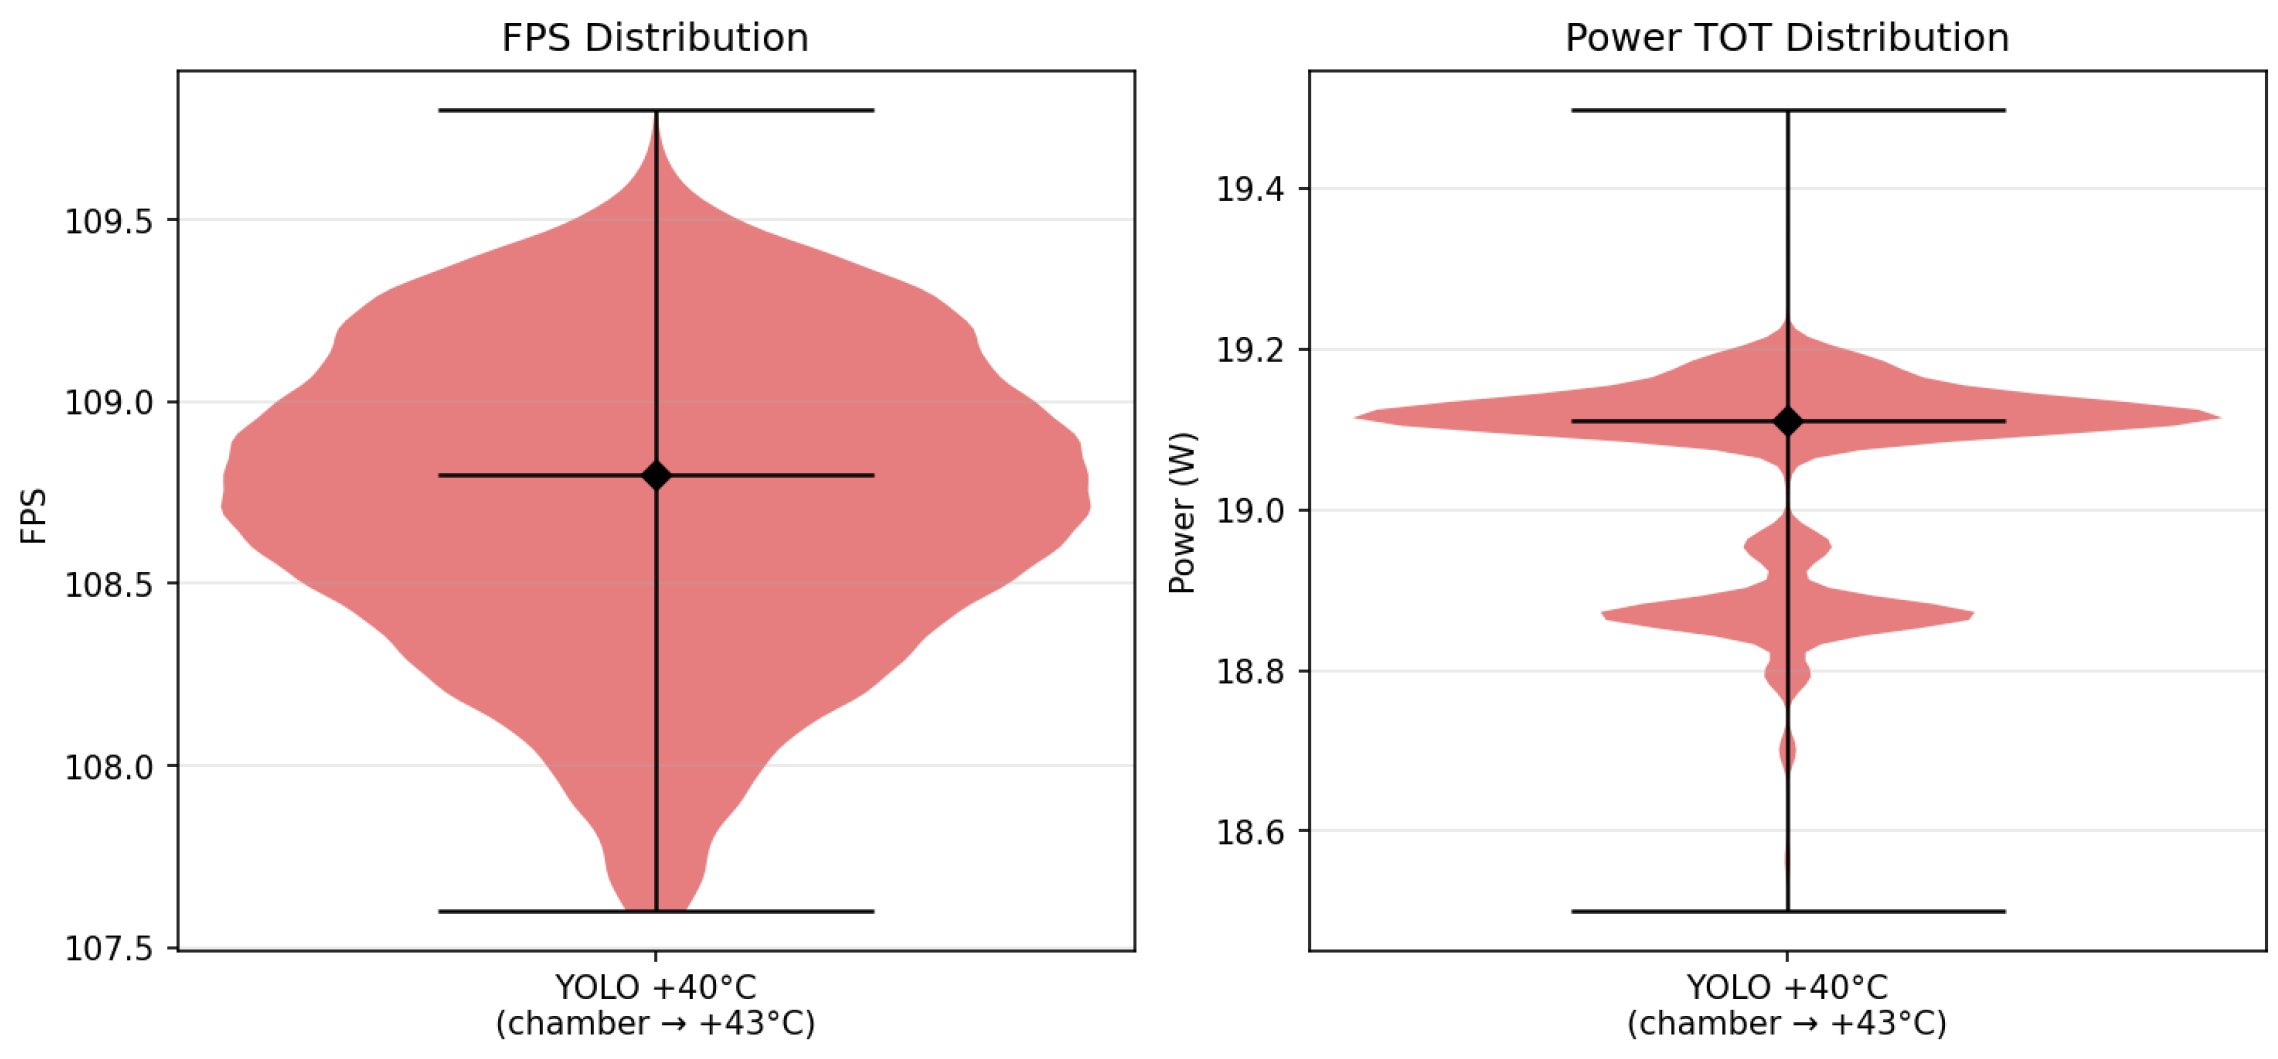
The data collected from the YOLO benchmark during the inference test showed that it operated stably with an almost constant frame rate of approximately 108.8 frames per second under a consistent load. The summary of the YOLO benchmark frame rate (FPS) data is presented in Figure 11.
Figure 11.
Steady-state performance distribution of the YOLO inference workload at +40 °C ambient (chamber drifted to ≈+43 °C during the run). Left: per-frame inference rate, with a designated median of ≈108.8 FPS and a tight distribution between 108.0 and 109.5 FPS. Right: total Jetson power, with a designated median of ≈19.1 W. The narrow spread of both metrics over the duration of the test confirms stable operation without thermal-throttling-induced performance degradation.
5. Discussion
The results presented in Section 4 can be interpreted in two complementary ways: in relation to the manufacturer’s published thermal limits, and in terms of the GPU utilization characteristics of the tested workload.
The thermal throttling thresholds observed in our measurements (GPU ≈ +95.6 °C, CPU ≈ +99.0 °C) align closely with the recommended operating temperature limit for the Orin SoC documented in the manufacturer’s thermal design guide [32]. This agreement validates the measurement chain (calibrated RTDs, tegrastats, jtop) and confirms that the AGX Orin in our deployment behaves consistently with the published thermal management strategy.
Compared to prior characterizations of ambient temperature impact on Jetson platforms, our findings extend the picture in two respects. The closest comparator, Ahmadi et al. [17], reports up to 40% variation in power consumption due to ambient temperature on the Jetson TX2 under inference workloads. We do not perform a comparable statistical sweep of inference power across our full ambient range, but we observe a consistent qualitative direction: ambient temperature meaningfully affects sustained edge inference. Earlier studies on the Jetson Nano and TX1 platforms [13,14] characterize compute and power behavior at fixed ambient temperatures only, and do not capture the interaction between workload, ambient, and enclosure-level thermal management that is visible in our closed-enclosure setup. A follow-up to that work [33] proposes a thermal-aware reinforcement-learning framework that adjusts CPU, GPU, and memory-controller frequencies in response to measured platform temperature on the same TX2 platform, confirming that ambient-driven thermal effects are large enough on edge devices to motivate dedicated runtime mitigation; our results indicate that, on the AGX Orin under the tested inference workload, the existing thermostat-controlled fan keeps chip temperatures well below throttling onset across the full ambient range; thus, such runtime mitigation is not required for this workload class on this platform.
The approximately twofold reduction in total Jetson power between the synthetic stress test ( W) and the YOLOv8s inference workload ( W) is consistent with the inference workload not fully exercising the platform’s compute capacity. The per-rail decomposition in Figure 8 shows that this reduction is highly asymmetric: the CPU rail drops by approximately between workloads, the GPU + SoC rail by approximately , while the “Other” rail (memory, I/O, system overhead) is nearly unchanged. The implication for deployment is twofold. First, workload-dependent power variation is dominated by the compute rails (CPU and GPU + SoC), while system-level overhead remains roughly constant. This means that for workloads lighter than the stress test, the “Other” rail forms a non-negligible fixed cost: it accounts for roughly 41% of total Jetson power under inference but only 25% under the stress test. Second, optimization strategies that target only the compute rails will yield diminishing returns as the fixed overhead becomes the dominant component of total consumption. For thermal management, the result is that at +40 °C ambient, the Jetson module itself is the bottleneck; under the tested inference workload, the same thermostat-controlled fan keeps the system within operating limits, so no additional active cooling is required for deployments whose workload profile matches YOLOv8s or lighter. In field deployments, the workload itself is also dynamic; detection rate varies with scene content, traffic volume, and time of day, so the 19.1 W inference figure represents a sustained worst case for this workload class rather than a continuous draw, and headroom relative to the +40 °C throttling onset will in practice be larger than the steady-state measurement suggests.
Several limitations should be considered when generalizing the results presented here. A single device was tested, so inter-unit variance in the AGX Orin’s thermal and power behavior is not characterized. Similarly, only a single inference workload (YOLOv8s) was evaluated end-to-end; together with the synthetic stress test, it brackets the operating envelope, with the stress test as the worst-case upper bound and YOLOv8s as the realistic deployed case, but intermediate workloads were not directly measured. The climate chamber used in this study does not provide active cooling at the +40 °C setpoint, and the chamber temperature drifted to +48 °C over the course of the test as it equilibrated with the heat dissipated by the DUT and the surrounding environment. The device’s behavior between these temperatures is therefore characterized by the endpoints rather than a continuously controlled sweep, and the drift was not recorded in detail. In a real outdoor deployment, the ambient is similarly uncontrolled and drifts with solar load, wind, and time of day, so the +48 °C reached during the drift is informative as an upper-envelope data point: the Jetson sustained throttled operation at this temperature without component failure, but operation in this regime is degraded (reduced clocks, fluctuating power) and should be treated as a transient tolerance rather than a steady-state design target. Finally, long-term reliability factors relevant to outdoor deployment, such as fan wear, dust ingress, and the effect of repeated thermal cycling, were not assessed. These factors directly affect the +40 °C upper limit established in this work: the limit assumes the thermostat-controlled fan operates at rated airflow, so fan degradation or partial inlet blockage by dust would shift the throttling onset to a lower ambient, and repeated diurnal thermal cycling between sub-zero and warm setpoints may accelerate solder-joint and connector fatigue over multi-year deployments [34]. Extending the experiments to multiple AGX Orin units and to a broader workload set (transformer detectors, multi-stream pipelines, larger YOLO variants) is left for future work.
6. Conclusions
This work presented a thermal and power characterization of the NVIDIA Jetson AGX Orin integrated into a realistic commercial enclosure across an ambient temperature range from °C to °C, under two workloads:
- Synthetic stress test;
- YOLOv8-based inference workload.
At sub-zero ambient temperatures, heat generated by the internal components partially compensates for the cold environment, keeping the components within their operating ranges down to °C. At the upper end of the tested range, the Jetson CPU approached the °C throttling threshold, with thermal throttling activating at GPU/CPU temperatures of approximately °C and °C. In one stress test, the chamber drifted from °C to °C, which triggered thermal throttling, evident from a noticeable drop in power consumption accompanied by significant fluctuations. This indicates that, in the present configuration, the upper ambient limit of °C is constrained by the cooling capability of the Jetson module itself rather than by the surrounding components or the enclosure.
Under the tested inference workload at °C ambient, the Jetson consumed on average 19.1 W, compared to 36.5 W under the stress test, and CPU/GPU temperatures remained well below the throttling threshold. This demonstrates that synthetic stress tests overestimate the thermal and power demands compared to the tested inference workload, and that the platform operates with substantial thermal margin under this workload. The available margin for heavier or more parallel workloads cannot be inferred from the power gap alone, since memory bandwidth, sustained-thermal coupling, and post-processing load also affect achievable performance. Overall, the benchmark results show that the Jetson AGX Orin sustains stable CPU and GPU temperatures alongside consistent inference performance across the full tested ambient range from °C to °C, confirming it as a reliable and efficient platform for outdoor edge AI deployments.
Author Contributions
Conceptualization, J.J. and R.K.; methodology, J.O.; software, D.T.; validation, J.J., R.K. and J.O.; formal analysis, J.J.; investigation, V.M.; resources, V.M.; data curation, J.O.; writing—original draft preparation, D.T. and V.M.; writing—review and editing, R.K. and J.J.; visualization, J.O.; supervision, J.J.; project administration, J.J.; funding acquisition, R.K. All authors have read and agreed to the published version of the manuscript.
Funding
The present research has been conducted by Latvijas Mobilais Telefons SIA with the financial support from the Recovery and Resilience Facility (Project No. 5.1.1.2.i.0/2/24/A/CFLA/006), within the framework of the project of Competence Center of Electrical and Optical Equipment Production Sector of Latvia.
Informed Consent Statement
Not applicable.
Data Availability Statement
The original contributions presented in this study are included in the article. Further inquiries can be directed to the corresponding author.
Acknowledgments
During the preparation of this manuscript, the author(s) used ChatGPT (GPT-5, OpenAI) and Claude AI (Opus 4.7) for the purposes of English language editing and spell checking. The authors have reviewed and edited the output and take full responsibility for the content of this publication.
Conflicts of Interest
Some authors are employees of a mobile network operator Latvijas Mobilais Telefons SIA. However, no commercial products or services are evaluated and no sponsor influenced the conclusions.
Appendix A. Synthetic Stress Test Script
| #!/bin/bash |
| PIDS = () |
| cleanup () { |
| echo "Stopping all processes…" |
| for pid in "${PIDS[@]}"; do |
| kill "$pid" 2>/dev/null |
| done |
| pkill -9 stress |
| exit 0 |
| } |
| trap cleanup SIGINT SIGTERM |
| # Start recording system statistics with tegrastats util |
| echo "Starting tegrastats" |
| tegrastats --readall --logfile tegrastats.log & |
| PIDS+=($!) |
| # Start recording system statistics with python script with jtop library |
| echo "Starting jtop logger" |
| python3 ./jtop_logger.py & |
| PIDS+=($!) |
| sleep 10 |
| # Start CPU stress test |
| echo "Starting CPU stress test" |
| stress --cpu 8 --io 4 & |
| sleep 5 |
| # Start streaming from cameras |
| echo "Start of broadcast from cameras" |
| ffmpeg -rtsp_transport tcp -i "rtsp://root:{pass}@192.168.88.181/axis-media/media.amp?videocodec=h264&resolution=1920x1080&fps=13" -c copy -f null /dev/null -loglevel error & |
| PIDS+=($!) |
| ffmpeg -rtsp_transport tcp -i "rtsp://root:{pass}@192.168.88.182/axis-media/media.amp?videocodec=h264&resolution=1920x1080&fps=13" -c copy -f null /dev/null -loglevel error & |
| PIDS+=($!) |
| sleep 5 |
| # Start GPU stress test |
| echo "Starting GPU stress test" |
| cd ./jetson-gpu-burn |
| ./gpu_burn 1000000 |
References
- Andriulo, F.C.; Fiore, M.; Mongiello, M.; Traversa, E.; Zizzo, V. Edge Computing and Cloud Computing for Internet of Things: A Review. Informatics 2024, 11, 71. [Google Scholar] [CrossRef] [Scilit]
- Barthélemy, J.; Verstaevel, N.; Forehead, H.; Perez, P. Edge-Computing Video Analytics for Real-Time Traffic Monitoring in a Smart City. Sensors 2019, 19, 2048. [Google Scholar] [CrossRef] [Scilit]
- Cob-Parro, A.C.; Losada-Gutiérrez, C.; Marrón-Romera, M.; Gardel-Vicente, A.; Bravo-Muñoz, I. Smart Video Surveillance System Based on Edge Computing. Sensors 2021, 21, 2958. [Google Scholar] [CrossRef] [Scilit] [PubMed]
- NVIDIA Corporation. Celebrating More than 2 Million Developers Embracing NVIDIA Robotics. 2025. Available online: https://blogs.nvidia.com/blog/2-million-robotics-developers/ (accessed on 28 April 2026).
- Karumbunathan, L.S. NVIDIA Jetson AGX Orin Series Technical Brief, v1.2; Technical Report; NVIDIA Corporation: Santa Clara, CA, USA, 2022. [Google Scholar]
- Zidar, J.; Matić, T.; Aleksi, I.; Hocenski, Z. Dynamic Voltage and Frequency Scaling as a Method for Reducing Energy Consumption in Ultra-Low-Power Embedded Systems. Electronics 2024, 13, 826. [Google Scholar] [CrossRef] [Scilit]
- Benoit-Cattin, T.; Velasco-Montero, D.; Fernández-Berni, J. Impact of Thermal Throttling on Long-Term Visual Inference in a CPU-Based Edge Device. Electronics 2020, 9, 2106. [Google Scholar] [CrossRef] [Scilit]
- Zhou, Y.; Liang, F.; Chin, T.w.; Marculescu, D. Play It Cool: Dynamic Shifting Prevents Thermal Throttling. arXiv 2022, arXiv:2206.10849. [Google Scholar] [CrossRef] [Scilit]
- Valladares, S.; Toscano, M.; Tufiño, R.; Morillo, P.; Vallejo-Huanga, D. Performance Evaluation of the Nvidia Jetson Nano Through a Real-Time Machine Learning Application. In Proceedings of the Intelligent Human Systems Integration 2021; Russo, D., Ahram, T., Karwowski, W., Di Bucchianico, G., Taiar, R., Eds.; Springer: Cham, Switzerland, 2021; pp. 343–349. [Google Scholar]
- Gong, Y.; Wu, Y.; Zhan, Z.; Zhao, P.; Liu, L.; Wu, C.; Tang, X.; Wang, Y. LOTUS: Learning-based online thermal and latency variation management for two-stage detectors on edge devices. In Proceedings of the 61st ACM/IEEE Design Automation Conference; Association for Computing Machinery: New York, NY, USA, 2024. [Google Scholar] [CrossRef] [Scilit]
- Yan, M.; Wang, H.; Venkataraman, S. PolyThrottle: Energy-efficient Neural Network Inference on Edge Devices. arXiv 2023, arXiv:2310.19991. [Google Scholar] [CrossRef] [Scilit]
- Zou, Y.; Zhai, J.; Fang, C.; Chen, Z. GPU Temperature Simulation-Based Testing for In-Vehicle Deep Learning Frameworks. arXiv 2025, arXiv:2509.15815. [Google Scholar]
- Holly, S.; Wendt, A.; Lechner, M. Profiling Energy Consumption of Deep Neural Networks on NVIDIA Jetson Nano. In Proceedings of the 2020 11th International Green and Sustainable Computing Workshops (IGSC); IEEE: Piscataway, NJ, USA, 2020; pp. 1–6. [Google Scholar] [CrossRef] [Scilit]
- Halawa, H.; Abdelhafez, H.A.; Boktor, A.; Ripeanu, M. NVIDIA Jetson Platform Characterization. In Proceedings of the Euro-Par 2017: Parallel Processing; Rivera, F.F., Pena, T.F., Cabaleiro, J.C., Eds.; Springer: Cham, Switzerland, 2017; pp. 92–105. [Google Scholar]
- Gu, Y.; Zhao, L.; Liu, T.; Wu, S. Evaluation of Thermal Stress on Heterogeneous IoT-Based Federated Learning. Electronics 2024, 13, 3140. [Google Scholar] [CrossRef] [Scilit]
- Minott, D.; Siddiqui, S.; Haddad, R.J. Benchmarking Edge AI Platforms: Performance Analysis of NVIDIA Jetson and Raspberry Pi 5 with Coral TPU. In Proceedings of the SoutheastCon 2025; IEEE: Piscataway, NJ, USA, 2025; pp. 1384–1389. [Google Scholar] [CrossRef] [Scilit]
- Ahmadi, A.; Abdelhafez, H.; Jaiswal, S.; Pattabiraman, K.; Ripeanu, M. Hot Under the Hood: An Analysis of Ambient Temperature Impact on Heterogeneous Edge Platforms. In Proceedings of the 6th International Workshop on Edge Systems, Analytics and Networking; Association for Computing Machinery: New York, NY, USA, 2023; pp. 25–30. [Google Scholar] [CrossRef] [Scilit]
- Skrastins, V.; Medvedevs, V.; Orlovs, D.; Ormanis, J.; Judvaitis, J. Experimental Evaluation of NB-IoT Power Consumption and Energy Source Feasibility for Long-Term IoT Deployments. IoT 2026, 7, 7. [Google Scholar] [CrossRef] [Scilit]
- Wankhede, M.; Khaire, V.; Goswami, A.; Mahajan, S. Evaluation of cooling solutions for outdoor electronics. In Proceedings of the 2007 9th Electronics Packaging Technology Conference; IEEE: Piscataway, NJ, USA, 2007; pp. 858–863. [Google Scholar]
- Judvaitis, J.; Salmins, A.; Nesenbergs, K. Network data traffic management inside a TestBed. In Proceedings of the 2016 Advances in Wireless and Optical Communications (RTUWO); IEEE: Piscataway, NJ, USA, 2016; pp. 152–155. [Google Scholar]
- Salmins, A.; Judvaitis, J.; Balass, R.; Nesenbergs, K. Mobile wireless sensor network TestBed. In Proceedings of the 2017 25th Telecommunication Forum (TELFOR); IEEE: Piscataway, NJ, USA, 2017; pp. 1–4. [Google Scholar]
- Lapsa, D.; Balass, R.; Judvaitis, J.; Nesenbergs, K. Measurement of current consumption in a wireless sensor network testbed. In Proceedings of the 2017 25th Telecommunication Forum (TELFOR); IEEE: Piscataway, NJ, USA, 2017; pp. 1–4. [Google Scholar]
- Balass, R.; Medvedevs, V.; Mackus, A.I.; Ormanis, J.; Ancans, A.; Judvaitis, J. Precise realtime current consumption measurement in IoT TestBed. Open Res. Eur. 2023, 3, 27. [Google Scholar] [CrossRef] [Scilit]
- Usamentiaga, R.; Venegas, P.; Guerediaga, J.; Vega, L.; Molleda, J.; Bulnes, F.G. Infrared Thermography for Temperature Measurement and Non-Destructive Testing. Sensors 2014, 14, 12305–12348. [Google Scholar] [CrossRef] [Scilit]
- NVIDIA Corporation. Tegrastats Utility. NVIDIA Jetson Linux Developer Guide. 2024. Available online: https://docs.nvidia.com/jetson/archives/r35.4.1/DeveloperGuide/text/AT/JetsonLinuxDevelopmentTools/TegrastatsUtility.html (accessed on 8 May 2026).
- Bonghi, R. jetson-stats: System Monitoring and Control Tool for NVIDIA Jetson Devices. GitHub Repository, 2019–2026. Python Package, Available via pip Install jetson-stats. Available online: https://github.com/rbonghi/jetson_stats/wiki/Home/bdf6b685238bd2277847ac1884a366b29eadfdb9 (accessed on 8 May 2026).
- Bonghi, R. jtop_logger.py. Available online: https://github.com/rbonghi/jetson_stats/blob/master/examples/jtop_logger.py (accessed on 8 May 2026).
- Anseeto. jetson-gpu-burn: Multi-GPU CUDA Stress Test for Jetson. Available online: https://github.com/anseeto/jetson-gpu-burn (accessed on 8 May 2026).
- Jocher, G.; Qiu, J.; Chaurasia, A. Ultralytics YOLO. Version 8.0.0. 2023. Available online: https://github.com/ultralytics/ultralytics (accessed on 14 April 2026).
- Suchý, I.; Turčaník, M. Review of large YOLOv8 and RT-DETR energy efficiency on edge devices for real-time detection. Sci. Rep. 2026, 16, 10908. [Google Scholar] [CrossRef] [Scilit]
- Aljami, H.M.; Alrowais, N.A.; AlAwajy, A.M.; Alhrgan, S.O.; Aldwaani, R.A.; Alsawadi, M.S.; Saqib, N.U.; Alam, S.S.; Alsubaie, R. Benchmarking YOLOv8 Variants for Object Detection Efficiency on Jetson Orin NX for Edge Computing Applications. Computers 2026, 15, 74. [Google Scholar] [CrossRef] [Scilit]
- NVIDIA Corporation. Jetson AGX Orin Series Thermal Design Guide; Technical Report TDG-10943-001, v1.1; NVIDIA Corporation: Santa Clara, CA, USA, 2022. [Google Scholar]
- Ahmadi, A.; Abdelhafez, H.A.; Pattabiraman, K.; Ripeanu, M. Edgeengine: A thermal-aware optimization framework for edge inference. In Proceedings of the Eighth ACM/IEEE Symposium on Edge Computing; IEEE: Piscataway, NJ, USA, 2023; pp. 67–79. [Google Scholar]
- Engelmaier, W. Fatigue life of leadless chip carrier solder joints during power cycling. IEEE Trans. Compon. Hybrids Manuf. Technol. 1983, 6, 232–237. [Google Scholar] [CrossRef] [Scilit]

Disclaimer/Publisher’s Note: The statements, opinions and data contained in all publications are solely those of the individual author(s) and contributor(s) and not of MDPI and/or the editor(s). MDPI and/or the editor(s) disclaim responsibility for any injury to people or property resulting from any ideas, methods, instructions or products referred to in the content. |
© 2026 by the authors. Licensee MDPI, Basel, Switzerland. This article is an open access article distributed under the terms and conditions of the Creative Commons Attribution (CC BY) license.