


Abstract
High-power laser diodes are extensively utilized in advanced optoelectronic systems. These devices typically operate under high-current injection conditions, under which intrinsic parasitic parameters become non-negligible and exert a substantial influence on their electro-optical response characteristics. Furthermore, when multiple single emitters are monolithically integrated into a linear array along the epitaxial-layer direction on a single substrate, additional parasitic elements are inevitably introduced. These parameters are critical for characterizing the output performance of high-power laser diodes. This paper presents the implementation of an equivalent circuit model for large-signal laser-diode operation within the Advanced Design System (ADS) computer-aided environment. The proposed model enables accurate simulation of the device’s operating-voltage waveform and optical-output-power response under both DC steady-state and pulsed-transient driving conditions, thereby achieving a coupled representation of electrical behavior and optical emission. Sensitivity analysis of various parasitic elements is performed to systematically evaluate their influence on output characteristics and device reliability. The results provide theoretical guidance for structural optimization and packaging design, offering new insights into future modeling and reliability assessment of high-power laser diodes.
1. Introduction
High-power laser diodes (LDs), which offer high conversion efficiency, low weight, compact size, and direct-modulation capability, are widely employed in communications, industrial processing, medical treatment, and military systems, where they play a critical role in economic development and national defense [1,2,3]. A common approach to achieving high-power laser-diode operation is the use of a laser-bar configuration. This structure features multiple single emitters that are monolithically integrated into a linear array along the epitaxial-layer direction on a single substrate, thereby increasing the total output power [1,4]. LD Mini-bars combine the advantages of single emitters with those of traditional bars and can be connected in series to deliver high power and high brightness at relatively low operating currents; however, these currents remain substantially higher than those of low-power.
LDs [5]. The large drive currents required render the intrinsic parasitic parameters of the LD non-negligible, while additional parasitic elements are introduced during emitter integration and device packaging. These parasitic parameters serve as key de-terminants of the large-signal output performance of high-power LDs [6,7,8].
Currently, equivalent circuit modeling offers an effective methodology for ana-lyzing the electrical behavior and output performance of LDs. In 1999, Esquivias in-vestigated the effects of carrier capture and radiative processes on the output charac-teristics of GaAs-based quantum-well laser diodes, extracting the carrier escape time and lifetime within the quantum well and estimating the carrier capture and transport times [9]. In 2014, Engelbrecht employed Electronic Design Automation (EDA) tools to incorporate the current–voltage characteristics of the diode p–n junction into analyti-cal equations, thereby establishing and validating a large-signal circuit model for a 30-W high-power LD module [10]. In 2019, Yan developed a robust circuit-level model of vertical-cavity surface-emitting lasers (VCSELs) using EDA tools, enabling calcula-tion of the device’s coupled electro-optical-thermal multiphysics response to pulsed signals and demonstrating the computational capability of the mode [11]. In 2024, Wang developed an equivalent-circuit model for a packaged GaN-based LD, analyzing the impact of packaging-design parameters on modulation behavior and providing a foundation for impedance matching in GaN-based LDs [12]. In 2025, Coenen proposed an electro-thermal model for GaAs nanoridge LDs, constructing a TCAD-based elec-tro-thermal equivalent-circuit model and predicting localized hotspots at the p-contact, thereby offering new insights into addressing reliability bottlenecks in LDs [13].Current research has primarily focused on the equivalent circuit modeling of low-power LDs and high-power LD modules; however, high-power LD arrays have received considerably less attention. In this paper, a large-signal equivalent-circuit model of a high-power LD Mini-bar is developed using the Symbolically Defined Device (SDD) module within the Advanced Design System (ADS). The model accurately reproduces the operational characteristics of the actual LD and simulates the influence of parasitic parameters on key performance metrics, including threshold current, slope efficiency, and voltage oscillations. This approach provides valuable insights for the subsequent manufacturing and optimization of high-power LD Mini-bars.
2. Equivalent Circuit Model of a High-Power Single-Emitter
Due to the simplicity and accuracy of laser rate equations, they are widely regarded as the standard approach for describing the recombination and radiative processes of carriers and photons within the active region of an LD. In this paper, the rate equations are similarly employed to construct the equivalent-circuit model of a single-emitter high- power LD. The fundamental form of the LD rate equations is presented in Equation (1) [11]:
where is the active region carrier density, is the photon density, is the current injected into the active region, is the electron charge, is the active region volume, is the optical confinement factor, is optical gain coefficient, is the carrier recombination rate, is the radiative recombination rate, is the photon lifetime, is the spontaneous emission factor, and is the gain compression factor.
When the output power of an LD becomes relatively high, the analysis of its output characteristics using the equivalent-circuit model derived from the fundamental rate equations begins to exhibit noticeable discrepancies. Therefore, modifications to the rate equations become necessary. By applying a perturbation analysis to the fundamental LD rate equations under steady-state conditions, the modified expression shown in Equation (2) is obtained [14]:
In fact, the basic rate equations exhibit inherent limitations. For example, they may yield non-physical solutions. Such erroneous solutions are critical in EDA environments, as they may lead to issues such as floating nodes. To address these limitations, this study introduces a modified optical gain expression based on Equation (2), as presented in Equation (3). This modification not only eliminates non-physical solutions but also im-proves the stability and applicability of the model in circuit simulation environments [15,16,17]:
where is a constant, is the transparency carrier density, and represents the saturation photon density.
For , the carrier recombination rate given in Equation (4) is employed. Under high current injection conditions, both the radiative recombination rate and are represented by the same expression. In addition, carrier leakage is incorporated into the formulation, a modification commonly employed in high-power LDs to adjust the rate equations and account for efficiency droop [18,19].
where is the recombination coefficient associated with defect centers, is the spontaneous radiative recombination coefficient, is the Auger recombination coefficient, is the nonradiative leakage recombination coefficient, and is an empirical parameter.
In practical LD operation, the carrier density and photon density within the active region reach very large magnitudes, reflecting the orders of magnitude associated with and in the rate equations. Since and are treated as variables in the rate equations, EDA tools may encounter numerical overflow under high current injection, leading to non-convergence during simulation. To address this issue, normalization of and in Equation (2) is required, thereby transforming them into lower-magnitude quantities within the circuit model. The normalization adopted in this letter is presented in Equation (5) [20]:
where and is the normalized carrier density and normalized photon density, respectively. is the threshold carrier density, which is temperature-dependent, and is an empirical constant.
The proposed correction method is well suited for large-signal modeling of high-power LDs under high-current operating conditions. It significantly enhances model reliability and interpretability, particularly when parasitic parameters and thermal effects are considered in circuit-simulation platforms such as ADS. It should be noted that this modification primarily addresses circuit-level simulation issues. It does not directly affect the applicability of the rate equations in purely theoretical analyses. Under extremely high frequency or complex multiphysics coupling conditions, additional model extensions are still required.
By substituting Equations (3)–(5) into Equation (2), the normalized rate equations for the construction of the equivalent circuit model of a single laser diode are obtained, as shown in (6):
The high-power LD investigated in this paper is a Fabry–Pérot (F–P) cavity laser, with the left facet defined as the front facet coated with an anti-reflection (AR) film and the right facet coated with a high-reflection (HR) film. Therefore, only the optical power conversion at the front facet of the laser is considered here. The output power from the left facet of the laser is expressed by Equation (7) [21]:
where denotes the wavelength in vacuum; and represent the thickness and width of the active region, respectively; while and correspond to the reflectivities of the laser’s left and right facets.
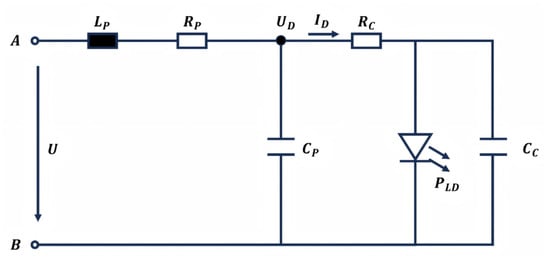
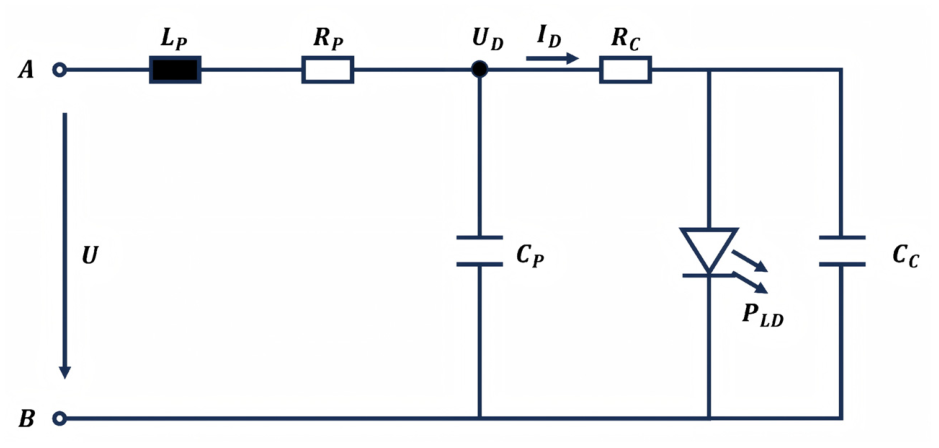
In this paper, circuit modeling is performed for the high-power LD (serial number FC01-000583) manufactured by Huaguang Optoelectronic. The large-signal equivalent circuit diagram of the LD is shown in Figure 1. Here, and are the intrinsic series resistance and parallel capacitance of the laser, respectively. , and are the additional parasitic parameters introduced by the bonding wires and packaging process. corresponds to the current injected into the intrinsic active region of the laser, represents the voltage across the device, and is the optical output power of the laser. Table 1. summarizes intrinsic parameters from actual devices provided by manufacturers, experimentally extracted parasitic values, and key inputs for equivalent circuit modeling.
Figure 1.
Large-signal equivalent circuit of a high-power single emitter.
Table 1.
Parameter of the equivalent circuit model for high-power LD [7,10,11,12].
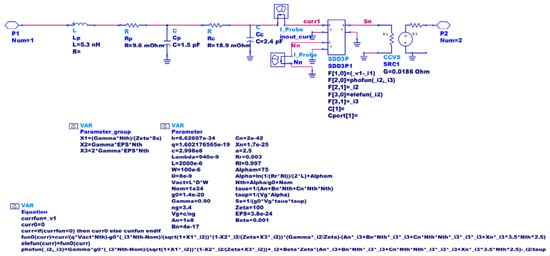
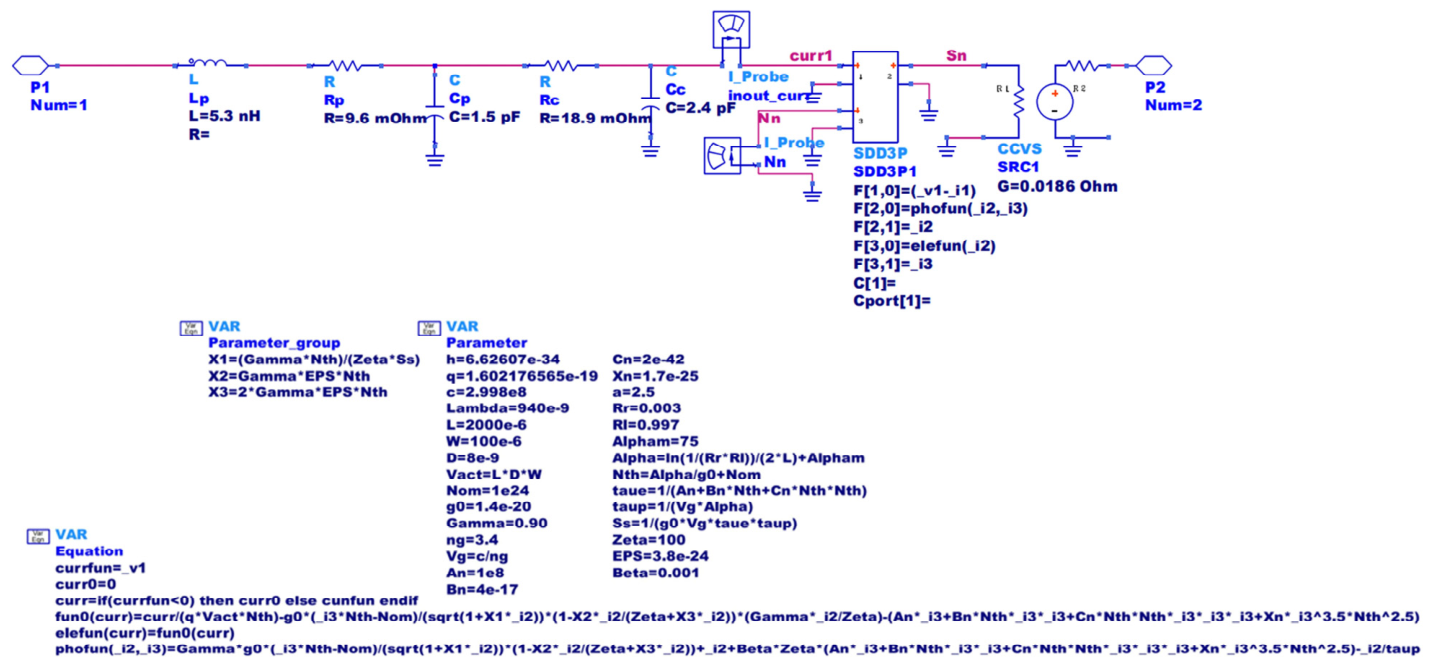
The parameters summarized in Table 1 were determined through a combination of experimental extraction, manufacturer supplied structural information, and physical constants validated in the literature. The electrical parasitic parameters were obtained from impedance spectroscopy together with detailed transient response analysis. The package level parasitic were estimated from the structural specifications provided by the device manufacturer and were further refined through waveform matching. The optical and recombination parameters were taken from established LD models and validated using the measured L–I–V characteristics of the tested devices [10,11,12]. The equivalent circuit model of the high-power LD is defined by Equations (6) and (7). It is implemented in the ADS environment using the three-port device SDD3P1. Port 1 is the input, Port 2 corresponds to the normalized photon density, and Port 3 corresponds to the normalized carrier density. The intrinsic parasitic parameters of the single device, together with additional parasitic elements introduced by bonding wires and soldering, are included in the circuit. This forms a complete equivalent circuit model, as shown in Figure 2. It should be noted that these additional parasitic parameters were already included at the single-device modeling stage to better match experimental results. They were further extracted and integrated into the overall Mini-bar model. Importantly, the SDD module in ADS allows the modified rate equations to be embedded directly in the circuit environment. Carrier density, photon density, and related physical quantities are implemented through symbolic expressions inside the SDD, without mapping them individually to traditional elements such as capacitors, inductors, or controlled sources. This approach preserves the physical integrity of the rate equations and avoids approximation errors caused by forced circuit decomposition. As a result, the model more closely reflects the electro-optical coupling behavior of real devices.
Figure 2.
Equivalent circuit model of a high-power single-emitter LD implemented in ADS with parasitic parameters.
3. Equivalent Circuit Model of a High-Power LD Mini-Bar
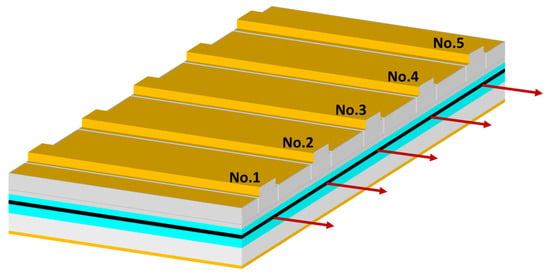
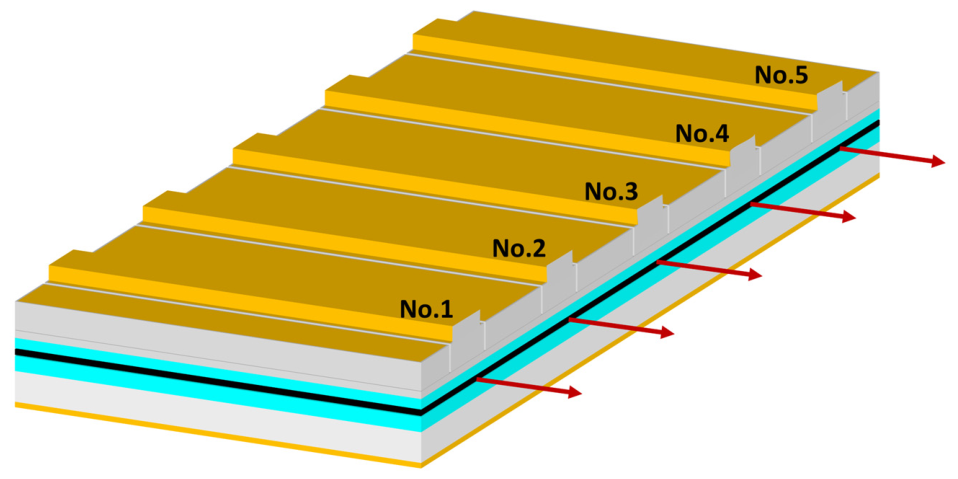
The high-power LD Mini-bar can be regarded as a one-dimensional parallel array of multiple laser diodes, as illustrated in Figure 3. Consequently, the core of its equivalent circuit model lies in replicating and paralleling the single-diode model as subcircuits. In this paper, a Mini-bar consisting of five emitting units is employed, where the cavity length, active region width, and quantum well thickness of each unit are identical to those of the single LD described in Section 2. The laser bar under investigation is designated as XGDG0059. The single LD equivalent circuit model established in Section 2, including the parasitic parameters introduced by packaging, is further encapsulated into a symbol. Additional parasitic elements are incorporated to construct the complete equivalent circuit model of the high-power LD Mini-bar.
Figure 3.
Epitaxial structure diagram of the LD Mini-bar.
In the practical fabrication of LD bars, epitaxial growth of the device structure is first carried out on a single substrate. Subsequently, multiple emitting units are electrically and optically isolated, electrodes are formed, and facet coatings are applied prior to packaging [22,23]. The primary sources of parasitic parameters in this process include electrical isolation, optical isolation, electrode coverage, and packaging. Since this paper focuses on large-signal modeling of the laser bar, parasitic capacitance between the emitting units and the substrate, as well as the mutual inductance and capacitance between units induced by the isolation structures, is neglected. In addition, thermal coupling effects are simplified by directly incorporating the temperature variations among units into the parameter settings of the single LD circuit model.
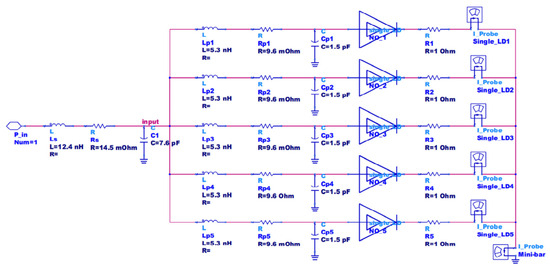
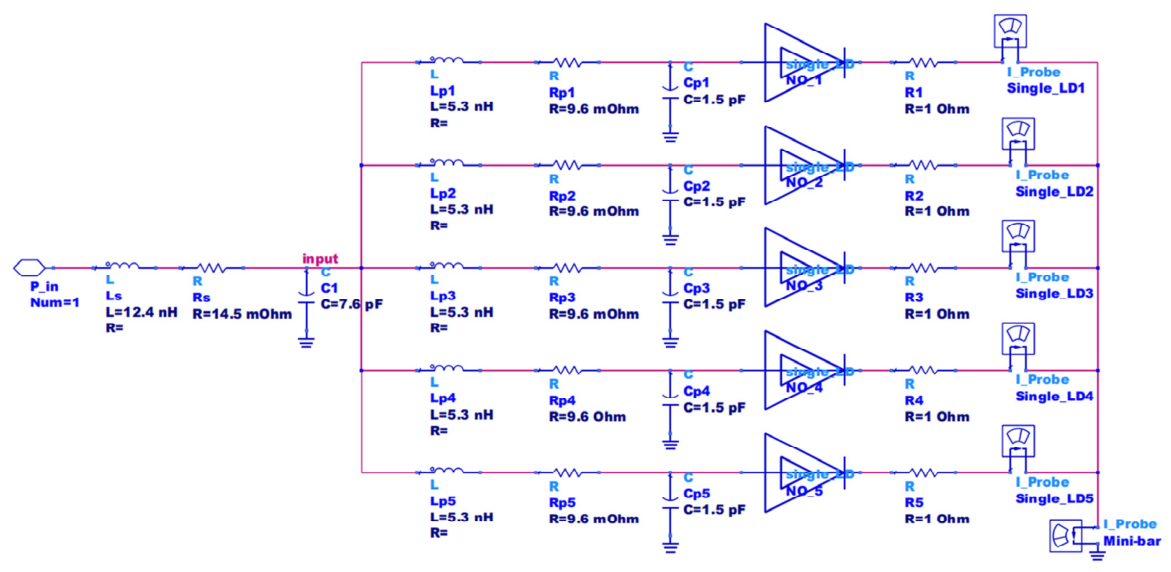
The final implemented circuit is shown in Figure 4, which contains five single LD symbols and incorporating parasitic parameters such as the parasitic resistance and inductance introduced by the shared electrode path, as well as inherent parasitic elements arising from packaging. Among these, and represent the total series inductance and resistance between the driving source and the device, including the shared conduction path among multiple emitting points within the device. Since the high-power LD Mini-bar examined in this paper operates primarily under DC or low-frequency pulsed excitation, the skin depth is substantially larger than the conductor dimensions, rendering the skin effect negligible. Therefore, the influence of the skin effect is neglected in the circuit model.
Figure 4.
Equivalent circuit model of a high-power LD Mini-bar implemented in ADS with parasitic parameters.
4. Simulation and Experimental Results
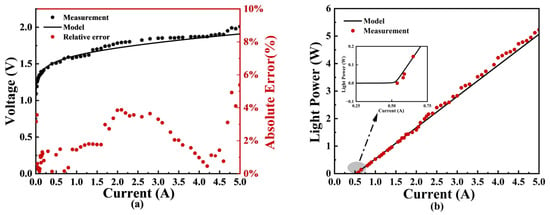
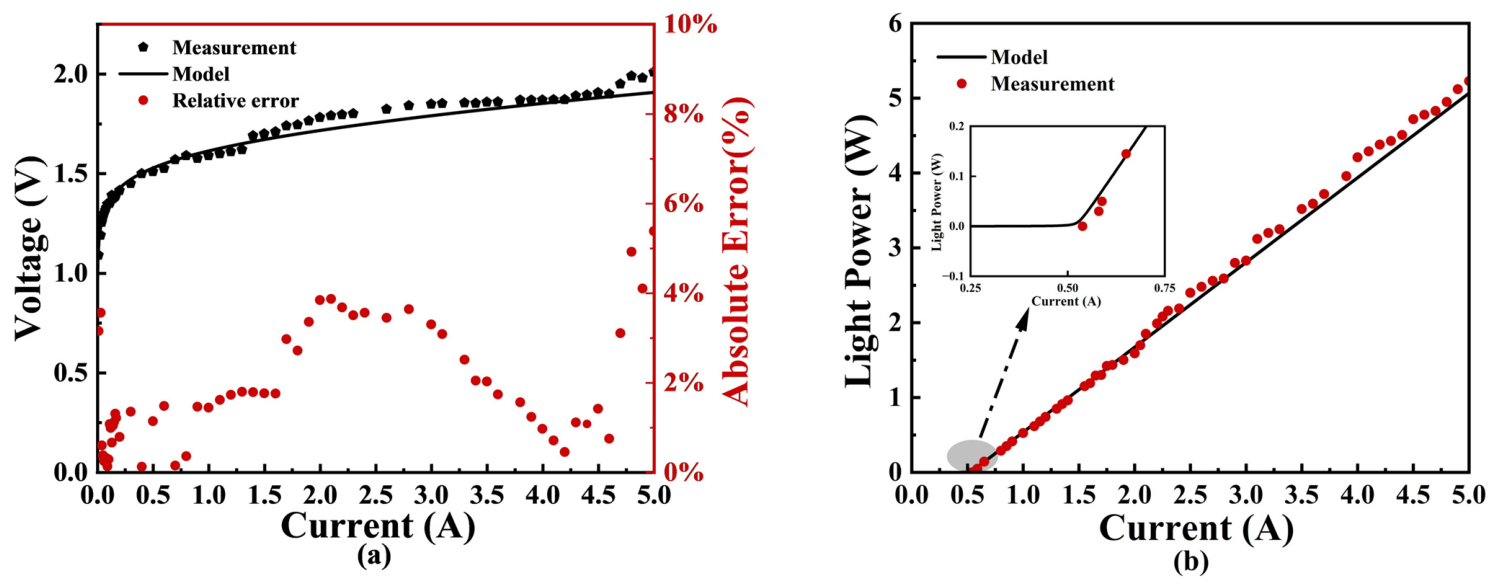
Figure 5a,b illustrates the Light–Current–Voltage (L–I–V) characteristics of the single laser diode equivalent circuit model at 300 K, under excitation currents ranging from 0 A to 5 A, with a pulse width of 30 μs and a repetition frequency of 500 Hz. For comparison, experimental measurements were performed on the actual single laser diode device FC01-000583 using a voltage probe and a PM10-19C power detector under ambient room-temperature conditions.
Figure 5.
Output characteristics of the single LD circuit model and the actual device. (a) Comparison between the single LD model and experimental voltage results, along with the relative voltage error, (b) L–I characteristics of the single LD model and experiment.
Figure 5a compares the simulated voltage of the single-diode equivalent circuit model with the experimentally measured voltage of the actual device. The relative error between the simulation and measurement is also presented. The simulated and measured voltages exhibit good agreement, with the relative deviation confined within ±5%. Figure 5b shows the L–I characteristics obtained from both the single-diode equivalent circuit model and the experimental measurements. The circuit model exhibits a threshold current of 0.49 A and a slope efficiency of 1.13 W/A, whereas the actual device shows a threshold current of 0.51 A and a slope efficiency of 1.15 W/A. The complete output characteristics obtained from both simulation and experiment are summarized in Table 2. These results demonstrate that the output characteristics of the semiconductor laser diode are well reproduced by the equivalent circuit model, thereby achieving the intended modeling objectives.
Table 2.
Output characteristics obtained from experiment and circuit model simulation.
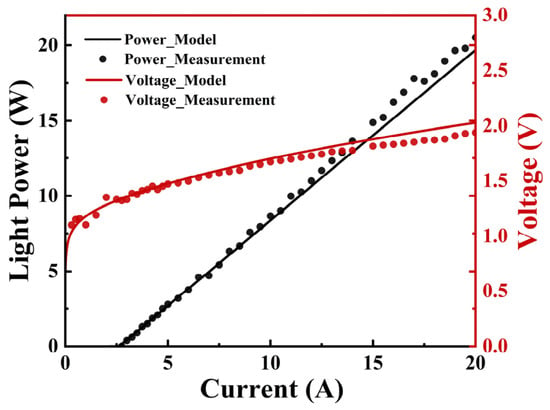
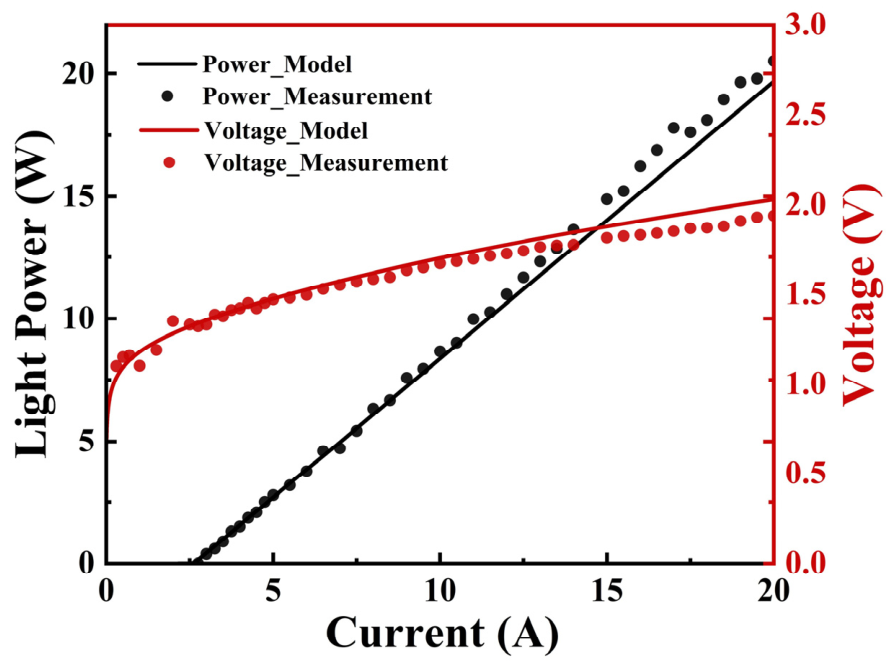
Figure 6 presents the simulated L–I–V characteristic curves of the equivalent circuit model for the high-power LD Mini-bar under quasi-continuous operation, with a pulse width of 30 μs and a repetition frequency of 500 Hz, alongside the measured L–I–V curves of the actual Mini-bar device obtained at 300 K using a voltage probe and a 40F-MA-19 power detector. As shown in Figure 6, the threshold currents for the model and the actual LD Mini-bar are 2.58 A and 2.64 A, respectively, corresponding to a relative error of 2.27%. The slope efficiencies are 1.11 W/A for the model and 1.14 W/A for the device, with a relative error of 2.63%. A comparison of the output characteristics between the single LD and Mini-bar circuit models, as well as their respective devices, is summarized in Table 2, demonstrating that the simulated results are in close agreement with the experimental data.
Figure 6.
Output characteristics of the high-power LD Mini-bar.
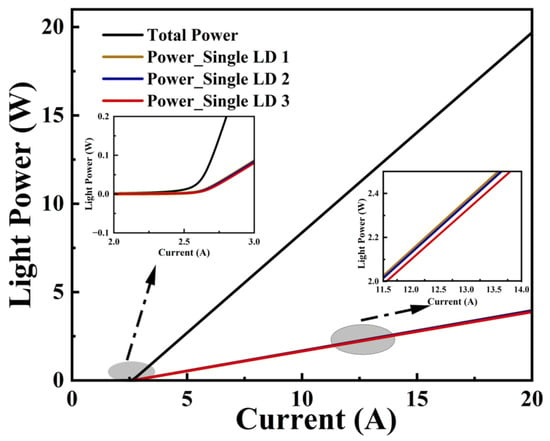
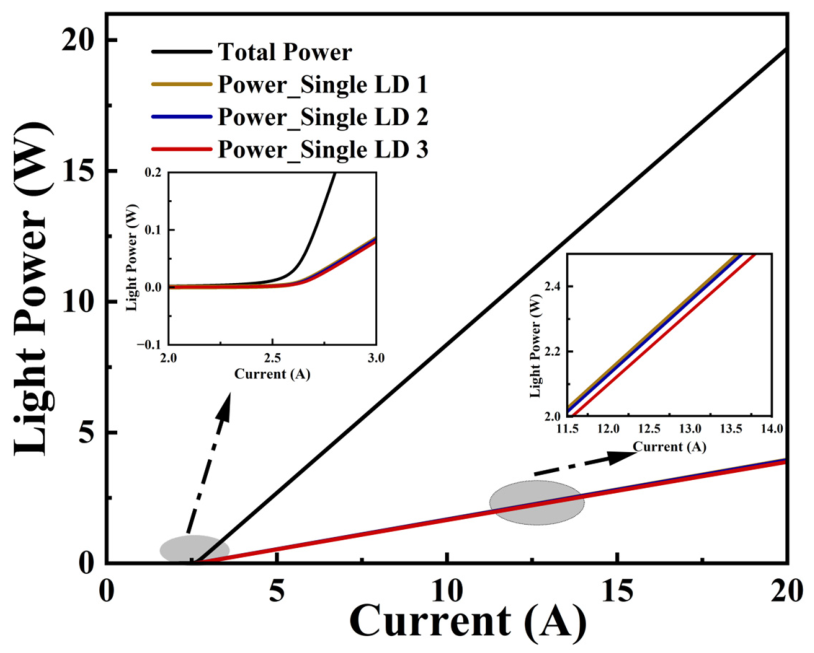
Figure 7 illustrates the total optical power output of the LD Mini-bar circuit model, along with the individual optical outputs of single LDs No. 1, No. 2, and No. 3. The results emphasize both the overall performance of the Mini-bar and the specific contributions of each individual LD to the total optical output. The model assumes a symmetric laser Mini-bar structure, in which the outputs of single LDs No. 4 and No. 5 are identical to those of No. 1 and No. 2, respectively, and are therefore not discussed further.
Figure 7.
L–I characteristics of the high-power LD Mini-bar and its single emitters.
Due to inferior heat dissipation in the central region of the laser bar during opera-tion, the temperature rise is higher compared to the edge regions, resulting in increased mate-rial resistivity in the central LD [24]. As shown in Figure 7, the threshold currents of LDs No. 1, No. 2, and No. 3 increase progressively. Specifically, the threshold current of LD No. 2 is approximately 3 mA higher than that of LD No. 1, whereas LD No. 3 shows an increase of about 10 mA relative to LD No. 1. Meanwhile, the slope efficiencies of LDs No. 1, No. 2, and No. 3 decrease progressively. LD No. 2 exhibits a reduction of approximately 0.02 W/A relative to LD No. 1, and LD No. 3 shows a reduction of about 0.07 W/A.
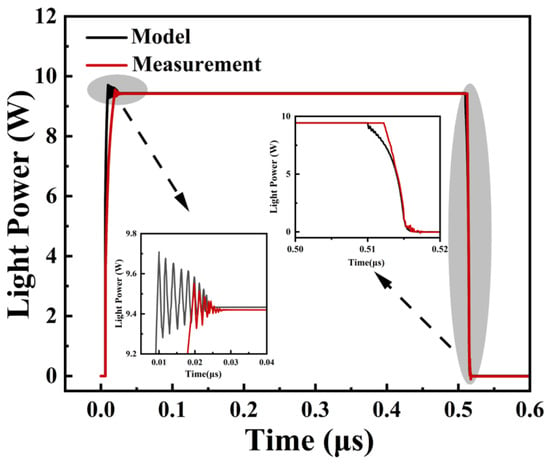
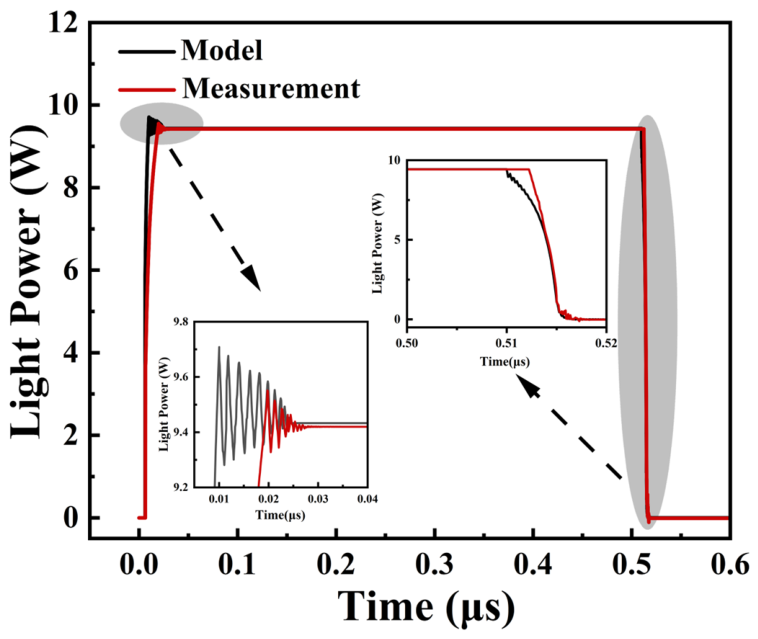
A pulsed square-wave current ranging from 0 to 10 A was applied to the circuit model to evaluate its transient characteristics. The pulse had a width of 500 ns, a period of 2 μs, and a delay time of 5 ns. The same operating conditions were applied to the actual LD Mini-bar device. After optical attenuation, the pulsed optical signal was captured using a high-speed photodetector (Thorlabs DET10A) and recorded with an oscilloscope (Tektronix MDO3032). Figure 8 presents the optical power output of both the circuit model and the actual LD Mini-bar device under identical test conditions. The circuit model accurately predicts the steady-state optical power and the falling edge of the optical pulse. In comparison, the actual LD Mini-bar exhibits a longer rise time. Both results exhibit consistent trends in relaxation oscillations; however, the oscillation amplitude predicted by the circuit model is noticeably larger. This discrepancy is attributed to the limited parameter accuracy of the model, which cannot fully account for the parasitic elements inherent to the actual package. Furthermore, the model does not incorporate more complex physical phenomena present in real devices, such as carrier diffusion, spatial hole burning, and mode competition, nor does it account for intrinsic carrier and photon noise. In summary, the optical power output response predicted by the equivalent circuit model closely matches that of the actual device, thereby validating its applicability for further studies on the output characteristics of high-power LDs.
Figure 8.
Transient response characteristics of the equivalent circuit model and the actual device under pulsed square-wave excitation.
The output characteristics of high-power laser diode arrays are constrained by multiple parasitic effects. These parasitic parameters do not contribute equally, and their relative dominance depends on the device structure and operating conditions. The parasitic resistance is the dominant factor affecting DC performance. Its value is determined by bonding quality, electrode coverage, and metallization thickness. It also increases with operating current and junction temperature. This results in reduced efficiency and local overheating, forming a positive-feedback process that accelerates device degradation. In transient response, the shared-path parasitic inductance is the primary source of voltage overshoot and ringing. Its influence increases approximately linearly with the number of emitters and the length of the shared conductive path. The effect is particularly pronounced during pulse switching. In contrast, the emitter-level parasitic inductance introduces only local disturbances and has a comparatively weaker impact on the overall dynamic behavior. The parasitic capacitances and have limited influence under the low-frequency pulse conditions considered in this study. Their effects become significant only at higher frequencies.
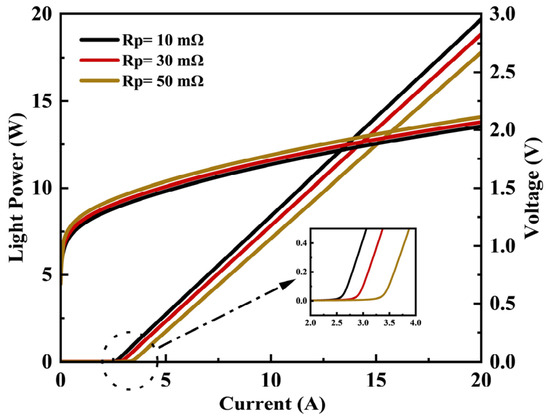
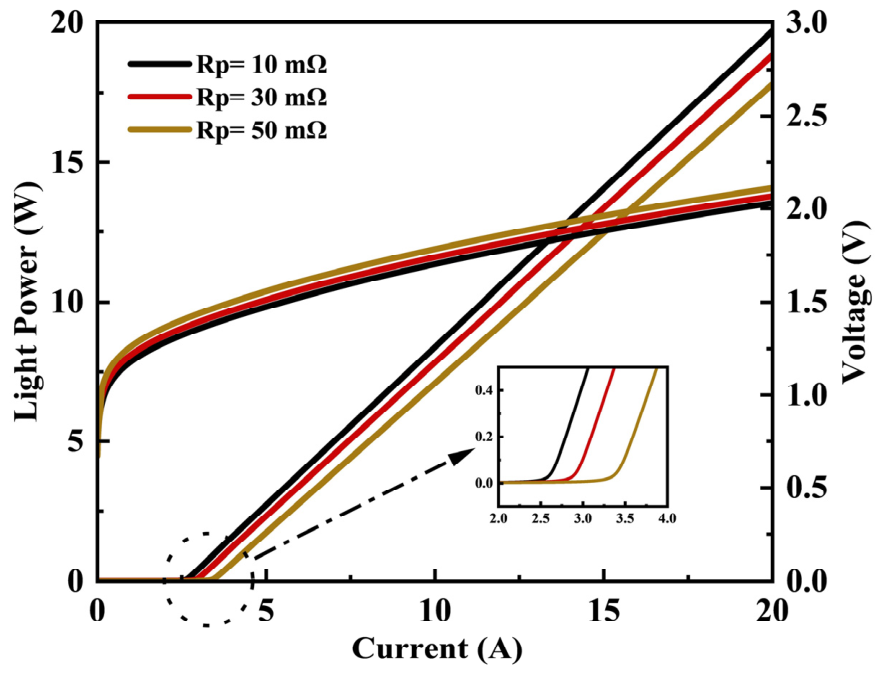
To quantitatively analyze the impact of on the core performance of high-power LD Mini-bar, a series of simulation analyses were conducted by varying the value of in the equivalent circuit model shown in Figure 4, while keeping all other parameters and excitation conditions constant. The resulting output characteristics are presented in Figure 9. It can be observed that as increases, the operating voltage of the Mini-bar exhibits a slight upward trend, whereas the threshold current increases significantly. Additionally, the slope efficiency of the Mini-bar gradually decreases progressively. When the maximum current is fixed at 20 A, the corresponding maximum output powers for increasing values are 19.68 W, 18.83 W, and 17.79 W, respectively. Table 3 summarizes the detailed numerical variations in the Mini-bar output characteristics resulting from changes in the parasitic resistance .
Figure 9.
Influence of parasitic resistance on the characteristics of the LD Mini-bar.
Table 3.
Variations in threshold current , slope efficiency S, threshold voltage , and output power at 20 A in the Mini-bar model induced by changes in .
When the parasitic resistance increases, a larger ohmic voltage drop is produced under the same drive current, leading to a higher operating voltage of the device. In addition, a portion of the input electrical power is dissipated across , thereby reducing the effective current injected into the active region. Consequently, a higher drive current is required to achieve the threshold gain, resulting in an increase in the threshold current.
The transient behavior of the LD Mini-bar is influenced by a complex set of parasitic parameters. The impact of parasitic resistance on transient performance is manifested primarily in the response amplitude, paralleling its effect on slope efficiency; therefore, this aspect is not discussed further. The following analysis focuses on the roles of parasitic capacitance and inductance in shaping the transient output behavior of the Mini-bar.
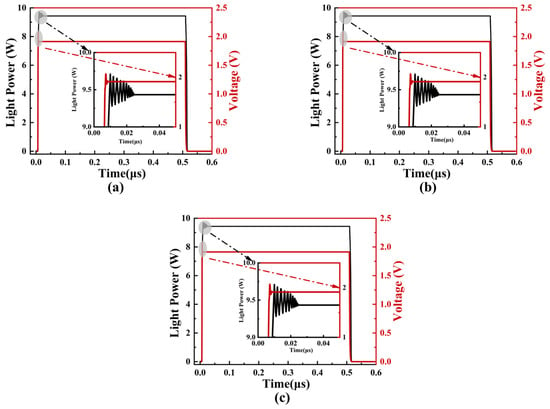
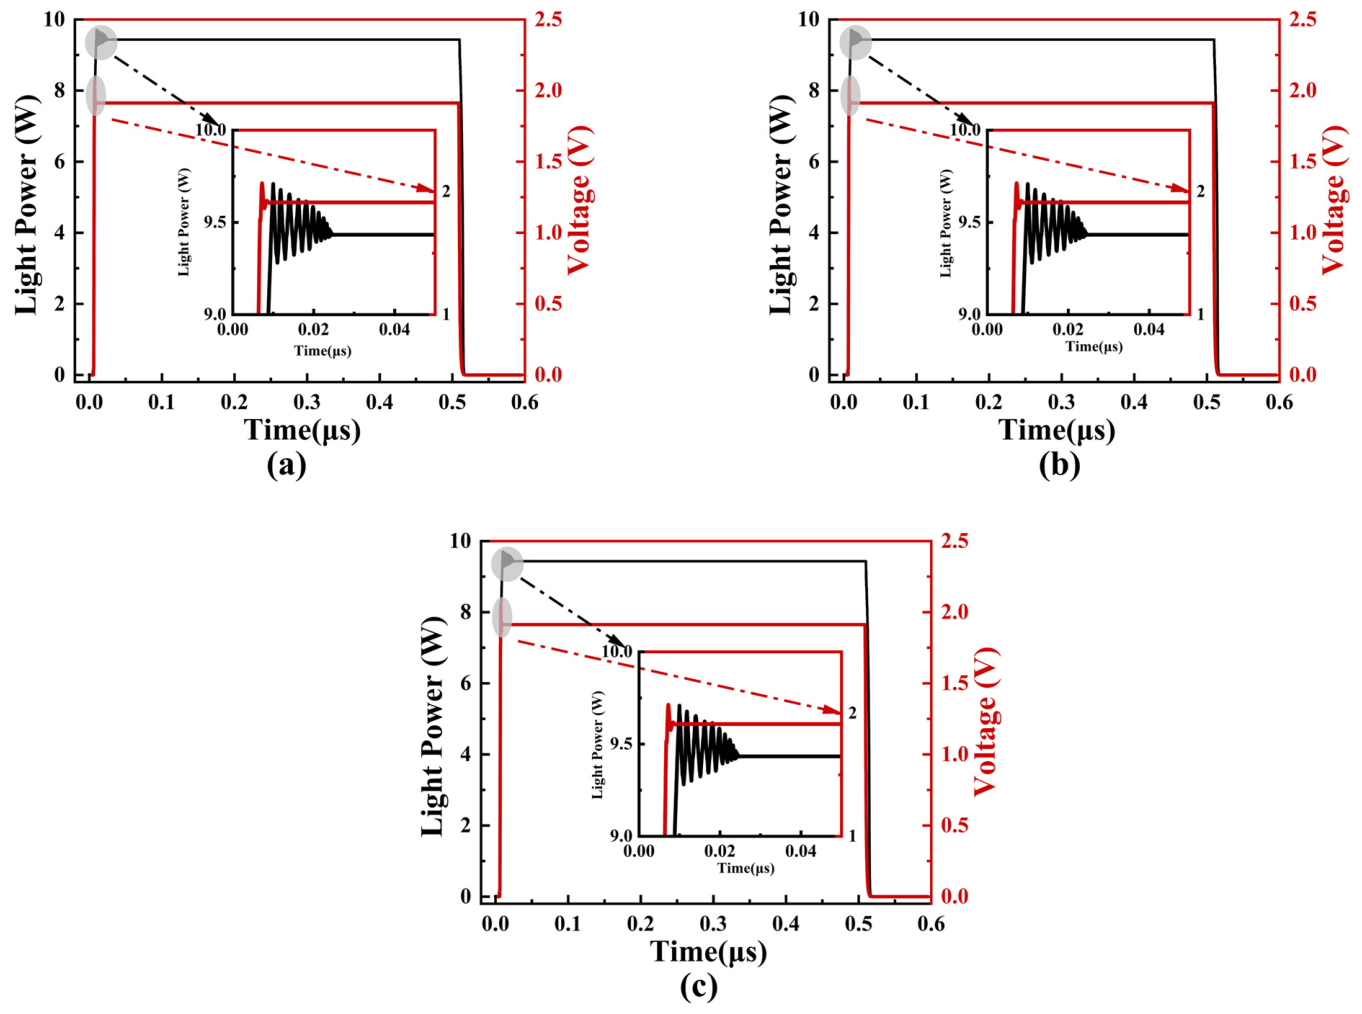
Compared to low-power LDs, high-power LDs exhibit two distinct types of parasitic capacitance and inductance: the parasitic capacitance and inductance associated with the common conduction path, and the parasitic capacitance and inductance intrinsic to each individual emitter. To begin with, the effects of these two parasitic capacitance components on the bar’s transient output behavior are investigated. Three combinations of and are examined within the equivalent circuit shown in Figure 4, while keeping all other parameters and excitation conditions constant. The resulting transient characteristics are shown in Figure 10. It can be observed that, under low-frequency operation, variations in and exert minimal influence on the Mini-bar’s transient response, as evidenced by the nearly identical voltage pulse oscillation profiles.
Figure 10.
Influence of two types of parasitic capacitance on the transient output characteristics of the LD Mini-bar. (a) = 5.6 pF, pF, (b) = 5.6 pF, pF, (c) = 10 pF, pF.
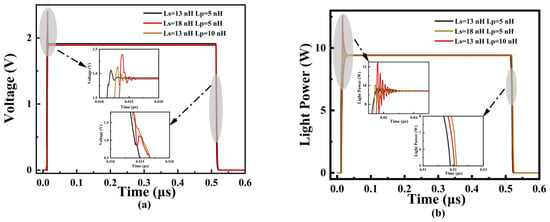
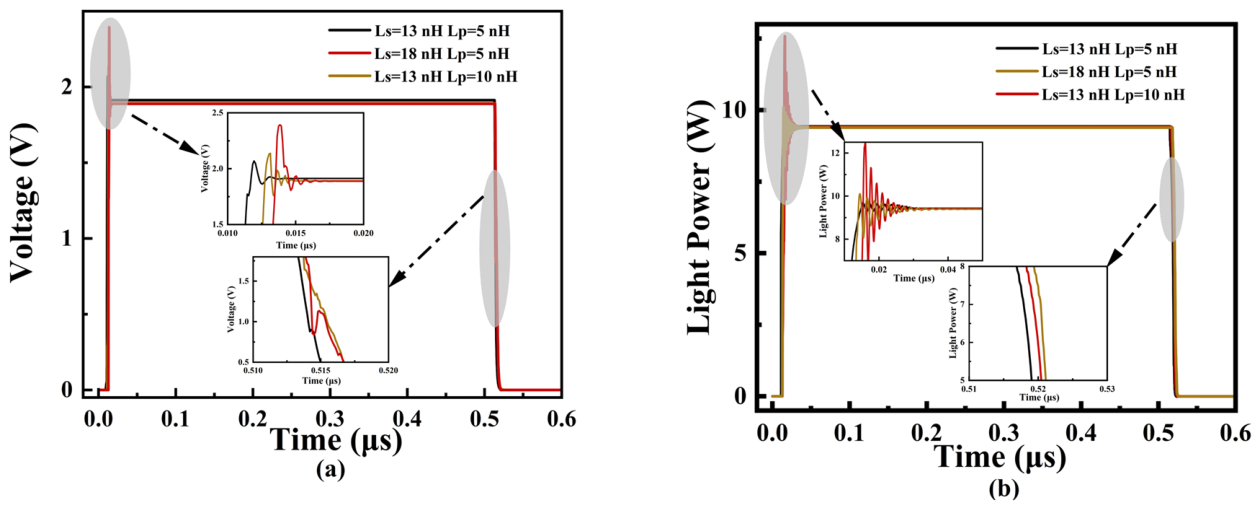
Figure 11 illustrates the impact of two types of parasitic inductance, and , on the transient output characteristics of the LD Mini-bar. Compared to parasitic capacitance, parasitic inductance exerts a more pronounced influence on the transient behavior. It can be observed that the parasitic inductance significantly influences the pulse voltage response of the bar. This impact is manifested primarily in two aspects: the rise time of the voltage pulse, and the duration and amplitude of the voltage oscillations. Separate increases in and each lead to a nanosecond-scale extension of the voltage pulse rise time. Compared with the baseline inductance configuration, the voltage amplitude decreases by approximately 0.008 V, which is attributed to the increased impedance and the associated voltage drop across the inductive elements. However, the peak optical-output power remains nearly unchanged, indicating that the optical efficiency is relatively insensitive to moderate variations in parasitic inductance under the tested conditions.
Figure 11.
Influence of two types of parasitic inductance on the transient output characteristics of the LD Mini-bar. (a) Effect of separately increasing and on the voltage characteristics of the LD Mini-bar, (b) Effect of separately increasing and on the light power characteristics of the LD Mini-bar.
When is kept constant and is increased, the duration of relaxation oscillations in both voltage and optical power responses becomes more pronounced, whereas the oscillation amplitude shows only a minor increase. In contrast, increasing while holding constant significantly enhances both the duration and amplitude of the oscillations. This is because carries the total transient current of all emitter branches, and the resulting induced voltage introduces a strongly coupled disturbance across the entire array. By comparison, the individual emitter inductance affects only the local branch current, and its perturbation does not propagate across branches. As a result, its impact on the overall oscillation amplitude is substantially weaker than that of .
A reverse voltage spike appears at the falling edge of the voltage pulse. However, no visible distortion is observed in the optical output. This observation suggests that the spike is confined to circuit nodes formed by external parasitic inductances and capacitances, including electrodes, bonding wires, and solder paths. It is not effectively transmitted to the active region of the laser. The transient voltage disturbance caused by the reverse spike is primarily absorbed by the external parasitic network. Its magnitude and duration are insufficient to significantly alter the carrier density or net-gain distribution in the active region. As a result, the stimulated emission process remains unaffected. No observable waveform distortion appears in the optical output. Although the spike does not cause instantaneous optical distortion, repeated exposure to high-amplitude voltage transients may accelerate fatigue and degradation in the metallization layers, solder joints, and semiconductor materials. It may also trigger failure mechanisms such as electromigration and void formation. These effects can lead to performance degradation or even catastrophic device failure.
5. Conclusions
An equivalent circuit model of a high-power LD Mini-bar was developed within the ADS simulation environment, incorporating parasitic parameters extracted from the actual device. Carrier and photon densities were normalized, and parasitic elements along the common conduction path were incorporated into multiple parallel single-diode models to construct an extended representation. Simulation results under large-signal DC and pulsed conditions closely match the measured device performance, thereby validating the accuracy of the model. Unlike low-power LDs, high-power devices in transient applications are less affected by parasitic capacitance; instead, parasitic resistance and inductance dominate the transient response, necessitating careful consideration in both design and reliability analysis.
The equivalent-circuit model proposed in this work provides an effective framework for analyzing the influence of electrical parameters on the optical output of high-power LD Mini-bars. Introducing more refined sub-models can further enhance the accuracy of electro-optical characterization in practical high-power lasers. It may also offer new perspectives for future research. One important direction is the incorporation of electro-thermal coupling. This would allow the model to more accurately capture the impact of transient self-heating on gain, refractive index, and threshold behavior. Another key direction is the inclusion of current coupling and crosstalk between emitters arising from shared parasitic parameters. This would enable a more accurate description of current redistribution and dynamic interactions in multi-emitter structures. With these extensions, the model would be able to represent the multiphysics-coupling processes in high-power LDs more comprehensively. This will support more accurate device optimization and design.
Author Contributions
L.L.: Writing—original draft, software, methodology, conceptualization and investigation. T.D.: Writing—review and editing. S.W.: Validation. J.L.: Validation. J.Z. (Junyue Zhang): Validation. W.H.: Visualization. Q.M.: Data curation. L.C.: Visualization. J.Z. (Jiachen Zhang): Validation. T.L.: Funding acquisition. Z.W.: Writing—review and editing, funding acquisition. All authors have read and agreed to the published version of the manuscript.
Funding
This work was supported by the National Natural Science Foundation of China (Grant No. 61504167), the Natural Science Foundation of Shaanxi Province, China (Grant Nos. 2023-JC-YB-556, 2022JQ-531, 2019ZY-CXPT-03-05, 2018JM6010, 2015JQ6263), the Talent Project of Science and Technology Department of Shaanxi Province (No. 2017KJXX-72), the State Key Laboratory of Ultrafast Optica Science and Technology (2025CKZZ12).
Data Availability Statement
Data is contained within the article.
Conflicts of Interest
The authors declare that there are no conflicts of interest regarding the publication of this paper.
Abbreviations
The following abbreviations are used in this manuscript:
| EDA | Electronic Design Automation |
| LD | Laser Diode |
| SDD | Symbolically Defined Device |
References
- Zhao, Y.; Wang, Z.; Demir, A.; Yang, G.; Ma, S.; Xu, B. High Efficiency 1.9 Kw Single Diode Laser Bar Epitaxially Stacked with a Tunnel Junction. IEEE Photonics J. 2021, 13, 1500708. [Google Scholar] [CrossRef] [Scilit]
- Chang, C.F.C.; Dill, J.E.; Zhang, Z.; Chen, J.; Pieczulewski, N.; Bader, S.J.; Ayala Valenzuela, O.E.; Crooker, S.A.; Balakirev, F.F.; McDonald, R.D.; et al. High-mobility holes in gallium nitride and their quantum oscillations. Nat. Electron. 2026, 9, 346–357. [Google Scholar] [CrossRef] [Scilit]
- Liu, J.; Wu, S.; Zhang, J.; Chen, L.; Zhang, J.; Huang, W.; Ling, L.; Meng, Q.; Zhang, R.; Wang, Z.; et al. Impact of non-injection window on front facet temperature in laser diodes via electro-opto-thermal multiphysics simulation. Opt. Laser Technol. 2025, 189, 113158. [Google Scholar] [CrossRef] [Scilit]
- Neukum, J. Pump up the power. Nat. Photon 2007, 1, 385–386. [Google Scholar] [CrossRef] [Scilit]
- Kharas, D.; Plant, J.J.; Loh, W.; Swint, R.B.; Bramhavar, S.; Heidelberger, C. High-Power (>300 mW) On-Chip Laser with Passively Aligned Silicon-Nitride Waveguide DBR Cavity. IEEE Photonics J. 2020, 12, 1504612. [Google Scholar] [CrossRef] [Scilit]
- Heathcote, R.I.; Buck, S.; Clarke, R.J.; Green, J.S. Modelling of a reflective waveplate for high-power lasers. In Proceedings of the SPIE 9194, Laser Beam Shaping XV; SPIE: San Diego, CA, USA, 2014; p. 91940N. [Google Scholar] [CrossRef] [Scilit]
- Bochove, E.J.; Shakir, S.A.; Starcher, Y.; Jacobo, A.; Colet, P.; Aceves, A.B.; Braiman, Y.; Deiterding, R.; Miller, C.; Rhodes, C. Simple model to explain instabilities in passively-phased high-power fiber laser arrays. In Proceedings of SPIE the 8080, Diode-Pumped High Energy and High Power Lasers; SPIE: Prague, Czech Republic, 2011; p. 808009. [Google Scholar] [CrossRef] [Scilit]
- Deng, L.; Li, T.; Wang, Z.; Zhang, P.; Wu, S.; Liu, J.; Zhang, J.; Chen, L.; Zhang, J.; Huang, W.; et al. Interface Contact Thermal Resistance of Die Attach in High-Power Laser Diode Packages. Electronics 2024, 13, 203. [Google Scholar] [CrossRef] [Scilit]
- Esquivias, I.; Weisser, S.; Romero, B.; Ralston, J.D.; Rosenzweig, J. Carrier dynamics and microwave characteristics of GaAs-based quantum-well lasers. IEEE J. Quantum Electron. 1999, 35, 635–646. [Google Scholar] [CrossRef] [Scilit]
- Engelbrecht, R.; Groh, J.; Stumpf, C.; Adametz, J.; Schmauss, B. Large-signal RF circuit model for a high-power laser diode module. IEEE Photonics Technol. Lett. 2014, 26, 761–764. [Google Scholar] [CrossRef] [Scilit]
- Yan, J.; Wang, J.; Tang, C.; Liu, X.; Zhang, G.; He, Y. An electro-opto-thermal-coupled circuit-level model for VCSELs under pulsed condition. IEEE Trans. Ind. Electron. 2019, 66, 1315–1324. [Google Scholar] [CrossRef] [Scilit]
- Wang, J.; Hu, J.; Guan, C.; Hou, Y.; Sun, L.; Fang, S.; Shi, J.; Li, Z.; Zhang, J.; Chi, N.; et al. Study of equivalent circuit of GaN based laser chip and packaged laser. Sci. Rep. 2024, 14, 11368. [Google Scholar] [CrossRef] [Scilit] [PubMed]
- Coenen, D.; Vermeersch, B.; Sar, H.; Hsieh, P.-Y.; Panda, D.P.; Oprins, H. Electrothermal modeling of GaAs nanoridge laser diodes. IEEE Trans. Electron Devices 2025, 72, 5038–5044. [Google Scholar] [CrossRef] [Scilit]
- Bae, H.J.; Cho, J.H.; Sung, H.K. Modulation performance enhancement of directly modulated injection-locked semiconductor lasers using an equivalent electrical circuit. Electronics 2021, 10, 2409. [Google Scholar] [CrossRef] [Scilit]
- Mena, P.V.; Morikuni, J.J.; Kang, S.-M.; Harton, A.V.; Wyatt, K.W. A simple rate-equation-based thermal VCSEL model. J. Light. Technol. 1999, 17, 865–872. [Google Scholar] [CrossRef] [Scilit]
- McDonald-Jensen, C.D.; Mohsin, M.; Rahim, M.; Zhao, P.; Pakulski, G.; Waldron, P. A diode-resistor model to understand leakage current in high power buried heterostructure semiconductor diode lasers. In Proceedings of the 2025 Photonics North (PN), Ottawa, ON, Canada, 20–23 May 2025; pp. 1–2. [Google Scholar] [CrossRef] [Scilit]
- Chen, S.; Yoshita, M.; Ito, T.; Mochizuki, T.; Akiyama, H.; Yokoyama, H.; Kamide, K.; Ogawa, T. Analysis of gain-switching characteristics including strong gain saturation effects in low-dimensional semiconductor lasers. Jpn. J. Appl. Phys. 2012, 51, 098001. [Google Scholar] [CrossRef] [Scilit]
- Gao, J. High frequency modeling and parameter extraction for vertical-cavity surface emitting lasers. J. Light. Technol. 2012, 30, 1757–1763. [Google Scholar] [CrossRef] [Scilit]
- Wang, G.; Qiu, J.; Yang, P.; Liu, G. Degradation analysis of 830 nm laser diodes based on PSpice model. In Proceedings of the PHM-Chengdu 2016, Chengdu, China, 19–21 October 2016; pp. 1–6. [Google Scholar] [CrossRef] [Scilit]
- Ghoniemy, S.; MacEachern, L.; Mahmoud, S. Extended robust semiconductor laser modeling for analog optical link simulations. IEEE J. Sel. Top. Quantum Electron. 2003, 9, 872–878. [Google Scholar] [CrossRef]
- Li, L.; Li, L.; Xu, H.; Yan, L.; Li, G.; Wang, D.; Ying, J.; Huang, F. Designing a 1550 nm pulsed semiconductor laser-emission module based on a multiquantum-well equivalent circuit model. Electronics 2023, 12, 1578. [Google Scholar] [CrossRef] [Scilit]
- Fafard, S.; Masson, D.P. 74.7% efficient GaAs-based laser power converters at 808 nm at 150 K. Photonics 2022, 9, 579. [Google Scholar] [CrossRef] [Scilit]
- Feng, Y.; Geng, W.; Yang, J.; Wei, Z.; Tang, J.; Zhang, C.; Jia, H.; Guo, L. Structural design and experimental investigation of a 1.65 µm tapered semiconductor laser with InGaAlAs MQWs (on InP). Photonics 2025, 12, 1107. [Google Scholar] [CrossRef] [Scilit]
- Gao, Y.; Wang, J.; Cao, M.; Zang, L.; Liu, H.; Yuen, M.M.F.; Bai, X.; Wang, Y. The Effect of Geometric Parameters on Flow and Heat Transfer Characteristics of a Double-Layer Microchannel Heat Sink for High-Power Diode Laser. Micromachines 2022, 13, 2072. [Google Scholar] [CrossRef] [Scilit] [PubMed]

Disclaimer/Publisher’s Note: The statements, opinions and data contained in all publications are solely those of the individual author(s) and contributor(s) and not of MDPI and/or the editor(s). MDPI and/or the editor(s) disclaim responsibility for any injury to people or property resulting from any ideas, methods, instructions or products referred to in the content. |
© 2026 by the authors. Licensee MDPI, Basel, Switzerland. This article is an open access article distributed under the terms and conditions of the Creative Commons Attribution (CC BY) license.