


Abstract
Low-speed automated driving (LSAD) shuttles operate in complex urban environments where abrupt braking can affect safety, service quality, and operational interpretability. This study proposes a telemetry-based workflow for the detection and characterization of hard braking (HB) events in autonomous shuttle operations. The workflow includes preprocessing of autonomous in-service telemetry data, deterministic HB detection under irregular sampling, evidence-based attribution using diagnostic and obstacle-related signals, and driving-context characterization through K-means clustering, applied to a 62-day dataset from an autonomous on-demand shuttle operating on a fixed 2.8 km urban loop in Turin. After preprocessing, 71% of the 16,670,518 observations are retained. The analysis identified 734 HB events, of which 89% are linked to specific contextual conditions, highlighting environmental and operational influences on safety-critical situations. Driving-context analysis relies on 316,280 observations collected at 1 Hz and yields a nine-cluster solution. When projected back onto the route through waypoint-level modal regimes, HB events are found to be over-represented in high-speed segments. These results show that HB events can be interpreted not only as a threshold exceedance, but as an operational indicator linked to route-level driving regimes. The proposed framework supports data-driven safety assessment and operational decision-making in autonomous shuttle systems by researchers and practitioners.
1. Introduction
Low-speed automated driving (LSAD) vehicles, especially urban shuttles, have emerged as an early and prominent form of automated mobility in European cities and living labs [1], reflecting the broader EU push toward a greener and more digital transport system [2,3].
However, “low speed” does not eliminate complexity. Urban operational design domains (ODDs) remain dense with interactions involving pedestrians and other vulnerable road users (VRUs), unstructured behaviors, occlusions, and infrastructure-driven stops and priority negotiations. Recent evidence from European testing [4] highlights that mixed traffic exposes LSAD systems to a wide range of unsafe situations, with VRU interaction remaining a critical aspect. Complementary safety assessment work on pedestrian interactions highlights the importance of surrogate measures and structured data pipelines to quantify safety-relevant behavior beyond crashes [5]. The resulting deployment question is therefore not only whether autonomous shuttles can technically “complete the route”, but whether their driving behavior is acceptable and interpretable within the ODD in terms of safety, comfort, service quality, and operational scalability. Recent studies show that low-speed automated vehicles remain challenging to deploy safely in urban traffic, even in constrained ODDs [6,7]. Because crash data are scarce in automated-driving settings, surrogate safety indicators have become increasingly important for assessing operational risk, especially in telematics-based and intersection-related studies [8]. In particular, recent work on automated shuttles and mixed-traffic deployments indicates that route design, operating context, and surrounding traffic behavior can substantially influence safety performance and comfort [6,7]. Hard braking (HB) events can provide insight into this problem space, as they can be interpreted as operational signals of safety-relevant interactions [8].
HB events have been widely adopted as surrogate safety indicators because crashes are rare while abrupt longitudinal actions are comparatively frequent and can be detected from kinematic data streams and telematics at scale [9,10]. Beyond frequency-based monitoring, jerk-based characterizations have been used to capture safety-critical maneuvers and driver-vehicle risk patterns. For instance, the occurrence of “critical jerks” has been linked to increased accident involvement [11], and dedicated methods have been proposed to detect jerk patterns over full safety-critical braking episodes rather than via pointwise flags [12].
Recent studies have approached HB analysis from different but complementary perspectives. Broad reviews on surrogate safety measures have emphasized the growing relevance of kinematic indicators for assessing safety-critical interactions in connected and automated driving contexts [13]. Telematics-based research has mainly focused on scalable event detection, statistical occurrence modeling, and the relationship between HB events and short-term crash risk across large datasets [14]. More recently, spatially explicit analyses have also highlighted the value of linking HB patterns to roadway characteristics and localized traffic conditions [15]. However, these strands of literature have largely evolved separately, with limited attention to integrated frameworks that jointly connect event detection, contextual characterization, attribution, and route-level operational interpretation under real-world autonomous shuttle conditions.
Despite this growing body of literature, existing approaches often focus either on the detection of critical events or on their contextual interpretation, without providing an integrated framework that systematically links detection, characterization, and attribution. In addition, many studies rely on controlled experiments or limited datasets, which may not fully capture the complexity of real-world autonomous operations. Against this background, the present study proposes a replicable, data-driven workflow for the detection and characterization of HB events in autonomous shuttle services, which transforms irregular, high-frequency shuttle telemetry into an interpretable event layer for urban LSAD vehicle operations.
The novelty of the proposed approach lies in the integration of multiple analytical steps within a unified framework, combining threshold-based event detection, clustering-based characterization of driving contexts, and evidence-based attribution using diagnostic and obstacle-related signals. By projecting the resulting event patterns back onto the service route, the workflow enables a route-level interpretation of HB behavior, providing a more comprehensive understanding of how safety-critical events emerge under real operational conditions.
Overall, three research questions are explored:
- What share of detected HB events can be attributed to error episodes, and, among the remainder, how often obstacle-related signals provide supporting evidence;
- Whether residual HB events exhibit systematic spatial concentration near specific route segments;
- Whether the driving contexts identified through K-means display meaningful differences in HB occurrence.
To address these questions, this work makes three main contributions. First, it proposes a data-driven framework for the detection of HB events from real-world autonomous shuttle telemetry data. Second, it characterizes these events through clustering techniques aimed at identifying recurring driving contexts. Third, it introduces an evidence-based attribution mechanism that links HB events to environmental and operational factors, thereby supporting a deeper understanding of safety-critical situations in autonomous mobility systems.
The proposed workflow follows a sequence of interconnected steps. Raw telemetry data are first preprocessed to ensure quality and consistency. HB events are then detected using threshold-based criteria based on acceleration and jerk, after which spurious detections are filtered out through a validation stage. The validated events are subsequently analyzed to assess their association with environmental and operational factors, while clustering techniques are finally applied to identify recurring driving contexts. This modular structure makes the workflow adaptable to different datasets and operational contexts.
The remainder of the paper is organized as follows. Section 2 describes the case study and the dataset used for the analysis. Section 3 presents the proposed methodology. Section 4 presents the results, including HB detection, attribution, and their distribution across driving contexts. Section 5 discusses the results and their implications. Finally, Section 6 concludes the paper and outlines directions for future work.
2. Case Study
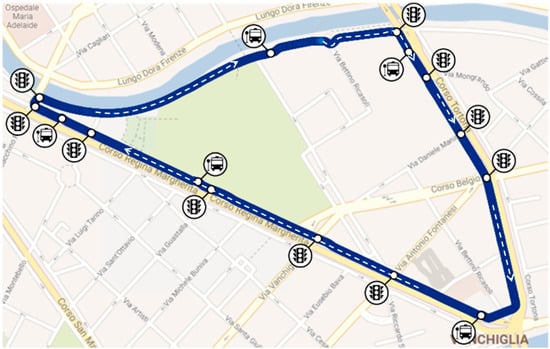
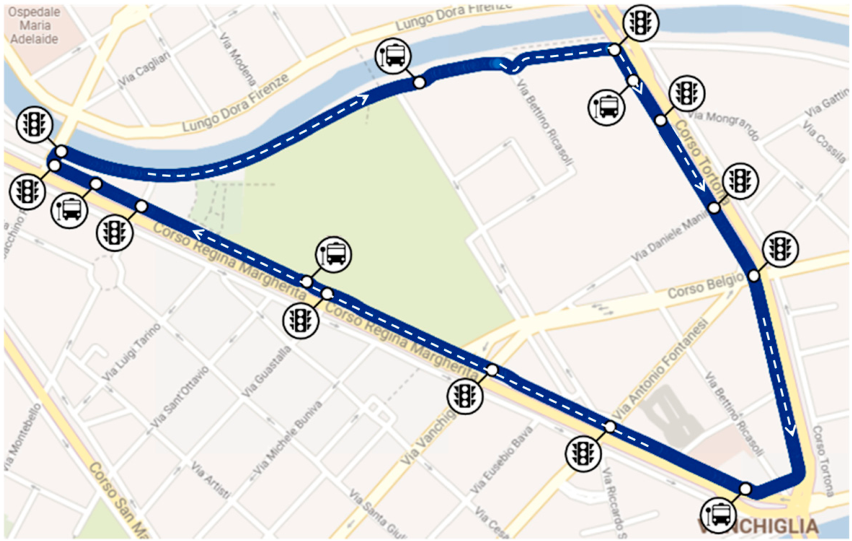
The empirical study is based on an autonomous on-demand shuttle service operating in the Vanchiglia district of Turin along the 2.8 km urban loop shown in Figure 1.
Figure 1.
Fixed operational loop of the autonomous shuttle service in Turin, including designated stops and signalized intersections.
The service runs within a constrained operating zone under mixed traffic conditions and follows a fixed route including five designated stops and ten signalized intersections. This configuration makes the case particularly suitable for the analysis of HB events, since the vehicle is repeatedly exposed to the same infrastructure, priority negotiations, and stopping conditions under nominal automated operation. The deployment is supervised and consistent with an SAE Level 3 [16] operational setting.
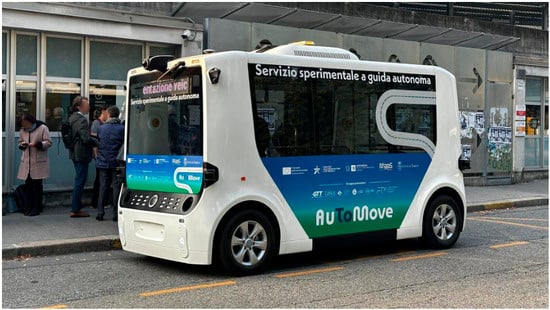
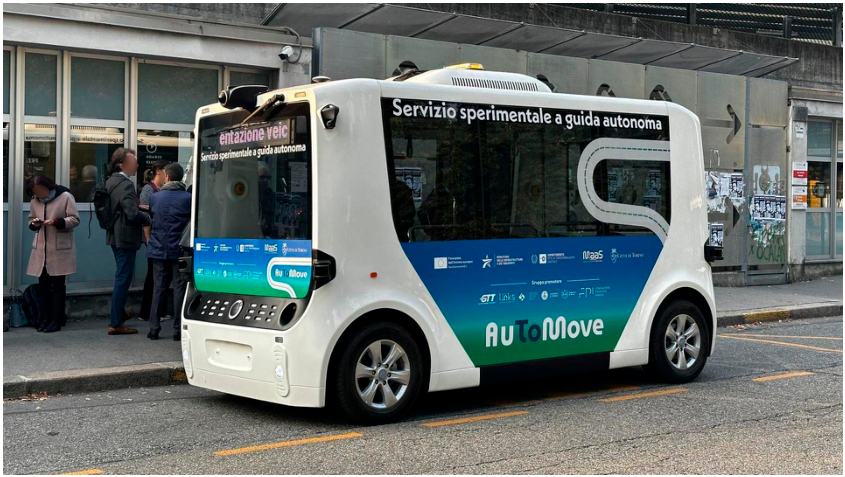
The deployment is part of Living Lab ToMove [17], an initiative supported by the national MaaS4Italy project, promoted by the Department for Digital Transformation with the support of the Italian Ministry of Infrastructure and Transport. Within this framework, the City of Turin, together with mobility operators, research institutions and industry partners, has deployed an autonomous collective transport service, with LINKS Foundation as one of the scientific partners of the initiative. The Ohmio LIFT autonomous shuttle, shown in Figure 2 in the project livery, has been used as a vehicle platform [18]. The Ohmio LIFT is a low-speed automated electric shuttle with a capacity of up to eight seated passengers, operated by the local public transport provider GTT [19]. It is deployed as a connected automated vehicle integrated into the local public transport system and is capable of communicating with roadside infrastructure through technologies provided by CinqueT [20], including support for signalized intersection management.
Figure 2.
Ohmio LIFT low-speed automated driving (LSAD) shuttle used in the ToMove experimental service in Turin.
The applicable national framework is Italian DM 70/2018 [21], also known as “Smart Road Decree”, which governs the experimentation of automated vehicles on public roads. It requires the presence of an onboard supervisor during road tests with documented driving experience and dedicated training, and it mandates the recording of a structured set of variables at a minimum frequency of 10 Hz to ensure traceability, ex post reconstruction, and objective assessment of system behavior.
The study relies on a large telemetry dataset collected between 14 October 2025 and 31 January 2026. During this period, the on-demand service operated five days per week for approximately five hours per day, except for holidays and a few specific events, such as strikes, that led to temporary suspensions. Overall, the dataset covers 62 non-consecutive operating days. The dataset comprises 134 individual telemetry variables, recorded at an approximate logging frequency of 12 Hz, of which the most relevant are reported in Table 1.
Table 1.
Native telemetry signals used in the analysis.
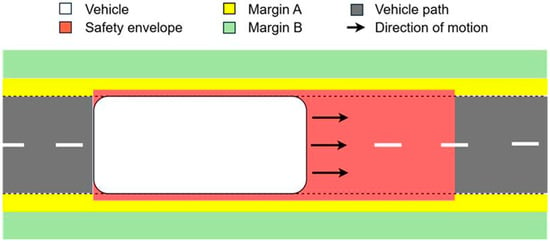
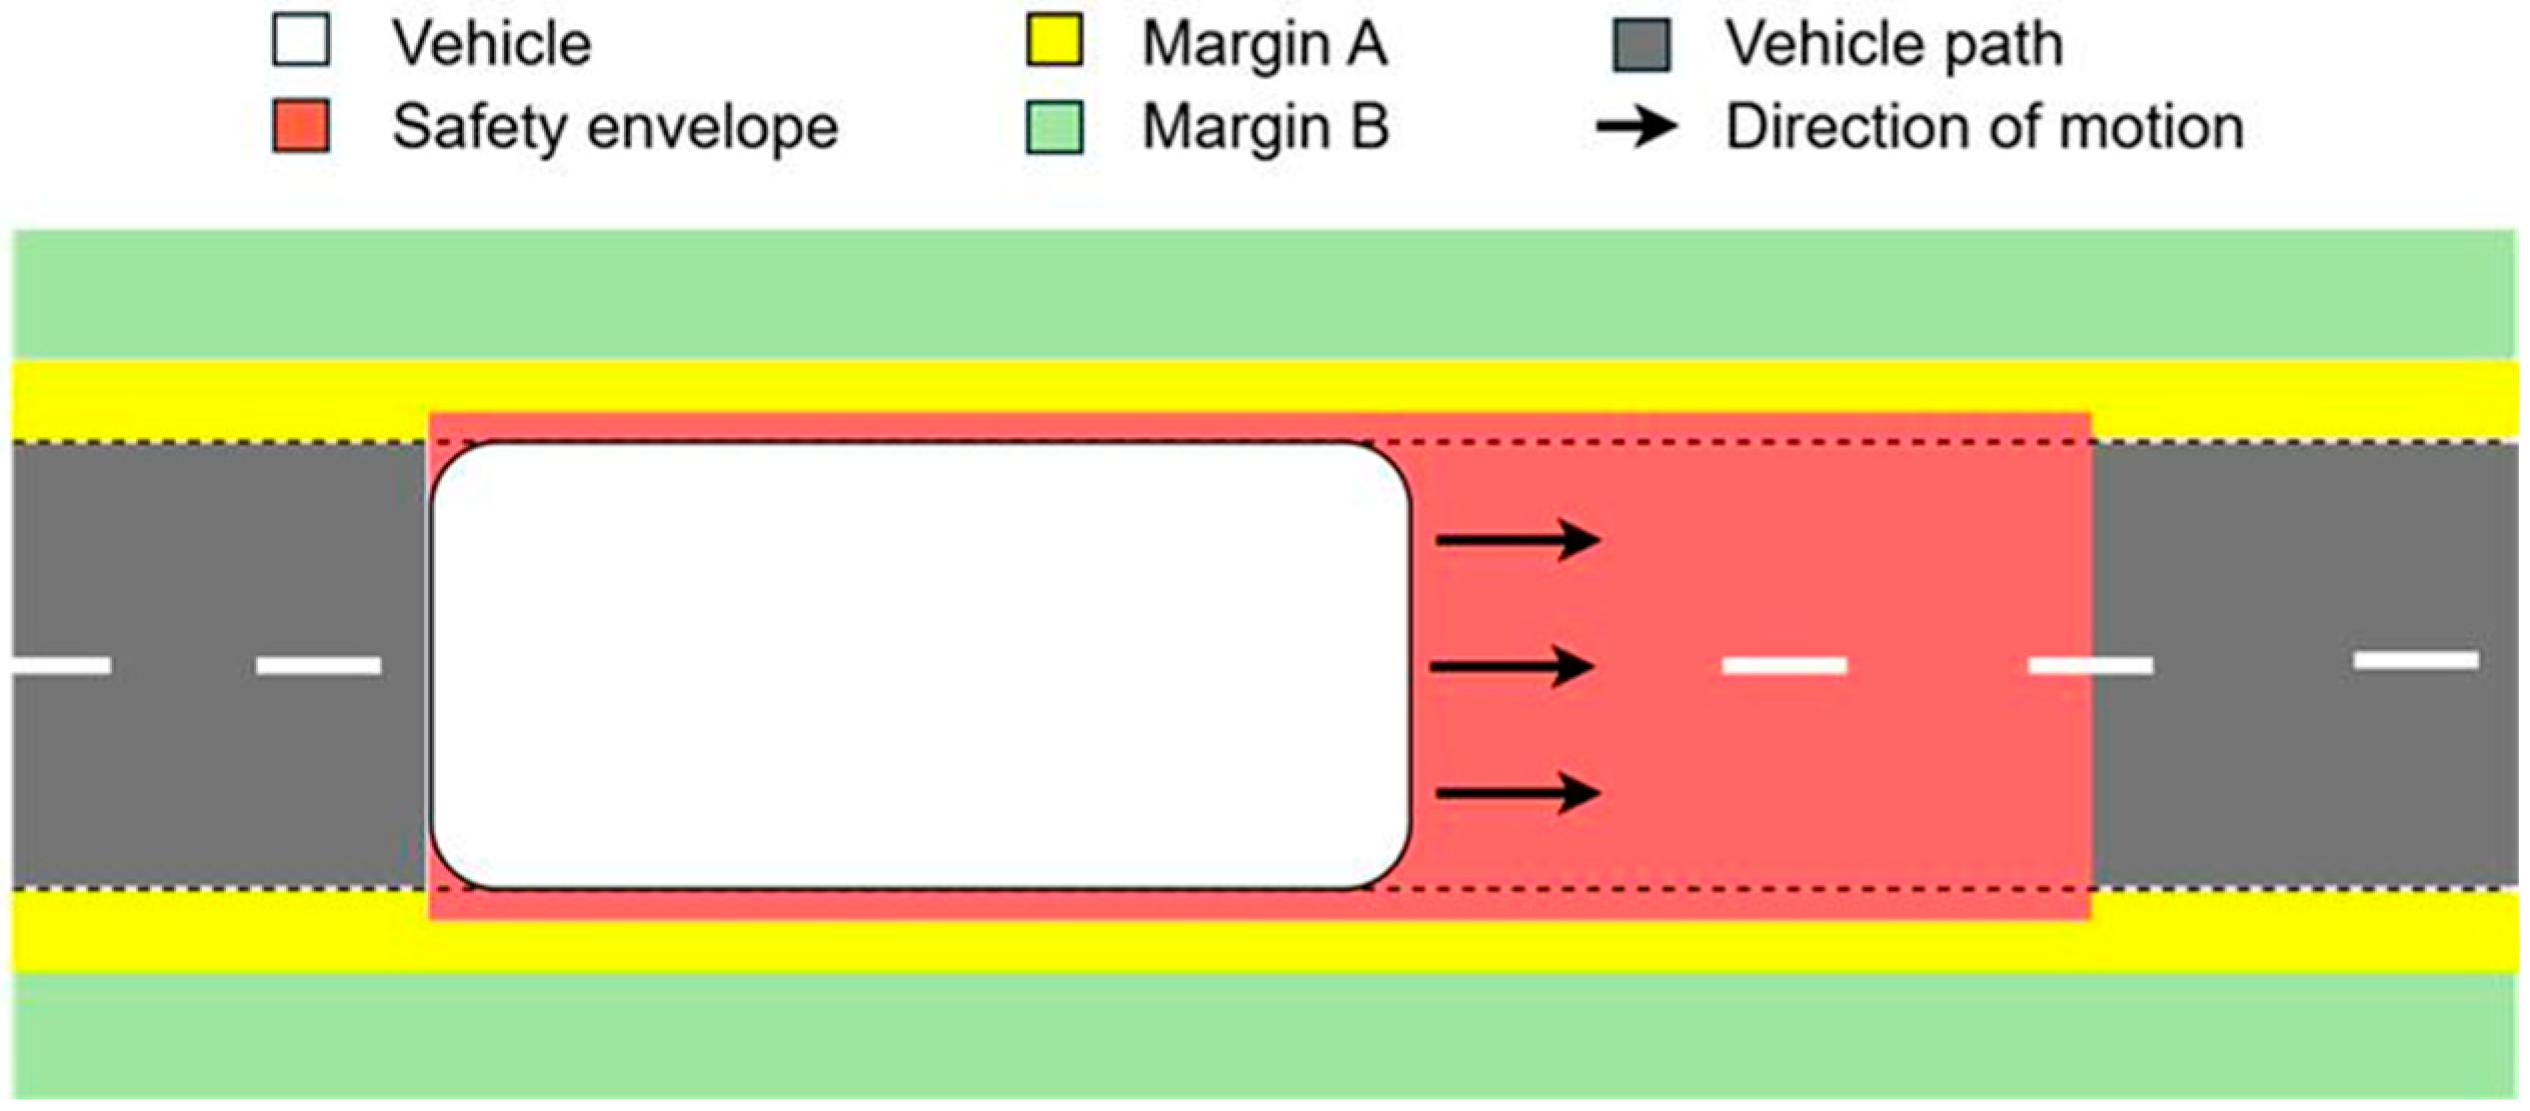
To support the interpretation of obstacle-related telemetry, Figure 3 schematizes the vehicle safety areas used by the onboard system. Around the planned vehicle path, the shuttle defines a central safety envelope and two surrounding buffer regions, denoted Margin A and Margin B, corresponding to progressively less critical proximity areas. The longitudinal extent of the safety envelope varies with vehicle speed, whereas the lateral extent of the safety envelope and the two margins are fixed. Obstacle detection within the safety envelope triggers a stop, whereas detection within the margins leads to speed reduction without a full stop, with Margin A corresponding to the stronger response. Although the exact scale is not reported, the elements shown in Figure 3 are represented with proportions consistent with their relative extent.
Figure 3.
Schematic representation of the vehicle safety areas.
3. Methodology
Raw shuttle telemetry is transformed into an interpretable representation of HB behavior through a four-stage workflow comprising route-aware preprocessing, deterministic HB detection, evidence-based HB attribution, and driving context characterization through clustering. Together, these steps produce both an event-level HB layer and a contextual representation of the operating regimes used in the empirical analysis.
3.1. Preprocessing
Raw telemetry is preprocessed to obtain a dataset suitable for event detection, attribution, and driving-context characterization. Preprocessing has two objectives: restricting the analysis to nominal in-service operation along the shuttle loop and isolating the autonomous-driving regime.
First, the telemetry is restricted to the operating zone. The onboard logs include auxiliary movements, most notably depot-related trajectories, that do not belong to nominal shuttle operation on the public route. These observations are removed by applying a spatial filter based on the shuttle’s front localization coordinates () and the operating area geometry. This ensures that the subsequent analysis only refers to in-service operation along the shuttle loop.
Second, the filtered telemetry is restricted to autonomous operation. This is performed using the operating-mode variable , retaining only observations corresponding to autonomous-driving mode. Other operating modes are excluded, as they reflect different control logics and are not representative of the operational regime targeted by this study.
3.2. Hard Braking Detection
HB detection is performed on the preprocessed telemetry. The detector combines the onboard longitudinal acceleration signal with a jerk estimate derived from measured speed using the true inter-sample time gaps. This formulation is adopted because the acceleration signal is recorded with limited numerical precision. Direct differentiation of this signal to compute jerk would amplify quantization effects and cause unstable estimates. By contrast, speed is recorded with higher precision and therefore provides a more reliable basis for jerk estimation under quasi-uniform sampling. The inter-sample time gaps used in the jerk estimator are computed directly from the original timestamps, which are preserved throughout the process. No resampling, interpolation, or gap-filling is applied. It is important to distinguish two types of gaps in the time series: short within-interval variations due to non-uniform sampling, which are used as true time deltas in the jerk computation, and longer discontinuities between separate operating intervals, which are excluded to avoid spurious estimates across non-contiguous driving segments. After preprocessing, no missing values remain for either speed or longitudinal acceleration, ensuring that the detector operates on a complete input at every retained observation.
Using a central finite-difference approximation adapted to irregular sampling, jerk at observation index is estimated by combining velocity differences over two neighboring intervals. The numerator represents the difference between forward and backward estimates of acceleration derived from velocity, while the denominator corresponds to the time interval between the midpoints of the adjacent segments. This formulation ensures consistency under nominally uniform sampling, as shown in Equation (1):
where denotes the longitudinal speed, the timestamp at index , and the longitudinal jerk.
Let denote the set of timestamps for which both longitudinal acceleration and jerk are defined. In accordance with Regulation (EU) 2022/1426 [22] for the case of unrestrained passengers, the set of detected HB points, , is defined as the set of observations in which acceleration falls at or below −2.4 m/s2 and jerk is lower than or equal to −5 m/s3. This definition is formalized in Equation (2):
Since a single physical braking maneuver may generate several consecutive HB points at high sampling frequency, point-level detections are aggregated into event-level candidates. Let the elements of be denoted as , ordered such that . A new candidate HB event is initiated at the first detected HB point and whenever two consecutive HB points are separated by more than a fixed aggregation gap , so that each resulting segment represents the start of a distinct braking event. In this context, consists of the timestamp of the first detected HB point together with the timestamps of all subsequent HB points that follow a gap exceeding , each marking the beginning of a new candidate HB event. The set of candidate HB events is therefore defined as shown in Equation (3):
with 3 s.
Since acceleration is taken directly from a dedicated onboard signal rather than derived from speed, a validation step is applied after temporal HB aggregation. Each candidate’s HB event in is retained only if at least one observation within a -second window shows a lower speed than at event onset. Denoting by the measured speed at time , the final set of detected HB events is defined as shown in Equation (4):
with 2 s. Each retained event is represented by the first HB point in its corresponding group of observations, providing a consistent event-level definition for subsequent attribution and contextual analysis.
This validation step complements the acceleration-based criterion by checking consistency with the observed speed trajectory, filtering cases where isolated acceleration–jerk exceedances are not followed by a sustained speed decrease. This helps avoid interpreting transient signal fluctuations as genuine HB maneuvers.
3.3. Hard Braking Attribution
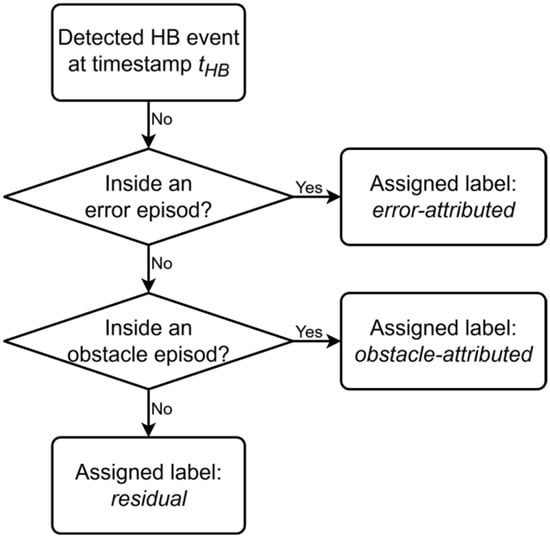
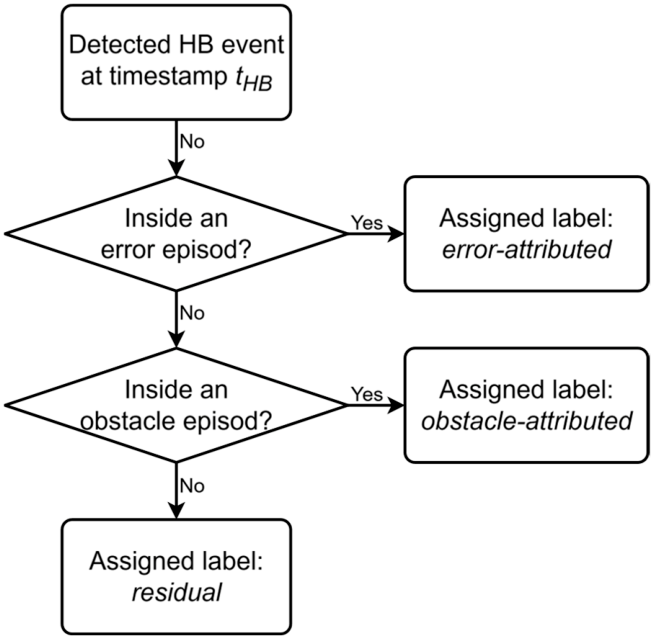
HB attribution is performed on the event-level HB set. Since the available telemetry does not provide verified ground-truth labels for the cause of each HB maneuver, attribution is treated as an evidence-based interpretation based on onboard error signals and obstacle-related indicators, rather than direct causal identification. Each event is assigned a single label through a fixed priority cascade with three mutually exclusive outcomes: error-attributed, obstacle-attributed, and residual (a category that encompasses all other causes). The underlying logic is illustrated in Figure 4.
Figure 4.
HB attribution flowchart.
The first stage of the cascade evaluates whether a detected HB event occurs during an error episode derived from the onboard diagnostic stream. In the available telemetry, diagnostic information records the active onboard error conditions at each timestamp and therefore provides a time-resolved indication of anomalous system behavior. In practice, the same error condition may persist across several consecutive rows and thus appear as a recurring sequence rather than as an isolated point occurrence. For attribution, the relevant object is therefore the contiguous time interval during which a given diagnostic condition remains active.
Let the error stream be partitioned into contiguous episodes. Each episode is represented by a closed interval , denoting respectively the timestamp of the first and last error row belonging to that episode. These episodes are constructed by grouping consecutive error rows while preserving temporal continuity, starting a new episode whenever the active error state changes or the time gap between consecutive error rows exceeds 3 s. The set of error-attributed HB events, , is therefore defined as shown in Equation (5):
Only HB events not matched to an error episode are passed to the second stage of the cascade. For each such event, obstacle evidence is evaluated over a fixed backward-looking window ending at the HB timestamp. Let denote the obstacle-attribution time window. The set of obstacle signals active in the interval is defined as shown in Equation (6):
with 10 s, selected as a compromise between sensitivity and specificity based on a comparison of 5 s, 10 s, and 15 s configurations, which show only moderate variation in aggregate attribution counts. Here, denotes any obstacle-related diagnostic signal defined in Table 1.
Using the active-signal set in Equation (6), the set of obstacle-attributed HB events (, is then defined as shown in Equation (7):
In this context, a signal is considered active if its recorded value differs from its predefined sentinel value, indicating the absence of detection.
When more than one obstacle signal is active for the same event, a single representative obstacle subtype is assigned through a fixed priority hierarchy reflecting the schema of Figure 3, expressed as . The assigned subtype corresponds to the highest-priority signal active in the look-back window. This rule preserves the mutually exclusive structure of the taxonomy while favoring the strongest available obstacle-related evidence.
This hierarchy is used only to assign a single representative obstacle subtype when multiple obstacle-related signals are active for the same already detected HB event. It does not affect whether an event is classified as obstacle-attributed, since this higher-level attribution only requires at least one active obstacle signal in the look-back window. The ordering reflects the operational meaning and relative criticality of the available signals. The envelope signal is assigned as the highest priority because it corresponds to an obstacle entering the safety envelope and triggering a stop response. Margin A and Margin B follow because they indicate progressively less critical proximity areas around the planned path, with Margin A associated with the stronger immediate speed-reduction response. Danger-zone detections are then prioritized over general on-track detections because they refer to conflict-prone or contextually annotated areas, whereas on-track detections provide broader evidence of an obstacle on the predefined path. The hierarchy should therefore be interpreted as a pragmatic rule for resolving overlapping telemetry evidence, not as proof that the selected signal is the unique cause of the HB event.
The residual class collects all events that are not supported by either source of evidence under the adopted rules. The set of residual HB events, , is therefore defined as shown in Equation (8).
For each event , the event location is matched to the nearest traffic light and to the nearest designated stop using haversine distance on the vehicle front-axle localization coordinates. A residual event is labelled as close-to-traffic-light when the nearest traffic light lies within 10 m, and as close-to-bus-stop when the nearest designated stop lies within 10 m. If none of the conditions are held, the HB event is considered unmatched. If both conditions are held, the event is assigned to the closer landmark.
3.4. Driving Context Characterization
The driving context is characterized by using a K-means clustering algorithm that aggregates observations from the available dataset into interpretable regimes. For clustering, the data stream is resampled to a 1 Hz representation in order to reduce redundancy and make observations comparable across the operating period. This is carried out within operating sessions, where a session is defined as a maximal contiguous interval of autonomous-driving observations such that the gap between consecutive timestamps does not exceed 2 s. Within each session, continuous variables are aggregated by arithmetic mean over 1 Hz bins, whereas discrete route-related variables are aggregated by mode. HB events are mapped onto the 1 Hz representation by assigning each detected event timestamp to the corresponding one-second bin.
For each retained one-second observation , the clustering feature vector , is defined as shown in Equation (9):
where all variables are expressed at 1 Hz: denotes speed, longitudinal acceleration, lateral acceleration, motor torque, hydraulic brake pressure and front steering angle. Together, these six signals capture the longitudinal and lateral dynamics as well as the control inputs of the vehicle, providing a compact representation of the driving state at each one-second interval.
Since K-means is distance-based, all clustering features are standardized before model fitting. The standardized value of feature for a one-second observation , denoted , is defined as shown in Equation (10):
where denotes the value of feature for the one-second observation , while and denote, respectively, the mean and standard deviation of feature .
Let denote the standardized feature vector of observation , and let be the number of clusters. For a given value of , the observations are partitioned into clusters by K-means to minimize the within-cluster sum of squares, as shown in Equation (11):
where is the set of observations assigned to cluster and is the corresponding centroid.
To improve the robustness of the selection of , candidate values are evaluated through repeated subsampling and K-means fitting. Specifically, eight random subsamples of 70,000 observations are drawn from the dataset. For each subsample and each candidate , K-means is fitted using K-means++ initialization, 20 random restarts, and Lloyd’s algorithm. The silhouette score and inertia are recorded for each fit.
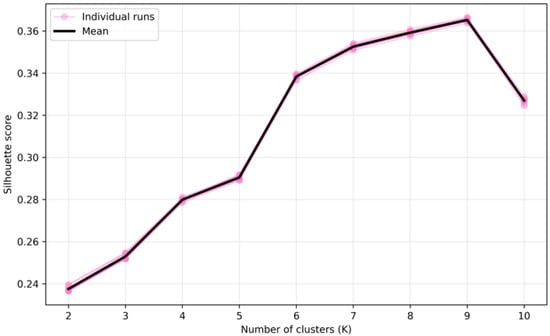
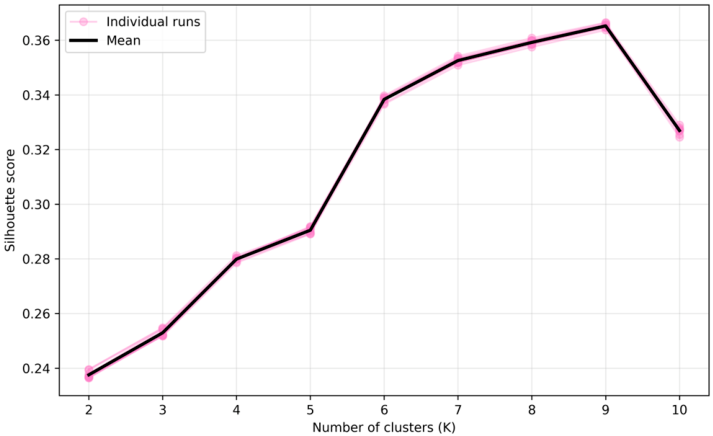
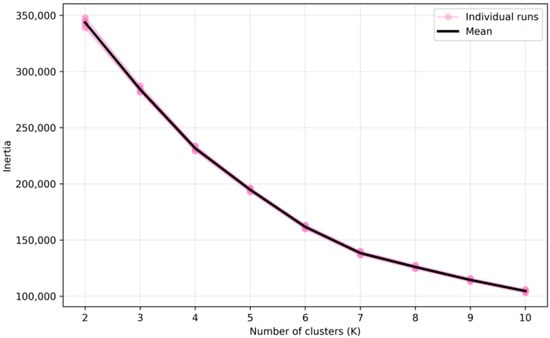
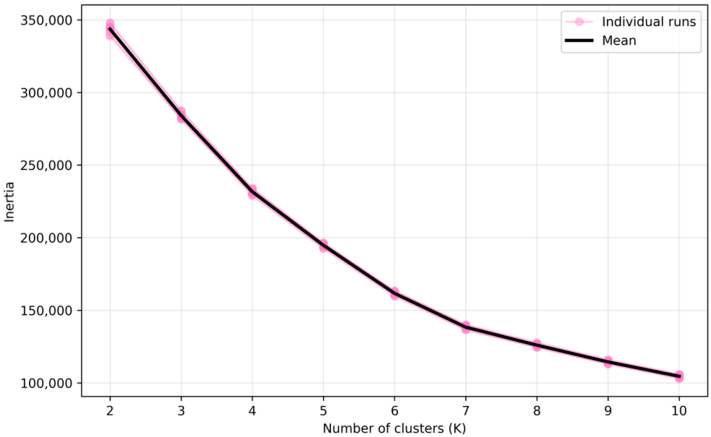
The results of this repeated model-selection procedure are summarized in Figure 5 and Figure 6. In both figures, thin colored lines represent individual repetitions, while the thick black line represents the mean across repetitions. As shown in Figure 5, the silhouette score increases up to 9 and then decreases at 10. Figure 6 shows that inertia decreases monotonically, with diminishing improvements for higher values of . On this basis, 9 is retained as the final number of clusters.
Figure 5.
Silhouette scores across candidate cluster numbers () under repeated K-means subsampling. Faint lines show individual runs; the black line shows the mean score across repetitions.
Figure 6.
Inertia across candidate cluster numbers () under repeated K-means subsampling. Faint lines show individual runs; the black line shows the mean across repetitions.
As a sensitivity check regarding the number of clusters, neighboring values of with similar silhouette scores to the retained 9 solution, were also examined. This analysis shows that lower- configurations preserve the main longitudinal regimes but tend to merge lateral-motion patterns that remain distinct in the nine-cluster solution. Given the operational relevance of lateral dynamics in the studied urban loop, which includes repeated bends, intersections, and constrained lane-following conditions, 9 provides the best interpretable compromise between statistical separation and domain-relevant operational interpretability. The resulting clusters are interpreted as descriptive operational regimes rather than natural or causal classes, and the retained partition should be viewed as one operationally useful representation of the telemetry space rather than the only valid one. Their role is to provide an interpretable context layer for comparing the frequency, spatial distribution, and attribution composition of HB events.
All data preprocessing, clustering (K-means), principal component analysis, and the related computations and visualizations are carried out in Python (version 3.11.14, Python Software Foundation, Wilmington, DE, USA), using the scikit-learn (version 1.8.0), NumPy (version 2.4.3), pandas (version 3.0.2), pyarrow (version 23.0.0), and Matplotlib (version 3.9.0) libraries.
4. Results
The application of the proposed workflow yields quantitative results at three complementary levels: event detection and attribution, clustering-based driving context characterization, and route-level association between HB events and recurrent local driving regimes. The results are presented from the construction of the reference HB event set to the identification of the main instantaneous driving contexts, and finally to the route-level interpretation of where HB events occur relative to the typical driving regime associated with each waypoint.
4.1. Hard Braking Detection and Attribution
The preprocessing stage reduced the raw telemetry to a route-consistent dataset restricted to nominal operation on the service loop. Starting from 16,670,518 raw observations, corresponding to 62 days of autonomous shuttle operation, a first spatial filtering step removes 3,848,130 records (23.08%) collected outside the operating zone, mainly corresponding to depot movements and maneuvers not belonging to the service route. A second filtering step then excludes records that cannot be reliably aligned with the reference route profile, including records with invalid or missing localization coordinates. After these steps, 11,917,096 observations are retained (71.49% of the initial dataset).
Applying the deterministic detector to the preprocessed telemetry yields 1269 HB points satisfying the acceleration–jerk threshold rule expressed in Equation (2). Following temporal aggregation based on the 3 s gap defined in Equation (3), these points form 835 candidate HB events, each representing a distinct braking maneuver. The speed-based validation described in Equation (4) retains 734 final HB events and removes 101 candidates, corresponding to 12.1% of the candidate event set, by ensuring consistency with the observed speed trajectory and filtering cases not followed by a sustained speed decrease.
The attribution cascade partitions the detected events into three mutually exclusive evidence-based classes. Under the retained specification, 11 events are matched to error episodes, 654 are obstacle-attributed, and 69 remain residual. In addition, 6 of the 69 residual events lie within 10 m of a fixed route landmark, specifically 5 near a traffic light and 1 near a shuttle stop.
4.2. Hard Braking Distribution Across Driving Contexts
The driving-context analysis is based on 316,280 one-second observations obtained from the 1 Hz representation of the preprocessed dataset after feature-based filtering. The retained nine-cluster solution is summarized in Table 2 through the mean values of the clustering variables and their standardized deviations from the global mean. Cluster labels are assigned a posteriori by inspecting centroid profiles, so that each label reflects the dominant kinematic or actuation signature of the corresponding cluster. Under this criterion, the retained regimes describe low-speed driving, decelerating, high-speed driving, accelerating, friction braking, turning right, gently turning right, turning left, and gently turning left.
Table 2.
Mean values and corresponding standardized deviations from the global mean for the variables retained in the clustering analysis, reported for each cluster together with the assigned label.
Table 2 shows that the longitudinal regimes are primarily separated by the combined behavior of speed, longitudinal acceleration, motor torque, and brake pressure, whereas the turning regimes are mainly distinguished by the sign and magnitude of lateral acceleration and steering angle. In particular, friction braking is characterized by high hydraulic brake pressure at low speed, decelerating by negative longitudinal acceleration and motor torque, accelerating by positive longitudinal acceleration and high motor torque, and high-speed driving by the highest mean speed. Turning regimes are differentiated by the sign of lateral acceleration and steering angle, with the “gently” turning clusters exhibiting milder lateral dynamics than the corresponding full-turning regimes. The coexistence of left- and right-turning regimes near some stops requires route-specific interpretation. Because the shuttle operates in mixed traffic rather than on a dedicated lane, predefined virtual tracks were introduced during commissioning to define admissible approach and exit trajectories. Some stops were positioned slightly off the nominal track to account for road geometry, parked vehicles, roadside obstacles, and overtaking requirements. As a result, the shuttle performs both entry and rejoining maneuvers near these stops, explaining the presence of both turning directions around the same station.
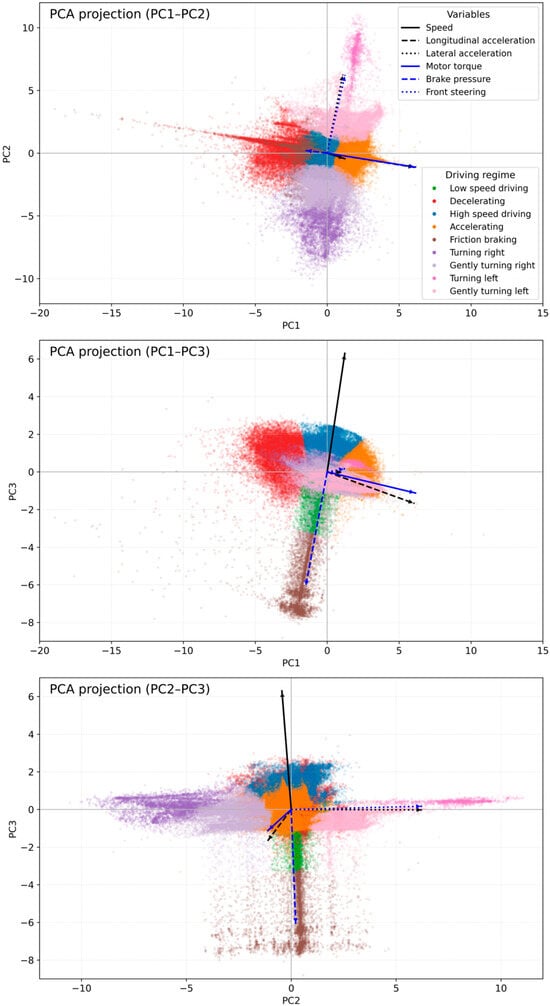
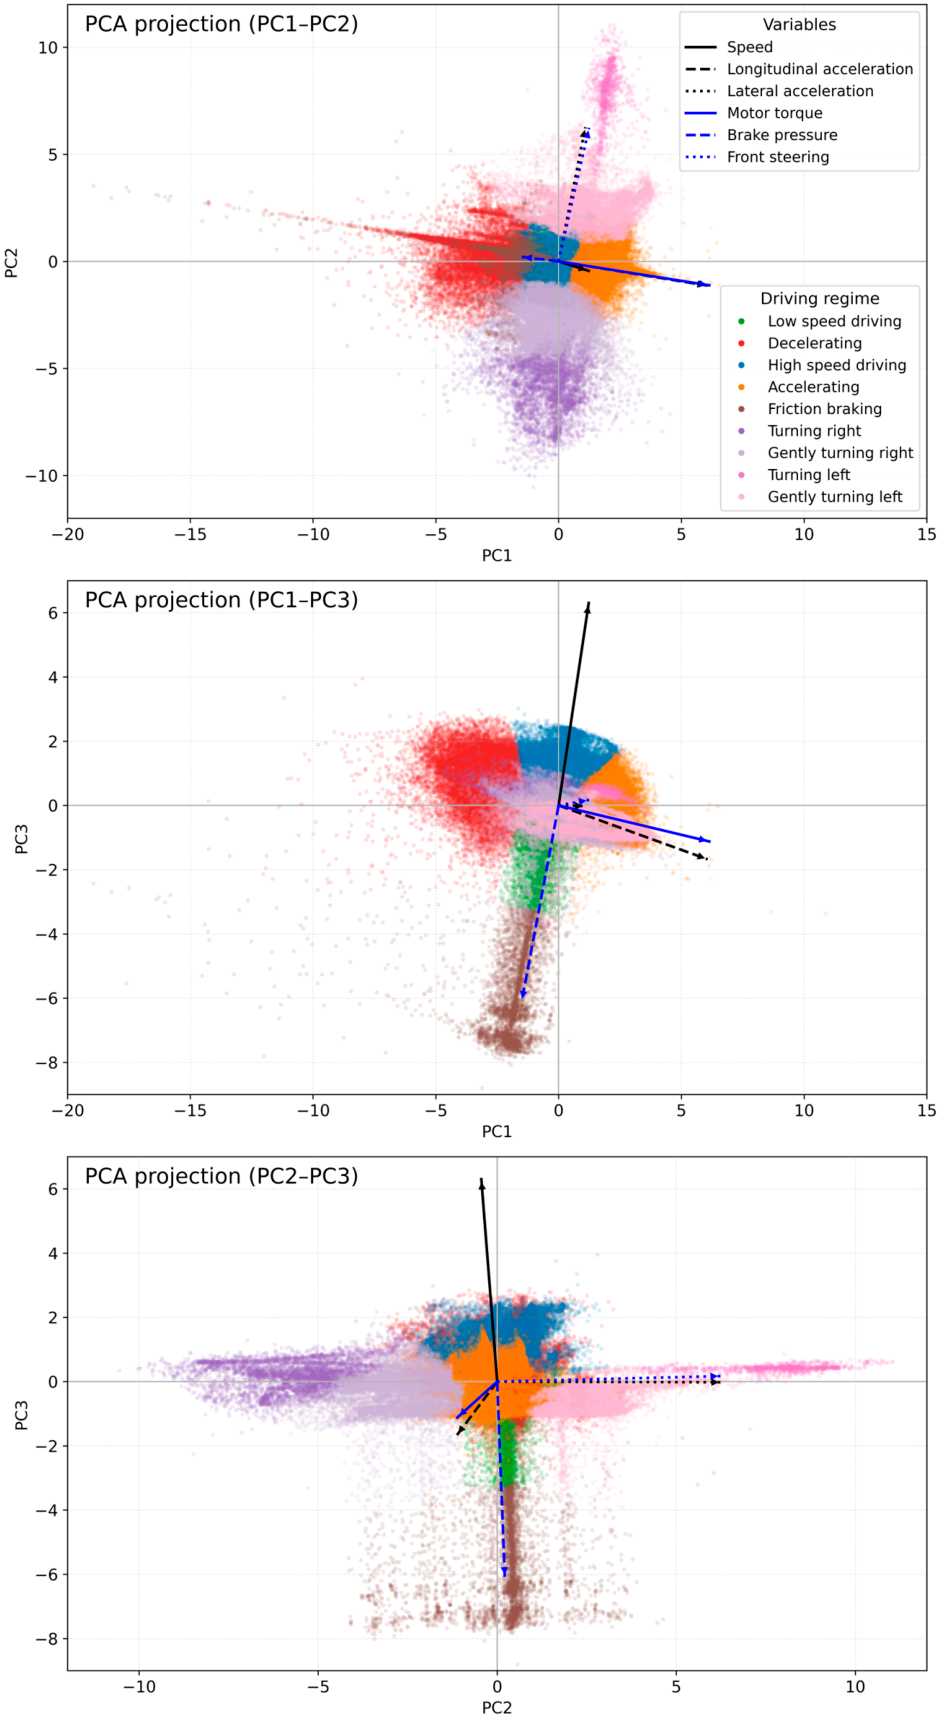
For the retained configuration, the first principal component (PC) explains approximately 31.83% of the total variance, the second 26.14%, and the third 19.26%, for a cumulative share of about 77.23%. The corresponding pairwise principal component analysis (PCA) projections (PC1–PC2, PC1–PC3, and PC2–PC3) are presented in Figure 7, providing a compact visualization of the retained clustering structure and of the role of the original variables in separating the regimes.
Figure 7.
Principal component analysis (PCA) projections of the retained nine-cluster driving-context solution in the PC1–PC2, PC1–PC3, and PC2–PC3 planes, with loading vectors overlaid.
In the PC1–PC2 plane, the feature vectors indicate that longitudinal and lateral variables contribute along distinct directions, allowing braking, accelerating, and turning regimes to occupy separate regions. In the PC1–PC3 plane, the strongest separation occurs between friction-braking observations and the remaining regimes, while longitudinal driving regimes remain concentrated in the central portion of the plot. In the PC2–PC3 plane, left- and right-turning regimes are more clearly distinguished, consistent with the role of lateral acceleration and steering angle in cluster definition.
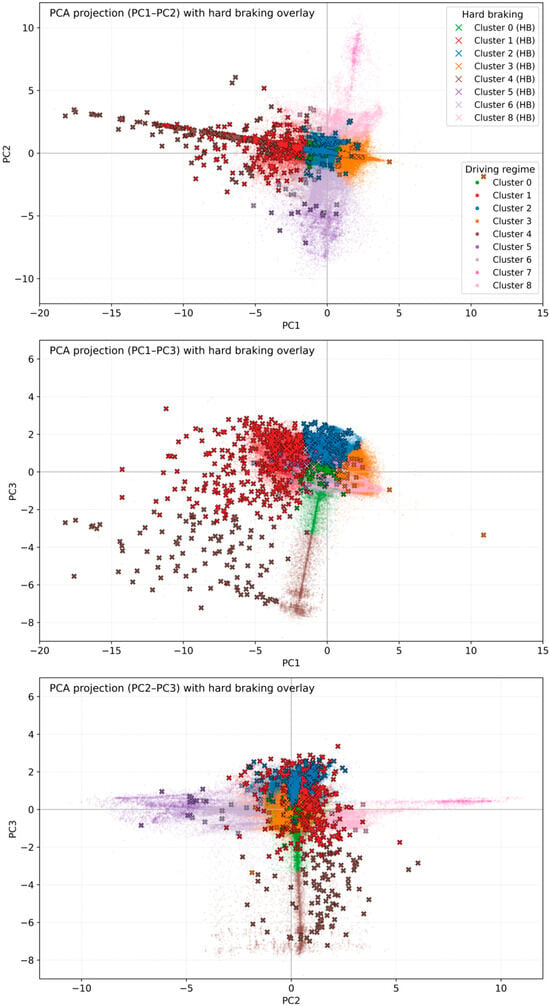
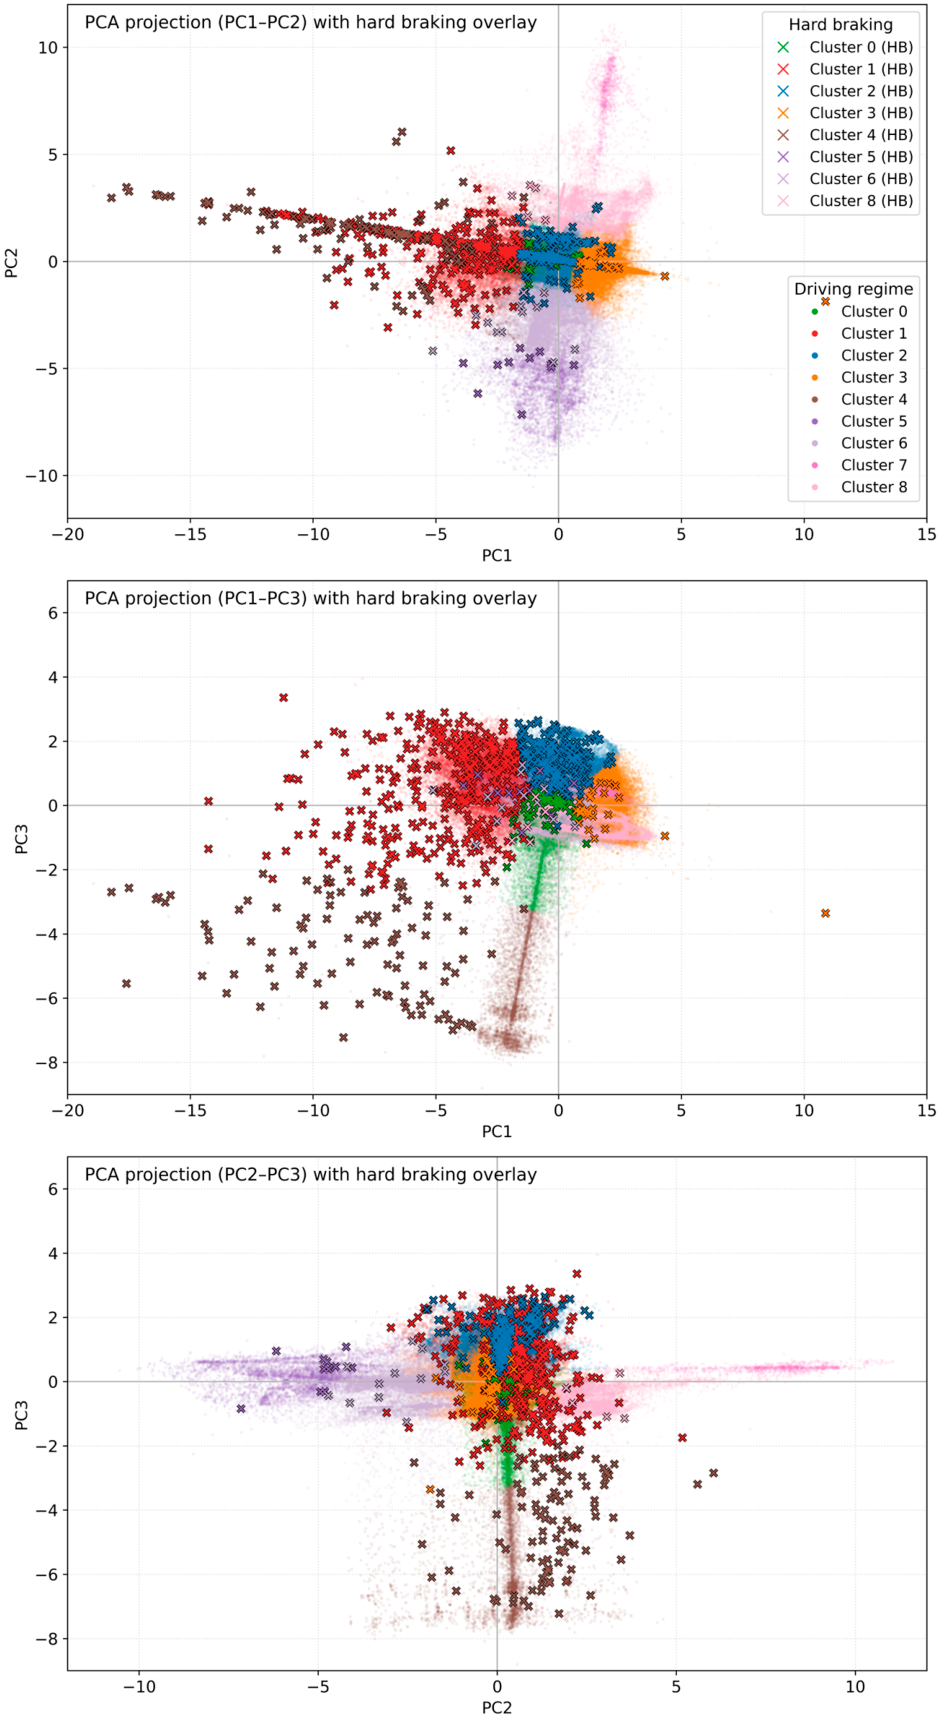
To make explicit how detected HB events distribute with respect to the retained driving contexts, Figure 8 overlays HB events onto the PCA projections, with events colored according to their instantaneous cluster membership.
Figure 8.
PCA projections of the driving-context data in the PC1–PC2, PC1–PC3, and PC2–PC3 planes, with HB events overlaid and colored by instantaneous cluster membership.
Across the three projections, HB events are concentrated primarily in the decelerating and friction braking clusters, with a non-negligible presence also in high-speed driving and accelerating. This result is coherent with the event definition itself, since abrupt braking is identified through strong deceleration and jerk conditions and is therefore expected to populate braking-oriented instantaneous states. For this reason, the instantaneous clustering of HB events is informative as a consistency check of the retained contexts but provides only limited insight into their route-level distribution.
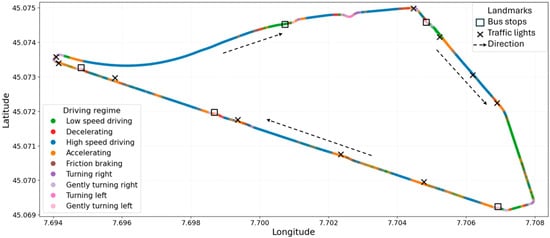
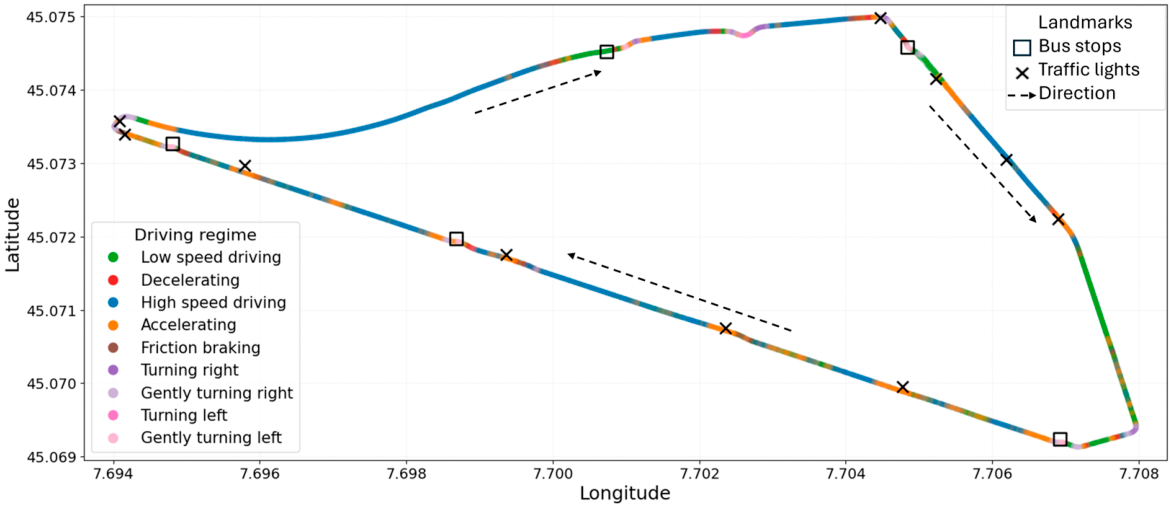
While Figure 7 and Figure 8 summarize the retained clustering solution in the reduced feature space, they do not capture how the identified driving contexts are distributed along the route. In particular, the instantaneous cluster assigned to an HB event does not describe the regime that typically characterizes the route location where the event occurs. To complement this view, each route waypoint is assigned a representative driving regime based on the modal cluster of the observations associated with it across repeated traversals of the loop. Since the shuttle operates on a fixed route and each waypoint is observed multiple times over the service period, the modal assignment provides a route-level characterization of typical driving behavior at each location. Accordingly, cluster labels are interpreted not only as instantaneous states, but also as recurrent local regimes associated with specific portions of the route.
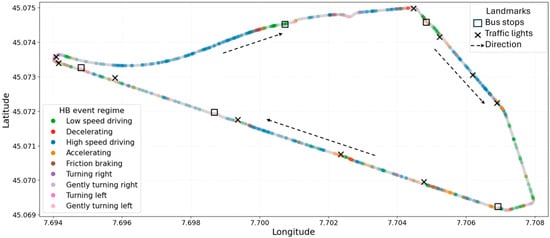
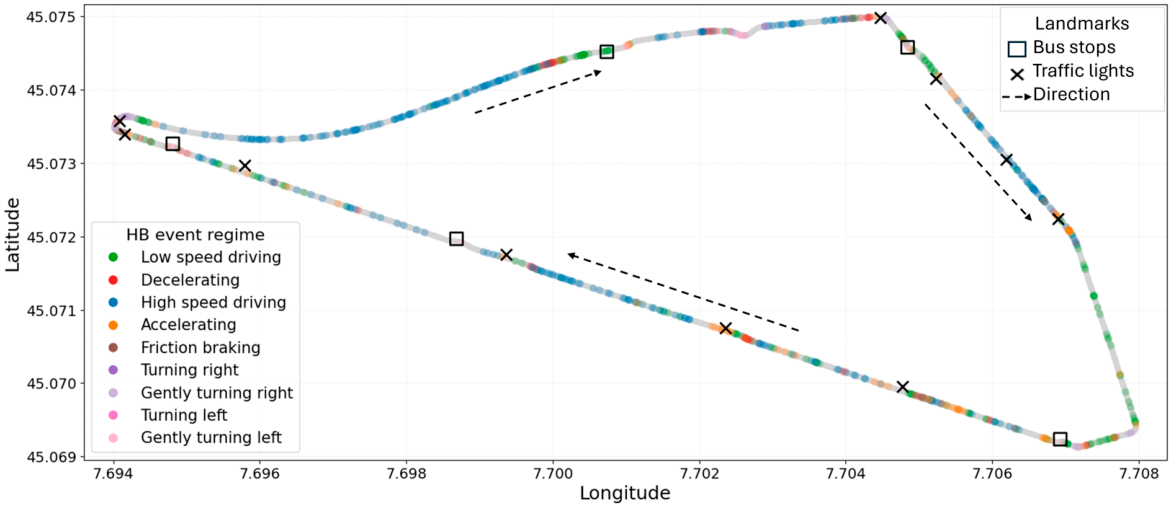
The resulting waypoint-level modal classification is shown in Figure 9. Building on this characterization, each detected HB event is associated with the modal regime of the corresponding waypoint. Figure 10 reports the spatial distribution of HB events under this representation, showing where HB events occur along the route and which recurrent driving regimes are most frequently associated with them. This step links HB occurrence to the typical driving context of each route segment, beyond instantaneous cluster membership.
Figure 9.
Entire shuttle loop colored by waypoint modal cluster.
Figure 10.
Spatial distribution of HB events along the shuttle loop, colored according to the modal driving regime of the waypoint at which each event occurs.
Finally, Table 3 summarizes the distribution of HB events across the waypoint-level modal driving regimes. For each regime, the table reports both its prevalence in the 1 Hz dataset and the corresponding share of HB events assigned to waypoints characterized by that regime. This comparison makes it possible to assess whether HB occurrence is proportional to the overall exposure of each regime along the route, or whether some recurrent route-level driving regimes are associated with HB events more frequently than expected from their baseline prevalence. In the retained case study, high-speed driving accounts for 23.79% of the 1 Hz observations but 43.19% of the detected HB events, whereas low-speed driving accounts for 36.37% of the observations but only 26.70% of the HB events. The remaining regimes display either comparable or lower HB shares relative to their baseline prevalence.
Table 3.
Comparison between the prevalence of waypoint-level modal driving regimes in the 1 Hz dataset and their share of detected HB events.
5. Discussion
The analysis of the dataset from the experimental shuttle deployment shows that HB is not an isolated or randomly distributed phenomenon but a recurrent operational pattern. The proposed workflow is useful precisely because it allows these events to be read through multiple lenses at once: their frequency, the type of evidence that accompanies them, the instantaneous vehicle state in which they are detected, and the typical way the shuttle drives at the route locations where they occur. Taken together, these layers provide a more informative picture than HB counting alone.
The first result concerns attribution. Within the retained evidence-based cascade, only 11 HB events are matched to error episodes, whereas 654 are obstacle-attributed and 69 remain residual. This strongly unbalanced split suggests that HB is associated much more often with proximity-related evidence than with explicitly logged onboard faults. However, the result should not be read as a direct causal decomposition of all events. The attribution logic was deliberately defined as evidence-based: it identifies whether diagnostic or obstacle signals are present under transparent temporal rules, but it does not reconstruct the full scene in which the maneuver occurred. For this reason, the obstacle-attributed class is best interpreted as the dominant evidence-supported category within the available telemetry, rather than as a definitive causal label.
The residual class also deserves a case-specific interpretation. Only 6 of the 69 residual events lie within 10 m of a fixed route landmark, specifically 5 near a traffic light and 1 near a shuttle stop. This suggests that the residual category cannot be reduced to a simple proxy for routine infrastructure-driven braking. Rather, it likely contains a mixture of events for which the retained telemetry does not provide sufficiently specific evidence, including interactions or operational triggers that are only partially reflected in the available signals.
A second point concerns the interpretation of the clustering stage. The retained nine-cluster solution distinguishes a partition of longitudinal and lateral regimes that meaningfully reflects the urban operating environment of the shuttle. However, the case study also highlights an important interpretive limit of instantaneous clustering. Since cluster membership is determined from synchronous one-second values of speed, longitudinal and lateral acceleration, motor torque, brake pressure, and steering angle, the assigned cluster describes the operating state observed at the event timestamp, not the sequence of states that led to it. Under this perspective, it is not especially informative that many HB events fall within braking-related instantaneous clusters, because strong braking is already implicit in the event definition itself.
This is why the route-level modal assignment becomes central for interpretation. By assigning each waypoint to the modal cluster observed across repeated traversals, the analysis characterizes how the shuttle typically behaves at each point of the loop. This produces a route-level reference that is analytically distinct from the instantaneous cluster of an individual event. When the HB events are projected onto this waypoint-level characterization, a more informative pattern emerges. In particular, high-speed driving accounts for 23.79% of the 1 Hz observations and 43.19% of the HB events, whereas low-speed driving accounts for 36.37% of the observations and 26.70% of the HB events. The remaining regimes are either roughly proportional or under-represented in the HB distribution. In other words, HB does not appear primarily at route points that are typically characterized by routine braking or low-speed maneuvering. Instead, it appears disproportionately associated with locations that are normally traversed under relatively faster conditions, although this pattern may also reflect differences in road function and operational exposure across segments.
This result is particularly important because it avoids tautological interpretation. If the analysis were limited to instantaneous cluster membership, the main message would simply be that HB events occur in braking-oriented states. That would be true, but not especially useful. For the Turin case study, this suggests that HB tends to arise as an interruption of relatively unconstrained motion along the loop, rather than as a continuation of locations that are already typically associated with low-speed or braking-dominated behavior. This association, however, should not be interpreted in a direct causal sense. An alternative interpretation is that these route segments differ not only in prevailing speed, but also in operational context, for example more open alignment, greater visibility, or a higher likelihood of encountering external disturbances such as bicycles, all of which may increase the probability of situations requiring sudden braking.
This interpretation is broadly consistent with previous research that treats HB as a surrogate indicator of safety-critical situations in connected and automated driving contexts [13]. In particular, recent telematics-based studies have shown that HB events are significantly associated with elevated short-term crash risk and can provide useful evidence on safety-relevant driving conditions [14]. At the same time, spatial analyses of telematics-derived surrogate safety measures have demonstrated that abrupt braking patterns are often shaped by localized roadway and traffic characteristics [15]. Compared with these studies, however, the present framework provides a more integrated interpretation by explicitly linking event detection to operational attribution and route-level driving regimes. In the case of autonomous shuttle operations, this route-level perspective helps reveal recurrent exposure-related patterns that would remain less visible in event-centric analyses alone.
The presence of turning-related clusters adds another useful element to this interpretation. Their inclusion shows that the clustering procedure is sensitive not only to longitudinal dynamics but also to lateral behavior, which is particularly relevant in an urban loop with repeated bends, intersections, and lane-following constraints. Consistent with the qualitative sensitivity check conducted on neighboring values of , the retained nine-cluster solution is considered preferable because it preserved a clearer description of lateral-motion patterns. In this sense, the distinction between stronger and milder turning regimes should be understood as a descriptive refinement of the telemetry space, useful for route-level interpretation, rather than as evidence of sharply separated maneuver classes. Yet these turning regimes are only marginally represented in the HB distribution at the route level. This suggests that, in the analyzed deployment, abrupt braking is not primarily concentrated at route locations whose typical modal signature is one of lateral maneuvering.
Overall, the Turin case study supports a coherent reading of the results. HB is rarely associated with logged internal errors, is most often accompanied by obstacle-related evidence, and tends to occur at route locations whose prevailing regime is not routine braking, but relatively faster travel. This does not reveal the full causal chain leading to each event, nor does it solve the limitations of working without temporal-sequence modeling or scene-level reconstruction. It does, however, show that the combination of detection, attribution, and route-level regime characterization can reveal operational patterns that would remain hidden if HB events were treated only as threshold exceedances.
Consistent with earlier telematics-based and jerk-oriented interpretations of safety-critical maneuvers, including the approaches proposed by Liu et al. [10], Ziakopoulos [9], and Bagdadi and Várhelyi [11,12], the present analysis highlights the relevance of abrupt longitudinal actions as operationally meaningful safety indicators. A distinguishing element of the present framework, however, is that it is based on real-world telemetry from an autonomous shuttle service operating under repeated urban conditions, rather than on broader telematics datasets or controlled experimental settings. This may help explain some of the observed differences, particularly the route-level over-representation of HB events in segments typically associated with high-speed driving. Such differences likely reflect not only instantaneous vehicle dynamics but also the local interaction structure of the operational environment, including route geometry, traffic conditions, visibility, and the presence of VRUs. Taken together, these aspects underline the importance of context-aware analysis when interpreting surrogate safety indicators in autonomous mobility systems.
The proposed framework has several relevant implications for the development and deployment of autonomous mobility systems. From a validation perspective, combining HB detection, attribution, and route-level characterization makes it possible to prioritize safety-relevant operational scenarios for further assessment. In practice, recurrent contextual configurations associated with HB events—such as pedestrian interaction zones or reduced-visibility segments—can be translated into representative scenarios for simulation-based testing and validation of autonomous driving functions. From an operational standpoint, the systematic over-representation of HB events in specific route segments can support targeted service refinement. Rather than suggesting network-wide changes, the results help identify localized sections where speed profiles, anticipation margins, or route geometry may require closer inspection or recalibration. More broadly, repeated event concentration at particular locations may also indicate where minor infrastructure or traffic-management measures—such as improved visibility at crossings or clearer right-of-way definition—could reduce the need for abrupt braking and contribute to smoother autonomous shuttle operations.
6. Conclusions
This study sets out to answer three research questions through a general telemetry-based workflow for the detection and characterization of HB in autonomous shuttle operations.
The first question asked what share of detected HB events can be attributed to error episodes and, among the remainder, how often obstacle-related signals provide supporting evidence. The results show a clear imbalance: only a small fraction of the detected events is linked to onboard diagnostic errors, whereas most are supported by obstacle-related evidence. More generally, this means that the proposed attribution framework is able to separate different evidence sources in a transparent way, and that, in the analyzed data, proximity-related signals emerge as the dominant explanatory layer.
The second question asked whether residual HB events exhibit systematic spatial concentration near specific route segments or landmarks. The answer is only partial. A small subset of residual events occurs near traffic lights or shuttle stops, but most of them are not captured by this proximity criterion. In general terms, this suggests that the residual class remains heterogeneous and that fixed route landmarks alone are not sufficient to explain it. The framework is therefore useful for isolating these unmatched events, but their interpretation would benefit from richer information than the current telemetry provides.
The third question asked whether the driving contexts identified through K-means display meaningful differences in HB occurrence. The results indicate that they do, but also that the most informative interpretation is obtained when those contexts are projected back onto the route. At the instantaneous level, clusters describe synchronous vehicle states and are therefore only partly informative for HB interpretation. At the waypoint level, however, they become recurrent local driving regimes, and the comparison between their baseline prevalence and their HB share shows that some regimes are over-represented in the HB distribution, although this over-representation could be interpreted as an operational association and may partly reflect segment-level differences in road function and exposure. However, this confirms that clustering can support HB analysis if it is used not only to label the event timestamp, but also to characterize how the shuttle typically drives at the location where the event occurs.
Taken together, these findings support the main contribution of the paper. The value of the proposed workflow does not lie only in detecting HB events from irregular telemetry, but in turning those detections into an interpretable operational layer that combines evidence source, vehicle state, and route-level driving regime. In this sense, the methodology is general, while the empirical patterns observed here remain specific to the Turin deployment.
This study has some limitations that should be acknowledged. First, the analysis is based on data collected from a specific autonomous shuttle service operating in a single urban environment, which may limit the generalizability of the findings to other contexts. Second, the proposed framework relies on vehicle telemetry data without access to external ground truth information (e.g., detailed traffic conditions or pedestrian interactions), which constrains the interpretation of the underlying causes of HB events. Furthermore, the attribution mechanism is evidence-based and does not imply causal relationships between observed factors and braking events.
Several directions for future work follow naturally from these results and limitations. Extending the analysis period would make it possible to test the temporal stability of the observed patterns. Applying the same workflow to other LSAD services would help assess its transferability across deployments. More importantly, richer scene-level data or temporal models could improve the interpretation of both residual events and the pre-event driving regime, which are precisely the points where the current analysis remains most limited, and could also help disentangle the role of speed from other segment-level characteristics such as road function, visibility, and exposure to disturbances.
Author Contributions
Conceptualization, B.C. and I.A.C.A.; methodology, B.C., E.G. and I.A.C.A.; software, E.G., I.A.C.A.; validation, F.F. and S.N.; formal analysis, B.C., E.G. and I.A.C.A.; investigation, B.C., E.G., F.F. and I.A.C.A.; resources, B.C.; data curation, S.N.; writing—original draft preparation, E.G.; writing—review and editing, A.A., B.C., E.G., F.F., I.A.C.A., S.C., S.N.; visualization, B.C., E.G., I.A.C.A., S.N.; supervision, B.C., E.G.; project administration, B.C.; funding acquisition, B.C. All authors have read and agreed to the published version of the manuscript.
Funding
This research has been carried out within the framework of the ToMove initiative (PNRR Missione 1– Componente 1– Asse 1 Investimento 1.4.6- Fondo complementare PNRR PROGETTO: Living Lab Comune di Torino– “ToMove” CODICE CUP: C15C22007220001), supported by the MaaS4Italy project, funded under the Italian National Recovery and Resilience Plan (NRRP) and the National Complementary Plan (PNC), and promoted by the Department for Digital Transformation with the support of the Ministry of Infrastructure and Transport.
Data Availability Statement
The data that support the findings of this study are not publicly available due to privacy and confidentiality constraints related to third-party agreements. Data are, however, available from the corresponding author upon reasonable request, subject to approval by the data providers.
Acknowledgments
The authors would like to thank Augusto Fasano of the University of Turin for his valuable support. During the preparation of this study, the authors used ChatGPT 5.4 (OpenAI, San Francisco, CA, USA) for literature review, writing and coding assistance. The authors reviewed and edited all outputs and take full responsibility for the content of this publication.
Conflicts of Interest
The authors declare no conflicts of interest.
Abbreviations
The following abbreviations are used in this manuscript:
| HB | Hard Braking |
| LSAD | Low-Speed Automated Driving |
| ODD | Operational Design Domain |
| PC | Principal Component |
| PCA | Principal Component Analysis |
| VRU | Vulnerable Road User |
References
- Zawieska, J.; Lodi, C.; Cheimariotis, I.; Piazza, F.; Rataj, M.; Stepniak, M.; Grosso, M.; Marotta, A. Research and innovation in smart mobility in Europe; Publications Office of the European Union: Luxembourg, 2025; Available online: https://data.europa.eu/doi/10.2760/5239530 (accessed on 5 May 2026).
- European Commission. Sustainable and Smart Mobility Strategy—Putting European Transport on Track for the Future. 2020. Available online: https://eur-lex.europa.eu/legal-content/EN/TXT/?uri=celex:52020DC0789 (accessed on 5 May 2026).
- European Commission. The New EU Urban Mobility Framework. 2021. Available online: https://eur-lex.europa.eu/legal-content/EN/TXT/?uri=celex:52021DC0811 (accessed on 5 May 2026).
- Vass, S.; Donà, R.; Mattas, K.; Morandin, G.; Toth, B.; Heé, M.Á.; Galassi, M.C.; Ciuffo, B. Are low-speed automated vehicles ready for deployment? Implications on safety and urban traffic. Transp. Res. Part C Emerg. Technol. 2025, 181, 105393. [Google Scholar] [CrossRef] [Scilit]
- Avignone, A.; Bassani, M.; Borgogno, B.; Caroleo, B.; Chiusano, S.; Princiotto, F. Evaluating unsignalized crosswalk safety in the age of autonomous vehicles. Comput. Ind. 2025, 167, 104259. [Google Scholar] [CrossRef] [Scilit]
- Anund, A.; Ricker, L.; Caroleo, B.; Hardestam, H.; Dahlman, A.; Skogsmo, I.; Nicaise, M.; Arnone, M. Lessons learned from setting up a demonstration site with autonomous shuttle operation based on experience from three cities in Europe. J. Urban Mobil. 2022, 2, 100021. [Google Scholar] [CrossRef] [Scilit]
- Debbaghi, F.-Z.; Rombaut, E.; Vanhaverbeke, L. Lessons learned from shared automated vehicles pilots in Europe: An evaluation of safety, traffic, and user acceptance. Case Stud. Transp. Policy 2025, 20, 101447. [Google Scholar] [CrossRef] [Scilit]
- Do, W.; Saunier, N.; Miranda-Moreno, L. Evaluation of conventional surrogate indicators of safety for connected and automated vehicles in car following at signalized intersections. Transp. Res. Rec. 2025, 2679, 1118–1133. [Google Scholar] [CrossRef] [Scilit]
- Ziakopoulos, A. Analysis of harsh braking and harsh acceleration occurrence via explainable imbalanced machine learning using high-resolution smartphone telematics and traffic data. Accid. Anal. Prev. 2024, 207, 107743. [Google Scholar] [CrossRef] [Scilit] [PubMed]
- Liu, L.; Racz, D.; Vaillancourt, K.; Michelman, J.; Barnes, M.; Mellem, S.; Eastham, P.; Green, B.; Armstrong, C.; Bal, R.; et al. Smartphone-based hard-braking event detection at scale for road safety services. Transp. Res. Part C Emerg. Technol. 2023, 146, 103949. [Google Scholar] [CrossRef] [Scilit]
- Bagdadi, O.; Várhelyi, A. Jerky driving—An indicator of accident proneness? Accid. Anal. Prev. 2011, 43, 1359–1363. [Google Scholar] [CrossRef] [Scilit] [PubMed]
- Bagdadi, O.; Várhelyi, A. Development of a method for detecting jerks in safety critical events. Accid. Anal. Prev. 2013, 50, 83–91. [Google Scholar] [CrossRef] [Scilit] [PubMed]
- Wang, C.; Xie, Y.; Huang, H.; Liu, P. A review of surrogate safety measures and their applications in connected and automated vehicles safety modeling. Accid. Anal. Prev. 2021, 157, 106157. [Google Scholar] [CrossRef] [Scilit] [PubMed]
- Joshi, M.; Bamney, A.; Wang, K.; Zhao, S.; Ivan, J.; Jackson, E. Analyzing the suitability of vehicle telematics data as a surrogate safety measure for short-term crashes. Transp. Res. Rec. 2025, 2679, 489–504. [Google Scholar] [CrossRef] [Scilit]
- Nikolaou, D.; Ziakopoulos, A.; Kontaxi, A.; Theofilatos, A.; Yannis, G. Spatial analysis of telematics-based surrogate safety measures. J. Saf. Res. 2025, 92, 98–108. [Google Scholar] [CrossRef] [Scilit] [PubMed]
- SAE International. J3016_202104: Taxonomy and Definitions for Terms Related to Driving Automation Systems for On-Road Motor Vehicles. Available online: https://www.sae.org/standards/j3016_202104-taxonomy-definitions-terms-related-driving-automation-systems-road-motor-vehicles (accessed on 5 May 2026).
- Torino City Lab. To Move. Available online: https://torinocitylab.it/en/to-move (accessed on 5 May 2026).
- Ohmio Vehicles. Ohmio Vehicles|Advanced Autonomous Electric Shuttles and Buses. Available online: https://www.ohmio.com/vehicle-details (accessed on 5 May 2026).
- GTT. Available online: https://www.gtt.to.it/cms (accessed on 5 May 2026).
- CinqueT. Available online: https://cinquet.it/ (accessed on 5 May 2026).
- Gazzetta Ufficiale. Available online: https://www.gazzettaufficiale.it/eli/id/2018/04/18/18A02619/SG (accessed on 4 May 2026).
- European Commission. Commission Implementing Regulation (EU) 2022/1426 of 5 August 2022 laying down rules for the application of Regulation (EU) 2019/2144 of the European Parliament and of the Council as regards uniform procedures and technical specifications for the type-approval of the automated driving system (ADS) of fully automated vehicles. Off. J. Eur. Union 2022, L 221, 1–64. Available online: http://data.europa.eu/eli/reg_impl/2022/1426/oj (accessed on 5 May 2026).

Disclaimer/Publisher’s Note: The statements, opinions and data contained in all publications are solely those of the individual author(s) and contributor(s) and not of MDPI and/or the editor(s). MDPI and/or the editor(s) disclaim responsibility for any injury to people or property resulting from any ideas, methods, instructions or products referred to in the content. |
© 2026 by the authors. Licensee MDPI, Basel, Switzerland. This article is an open access article distributed under the terms and conditions of the Creative Commons Attribution (CC BY) license.