


Abstract
The dynamic characteristics of high-speed on/off valves (HSVs) are a key factor in measuring their performance, and determining the control accuracy of valve-controlled systems. Furthermore, the hysteresis characteristics of HSVs can seriously affect their dynamic characteristics. This study evaluated the hysteresis characteristics of HSVs in a valve-controlled hydraulic control system, and considered the pressure changes in front of the valve during the opening and closing process of the valve core. A time-delay compensation control (TDCC) based on pulse-width modulation (PWM) was proposed. The reference PWM signal was used to control the opening and closing time of the HSV, while the loading signal was composed of an opening compensation PWM, an excitation PWM, an opening holding PWM, and a closing compensation PWM. Using an opening compensation PWM to start the initial current, combined with current feedback and pressure changes in front of the valve, the amplitude and duty cycle of different PWM signals were determined in real time. This reduced the time delay and working current of the HSV during opening and closing. A simulation comparison analysis was conducted, with a single PWM control and a pre-excitation control algorithm (PECA). The results showed that, compared to a single PWM control, the TDCC can reduce the overall opening and closing time delay by 78.1%, and the energy consumption by 64.7%. Compared with PECA, the overall opening and closing time delay was reduced by 10.9%, and the energy consumption was reduced by 28%. At the same time, the frequency response of the valve core displacement increased by 70%, compared to the single PWM control.
1. Introduction
Digital hydraulic technology controls the discrete output of hydraulic systems, which has the advantages of discrete flow, digital control signals, and intelligent control [1]. Compared with traditional servo systems, it is less affected by hydraulic fluid contamination [2]. Currently, digital hydraulics are widely used in various fields, such as aircraft braking systems [3], construction machinery [4,5], wave energy recovery systems, etc. [6]. The high-speed on/off valve (HSV), as a core control component in digital hydraulic systems, has many advantages, and a strong research potential, and the output performance of digital hydraulic systems is directly determined by the dynamic characteristics of HSVs. An HSV operates when it is either fully open or fully closed. It has advantages, such as a low pressure loss, a low energy consumption, a strong anti-pollution ability, an easy-to-use PWM control, and the direct conversion of digital signals into flow signals [7,8,9], which has been widely used in valve-controlled hydraulic control systems. The main performance indicators of HSVs include dynamic characteristics, static flow characteristics, and heat transfer [10]. The better the dynamic characteristics, the higher the output flow resolution of HSVs. The better the static flow characteristics, the higher the linearity. As a key factor in measuring the performance of HSVs, and determining the control accuracy of valve-controlled hydraulic systems, improving the dynamic characteristics of HSVs is crucial. During the stage of new product development, the dynamic performance of an HSV can be improved, to some extent, by optimizing the electromechanical converter, coil layout, and valve structure [11,12]. However, for an existing HSV, improving its dynamic characteristics is mainly achieved through optimizing control strategies, while also reducing the energy consumption [13]. The optimized control strategies can be mainly divided into external hardware drive circuit control, intelligent control, and pre-excitation control.
Regarding external hardware drive circuit control strategies, in [14], Zhao et al. studied the relationship between the power loss and dynamic response of the valve core, and provided the maximum excitation voltage to achieve the highest energy utilization rate. In [15], the hardware control driving signal was directly used, without feedback. Although it reduced the valve core closing time delay, it could not adapt to system changes. In [16], Fang et al. proposed a nonlinear model for the high-speed on/off valve actuator (HSVA), and designed a sliding mode controller and observer. Through accurately maintaining the stability of electromagnetic force, considering the coil temperature rise, the state of an HSV can be precisely controlled via the driving of the high-speed on/off valve spool with electromagnetic force. In [17], LinJama et al. designed an AC boost circuit for parallel digital valve groups, which can output dual-voltage drive signals. However, the charging and discharging speed of this circuit is relatively slow, resulting in a lower control frequency of the output signal, with a maximum of only 22 Hz. Although the dynamic characteristics of HSV cores were improved via the addition of driver circuits, the cost and complexity of the system were increased, and more space was occupied.
For intelligent control strategies, in [18], Pu et al. combined dual-voltage driving with fuzzy PID, to accurately control the displacement of the HSV core, reducing the lag time of the valve core opening. Gao et al. [19] used the coil current to identify the motion state of the HSV, and applied the relationship between the coil current derivative and the critical state of the valve core to feedback control. Gao et al. [20] proposed a composite PWM control strategy, and designed a closed-loop controller, to reduce the closing time of the HSV. In [21], Gao Qiang used a differential PWM scheme to control the duty cycle of two HSVs separately, and obtain a more accurate pressure control. In [22], Zhang et al. estimated the working state of an HSV based on the critical switching current, achieving the adaptive switching of different system pressures and duty cycles. In addition, some scholars, such as Simic and Herakovic [23], have applied pulse frequency modulation (PFM) and pulse number modulation (PNM) techniques in digital valve groups, improving the response speed and energy efficiency of the independent metering control system of parallel digital piezoelectric valve groups. The power consumption in the steady state of the system can be reduced by six times. Intelligent control can improve the dynamic characteristics and adaptive ability of the system, but it also significantly increases the complexity of the system, due to the need to design corresponding controllers.
The pre-excitation control strategy is relatively simple and easy to implement. Generally, the opening and closing lag time of the HSV can be reduced through preloading a signal to make the current of the valve core close to the critical switch value. Zhong et al. [24,25] proposed a pre-excitation control algorithm (PECA) based on the principle of multi-voltage driving, which reduced the lag time of the valve response, and improved the energy conversion efficiency. In [13], Zhong et al. extended the controllable duty cycle range, by switching PWM signals with different amplitudes through real-time current feedback. In [26], Zhong et al. improved the dynamic characteristics of an HSV using current and maximum pressure feedback, reducing the impact of the maximum pressure of the system on dynamic characteristics. The pre-excitation method loads the control signal based on the highest pressure after the valve core is opened, ensuring that the valve core does not close during the opening and holding stage. To some extent, this improves the dynamic performance of the valve core, and does not significantly increase the complexity of the system.
However, after the valve core is opened, the pressure in front of the valve will decrease, and the current value required to maintain the maximum opening will also decrease. In this case, the current value generated by the control signal applied, based on the highest pressure, will be greater than the actual required current value. This will generate excess energy consumption. Moreover, during the valve core closing stage, the current value being higher than the actual required current value will also lead to an extension in the valve core lag time.
The use of PWM signals for control in HSVs has inherent high time delay characteristics, which cannot meet the requirements of applications with high switching frequencies. In order to reduce the delay duration during the opening and closing processes of HSVs, improve their response speed, and expand their frequency response range, the aforementioned scholars have proposed various control strategies based on PWM signals. However, none of these strategies considered the changes in the pre-valve pressure during the opening and closing processes of the HSV.
Therefore, this study considers the variation in pre-valve hydraulic pressure after the HSV is opened, and proposes a PWM-based time-delay compensation control (TDCC) strategy. This strategy aims to reduce the time delay of the HSV, improve the response speed of the HSV, expand its frequency response range, and further reduce the energy consumption. The TDCC integrates four different functional PWM signals, and controls the opening and closing of the HSV through a reference PWM (RPWM) signal. The loading sequence of the four PWM signals compensates for one signal before the moment of valve opening, namely the opening compensation PWM (OCPWM), which brings the HSV to the state of being about to open, but not fully open, reducing the delay time and motion time of the valve spool opening. At the moment of valve opening, the rated excitation PWM (EPWM) signal is loaded, to fully open the valve spool quickly. After the HSV is opened, the pre-valve pressure decreases, and the opening–holding PWM (OHPWM) signal value is adjusted based on the pre-valve pressure. When the HSV reaches the closing moment, a reverse PWM signal, namely the closing compensation PWM (CCPWM), is loaded to shorten the delay length during closing, and accelerate the closing speed. The values of the OCPWM and OHPWM signals are obtained through the force balance between the coil current and the pre-valve pressure. Based on the current feedback, and the pressure changes in front of the valve, the amplitude and duty cycle of different PWM signals were determined in real time. This minimized the time delay and working current of the HSV opening and closing, improved the dynamic characteristics, and reduced the energy consumption.
2. Mathematical Modelling
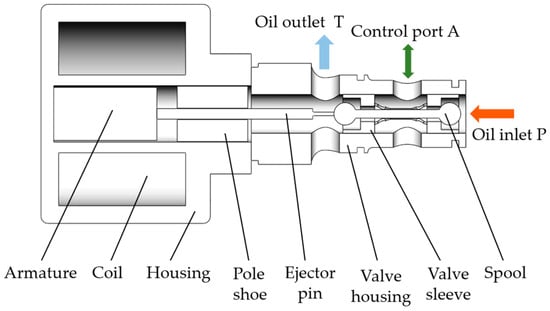
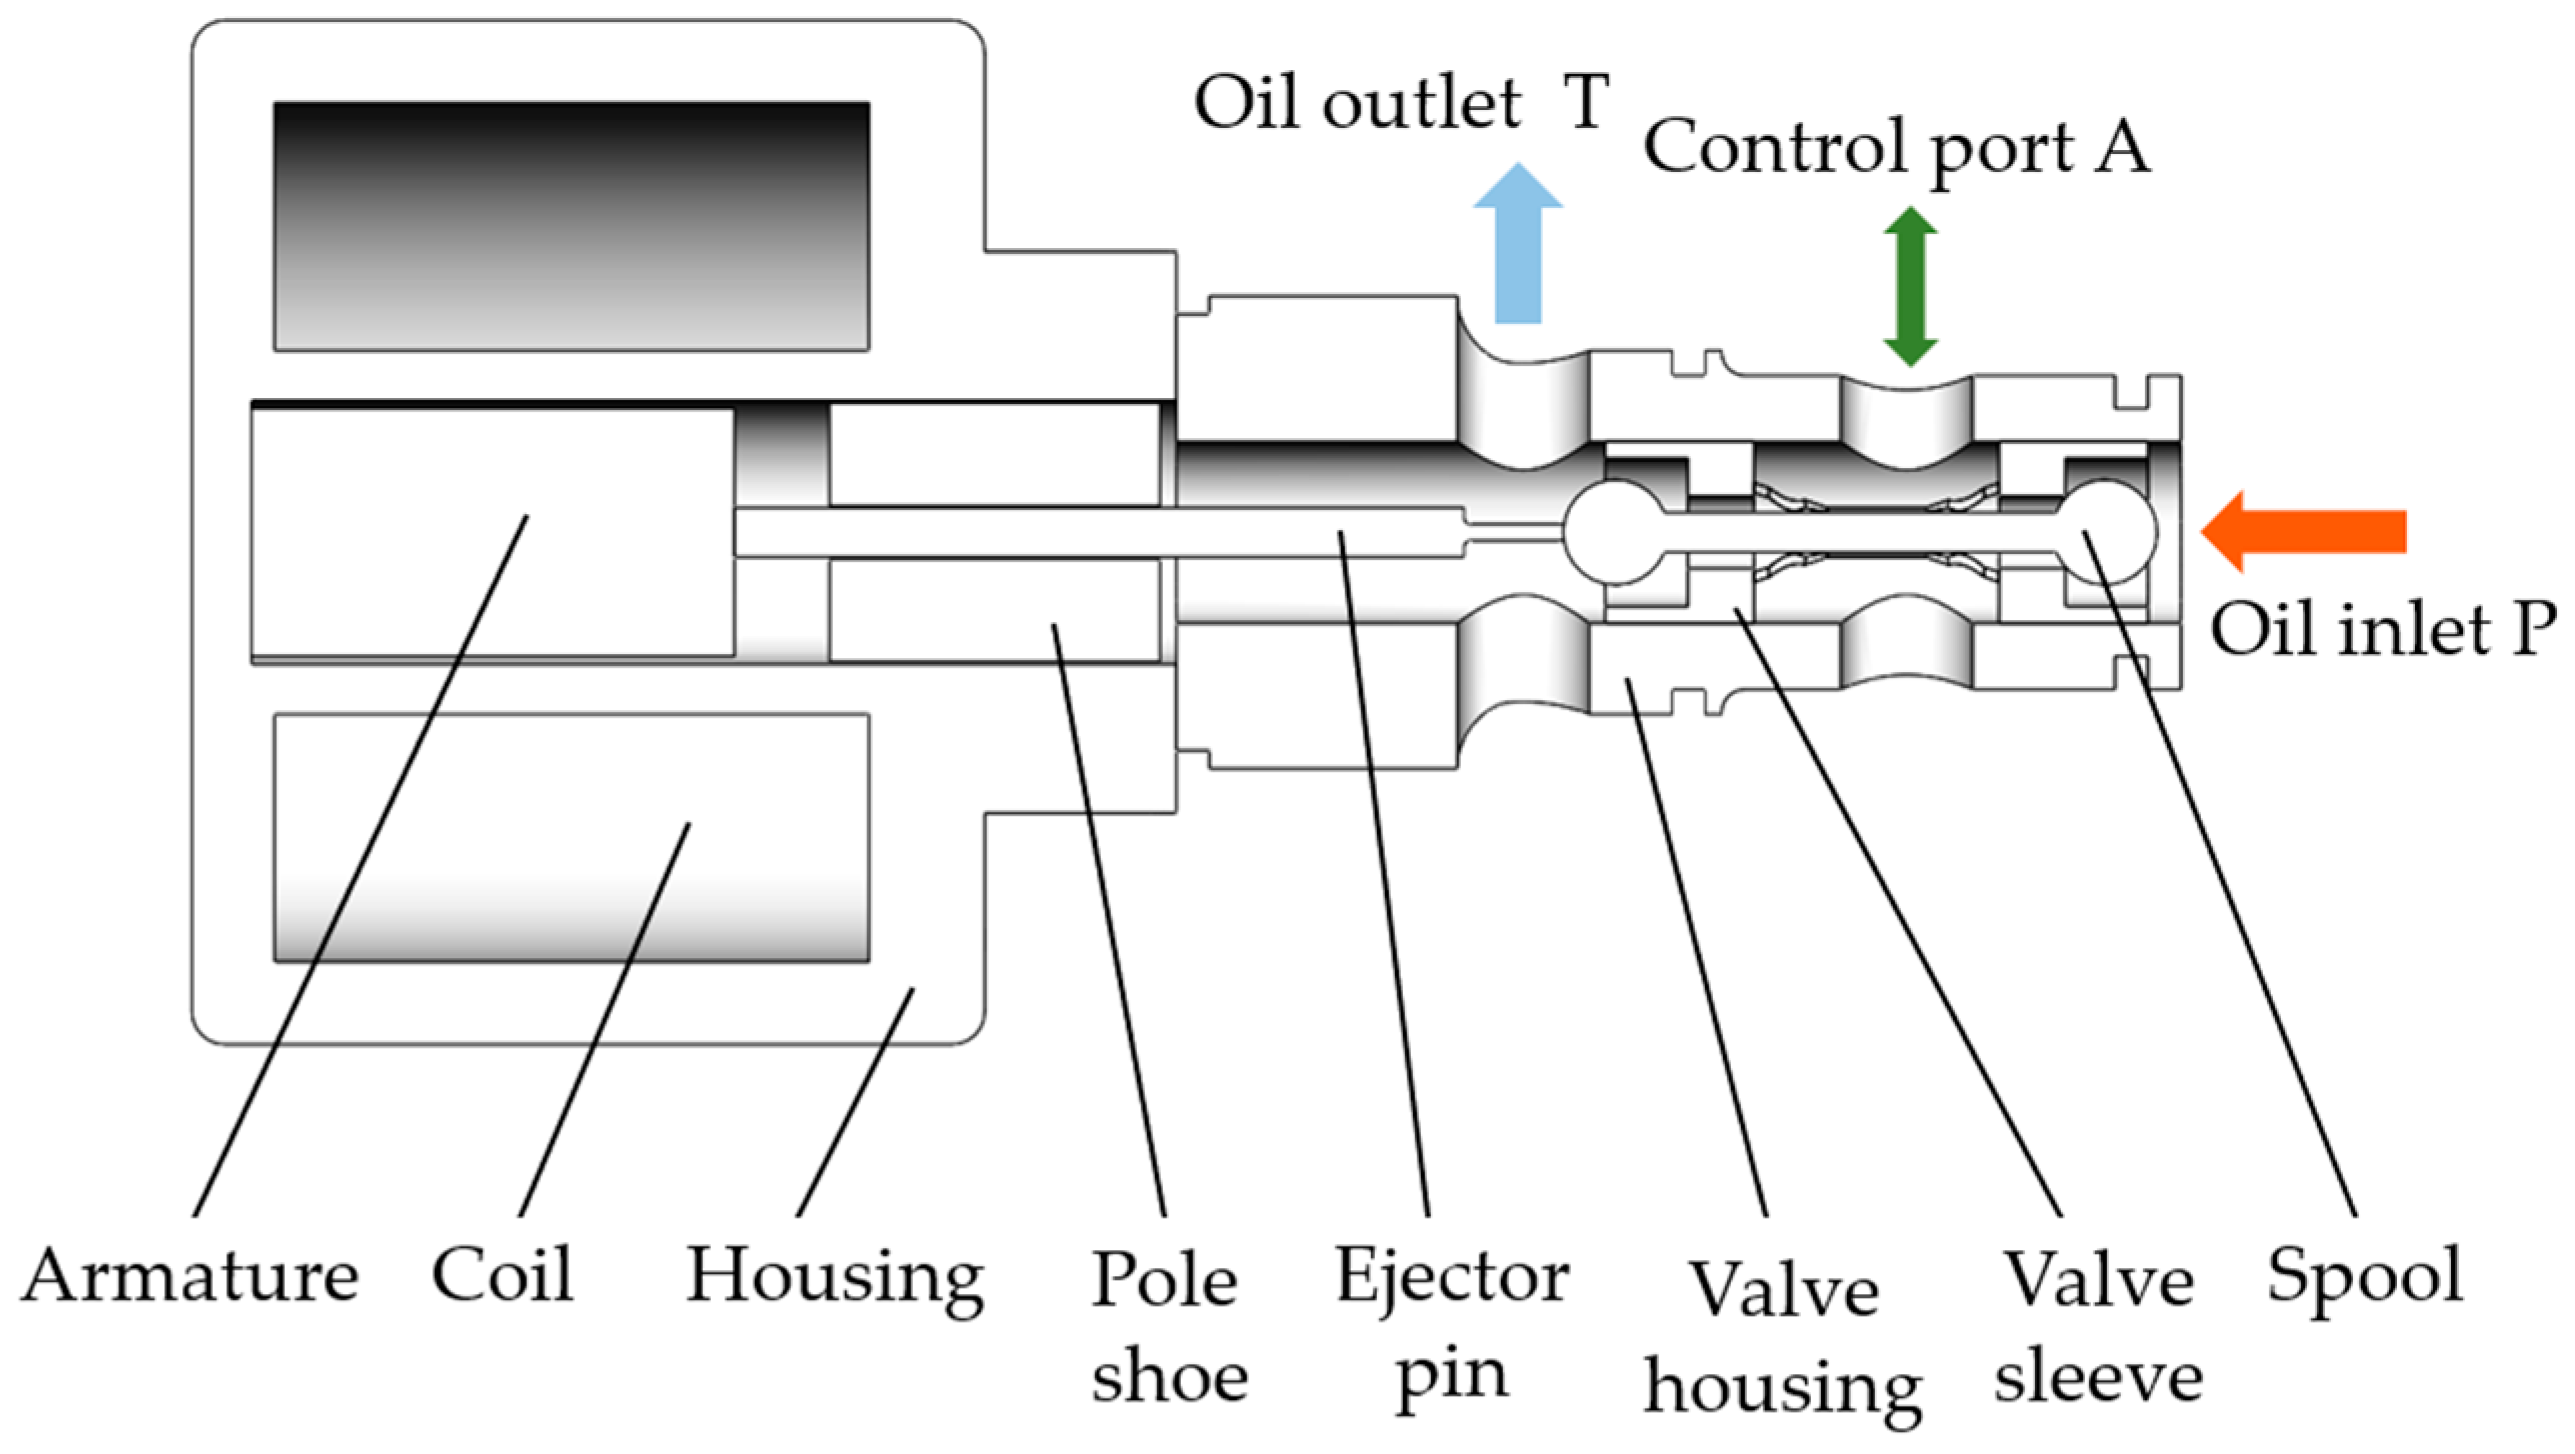
The high-speed on/off valve in this study was a dual-position, three-way, normally closed, cartridge ball valve, with an internal valve core, as shown in Figure 1.
Figure 1.
The structure of the HSV.
Adopting a spherical valve core, the spherical diameter was 3.175 mm, the ejector pin diameter was 1.2 mm, the valve core stroke was 0.46–0.5 mm, the leakage rate was ≤5 mL/min, the valve port diameter was 2.2 mm, the nominal pressure was 5 ± 0.05 MPa, the maximum pressure was 6 ± 0.05 MPa, and the nominal flow was 8 ± 1 L/min. There is no spring between the valve core and the valve sleeve, and the reset relies on hydraulic pressure (the pressure difference formed by the force surface) to return to its original position. When energized, the valve core is pushed by an ejector pin to open the P–A oil port, and the A–T oil port is closed. The HSV uses a pulse-width modulation signal to control the displacement of the spool, and adjusts the pressure and flow in the hydraulic system through high-frequency opening and closing. Its driving voltage was 24 V, the coil turns were 900 turns, and the internal resistance was 10.2 .
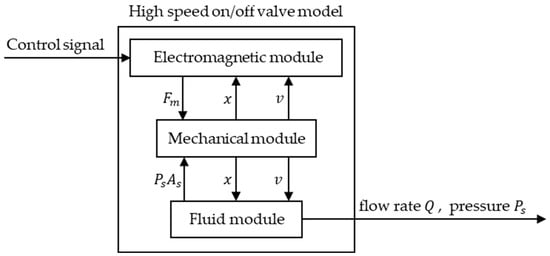
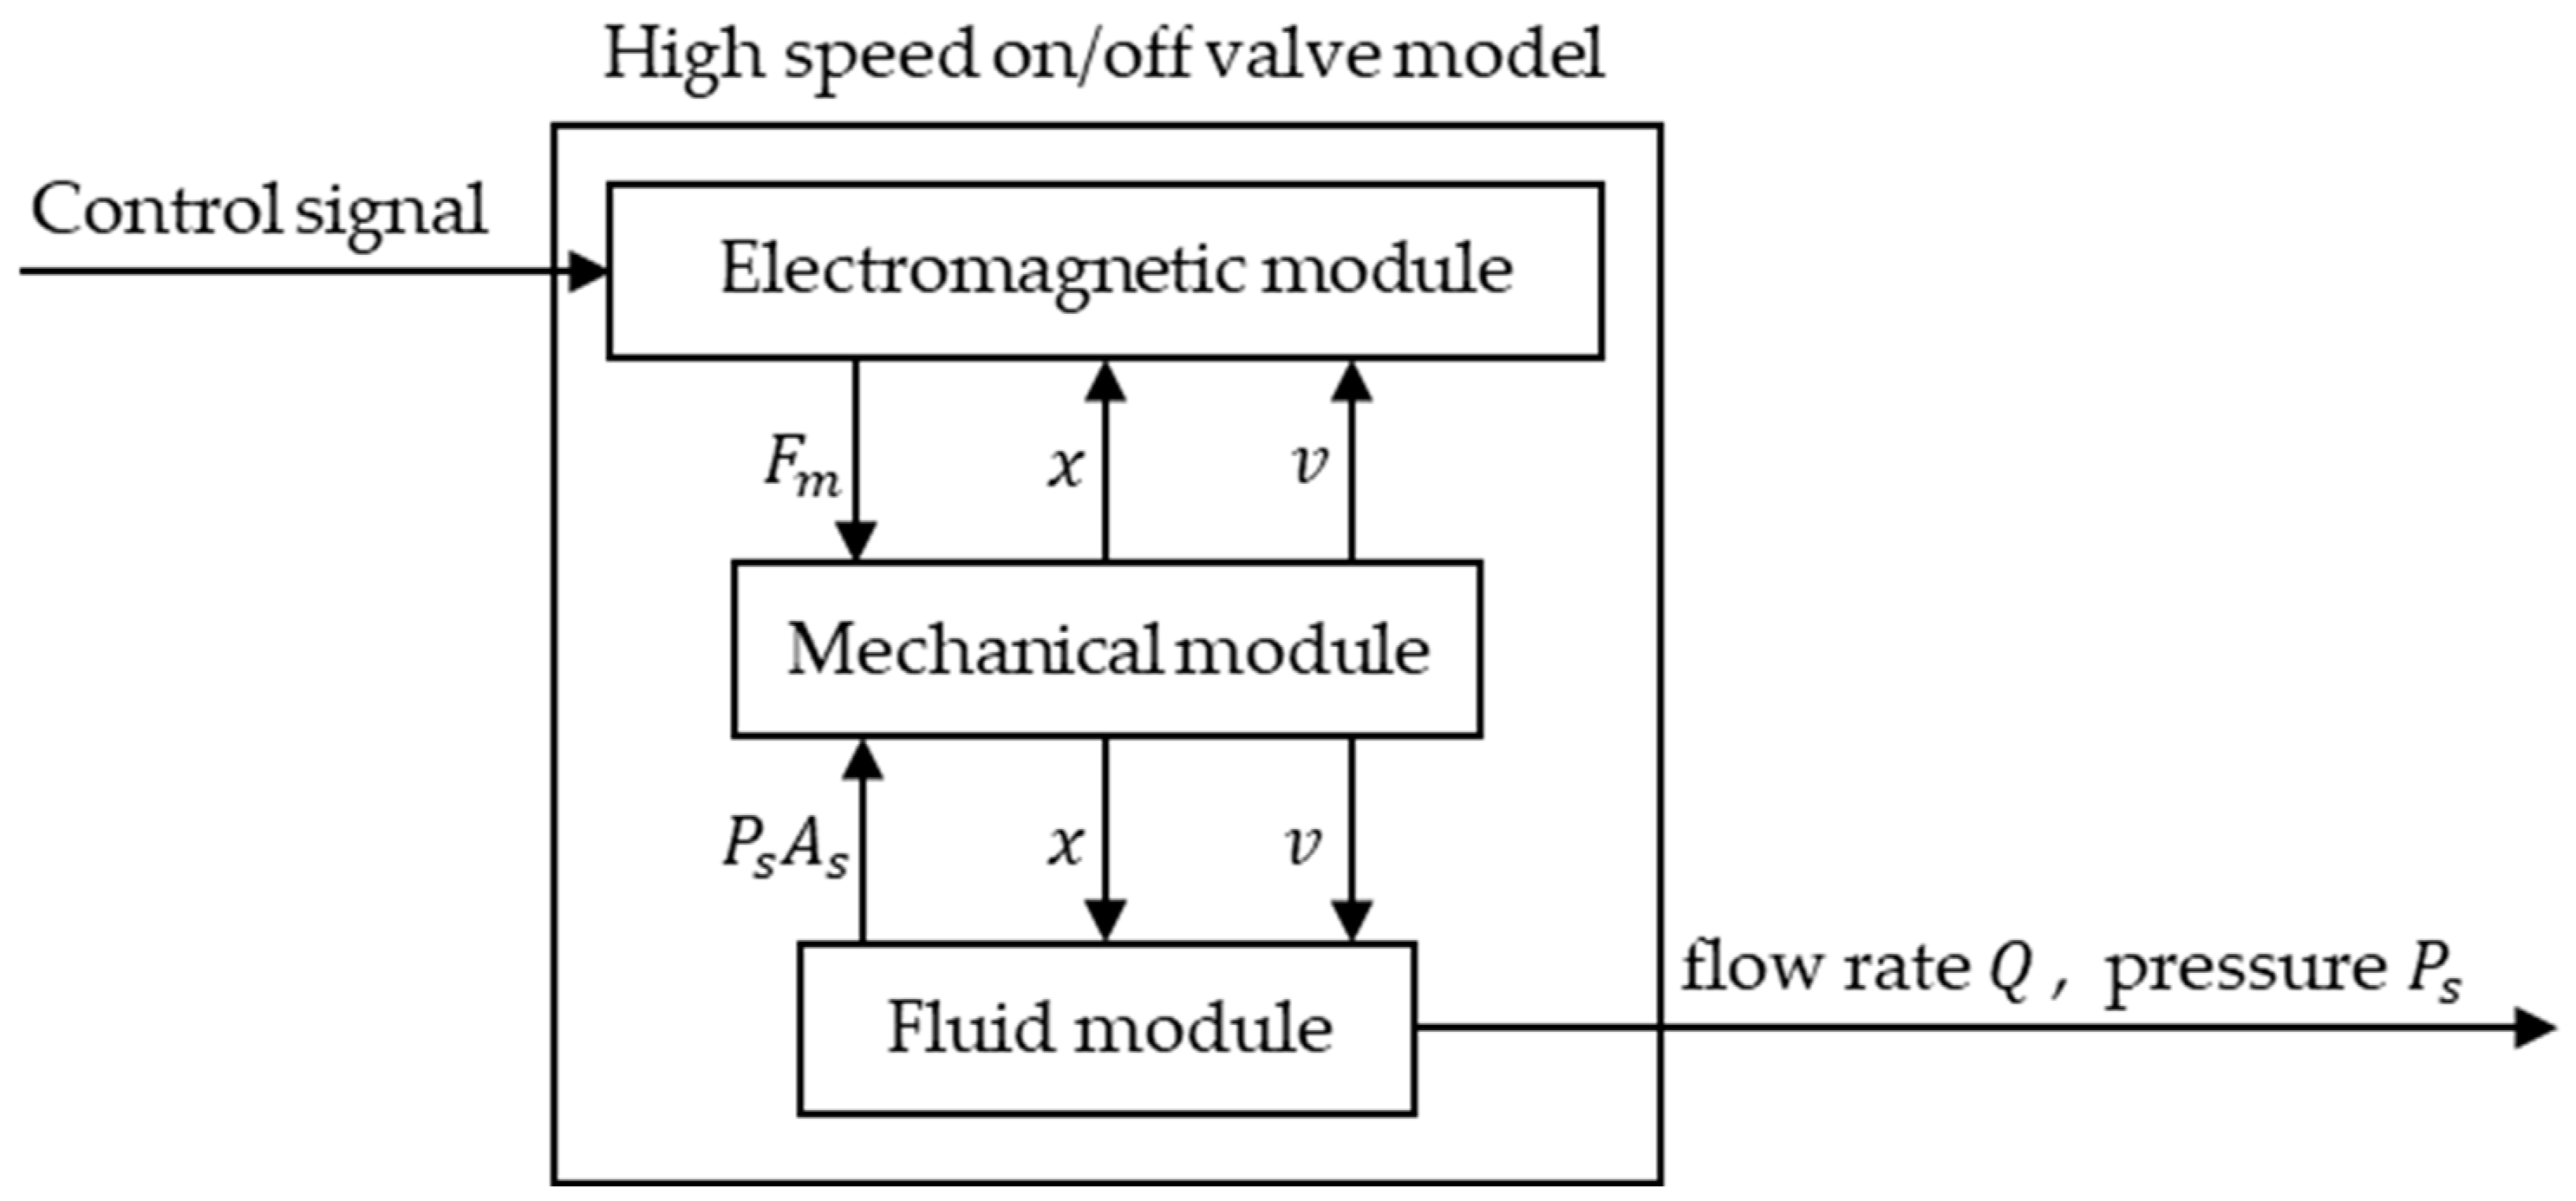
The HSV consists of three parts: the electromagnetic module, mechanical module, and fluid module; the internal coupling relationship of these three parts is shown in Figure 2. After decoupling, the mathematical analytical models of each part were obtained.
Figure 2.
Internal coupling relationship of the HSV.
2.1. Electromagnetic Module
Assuming that magnetic flux exists uniformly in the medium, according to the first equation of the magnetic circuit, it can be obtained as [20]:
where is the number of coil turns; is the coil current; is the main magnetic field strength; is the length of the magnetic circuit of the magnetic core; is the intensity of the air gap magnetic field; is the length of the air gap magnetic circuit; is the magnetic leakage coefficient; is the relative magnetic permeability; is the initial air gap length; and is the displacement of the spool.
The relationship between the magnetic flux density , the main magnetic field intensity , the magnetic core permeability , the effective sectional area of the armature , the magnetic flux , the flux linkage , and the coil inductance is as follows [20]:
From Equations (1)–(3), the coil inductance can be obtained as:
It can be seen that the coil inductance is related to the movement of the valve core. The electromagnetic force after the electromagnetic coil is energized is [13]:
where is the electromagnetic force and is the vacuum magnetic constant.
The mathematical model of the electrical circuit under the working state of the HSV can be expressed as [25]:
where is the coil voltage, and is the equivalent resistance of the coil. When the armature is stationary, the equivalent resistance and inductance of the coil are fixed values, which can be equivalent to a fixed value resistance inductance circuit. Therefore, the dynamic equation of the coil current can be expressed as [13]:
where is the initial coil current, and represents time. Furthermore, the hysteresis time of the current change can be obtained as [13]:
2.2. Fluid Module
The volume of flow through the HSV port can be expressed as:
where is the flow rate of the HSV; is the flow coefficient; is the effective flow area; is the valve port pressure difference; and is the density of the oil.
When oil flows through the valve port, due to changes in the flow direction and velocity, the valve core will be subjected to fluid forces, which can be divided into a steady flow force and a transient flow force [25].
where is the steady flow force; is the transient flow force; is the velocity coefficient; is the flow coefficient; is the jet angle; is the gradient of the valve port; is the damping length of the oil; and is the displacement of the spool.
2.3. Mechanical Module
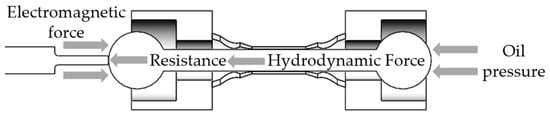
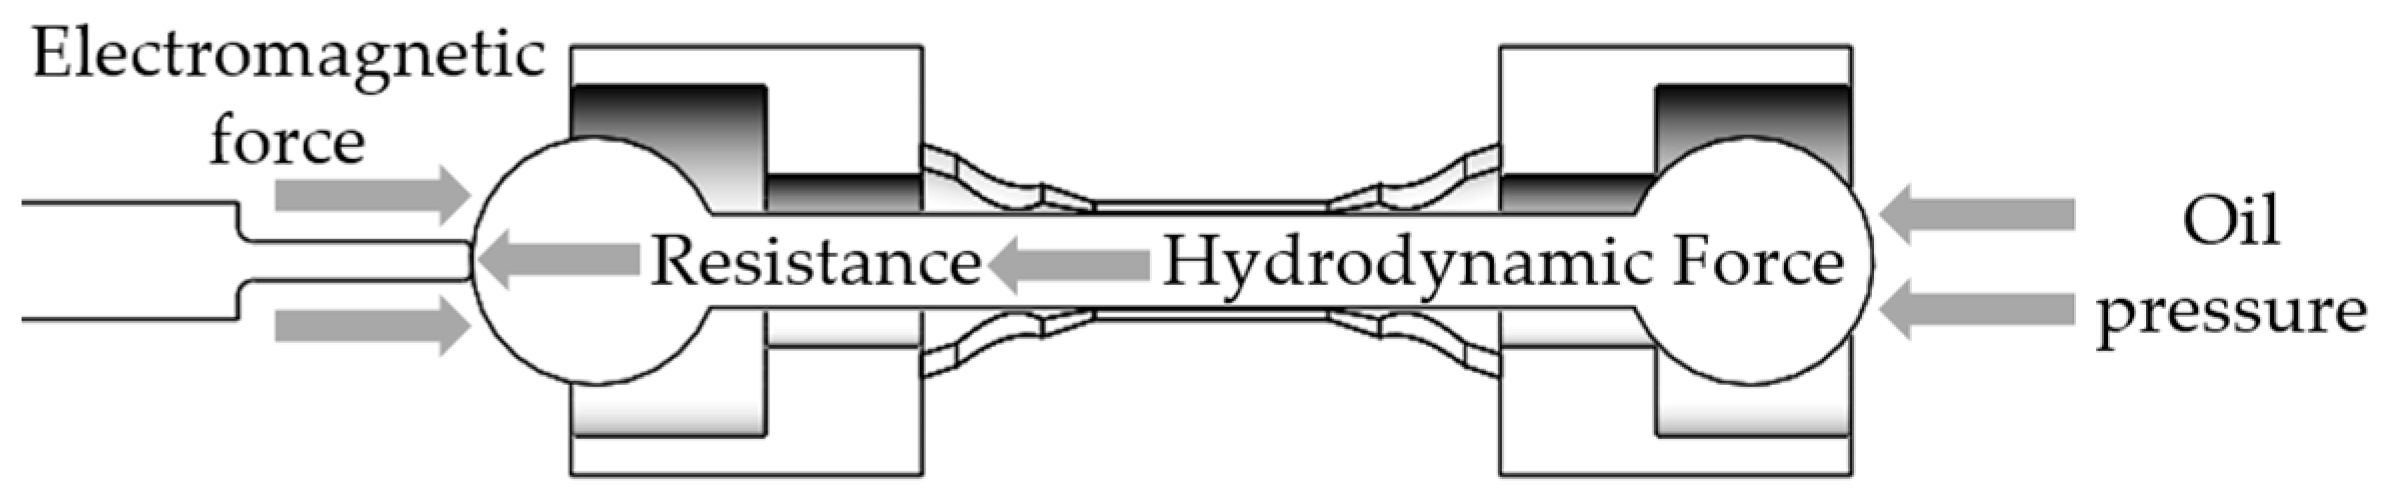
As shown in Figure 3, the HSV spool is subjected to four forces during movement: the electromagnetic force, resistance, hydrodynamic force, and oil pressure, resulting in the force balance equation of the spool, as follows [26]:
where represents the mass of the moving component; is the displacement of the spool; is the electromagnetic force; is the steady-state hydrodynamic force; is the transient hydrodynamic force; is the pre-valve pressure; is the effective working area of the pressure oil; and is the coefficient of the viscous friction.
Figure 3.
Force analysis of the HSV.
At the critical opening and closing moments of the HSV, the valve core is in a stationary state. Due to the small value of the hydraulic force, the influence of the hydraulic force on the valve core is ignored. At this time, the critical electromagnetic force of the HSV is:
where is the critical electromagnetic force.
Due to the relationship between the pressure in front of the valve and the load, the opening-and-closing state of the HSV affects the change in the pressure in front of the valve. When the spool is closed, the pressure in front of the valve gradually increases, and stabilizes at its maximum value. After the valve core is opened, the pressure in front of the valve gradually decreases, as it is larger than the load pressure. According to Equations (3), (5) and (13), the critical current for the HSV to switch on and off is:
where is the critical opening current of the valve core; is the critical closing current of the valve core; is the coil inductance in the fully open state of the valve core; is the maximum displacement of the valve core; and is the coil inductance in the closed state of the valve core. It can be seen that the critical opening and closing current changes with the pressure changes in front of the valve. The higher the pressure in front of the valve, the greater the critical current required for valve core movement.
The voltage value that generates the critical opening and closing current can be expressed as:
where is the critical opening voltage of the spool; is the critical closing voltage of the spool; and is the equivalent resistance of the coil.
Usually, the current loaded on the coil is accompanied by a thermal effect that causes a temperature rise, thereby affecting the performance of the electromagnetic coil. The electrical power and energy consumed by the current through the solenoid valve can be simplified as [15]:
where is the power in watts [W]; is the coil current; is the energy consumption in joules [J]; and is the time in seconds [s].
3. Time-Delay Characteristics Analysis of HSVs
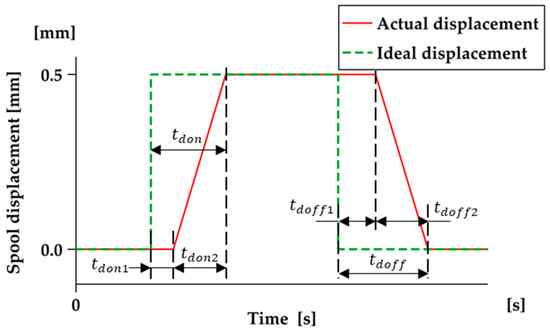
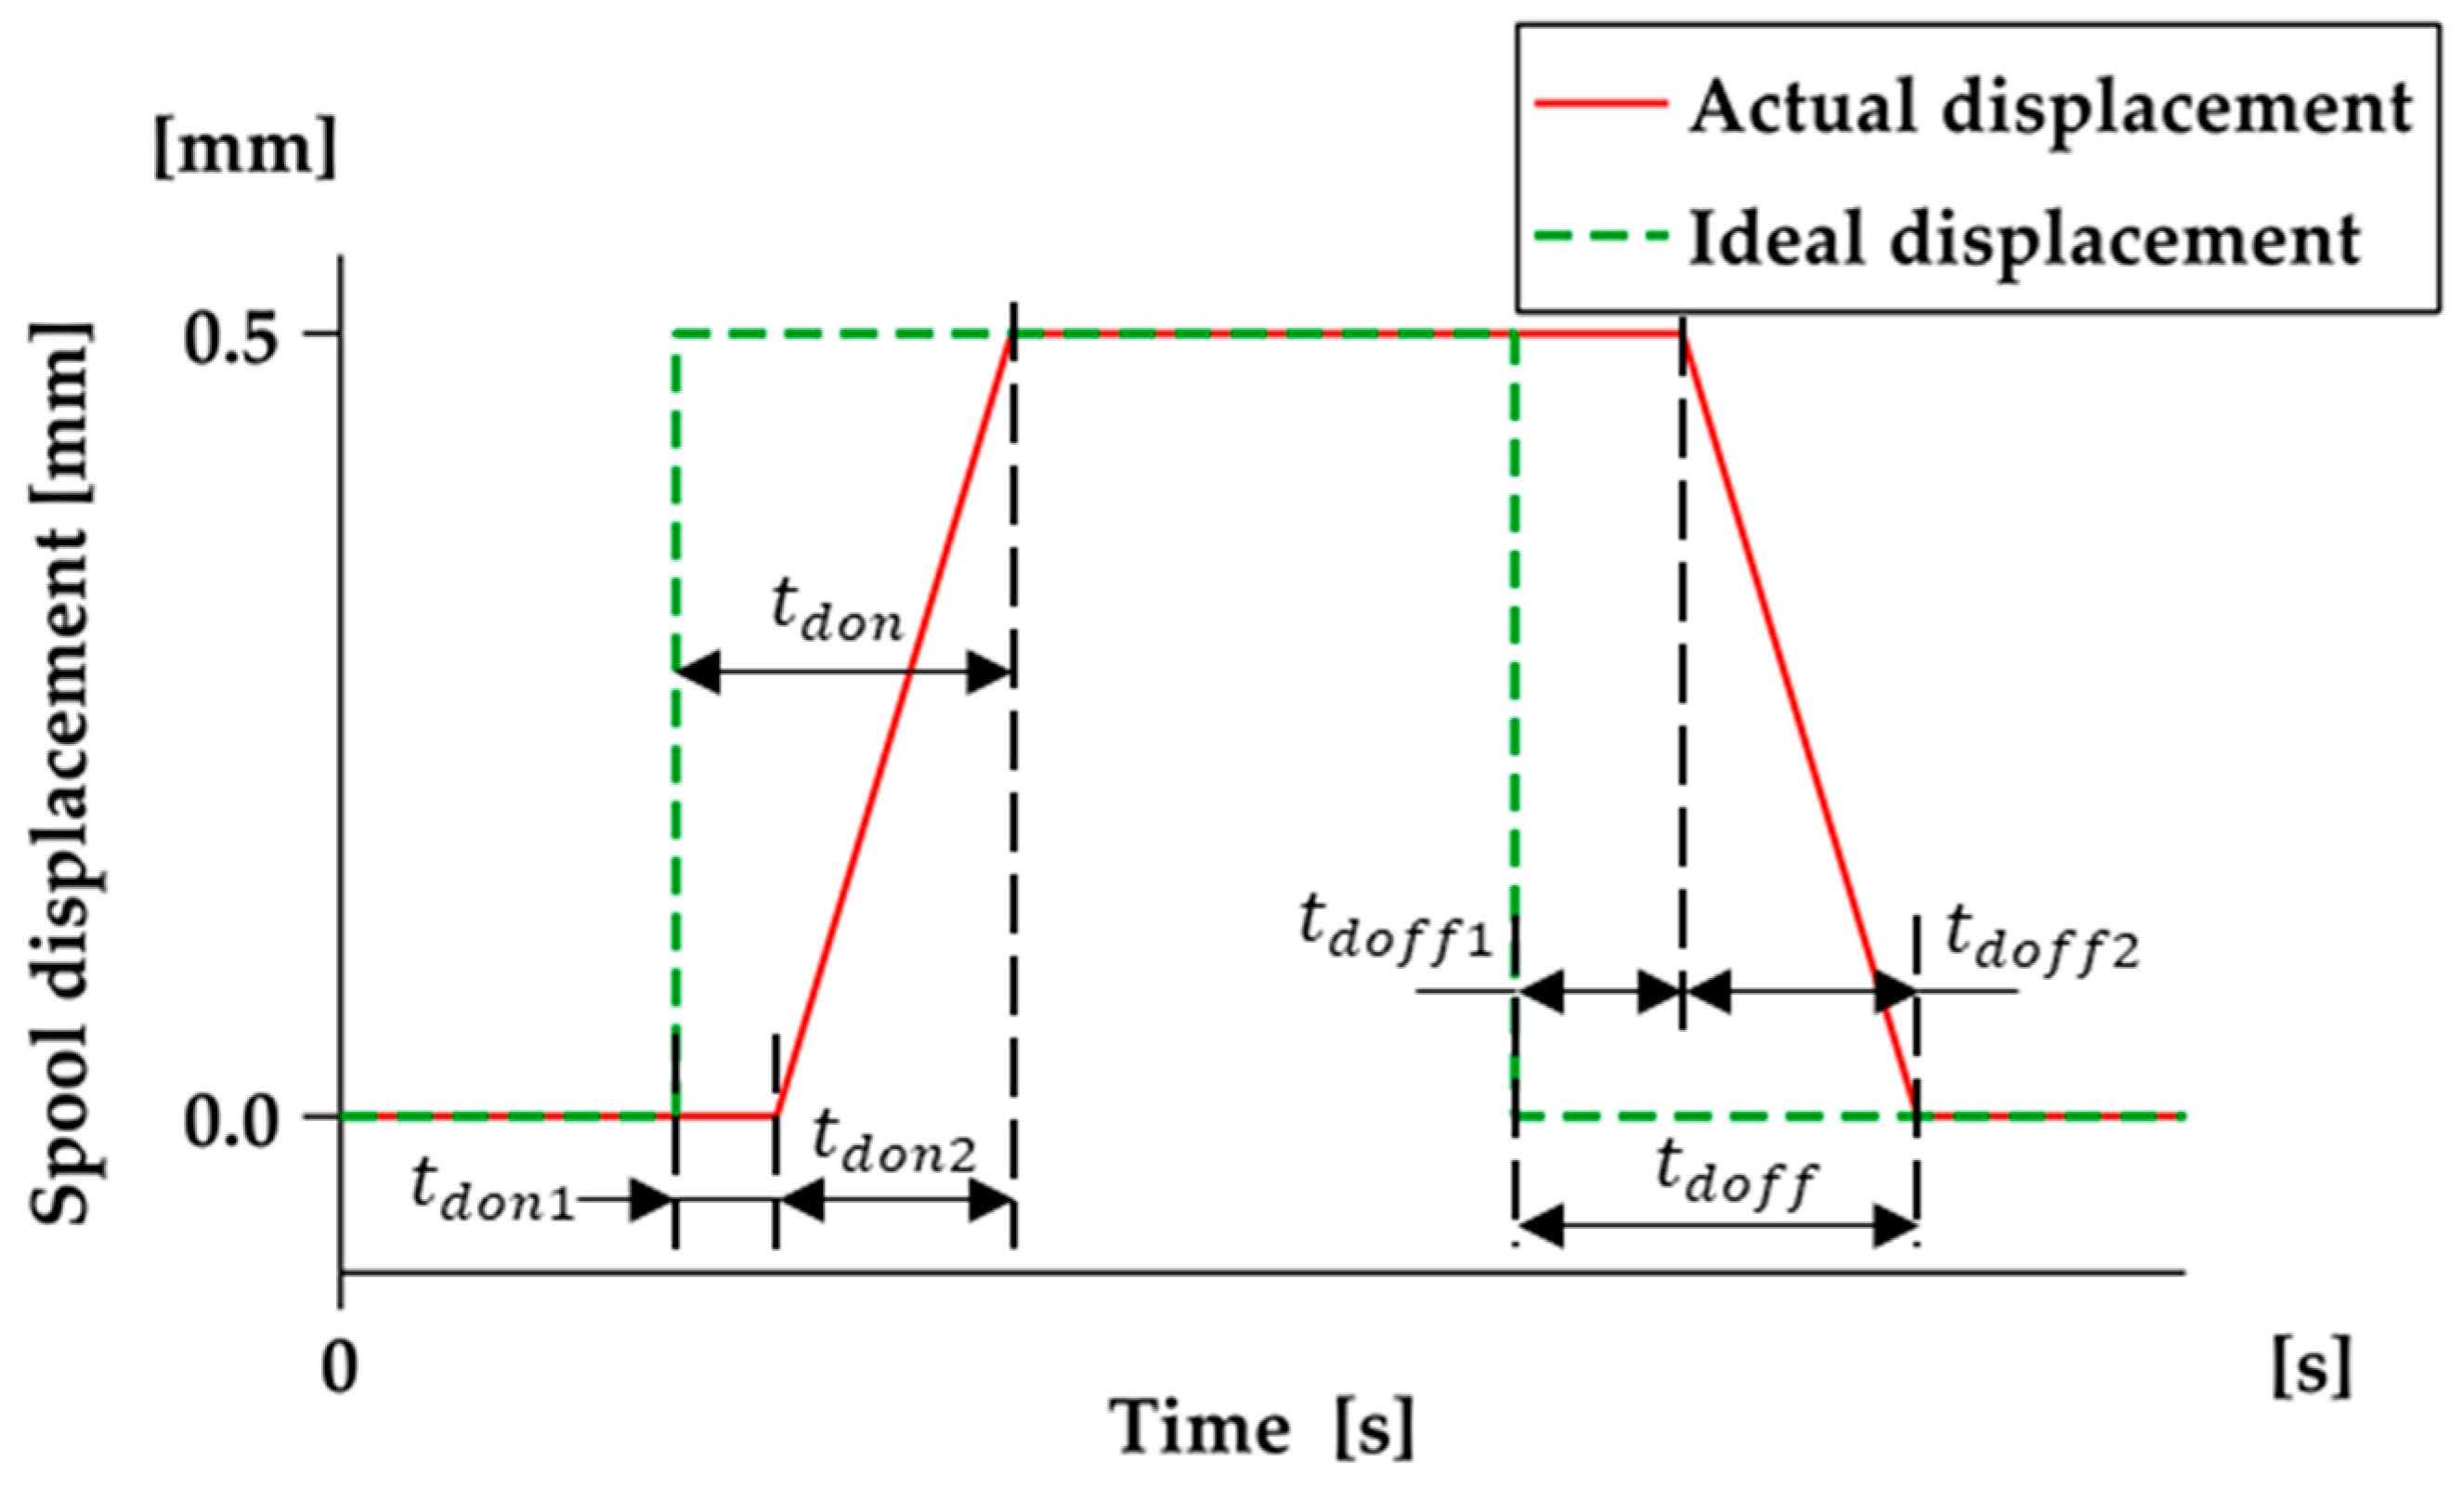
The time-delay characteristics of HSVs are mainly affected by the delay time. Due to the presence of inductance and inertia, the valve cannot move immediately upon receiving the control signal; therefore, it lags behind the control signal, as shown in Figure 4. The delay time is , in which, is the opening delay time, composed of the opening delay time and the opening motion time . The closing delay time is composed of the closing delay time and the closing motion time .
Figure 4.
Time-delay characteristics of an HSV.
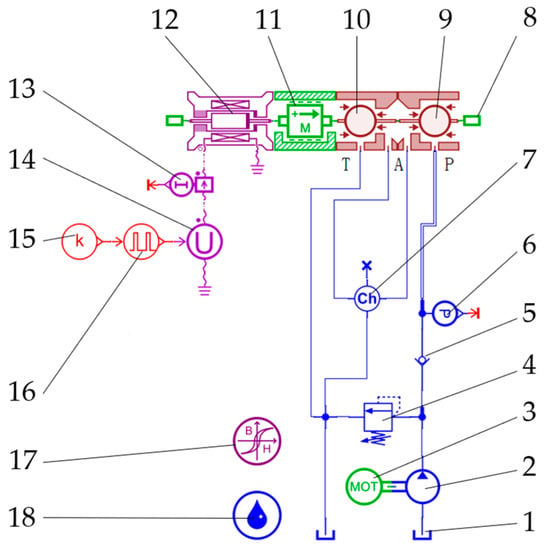
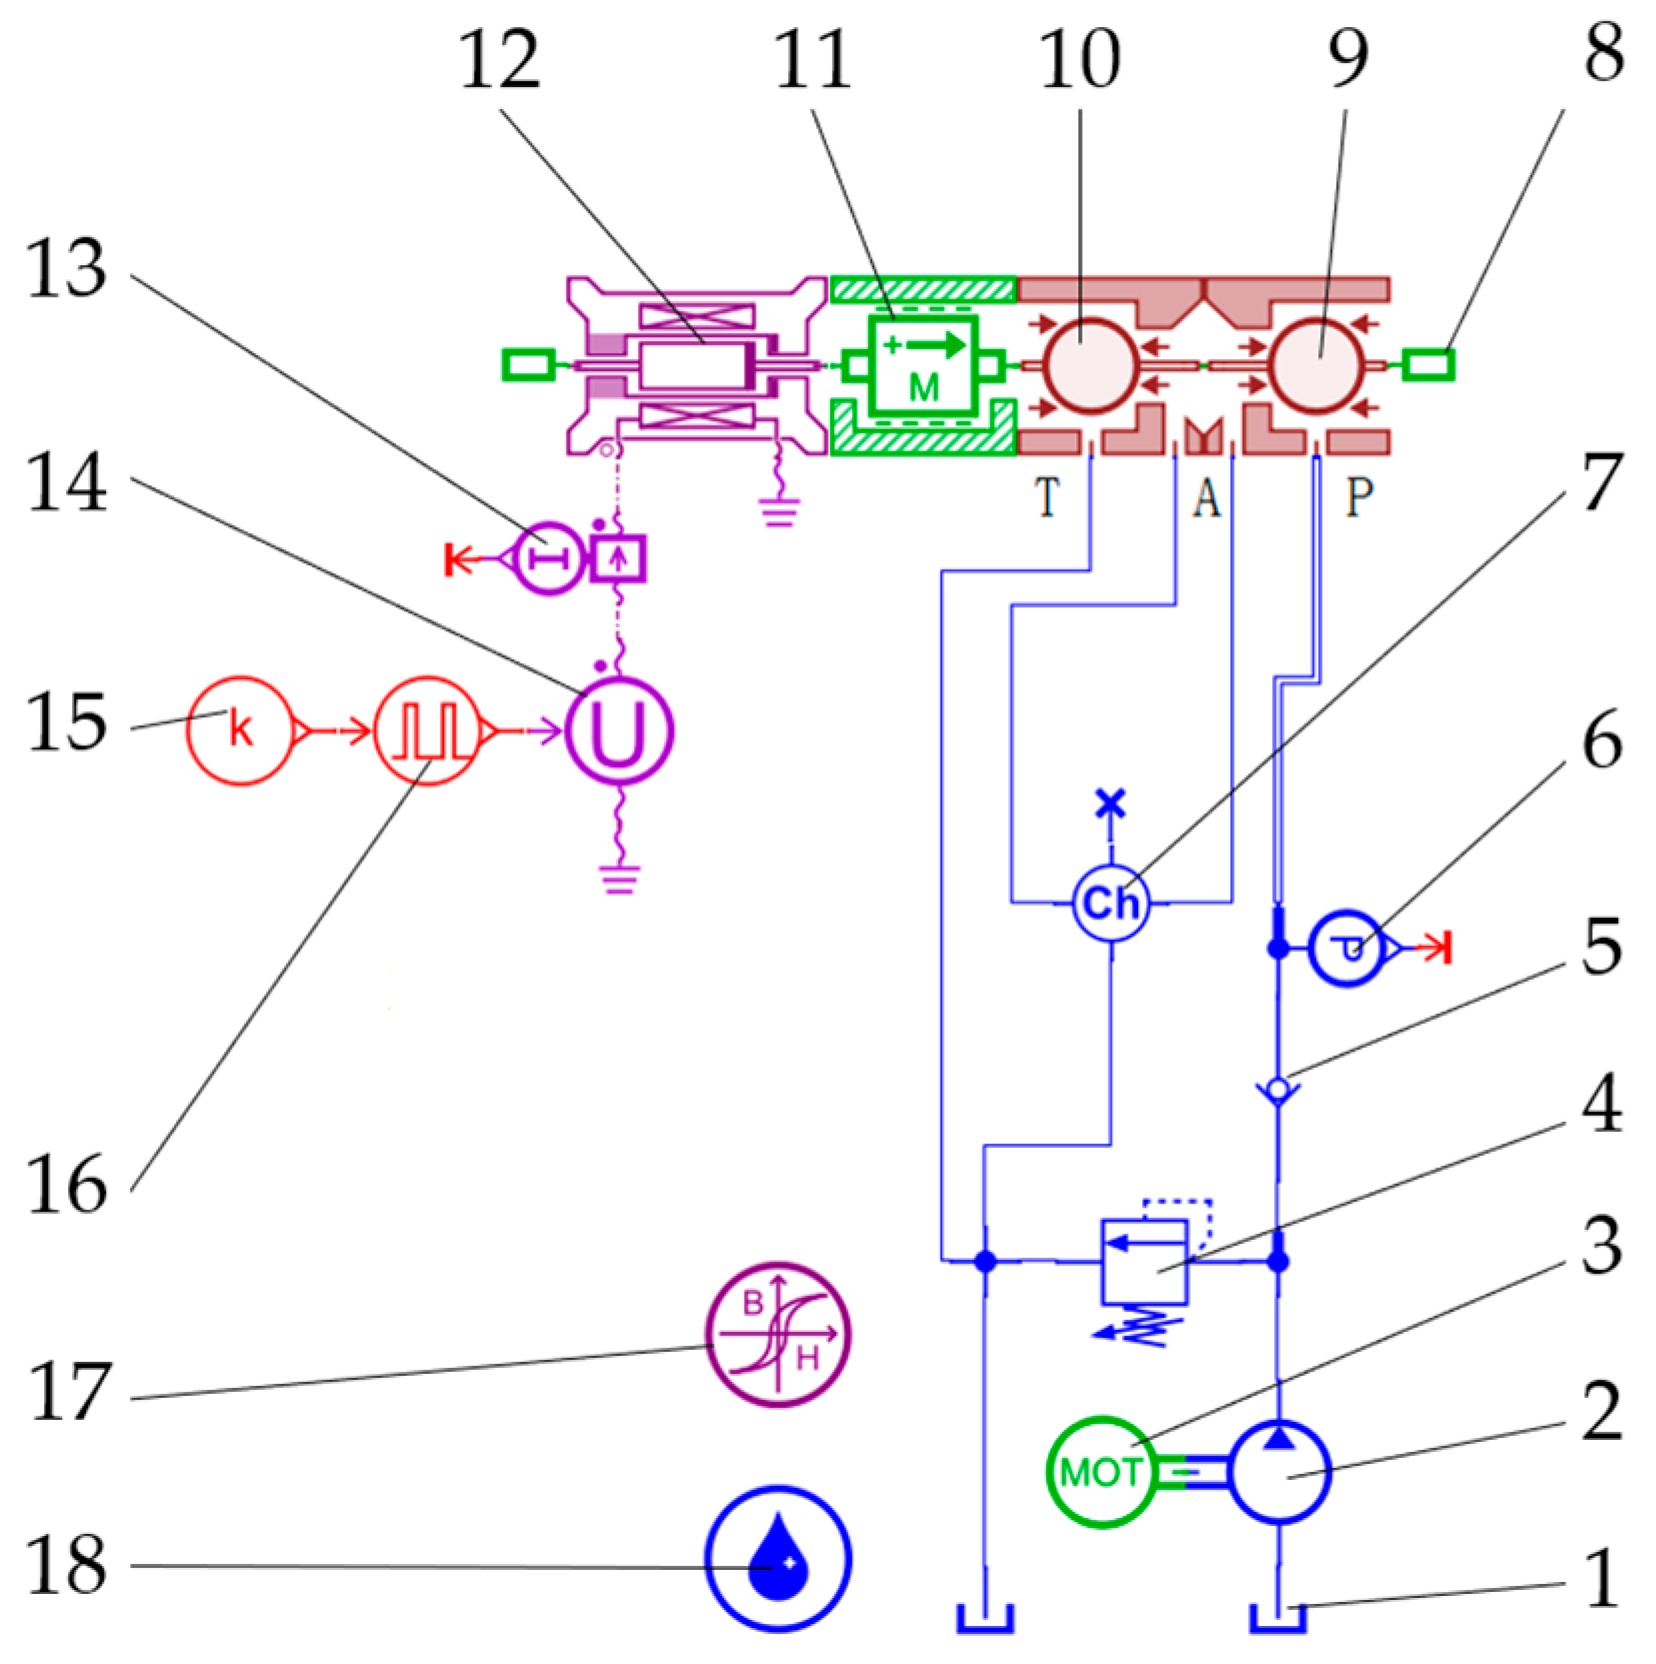
A simulation model of a dual-position, three-way, normally closed HSV was established, as shown in Figure 5. Table 1 lists the component names, sub-model models, and corresponding functions of the AMEsim simulation model. The simulation parameter settings are shown in Table 2.
Figure 5.
Simulation model of an HSV hydraulic system.
Table 1.
Names and functions of the simulation model components.
Table 2.
Parameters of the HSV in AMEsim.
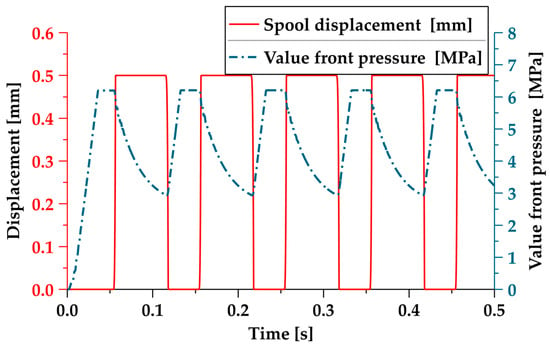
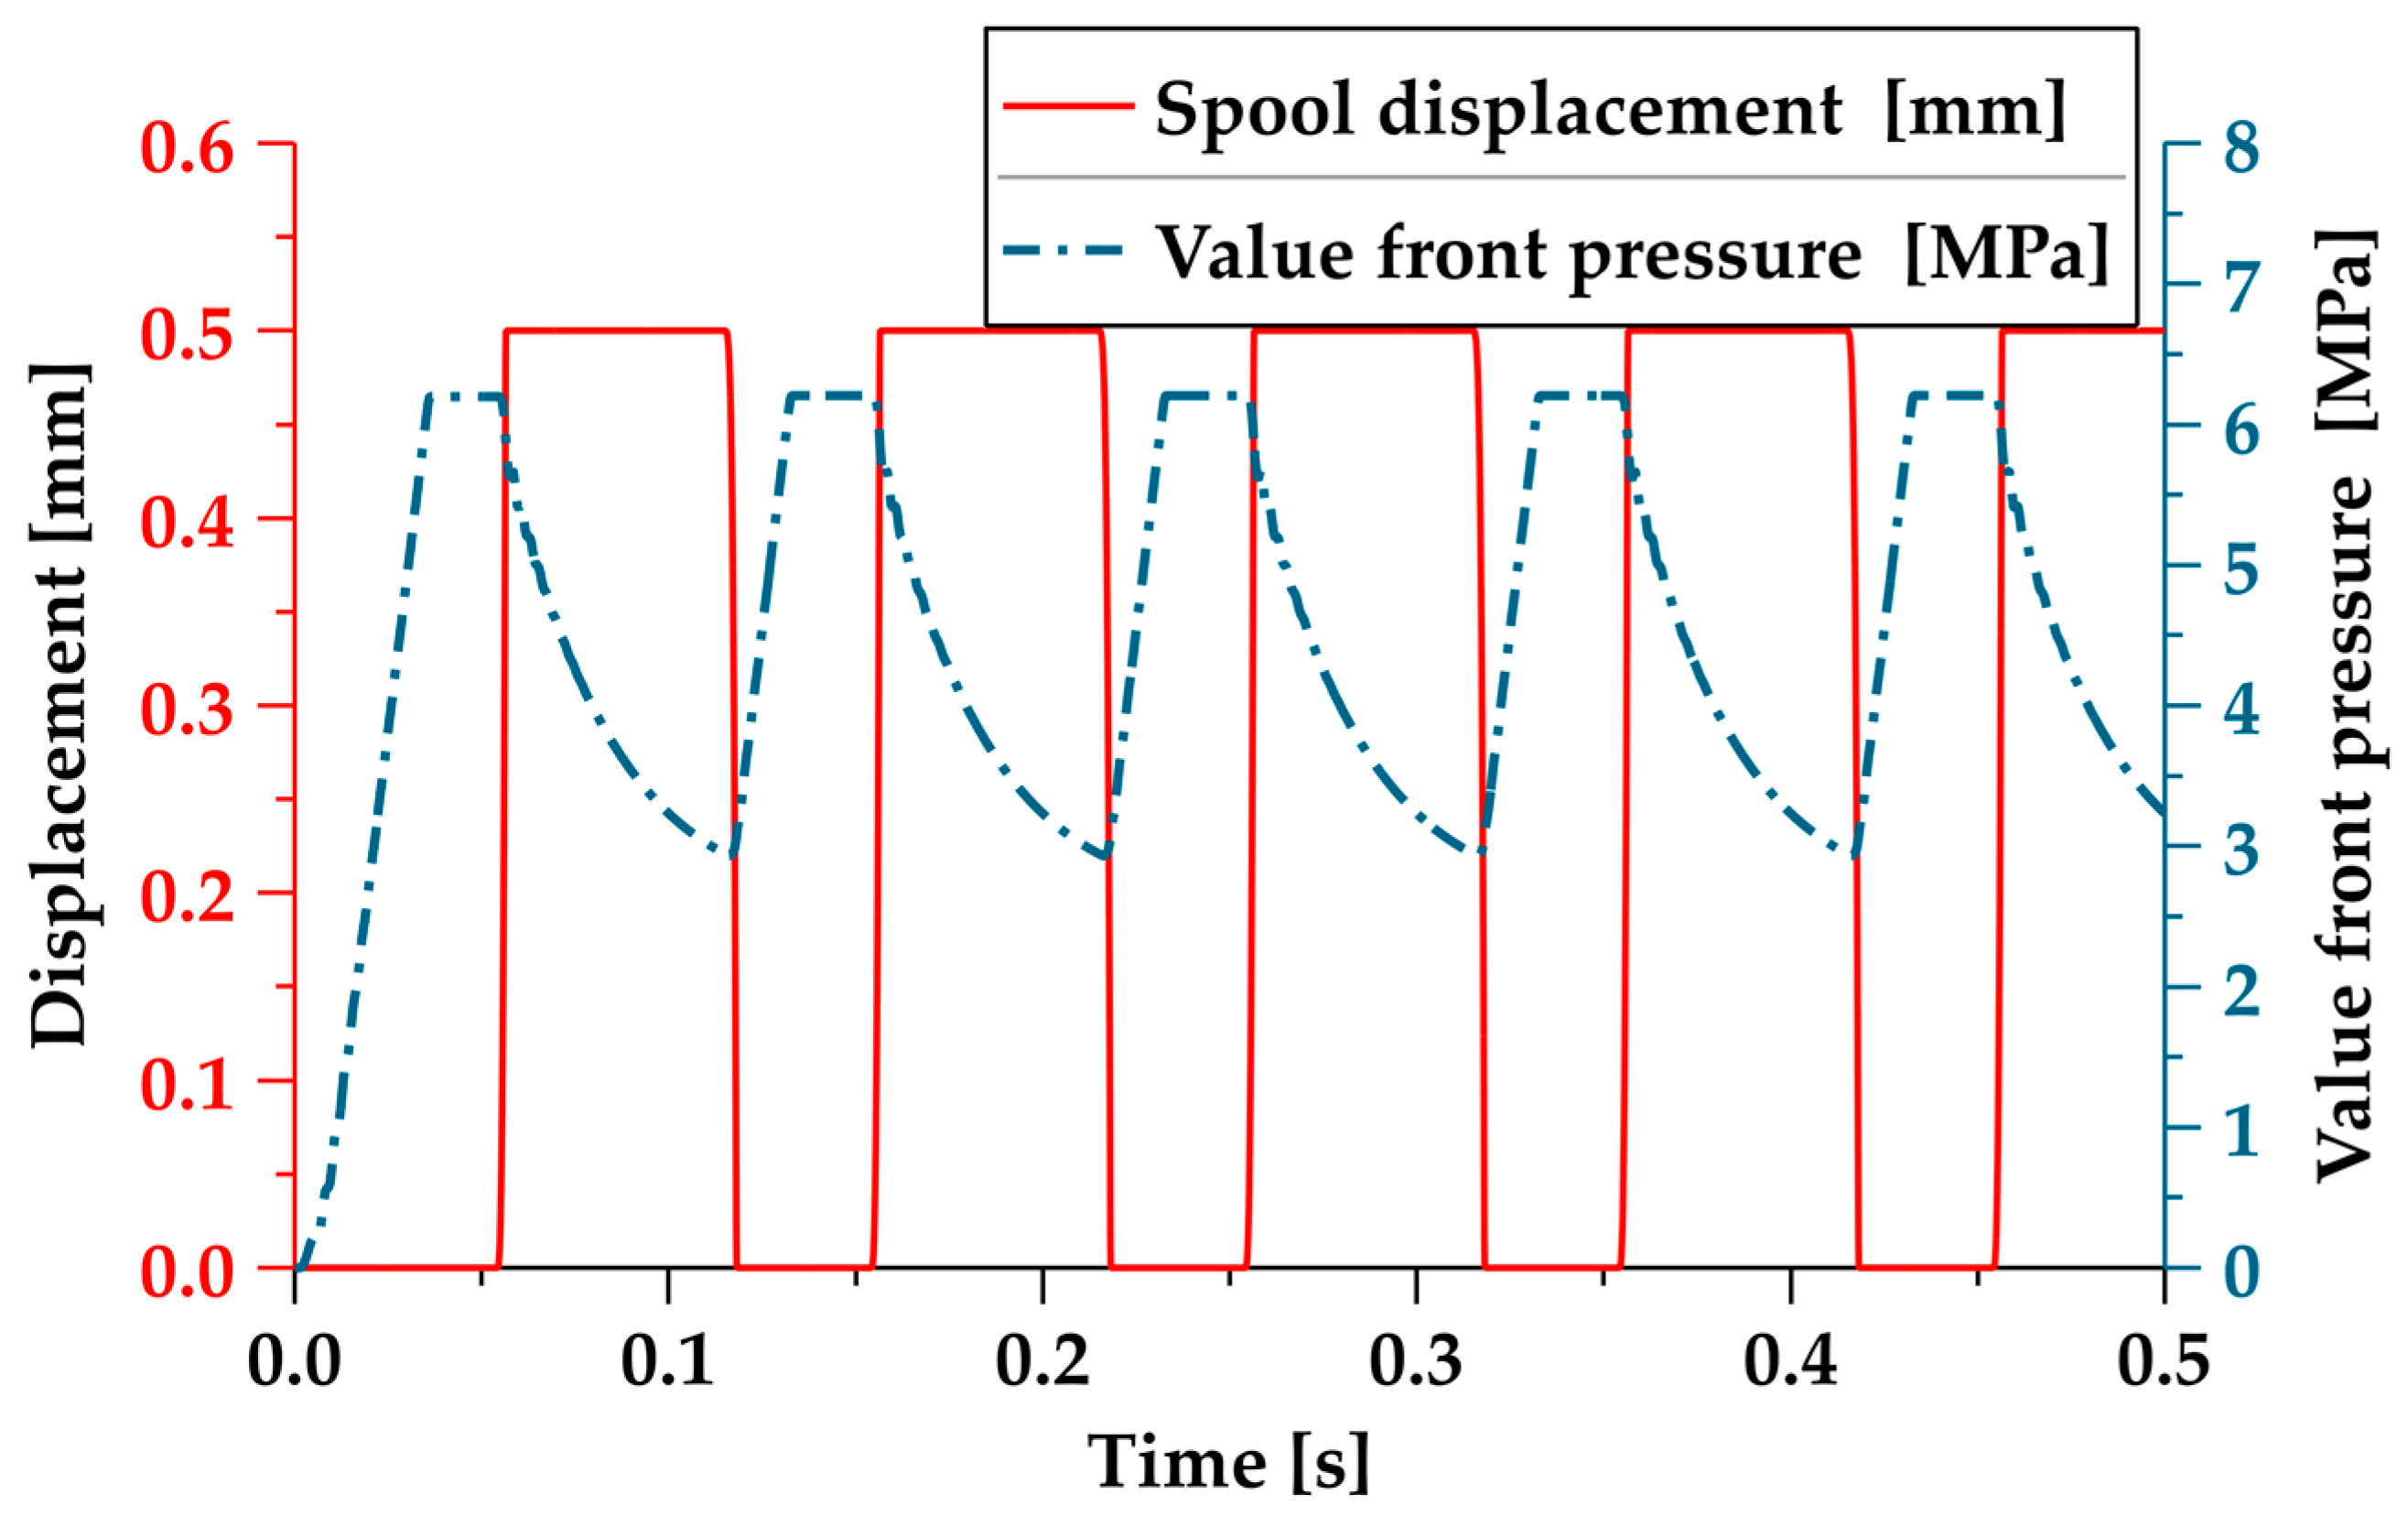
We used a single PWM (SPWM) signal to control the opening and closing of the HSV, with a frequency of 10 Hz, a duty cycle of 0.5, an amplitude of 24, a relief valve pressure of 6 MPa, and a simulation time of 0.5 s. As shown in Figure 6, the red solid line represents the displacement curve of the valve core, and the blue chain line represents the output value of the pressure sensor. The results show that the pressure at the oil supply port of the valve core begins to decrease after the spool is opened, and gradually increases to the maximum value after the valve core is closed. As the overflow area of the spool is small, the oil pressure drops after passing through the overflow port of the spool. From this, the opening and closing status of the valve core can be determined, based on the pressure changes in front of the valve.
Figure 6.
The relationship between spool displacement and the pressure in front of the valve.
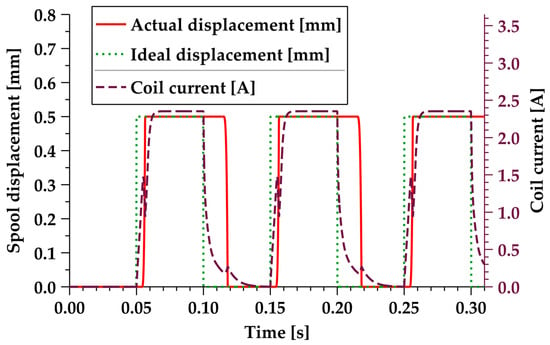
Figure 7 shows the dynamic response performance of the HSV. The red solid line represents the displacement curve of the actual movement of the valve core, the green solid dotted line represents the ideal displacement curve of the valve core, and the purple dashed line represents the coil current curve of the HSV.
Figure 7.
Dynamic characteristics of the SPWM-controlled HSV.
The results showed that the time delay of the valve core during the opening and closing periods was relatively long (an opening time delay of 7 ms, including an opening time delay of 4 ms and an opening motion time of 3 ms; a closing time delay of 19 ms, including a closing time delay of 15 ms and a closing motion time of 4 ms). Furthermore, there was a significant fluctuation in the coil current when the valve core began to move. When the valve core moved to the maximum opening, the coil current continued to rise, resulting in excess energy consumption.
4. TDCC Based on PWM
4.1. Principle of TDCC
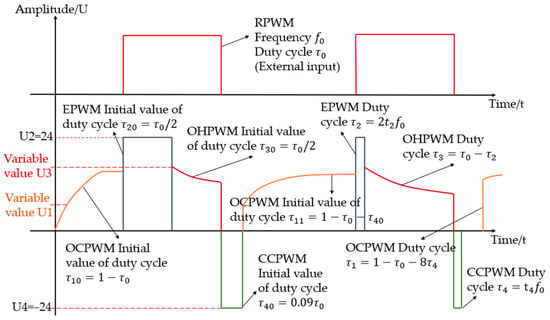
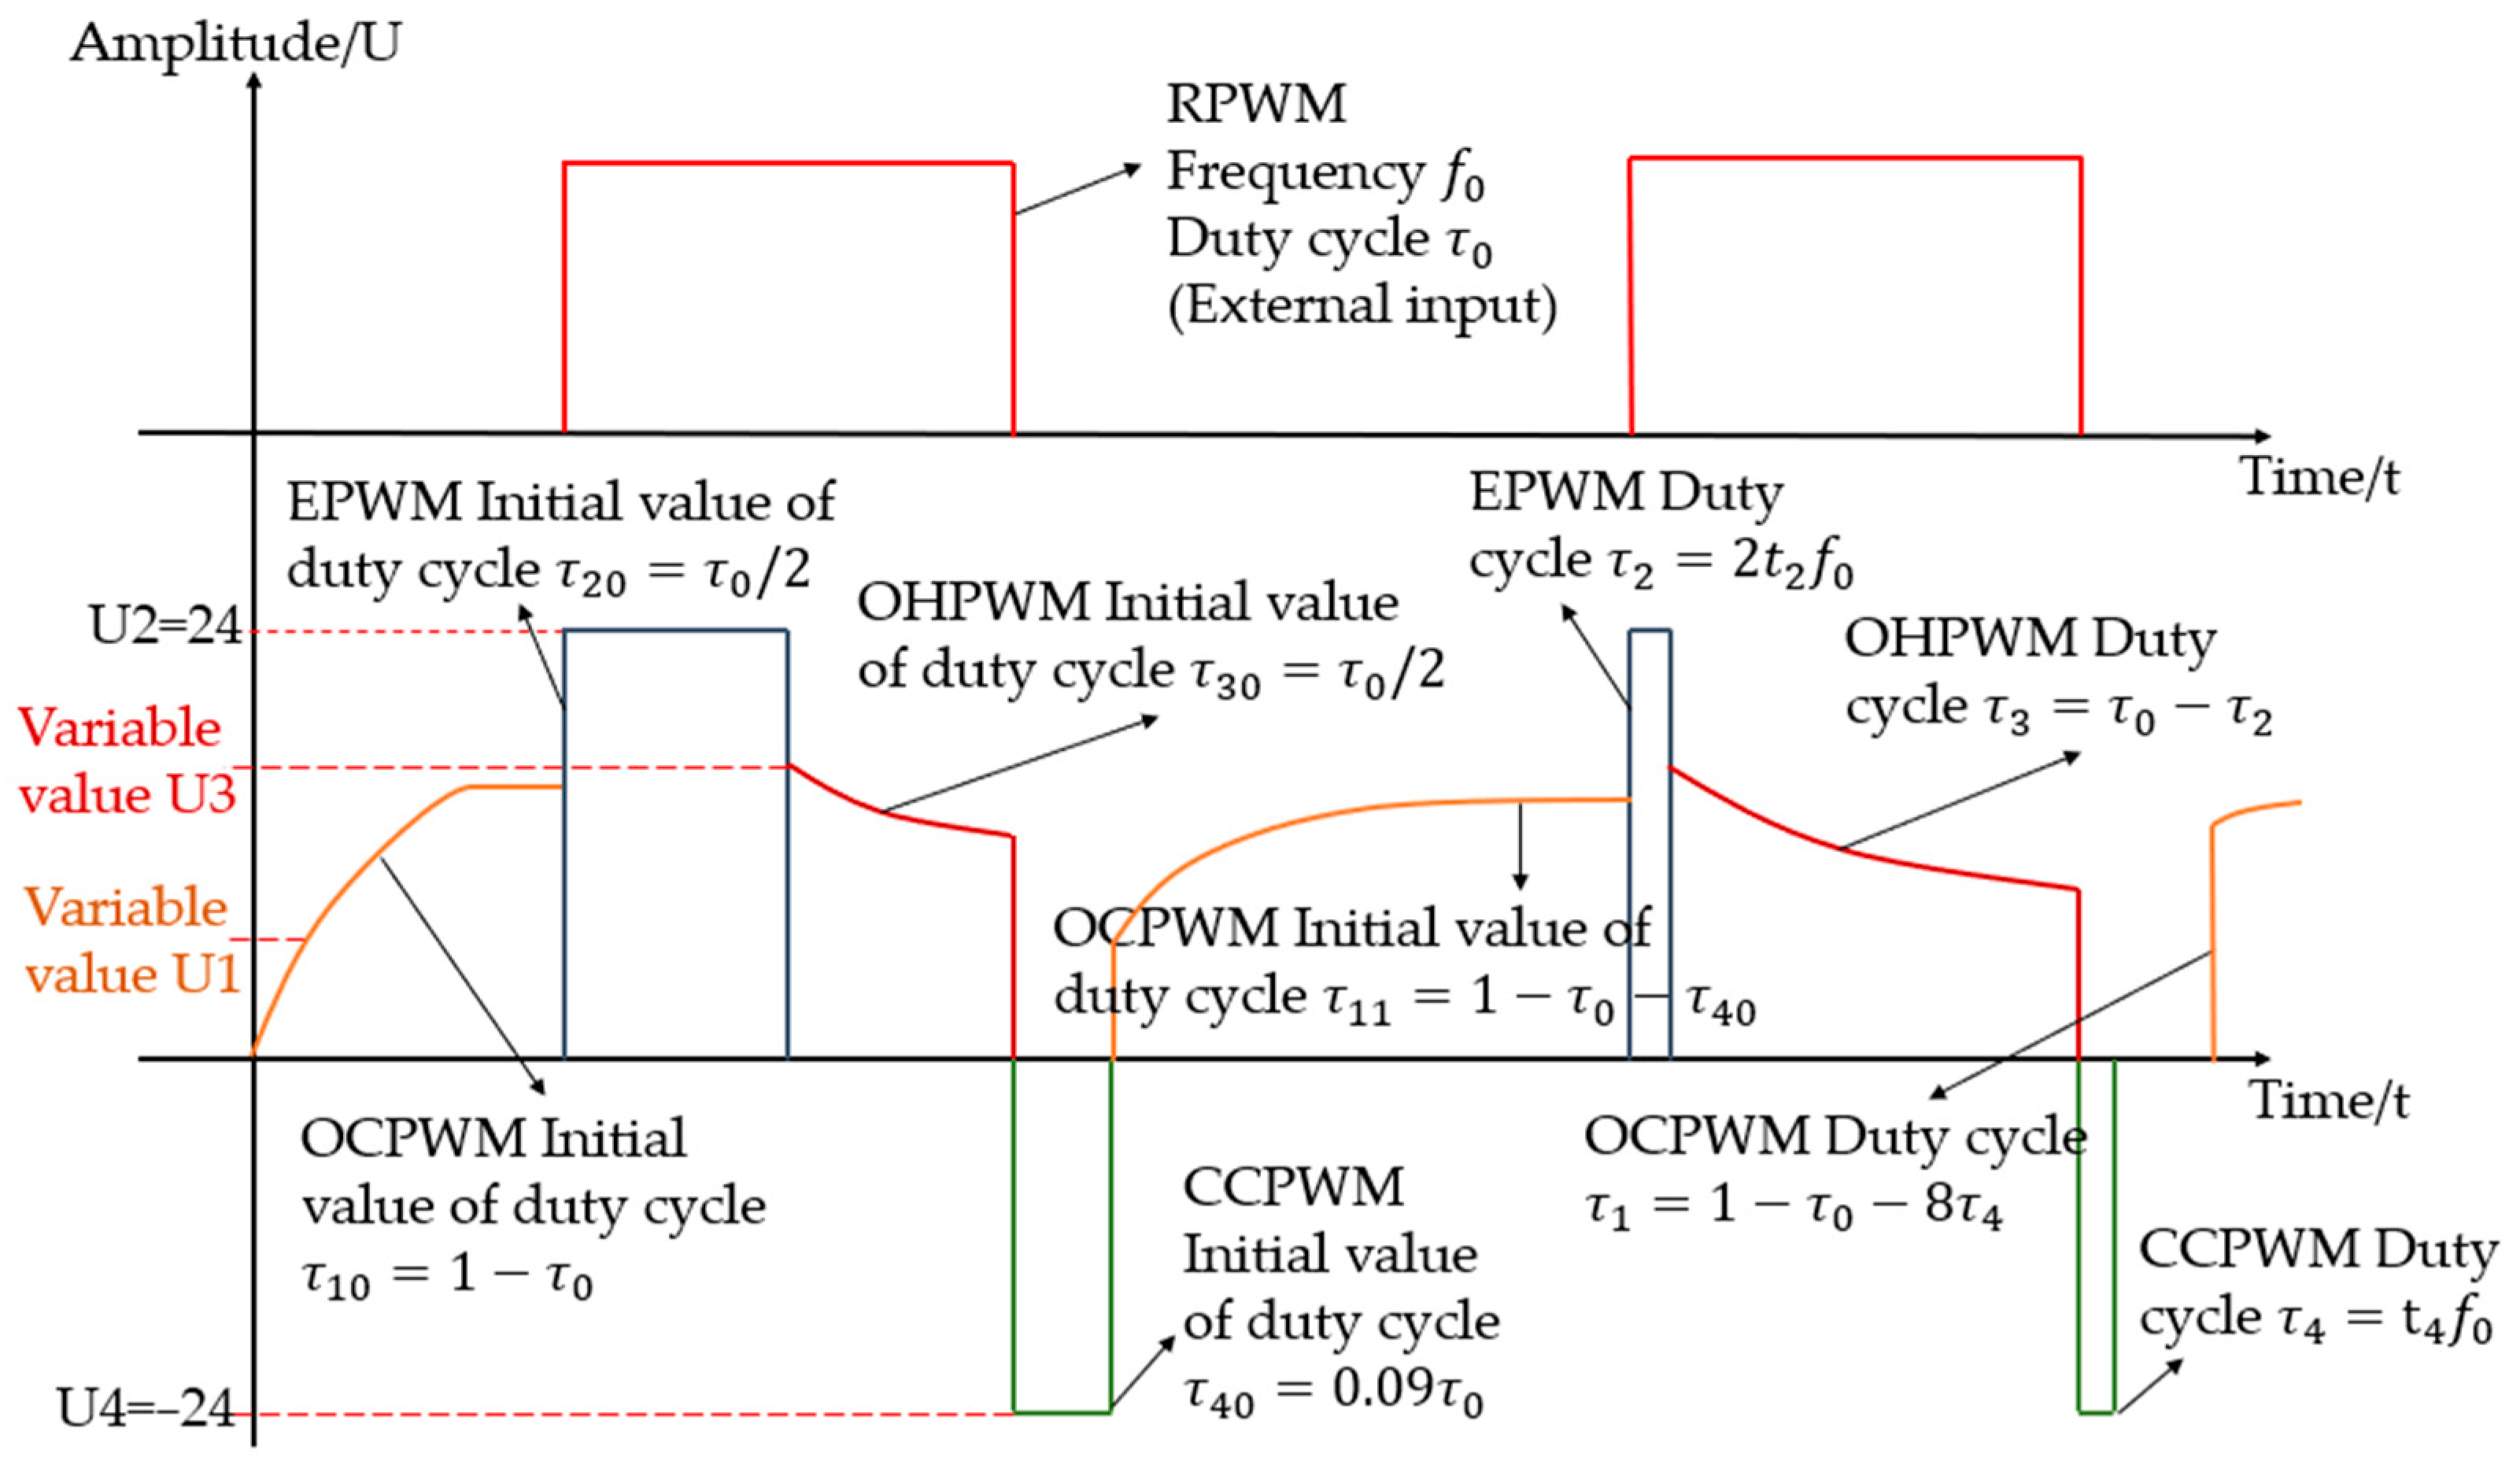
In order to reduce the time delay when the HSV is opened and closed, and to reduce the excess energy consumption when the valve core is fully open, TDCC based on PWM was proposed. The control principle is shown in Figure 8.
Figure 8.
Schematic diagram of TDCC.
The duty cycle of the EPWM and CCPWM is related to the feedback of the valve core movement process. The duty cycle of the OCPWM and OHPWM is also related to the EPWM and CCPWM. Therefore, before the valve core completes a complete opening and closing movement, it is necessary to specify the initial duty cycle values for each PWM, to ensure the normal movement of the valve core.
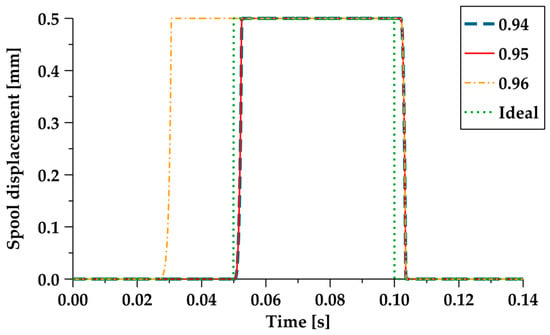
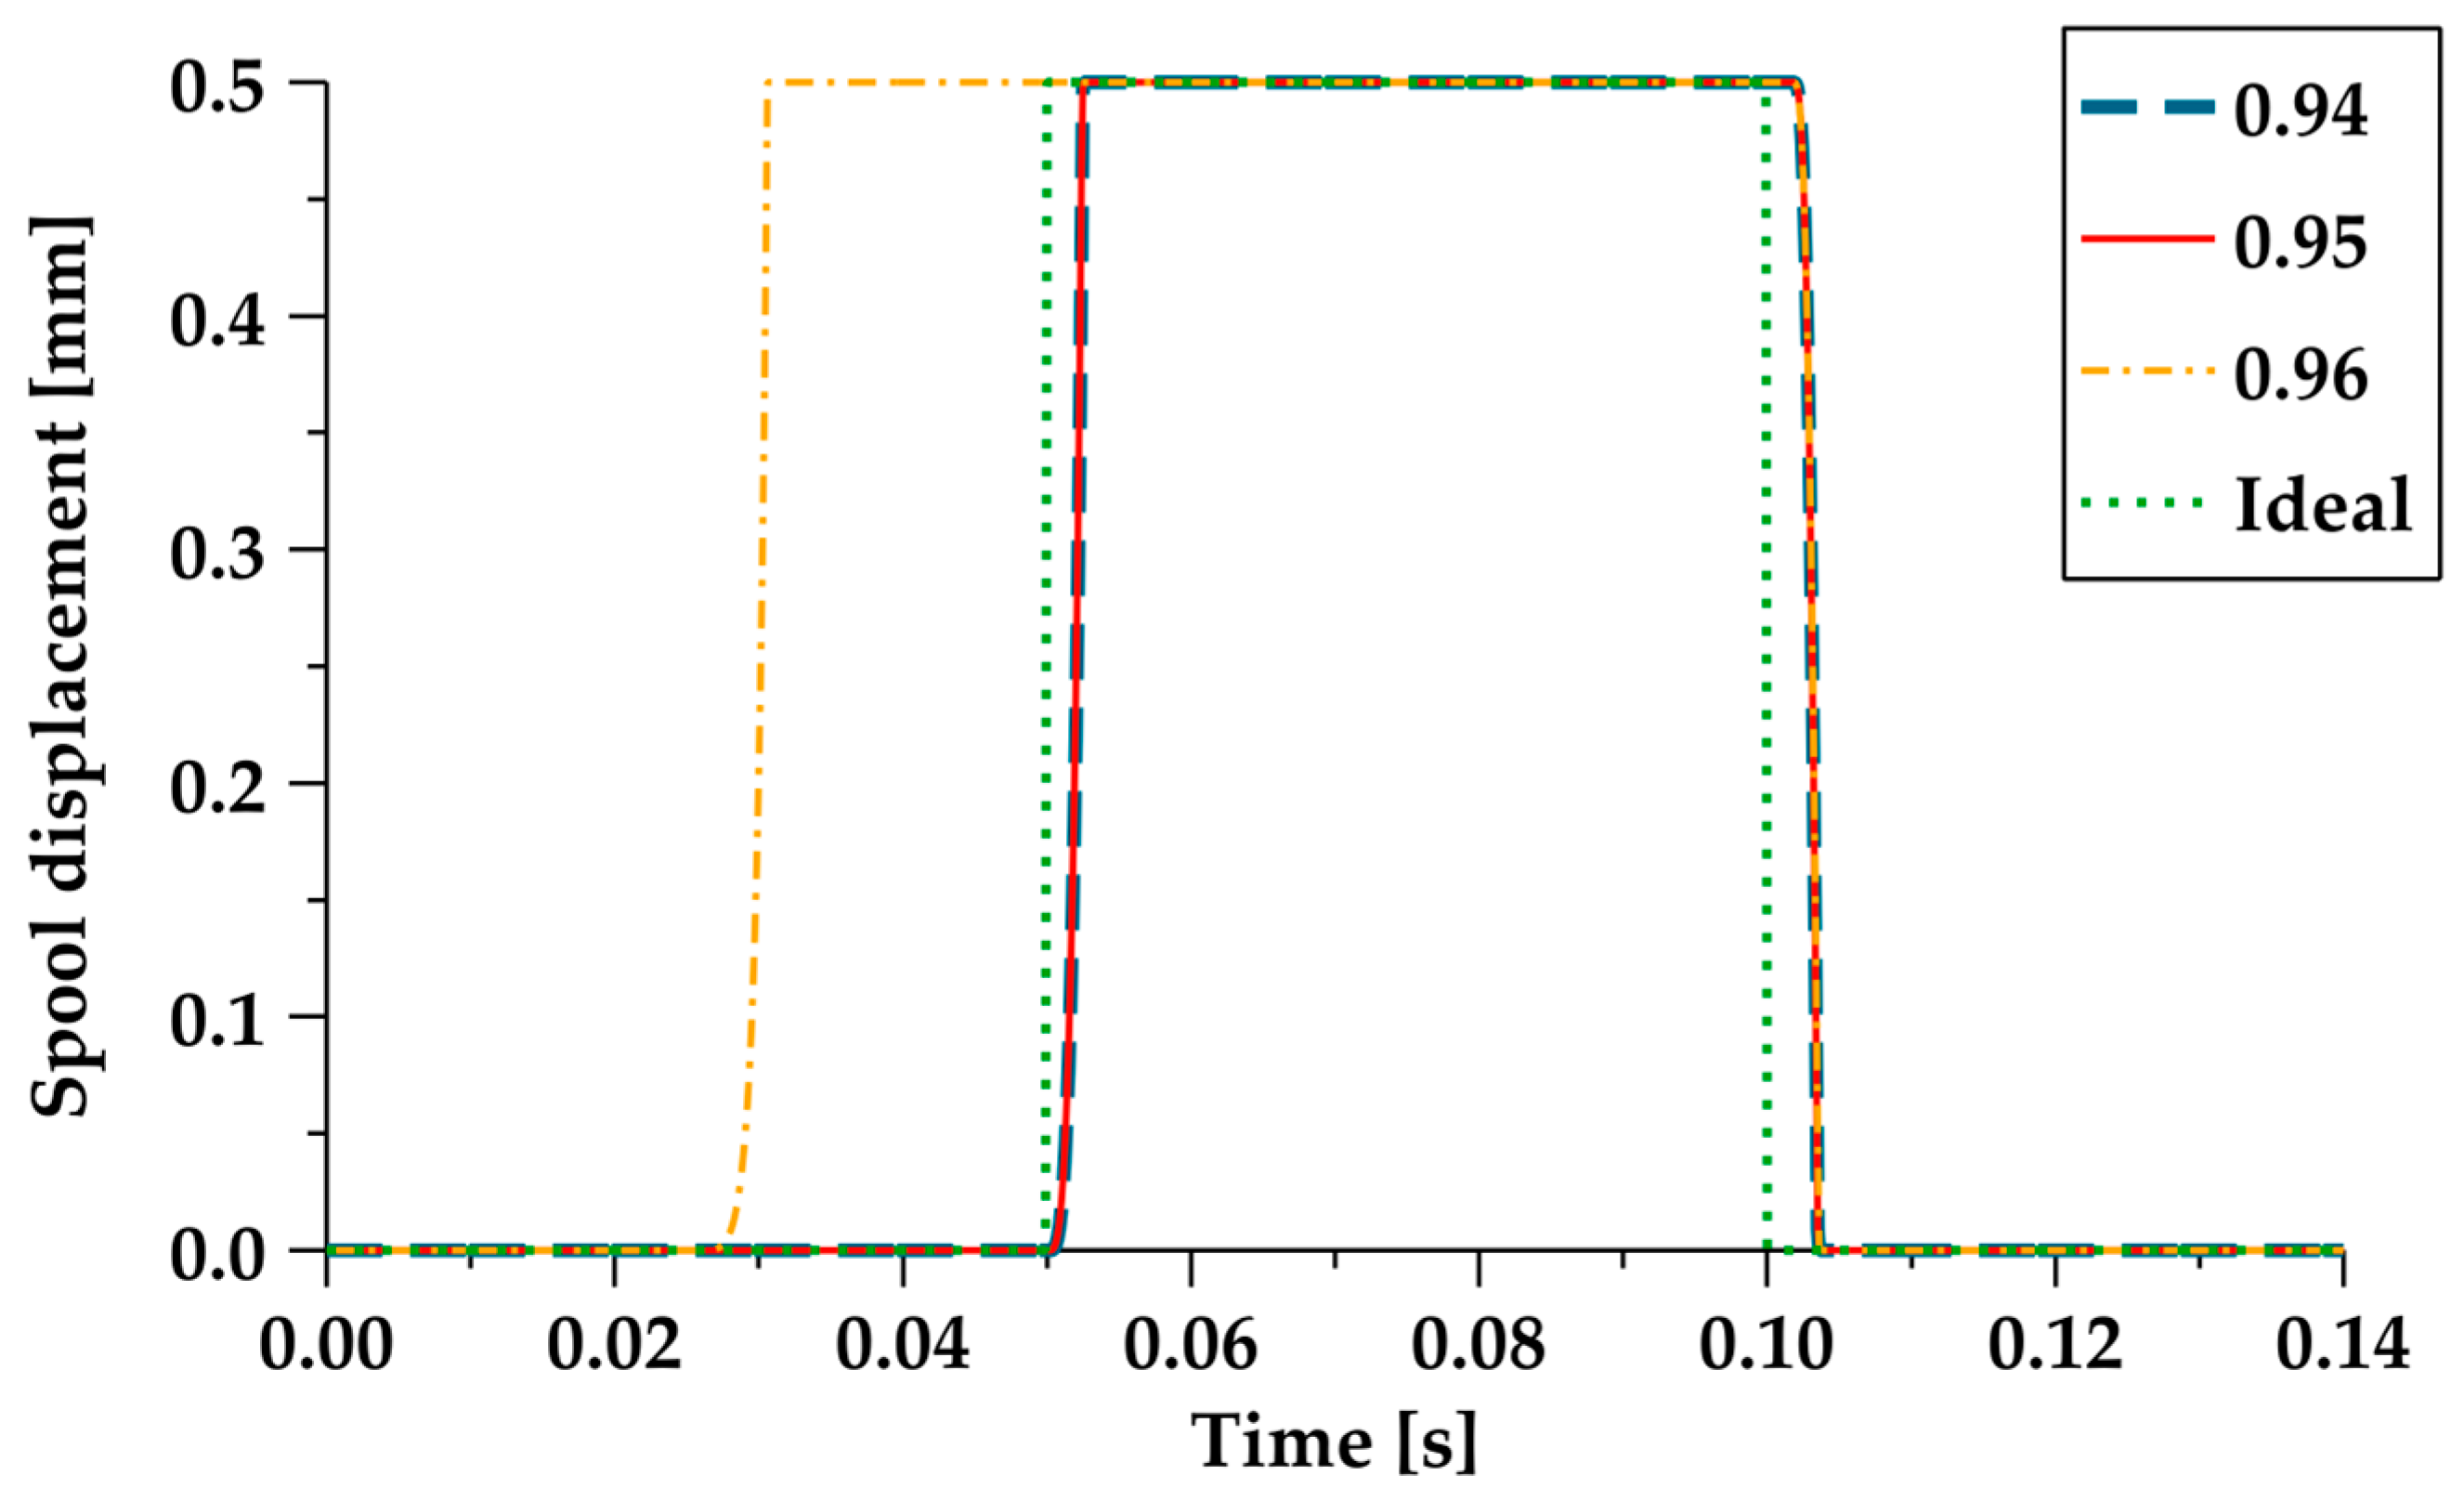
Before the rising edge of the RPWM arrives, the OCPWM, with the amplitude changing with the pressure in front of the valve, is loaded. This causes the coil current to rise near the critical opening current of the valve core, reducing the time it takes for the current to rise from 0 to the critical opening current of the valve core when the opening signal arrives. The amplitude of the OCPWM is determined according to Equation (16), and a coefficient correction is required to ensure that the valve core does not open. Different coefficients are used to obtain the displacement of the valve core, as shown in Figure 9. According to the diagram, when the coefficient is 0.95, the valve core does not open in advance; then:
where is the amplitude of the OCPWM; is the duty cycle of the RPWM; is the initial duty cycle of the first cycle for the OCPWM; is the initial duty cycle of the second cycle for the OCPWM; is the initial duty cycle of the first cycle for the CCPWM; is the subsequent cycle duty cycle for the OCPWM; and is the subsequent cycle duty cycle for the CCPWM. The frequency of the OCPWM is consistent with the RPWM frequency .
Figure 9.
Comparison of the spool displacement with different coefficients in U1.
When the opening signal of the valve core, i.e., the rising edge of the RPWM, arrives, the EPWM with amplitude V is loaded, causing the current to rapidly rise, and open the valve core. The first cycle of the EPWM needs to ensure that the valve core is fully opened. According to the dynamic response characteristics of the valve core, shown in Figure 7, the initial duty cycle of the EPWM is taken as .
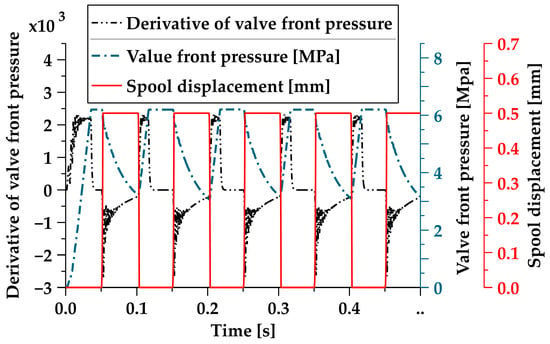
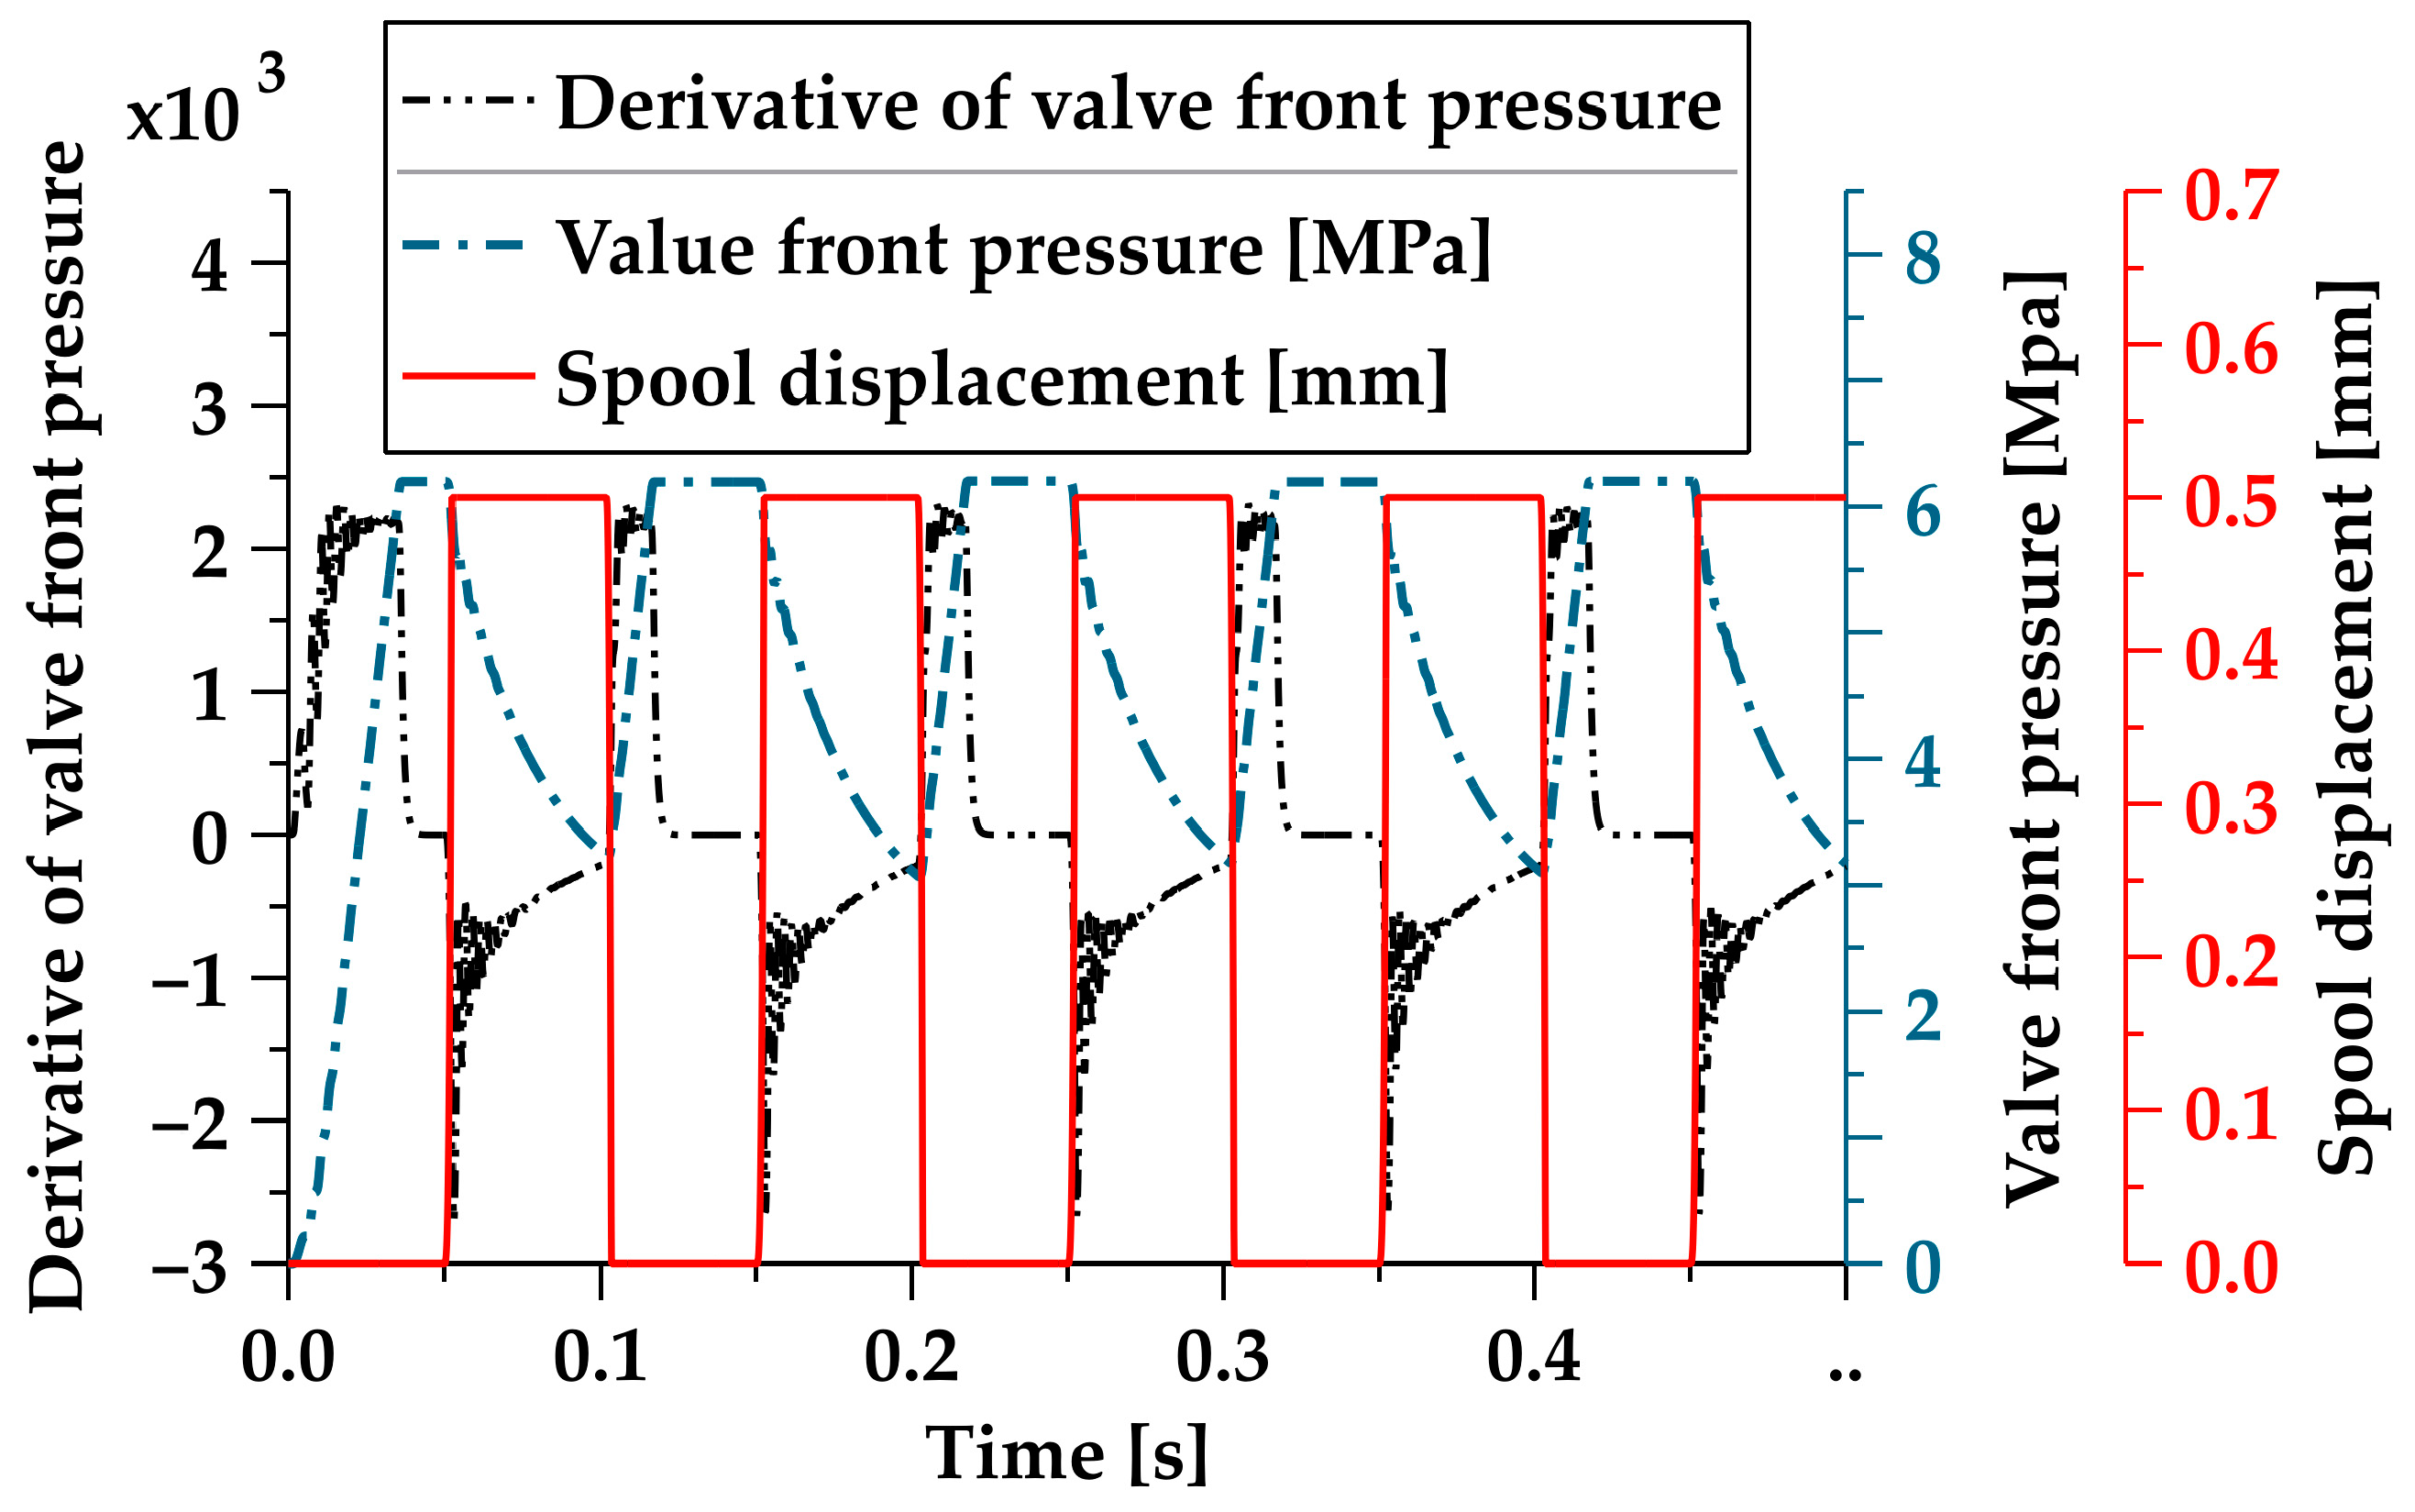
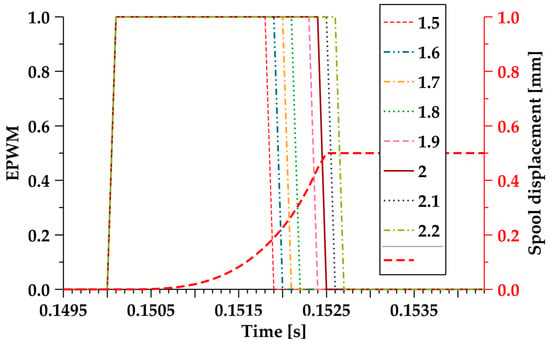
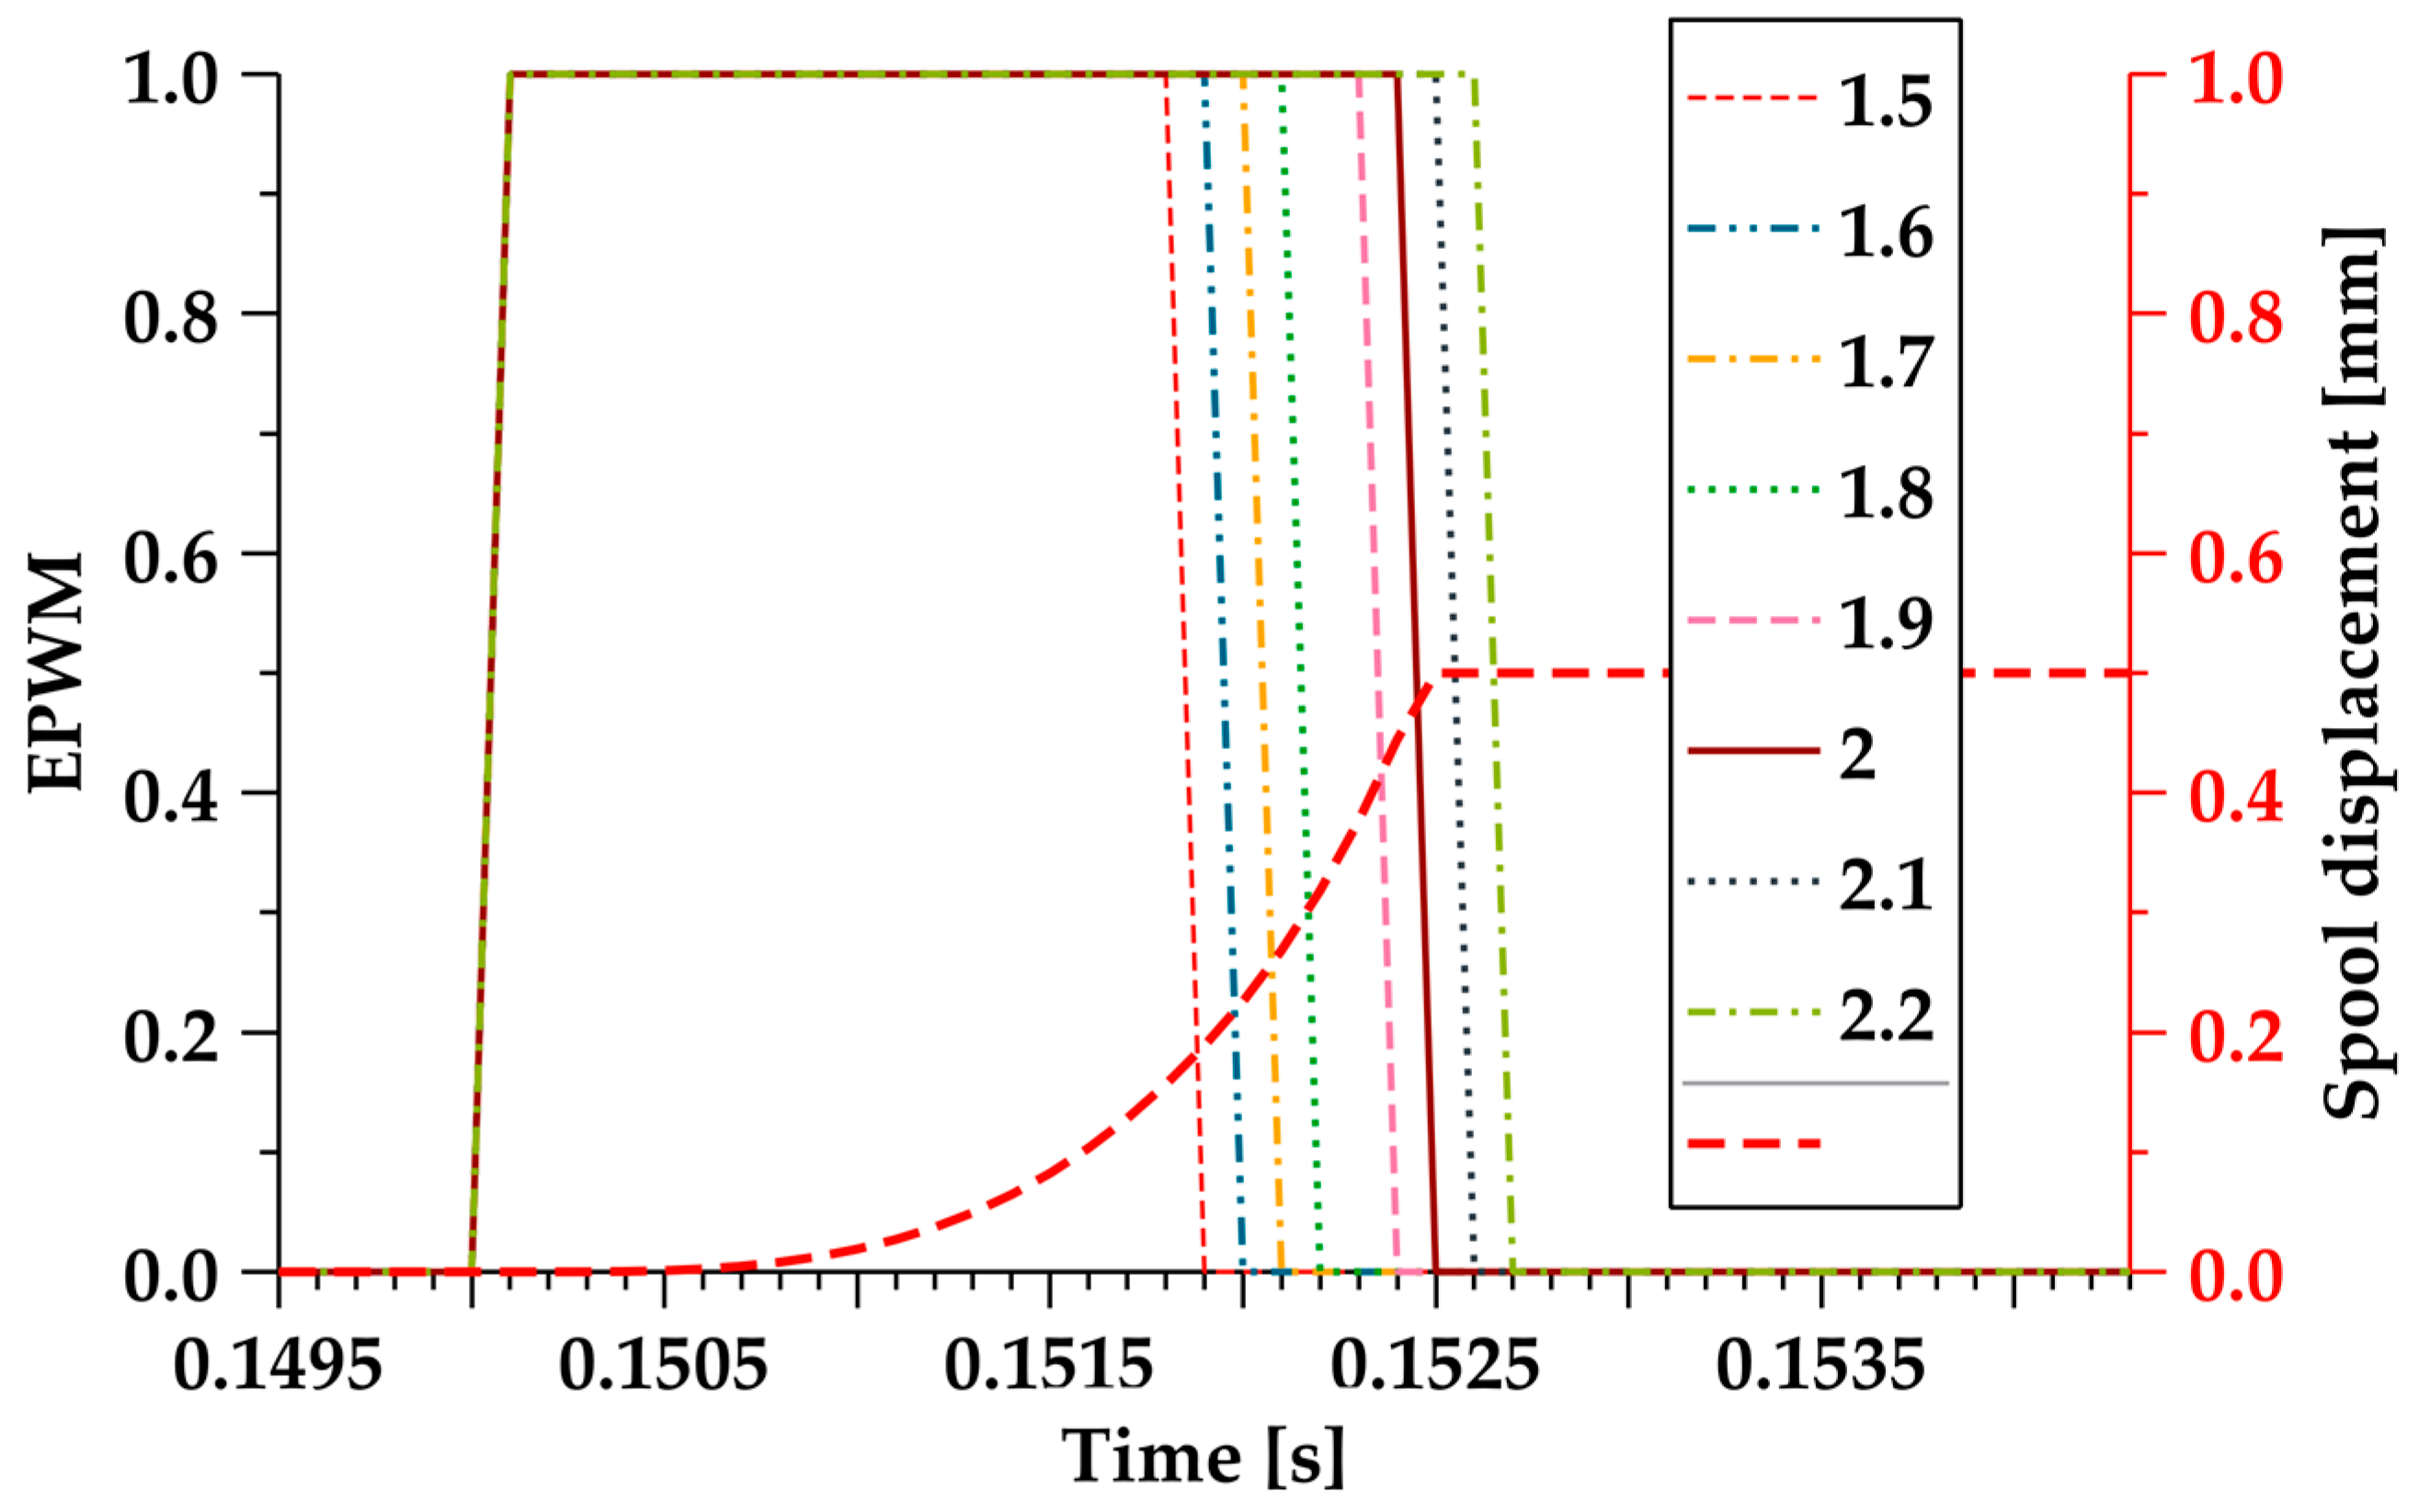
The duty cycle of the subsequent cycles of the EPWM is related to the position status of the valve core. When the valve core is in a fully open state, the amplitude of the EPWM changes to 0. Due to the difficulty of installing displacement sensors inside the HSV, the relationship shown in Figure 6 is used to determine the position and status of the spool, based on the pressure changes in front of the valve. The derivative of the pressure in front of the valve is shown in Figure 10. The black double-dotted line represents the derivative of the pressure in front of the valve, the blue chain line represents the pressure in front of the valve, and the red solid line represents the displacement of the valve core. It can be seen that, when the derivative of the pressure in front of the valve is less than zero, this indicates that the valve core is open. To calculate the time when the derivative from the rising edge of the RPWM to the pressure in front of the valve is less than zero, in order to ensure that the valve core is in a fully open state when the amplitude of the excitation PWM change to 0, a coefficient is needed to correct . Different coefficients were used to obtain the valve core displacement and EPWM signal, as shown in Figure 11. According to the figure, when the coefficient is 2, the valve core precisely reaches a fully open state when the amplitude of the EPWM is 0. Then:
where is the duty cycle of the EPWM; is the time from the falling edge of the EPWM to the derivative of the pressure in front of the valve being less than zero; and is the RPWM frequency. The frequency of the EPWM is consistent with the RPWM frequency .
Figure 10.
The relationship between the derivative of the pressure in front of the valve and the displacement of the valve core.
Figure 11.
Comparison chart of different coefficients.
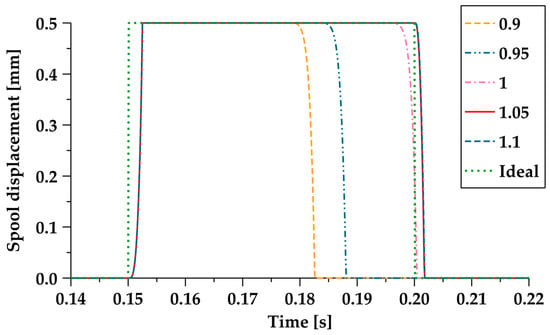
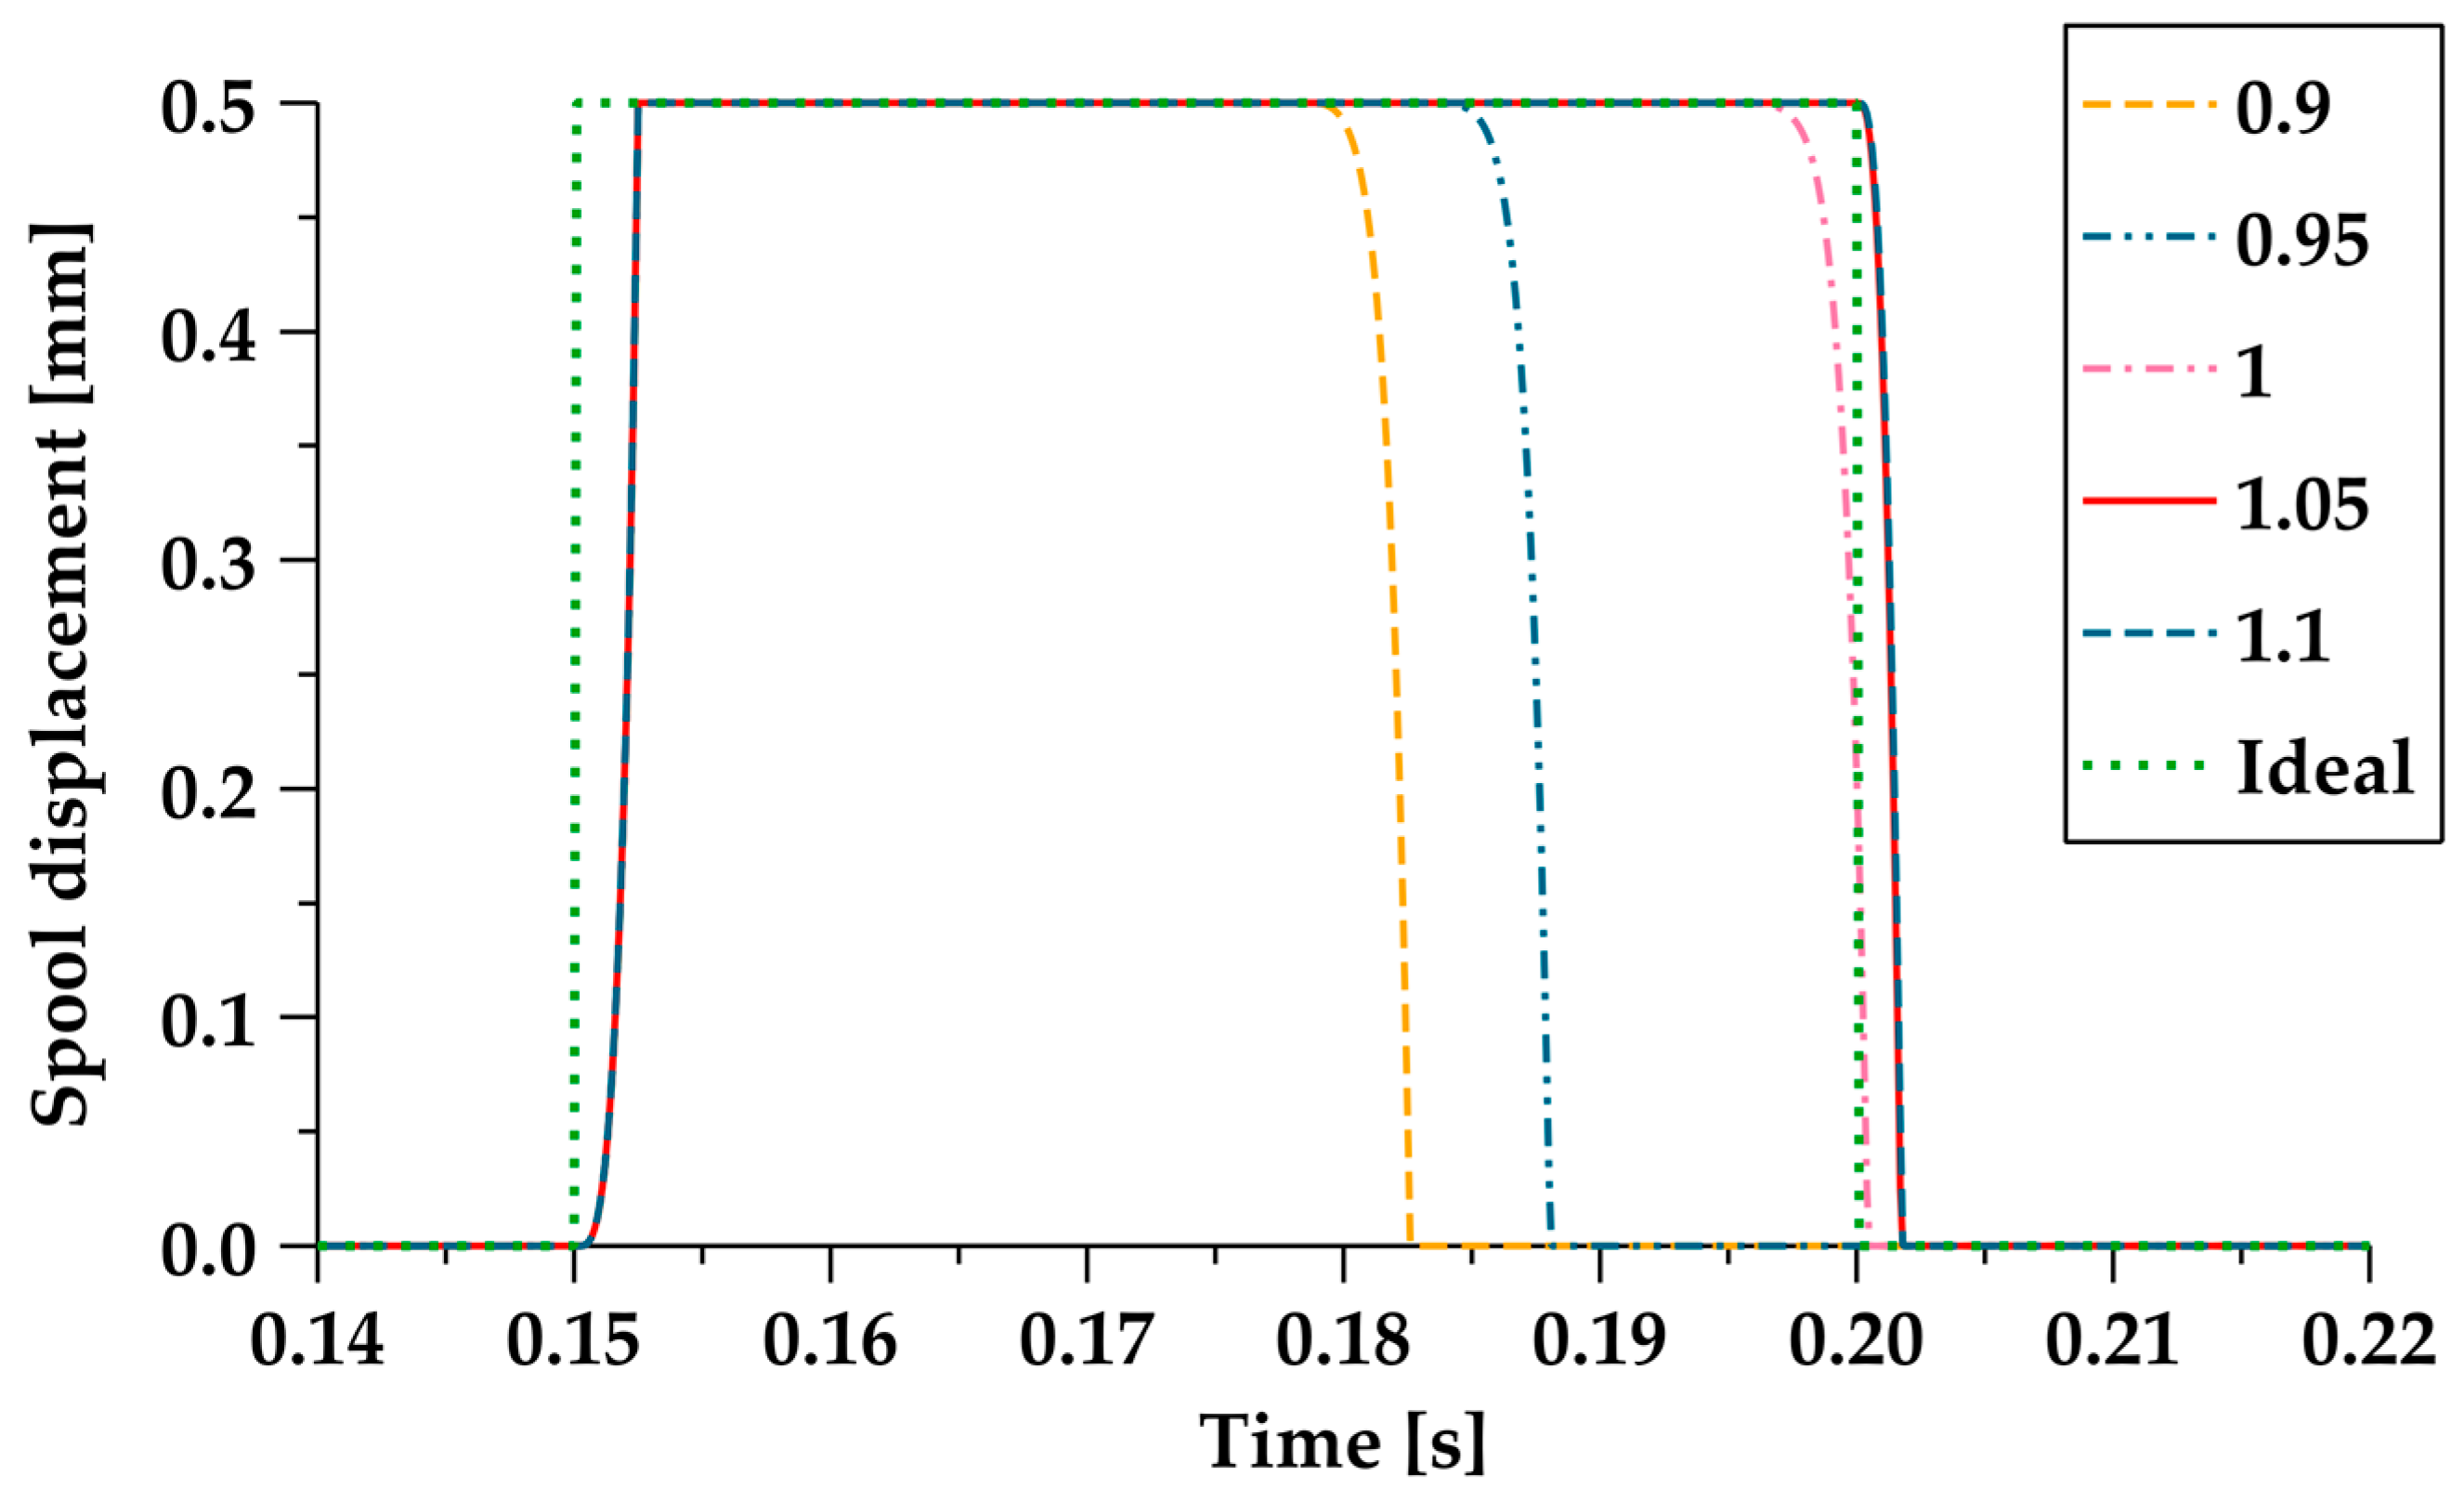
When the valve core is fully open, in order to ensure the normal opening of the valve core, and minimize the current as much as possible, the OHPWM with amplitude , changing with the pressure in front of the valve, also requires a coefficient correction. Different coefficients were used to obtain the valve core displacement curve, as shown in Figure 12. The green dotted line in the figure shows the ideal displacement. According to the diagram, when the coefficient is greater than or equal to 1.05, the valve core displacement does not close in advance. Therefore, the coefficient is taken as 1.05; then:
where is the amplitude of the OHPWM; is the initial value of the first cycle duty cycle of the OHPWM; is the duty cycle of the EPWM; is the initial duty cycle of the EPWM; is the duty cycle of the RPWM; and is the duty cycle of subsequent cycles of the OHPWM. The frequency of the OHPWM is consistent with that of the RPWM.
Figure 12.
Comparison chart of spool displacement with different coefficients in U3.
When the valve core closing signal, i.e., the falling edge of the RPWM arrives, in order to enable the valve core to close quickly, the coil current needs to decrease rapidly. This is carried out via loading the CCPWM with an amplitude of V, to reduce the influence of inductance, and quickly unload the coil current. If the duty cycle of the CCPWM is too large or too small, it will affect the closing time of the spool. If the duty cycle is too large, it will cause the current to decrease to zero, and then increase in reverse, causing the electromagnetic force to increase again; if the duty cycle is too small, it will cause the current to slowly decrease to zero. Therefore, in order to ensure that the coil current can drop to zero in the first cycle, to facilitate the calculation of the duty cycle of the CCPWM subsequent cycles, and not cause the valve core to open again, the initial value of the duty cycle of the CCPWM first cycle is taken as .
The duty cycle of the CCPWM in subsequent cycles is calculated through collecting the current value of the coil current through a current sensor, and calculating the time from the falling edge of RPWM to the zero of the coil current. The duty cycle of the CCPWM is . The frequency of the CCPWM is consistent with that of the RPWM.
If the amplitude of the CCPWM is 0, and the OCPWM is directly loaded, the current will also increase before the valve core is fully closed, resulting in an increase in the valve core closing time. Therefore, according to Equation (8), the time for the current sensor to decrease to 0 is 0.0028 s; that is, the loading time for the CCPWM is 0.0028 s. When the voltage is loaded, the time for the current to rise to the maximum value is 0.0246 s. In order to keep the current value small during any time period, according to the frequency of 10 Hz, the duration of the RPWM amplitude 0 at a duty cycle of 0.5 is 0.05 s. Therefore, the amplitude of the OCPWM needs to become 0 within 0.0226 s after the end of the CCPWM, with 0.0226/0.0028 = 8.07. In order to increase the current to the maximum value, the coefficient is rounded down to 8, to correct the duty cycle of subsequent OCPWM cycles:
OCPWM is loaded after the amplitude of the CCPWM changes to 0 for a period of time, ensuring that the coil current remains at 0 when the amplitude of the CCPWM changes to 0, and the valve core is fully closed.
4.2. Time Series Analysis of TDCC
The pressure in front of the valve, shown in Figure 6, gradually increases from 0 to the set maximum pressure value at . Therefore, when the RPWM is directly loaded onto the HSV at , the hydraulic pressure overcome is 0, which cannot reflect the actual dynamic response of the valve core at the maximum working pressure. Therefore, the RPWM needs to be delayed for a period of time, to ensure that the pressure in front of the valve rises to the maximum value, which is more in line with actual working conditions.
The first cycle of the OCPWM does not require a delay, and is directly loaded onto the HSV electromagnetic coil, according to Equations (19) and (20). Due to the consistency between the frequency of the OCPWM and RPWM, the duration corresponding to the initial value of the CCPWM duty cycle needs to be delayed in the second cycle of the OCPWM:
The time delay of subsequent cycles of the OCPWM is also related to the duty cycle of the CCPWM, with a value of:
EPWM is loaded at the rising edge of the RPWM, so the delay of the EPWM is the same as that of the RPWM; that is, . The OHPWM is loaded after the EPWM, and the frequency of the OHPWM is consistent with the RPWM. Therefore, the delay of the OHPWM in the first cycle, and the delay in subsequent cycles, are:
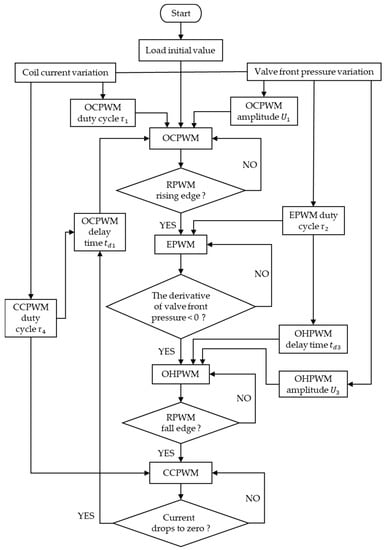
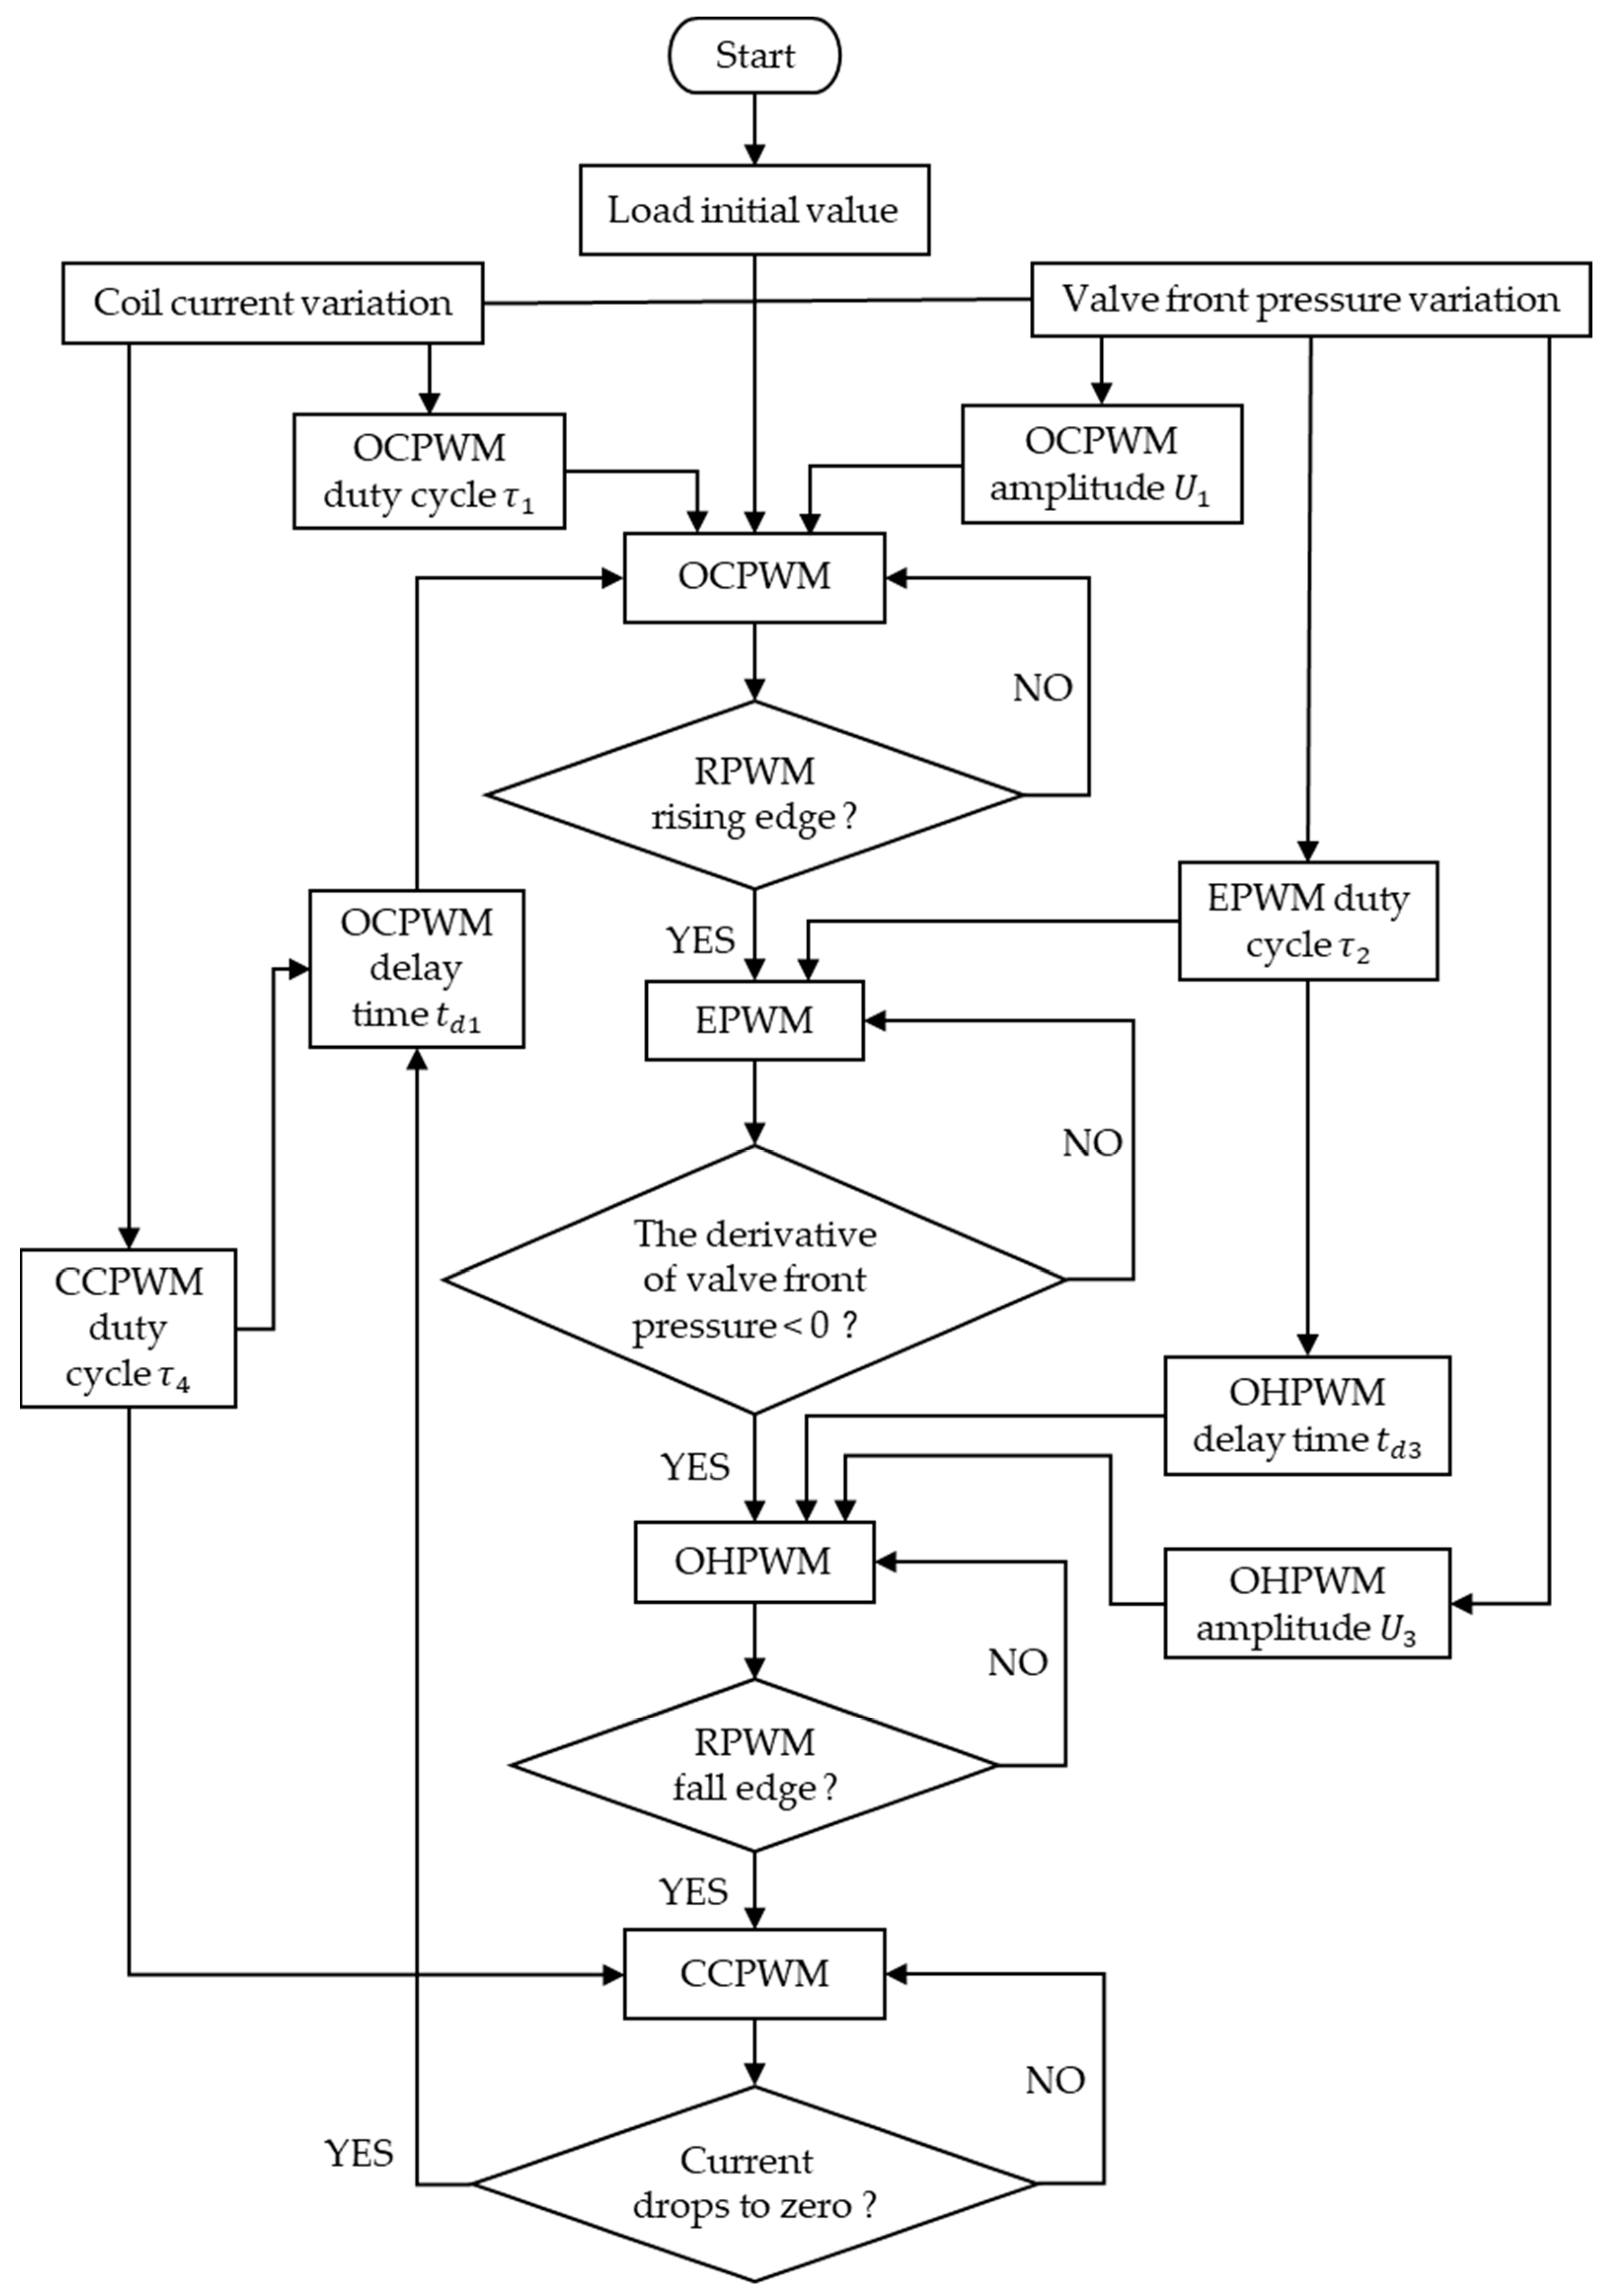
The CCPWM is loaded at the falling edge of the RPWM and, in subsequent cycles, the duty cycle of the CCPWM is related to the current falling time of the previous cycle, and the falling edge time of the RPWM. Before obtaining the current falling time of the previous cycle, the duty cycle output is zero. Therefore, it is only necessary to set the time delay of the initial value of the CCPWM in the first cycle as , and there is no need to delay in subsequent cycles. Based on the above, the control principle flowchart of the TDCC is shown in Figure 13.
Figure 13.
Flowchart of the TDCC.
5. Verification and Analysis of TDCC
5.1. Validation Model Construction
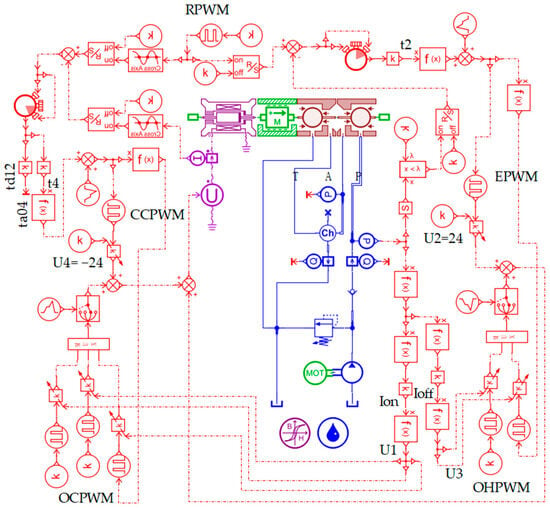
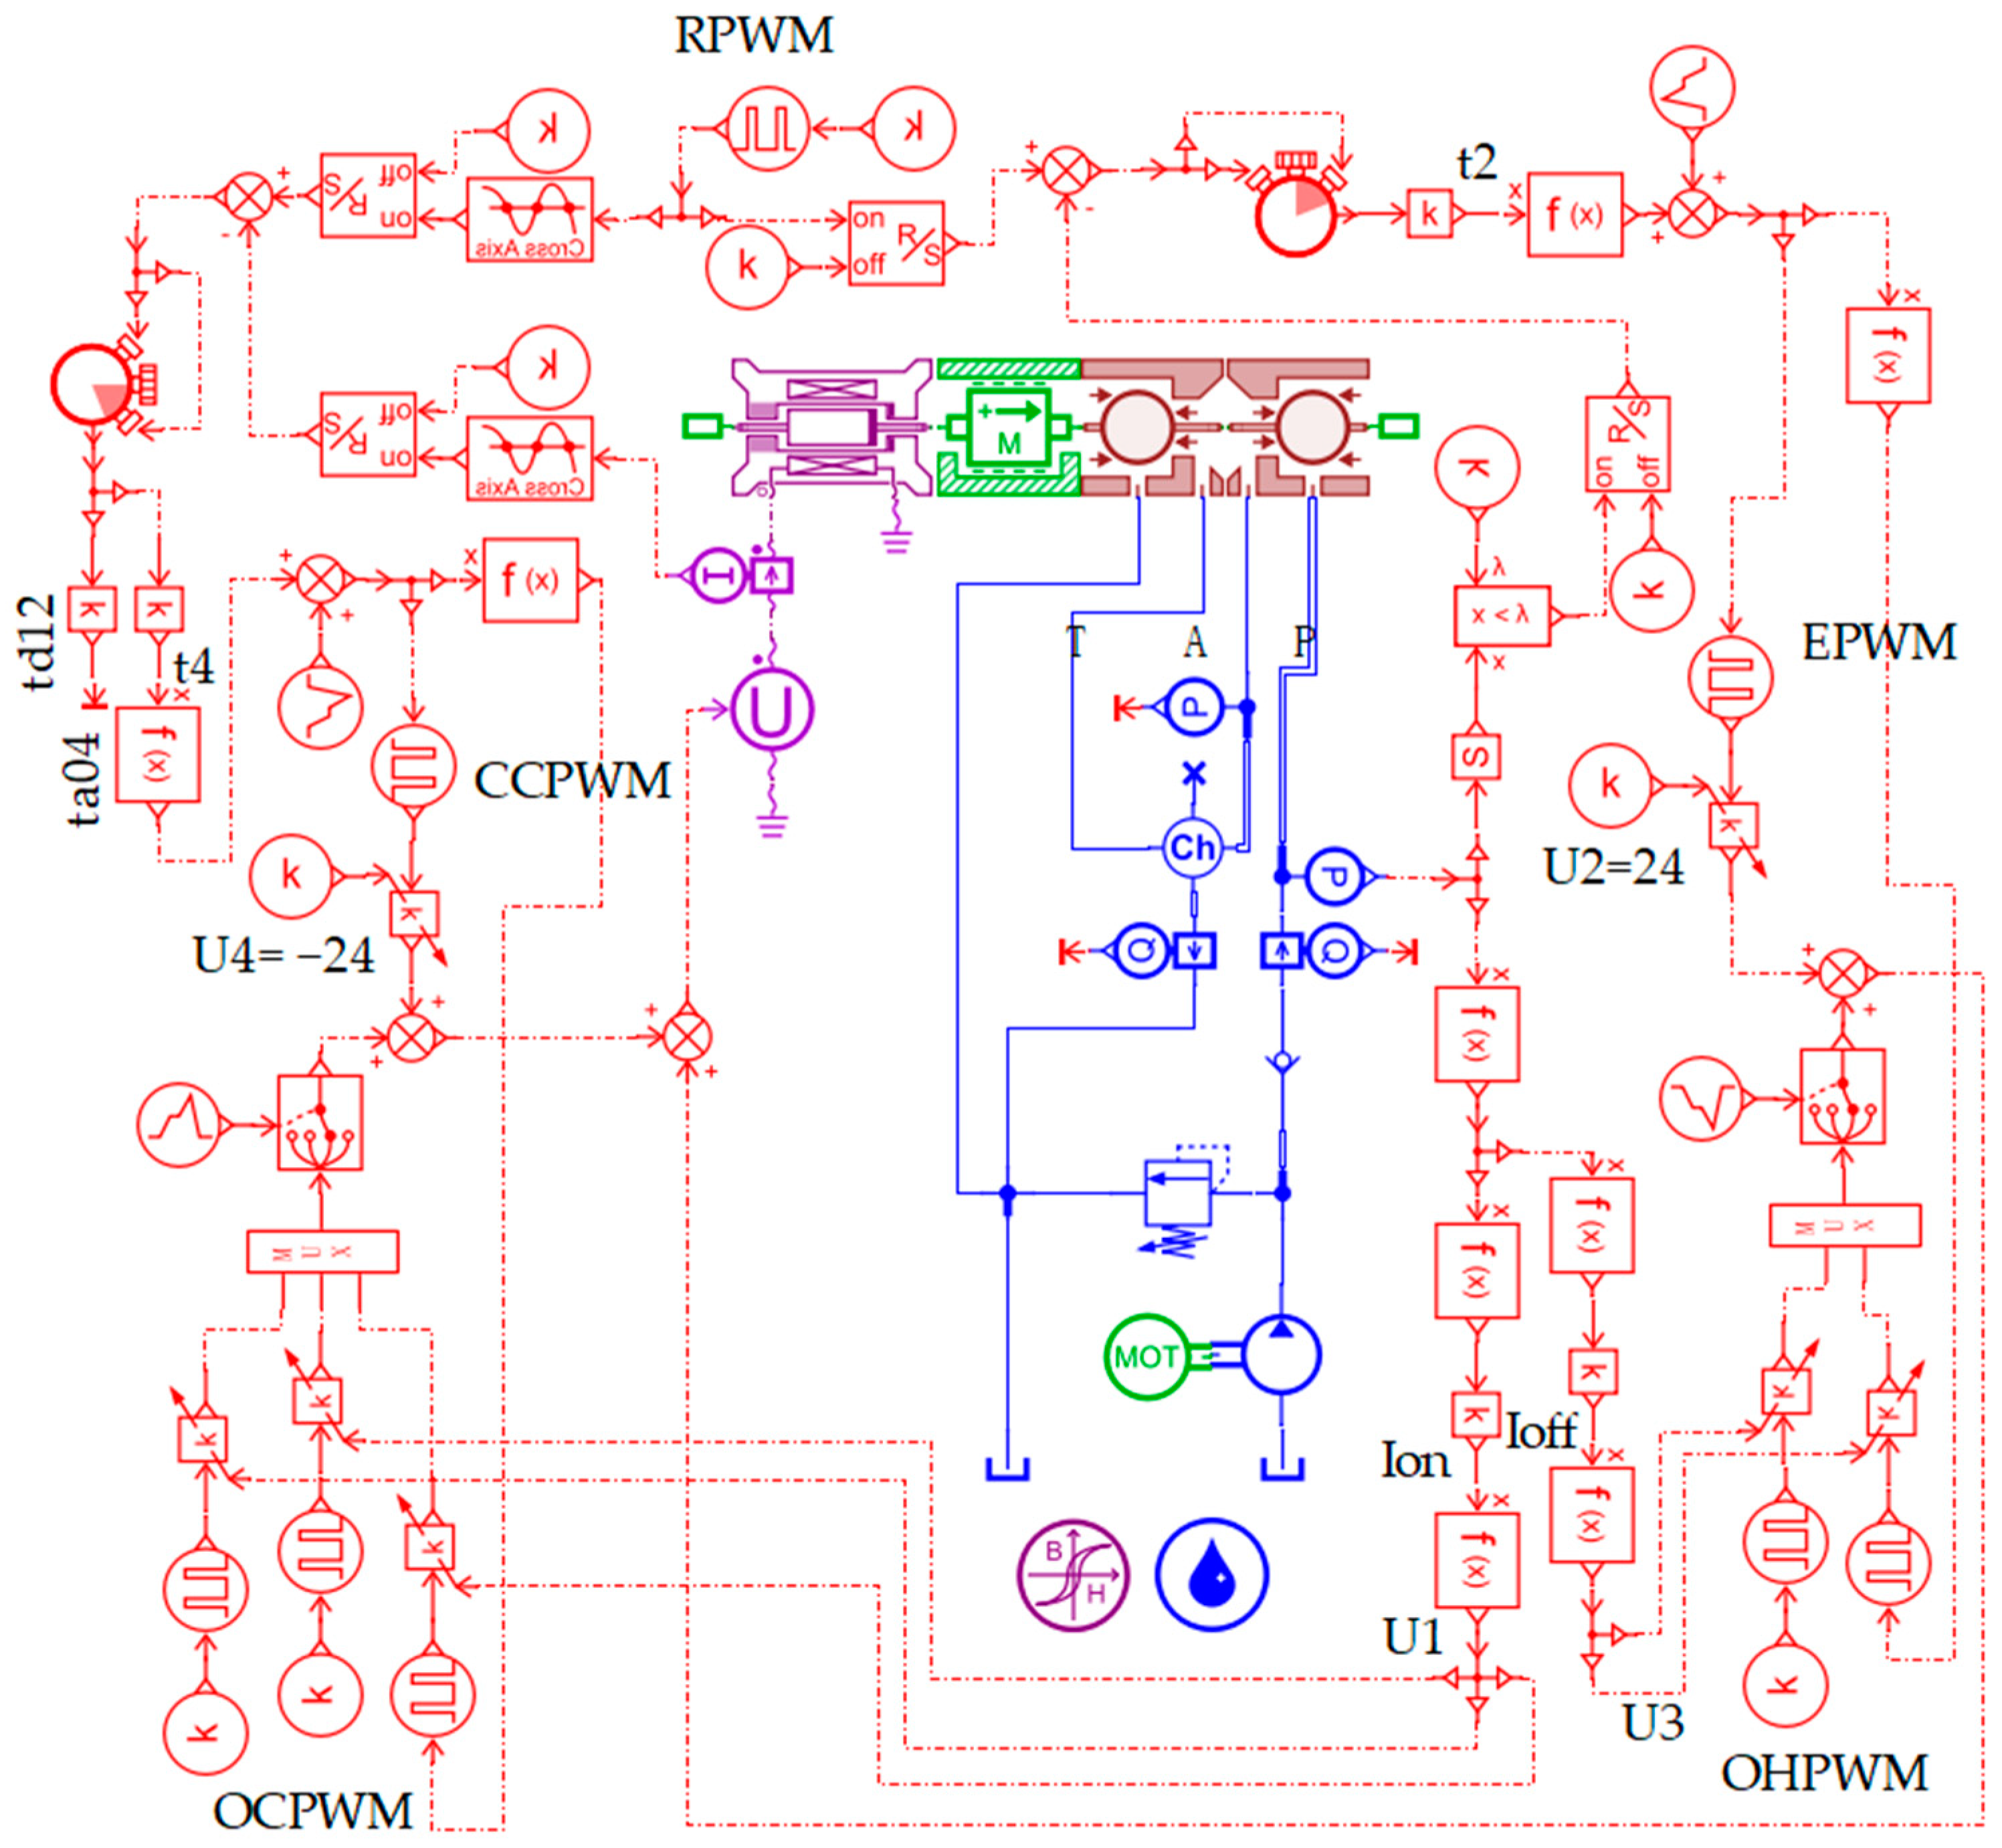
To verify and analyze the dynamic response characteristics of the HSV under the TDCC and SPWM control strategies, a simulation model of an HSV TDCC strategy based on PWM was built in AMEsim 2020.1 software, as shown in Figure 14. This used signal control based on the HSV hydraulic system simulation model shown in Figure 5. The simulation parameters related to the HSV were consistent with those in Table 2.
Figure 14.
Simulation model of TDCC.
5.2. Analysis of Simulation Results
We set the RPWM frequency to 10 Hz, the duty cycle to 0.5, the amplitude to 24, the relief valve pressure to 6 MPa, and the simulation time to 0.5 s.
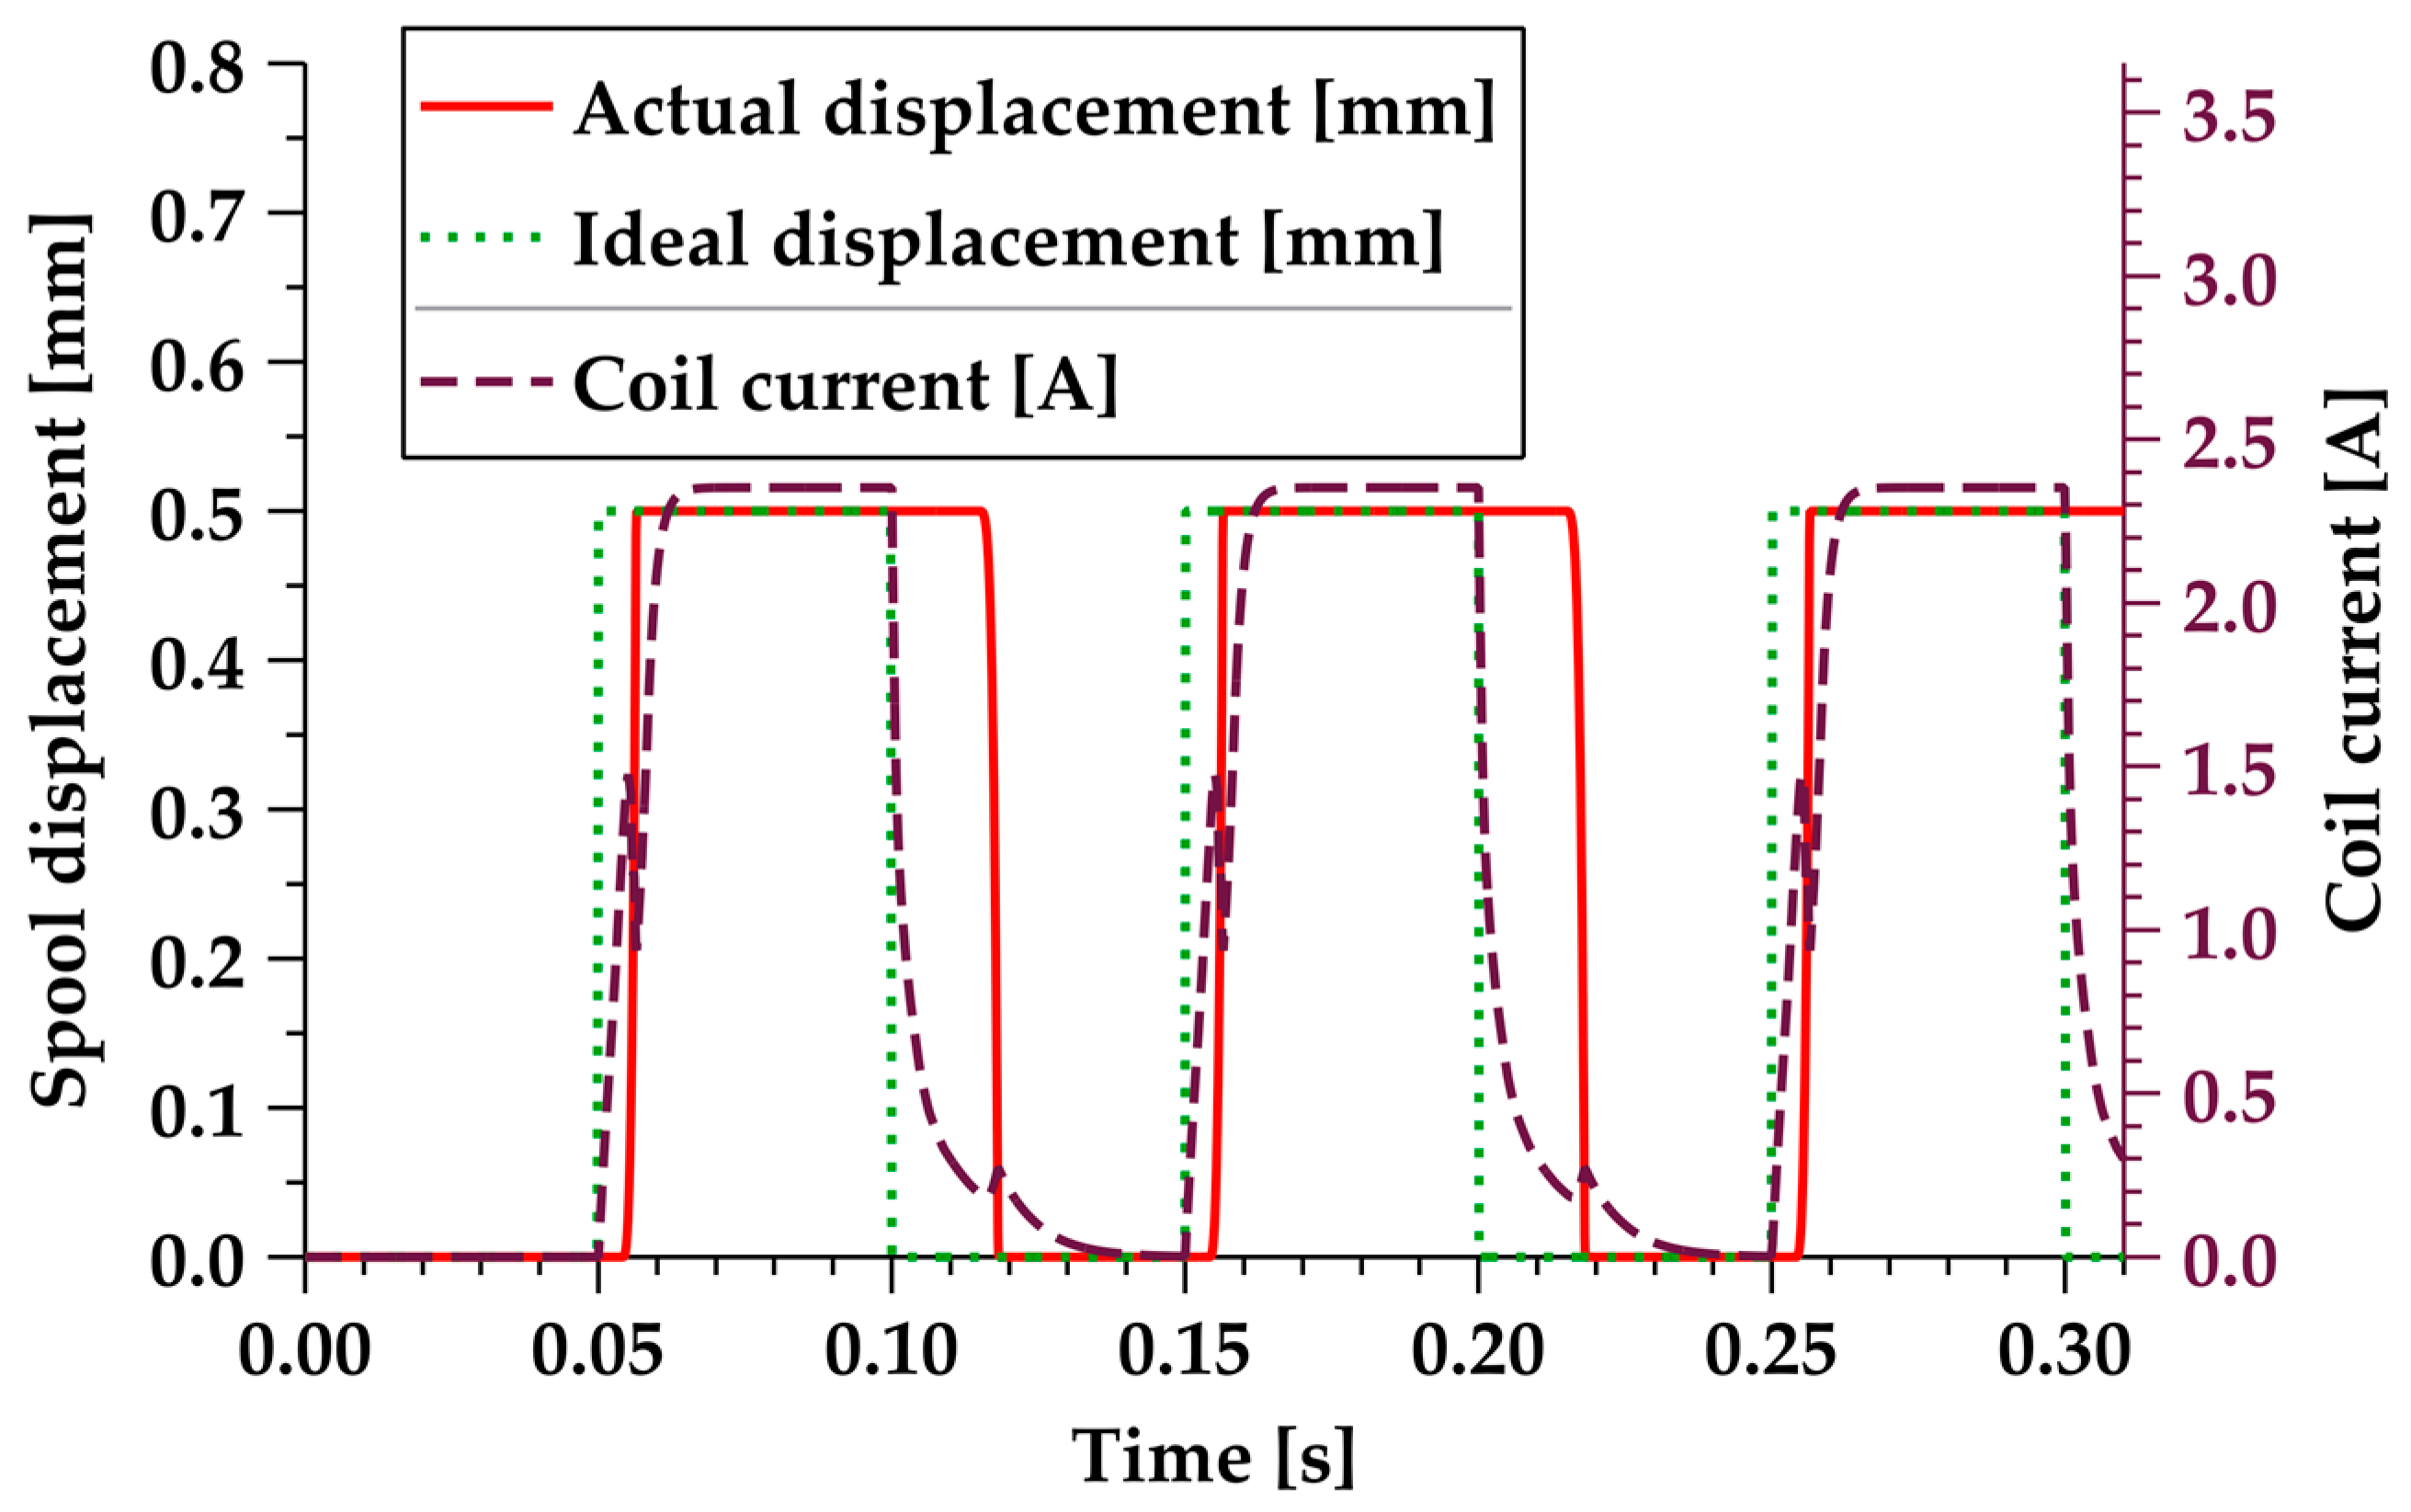
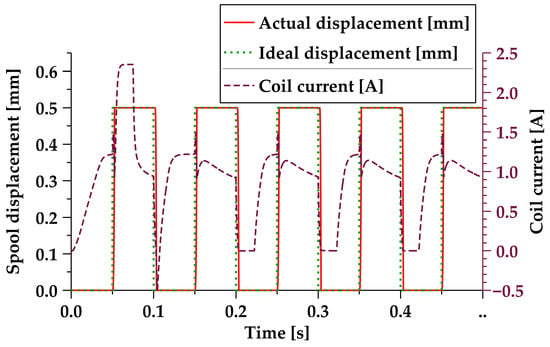
In Figure 15, the dynamic response performance curve of the valve core for TDCC, and the dynamic curve of the coil current, are shown. The red solid line in the figure represents the actual displacement curve of the valve core, the green solid dotted line represents the ideal displacement curve of the valve core, and the purple dashed line represents the coil current curve of the HSV. The results show that, with the exception of the first cycle when the initial duty cycle was set, the displacement of the valve core fitted the ideal displacement well in subsequent cycles. Before the valve core was opened, the coil current first rose by one step, and then quickly rose to open the valve core. After the valve core was opened, the current decreased, and then dropped to 0.
Figure 15.
Dynamic characteristics of the valve core for TDCC.
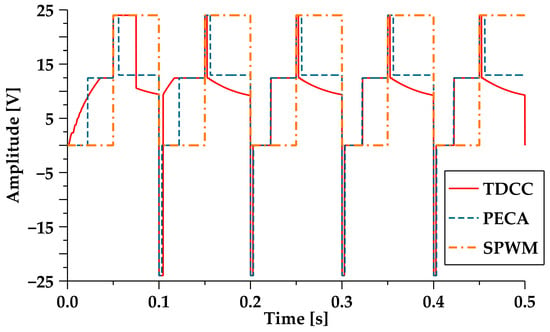
A comparison was made for PECA, and the driving signals of the three control methods are shown in Figure 16. The red solid line in the figure represents the TDCC (The first cycle in the figure is the set initial value, and the subsequent cycles are the OCPWM, EPWM, OHPWM, and CCPWM, with the variable amplitude and variable duty cycle determined in real time, based on the RPWM, the coil current, and the pressure feedback in front of the valve), the blue dashed line represents the PECA, and the orange chain line represents the SPWM. It can be seen that TDCC obtained relevant parameters for subsequent cycles in the first and second cycles, and entered the formal cycle starting from the third cycle.
Figure 16.
Drive signal comparison.
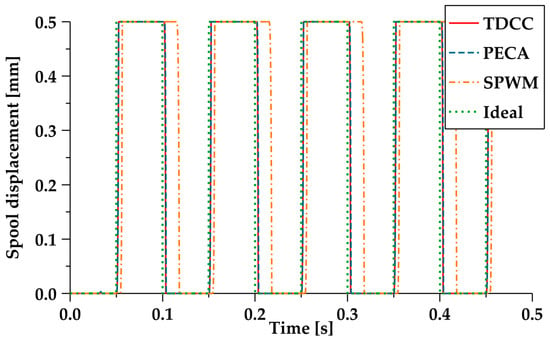
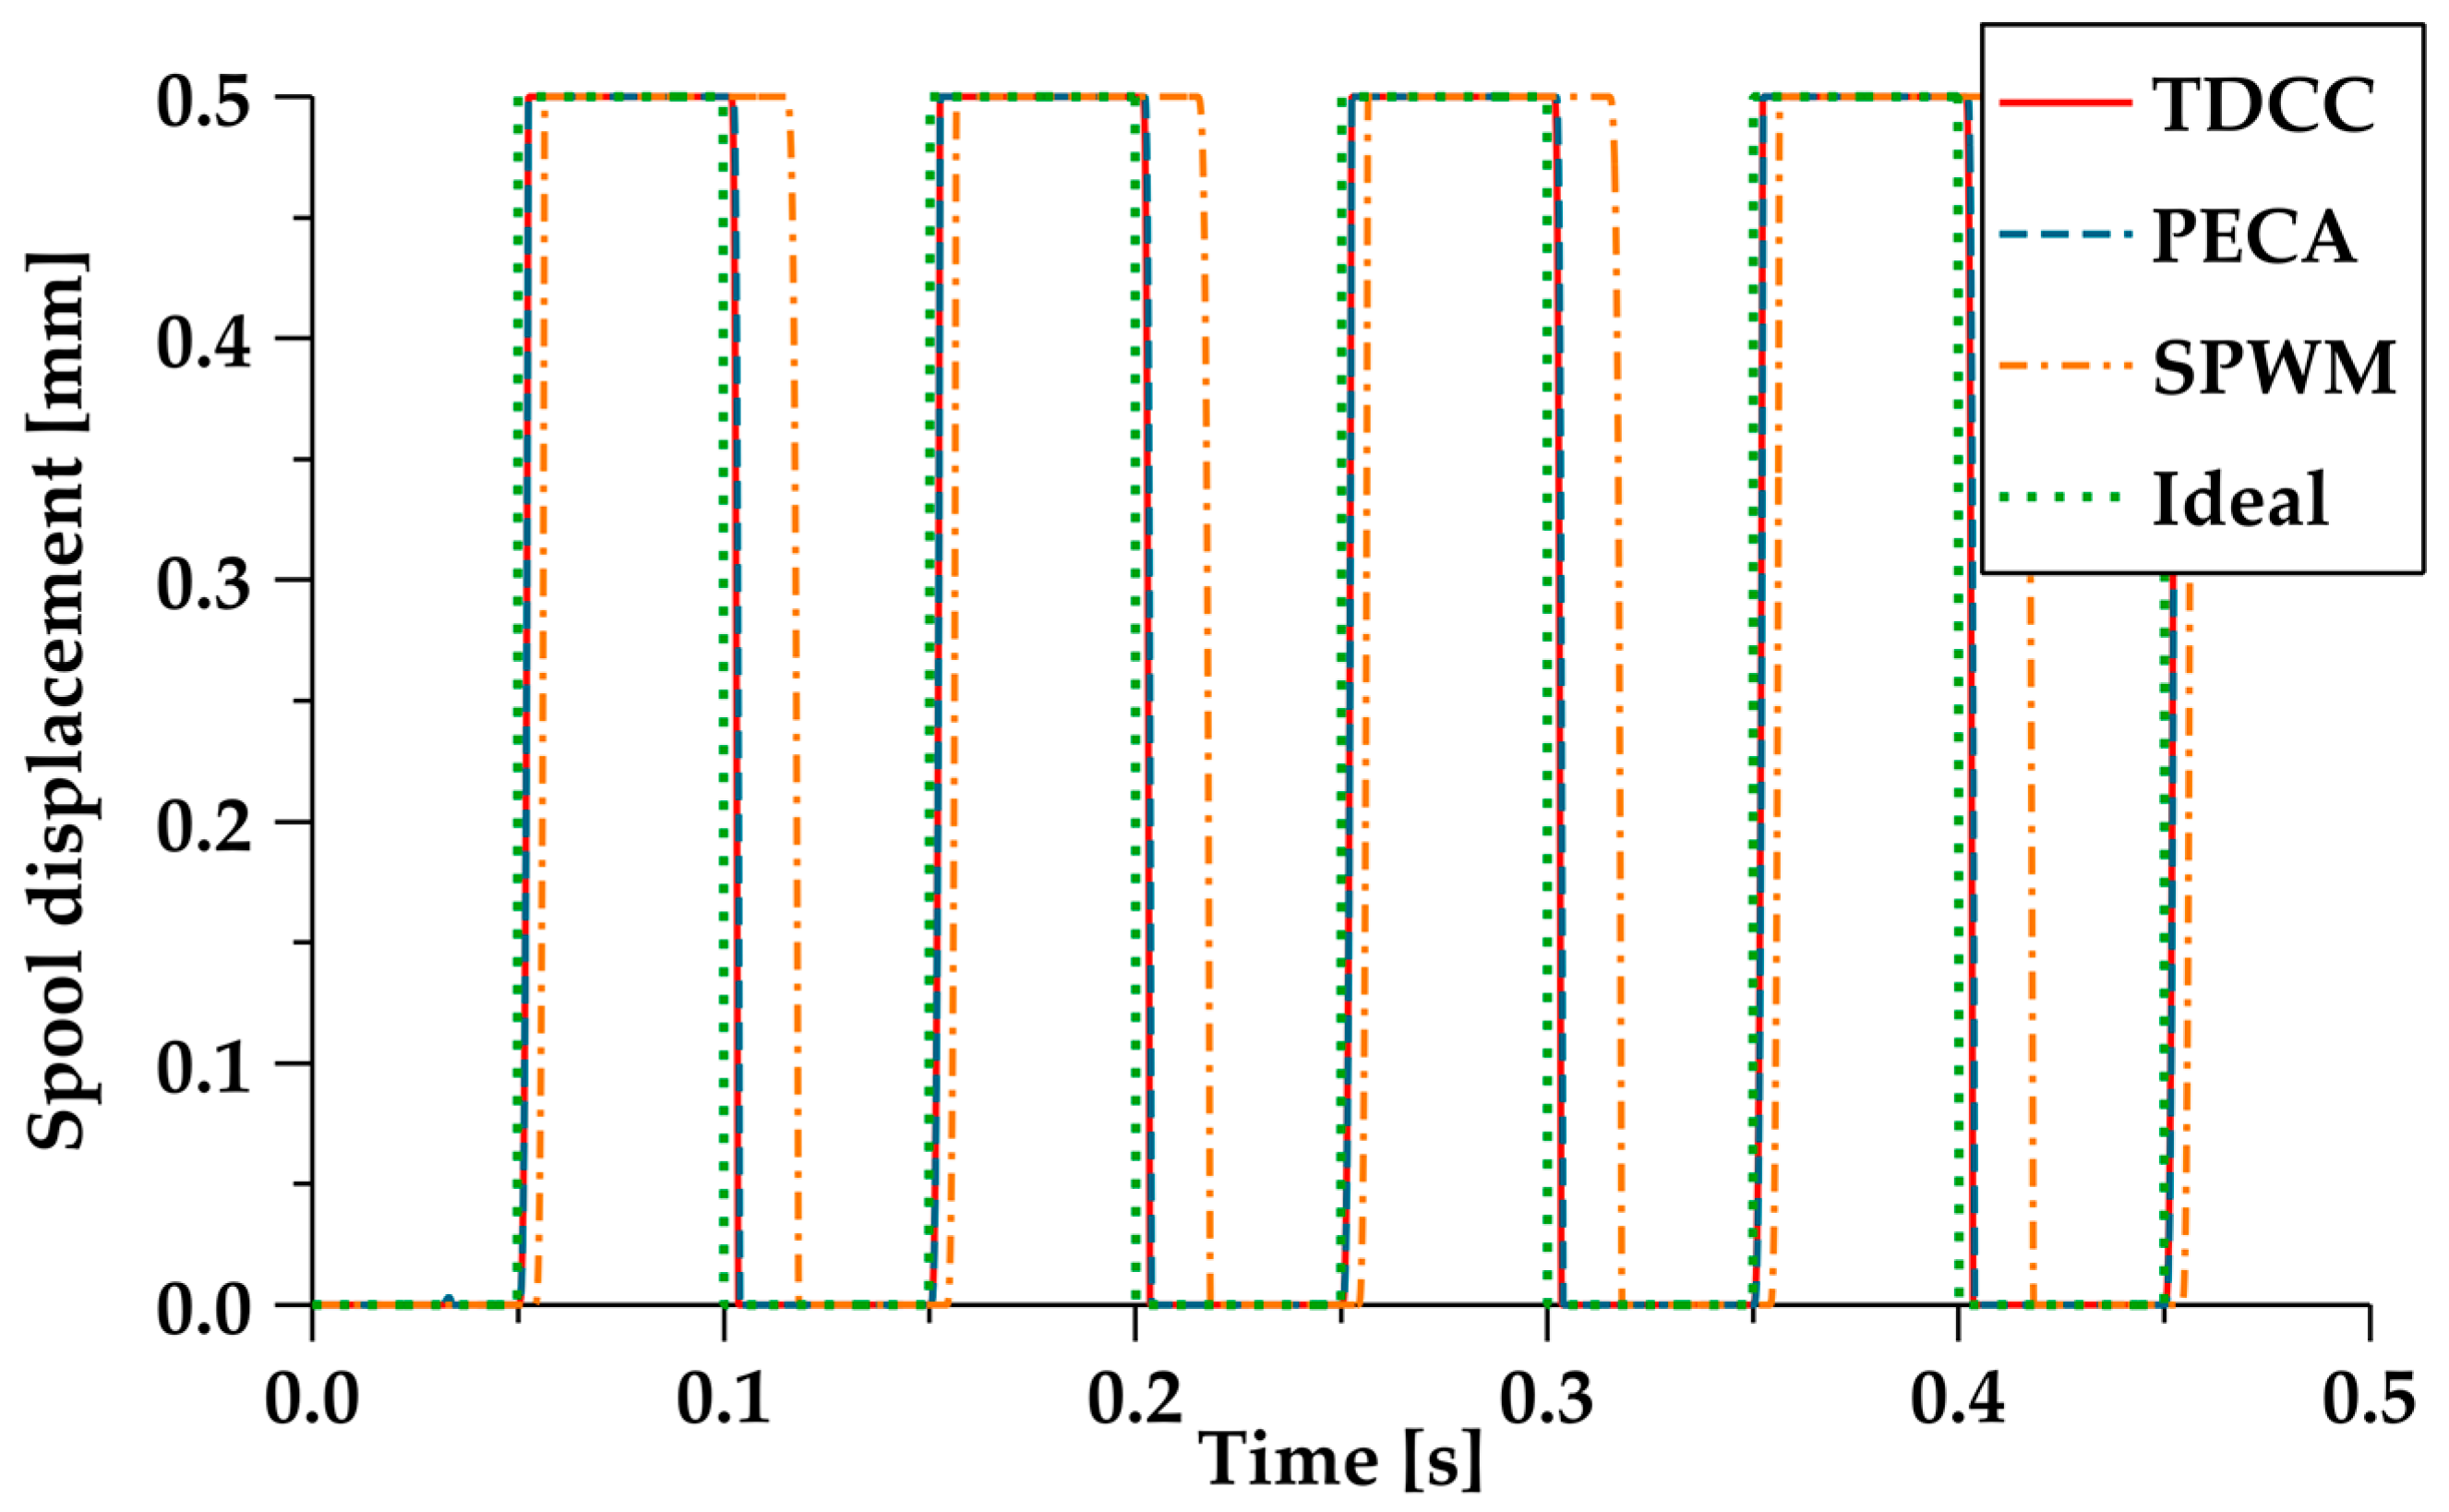
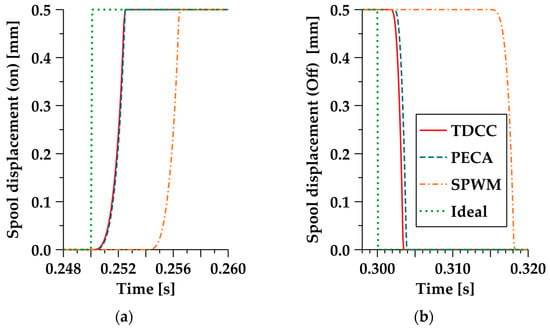
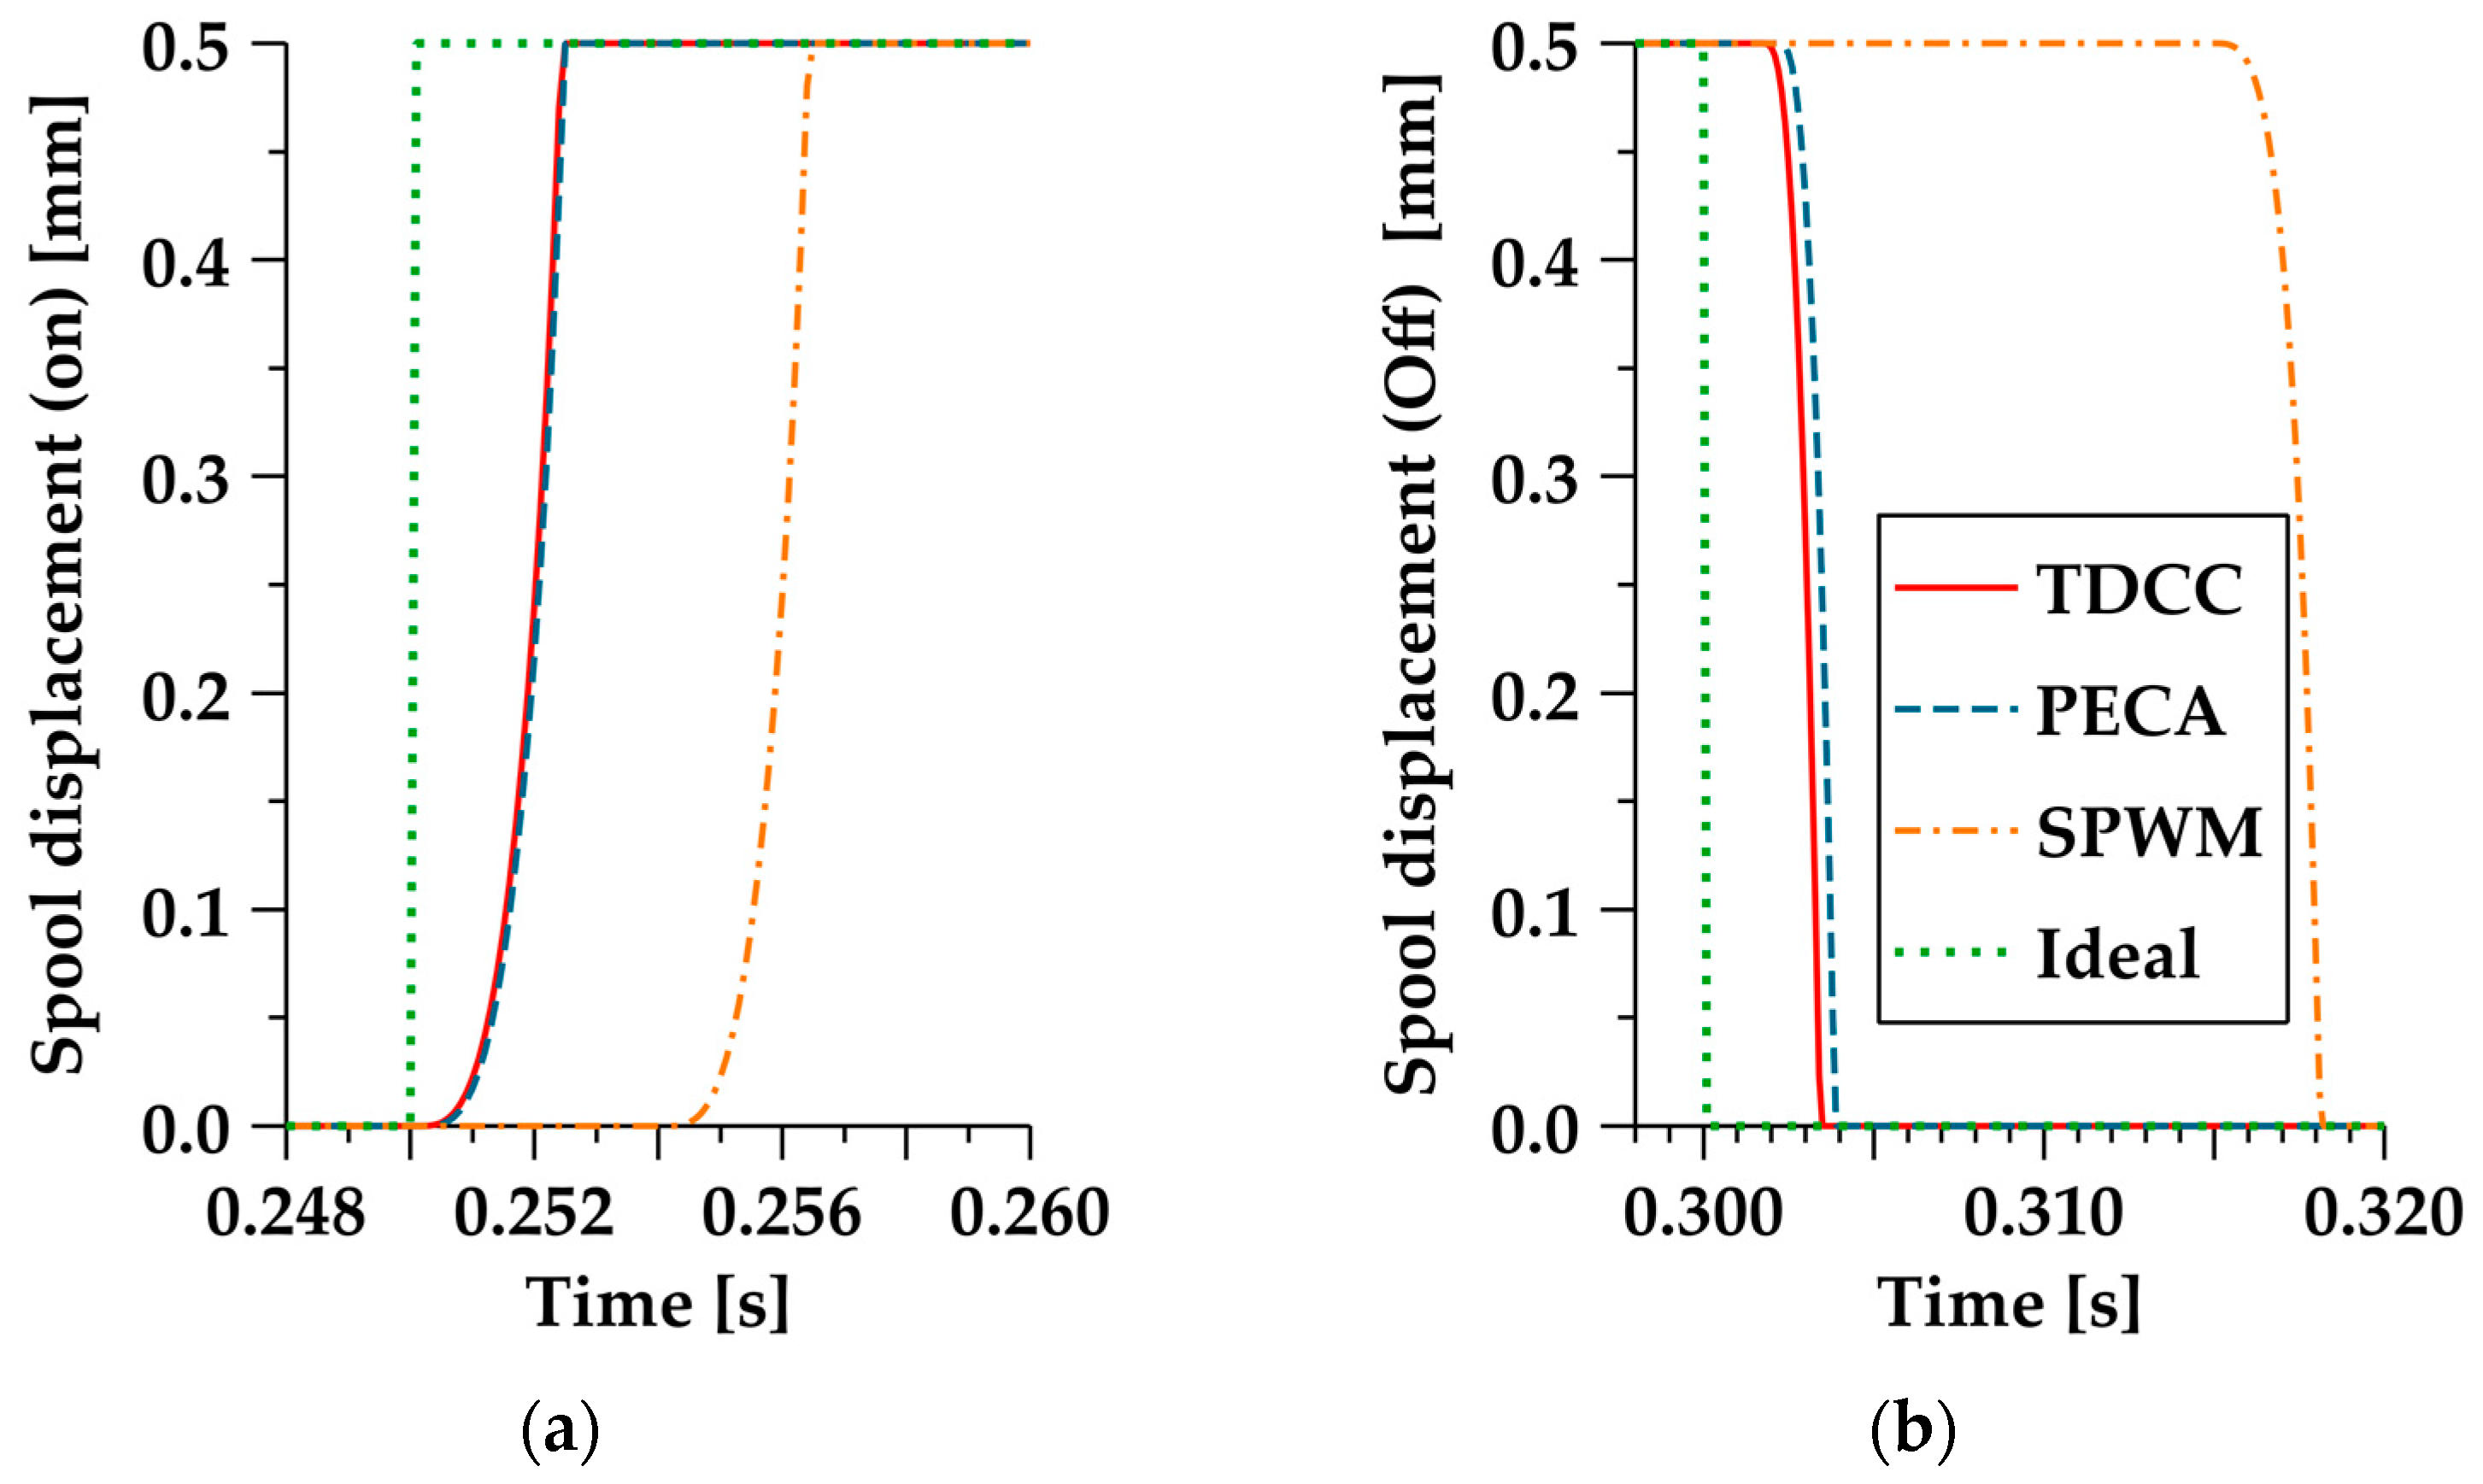
Next, for the dynamic response of the valve core, the TDCC was compared with the PECA and SPWM, and the simulation time was 0.5 s. The displacement curve of the valve core obtained is shown in Figure 17. We selected the third cycle as the basis for comparative analysis, and the subsequent cycles were the same as the third cycle. As is shown in Figure 18, the red solid line represents the TDCC, the blue dashed line represents the PECA, the orange chain line represents the SPWM, and the green solid dotted line represents the ideal displacement curve of the valve core. Figure 18a shows the opening stage of the valve core, and Figure 18b shows the closing stage of the valve core. The comparison results are shown in Table 3.
Figure 17.
Valve core displacement response.
Figure 18.
Comparison of the valve core displacement response. (a) Comparison of the valve core displacement response in the opening stage; (b) comparison of the valve core displacement response in the closing stage.
Table 3.
Comparison of the time delay.
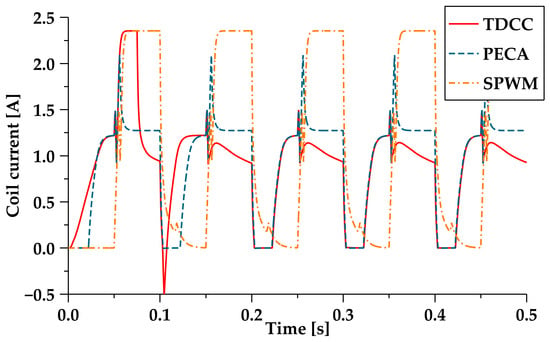
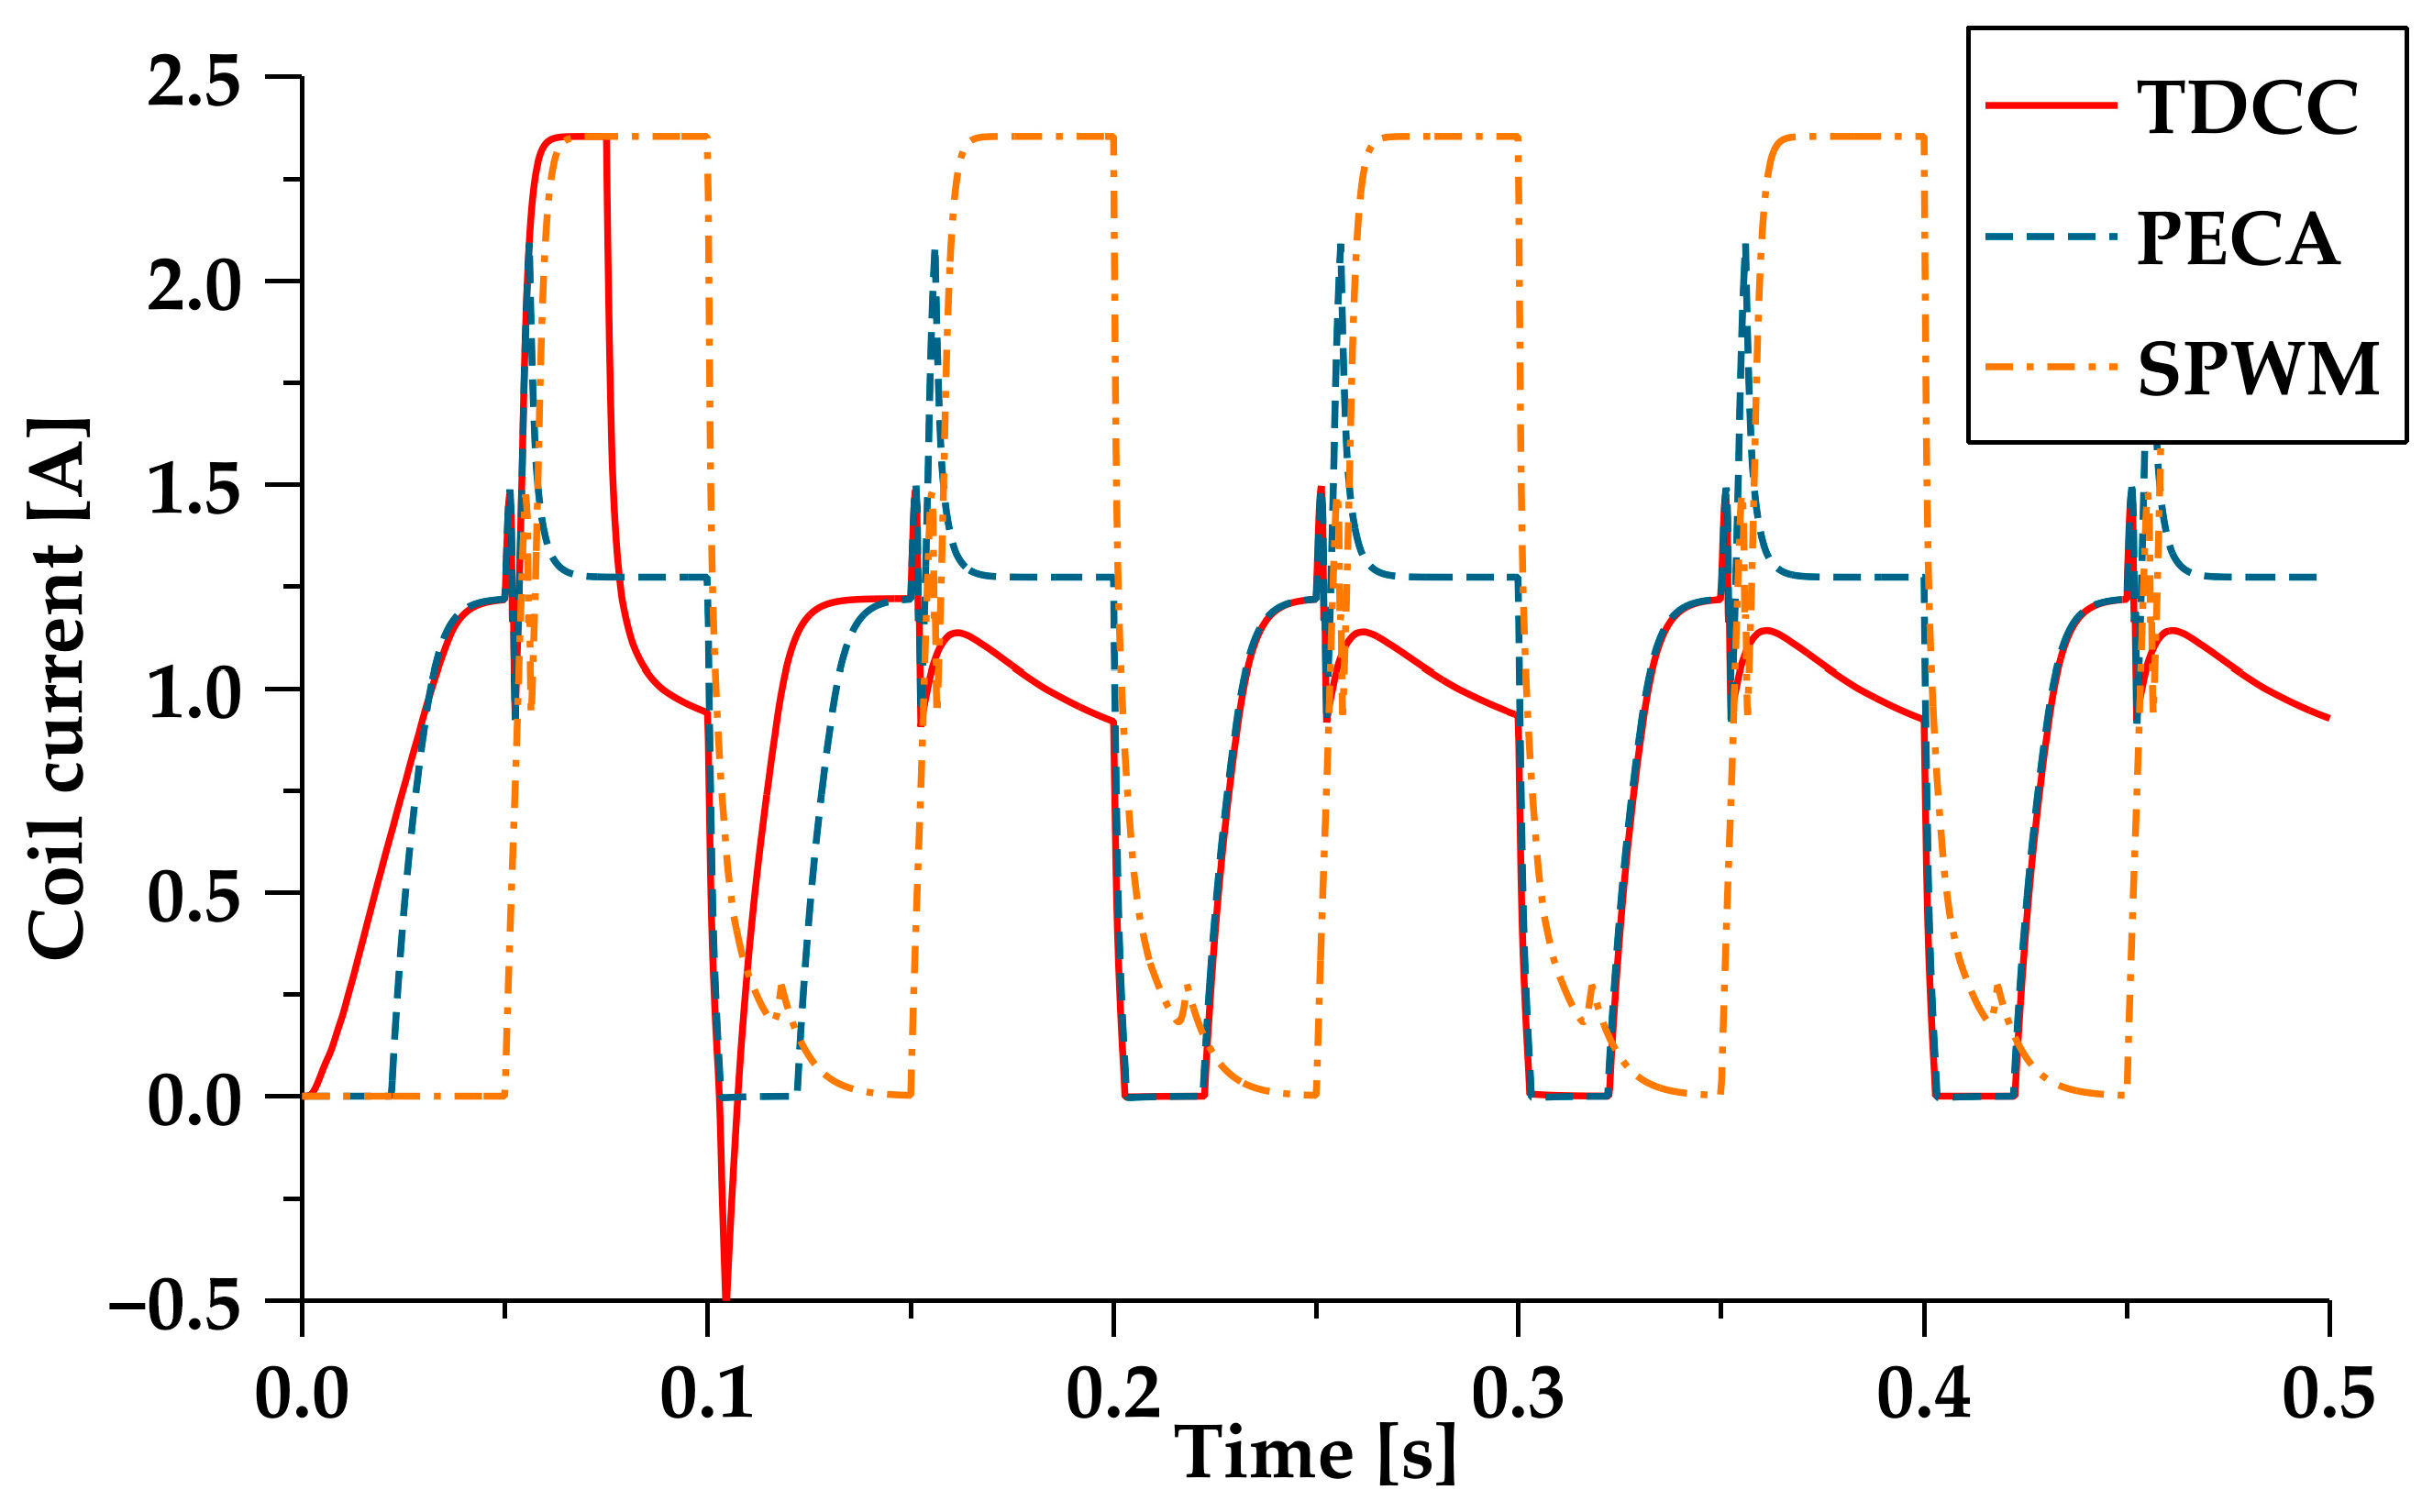
Figure 19 shows the current dynamic curve of the electromagnetic coil under the TDCC, PECA, and SPWM control. The red solid line in the figure represents the coil current under TDCC control, the blue dashed line represents the coil current under PECA control, and the orange chain line represents the coil current under the SPWM control. The results show that, during the opening and holding stage, TDCC was significantly lower than the SPWM. Due to the gradual decrease in the pressure in front of the valve after the valve core was opened, the current of TDCC during the opening and holding stage was also slightly smaller than that of PECA.
Figure 19.
Comparison of the coil current response.
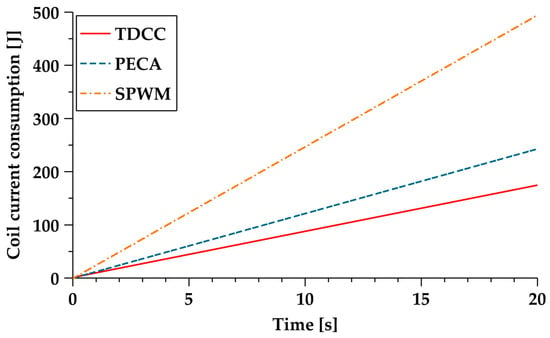
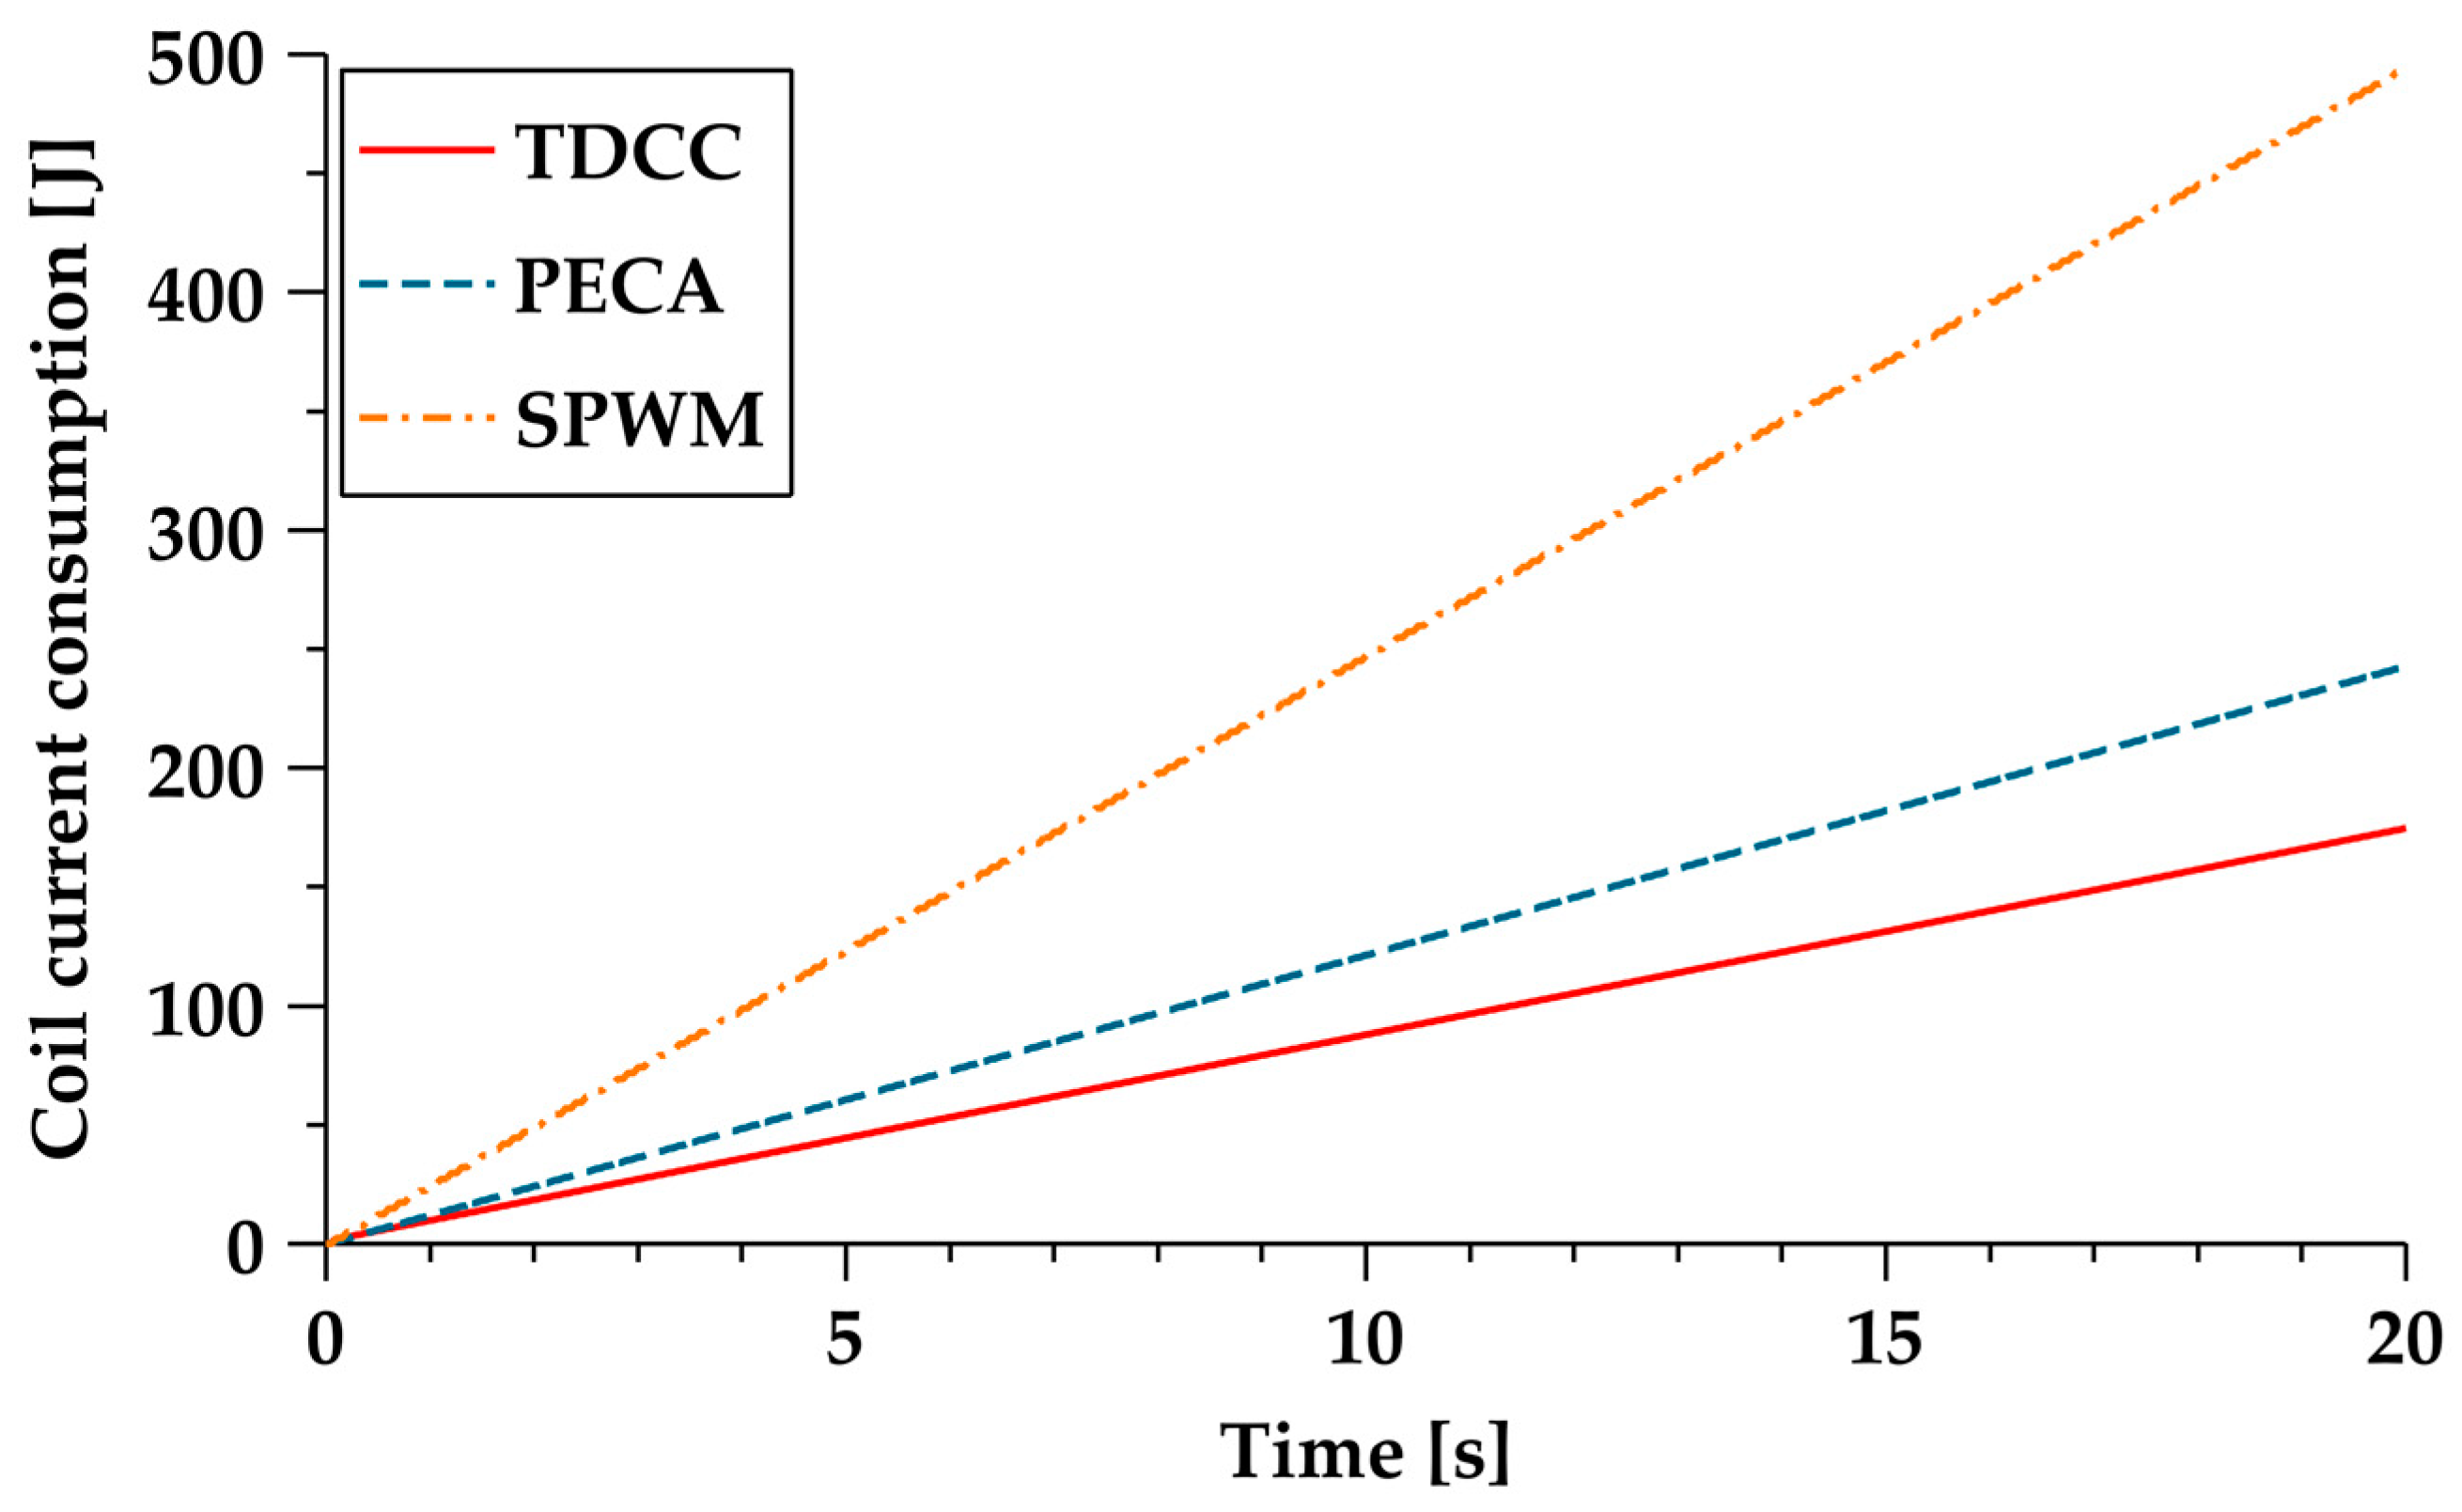
We set the simulation time to 20 s, and calculated the energy consumption corresponding to the coil current, according to Equation (18). As shown in Figure 20, the energy consumption in 20 s was 174.8 J, 242.9 J, and 494.8 J for the TDCC, PECA, and SPWM, respectively. Comparing the total energy consumed by the three methods within 20 s, we can obtain the results using the formulas (242.9–174.8)/242.9 and (494.8–174.8)/494.8: compared to PECA, TDCC reduced the energy consumption by 28%, and compared to the SPWM, TDCC reduced the energy consumption by 64.7%, indicating that TDCC achieved a low energy consumption.
Figure 20.
The coil current consumption.
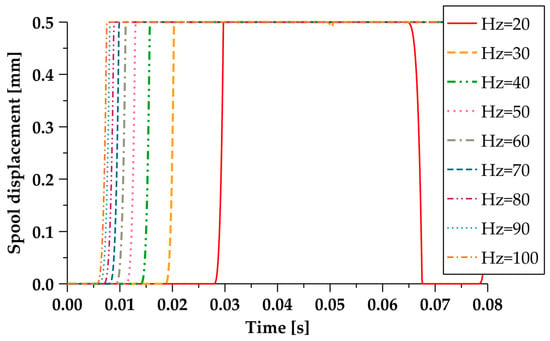
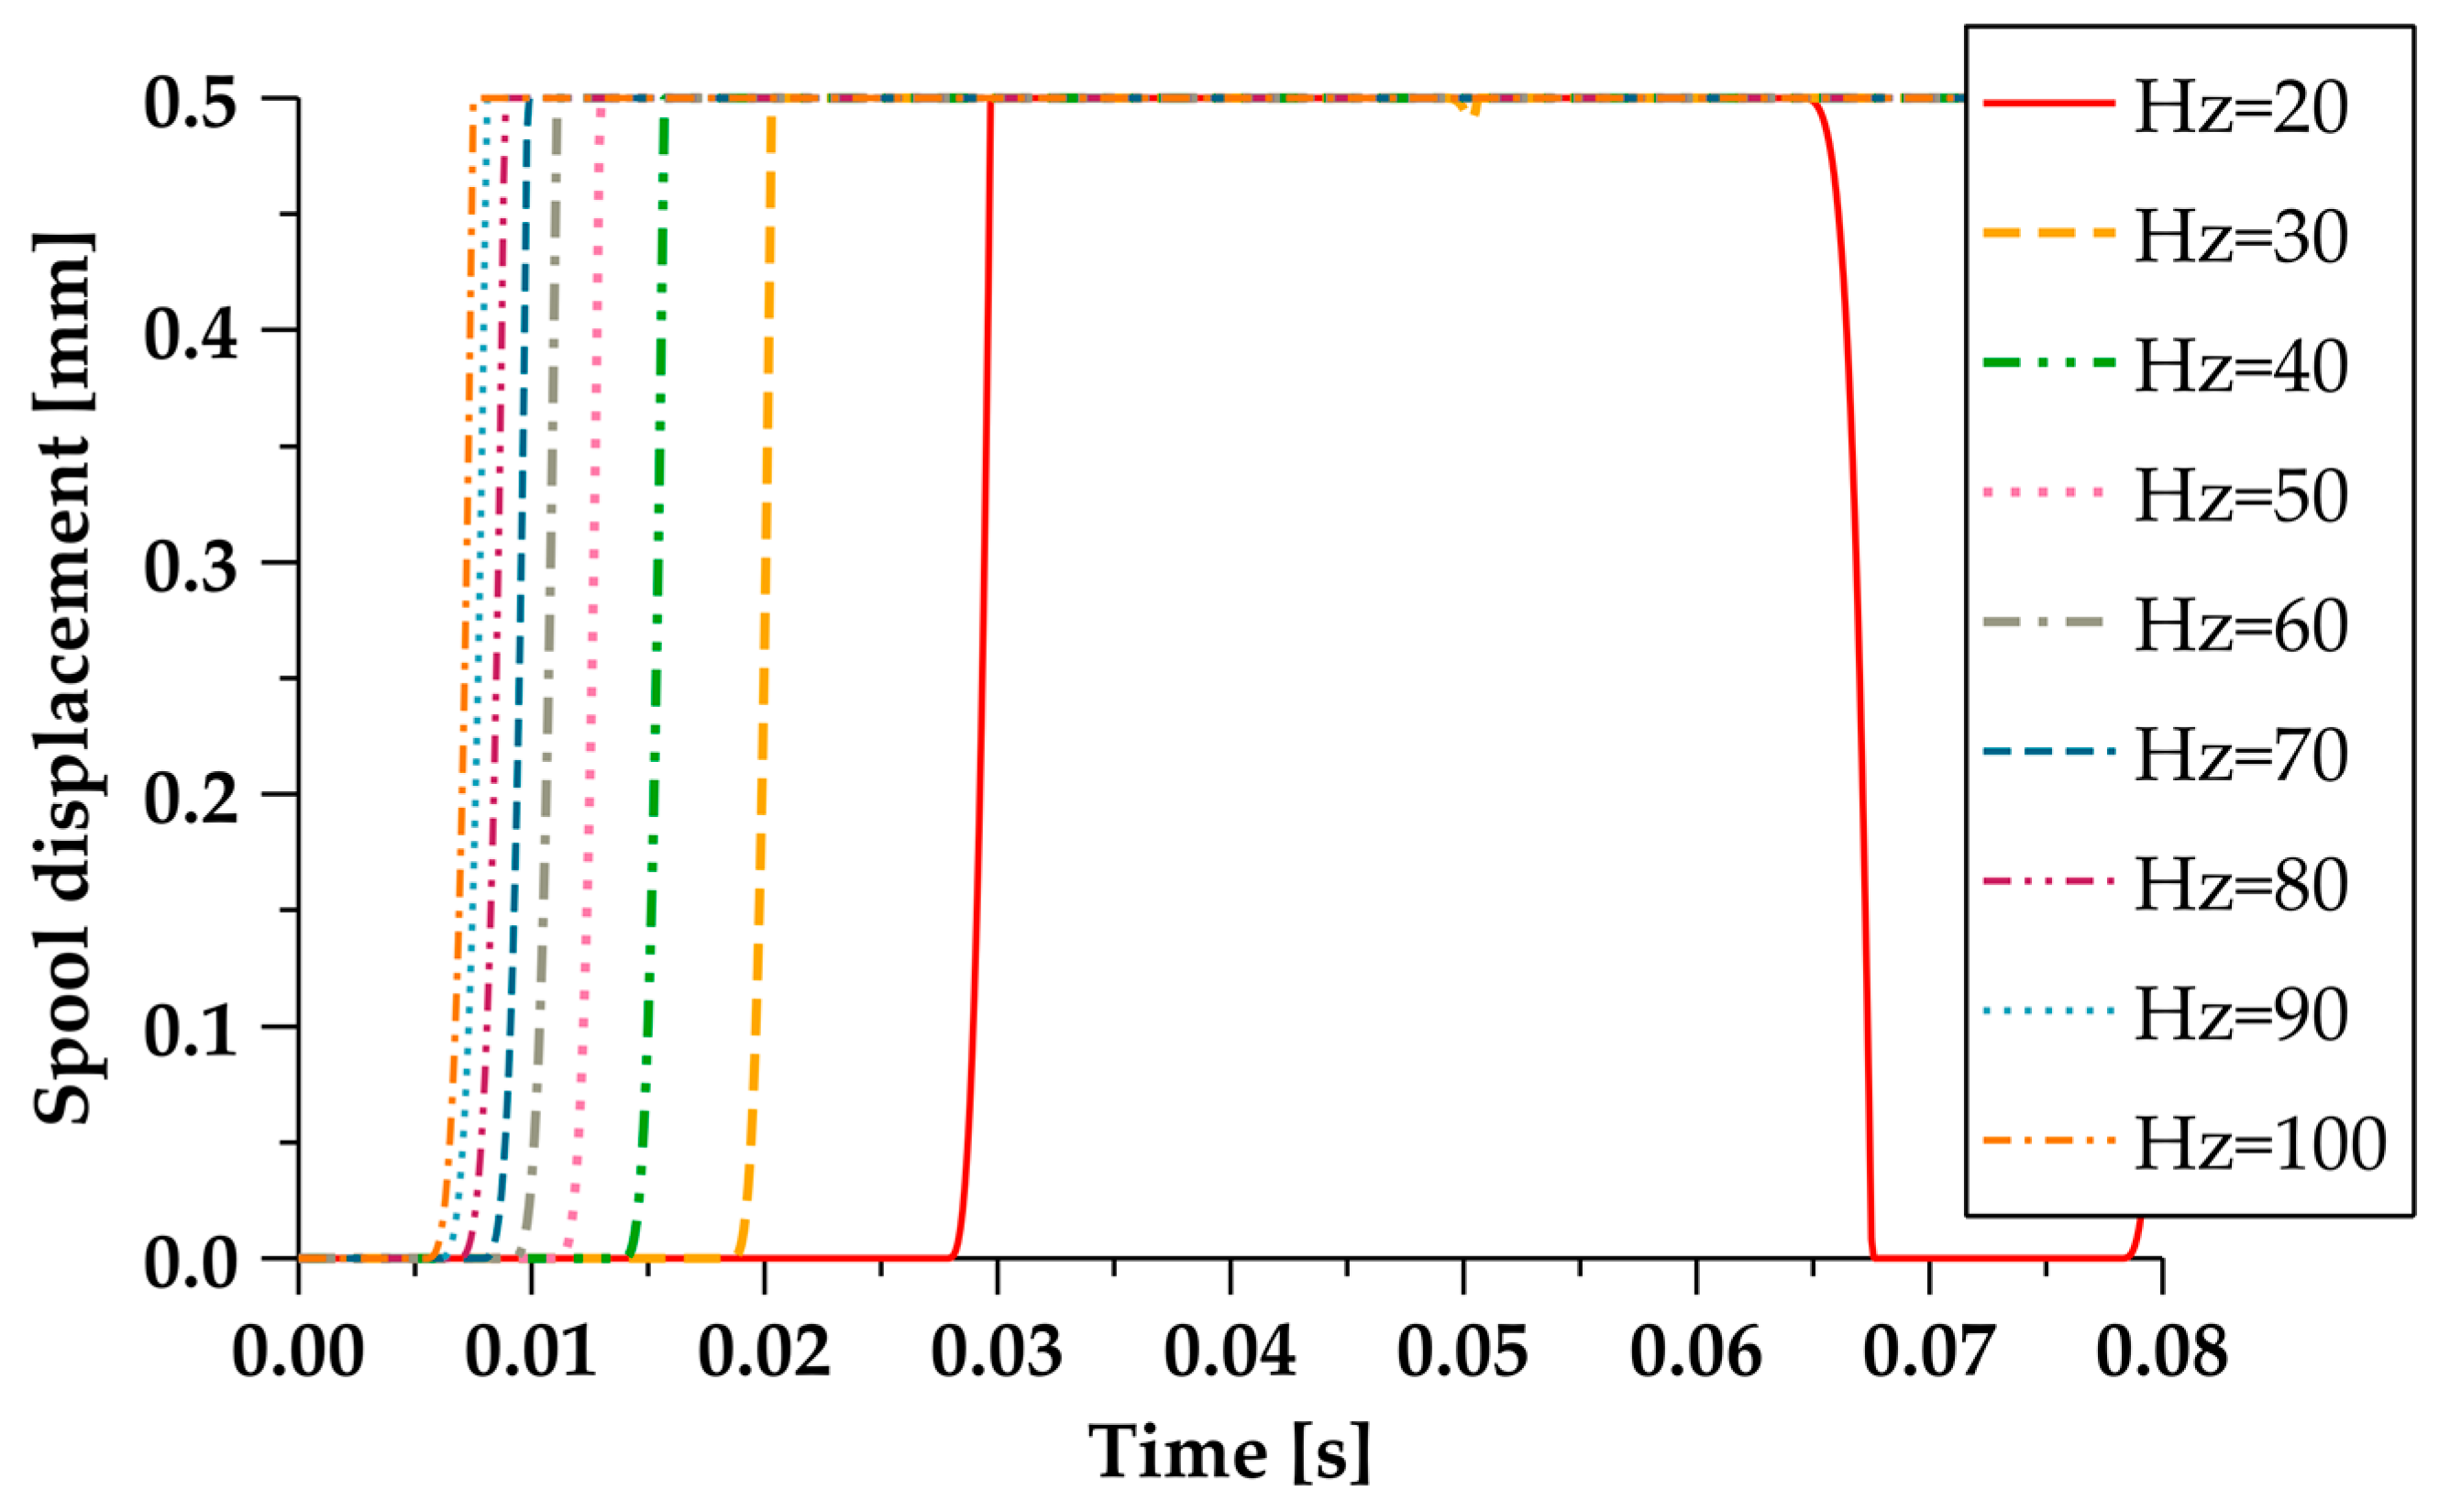
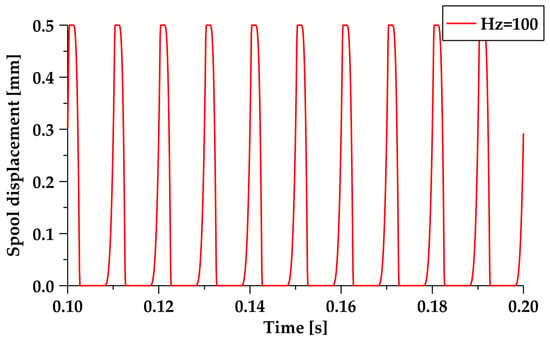
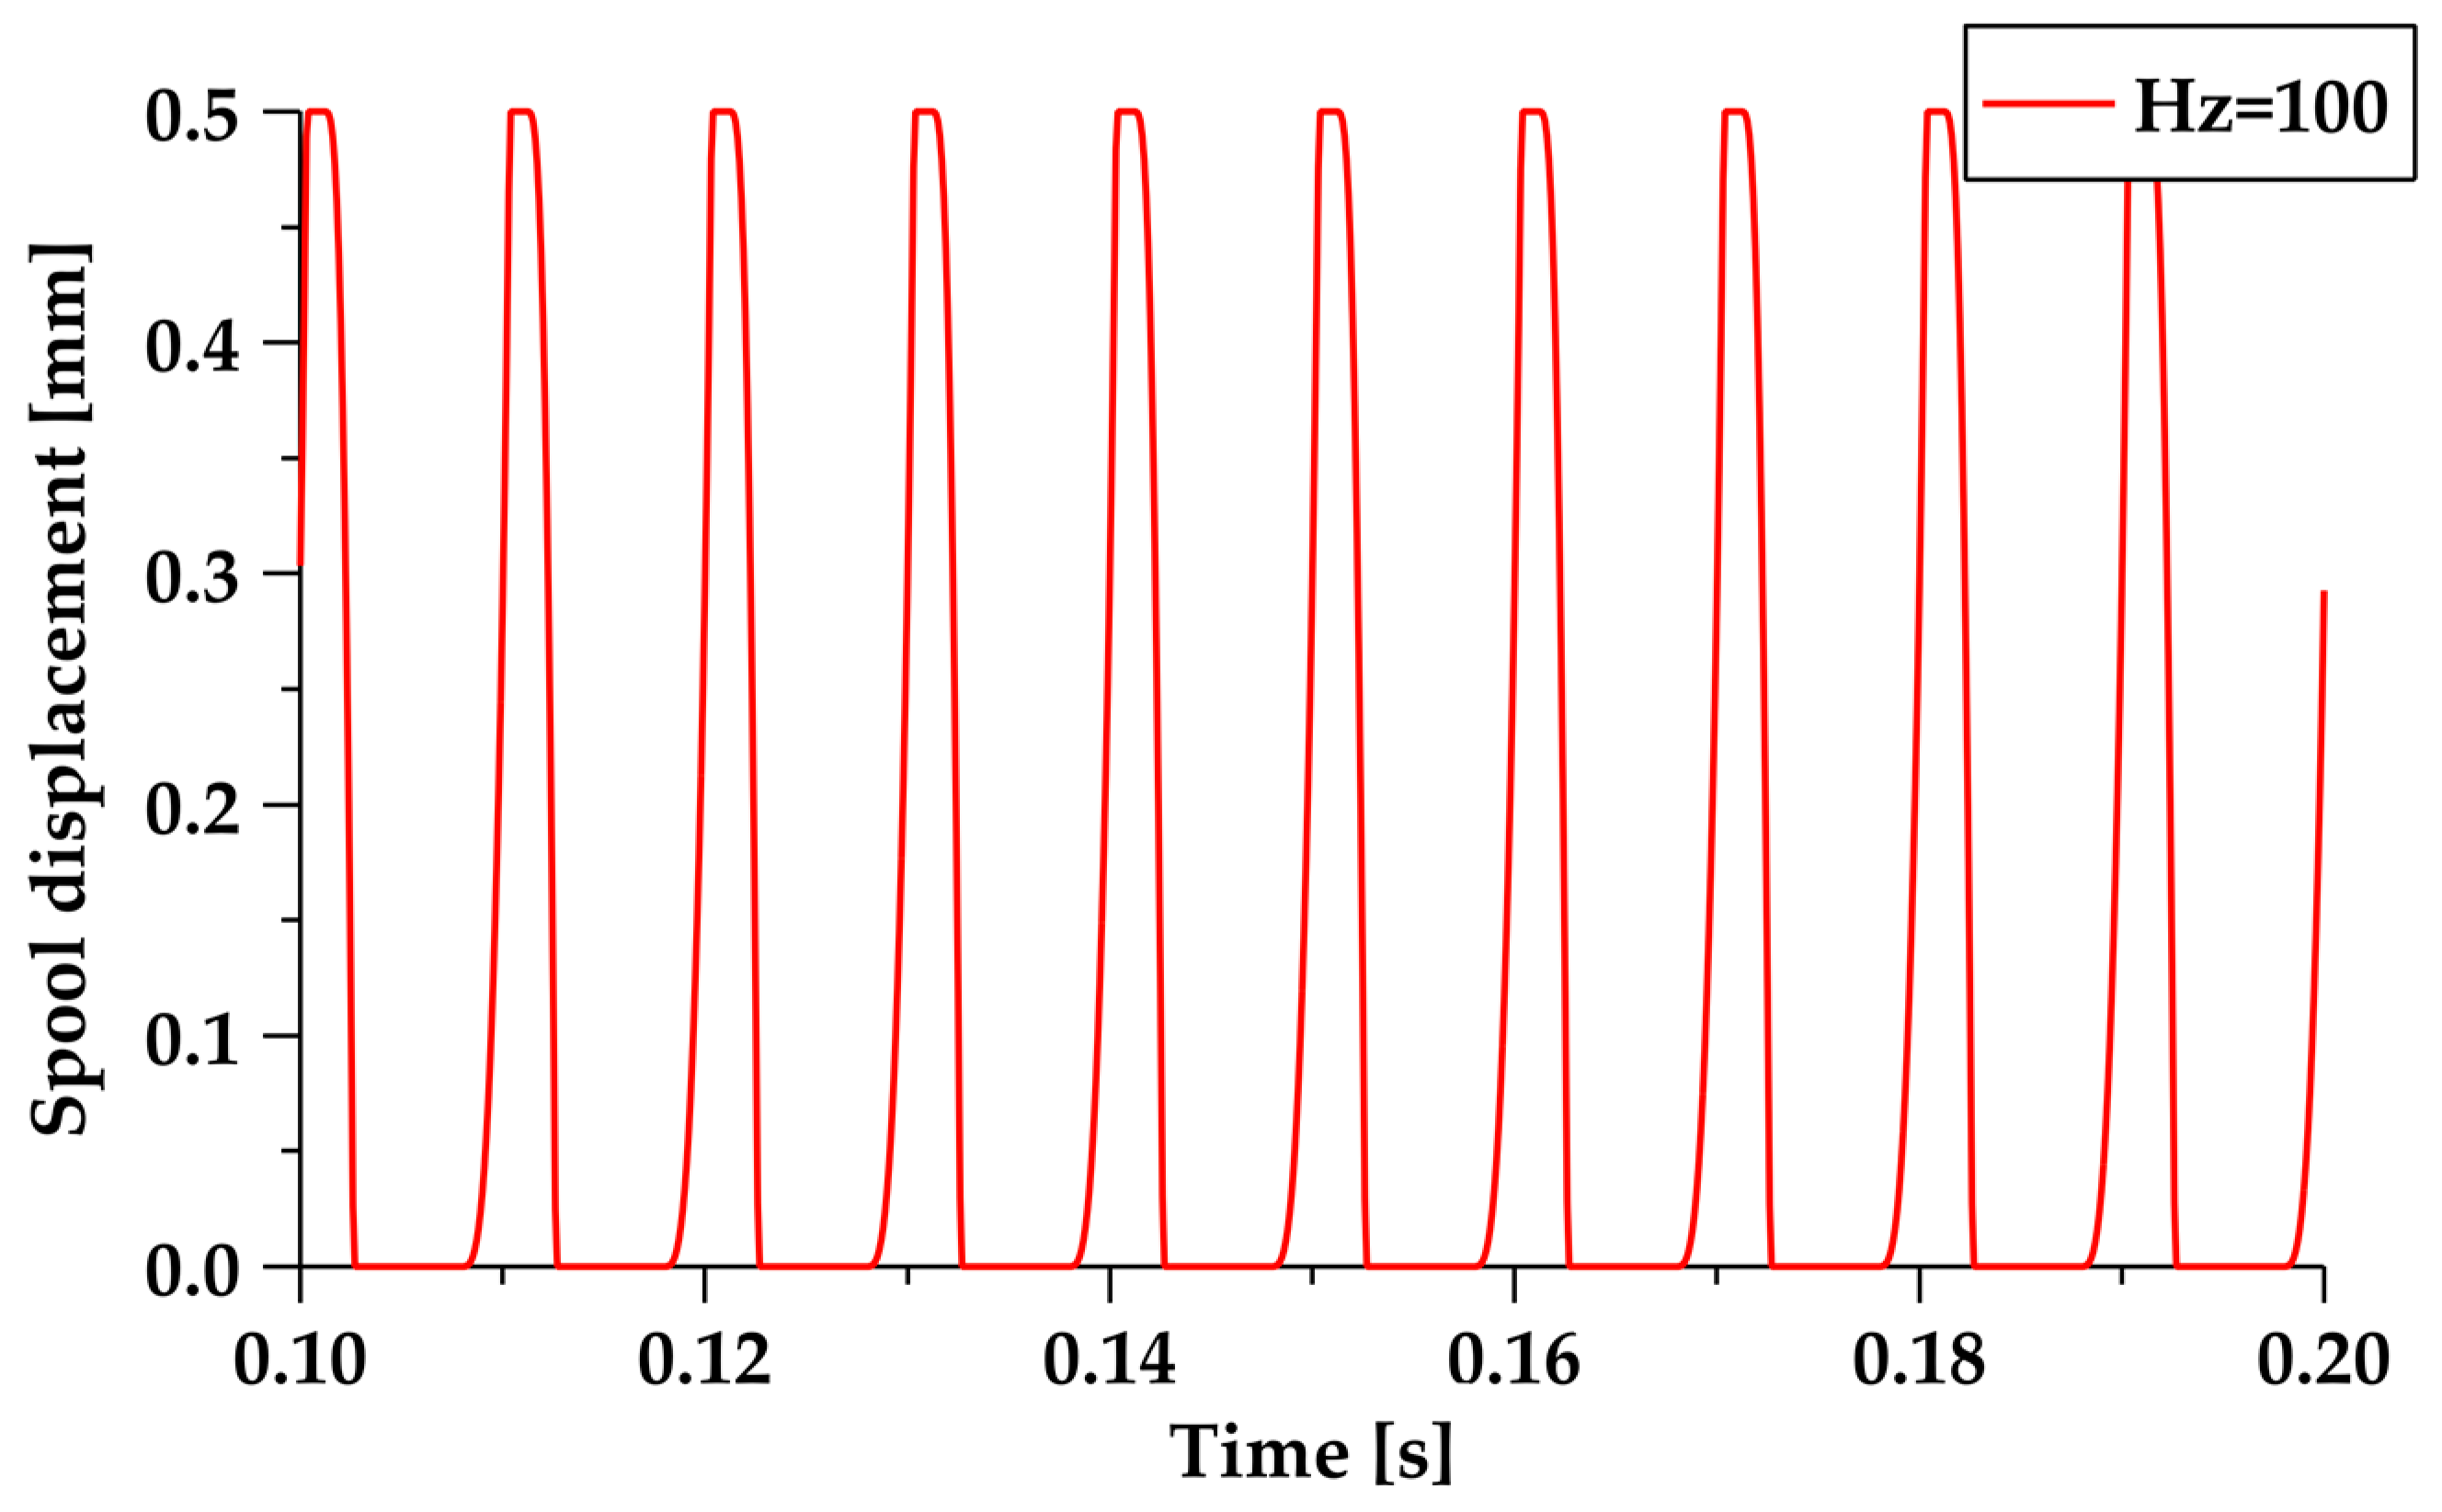
In addition to keeping the duty cycle of 0.5 constant, we changed the frequency response range of the PWM signal, to test the displacement of the valve core. The displacement response curves of the valve core at different frequencies under the SPWM control are displayed in Figure 21. The results show that the valve core could close normally after the frequency exceeded 30 Hz under the SPWM control. As can be seen in Figure 22, the displacement response curves of the valve core at different frequencies under the TDCC control show that the valve core response was not ideal, but could close normally at a frequency of 100 Hz. Compared with the SPWM control, the frequency response range of the valve core increased by 70%.
Figure 21.
The valve core displacement response under the SPWM control.
Figure 22.
The valve core displacement response under TDCC.
6. Conclusions and Discussion
In this article, a time-delay compensation control strategy based on PWM was proposed, which considered the hysteresis characteristics of HSV switching, and the pressure changes in front of the valve after the valve core is opened. The amplitude and duty cycle of the OCPWM and OHPWM were determined through the real-time feedback of the current and the pressure in front of the valve. By compensating with a PWM signal before the valve spool opens, the lag time of the valve spool opening is reduced. During the holding phase, the variation in the pre-valve pressure is considered, effectively reducing the current value during the holding phase, and thereby reducing the energy consumption of the HSV coil. Loading the CCPWM when the valve spool closes accelerates the closing speed of the valve spool. The method proposed in this paper has achieved the following accomplishments:
- (1)
- The established TDCC method can simultaneously reduce the time delay in the HSV opening and closing. Compared with the SPWM control, the opening time delay was reduced by 65.7%, the closing time delay was reduced by 82.6%, and the overall time delay for opening and closing was reduced by 78.1%. Compared with the PECA, the opening time delay was reduced by 4%, the closing time delay was reduced by 15.4%, and the overall time delay for opening and closing was reduced by 10.9%.
- (2)
- The TDCC reduced the excess energy consumption generated by the current. Compared to the PECA, the TDCC reduced the energy consumption by 28%, and compared to the SPWM, the TDCC reduced the energy consumption by 64.7%.
- (3)
- The proposed method further expands the frequency response range of the valve core displacement and, compared with the SPWM control, the frequency response range of the valve core increased by 70%.
The method proposed in this paper improves the performance of the HSV, reduces the valve energy consumption, and expands the frequency response range of the valve spool. It can enhance the position accuracy of controlling hydraulic cylinders using HSVs. However, it may not be suitable for high-pressure and high-flow scenarios. In future research, it may be possible to make improvements to the OCPWM signal, to increase the coil voltage value at the critical state of the valve spool, which has great potential for further accelerating the opening speed of the valve spool. Additionally, the reliability of the method can be validated through application to a physical model and, based on this, the position control accuracy of the valve-controlled cylinder can be improved. If resources allow, the structure of the HSV can be improved, to expand its application range under different pressure and flow conditions.
Author Contributions
Conceptualization, Q.L. and H.D.; methodology, Q.L., H.D., and J.W.; formal analysis, P.H.; data curation, P.H.; writing—original draft preparation, Q.L.; writing—review and editing, H.D. All authors have read and agreed to the published version of the manuscript.
Funding
Major Science and Technology Project of Changsha City under “the open competition mechanism to select the best candidates”: Kq2102001.
Data Availability Statement
Not applicable.
Conflicts of Interest
The authors declare no conflict of interest.
References
- Brandstetter, R.; Deubel, T.; Scheidl, R.; Winkler, B.; Zeman, K. Digital hydraulics and “Industrie 4.0”. Proc. Inst. Mech. Eng. Part I J. Syst. Control Eng. 2017, 231, 82–93. [Google Scholar] [CrossRef] [Scilit]
- Wu, S.; Zhao, X.Y.; Li, C.F.; Jiao, Z.X.; Qu, F.Y. Multiobjective Optimization of a Hollow Plunger Type Solenoid for High Speed On/Off Valve. IEEE Trans. Ind. Electron. 2018, 65, 3115–3124. [Google Scholar] [CrossRef] [Scilit]
- Jiao, Z.X.; Zhang, H.; Shang, Y.X.; Liu, X.C.; Wu, S. A power-by-wire aircraft brake system based on high-speed on-off valves. Aerosp. Sci. Technol. 2020, 106, 106177. [Google Scholar] [CrossRef] [Scilit]
- Gao, Q.; Zhu, Y.C.; Wu, C.W.; Jiang, Y.L. Development of a novel two-stage proportional valve with a pilot digital flow distribution. Front. Mech. Eng. 2021, 16, 420–434. [Google Scholar] [CrossRef] [Scilit]
- Zhong, Q.; Bao, H.M.; Li, Y.B.A.; Hong, H.C.; Zhang, B.; Yang, H.Y. Investigation into the Independent Metering Control Performance of a Twin Spools Valve with Switching Technology-controlled Pilot Stage. Chin. J. Mech. Eng. 2021, 34, 91. [Google Scholar] [CrossRef] [Scilit]
- Hansen, A.H.; Asmussen, M.F.; Bech, M.M. Hardware-in-the-Loop Validation of Model Predictive Control of a Discrete Fluid Power Power Take-Off System for Wave Energy Converters. Energies 2019, 12, 3668. [Google Scholar] [CrossRef] [Scilit]
- Zhang, Q.H.; Liu, Y.; Xiong, W.; Ruan, J.; Tang, J.; Tan, J.P. Research on Buffer Characteristics of a New 2D Digital Buffer Valve for Vehicle Shift. Electronics 2022, 11, 1846. [Google Scholar] [CrossRef] [Scilit]
- Gao, Q.; Wang, J.; Zhu, Y.; Wang, J.; Wang, J.C. Research Status and Prospects of Control Strategies for High Speed On/Off Valves. Processes 2023, 11, 160. [Google Scholar] [CrossRef] [Scilit]
- Wang, H.; Chen, Z.; Huang, J.H.; Quan, L.; Zhao, B. Development of High-Speed On-Off Valves and Their Applications. Chin. J. Mech. Eng. 2022, 35, 67. [Google Scholar] [CrossRef] [Scilit]
- Akkurt, N.; Shedd, T.; Memon, A.A.; Usman; Ali, M.R.; Bouye, M. Analysis of the forced convection via the turbulence transport of the hybrid mixture in three-dimensional L-shaped channel. Case Stud. Therm. Eng. 2023, 41, 102558. [Google Scholar] [CrossRef] [Scilit]
- Roemer, D.B.; Johansen, P.; Pedersen, H.C.; Andersen, T.O. Optimum design of seat region in valves suitable for digital displacement machines. Int. J. Mechatron. Autom. 2014, 4, 116–126. [Google Scholar] [CrossRef] [Scilit]
- Noergaard, C.; Bech, M.M.; Christensen, J.H.; Andersen, T.O. Modeling and Validation of Moving Coil Actuated Valve for Digital Displacement Machines. IEEE Trans. Ind. Electron. 2018, 65, 8749–8757. [Google Scholar] [CrossRef]
- Zhong, Q.; Zhang, B.; Yang, H.Y.; Ma, J.E.; Fung, R.F. Performance analysis of a high-speed on/off valve based on an intelligent pulse-width modulation control. Adv. Mech. Eng. 2017, 9, 1687814017733247. [Google Scholar] [CrossRef] [Scilit]
- Zhao, J.H.; Wang, M.L.; Wang, Z.J.; Grekhov, L.; Qiu, T.; Ma, X.Z. Different boost voltage effects on the dynamic response and energy losses of high-speed solenoid valves. Appl. Therm. Eng. 2017, 123, 1494–1503. [Google Scholar] [CrossRef] [Scilit]
- Aborobaa, A.N.; Ghamry, K.A.; Saleh, A.; Mabrouk, M.H. Energy-saving and Performance-enhancing of a High Speed on/off Solenoid Valve. FME Trans. 2022, 50, 283–293. [Google Scholar] [CrossRef] [Scilit]
- Fang, J.G.; Wang, X.F.; Wu, J.J.; Yang, S.; Li, L.; Gao, X.; Tian, Y. Modeling and Control of A High Speed On/Off Valve Actuator. Int. J. Automot. Technol. 2019, 20, 1221–1236. [Google Scholar] [CrossRef] [Scilit]
- Linjama, M.; Paloniitty, M.; Tiainen, L.; Huhtala, K. Mechatronic Design of Digital Hydraulic Micro Valve Package. Procedia Eng. 2015, 106, 97–107. [Google Scholar] [CrossRef] [Scilit]
- Pu, L.; Zhang, X.-D. An intelligent fuzzy-PID control system for high-speed solenoid valve. In Proceedings of the 2009 4th International Conference on Innovative Computing, Information and Control, ICICIC 2009, Kaohsiung, Taiwan, 7–9 December 2009; pp. 504–507. [Google Scholar]
- Gao, Q.; Zhu, Y.C.A.; Wu, C.W.; Jiang, Y.L. Identification of critical moving characteristics in high speed on/off valve based on time derivative of the coil current. Proc. Inst. Mech. Eng. Part I J. Syst. Control Eng. 2021, 235, 1084–1099. [Google Scholar] [CrossRef] [Scilit]
- Gao, Q.; Zhu, Y.C.; Luo, Z.; Bruno, N. Investigation on adaptive pulse width modulation control for high speed on/off valve. J. Mech. Sci. Technol. 2020, 34, 1711–1722. [Google Scholar] [CrossRef] [Scilit]
- Gao, Q. Nonlinear Adaptive Control with Asymmetric Pressure Difference Compensation of a Hydraulic Pressure Servo System Using Two High Speed On/Off Valves. Machines 2022, 10, 66. [Google Scholar] [CrossRef] [Scilit]
- Zhang, B.; Zhong, Q.; Ma, J.E.; Hong, H.C.; Bao, H.M.; Shi, Y.; Yang, H.Y. Self-correcting PWM control for dynamic performance preservation in high speed on/off valve. Mechatronics 2018, 55, 141–150. [Google Scholar] [CrossRef] [Scilit]
- Simic, M.; Herakovic, N. Characterization of energy consumption of new piezo actuator system used for hydraulic on/off valves. J. Clean. Prod. 2021, 284, 124748. [Google Scholar] [CrossRef] [Scilit]
- Zhong, Q.; Wang, X.L.; Xie, G.; Yang, H.Y.; Yu, C.; Xu, E.G.; Li, Y.B. Analysis of Dynamic Characteristics and Power Losses of High Speed on/off Valve with Pre-Existing Control Algorithm. Energies 2021, 14, 4901. [Google Scholar] [CrossRef] [Scilit]
- Zhong, Q.; Xu, E.; Xie, G.; Wang, X.; Li, Y. Dynamic performance and temperature rising characteristic of a high-speed on/off valve based on pre-excitation control algorithm. Chin. J. Aeronaut. 2023. [Google Scholar] [CrossRef] [Scilit]
- Zhong, Q.; Wang, X.L.; Zhou, H.Z.; Xie, G.; Hong, H.C.; Li, Y.B.; Chen, B.; Yang, H.Y. Investigation Into the Adjustable Dynamic Characteristic of the High-Speed ON/OFF Valve With an Advanced Pulsewidth Modulation Control Algorithm. IEEE-ASME Trans. Mechatron. 2022, 27, 3784–3797. [Google Scholar] [CrossRef] [Scilit]

Disclaimer/Publisher’s Note: The statements, opinions and data contained in all publications are solely those of the individual author(s) and contributor(s) and not of MDPI and/or the editor(s). MDPI and/or the editor(s) disclaim responsibility for any injury to people or property resulting from any ideas, methods, instructions or products referred to in the content. |
© 2023 by the authors. Licensee MDPI, Basel, Switzerland. This article is an open access article distributed under the terms and conditions of the Creative Commons Attribution (CC BY) license (https://creativecommons.org/licenses/by/4.0/).