


Abstract
Skin hydration is not uniform: it is low at the surface and rises with depth, and the standard capacitance probe (Corneometer) samples only the outermost layer. How the surface–deep relationship evolves under repeated moisturizer use is not captured by a single metric. Using the Hydration Gap Index (HGI = |surface − deep (0.5 mm)|), this relationship was tracked in 22 healthy adults, measuring surface hydration (Corneometer) and depth-resolved deep hydration (Moisturemeter D; 0.5–5.0 mm) at baseline, after one application, and after two weeks. Surface hydration rose sharply after one application (30.9 → 64.0 A.U.), then partially declined by two weeks (43.5 A.U.; all p < 0.001), whereas deeper readings were essentially unchanged (≤5.1%), consistent with a stable deep compartment. The per-subject surface–deep gap first widened (13.1 → 18.0) then narrowed to ≈5.1 A.U. (19/22 subjects; group-mean 2.0). Surface and deep compartments varied independently (baseline r = −0.14; change r = +0.05), and the surface-dominant response was reproduced with a different surface instrument in the same cohort (surface +102%, deep +4%). The apparent depth gradient steepened only through this shallow-layer gain (−3.66 → −3.93 A.U./mm, p < 0.0001). Thus, repeated use reflected equilibration of the superficial layer toward the 0.5 mm compartment, not a uniform rise; the HGI provides a compact index of this surface-to-deep equilibration.
1. Introduction
Skin hydration governs barrier integrity and is the dominant endpoint in moisturization research [1,2]. The capacitance method (Corneometer) is the field standard [3], but it samples only the outermost stratum corneum, so a large surface signal is frequently interpreted as whole-skin hydration even though deeper water is not measured [4,5,6]. Reviews of the available bioengineering methods emphasise this depth limitation [7,8]. Tissue dielectric constant (TDC) measurement (Moisturemeter D) complements capacitance by estimating water at defined effective depths, enabling simultaneous surface and depth-resolved assessment [9,10,11,12,13,14]. Importantly, TDC reports the water content of the cumulative tissue volume from the surface down to each effective depth rather than of a discrete plane, so that greater effective depths progressively incorporate the water-poor subcutaneous fat layer [10,12]. Because the tissue dielectric constant reflects water within a depth-defined sensing volume, it provides a relative, non-invasive proxy for tissue water rather than an absolute water volume; all deep-hydration values reported here are interpreted in this relative sense.
A central, well-established fact is that skin water is not uniform: a steep concentration gradient runs from the dry surface (≈15–40%) to the more hydrated deeper layers (≈65–70%), as shown by in vivo confocal Raman depth profiling and earlier work [15,16,17,18,19,20]. It is also known that surface methods correlate imperfectly with deeper measures [4,7] and that topical treatment can reshape the gradient [19,21]. What remains poorly characterised is the temporal behaviour of this surface–deep relationship: existing studies largely describe a static gradient at a single time, and few have tracked, with a dedicated quantitative index, how the surface–deep gap evolves across repeated applications.
This study therefore addresses not merely whether a gradient exists but whether it re-equilibrates over time. The Hydration Gap Index (HGI = |surface − deep (0.5 mm)|) is introduced, and the hypothesis of hydration equilibration is tested: repeated application does not simply raise hydration but rebalances the surface and deep compartments, so that an acutely widened surface–deep gap converges toward equilibrium. Both compartments were measured simultaneously—surface capacitance together with depth-resolved tissue dielectric constant—and surface and deep water were tracked over repeated applications and summarised with two quantitative descriptors: the HGI (the surface-to-deep gap) and the depth-gradient steepness (DGS, the slope of the deep profile with depth). Using this framework, the following were characterised: surface and depth-resolved kinetics; depth attenuation; the HGI and DGS over time; the statistical independence of the two compartments; and the reproducibility of the surface-selective response [22,23,24,25,26,27,28,29,30]. The novelty of this work is threefold: (i) it is the first to quantify, via the HGI, the temporal narrowing of the surface-to-deep gap under repeated application; (ii) it establishes the statistical independence of the surface and deep compartments, exposing the overestimation inherent in surface-only assessment; and (iii) it shows the acute surface-selective response is reproduced with a second surface instrument applied to the same cohort, indicating it is not an artefact of a single device.
2. Materials and Methods
2.1. Study Design and Subjects
The primary study (HM-P26-0353) was a single-arm, repeated-measures design. Twenty-three healthy Korean adults (≥20 years) were enrolled; one was excluded at screening, leaving 22 for analysis. Inclusion criteria were healthy Korean adults (men and women) aged ≥20 years; provision of written informed consent after full explanation of the study; freedom from acute or chronic systemic disease, including skin disease; and ability to attend follow-up throughout the study. Exclusion criteria were pregnancy, lactation, or planned pregnancy; psychiatric or infectious skin disease; use of topical steroids for ≥1 month; participation in the same study within the previous 6 months; sensitive or hypersensitive skin; skin abnormalities (e.g., nevi, acne, erythema, telangiectasia) at the test site; use of cosmetics or drugs of the same or similar efficacy at the test site within the previous 3 months; dermatologic procedures at the test site within the previous 6 months; being an employee of the testing institution; or being otherwise judged unsuitable by the principal investigator. The test product was Layer Lab Blue Ectoin Hydro Cream (a cream; Layer By Layer Co., Ltd., Seoul, Republic of Korea; product control no. 260323-E-05). The formulation is a glycerin- and niacinamide-based hydrating cream whose principal functional ingredients include humectants and moisturizing actives (glycerin, betaine, ectoin, glyceryl glucoside, 1,2-hexanediol) together with niacinamide, adenosine, allantoin, and botanical soothing agents (e.g., Aloe barbadensis leaf extract, guaiazulene); the complete INCI declaration is provided as a separate confidential file. An appropriate amount was applied to the face twice daily for 14 days, and participants were instructed to adhere to the specified usage method and follow-up schedule. Instrumental measurements were obtained at pre-defined visits (baseline, week 1, and week 2) rather than daily. The study was single-arm and baseline-controlled, without a separate positive or negative control arm. A participant flow diagram is provided in the Supplementary Materials (Figure S1 Participant flow diagram): 23 subjects were enrolled, 1 was excluded at screening, and 22 completed and were analysed (enrolled cohort: 22 women and 1 man; mean age 52.57 ± 8.02 years). It was conducted at the Human Skin Clinical Trial Center (Seoul) between 16 and 30 April 2026 under dermatologist supervision, following the Declaration of Helsinki (approved by the Institutional Review Board of the Human Skin Clinical Trial Center; approval no. HM-IRB-P26-0353). The same cohort was additionally assessed at baseline and after one application with a different surface instrument (Epsilon E100, Biox Systems Ltd., London, UK), recorded under protocol HM-R26-0353 (n = 23, the same participants; the single-application assessment includes all 23, whereas the primary two-week analysis retained 22 after the screening exclusion). This provides a within-cohort, cross-instrument check of the surface response; the accompanying deep reading (TDC, 1.5 mm) is the same measurement reported for the primary study, not an independent re-measurement.
2.2. Measurements
Surface hydration was measured with a Corneometer CM 825 (Courage + Khazaka electronic GmbH, Cologne, Germany; capacitance, arbitrary units, A.U.) at the forehead and both cheeks [3,6]; depth-resolved hydration was measured with a Moisturemeter D (Delfin Technologies Ltd., Kuopio, Finland; tissue dielectric constant, TDC; 265 MHz) at effective depths of 0.5, 1.5, 2.5 and 5.0 mm on the cheek [9,14], using depth-specific probes (the 1.5 mm depth used the S15 probe). Measurements were obtained at baseline, immediately after one application, and after two weeks in a controlled environment (22 ± 2 °C and 50 ± 5% relative humidity) [9]. In this same-cohort cross-instrument assessment, surface hydration was measured with an Epsilon E100 (Biox Systems Ltd., London, UK; ε) and deep hydration with the Moisturemeter D (TDC, 1.5 mm).
2.3. Outcome Definitions and Statistics
The Hydration Gap Index was defined, for each subject, as the absolute difference between the surface and 0.5 mm deep readings: HGI = |Surface − Deep (0.5 mm)|, computed per subject and then summarised as mean ± SD, so that per-subject signed differences do not cancel. Because the surface (Corneometer capacitance, A.U.) and deep (Moisturemeter D tissue dielectric constant, A.U.) values are reported on different instrument scales, the HGI is an operational within-study index of surface-to-deep divergence rather than an absolute difference in water content; it is interpreted only within this study and across matched timepoints, and its physical limitation is addressed in Section 4.2. Because both probes report on comparable arbitrary-unit ranges and each subject is measured on the same instruments at every visit, any fixed offset between the two scales is constant within a subject over time; the HGI therefore tracks the magnitude and temporal course of the surface-to-deep divergence—its acute widening and subsequent narrowing—robustly, even though its absolute magnitude is not a physical water-content difference. Percentage improvement was calculated as (post − baseline)/baseline × 100. Data are presented as mean ± SD. Within-subject changes across timepoints were assessed as follows. For each outcome the omnibus effect of time (three timepoints) was first tested with a one-way repeated-measures ANOVA (Friedman test where normality was not met), and the partial eta-squared (η2p) is reported as the effect size. Normality of the within-subject differences was assessed by the Shapiro–Wilk test with inspection of Q–Q plots. When the omnibus test was significant, the three pre-specified pairwise contrasts (baseline vs. one application, one application vs. two weeks, and baseline vs. two weeks) were examined using paired t-tests, or the Wilcoxon signed-rank test where normality was not supported. Because three pairwise comparisons were performed within each outcome, all pairwise p-values were adjusted for multiplicity using the Holm–Bonferroni step-down procedure (family = the three contrasts within that outcome); a significant omnibus ANOVA was not treated as a substitute for this correction. For each contrast, the mean paired difference (Δ) is reported with its standard error (SE) and the Holm-adjusted p-value (Table 1). The baseline-to-two-week change in the depth-gradient steepness was tested with a paired t-test on the per-subject slopes, and differences across improvement tertiles with one-way ANOVA. Surface–deep associations were quantified with Pearson correlation for linear relationships and Spearman rank correlation (ρ) where indicated; these exploratory associations were not corrected for multiplicity and are interpreted accordingly. Both the group-mean HGI and the mean of the per-subject absolute gaps are reported, with the per-subject mean treated as the primary summary. A two-tailed p < 0.05 was considered significant. The sample size (n = 22 analysed) was fixed by the original commissioned study protocol; no a priori power analysis was performed for the HGI endpoint. Statistical analyses were performed with IBM SPSS Statistics 26 (IBM Corp., Armonk, NY, USA); the Hydration Gap Index and depth-gradient steepness were additionally computed in Python (version 3.10; https://www.python.org, accessed on 1 April 2026), using the pandas, SciPy, and statsmodels libraries.
Table 1.
Skin hydration (A.U.) at baseline, after a single application, and after two weeks of twice-daily use (n = 22).
3. Results
3.1. Surface Hydration Rises Sharply After One Application, Then Partially Declines
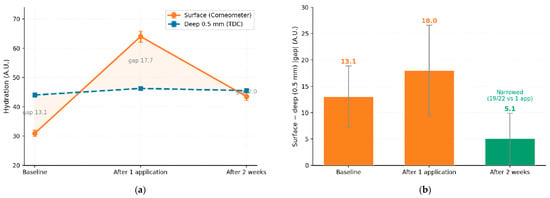
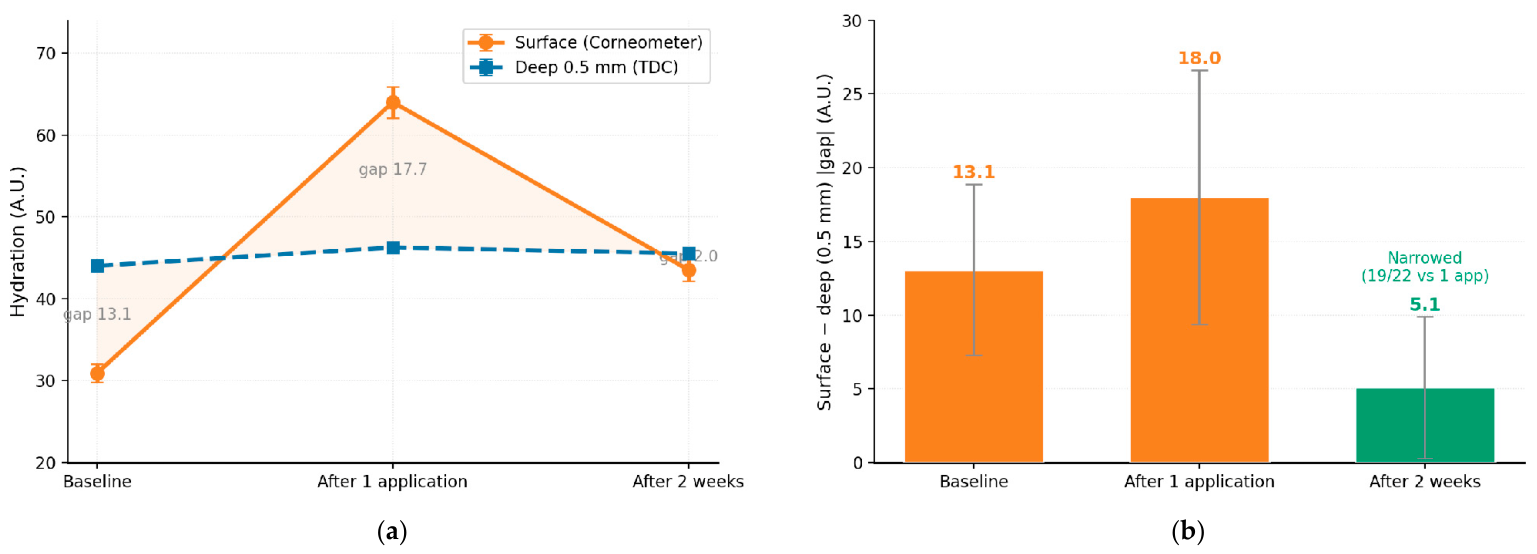
Surface hydration rose sharply after one application and then partly relaxed by two weeks while remaining above baseline (Table 1, Figure 1a). All 22 subjects showed the same trajectory (peak at one application, decline by two weeks, still above baseline), and the decline from peak to two weeks was significant (p < 0.001). The overall effect of time was significant for surface hydration (repeated-measures ANOVA, F(2,42) = 645.4, p < 0.001, partial η2 = 0.97), and a significant time effect was also present at every deep depth (all F(2,42) ≥ 62.8, p < 0.001). Full omnibus repeated-measures ANOVA statistics (F, p, and partial η2), together with the Shapiro–Wilk normality results, are provided in Table S1.
Figure 1.
(a) Surface (Corneometer) and deep (0.5 mm TDC) hydration kinetics with the gap shaded; (b) the hydration gap index |HGI| narrowing at two weeks (per-subject mean 5.1 ± 4.8 A.U.; group-mean 2.0 A.U.). Kinetics mean ± SEM; |HGI| mean ± SD; n = 22.
3.2. Deep Readings Are Essentially Unchanged and Decline with Effective Depth
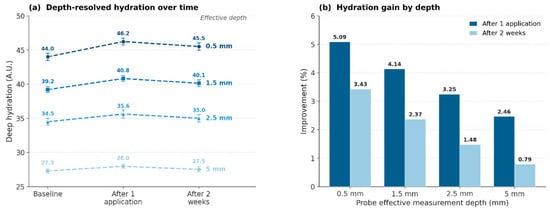
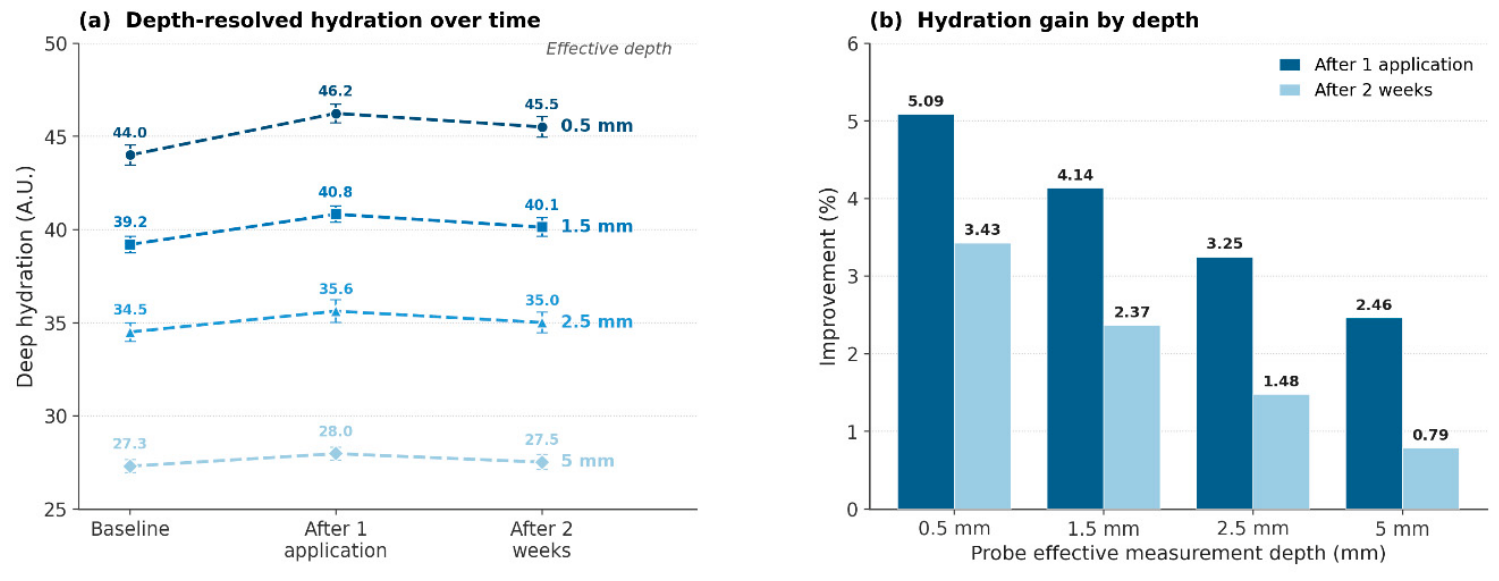
The deeper readings were essentially unchanged over the study: all timepoint-to-timepoint differences were ≤5%, and at 5.0 mm ≤1% (Table 1). Although several of these small changes reached statistical significance, this reflects the low within-subject variance of the paired measurements rather than a physiologically meaningful gain, and the magnitudes lie within the practical resolution of the device. The readings showed a clear ordering by effective depth (0.5 > 1.5 > 2.5 > 5.0 mm; Table 1, Figure 2a). Because TDC integrates water over the cumulative volume from the surface to each effective depth, this decline is best read as normal anatomy: the shallowest volume (≈0.5 mm) samples stratum corneum, epidermis and upper papillary dermis, whereas progressively deeper volumes (≈2.5–5.0 mm) increasingly incorporate the water-poor subcutaneous fat layer. The monotonic attenuation of the post-application change with depth (Figure 2b) is therefore consistent with a topical effect confined to the most superficial, product-accessible layer rather than with penetration into deep tissue.
Figure 2.
(a) Depth-resolved readings (Moisturemeter D) by effective measurement depth and (b) attenuation of the post-application improvement with effective depth. Mean ± SEM, n = 22.
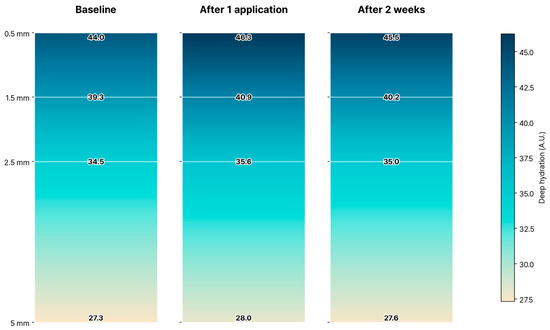
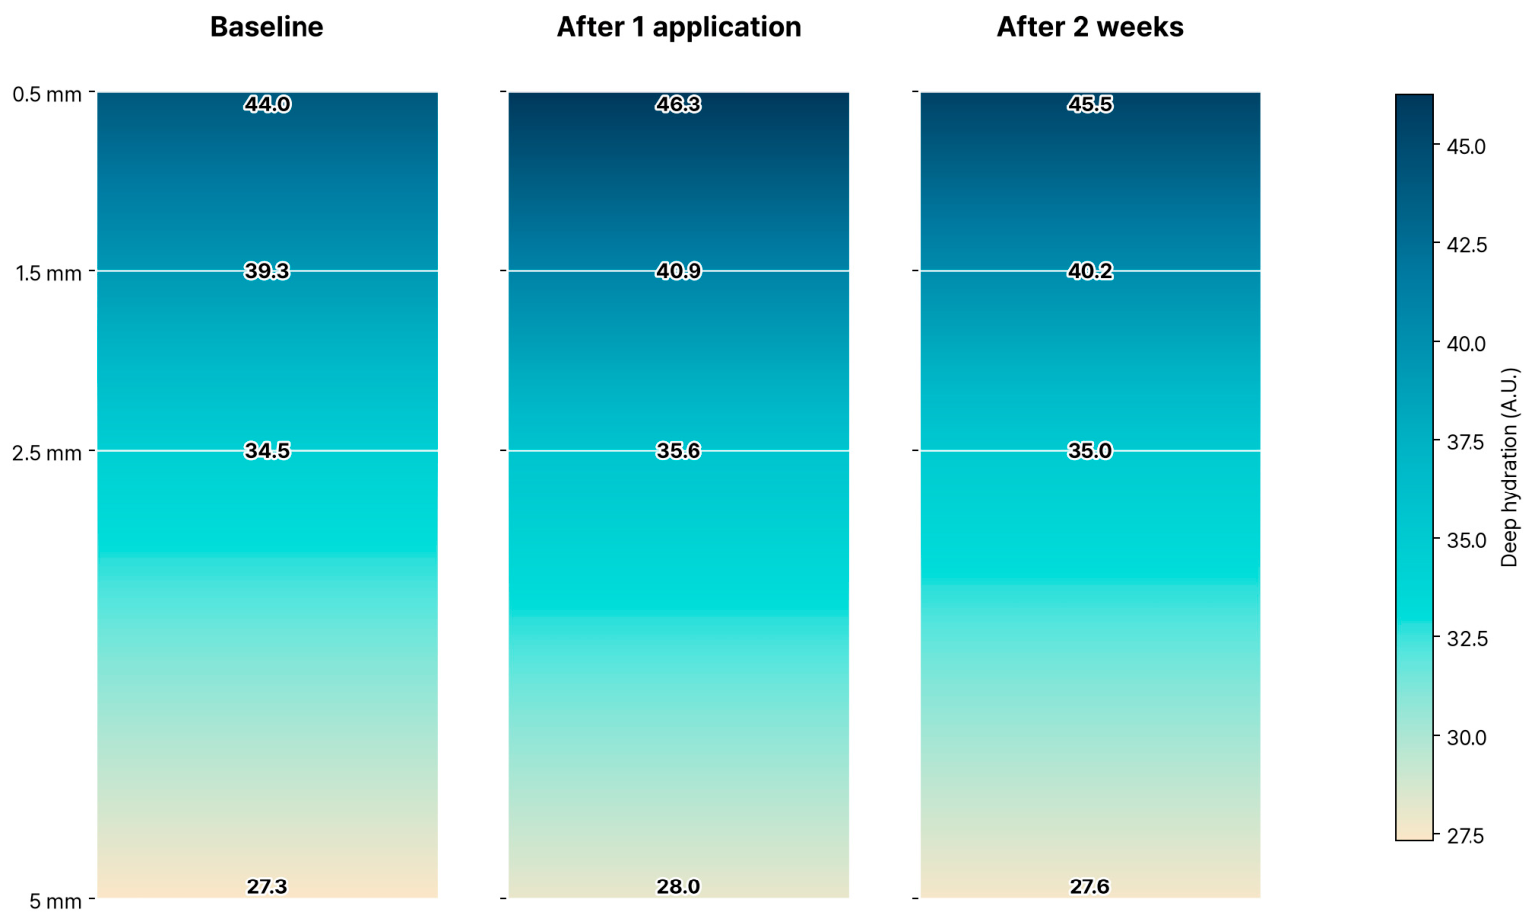
Figure 3 presents the depth-resolved readings as a continuous colour gradient (linear interpolation between the four measured depths). At every timepoint the shallower volumes register higher water content and the signal declines with effective depth as the subcutaneous fat layer enters the measurement volume; the between-timepoint differences are small and confined to the shallowest layer, matching Table 1 and Figure 2.
Figure 3.
Continuous-gradient representation of the depth-resolved reading by probe effective measurement depth (0.5–5.0 mm; tissue dielectric constant) at baseline, after one application, and after two weeks; linear interpolation between the four measured depths. Colour intensity increases with water content (darker = more hydrated). n = 22.
3.3. The Surface–Deep Relationship over Time: Gap Narrowing, with Apparent Steepening Driven by Shallow-Layer Gain
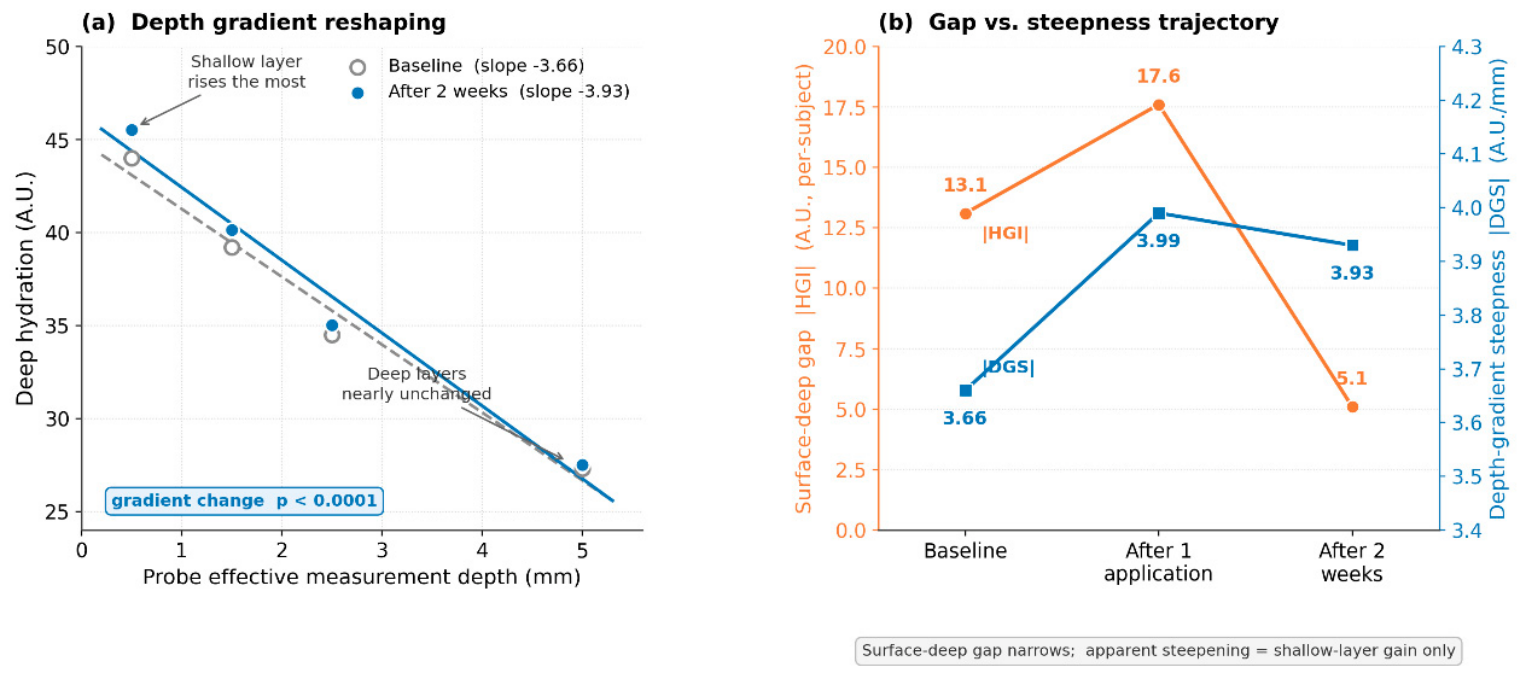
Having characterised each compartment separately, these compartments are now combined to describe their relationship over time along two axes—the surface-to-deep gap (HGI) and the steepness of the deep profile (DGS). Considering the gap first: at baseline the surface was drier than the 0.5 mm compartment (per-subject |HGI| 13.1 A.U.). One application widened the gap (18.0) as the surface overshot; by two weeks the surface had stabilized close to the 0.5 mm compartment. At the individual level the absolute surface–deep gap narrowed to a mean of ≈5.1 A.U. at two weeks, with 19 of 22 subjects showing a smaller gap than after one application; at the group-mean level the gap was only 2.0 A.U., a value that understates the typical per-subject gap because signed differences partly cancel on averaging. Thus the per-subject |HGI| moved 13.1 → 18.0 → 5.1 (group-mean 13.1 → 17.7 → 2.0), corresponding to acute widening followed by narrowing toward a common level (Figure 1b). This temporal narrowing, rather than the hydration increase itself, is the central and most novel observation of this work: whereas prior studies described a static surface–deep gradient, the HGI here tracks its dynamic, time-dependent re-equilibration.
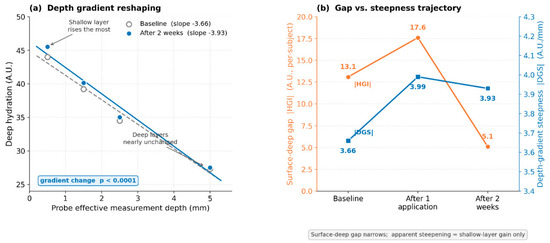
Turning to the second descriptor, the apparent steepness of the depth-resolved profile increased slightly over time. The depth-gradient steepness (DGS) rose from 3.66 at baseline to 3.93 A.U./mm at two weeks (regression slope −3.66 to −3.93; p < 0.0001; Figure 4), peaking at 3.99 immediately after one application. Critically, this steepening was produced almost entirely by a gain in the shallowest, product-accessible layer (0.5 mm), whereas the deeper readings (2.5–5.0 mm)—dominated by the deeper dermis and the water-poor subcutaneous fat, whose water is set by systemic physiology which topical product does not reach—were unchanged. The steepening is therefore not a remodelling of deep tissue water but an arithmetic consequence of a localised superficial gain against a fixed deep baseline, and it is fully consistent with the surface–deep narrowing captured by the HGI: repeated use raised water only where product can act, at and above the 0.5 mm layer. Although the steepening here is driven by the shallow-layer gain, the DGS is in principle independent of the HGI: it would respond differently if the deeper readings changed, so reporting both descriptors distinguishes a shallow-confined effect from a genuine redistribution of deeper water and guards against reading a surface-driven slope change as deep-tissue remodelling.
Figure 4.
Depth-resolved readings and the two summary descriptors. (a) The apparent profile steepens slightly from baseline to two weeks (slope −3.66 → −3.93 A.U./mm, p < 0.0001), driven by a gain in the shallowest product-accessible layer against near-constant deeper readings; the x-axis is the probe effective measurement depth. (b) The two descriptors over time—surface–deep narrowing (|HGI|) and depth-gradient steepness (|DGS|). n = 22.
3.4. The Surface and Deep Compartments Vary Independently
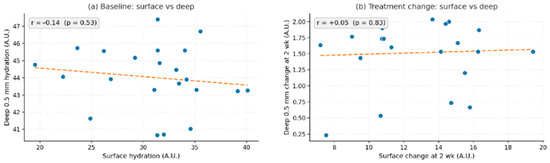
Surface and deep hydration were not correlated across subjects at baseline (r = −0.14, p = 0.53) nor in their two-week change (r = +0.05, p = 0.83; Figure 5). A large surface gain did not imply a large deep gain, indicating that the compartments behave as largely distinct pools. The narrowing of the HGI therefore does not require a shared driver: the labile superficial pool, after its transient overshoot, declines toward the 0.5 mm compartment, whose level is set systemically and is not altered by topical product. Consistent with this, the convergence is most plausibly driven by progressive barrier repair and adequate hydration of the epidermis with repeated use, which brings the surface reading down toward the stable superficial-dermal level, rather than by any rise in deep tissue water. Nonetheless, the single-application surface improvement was positively associated with the improvement of the shallowest deep layers and attenuated with depth: the association was significant at 0.5 mm (ρ = +0.46, p = 0.032), weakened deeper, and became non-significant at 2.5 mm and beyond, indicating that the topical effect reaches only the shallow, product-accessible layers and not the deeper tissue, whose hydration is not modifiable by topical product.
Figure 5.
Surface and deep hydration are uncorrelated across subjects, both (a) at baseline and (b) in their two-week change. Dashed line, linear fit; n = 22.
3.5. The Surface-Selective Response Is Reproduced with a Different Surface Instrument
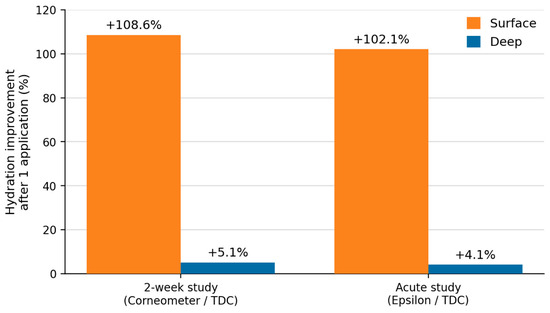
When the same cohort was re-assessed with a different surface instrument (Epsilon, ε; n = 23), surface hydration rose by +102% after one application while the accompanying deep reading (TDC, 1.5 mm) rose by +4% (Table 2, Figure 6). Because these deep TDC 1.5 mm values are the same measurements reported for the primary study, this comparison is not an independent replication of the deep compartment; its narrower purpose is to test whether the large surface response depends on the choice of surface device. That a second surface instrument reproduced the acute increase to essentially the same magnitude indicates the surface-selective response is a property of the response itself rather than an artefact of the Corneometer. Because it used a single application only, it speaks to the acute dissociation and not to the two-week temporal narrowing, which remains specific to the primary study.
Table 2.
Same-cohort single-application assessment with a different surface instrument (n = 23): surface (Epsilon ε) versus deep (TDC, 1.5 mm) hydration. The deep values are the shared 1.5 mm measurements also used in the primary study.
Figure 6.
Surface-selective hydration response after one application, reproduced across two surface instruments (Corneometer and Epsilon) in the same cohort.
3.6. Drier Baseline Skin Shows Larger Relative Gains but Converges to a Common Level
When subjects were ranked by the summed surface improvement across the three sites (forehead and both cheeks) and split into tertiles, those with the largest relative gains had the lowest baseline hydration (Spearman ρ = −0.61, p = 0.003; Table 3). Critically, the absolute hydration reached after one application was statistically indistinguishable across the low-, mid- and high-improvement groups (about 62–66 A.U.; ANOVA p = 0.69; Table 3): subjects who improved most in percentage terms had simply started drier and converged toward a common level. A positive association between the single-application surface and 0.5 mm deep improvement was also observed (ρ = +0.46, p = 0.032), consistent with a shared baseline dependence and with the shallow-layer coupling noted in Section 3.4.
Table 3.
Surface hydration by improvement tertile (three-site summed improvement after one application); n = 22.
A per-subject map of site-level surface improvement (forehead and both cheeks), ordered by the three-site improvement sum, is provided in the Supplementary Materials (Figure S2). All subjects improved across the measured sites, and subjects with larger sums had drier baseline skin.
4. Discussion
The principal novelty of this work is the first quantification, through a dedicated index (the HGI, with its companion descriptor DGS, introduced for the first time in the present study and not an adaptation of a previously published index), of the temporal convergence of the surface-to-deep hydration gap during repeated use: the dominant effect is not an increase in hydration but a rebalancing of where water resides, captured compactly by the HGI. The surface overshot acutely and then relaxed to a value close to the 0.5 mm compartment, narrowing the group-mean surface–deep gap to about 2.0 A.U. by two weeks (per-subject mean ≈ 5.1 A.U.). Because the two compartments varied independently across subjects, this narrowing is most parsimoniously explained by the labile surface pool relaxing back toward the stable deep pool (whose level is set systemically rather than topically) after its transient overshoot, rather than by a single driver moving both together. These observations reframe moisturization from raising a single surface number toward tracking how the product-accessible superficial layer re-equilibrates toward the deeper water compartment, whose level appears to be governed systemically rather than by topical product [1,2,21].
The result also has a methodological implication. Surface-only assessment reported a +108.6% acute and +41.7% sustained change, greatly overstating volumetric hydration because deep compartments moved by ≤5.1% [4,5]. The independence of the compartments means the surface signal cannot be used to infer deep hydration; multi-depth assessment is required to describe the architecture. That the acute surface-selective response was reproduced with a second surface instrument in the same cohort strengthens this conclusion, since it shows this increase is not specific to the Corneometer. Mechanistically, humectant- and lipid-mediated actions on the outer stratum corneum are well described [23,25] and account for the large but transient surface response; the deeper readings, by contrast, reflect dermal and subcutaneous water whose level appears to be governed by systemic physiology and is not a target of topical application [10,21,22]. By the same logic, any increase in the deeper TDC signal reflects greater water content within the deep sensing volume; whether this corresponds to systemic fluid status (for example, transient oedema) rather than to topically delivered hydration cannot be determined from the present data and is left as a hypothesis for future study. The HGI offers a single-number summary of the superficial equilibration; whether it relates to barrier function is a hypothesis for future work that would pair it with a direct barrier measure such as transepidermal water loss (TEWL).
4.1. Implications: Three Testable Hypotheses
These findings suggest three hypotheses of clinical and cosmetic-science relevance that warrant dedicated testing. First, the HGI may serve as a functional indicator of skin homeostasis and barrier health: because the surface–deep gap re-equilibrates with use, the restoration of the gap, rather than the absolute surface value, may better reflect barrier status; this can be tested by correlating the HGI with transepidermal water loss (TEWL), natural moisturizing factor (NMF), and clinical dryness scales.
Second, the surface response has two temporal components—an immediate increase after a single application and a lower but stably elevated level maintained over two weeks of repeated use—which together may reconcile immediate sensory benefit with durable superficial hydration; this can be tested by linking the acute surface increase to immediate perception (reduced tightness, smoothness) and the maintained two-week surface level, together with the restored HGI, to longer-term barrier measures. Both components are superficial; the deeper readings are not invoked, consistent with their lying outside the reach of topical product.
Third, the product effect is essentially confined to the shallow, product-accessible layers: the single-application surface improvement correlated with the deep improvement at the shallowest depths (0.5 mm; ρ = +0.46, p = 0.032) and attenuated to non-significance at 2.5 mm and beyond. Because water below roughly 1.0 mm is governed by systemic physiology rather than by topical delivery, this boundary is best interpreted as a physiological limit on what a leave-on moisturizer can influence rather than as a target to be overcome; the practically relevant endpoint is therefore the surface-to-0.5 mm relationship (the HGI) itself, which can be tested against barrier markers such as TEWL and NMF.
4.2. Limitations
This study has several limitations. First, the primary study was single-arm without an untreated or vehicle control, so time, regression to the mean, and environmental factors cannot be fully separated from a product effect; the equilibration is therefore described as an observed temporal pattern rather than a causally attributed one. Second, the HGI subtracts values from two different instruments (Corneometer capacitance and Moisturemeter D tissue dielectric constant) that are reported on distinct, non-identical scales; it is thus a within-study operational measure of surface-to-deep divergence and should not be read as an absolute difference in water content, and comparisons of HGI magnitude across studies using different instruments are not warranted. Third, the cross-instrument comparison (HM-R26-0353) was not an independent study but the same cohort re-assessed with a different surface instrument after a single application; its deep TDC 1.5 mm readings are the same measurements as in the primary study, so it provides cross-instrument confirmation of the acute surface response rather than an independent replication, and does not address the two-week temporal narrowing. Fourth, the pre-specified pairwise comparisons among the three timepoints were corrected for multiplicity using the Holm–Bonferroni procedure within each outcome; the remaining exploratory surface–deep associations (Pearson and Spearman correlations) were not formally corrected and should be interpreted as hypothesis-generating. TDC readings are cumulative volumetric measures to a device-effective depth, not values at a discrete anatomical plane; at greater effective depths they progressively incorporate the water-poor subcutaneous fat layer, and the deeper signal reflects dermal and subcutaneous water whose level appears to be governed by systemic physiology rather than being topically modifiable [10,12,14]. Accordingly, the deep readings here are treated as a stable physiological reference against which the superficial change is measured, not as an outcome expected to respond to the product. Follow-up was two weeks in 22 subjects; longer, controlled studies with a larger sample, ideally with depth-resolved Raman confirmation of the gradient, are warranted [16,27]. These limitations map onto concrete next steps: the two-instrument scale dependence can be reduced by cross-instrument calibration or single-instrument designs; the operational, relative nature of the HGI and its possible link to barrier function can be tested by pairing it with direct barrier measures such as transepidermal water loss (TEWL) and natural moisturizing factor (NMF); the single-arm design can be addressed with vehicle- or untreated-controlled, adequately powered trials in demographically broader cohorts; and the coarse visit schedule can be improved with denser (for example, more frequent) sampling to resolve the day-to-day trajectory.
Consistent with equilibration toward a common level, subjects with drier baseline skin showed larger relative gains yet reached the same absolute hydration as others after one application (Table 3), so large percentage improvements reflect baseline dryness rather than a distinct responder phenotype.
5. Conclusions
Over two weeks of repeated application, the surface-to-deep hydration gap followed a non-monotonic course, widening after a single application and then narrowing by two weeks (per-subject |HGI| 13.1 → 18.0 → 5.1; group-mean 13.1 → 17.7 → 2.0), as a transient surface increase relaxed toward the 0.5 mm compartment, while the deeper readings remained essentially unchanged. The superficial and deep readings varied independently, surface-only assessment overstated volumetric change, and the acute surface-selective pattern was reproduced with a different surface instrument in the same cohort. By quantifying the non-monotonic change in the surface-to-0.5 mm gap over time, the HGI provides a compact operational index of surface-to-deep equilibration that surface-only methods cannot resolve, for use in future moisturization studies. The HGI is defined at the level of the instruments and is not interpreted here as a biological or barrier measurement. The findings motivate further work testing whether the HGI relates to barrier function—for example, against transepidermal water loss (TEWL)—and on the surface response as a combined immediate-and-maintained superficial benefit.
Supplementary Materials
The following supporting information can be downloaded at: https://www.mdpi.com/article/10.3390/cosmetics13050234/s1, Figure S1: Participant flow diagram; Figure S2: Per-subject surface-hydration improvement map; Table S1: Complete statistical results across timepoints.
Author Contributions
Conceptualization, W.H. and H.K.; methodology, Y.K. (Youngrin Kwag) and S.H.O.; software, S.h.K.; validation, Y.K. (Youngrin Kwag) and S.H.O.; formal analysis, Y.K. (Youngrin Kwag) and S.H.O.; investigation, Y.K. (Youngrin Kwag), J.H.B., H.J. and Y.K. (YooRi Kang); resources, W.H.; data curation, J.H.B. and H.J.; writing—original draft preparation, Y.K. (Youngrin Kwag); writing—review and editing, W.H. and H.K.; visualization, S.H.O.; supervision, W.H.; project administration, H.K. and Y.K. (YooRi Kang). All authors have read and agreed to the published version of the manuscript.
Funding
This research received no external grant funding. The original clinical study was commissioned and funded by Layer By Layer Co., Ltd. (Republic of Korea) (no grant/award number applicable). The funder had no role in the design of this analysis, the interpretation of the data, the writing of the manuscript, or the decision to publish.
Institutional Review Board Statement
The study was conducted in accordance with the Declaration of Helsinki and approved by the Institutional Review Board of Human Skin Clinical Trial Center Co., Ltd. (HM-IRB-P26-0353; approved 23 March 2026).
Informed Consent Statement
Informed consent was obtained from all subjects involved in the study.
Data Availability Statement
The data presented in this study are available on request from the corresponding author.
Acknowledgments
During the preparation of this manuscript, the authors used Anthropic’s Claude (Claude Opus 4.8) to assist with English-language editing and manuscript preparation. The authors reviewed and edited all content and take full responsibility for the final manuscript.
Conflicts of Interest
All authors are affiliated with Human Skin Clinical Trial Center Co., Ltd. Hongseok Kim is the employee of VOS Dermatology Clinic. Wonkyu Hong is the employee of Classone Clinic. The original clinical data were collected in a cosmetic efficacy trial commissioned and supported by Layer By Layer Co., Ltd. As the commissioning party, the sponsor was involved in the original trial design and data collection. The sponsor had no role in the design of this analysis, the interpretation of data, the writing of the manuscript, or the decision to publish; all analyses were performed independently by the authors. No other conflicts of interest are declared.
References
- Rajkumar, J.; Chandan, N.; Lio, P.; Shi, V. The skin barrier and moisturization: Function, disruption, and mechanisms of repair. Skin Pharmacol. Physiol. 2023, 36, 174–185. [Google Scholar] [CrossRef] [Scilit] [PubMed]
- Verdier-Sevrain, S.; Bonte, F. Skin hydration: A review on its molecular mechanisms. J. Cosmet. Dermatol. 2007, 6, 75–82. [Google Scholar] [CrossRef] [Scilit] [PubMed]
- Berardesca, E.; EEMCO Group. EEMCO guidance for the assessment of stratum corneum hydration: Electrical methods. Skin Res. Technol. 1997, 3, 126–132. [Google Scholar] [CrossRef] [Scilit] [PubMed]
- Clarys, P.; Clijsen, R.; Taeymans, J.; Barel, A.O. Hydration measurements of the stratum corneum: Comparison between the capacitance method (Corneometer CM 825) and the impedance method (Skicon-200EX). Skin Res. Technol. 2012, 18, 316–323. [Google Scholar] [CrossRef] [Scilit] [PubMed]
- Barel, A.O.; Clarys, P. In vitro calibration of the capacitance method (Corneometer CM 825) and conductance method (Skicon-200). Skin Res. Technol. 1997, 3, 107–113. [Google Scholar] [CrossRef] [Scilit] [PubMed]
- Fluhr, J.W.; Voisard, A.; Nikolaeva, D.G.; Herzog, L.; Wiora, G.; Gayer, J.; Lehmann, N.J.; Darlenski, R. Stratum corneum hydration measurements with a Bluetooth wireless probe: A real-life study at home compared to measurements under laboratory conditions. Skin Pharmacol. Physiol. 2024, 37, 40–48. [Google Scholar] [CrossRef] [Scilit] [PubMed]
- Crowther, J.M.; Matts, P.J. In vivo confocal Raman spectroscopy: The window into the skin. Int. J. Cosmet. Sci. 2024, 46, 603–609. [Google Scholar] [CrossRef] [Scilit] [PubMed]
- Constantin, M.M.; Poenaru, E.; Poenaru, C.; Constantin, T. Skin hydration assessment through modern non-invasive bioengineering technologies. Maedica 2014, 9, 33–38. [Google Scholar] [PubMed]
- Berardesca, E.; Loden, M.; Serup, J.; Masson, P.; Rodrigues, L.M. The revised EEMCO guidance for the in vivo measurement of water in the skin. Skin Res. Technol. 2018, 24, 351–358. [Google Scholar] [CrossRef] [Scilit] [PubMed]
- Nuutinen, J.; Ikaheimo, R.; Lahtinen, T. Validation of a new dielectric device to assess changes of tissue water in skin and subcutaneous fat. Physiol. Meas. 2004, 25, 447–454. [Google Scholar] [CrossRef] [Scilit] [PubMed]
- Lahtinen, T.; Nuutinen, J.; Alanen, E. Dielectric properties of the skin. Phys. Med. Biol. 1997, 42, 1471–1472. [Google Scholar] [CrossRef] [Scilit] [PubMed]
- Alanen, E.; Lahtinen, T.; Nuutinen, J. Penetration of electromagnetic fields of an open-ended coaxial probe between 1 MHz and 1 GHz in dielectric skin measurements. Phys. Med. Biol. 1999, 44, N169–N176. [Google Scholar] [CrossRef] [Scilit] [PubMed]
- Mayrovitz, H.N.; Bernal, M.; Carson, S. Gender differences in facial skin dielectric constant measured at 300 MHz. Skin Res. Technol. 2012, 18, 504–510. [Google Scholar] [CrossRef] [Scilit] [PubMed]
- Mayrovitz, H.N. Assessing free and bound water in skin at 300 MHz using tissue dielectric constant measurements with the MoistureMeterD. In Lymphedema; Springer: Cham, Switzerland, 2015; pp. 133–148. [Google Scholar] [CrossRef] [Scilit]
- La Gioia, A.; Porter, E.; Merunka, I.; Shahzad, A.; Salahuddin, S.; Jones, M.; O’Halloran, M. Open-ended coaxial probe technique for dielectric measurement of biological tissues. Diagnostics 2018, 8, 40. [Google Scholar] [CrossRef] [Scilit] [PubMed]
- Caspers, P.J.; Lucassen, G.W.; Carter, E.A.; Bruining, H.A.; Puppels, G.J. In vivo confocal Raman microspectroscopy of the skin: Noninvasive determination of molecular concentration profiles. J. Investig. Dermatol. 2001, 116, 434–442. [Google Scholar] [CrossRef] [Scilit] [PubMed]
- Caspers, P.J.; Lucassen, G.W.; Bruining, H.A.; Puppels, G.J. Automated depth-scanning confocal Raman microspectrometer for rapid in vivo determination of water concentration profiles in human skin. J. Raman Spectrosc. 2000, 31, 813–818. [Google Scholar] [CrossRef] [Scilit]
- Darvin, M.E.; Schleusener, J.; Lademann, J.; Choe, C.S. Current views on noninvasive in vivo determination of physiological parameters of the stratum corneum using confocal Raman microspectroscopy. Skin Pharmacol. Physiol. 2022, 35, 125–136. [Google Scholar] [CrossRef] [Scilit] [PubMed]
- Lee, H.J.; Park, S.R.; Kwon, D.I.; Park, M.S.; Lim, D.H. Depth profiling of epidermal hydration inducing improvement of skin roughness and elasticity: In vivo study by confocal Raman spectroscopy. J. Cosmet. Dermatol. 2022, 21, 4810–4817. [Google Scholar] [CrossRef] [Scilit] [PubMed]
- Blank, I.H. Factors which influence the water content of the stratum corneum. J. Investig. Dermatol. 1952, 18, 433–440. [Google Scholar] [CrossRef] [Scilit] [PubMed]
- Rawlings, A.V.; Matts, P.J. Stratum corneum moisturization at the molecular level: An update in relation to the dry skin cycle. J. Investig. Dermatol. 2005, 124, 1099–1110. [Google Scholar] [CrossRef] [Scilit] [PubMed]
- Harding, C.R.; Watkinson, A.; Rawlings, A.V.; Scott, I.R. Dry skin, moisturization and corneodesmolysis. Int. J. Cosmet. Sci. 2000, 22, 21–52. [Google Scholar] [CrossRef] [Scilit] [PubMed]
- Loden, M. Role of topical emollients and moisturizers in the treatment of dry skin barrier disorders. Am. J. Clin. Dermatol. 2003, 4, 771–788. [Google Scholar] [CrossRef] [Scilit] [PubMed]
- Loden, M.; Andersson, A.C.; Lindberg, M. Improvement in skin barrier function in patients with atopic dermatitis after treatment with a moisturizing cream (Canoderm). Br. J. Dermatol. 1999, 140, 264–267. [Google Scholar] [CrossRef] [Scilit] [PubMed]
- Froebe, C.L.; Simion, F.A.; Ohlmeyer, H.; Mattai, J.; Rhein, L.D.; Friberg, S.E. Prevention of stratum corneum lipid phase transitions in vitro by glycerol. J. Soc. Cosmet. Chem. 1990, 41, 51–65. [Google Scholar]
- Yosipovitch, G.; Xiong, G.L.; Haus, E.; Sackett-Lundeen, L.; Ashkenazi, I.; Maibach, H.I. Time-dependent variations of the skin barrier function in humans. J. Investig. Dermatol. 1998, 110, 20–23. [Google Scholar] [CrossRef] [Scilit] [PubMed]
- Bohling, A.; Bielfeldt, S.; Himmelmann, A.; Keskin, M.; Wilhelm, K.P. Comparison of the stratum corneum thickness measured in vivo with confocal Raman spectroscopy and confocal reflectance microscopy. Skin Res. Technol. 2014, 20, 50–57. [Google Scholar] [CrossRef] [Scilit] [PubMed]
- Yoo, S.; Kim, J.; Jeong, E.T.; Hwang, S.J.; Kang, N.G.; Lee, J. Penetration rates into the stratum corneum layer: A novel quantitative indicator for assessing skin barrier function. Skin Res. Technol. 2024, 30, e13655. [Google Scholar] [CrossRef] [Scilit] [PubMed]
- Paye, M.; Van de Gaer, D.; Morrison, B.M. Corneometry measurements to evaluate skin dryness in the modified soap chamber test. Skin Res. Technol. 1995, 1, 123–127. [Google Scholar] [CrossRef] [Scilit] [PubMed]
- Purnamawati, S.; Indrastuti, N.; Danarti, R.; Saefudin, T. The role of moisturizers in addressing various kinds of dermatitis: A review. Clin. Med. Res. 2017, 15, 75–87. [Google Scholar] [CrossRef] [Scilit] [PubMed]

Disclaimer/Publisher’s Note: The statements, opinions and data contained in all publications are solely those of the individual author(s) and contributor(s) and not of MDPI and/or the editor(s). MDPI and/or the editor(s) disclaim responsibility for any injury to people or property resulting from any ideas, methods, instructions or products referred to in the content. |
© 2026 by the authors. Licensee MDPI, Basel, Switzerland. This article is an open access article distributed under the terms and conditions of the Creative Commons Attribution (CC BY) license.