


Abstract
This study investigates hydroclimatic variability and water balance dynamics in the Akmola region during 2003–2023 using observations from 16 meteorological stations. The study evaluates changes in air temperature, precipitation, reference evapotranspiration (ET0), climatic water balance, and drought conditions. Reference evapotranspiration was calculated using the FAO-56 Penman–Monteith method, while drought variability was assessed using the 12-month Standardized Precipitation–Evapotranspiration Index (SPEI-12). Temporal trends were analyzed using the Mann–Kendall test and Sen’s slope estimator. The results revealed significant spatial heterogeneity in hydroclimatic conditions across the region. Air temperature showed a consistent increasing trend at most stations, accompanied by increasing atmospheric evaporative demand. All stations were characterized by a persistently negative climatic water balance, with mean annual values of approximately −750 mm, indicating a regional moisture deficit. Reference evapotranspiration exhibited significant spatial variability, with the highest values observed in the southern and central parts of the region. Precipitation remained the dominant control of water balance variability (r = 0.79–0.96), while increasing temperature intensified moisture deficits through increased evapotranspiration. SPEI-12 indicated recurrent drought episodes and increasing drought vulnerability associated with warming-induced atmospheric water demand. The study demonstrates that increasing evapotranspiration is becoming a major driver of water stress in the Akmola region and highlights the importance of integrating climatic water balance and SPEI indicators for drought monitoring and climate adaptation in semi-arid steppe regions.
1. Introduction
Climate change is fundamentally altering hydrological cycles worldwide, with significant consequences for water availability, drought occurrence, and ecosystem stability. Arid and semi-arid regions, such as Central Asia, are particularly sensitive to changes in temperature and precipitation due to their already limited and highly variable water resources. Observational and model-based studies indicate that Central Asia is experiencing significant warming along with shifting rainfall patterns, which are projected to intensify drought frequency, duration, and severity under future climate scenarios [1]. Similar hydroclimatic conditions are observed in the Eurasian steppe, parts of Inner Mongolia, the Canadian Prairies, and semi-arid continental regions of Eastern Europe.
Global climate change has emerged as one of the most critical environmental challenges of the 21st century, driving significant alterations in temperature regimes, precipitation patterns, the occurrence of extreme weather events, and stability of hydrological processes worldwide [2]. Regions with continental climates, and Kazakhstan in particular, are exceptionally sensitive to these changes due to their inherent aridity, large seasonal temperature ranges, and limited water resources. Observations and climate model projections consistently indicate that Kazakhstan is warming at a rate exceeding the global average, accompanied by increasingly variable precipitation and a higher frequency of drought events [3,4].
Socio-economic development of Kazakhstan is closely tied to its hydroclimatic conditions. Agriculture, a key economic sector and source of employment in rural regions, depends on reliable water availability and favorable growing conditions. However, climate change poses multifaceted challenges for agricultural productivity, water security, and ecosystem sustainability across the country, particularly in semi-arid northern and central regions [5]. Increased evapotranspiration and prolonged dry periods result in negative water balances, reducing soil moisture, altering streamflow regimes, and exacerbating water stress in both irrigated and rainfed systems [6].
Adaptation to climate change has therefore become a national priority. The Government of the Republic of Kazakhstan has developed strategic frameworks, including the National Climate Change Adaptation Plan, aiming to strengthen resilience in the water, agricultural, and environmental sectors. These policies emphasize early warning systems for drought, improved water management, and the introduction of climate-smart agricultural practices. However, the effectiveness of adaptation strategies is contingent on robust scientific understanding of regional climate trends and hydroclimatic dynamics [7,8].
Evapotranspiration (ET0), the atmospheric demand for water from soil and vegetation, is a critical component of the hydrological cycle that is highly sensitive to temperature and radiation changes. Variation in ET0 and its interaction with precipitation determine water balance conditions, thereby influencing both hydrological drought and agricultural water stress. Previous work in arid regions has shown that seasonal fluctuations in evapotranspiration and spatial differences in water use efficiency significantly affect water availability and drought vulnerability [9].
In Kazakhstan, trends toward rising mean values of the surface air temperatures have been documented over the past several decades, while precipitation patterns remain spatially and temporally variable. Such circumstances proved to considerably influence drought dynamics. For example, a recent analysis using standardized drought indices (SPI and SPEI) showed that annual mean surface temperature increased significantly during the 1950–2020 period, with corresponding variability in drought conditions affecting wheat cultivation outcomes [10]. The climate of the Akmola region creates a structural water deficit, in which precipitation does not compensate for moisture loss due to evapotranspiration. Snow cover plays a major role in forming the water balance, and the stability of hydrological systems depends on the duration of winter and the volume of spring floods [11].
The Standardized Precipitation–Evapotranspiration Index (SPEI) integrates both precipitation input and atmospheric evaporative demand, making it a more comprehensive drought indicator than precipitation-only indices. SPEI has been widely used to analyze spatiotemporal patterns of dry and wet conditions, revealing distinct historical drought phases and shifts in hydrological regimes across Central Asia [12].
Despite these advances, there remains a lack of comprehensive multi-station studies in the Akmola region that simultaneously assess variability during 2003–2023 trends in temperature, precipitation, ET0, water balance, and SPEI. Most existing regional studies focus either on a single variable or on broad Central Asian scales, limiting the understanding of local and intra-regional hydroclimatic variability. Moreover, the specific responses of water balance dynamics and drought severity to changing climate drivers in the Akmola region have not been fully characterized. This gap hampers the development of effective water management and agricultural adaptation strategies in the region, which may pose a great risk because water resources are critical for socio-economic stability and food security in the Akmola region.
Scientific assessments of the impact of climate change in Kazakhstan have documented significant warming trends, with the strongest signals observed in winter and spring seasons, while changes in precipitation exhibit spatial heterogeneity with no consistent long-term trend at the national scale [13]. At the same time, drought risk—often quantified through drought indices such as the Standardized Precipitation–Evapotranspiration Index (SPEI)—shows increasing severity and duration in many parts of the country, reflecting the coupled influence of increased atmospheric evaporative demand and rainfall variability [14].
Much of the existing literature focuses on individual climate variables (e.g., temperature or precipitation alone) or considers only a few monitoring locations. Few studies have concurrently analyzed multiple hydroclimatic components (including evapotranspiration, water balance, and drought indicators like SPEI) across a sufficiently dense network of meteorological stations to capture spatial heterogeneity across the diverse landscapes of Kazakhstan. Furthermore, there is a relative scarcity of studies that explicitly link these hydroclimatic trends to practical adaptation measures such as water resource planning, agricultural decision-making, and drought risk reduction strategies.
1.1. Objective
This study evaluates hydroclimatic responses to observed warming-related changes in a cold semi-arid continental region, using the Akmola region as a case study. The Akmola region represents a typical cold semi-arid continental agro-climatic system of the Eurasian steppe. By analyzing multi-decadal observational records, we identify spatial and temporal trends in hydroclimatic variables and evaluate how variations in water availability and drought severity have evolved. The results provide insights into recent hydroclimatic variability in the Akmola region and may contribute to future drought monitoring and water-resource assessments.
Semi-arid steppe ecosystems are highly dependent on water balance stability, making them particularly sensitive to changes in atmospheric evaporative demand. Increasing evapotranspiration under warming conditions may alter soil moisture regimes, vegetation productivity, and ecosystem resilience. Despite growing recognition of climate-driven hydroclimatic shifts, the number of studies examining their ecological implications in continental dryland steppe systems (Central Asia being a representative of such systems) remains limited. Understanding of the underlying connection between these phenomena is essential to assess ecosystem vulnerability and keep variability sustainable.
In this context, the present study aims to characterize recent hydroclimatic variability in the Akmola region by examining changes in air temperature, precipitation, reference evapotranspiration (ET0), climatic water balance, and SPEI. By integrating these variables, we seek to elucidate spatial and temporal patterns of water availability and drought risk, thereby contributing to the scientific evidence base needed for effective climate hydroclimatic variability in the region.
1.2. Research Questions
What are the hydroclimatic variabilities in air temperature, precipitation, reference evapotranspiration (ET0), climatic water balance, and SPEI across the Akmola region?
How do the magnitude and direction of hydroclimatic trends vary among meteorological stations within the Akmola region?
What do observed changes in ET0, climatic water balance, and SPEI indicate about recent changes in regional water availability and drought conditions?
2. Materials and Methods
2.1. Study Area
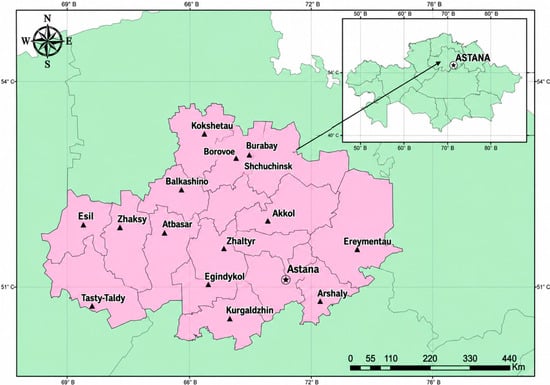
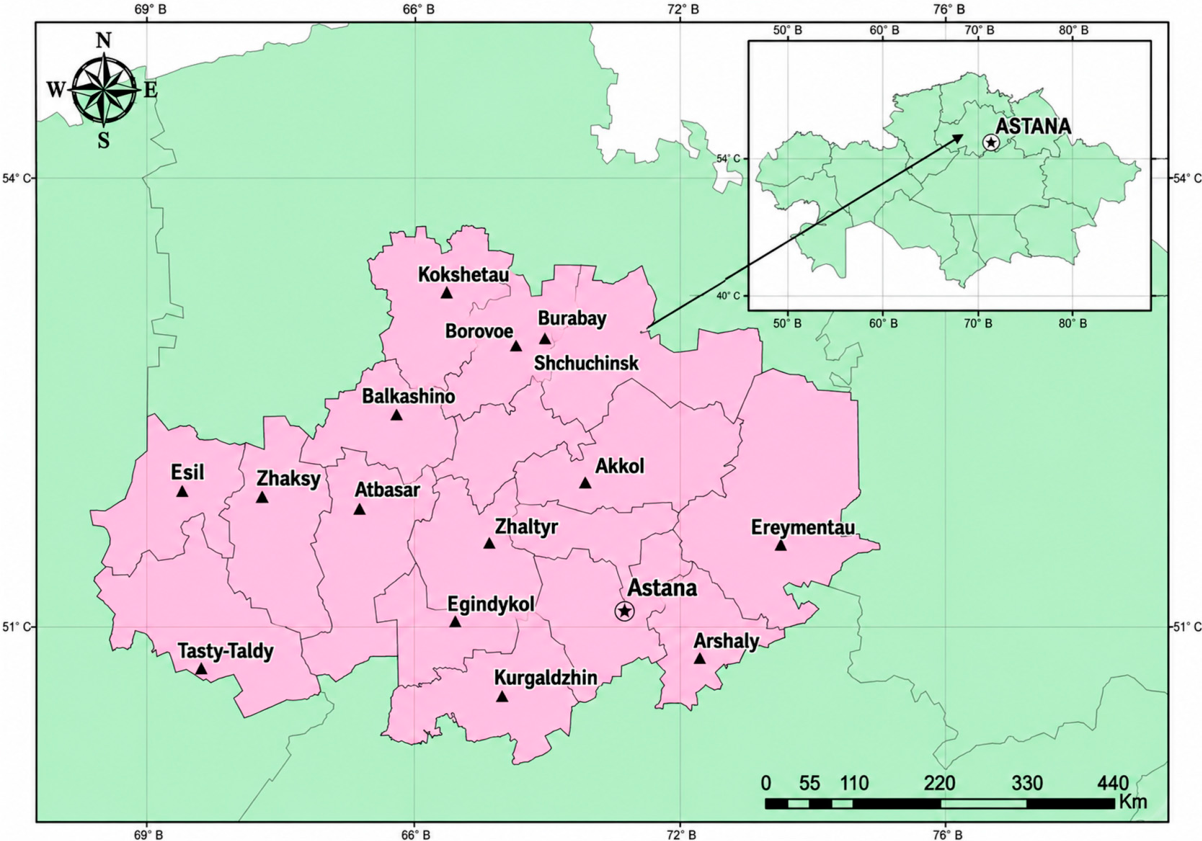
The Akmola region was selected as the study area as it represents vast dryland agricultural regions of Central Asia and analogous continental interiors worldwide (Figure 1).
Figure 1.
Study area and locations of weather stations in the Akmola region.
2.1.1. Climatic Conditions of Akmola Region
The Akmola Region is characterized by a sharply continental, arid climate, with hot summers and cold winters. Daily and annual temperature ranges may vary quite substantially. The average annual air temperature is approximately +2 to +4 °C. In winter, temperatures typically drop to −14 to −18 °C and may fall down to −40 °C or below during years with severe frost. In summer, average July temperatures range from +18 to +22 °C, with occasional hot days reaching +35 to +40 °C. This pronounced continental climate has a significant impact on the water balance: cold winters promote snow accumulation, whereas hot summers increase evapotranspiration.
Depending on the zone and topography, the average annual precipitation may fluctuate from approximately 250 to 300 mm/year. Most of the precipitation occurs during the warm period, primarily in summer (June–August). Precipitation during winter is limited; therefore, snow cover plays a crucial role in the hydrological regime. Snow accumulates during winter, and spring snowmelt becomes a key natural factor in recharging surface and groundwater resources. This process is particularly important under conditions of insufficient summer moisture.
The average wind speed in the region is approximately 5–6 m/s. Westerly and southwesterly winds prevail, especially during the warm season. These winds increase evapotranspiration and contribute to additional moisture loss, thereby increasing the regional moisture deficit. Due to low precipitation combined with high summer temperatures and strong winds, the region experiences persistent moisture losses (evapotranspiration and wind-driven drying) which significantly exceed water input from precipitation.
Winter and spring snowmelt become critical for maintaining the regional water balance. Snow represents the primary source of water recharge for rivers, groundwater, and soil moisture. In contrast, summer precipitation, even when present, often evaporates rapidly and contributes little to sustainable water recharge. As a result, its effectiveness in replenishing water resources is limited.
The Akmola region exhibits a sharply continental, arid climate that restricts atmospheric moisture input. Under such conditions, snow accumulation and subsequent melting are key factors in sustaining rivers, groundwater, and soil moisture. Summer is characterized by intensified evapotranspiration and moisture loss, which further exacerbates the moisture deficit. Therefore, seasonal dynamics must be considered when assessing the water balance: winter snow accumulation and spring melt represent a critical moisture reserve, whereas summer precipitation only partially compensates for evapotranspiration losses [15].
2.1.2. Hydrological and Climatic Data
Climate data was collected from the weather stations of the Akmola region (Figure 1). The geographical locations of the weather stations are given in Figure 1 and Table 1.
Table 1.
Geographical coordinates and elevations of weather stations in the Akmola region.
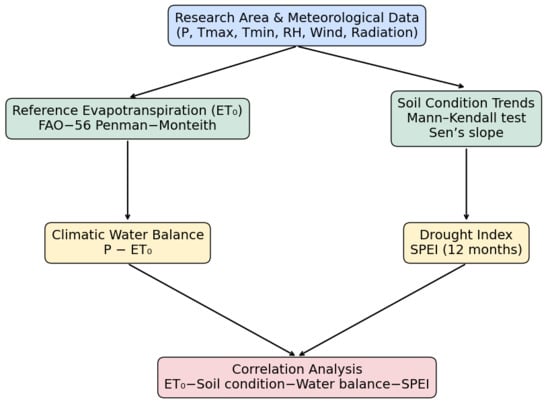
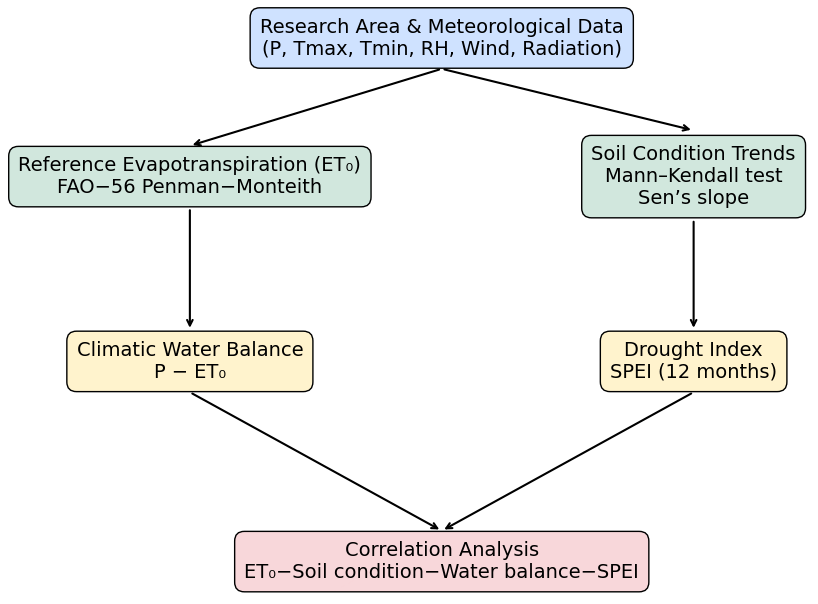
Figure 2 illustrates the conceptual methodological framework of the study.
Figure 2.
Methodological framework illustrating ET0, soil surface conditions, climatic water balance and SPEI and correlation analysis.
Elevation values for all meteorological stations were consistently derived from the Shuttle Radar Topography Mission (SRTM) digital elevation model (NASA) using station coordinates obtained via Google Earth Pro. This approach ensures methodological consistency and comparability across all stations. The SRTM dataset (NASA, 2000) was used as the elevation data source [16].
2.1.3. Data Quality Control and Limitations
Prior to analysis, all meteorological datasets were subjected to quality control procedures. The data was screened for missing values, internal consistency, and potential recording errors. Time series were visually inspected to identify unrealistic values and abrupt discontinuities that could indicate measurement or data-entry errors.
Missing observations represented less than 5% of the complete dataset. To ensure consistency among variables used in correlation and trend analyses, records containing missing values were removed using the listwise deletion approach. In total, 27 observations were excluded from the analyses, corresponding to 3.5% of the available records. Given the relatively small proportion of missing data, the influence of data removal on the overall statistical results is expected to be minimal. Consistency checks were performed by comparing the ranges and temporal behavior of temperature, precipitation, relative humidity, wind speed, and other meteorological variables among neighboring stations. No systematic inconsistencies were identified.
Because the study relied on officially archived observations provided by Kazhydromet, no additional homogenization procedures were applied. The analyses therefore used the original observational records after quality screening and removal of incomplete observations. The study period does not meet the conventional 30-year climatological baseline and therefore the results should be interpreted as recent hydroclimatic trends rather than long-term climate normals. The climatic water balance (P − ET0) represents atmospheric water deficit rather than a complete hydrological water balance, because runoff, groundwater exchange, and storage changes were not included.
The study did not include analyses of snow depth, snow-water equivalent, snow-cover duration, soil moisture observations, runoff measurements, or groundwater dynamics. Therefore, conclusions regarding hydrological processes and snowmelt contributions should be interpreted cautiously.
2.2. Methods
Meteorological data was collected from regional weather stations. Trends in soil surface conditions were assessed using the Mann–Kendall test. Reference evapotranspiration (ET0) was calculated using the FAO-56 Penman Monteith method. Climatic water balance and the drought index (SPEI) were subsequently estimated. Data processing included statistical analysis, trend estimation, evapotranspiration calculation, SPEI computation, and climatic water balance modeling.
2.2.1. Trend Analysis Using the Mann–Kendall Test and Sen’s Slope Estimator
To evaluate hydroclimatic variability during 2003–2023 trends in soil surface conditions, we applied the non-parametric Mann–Kendall (MK) test. This test is widely used in hydrology and climatology to detect monotonic trends in environmental time series because it does not require normality, is robust to outliers, and can be applied in the presence of missing values.
Data on soil surface condition was obtained from routine meteorological observations and recorded using standardized coding schemes applied at meteorological stations. These codes follow internationally recognized classification systems established by the World Meteorological Organization (WMO), where numerical codes represent different surface states [17].
For analytical purposes, the original codes were grouped into three categories, (1) frozen soil (codes 7–9), (2) extremely dry soil (code 6), and (3) wet or flooded soil (codes 3–5), following commonly used aggregation approaches in climatological studies. Aggregation was performed to reduce the number of categories and focus on major hydroclimatically relevant surface states. The observations were collected through the national meteorological network following standardized WMO observation protocols, which minimize observer-related inconsistencies.
For each category, annual totals were calculated from daily observations obtained from national climate stations [11], resulting in one time series per category for the study period. These annual series were subsequently subjected to trend analysis. It should be noted that this classification is based on observed soil surface conditions rather than direct air temperature measurements, which explains the relatively low frequency of extremely dry days in the dataset.
The Mann–Kendall test evaluates the null hypothesis of no monotonic trend against the alternative hypothesis of an increasing or decreasing trend. If x1, x2, …, xn represent a time series of length n, the Mann–Kendall statistic S is defined as Equation (1):
where j > i. The sign function is sgn(x) = 1 if x > 0, sgn(x) = 0 if x = 0, and sgn(x) = −1 if x < 0.
For n > 10, the statistic S is approximately normally distributed with a mean of zero and a variance corrected for ties. The standardized normal statistic Z is calculated, and the null hypothesis of no trend is rejected when |Z| > Zα/2 at a significance level of α = 0.05.
To quantify the magnitude of the detected trend, Sen’s slope estimator was applied. Sen’s slope represents the median of all pairwise slopes between data points and is defined as follows (Equation (2)):
where β is the Sen’s slope estimator, xi and xj are data values at time steps i and j, respectively, and i > j. A positive β indicates an increasing trend, while a negative β indicates a decreasing trend. All calculations were performed in Python 3.11.5. Annual counts of soil surface condition categories were computed using the pandas library, while the Mann–Kendall test and Sen’s slope estimator were implemented using the pymannkendall package [18,19].
2.2.2. Potential Evapotranspiration (ET0) Calculation Using the FAO-56 Penman–Monteith Equation
Reference evapotranspiration (ET0) was calculated using the FAO-56 Penman–Monteith method, which is widely recommended as the standard approach for estimating atmospheric evaporative demand over a reference grass surface. The Penman–Monteith equation incorporates air temperature, net radiation, wind speed, and humidity, enabling a physically based estimation of atmospheric evaporative demand. Reference evapotranspiration (ET0) was calculated using meteorological data obtained from Kazhydromet stations. It should be noted that actual evapotranspiration (ET) was not estimated in this study, due to the absence of crop-specific coefficients (Kc), and the analysis was therefore limited to reference evapotranspiration (ET0).
Although generic FAO crop coefficients are available for grassland ecosystems, they were not applied, because vegetation cover, land use, grazing intensity, and seasonal vegetation development differ substantially among meteorological stations. The use of a single generic Kc value would therefore introduce additional uncertainty and could bias comparisons among stations. Since the objective of this study was to assess atmospheric evaporative demand and spatial hydroclimatic variability under standardized conditions, ET0 was considered a more appropriate indicator than estimated actual evapotranspiration.
The FAO Penman–Monteith equation integrates the effects of net radiation, air temperature, wind speed, and vapor pressure deficit, and is expressed as follows (Equation (3)):
where ET0 is the reference evapotranspiration (mm day−1), Rn is the net radiation at the crop surface (MJ m−2 day−1), G is the soil heat flux density (MJ m−2 day−1), T is the mean daily air temperature measured at 2 m above ground (°C), u2 is the wind speed measured at 2 m above ground (m s−1), es is the saturation vapor pressure (kPa), ea is the actual vapor pressure (kPa), Δ is the slope of the saturation vapor pressure–temperature curve (kPa °C−1), and γ is the psychrometric constant (kPa °C−1).
The saturation vapor pressure (es) was computed from daily maximum and minimum air temperatures using the Tetens equation, while actual vapor pressure (ea) was derived from relative humidity data. The slope of the saturation vapor pressure curve (Δ) was calculated as a function of air temperature, and the psychrometric constant (γ) was determined from atmospheric pressure derived from station elevation. Net radiation (Rn) was estimated from incoming shortwave radiation and outgoing longwave radiation following FAO-56 procedures. For daily and monthly time steps, the soil heat flux (G) was assumed to be negligible, in accordance with FAO-56 guidelines. The calculations were performed at the temporal resolution corresponding to available observations and were subsequently aggregated to monthly and annual scales for analysis. The FAO-56 Penman–Monteith method was selected due to its physical basis and broad applicability across climates, allowing consistent comparison among meteorological stations in the study region [20,21].
Wind speed was measured at the standard meteorological height of 2 m, and relative humidity was obtained from daily observations [11]. Solar radiation was estimated using empirical relationships based on air temperature and sunshine duration, following FAO-56 recommendations [22]. The adopted procedure follows FAO-56 recommendations and is widely applied when direct radiation observations are unavailable. Meteorological data was obtained from Kazhydromet stations, which provide publicly available observations. Data for each station and year were manually collected and compiled into a unified dataset for analysis.
2.2.3. Water Balance Calculation
The climatic water balance was calculated as the difference between precipitation and reference evapotranspiration. This indicator reflects the net availability of atmospheric water resources and is widely used to assess moisture surplus or deficit conditions at different temporal scales.
The water balance (WB) was computed according to Equation (4):
where WB is the climatic water balance (mm), P is precipitation (mm), and ET0 is the reference evapotranspiration (mm) estimated using the FAO-56 Penman–Monteith method.
Positive WB values indicate moisture surplus conditions, whereas negative WB values indicate water deficit and potential drought stress. Monthly water balance values were calculated using monthly sums of precipitation and ET0, while annual values were obtained by aggregating the corresponding monthly totals.
For stations where additional hydrological components were unavailable, a simplified climatic water balance approach was applied. In hydrological terms, the full water balance can be written as Equation (5):
where Q represents runoff and ΔS denotes changes in water storage in soil and surface or groundwater reservoirs. Due to data limitations regarding runoff and storage changes at the station scale, the water balance in this study was assessed in its simplified form as P − ET0, which is commonly applied in regional climate and drought analyses.
The calculated water balance values were further analyzed to identify temporal trends and periods of moisture deficit or surplus, and to relate these patterns to variations in the Standardized Precipitation–Evapotranspiration Index (SPEI), precipitation, and evapotranspiration across the study region [23].
2.2.4. Calculation of the Standardized Precipitation–Evapotranspiration Index (SPEI)
The Standardized Precipitation–Evapotranspiration Index (SPEI) was used to characterize drought severity, duration, and frequency. SPEI is a multiscalar drought index that integrates atmospheric water supply (precipitation) and atmospheric water demand (evapotranspiration), thereby enabling the assessment of climatic water balance anomalies under changing climate conditions [24].
Previous research highlights the urgent need for reliable drought forecasts under accelerating global warming. Although CMIP6 models reproduce global average drought behavior reasonably well, they exhibit significant regional deviations, particularly in historically drought-prone areas. Future projections indicate a marked increase in drought duration, frequency, and intensity, especially under higher warming scenarios.
Notably, drought intensification is often more pronounced when assessed using the SPEI compared to SPI. Under a 3 °C warming scenario, drought intensity is projected to increase across more than 90% of the territory according to the SPEI, whereas SPI suggests a more limited spatial extent. Similar discrepancies are observed in drought frequency and duration. These findings highlight the importance of incorporating evapotranspiration into drought assessments. The study also reveals contrasting regional responses: wet regions show potential improvement when assessed using SPI, while SPEI indicates worsening conditions. In dry regions, both indices indicate deterioration, although SPEI generally reflects a greater magnitude of change. Overall, these results underscore the increasing complexity of drought dynamics under climate change and the need for integrated mitigation and adaptation strategies [25].
SPEI was calculated based on the climatic water balance (D), defined as the difference between precipitation and reference evapotranspiration (Equation (6)):
where P is precipitation (mm) and ET0 is reference evapotranspiration (mm), estimated using the FAO-56 Penman–Monteith method. Monthly series of D were accumulated over 12-month time scales to capture long-term drought conditions relevant for agricultural and hydrological applications.
D = P − ET0,
The accumulated D series were then fitted to a three-parameter log-logistic probability distribution, as proposed in the original SPEI formulation. The cumulative probability of a given D value was then transformed into a standardized normal variable with zero mean and unit variance (Equation (7)):
where F(D) is the cumulative probability of the water balance value D obtained from the fitted distribution, and Φ−1 is the inverse of the standard normal cumulative distribution function. This standardization allows comparison of drought conditions across regions and time periods.
SPEI values were interpreted according to widely used drought severity classes, where values between −1.0 and −1.49 indicate moderate drought, −1.5 to −1.99 severe drought, and values ≤ −2.0 extreme drought, whereas positive values represent wet conditions. The index is particularly suitable for climate change assessments because it explicitly incorporates the effect of increasing evaporative demand on drought intensity.
The study utilized mean daily meteorological data derived from routine observations at Kazhydromet stations, including air temperature, relative humidity, wind speed, and precipitation. The statistical fitting and standardization procedures followed established SPEI methodology [26].
2.2.5. Correlation of Indicators and Comparison of Trend Lines of Indicators
Pearson correlation analysis was applied to assess the relationships between reference evapotranspiration (ET0), precipitation (P), air temperature (T), and climate water balance using monthly data over a 20-year period. The analysis was conducted separately for each station. The results are presented as heatmaps, illustrating the strength and direction of linear relationships between variables.
Correlation analysis was performed to identify relationships among key hydrometeorological variables influencing water balance and moisture conditions in the Akmola region. The Pearson correlation coefficient (r), widely used in climatological and hydrological studies for analyzing continuous time series, was employed to quantify linear relationships between variables. Analysis period: 20 years of observations.
Missing observations in the time series were identified during data preprocessing and handled using listwise deletion. Given the low proportion of missing data, this approach is unlikely to introduce bias or affect the reliability of the statistical analysis. Pearson correlation coefficients were used to quantify linear relationships among hydroclimatic variables.
Positive values of r indicate a direct relationship, whereas negative values indicate an inverse relationship between variables. Correlation results are visualized as heatmaps for each station. The color scale ranges from −1 (strong negative correlation) (blue) to +1 (strong positive correlation) (red), aiding in visual comparison of the strength and direction of relationships between variables. The strength of correlations was interpreted using conventional thresholds, where |r| < 0.40 indicates weak, 0.40–0.59 moderate, 0.60–0.79 strong, and ≥0.80 very strong relationships.
The choice of correlation analysis was driven by the need to identify the main climatic drivers of water balance, assess the role of temperature through evapotranspiration (ET0), identify the stability of precipitation-water balance and temperature, and compare regional differences in climatic mechanisms. This approach is widely used in studies of aridity, climatic water balance, and drought indices (SPEI), as it allows for the identification of both direct and indirect climatic influences. SPEI-12 was selected because the objective was to assess long-term hydroclimatic conditions rather than short-term agricultural drought.
3. Results
3.1. Soil Surface Condition Assessment
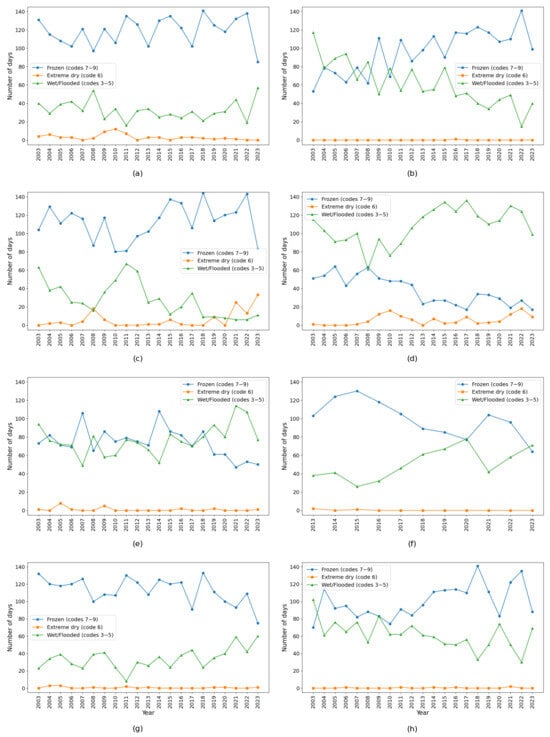
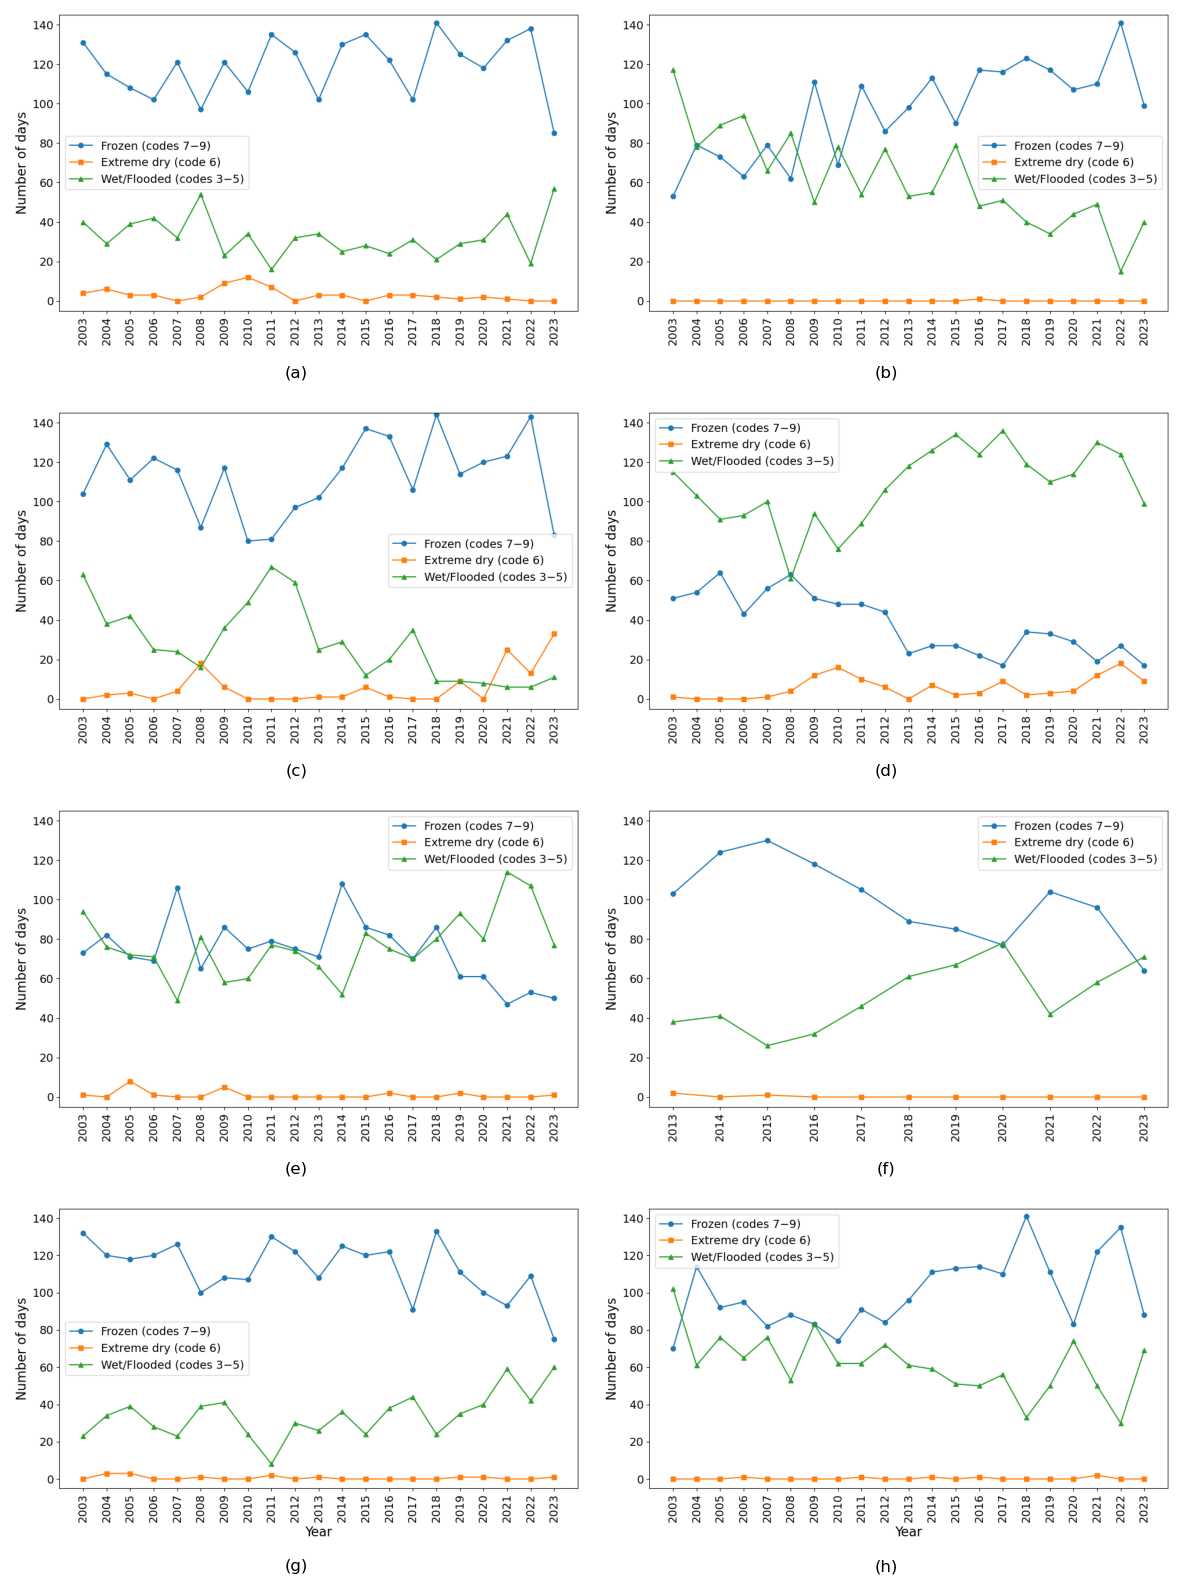
The assessment of soil surface conditions across meteorological stations in the Akmola region indicates that the studied locations exhibit statistically significant temporal changes regarding the categorization of their soil surface condition (p < 0.05). In Astana, the frequency of extremely dry soil days (code 6) exhibited a moderate monotonic behavior (τ = −0.40), accompanied by a statistically significant increasing trend (Sen’s slope = 0.63 days year−1, p = 0.001) (Figure 3).
Figure 3.
Yearly frequency of soil surface conditions in the Akmola region. Weather stations with significant trends data: (a) Astana, (b) Atbasar, (c) Borovoye, (d) Egindykol, (e) Ereymentau, (f) Esil, (g) Kokshetau, and (h) Shchuchinsk.
In Ereymentau, frozen soil days (codes 7–9) exhibited a significant decreasing trend (Sen’s slope = −1.32 days year−1, p = 0.05), with moderate monotonic behavior (τ = −0.32). In Kokshetau, wet and flooded soil surface conditions (codes 3–5) showed a statistically significant increasing trend (Sen’s slope = 1 days year−1, p = 0.02) with moderate monotonic behavior (τ = 0.39). In the Shchuchinsk station, frozen soil days (codes 7–9) exhibited a statistically significant increasing trend (Sen’s slope = 2 days year−1, p = 0.02) with moderate monotonic behavior (τ = 0.37). Shchuchinsk station also indicated a statistically significant decreasing trend (Sen’s slope = −1.59 days year−1, p = 0.003) regarding wet and flooded soil surface conditions (codes 3–5) with moderate monotonic behavior (τ = 0.48). In Atbasar, frozen soil days (codes 7–9) exhibited a statistically significant increasing trend (Sen’s slope = 3.14 days year−1, p = 0.0004) with strong monotonic behavior (τ = 0.56). Wet and flooded soil surface conditions (codes 3–5) in Atbasar station showed a significant decreasing trend (Sen’s slope = −3.17 days year−1, p = 0.00002), despite a relatively strong monotonic behavior (τ = 0.67) (Table 2).
Table 2.
Statistical data of the soil surface condition in the Akmola region weather stations.
In Borovoye, wet and flooded soil surface conditions (codes 3–5) exhibited a statistically significant decreasing trend (Sen’s slope = −1.9 days year−1, p = 0.0004) with strong monotonic behavior (τ = 0.56). In Egindykol, extremely dry soil days (code 6) exhibited a statistically significant increasing trend (Sen’s slope = 0.37 days year−1, p = 0.02) with moderate monotonic behavior (τ = 0.37). Wet and flooded soil surface conditions (codes 3–5) in Egindykol station also showed a statistically significant decreasing trend (Sen’s slope = −1.59 days year−1, p = 0.03) with moderate monotonic behavior (τ = 0.35). In Esil (Figure 3, Table 3), frozen soil days (codes 7–9) exhibited a statistically significant decreasing trend (Sen’s slope = −4.86 days year−1, p = 0.02) with strong monotonic behavior (τ = −0.56). Esil station also indicated a statistically significant increasing trend (Sen’s slope = 4.33 days year−1, p = 0.02) regarding wet and flooded soil surface conditions (codes 3–5), with strong monotonic behavior (τ = 0.56).
Table 3.
Correlation analysis of the condition of the soil and ET0.
For several stations, no statistically significant trends were detected in any soil surface condition category (p > 0.05), indicating relative temporal stability of soil surface conditions.
3.2. Monthly and Annual Water Balance Characteristics
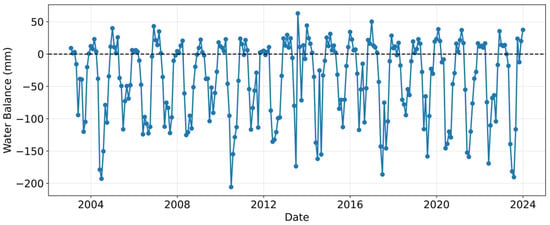
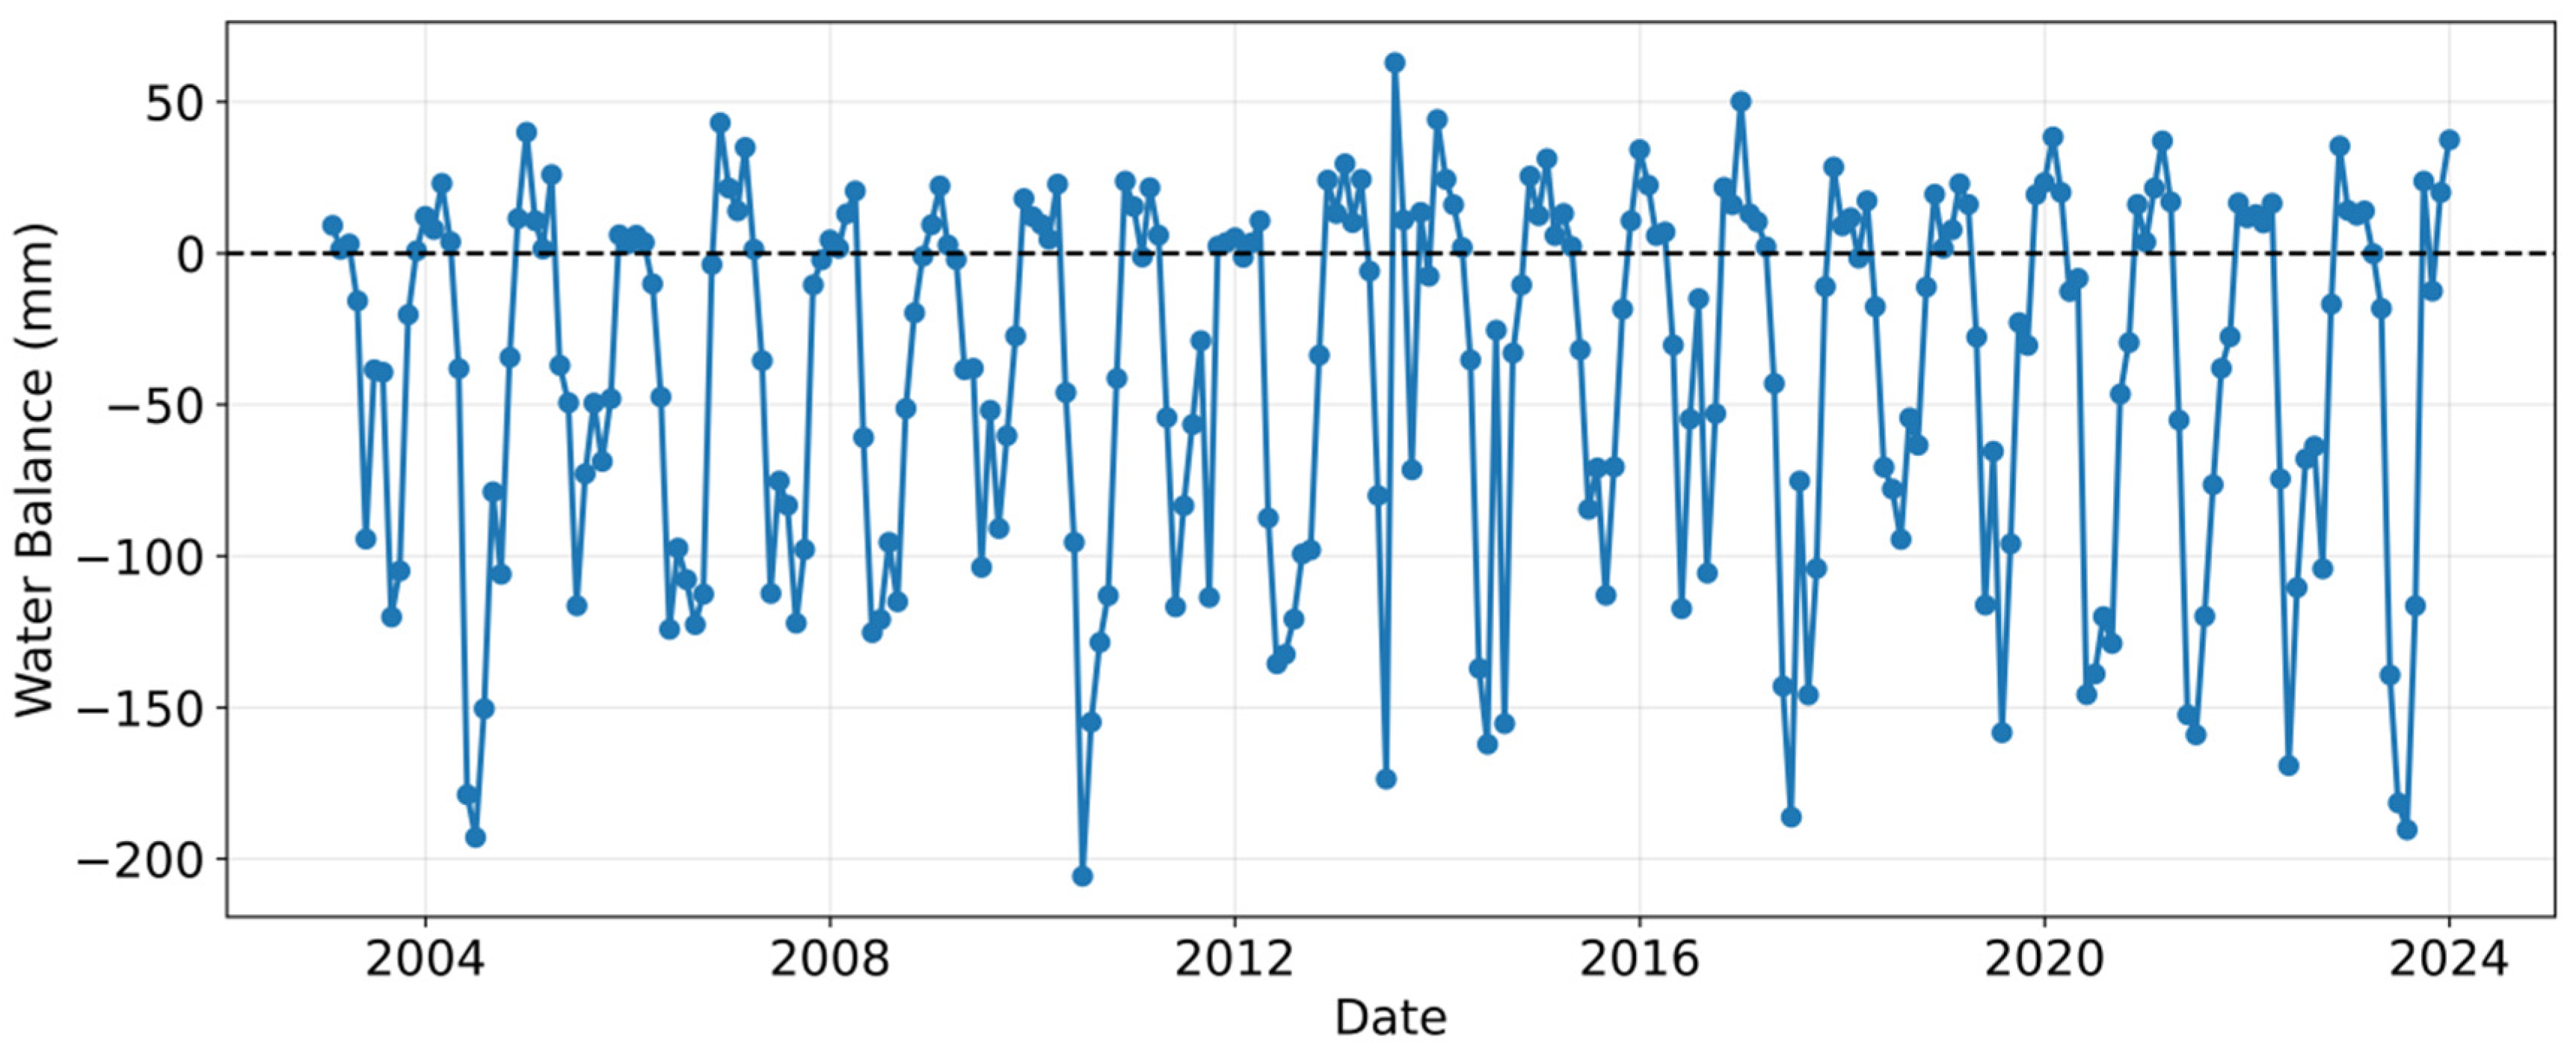
The analysis of the monthly climatic water balance revealed that all meteorological stations in the Akmola region are characterized by predominantly negative water balance conditions, indicating a persistent regional moisture deficit. In the Zhaltir station, monthly water balance values ranged from approximately +50 mm to −200 mm, with negative values prevailing during the spring, summer, and autumn seasons (Figure 3). These periods coincide with the main vegetation period, highlighting the strong coupling between high atmospheric evaporative demand and limited precipitation inputs.
The dominance of negative water balance during the warm months reflects the combined effect of relatively low precipitation and high reference evapotranspiration, which accelerate soil moisture depletion and increase drought stress. Such seasonal patterns are typical of continental and semi-arid climates, where evapotranspiration exceeds precipitation for most of the year, particularly under ongoing warming conditions.
Annual water balance values further confirm the persistence of moisture deficit variability. Although the overall trend remains negative, relatively less negative (i.e., wetter) conditions were observed in 2004, 2010, 2017, and 2023 (Figure 4), likely reflecting interannual variability in precipitation and/or reduced evaporative demand.
Figure 4.
The annual monthly water balance trend in Zhaltir weather station.
The consistency of negative water balance across both monthly and annual scales, as well as across all stations, indicates that the moisture deficit is a regional-scale phenomenon rather than a localized anomaly. Detailed results for all meteorological stationsconfirm the spatial coherence of water deficits throughout the Akmola region. These findings underscore the vulnerability of regional water resources, ecosystems, and agricultural systems to sustained atmospheric water demand and highlight the importance of integrating water balance indicators into drought monitoring and climate adaptation strategies.
All annual water balance values across the meteorological stations were approximately −750 mm. Based on both measured and calculated data, variability during 2003–2023 was analyzed for all stations in the Akmola region. Using the Zhaltir station as a representative example, air temperature shows a clear increasing trend, while potential evapotranspiration remains relatively stable, with a slight upward tendency. Precipitation also exhibits an increasing trend, with a notable peak observed in 2014.
Despite these changes, the climatic water balance remains generally stable throughout the time period. However, the Standardized Precipitation–Evapotranspiration Index (SPEI) shows a slightly increasing trend, indicating a marginal reduction in drought severity (Figure 4).
3.3. ET0 Model and Relation with Soil Surface Condition
Evapotranspiration (ET0) was calculated for all meteorological stations over a 20-year period and analyzed in relation to different categories of soil surface condition. Overall, a positive trend in ET0 was observed. A statistically significant positive correlation between extremely dry soil days and ET0 was identified in the Borovoye station (r ≈ 0.65), whereas a significant negative correlation was observed in Ereymentau (r ≈ −0.54). Positive correlations between ET0 and frozen soil days were found in Burabay (r ≈ 0.43), Egindykol (r ≈ 0.43), Ereymentau (r ≈ 0.51), Kokshetau (r ≈ 0.56), and Zhaltir (r ≈ 0.43). In addition, a relationship with wet or flooded soil days was observed in Esil (r ≈ 0.54) and Kokshetau (r ≈ 0.67) (Table 1).
Higher potential evapotranspiration tends to be associated with a reduced number of frozen soil days; however, this relationship is weak and statistically non-significant. No statistically significant correlation was found between ET0 and the number of wet soil days, suggesting that wet conditions are primarily controlled by precipitation rather than evaporative demand. Extremely dry soil days were rare in the study region; therefore, correlation analysis with ET0 was not meaningful, due to the near-zero variance in the time series.
The correlation matrix (Table 3) indicates weak negative correlations between annual ET0 and frozen soil days (r ≈ −0.12), and almost no relationship between ET0 and wet or flooded soil days. In contrast, strong negative correlations between frozen and wet or flooded soil days (r ≈ −0.65), along with positive correlations between frozen and extremely dry soil days (r ≈ 0.61), highlight the internal structure of soil surface state transitions.
Correlations between ET0 and categories of soil surface condition varied considerably among stations and should be interpreted with caution. The observed relationships do not necessarily imply direct physical causation and may reflect the influence of multiple climatic variables, including seasonal temperature variability, snow cover duration, and precipitation patterns.
3.4. Water Balance, Temperature and Precipitation in the Akmola Region
Correlation analysis revealed a strong positive relationship between precipitation and climatic water balance across all meteorological stations in the Akmola region, with correlation coefficients ranging from approximately r ≈ 0.79 to r ≈ 0.96. This indicates that precipitation is the dominant control on water balance variability at the regional scale: higher precipitation leads to less negative (or occasionally positive) water balance conditions, whereas precipitation deficits intensify moisture shortages.
In contrast, precipitation exhibited only weak correlations (both positive and negative) with air temperature, suggesting that temperature does not directly control precipitation variability. This is consistent with the continental climate of the Akmola region, where precipitation is primarily governed by large-scale atmospheric circulation rather than local thermal conditions.
The climatic water balance showed weak to moderate negative correlations with air temperature, with coefficients ranging from r ≈ −0.16 at Astana to r ≈ −0.44 at Kokshetau. This inverse relationship reflects the indirect influence of temperature via increased atmospheric evaporative demand: as temperature rises, reference evapotranspiration (ET0) increases, leading to greater moisture losses and more negative water balance values, even without substantial changes in precipitation.
Variability in correlation strength among stations highlights the role of local climatic and physiographic factors. Stronger negative correlations indicate higher sensitivity of evapotranspiration to temperature, whereas weaker relationships suggest partial buffering by precipitation variability or other site-specific conditions.
Overall, the results demonstrate that, while precipitation remains the primary driver of water balance dynamics in the Akmola region, rising air temperature may increase atmospheric evaporative demand, which may subsequently intensify regional drought vulnerability. This effect is particularly noticeable when precipitation is insufficient to compensate for moisture losses.
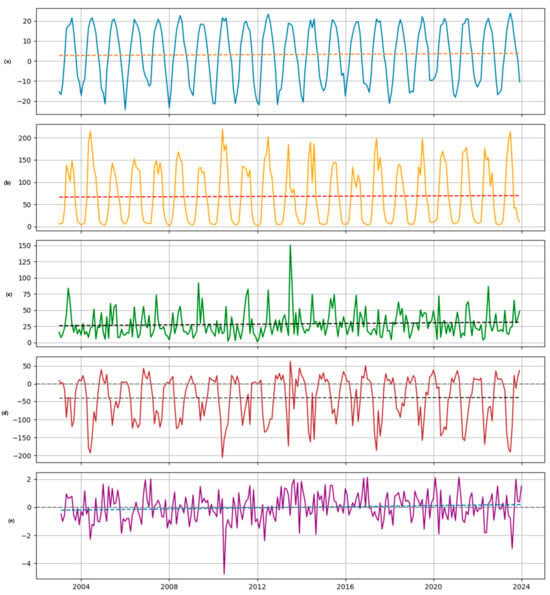
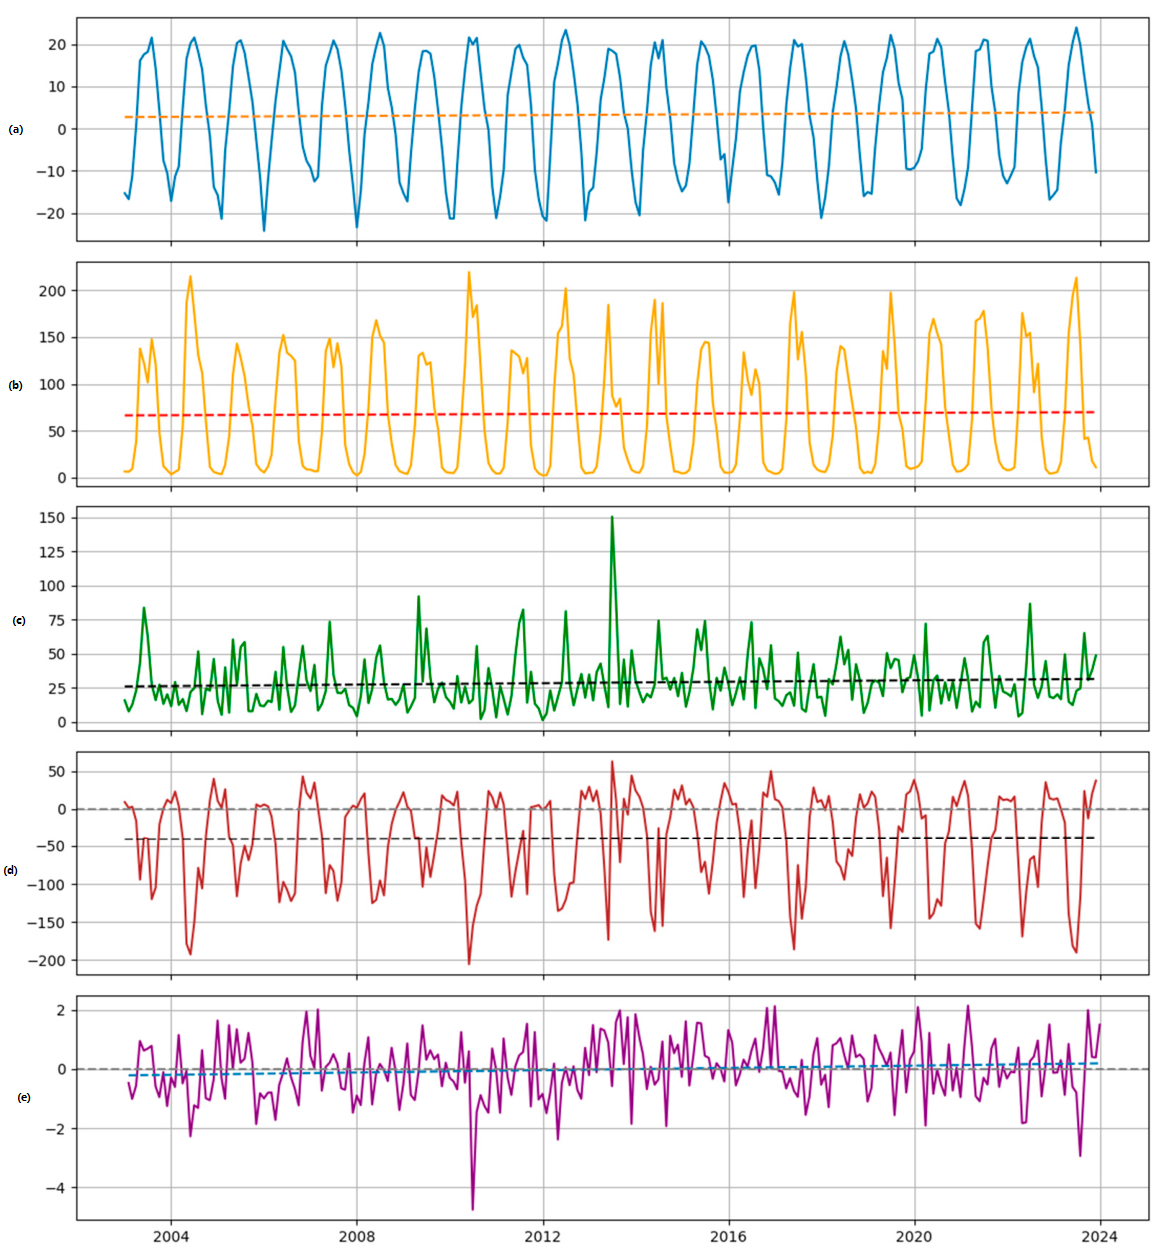
Figure 5 illustrates the monthly dynamics of temperature, ET0, precipitation, climatic water balance, and SPEI at the Zhaltir station. The pronounced seasonal cycles of temperature and ET0 result in predominantly negative water balance conditions throughout most of the year, which is consistently reflected in SPEI variability.
Figure 5.
Monthly variability and linear trends of (a) mean air temperature (blue line), (b) reference evapotranspiration, ET0 (orange line), (c) precipitation (green line), (d) climatic water balance (brown line), and (e) SPEI (purple line). Dashed colored lines indicate linear trends, whereas gray dashed lines denote the zero reference level (for water balance and SPEI).
The combined visualization of hydroclimatic variables at the station scale demonstrates how increasing evaporative demand amplifies water balance deficits, even in the absence of a pronounced decline in precipitation. The coherence between negative water balance anomalies and SPEI confirms the sensitivity of drought conditions to both precipitation variability and temperature-driven evapotranspiration.
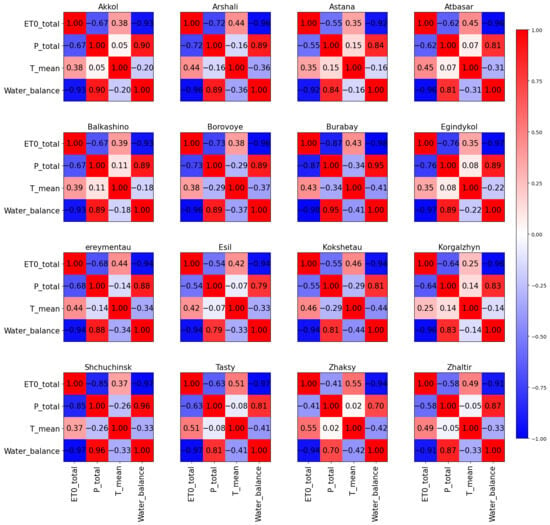
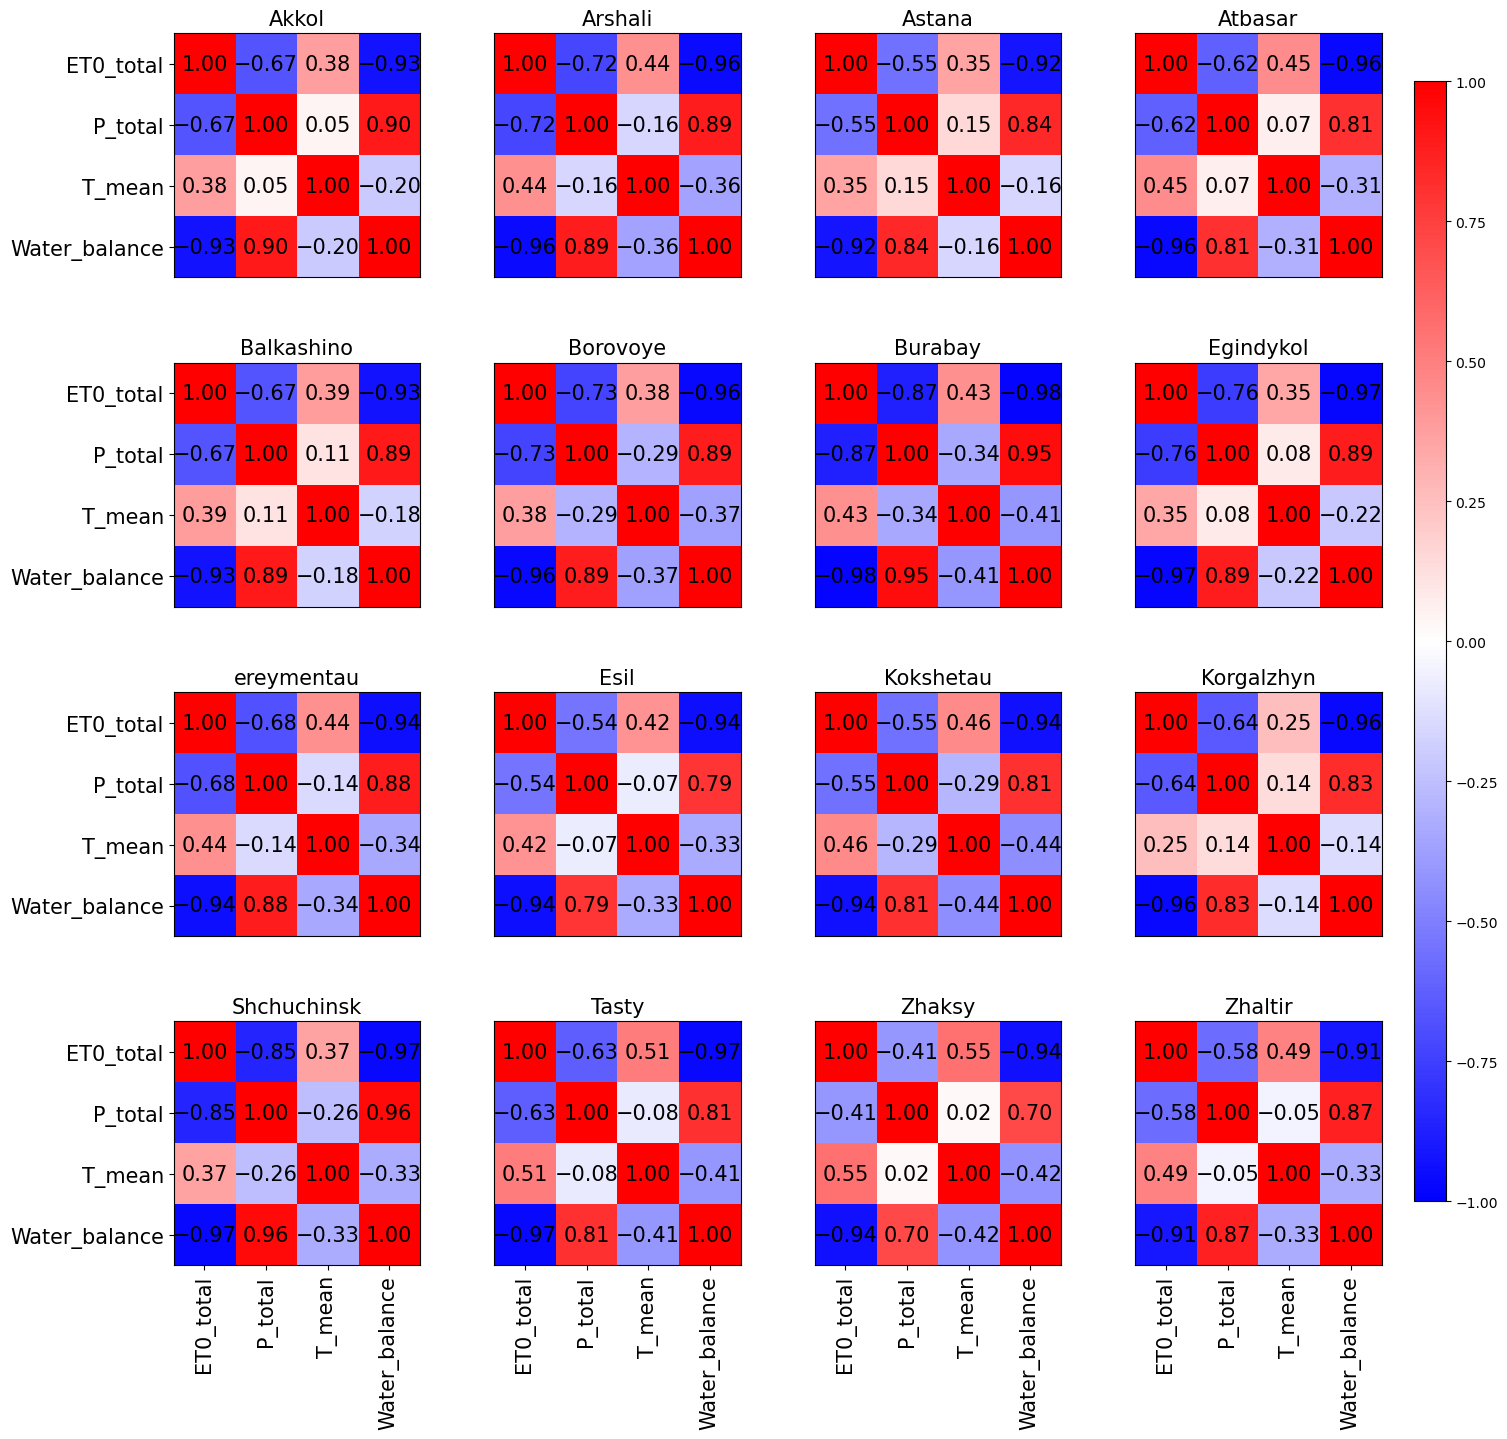
Correlation analysis between water balance components, precipitation, temperature, and evapotranspiration further highlights these relationships. Evapotranspiration (ET0) is positively correlated with air temperature at all stations, with correlation coefficients ranging from weak (r ≈ 0.25 at Korgalzhyn) to moderate–strong (r ≈ 0.55 at Zhaksy). This confirms that higher temperatures lead to increased evaporative demand.
In contrast, air temperature exhibits a consistently negative correlation with climatic water balance across all stations, with coefficients ranging from approximately r ≈ −0.44 to −0.16 (Figure 6). The inverse relationship between temperature and climatic water balance should be interpreted with caution because temperature is a major component influencing ET0, which is directly used in the calculation of climatic water balance (P − ET0).
Figure 6.
Correlation between temperature (°C), ET0 (mm month−1), precipitation (mm month−1), and climatic water balance (mm month−1). Variables: ET0_total—total reference evapotranspiration; P_total—total precipitation; T_mean—average air temperature; Water_balance—climatic water balance (P − ET0).
Some of the observed correlations are partly influenced by the mathematical structure of the analyzed variables. In particular, ET0 is directly dependent on temperature, while climatic water balance is calculated as the difference between precipitation and ET0. Therefore, strong correlations among these variables should not be interpreted solely as independent climatic relationships.
Reference evapotranspiration (ET0) exhibits a negative correlation with precipitation at all meteorological stations, with correlation coefficients ranging from approximately r ≈ −0.41 at Zhaksy to r ≈ −0.85 at Shchuchinsk. This inverse relationship indicates that higher precipitation is generally associated with reduced atmospheric evaporative demand.
Precipitation shows a strong positive correlation with climatic water balance across all stations (r ≈ 0.79–0.96), confirming its dominant role in controlling water balance variability. Its relation to air temperature, however, is only weak (both positively and negatively), while climatic water balance shows a weak to moderate negative correlation with air temperature (ranging from r ≈ −0.16 at Astana to r ≈ −0.44 at Kokshetau).
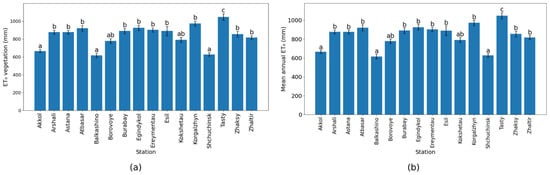
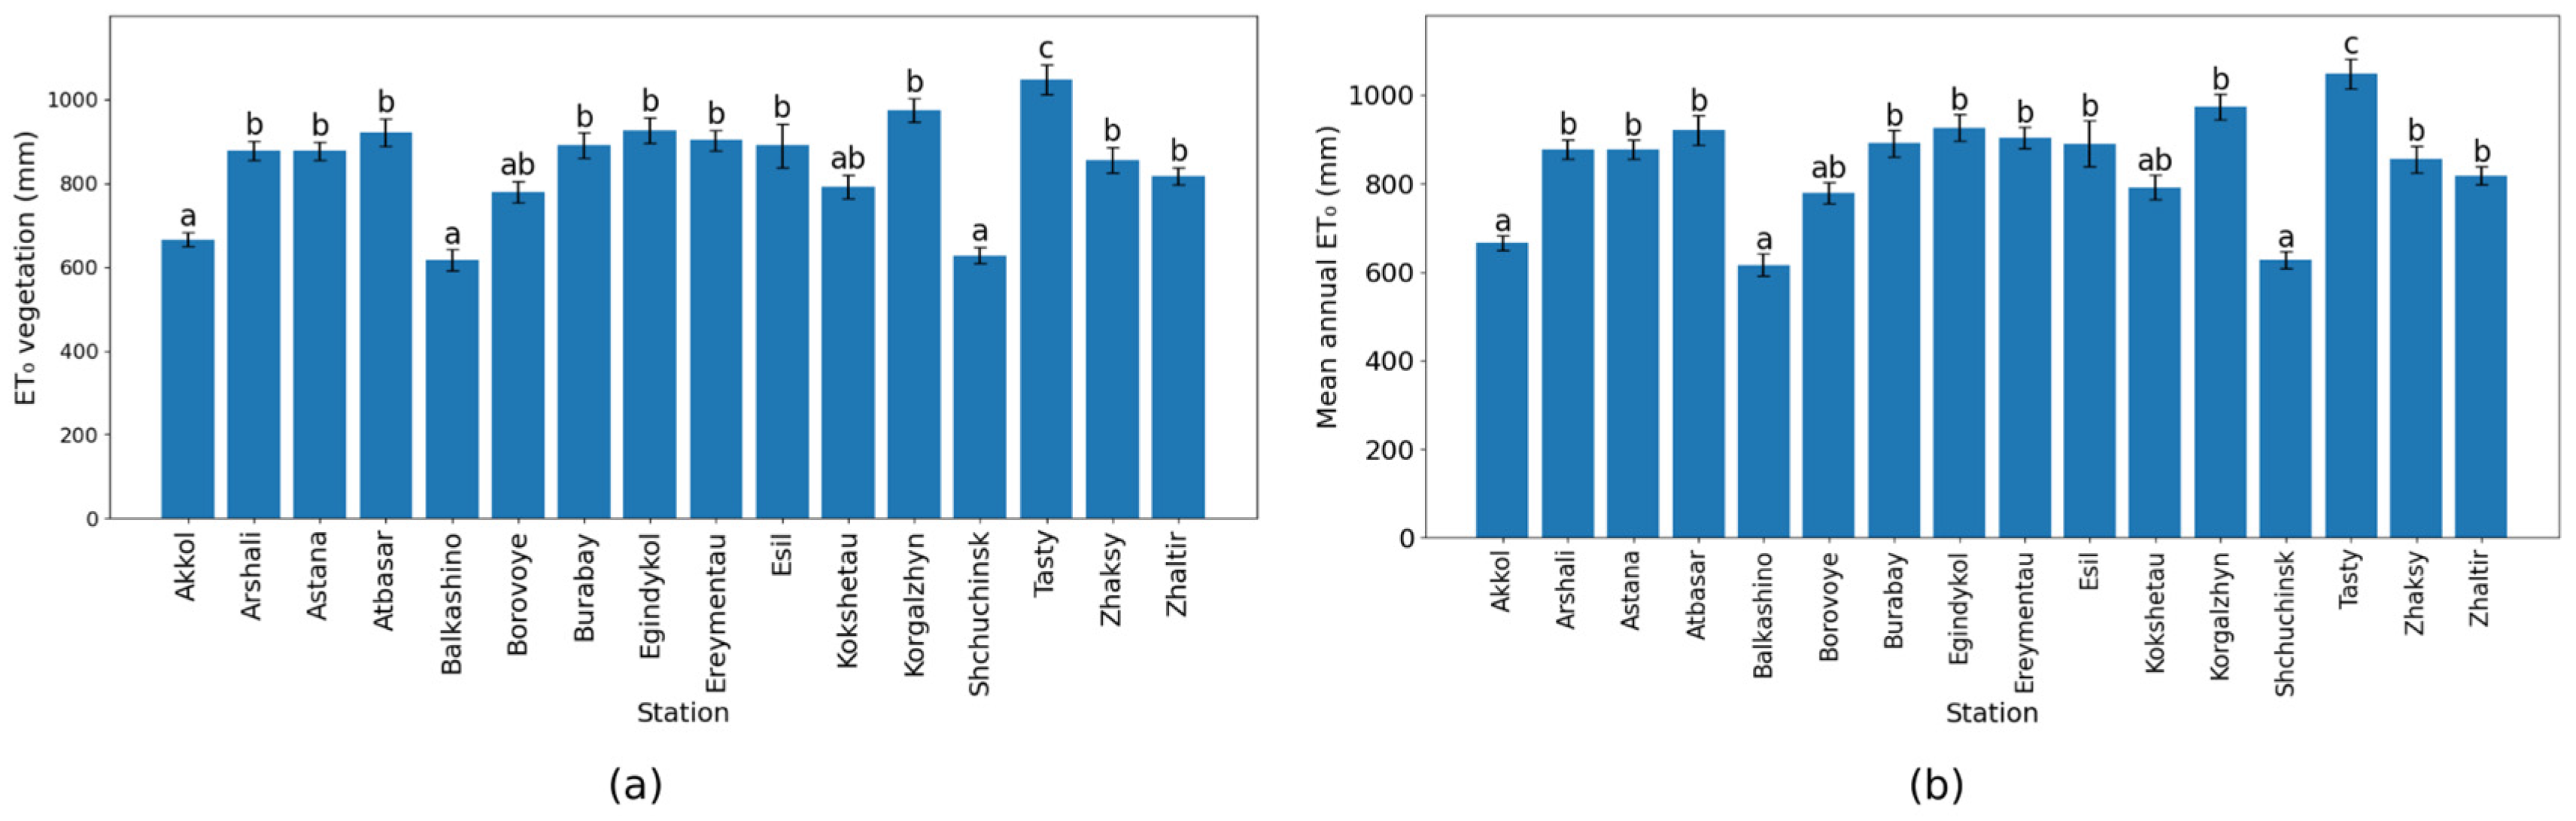
The spatial variability of ET0 across the study area is presented in Figure 7. Both seasonal and annual patterns reveal consistent differences among stations. During the vegetation period (April–September), ET0 values vary considerably, with higher values observed at stations such as Korgalzhyn and Tasty, and lower values at Akkol and Shchuchinsk. This indicates pronounced spatial heterogeneity in evapotranspiration during the active hydrological season.
Figure 7.
Spatial variability in reference evapotranspiration across meteorological stations: (a) ET0 during the vegetation period and (b) mean annual ET0. Bars represent mean values, error bars indicate standard error, and different letters denote statistically significant differences among stations according to Tukey’s HSD test (p < 0.05).
A similar pattern is observed in mean annual ET0, where stations with higher vegetation-period values also tend to exhibit higher annual totals. The Tukey HSD test confirms statistically significant differences among stations (p < 0.05). Stations are grouped into distinct homogeneous subsets, as indicated by letter annotations: stations sharing the same letter do not differ significantly, whereas those marked with different letters show statistically significant differences.
Reference evapotranspiration (ET0) shows clear spatial variability, with higher values observed at Tasty, Zhaltir, and Shchuchinsk, and lower values at Akkol and Balkashino. The similarity between vegetation-period and annual patterns indicates that spatial differences in ET0 are primarily controlled during the vegetation period.
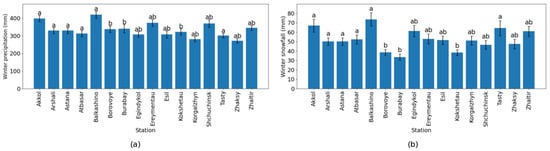
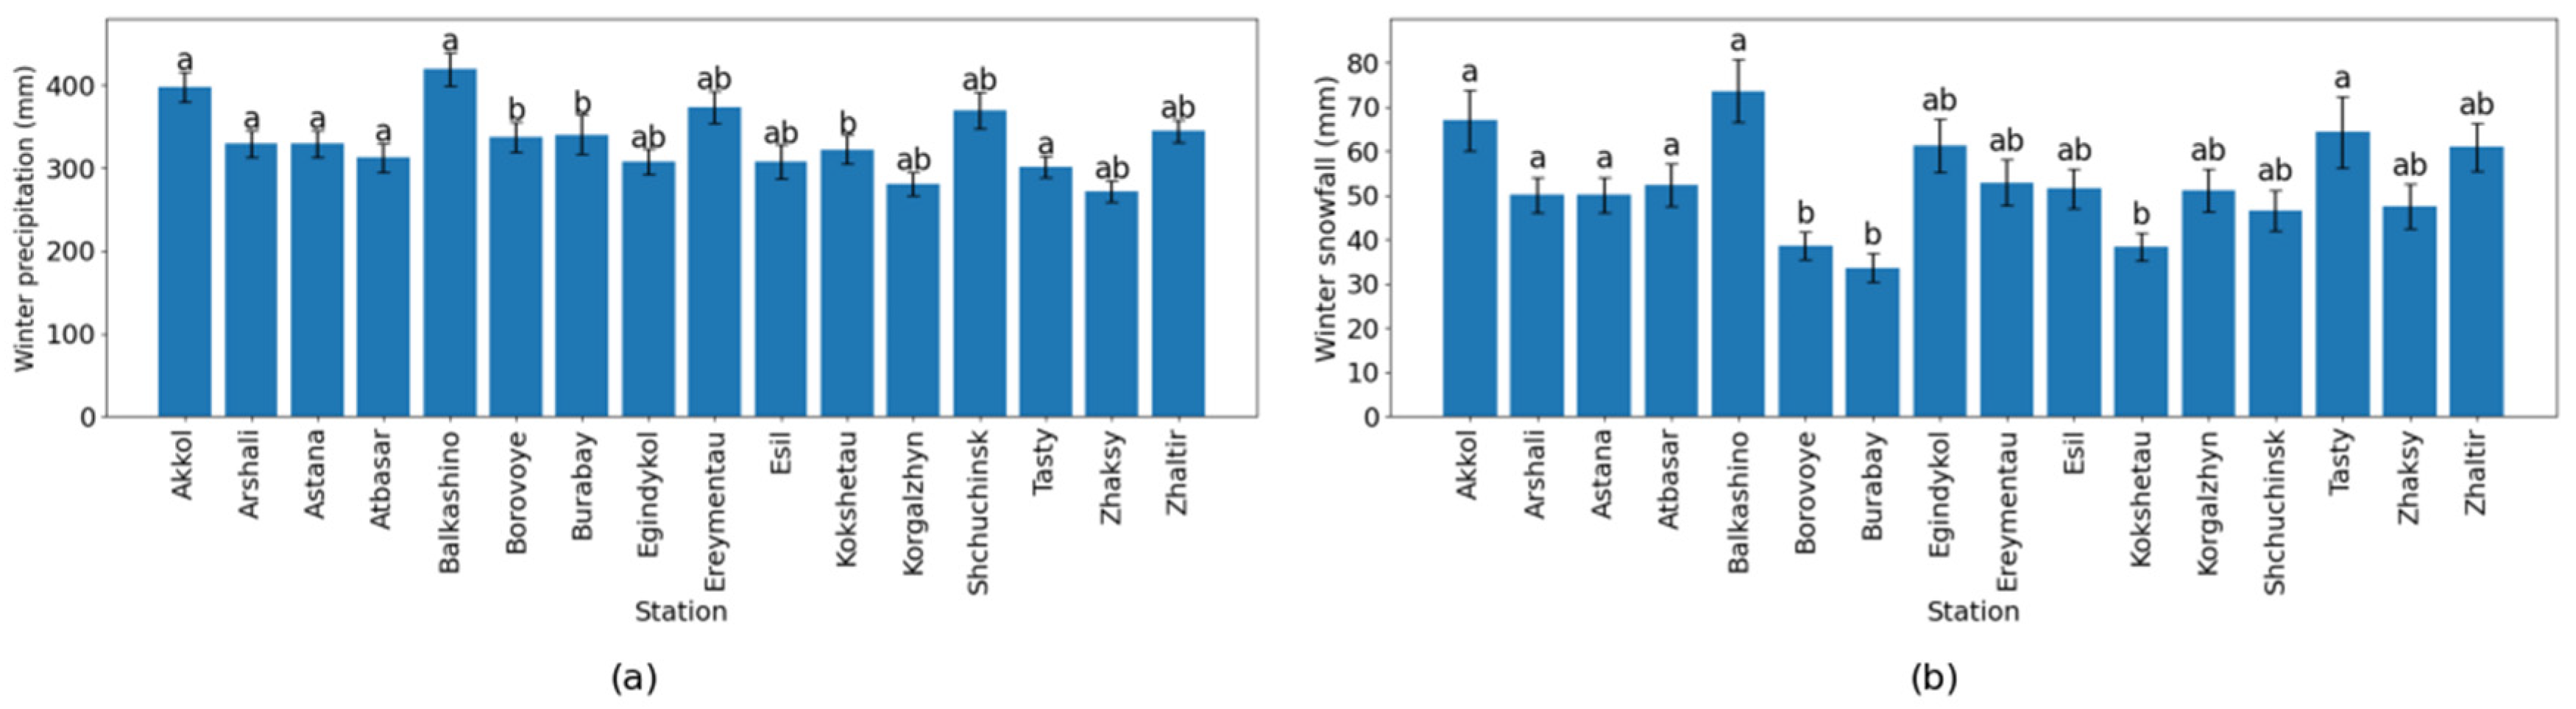
The spatial variability of winter precipitation and snowfall across the study area is presented in Figure 8. Winter precipitation showed noticeable differences among stations, with higher values observed at stations such as Balkashino, Akkol, and Shchuchinsk, while lower precipitation was recorded at Korgalzhyn, Zhaltir, and Tasty. This indicates spatial heterogeneity in cold-season precipitation across the region.
Figure 8.
Spatial variability in (a) annual precipitation and (b) snowfall across meteorological stations. Bars represent mean values, error bars indicate standard error, and different letters denote statistically significant differences among stations according to Tukey’s HSD test (p < 0.05).
A similar spatial pattern was observed for winter snowfall. Stations with higher total winter precipitation generally exhibited higher snowfall values, confirming that winter precipitation is predominantly represented by snowfall in the study area.
The Tukey HSD test revealed statistically significant differences among stations (p < 0.05), with several distinct groups identified. Stations sharing the same letter do not differ significantly, whereas those with different letters show statistically significant differences. The relatively small standard errors indicate that interannual variability is moderate, and the observed spatial patterns are consistent across years.
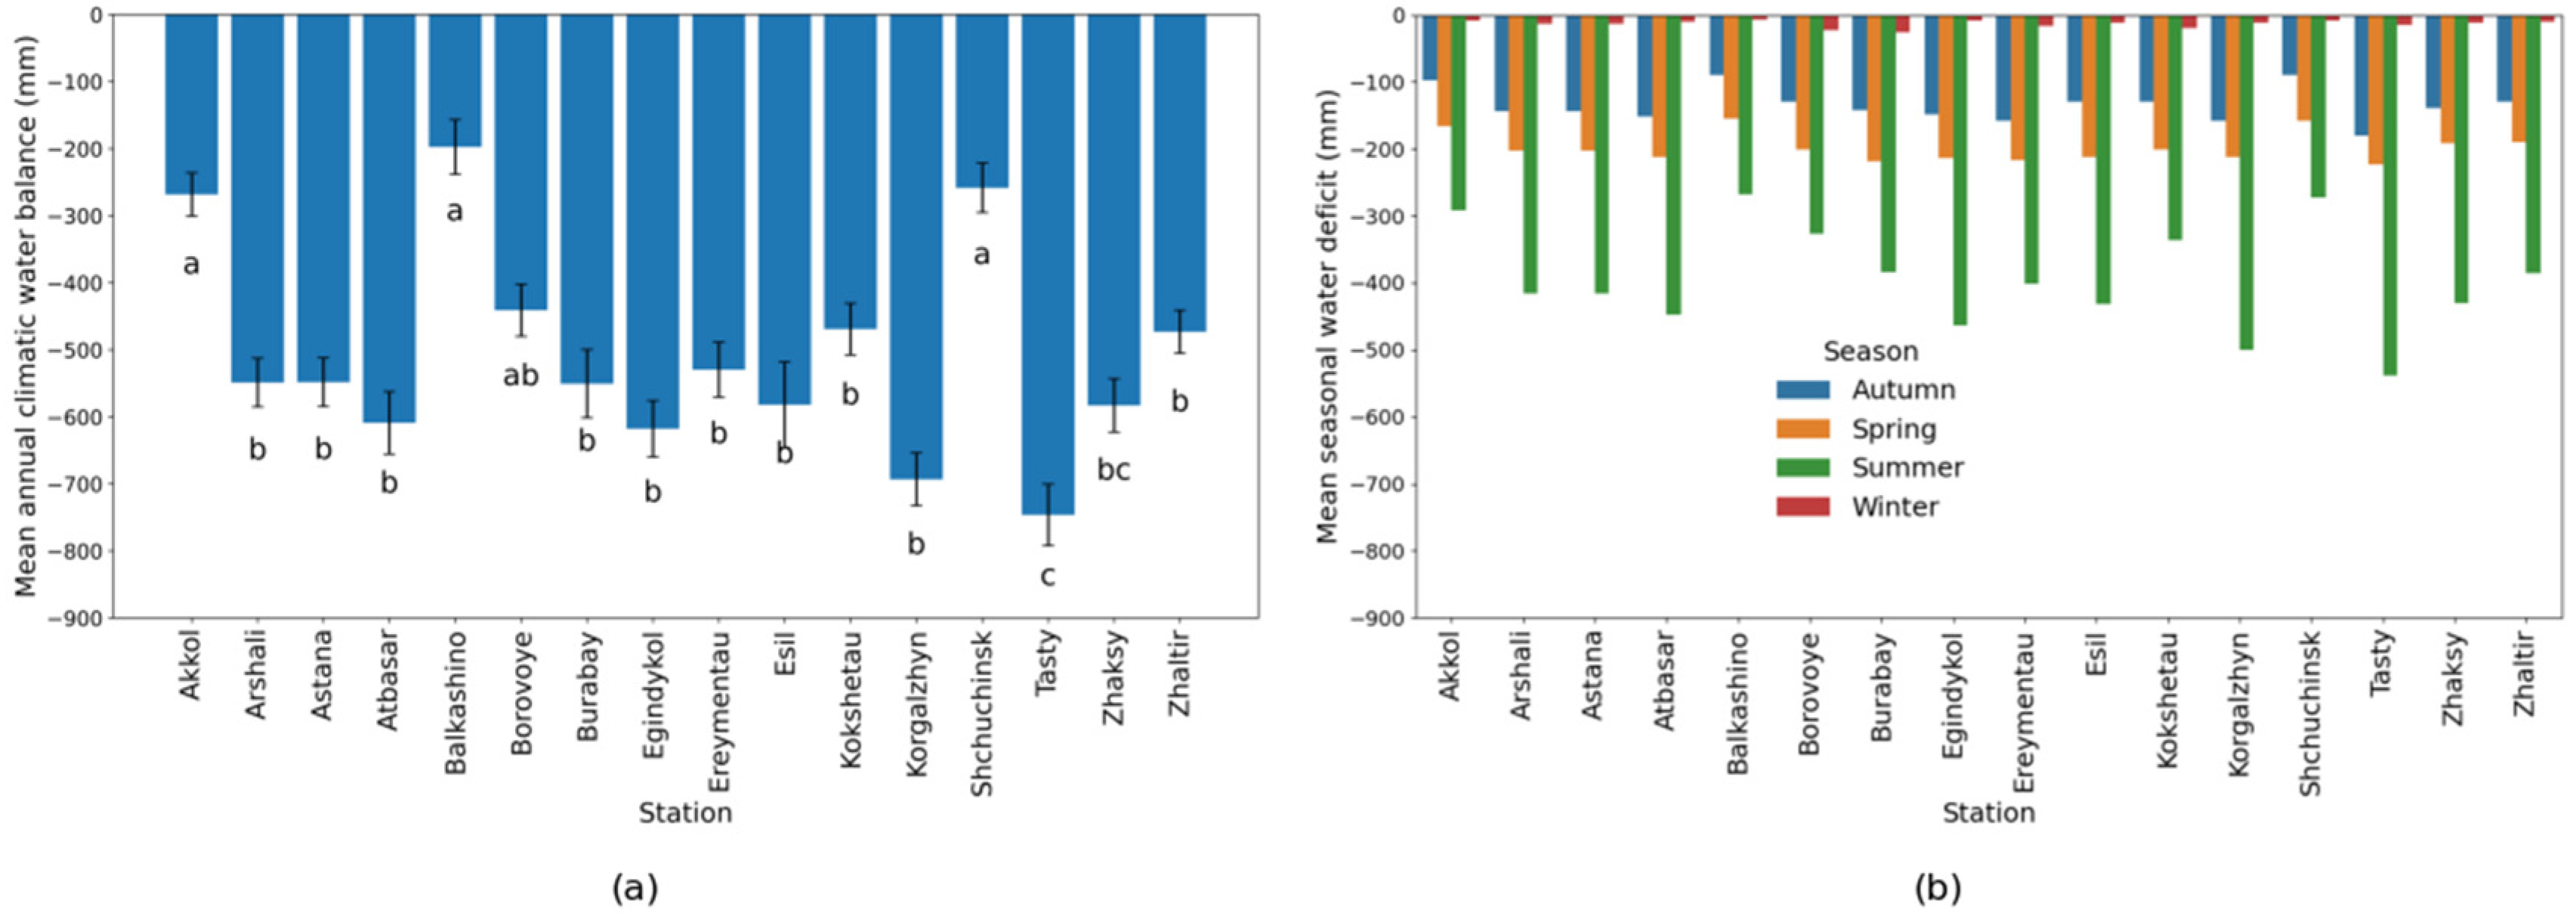
The spatial variability in the mean annual climatic water balance across stations is presented in Figure 9. All stations exhibit negative water balance values, indicating that evapotranspiration exceeds precipitation throughout the study area. The magnitude of the deficit varies considerably among stations. The most negative values were observed at stations such as Tasty and Korgalzhyn, while relatively less negative values were recorded at Balkashino and Akkol.
Figure 9.
Spatial variability in (a) mean annual climatic water balance and (b) mean seasonal water deficit across meteorological stations. Bars represent mean values, error bars indicate standard error, and different letters denote statistically significant differences among stations according to Tukey’s HSD test (p < 0.05).
The spatial distribution of climatic water balance shows that the most negative values were observed at Tasty, Korgalzhyn, and Egindykol, indicating the strongest moisture deficit. In contrast, relatively less negative values were recorded at Akkol, Balkashino, and Shchuchinsk, suggesting comparatively more favorable moisture conditions. Across all stations, the summer season exhibits the largest deficit, confirming the dominant role of evapotranspiration during the vegetation period.
The observed spatial variability in ET0, winter precipitation, snowfall, and climatic water balance is likely associated with differences in regional climatic and physiographic conditions. Stations located in the northern and north-eastern parts of the study area generally receive greater winter precipitation and snow accumulation, which contribute to higher seasonal water storage and less negative climatic water balance values. In contrast, stations situated in the southern and south-western parts of the region experience lower snowfall and higher atmospheric evaporative demand, resulting in stronger moisture deficits.
Snow cover represents an important component of the regional hydrological regime because it provides a major source of spring recharge. Therefore, spatial differences in snow accumulation directly influence water availability during the subsequent vegetation period. In addition, local variations in elevation, land surface characteristics, and exposure to prevailing air masses may further contribute to the observed hydroclimatic gradients across the Akmola region.
4. Discussion
4.1. Spatial Heterogeneity of Hydroclimatic Conditions
This study revealed pronounced spatial and seasonal heterogeneity in hydroclimatic conditions across the Akmola region, reflecting the combined influence of precipitation, air temperature, atmospheric evaporative demand, and local soil–snow interactions. Although many soil surface condition categories did not exhibit statistically significant monotonic trends over the 2003–2023 period, significant changes were detected at several stations, indicating that hydroclimatic responses are not spatially uniform and are strongly regulated by local environmental conditions.
At stations where trends were not statistically significant, Sen’s slope still indicated directionality, suggesting that some soil surface responses may already be shifting but remain within the bounds of natural interannual variability. Such spatially mixed results are typical for sharply continental climates, where strong yearly variability can obscure variability tendencies [27,28].
The spatial analysis of hydroclimatic variables demonstrates pronounced heterogeneity across meteorological stations in the Akmola region. Stations such as Tasty, Korgalzhyn, and Egindykol consistently exhibit more negative climatic water balance, indicating stronger moisture deficit conditions, whereas Akkol, Balkashino, and Shchuchinsk show relatively less severe deficits. These differences are closely linked to spatial variability in both atmospheric water demand and moisture input.
These results confirm that hydroclimatic conditions in the region are controlled by a combination of local climatic factors, resulting in distinct microclimatic zones. The strongest spatial differences are expressed during the vegetation period, when evapotranspiration dominates the water balance and amplifies inter-station variability.
4.2. Trends in Soil Surface Conditions, and Influencing Factors
Trend analysis of soil surface condition categories revealed strong spatial heterogeneity, reflecting the complex interplay among climate forcing, soil properties, snow cover, and local hydrological conditions. Significant trends were detected in frozen, wet or flooded, and extremely dry soil surface condition categories at several stations, whereas others showed no statistically significant trends (p > 0.05).
Decreasing numbers of frozen soil days at stations such as Ereymentau and Esil are consistent with regional warming trends and shortening winter seasons observed across the Akmola region. A reduced duration of frozen soil periods may affect spring infiltration, soil structure, and the timing of agricultural operations. Possible explanations include differences in snow cover persistence, soil moisture conditions, and local physiographic characteristics.
An increasing trend in frozen soil days at some stations may be associated with local differences in snow cover, soil moisture, topography, or other site-specific factors; however, these mechanisms were not evaluated directly in the present study. Similar spatial contrasts in frozen soil period dynamics have been reported in Central Asia and emphasize the limitations of inferring soil thermal responses solely from air temperature trends [29].
Wet or flooded soil surface conditions showed both positive and negative trends, indicating shifts in moisture surplus events. Increasing trends at stations such as Kokshetau and Esil may be linked to changes in snowmelt timing or precipitation intensity, whereas decreasing trends at Shchuchinsk, Borovoye, and Atbasar suggest reduced soil moisture under increasing evaporative demand. Extremely dry soil surface conditions increased significantly at Egindykol, indicating intensifying soil moisture stress and supporting the broader interpretation of increasing agricultural drought risk in the Akmola region.
4.3. Water Balance Dynamics and Drought Mechanisms
The study revealed a predominance of negative annual water balance across all stations (e.g., Zhaltir: −470 mm annually), indicating a persistent regional moisture deficit. Years that indicated less negative values (2013, 2015, and 2016) reflect interannual variability rather than a shift in the overall regime. This pattern is consistent with studies in continental and semi-arid regions, where evapotranspiration exceeds precipitation for most of the year due to high atmospheric evaporative demand [30,31].
Precipitation deficits during prolonged droughts are typically partitioned among evapotranspiration, runoff, and groundwater storage. Studies of the Millennium Drought in Australia demonstrated significant long-term declines in groundwater storage, while evapotranspiration remained relatively stable [32,33]. Correlation analysis showed that there is a strongly positive correlation between precipitation and water balance (r ≈ 0.79–0.96), whereas the correlation between air temperature and water balance is weak to moderately negative (r ≈ −0.16 to −0.44). This confirms a dual-control mechanism of drought development: precipitation controls water input, whereas temperature regulates water losses through evapotranspiration.
Our results are consistent with studies suggesting that increasing atmospheric evaporative demand may contribute to drought development; however, precipitation variability remains the primary control of climatic water balance in the study area [34]. The consistency between climatic water balance and SPEI confirms that SPEI effectively captures drought variability in the study region. The results indicate that drought conditions are influenced by both precipitation variability and atmospheric evaporative demand.
4.4. Role of Evapotranspiration (ET0) in Regional Drying
The spatial variability of ET0 is primarily driven by differences in air temperature, solar radiation, humidity, and wind speed, as described by the FAO-56 Penman–Monteith framework. Stations with higher ET0 values are associated with stronger atmospheric demand and more negative water balance.
The variability in the temperature–ET0 relationship across stations reflects the multifaceted nature of evapotranspiration processes. While temperature is an important driver, ET0 is also influenced by radiation, vapor pressure deficit, and aerodynamic conditions. Local factors such as land surface characteristics and microclimate further modulate this relationship.
The consistency between vegetation-period ET0 and annual ET0 suggests that the vegetation period plays a dominant role in controlling total evapotranspiration. Similar patterns have been reported in semi-arid regions of northern China and Central Asia [35,36,37].
4.5. Ecological and Agricultural Implications
Increasing atmospheric evaporative demand, combined with declining water balance, may significantly affect steppe hydroclimatic assessment. The observed increase in evaporative demand and persistent negative climatic water balance may indicate conditions that are generally associated with increased drought vulnerability in semi-arid ecosystems. However, ecological and agricultural impacts were not quantified in this study [38]. Similar hydroclimatic responses have been documented in other semi-arid regions, where warming-driven evapotranspiration increases ecosystem instability.
4.6. Implications for Water Management and Adaptation
The results suggest that climatic water balance and SPEI may provide useful indicators for regional drought monitoring. Consideration of both precipitation and atmospheric evaporative demand is important when assessing water availability under observed warming-related changes.
5. Conclusions
Analysis of meteorological observations from 16 stations in the Akmola region during the 2003–2023 period revealed persistent negative climatic water balance values across all stations, indicating moisture deficit conditions typical of semi-arid continental environments. Significant spatial variability was observed in reference evapotranspiration (ET0), winter precipitation, snowfall, and climatic water balance. Stations such as Tasty, Korgalzhyn, and Egindykol exhibited the strongest moisture deficits, whereas Akkol, Balkashino, and Shchuchinsk showed relatively less negative water balance conditions.
Precipitation was identified as the primary control of climatic water balance variability, while increasing air temperature contributed indirectly through enhanced atmospheric evaporative demand and higher ET0. Seasonal analysis showed that the most pronounced water deficit occurs during the vegetation period, when evapotranspiration reaches its maximum values and exceeds precipitation inputs.
The consistency between climatic water balance and SPEI confirms the usefulness of integrated drought indicators that combine precipitation and evaporative demand for monitoring hydroclimatic variability in semi-arid regions. The results demonstrate substantial spatial heterogeneity of hydroclimatic conditions within the Akmola region and highlight the importance of station-scale assessments when evaluating water availability and drought risk.
Author Contributions
Conceptualization, R.B. and R.T.; methodology, A.O.; software, A.R.; validation, R.B., Z.R. and A.O.; formal analysis, A.O.; investigation, R.T.; resources, A.R.; data curation, A.O.; writing—original draft preparation, A.O.; writing—review and editing, R.B.; visualization, A.R.; supervision, Z.R.; project administration, R.B.; funding acquisition, R.B. All authors have read and agreed to the published version of the manuscript.
Funding
This research was funded by the Science Committee of the Ministry of High Education and Science of the Republic of Kazakhstan, grant number AP23486944, on the topic “Linking water quality and quantity of climate change condition in steppe zone of Kazakhstan”.
Data Availability Statement
The data used in the article were collected for the Akmola region from the website of meteorological stations of Kazakhstan: https://meteo.kazhydromet.kz/database_meteo/ (accessed on 15 January 2026).
Conflicts of Interest
The authors declare no conflicts of interest.
Abbreviations
The following abbreviations are used in this manuscript:
| SPEI-12 | 12-month Standardized Precipitation Evapotranspiration Index |
| FAO | Food and Agriculture Organization |
| ET0 | Reference Evapotranspiration and Transpiration |
| SPI | Standardized Precipitation Index |
| WB | Water Balance |
| CMIP6 | Coupled Model Intercomparison Project Phase 6 |
References
- Cao, L.; Xu, C.; Suo, N.; Song, L.; Lei, X. Future dry-wet climatic characteristics and drought trends over arid Central Asia. Front. Earth Sci. 2023, 11, 1102633. [Google Scholar] [CrossRef] [Scilit]
- Contribution of Working Group I to the Sixth Assessment Report of the Intergovernmental Panel on Climate Change. IPCC 2023 Climate Change 2023: The Physical Science Basis; Cambridge University Press: Singapore; pp. 1513–1766. Available online: https://www.ipcc.ch/report/ar6/syr/downloads/report/IPCC_AR6_SYR_FullVolume.pdf (accessed on 15 January 2026).
- Salnikov, V.; Turulina, G.; Polyakova, S.; Petrova, Y.; Skakova, A. Climate change in Kazakhstan during the past 70 years. Quat. Int. 2015, 358, 77–82. [Google Scholar] [CrossRef] [Scilit]
- Hua, T.; Zorita, E.; Wang, X.; Wang, N.; Zhang, C. Precipitation variability in the north fringe of East Asian Summer Monsoon during the past millennium and its possible driving factors. Clim. Dyn. 2019, 53, 2587–2602. [Google Scholar] [CrossRef] [Scilit]
- Aidan, I.; Aldashev, A.; Thomas, T.S.; Dunston, S. Impact of Climate Change onAgriculture in Kazakhstan Silk Road. J. Eurasian Dev. 2020, 2, 66–88. [Google Scholar] [CrossRef] [Scilit]
- Wei, Y.; Zhou, K.; Sheng, E.; Liu, B.; Lan, J. Hydroclimatic differences over the past 2300 years in arid Central Asia and their potential impacts on human activities revealed by End Member Modelling Analysis of lake sediments. Quat. Sci. Adv. 2025, 20, 100304. [Google Scholar] [CrossRef] [Scilit]
- UNFCCC. Nationally Determined Contribution of the Republic of Kazakhstan to the Global Response to Climate Change Until 2035. 2025. Available online: https://unfccc.int/sites/default/files/2025-11/NDC_Kazakhstan%203.0%20eng.pdf (accessed on 15 January 2026).
- Climate Adaptation Options and Opportunities in the Agriculture Sector. Report of World Bank Republic of Kazakhstan. 2024. Available online: https://documents1.worldbank.org/curated/en/099060424004022607/pdf/P50211216a88d304191601df346d0b1713.pdf (accessed on 15 January 2026).
- Tang, Y.; Chen, J.-P.; Zhang, F.; Yuan, S.-S. Spatiotemporal Analysis of Evapotranspiration and Effects of Water and Heat on Water Use Efficiency. Water 2021, 13, 3019. [Google Scholar] [CrossRef] [Scilit]
- Karatayev, M.; Salnikov, V.; Bekseitova, R.; Nizamova, M. Monitoring climate change, drought conditions and wheat production in Eurasia: The case study of Kazakhstan. Heliyon 2021, 8, e08660. [Google Scholar] [CrossRef] [Scilit] [PubMed]
- Kazhydromet Meteorological Data Base. 2026. Available online: https://meteo.kazhydromet.kz/database_meteo (accessed on 15 January 2026).
- Sun, Y.; Chen, X.; Yu, Y.; Qian, J.; Wang, M.; Huang, S.; Xing, X.; Song, S.; Sun, X. Spatiotemporal Characteristics of Drought in Central Asia from 1981 to 2020. Atmosphere 2022, 13, 1496. [Google Scholar] [CrossRef] [Scilit]
- Kharlamova, N.; Reyakin, V. Regional climate and environmental change in Central Asia. In Environmental Security and Sustainable Land Use—With Special Reference to Central Asia; NATO Security through Science Series; Vogtmann, H., Dobretsov, N., Eds.; Springer: Dordrecht, The Netherlands, 2006. [Google Scholar] [CrossRef] [Scilit]
- Birimbayeva, L.; Makhmudova, L.; Alimkulov, S.; Tursunova, A.; Mussina, A.; Tigkas, D.; Beksultanova, Z.; Rodrigo-Clavero, M.-E.; Rodrigo-Ilarri, J. Analysis of the Spatiotemporal Variability of Hydrological Drought Regimes in the Lowland Rivers of Kazakhstan. Water 2024, 16, 2316. [Google Scholar] [CrossRef] [Scilit]
- Amrina, M.; Kozina, V.; Isakhan, G. The environmental state of the Akmola Region in the Republic of Kazakhstan in the 1990s. E3S Web Conf. 2024, 510, 03035. [Google Scholar] [CrossRef] [Scilit]
- Google LLC. Google Earth Pro. 2024. Available online: https://earth.google.com (accessed on 15 January 2026).
- Manual on Codes (WMO-No. 306). World Meteorological Organization (WMO): Geneva, Switzerland, 2025.
- Kamal, N.; Pachauri, S. Mann-Kendall, and Sen’s Slope Estimators for Precipitation Trend Analysis in North-Eastern States of India. Int. J. Comput. Appl. 2019, 177, 7–16. [Google Scholar] [CrossRef] [Scilit]
- Ahmad, I.; Tang, D.; Wang, T.; Wang, M.; Wagan, B. Precipitation Trends over Time Using Mann-Kendall and Spearman’s rho Tests in Swat River Basin, Pakistan. Adv. Meteorol. 2015, 2015, 431860. [Google Scholar] [CrossRef] [Scilit]
- Allen, R.G.; Pereira, L.S.; Raes, D.; Smith, M. Crop evapotranspiration—Guidelines for computing crop water requirements (FAO-56). In Water Resources, Development and Management Service; Food and Agriculture Organization of the United Nations: Rome, Italy, 1998. [Google Scholar]
- Chen, J. Biophysical Models and Applications in Ecosystem Analysis; Michigan State University Press: East Lansing, MI, USA, 2021. [Google Scholar] [CrossRef] [Scilit]
- Postma, K.; Mane, S.; Shen, M.; Kussainova, M.; Beisenova, R.; Nanda, A.; Dong, G.; Chen, J. Water loss through evapotranspiration after precipitation events in bioenergy crops grown in similar climatic conditions. Front. Environ. Sci. 2024, 12, 1463852. [Google Scholar] [CrossRef] [Scilit]
- Chen, Y.; Zhang, S.; Wang, Y. Analysis of the Spatial and Temporal Distribution of Potential Evapotranspiration in Akmola Oblast, Kazakhstan, and the Driving Factors. Remote Sens. 2022, 14, 5311. [Google Scholar] [CrossRef] [Scilit]
- Vicente-Serrano, S.M.; Beguería, S.; López-Moreno, J.I. A Multiscalar Drought Index Sensitive to Global Warming: The Standardized Precipitation Evapotranspiration Index. J. Clim. 2010, 23, 1696–1718. [Google Scholar] [CrossRef] [Scilit]
- Bhardwaj, K.; Mishra, A.; Khedun, C.P. Global droughts in a warming climate: Evaluation of SPI and SPEI under 1.5°, 2°, and 3 °C global warming. J. Hydrol. 2025, 659, 133309. [Google Scholar] [CrossRef] [Scilit]
- Vicente-Serrano, S.M.; Peña-Angulo, D.; Beguería, S.; Domínguez-Castro, F.; Tomás-Burguera, M.; Noguera, I.; Gimeno-Sotelo, L.; El Kenawy, A. Global drought trends and future projections Phil. Trans. R. Soc. 2022, 380, 20210285. [Google Scholar] [CrossRef] [Scilit] [PubMed]
- Beguería, S.; Vicente-Serrano, S.M.; Reig, F.; Latorre, B. Standardized precipitation evapotranspiration index (SPEI) revisited: Parameter fitting, evapotranspiration models, tools, datasets and drought monitoring. Int. J. Climatol. 2014, 34, 3001–3023. [Google Scholar] [CrossRef] [Scilit]
- Chen, C.; Peng, X.; Frauenfeld, O.W.; Zhao, Y.; Yang, G.; Tian, W.; Li, X.; Du, R.; Li, X. Comprehensive Assessment of Seasonally Frozen Ground Changes in the Northern Hemisphere Based on Observations. J. Geophys. Res. Atmos. 2022, 127, e2022JD037306. [Google Scholar] [CrossRef] [Scilit]
- Feng, K.; Cao, Y.; Du, E.; Zhou, Z.; Zhang, Y. Spatiotemporal Dynamics of Drought and the Ecohydrological Response in Central Asia. Remote Sens. 2025, 17, 166. [Google Scholar] [CrossRef] [Scilit]
- Gebrechorkos, S.H.; Sheffield, J.; Vicente-Serrano, S.M.; Funk, C.; Miralles, D.G.; Peng, J.; Dyer, E.; Talib, J.; Beck, H.E.; Singer, M.B.; et al. Warming accelerates global drought severity. Nature 2025, 642, 628–635. [Google Scholar] [CrossRef] [Scilit] [PubMed]
- Lu, Y.; Yang, T.; Fu, J.; Song, W. Utility of the standardized precipitation evapotranspiration index (SPEI) to detect agricultural droughts over China. J. Hydrol. Reg. Stud. 2025, 58, 102190. [Google Scholar] [CrossRef] [Scilit]
- Mancilla, M.A.; Moncada, W.; Silva Alvarado, V.L. A New Machine Learning Algorithm to Simulate the Outlet Flow in a Reservoir, Based on a Water Balance Model. Limnol. Rev. 2025, 25, 29. [Google Scholar] [CrossRef] [Scilit]
- Lawrence, D.M.; Slater, A.G. The contribution of snow condition trends to future ground climate. Clim. Dyn. 2010, 34, 969–981. [Google Scholar] [CrossRef] [Scilit]
- Alimkulov, S.; Makhmudova, L.; Talipova, E.; Baspakova, G.; Monkayeva, G. Assessment of the impacts of climate change on drought intensity and frequency using SPI and SPEI in the Southern Pre-Balkash region, Kazakhstan. Watershed Ecol. Environ. 2025, 7, 11–22. [Google Scholar] [CrossRef] [Scilit]
- Pyarali, K.; Peng, J.; Disse, M.; Tuo, Y. High Resolution Standardized Precipitation Evapotranspiration Index (SPEI) Dataset for Central Asia; NERC EDS Centre for Environmental Data Analysis: Oxfordshire, UK, 2022. [Google Scholar] [CrossRef]
- Ogunrinde, A.T.; Adigun, P.; Xue, X.; Koji, D.; Jing, Q. Spatiotemporal analysis of drought patterns and trends across Africa: A multi-scale SPEI approach (1960–2018). Int. J. Digit. Earth 2025, 18, 2447342. [Google Scholar] [CrossRef] [Scilit]
- Gardiya Weligamage, H.; Fowler, K.; Peterson, T.J.; Saft, M.; Peel, M.C.; Ryu, D. Partitioning of precipitation into terrestrial water balance components under a drying climate. Water Resour. Res. 2023, 59, e2022WR033538. [Google Scholar] [CrossRef] [Scilit]
- Hasan, I.A.; Yuce, M.I. Prediction of Potential Evapotranspiration via Machine Learning and Deep Learning for Sustainable Water Management in the Murat River Basin. Sustainability 2024, 16, 11077. [Google Scholar] [CrossRef] [Scilit]

Disclaimer/Publisher’s Note: The statements, opinions and data contained in all publications are solely those of the individual author(s) and contributor(s) and not of MDPI and/or the editor(s). MDPI and/or the editor(s) disclaim responsibility for any injury to people or property resulting from any ideas, methods, instructions or products referred to in the content. |
© 2026 by the authors. Licensee MDPI, Basel, Switzerland. This article is an open access article distributed under the terms and conditions of the Creative Commons Attribution (CC BY) license.