


Highlights
What are the main findings of your research?
- Improving irrigation efficiency reduces gross irrigation requirements and unmet water demand across avocado-producing municipalities.
- Benefits vary spatially, and some municipalities retain irrigation deficits despite technological improvements.
- The findings support municipality-specific irrigation planning and water-allocation decisions.
- Integrating seasonal crop water requirements, water rights, and sensitivity analyses identifies areas requiring additional water-management strategies.
Abstract
Water scarcity challenges avocado production in Michoacán, where irrigation requirements and water-allocation constraints vary among municipalities. This study developed a Water–Food Nexus optimization framework for six avocado-producing municipalities using a monthly linear programming model incorporating variable crop coefficients, water-right-based allocation limits, and hypothetical rainwater harvesting. Three irrigation efficiencies were evaluated: sprinkler (0.70), micro-sprinkler (0.80), and drip irrigation (0.95). A four-stage lexicographic optimization prioritized deficit minimization and efficient water allocation. Increasing irrigation efficiency from 0.70 to 0.95 reduced modeled gross irrigation demand from 308.23 to 227.11 Mm3 year−1 (26%) and unmet demand from 26.31 to 10.91 Mm3 year−1 (59%), increasing regional coverage from 92% to 95%. Under drip irrigation, Uruapan and Tancítaro achieved practically complete coverage, whereas Salvador Escalante reached only 73%. Sensitivity analyses confirmed that these outcomes depend on water-allocation and delivery conditions. Higher efficiency also reduced estimated production losses. However, reductions in gross irrigation demand do not necessarily represent net basin-scale water savings, as consumptive use and return flows were not quantified. The framework supports municipality-specific irrigation-management strategies under defined water-allocation constraints.
1. Introduction
The relationship between water availability and agricultural production is one of the main challenges for the sustainable management of global food systems. Population growth, changing consumption patterns, and economic development are expected to increase pressure on agricultural resources [1,2]. By 2050, projections indicate that the world’s population will reach 9 billion people [3], which will require raising global food production by nearly 50% compared with 2012 [1] and will force farmers to increase crop yields in order to achieve food security, exacerbating water scarcity. Since food production and food security are intrinsically linked to water availability and water security [4], the evaluation of water resources has become a priority approach at the global level [5].
Globally, agriculture is the largest user of freshwater, accounting for nearly 70% of the water withdrawn from lakes, rivers, and aquifers [6]. Furthermore, approximately 352 million hectares of land worldwide were equipped for irrigation in 2021, representing 22% of the global cropland [7]. Agriculture accounts for around 72% of global freshwater withdrawals, a share that exceeds 80% in Africa and Asia [8].
Occupying nearly one-fifth of the world’s arable land, irrigated agriculture accounts for more than 40% of global food production [9] and is essential for meeting the growing global demand for agri-food products. However, in regions with water scarcity, agricultural water use exacerbates competition with other essential uses such as drinking water, sanitation, and energy, while the overexploitation of water resources and excessive groundwater extraction [10,11] threaten sustainable agricultural development [12].
For this reason, the improvement and optimization of irrigation systems are key strategies for ensuring food security through an approach that evaluates their benefits and trade-offs across different sectors [9]. Within this framework, the Water–Food Nexus (WFN) has gained prominence as a fundamental analytical framework for achieving equitable, balanced, and sustainable resource management [5,13]. Assessment models related to this nexus allow for the prediction of future scenarios in the face of scarcity, although the joint allocation of land and water resources involves a high degree of uncertainty regarding local water availability [14]. In irrigated agriculture, improving irrigation efficiency is often proposed as a key intervention to reduce water use without compromising yields [15].
This dilemma is particularly acute in Mexico, a country characterized by severe water scarcity, water pollution, and unequal access to water among its population. Over the past 30 years, Mexico has led global avocado production, accounting for 29% of the global total and meeting 34% of international demand [16]. At the national level, avocados stand out as one of the main crops due to their high economic value in international markets [17] and their high irrigation water demand, estimated at around 750 m3/ton [18]. Despite this leading position, global supply is highly concentrated geographically: approximately 45% of global trade volume comes from the so-called Avocado Belt in the state of Michoacán [18]. Over the past five decades, cultivation has expanded rapidly on the Purépecha Plateau [16]. Production in Michoacán is concentrated in 32 municipalities, with Tancítaro, Uruapan, Tacámbaro, Salvador Escalante, Ario de Rosales, and Peribán accounting for approximately 70% of the total area [19]. While this position cements Michoacán’s status as a key economic driver, the rapid conversion of forests into commercial orchards has led to severe ecological challenges and the depletion of water sources in regions that were historically abundant [16,19,20].
Studies show that avocado production has a high-water footprint and that the estimated demand for water for agricultural use can amount to as much as 120% of the surface and groundwater volumes legally allocated for agricultural purposes [18]. This discrepancy between estimated water demand and legally allocated volumes can intensify competition among water users, increase pressure on local water resources, and lead to conflicts regarding water rights and various social concerns [18]. The discrepancy between the irrigation requirements of avocados and the volumes of water rights for agricultural use registered with the National Water Commission (CONAGUA) poses a fundamental challenge to the long-term sustainability of this crop. Avocado production relies on water extraction to maintain productivity, yet previous studies have highlighted the growing pressure on local water resources and the limitations inherent in legally registered water allocations [18,21]. In this context, it is necessary to assess whether irrigation demand can be met within the existing administrative allocation constraints. However, the registered volumes used in this study must be distinguished from hydrological availability and actual water extractions, neither of which is directly quantified in the present analysis.
Although previous studies have quantified the water footprint of avocados, assessed their socio-environmental impacts, and projected scenarios for deforestation and water availability [16,17,20], few studies explicitly integrate agronomic requirements, legal concession limits, and intermunicipal spatial heterogeneity into a unified optimization framework [16]. However, integrating these elements requires considering not only the annual volume of available water but also its temporal distribution and the different constraints faced by individual municipalities. In particular, the effectiveness of irrigation modernization may differ substantially among locations depending on their registered water allocations, available water sources, and seasonal irrigation requirements. Therefore, a municipality-level allocation framework is needed to identify whether reductions in irrigation demand are sufficient to eliminate modeled irrigation deficits or whether allocation constraints persist despite efficiency improvements.
Agricultural water management increasingly relies on optimization approaches to improve water allocation and sustain crop production under limited water availability. Linear programming has been used to optimize irrigation water use by considering crop water requirements and effective precipitation [22], while other optimization frameworks account for multiple water sources and uncertainty in water availability [23]. Recent research has also emphasized the potential to incorporate water footprint indicators, multiple objectives, and economic and environmental constraints into agricultural water management models [24]. Building on this body of research, the present study applies a multi-stage linear programming framework to avocado-producing municipalities in Michoacán, Mexico, integrating municipal water allocation, irrigation technology scenarios, and the temporal distribution of water deficits. Its main contribution is the joint assessment of these factors under municipality-specific resource constraints, extending the analysis beyond irrigation scheduling at the field level.
Alongside mathematical optimization, data-driven approaches and artificial intelligence (AI) are increasingly being explored to support agricultural water management. Machine learning techniques have been investigated to improve irrigation decision-making using information on soil moisture, weather conditions, and crop water requirements [25]. In addition, digital technologies such as remote sensing and sensor-based monitoring offer opportunities to improve the assessment of agricultural water needs and support more informed irrigation planning [26]. Recent research has further highlighted the expanding role of AI in agriculture, including applications related to crop production, resource-use efficiency, and environmental sustainability [27].
Therefore, the main objective of this research is to evaluate whether the irrigation demand of avocado cultivation can be met within the surface and groundwater allocation limits represented in the model, under different irrigation efficiency scenarios using a GAMS optimization model applied to the priority municipalities in the study area (Figure 1). This will identify the municipalities where efficiency improvements are sufficient to reduce or eliminate the modeled irrigation deficits and those where allocation constraints persist.
Figure 1.
Outline of the methodological framework for optimizing the assessment of the water–food nexus in avocado production in Michoacán.
2. Materials and Methods
2.1. Study Area
The study area comprises six avocado-producing municipalities in the state of Michoacán, Mexico: Uruapan, Tancítaro, Peribán, Ario de Rosales, Salvador Escalante, and Tacámbaro. These municipalities are located within the so-called Michoacán Avocado Belt, spanning geographic coordinates between 18.7° N and 20.1° N latitude and 100.1° W and 102.9° W longitude [28], and constitute the country’s main avocado-producing area [29]. Together, they account for approximately 70% of the state’s avocado-growing area [19]. Geographically, these municipalities are located in the Purépecha Plateau ecoregion and along the Trans-Mexican Neovolcanic Belt, which is characterized by altitude, temperature, precipitation, and volcanic soils that are favorable for avocado cultivation (Persea americana Mill., in particular cv. Hass) [16]. The spatial distribution of the municipalities included in the study is shown in Figure 2. The municipal boundaries were obtained from the INEGI’s 2025 Geostatistical Framework [30], processed and mapped using QGIS 3.44, and subsequently edited for visual presentation.
Figure 2.
Location of the study area in Michoacán, México.
2.2. Data Sources and Data Processing
The database integrated agricultural, climatic, geospatial, and administrative information on water rights. To ensure methodological traceability, the data were classified into four categories: data observed or reported by official sources; variables derived using equations; parameters obtained from literature; and assumptions used exclusively for scenario analysis.
2.2.1. Agricultural Data
The agricultural data were obtained from the agricultural production system of the Agri-Food and Fisheries Information Service (SIAP) [31]. This source provides data on planted areas, harvested areas, production, and yield, disaggregated down to the municipal level and by irrigation type.
The 2025 agricultural year was used as the baseline production condition. For each municipality, records corresponding to irrigated avocado cultivation were extracted. Although the original dataset also contains information on rain-fed production, the optimization model developed in this study considers only the area under irrigation.
The SIAP database shows 45,501 ha of irrigated cropland and 556,245 metric tons of irrigated production for the six municipalities. The area and production for the municipalities analyzed are presented in Table 1.
Table 1.
Irrigated avocado area and annual production in the study area.
Crop yield was calculated as the ratio of reported production to harvested area, whereas the planted irrigated area was used as the reference area for estimating irrigation water requirements in the optimization model. For the study area, total planted and harvested areas were 45,501 and 44,954 ha, respectively, resulting in a production-weighted regional yield of 12.37 . This distinction ensures consistency between the agricultural indicators reported by SIAP and the area considered in the water-allocation model.
The agricultural area and avocado production data for 2025 were obtained from SIAP to represent the most recent agricultural conditions in the study area. These data were combined with the average climatic conditions for 1991–2020 to evaluate water requirements under representative long-term conditions rather than those of a specific year. Therefore, the study does not aim to reproduce the actual water balance of 2025, but to assess water availability and irrigation performance under a standardized scenario.
To link the reference yield to the irrigated area, the coefficient was defined:
where represents a reference production coefficient per irrigated hectare, not the conventional agronomic yield.
The purpose of the meteorological analysis was to obtain, for each municipality and month, the variables needed to estimate the irrigation requirements for avocado crops.
2.2.2. Weather Data
Water Requirements for Crops
The water assessment was based on the crop water requirement (CWR, ) approach and on the distinction between green water derived from effective precipitation and blue water corresponding to the additional irrigation requirement. The term CWR refers to the volume of water a crop needs to grow and produce its specific product [17], and depends on the atmosphere’s evaporative power, which is represented by reference evapotranspiration ( and the crop’s water use characteristics and phenology, which can be summarized by the crop coefficient (Kc, dimensionless) [23].
The methodological framework followed the principles used by [18], who estimated the crop’s water requirement based on the ratio of reference evapotranspiration ( and cropping coefficient (, and then separated the green and blue components.
The CWR is calculated by multiplying the and under standard conditions, that is, with no water limitations on crop growth. The CWR is equal to the crop’s actual evapotranspiration () [18].
Reference Evapotranspiration ET0
Reference Evapotranspiration for crops represents the atmospheric water demand for each crop type, growth stage, and management practice. However, in several regions of the world, meteorological observations are not always available [32]. In this paper, , was obtained from the agroclimatic dataset AgERA5, available through the Copernicus Climate Data Store [33], which is a relatively new climate dataset designed specifically for agricultural applications [34]. Based on these findings, monthly precipitation records from the CHIRPS satellite product were used in this study [35]. The 1991–2020 climatological reference period was selected to provide a consistent, continuous basis for characterizing precipitation across the six municipalities.
The reference evapotranspiration variable included in AgERA5 is based on the standardized model FAO56 Penman-Monteith. It is considered the standard and simplest method for representing plant water use and the evaporative demand of a reference area, and is useful for planning and the efficient use of agricultural water resources [36,37,38]. For avocado cultivation, Kaneko et al. [37] examined the relationship between reference evapotranspiration and avocado water use, highlighting the relevance of crop coefficients and factors such as soil type, fruit load, and shaded area in estimating crop water requirements. Using a climatological period makes it possible to represent long-term average atmospheric conditions and reduce the influence of anomalies typical of individual years. The AgERA5 data were obtained from the Copernicus Climate Data Store [33].
Crop Coefficient and Evapotranspiration of Avocados
The amount of water equal to that lost from a cultivated field through evapotranspiration is known as the crop’s water requirement [39]. It is expressed as the ET rate in mm/day and can be calculated using Equation (2) [40]:
The values of were based on studies conducted on avocados in Michoacán, where coefficients of approximately 0.60 for the initial stage, 0.85 for the middle stage, and 0.75 for the final stage were reported. Fuerte-Velázquez et al. [17] used these parameters in a water footprint analysis of avocados using CROPWAT [23], which is an empirical method that uses the daily balance of soil moisture content as the basis for its calculations [36].
In this study, a variable crop coefficient was used to account for changes in avocado water requirements throughout the year. The selection of values and their corresponding periods was based on studies conducted in Michoacán, Mexico. Rocha-Arroyo et al. [41] reported that the main flowering period of ‘Hass’ avocado occurs between December and February, with flowering commonly observed around 20 January. Similarly, Gómez-Tagle et al. [18] used 14 January as the reference date for the beginning of the flowering stage in their study of avocado water requirements in Uruapan, Michoacán. Based on these studies, 14 January was selected as the starting date of the annual crop cycle. The Kc values were taken from Fuerte-Velázquez and Gómez-Tagle [42], who reported coefficients of 0.60 for the initial stage (90 days), 0.85 for the middle stage (215 days), and 0.75 for the final stage (60 days). These values were used to calculate monthly coefficients according to the number of days corresponding to each stage. This approach follows the FAO-56 methodology [43], which considers changes in crop water requirements during different growth stages. In addition, Kaneko et al. [37] and Montazar et al. [44] reported variations in avocado crop coefficients throughout the year, supporting the use of variable values. Since detailed information on the flowering dates and growth stages of individual orchards was not available for all municipalities, the same representative annual crop cycle was considered for the study area.
Effective Precipitation
The effective precipitation is the fraction of precipitation that can help meet the evapotranspiration requirement [36]. This is defined as the portion of total precipitation that is available to support crop growth [40]. It was estimated to use the Smith/CROPWAT empirical method presented in Equation (3) [42]:
Previous studies have evaluated the performance of CHIRPS precipitation estimates under different climatic conditions. Rodríguez-Herrera et al. [45] assessed CHIRPS (Climate Hazards Group InfraRed Precipitation with Stations) precipitation estimates in Mexican basins, while Rivera et al. [46] evaluated their performance in the Central Andes of Argentina. In this study, monthly precipitation data for the 1991–2020 reference period were obtained from the CHIRPS dataset [35]. Municipal precipitation values were spatially aggregated using the boundaries provided by the 2025 INEGI Geostatistical Framework [30].
where is the total monthly rainfall .
Irrigation Requirement (IR)
Irrigation Requirement represents the fraction of water demand due to evapotranspiration , which is not covered by the actual precipitation and is defined as the net amount of water that must be applied through irrigation to meet the crop’s water requirement during its production cycle [47]. It was calculated using the following equation [36]:
Gross Water Demand and Irrigation Efficiency Scenarios
Irrigation Efficiency () is a crucial factor in improving water management as demand for water increases [48]. Previous studies have reported differences in application efficiency between sprinkler and localized irrigation systems [49]. Accordingly, three illustrative efficiency scenarios were adopted: sprinkler irrigation (0.70), micro-sprinkler irrigation (0.80), and drip irrigation (0.95). These values represent technical modeling assumptions rather than field-measured efficiencies in the study municipalities.
2.2.3. Agricultural Water Records
The water volumes allocated to the agricultural sector in each municipality were obtained from the Public Registry of Water Rights (REPDA) of the National Water Commission (CONAGUA) [50]. The records were compiled by municipality and categorized according to the source of the water, distinguishing between surface water and groundwater. Only those records classified as agricultural use were retained for this analysis.
Table 2 presents the annual water volumes registered for agricultural use in the municipalities that comprise the study area. These values correspond to the municipal agricultural sector as a whole and therefore include water registered for different crops, not exclusively for avocado production.
Table 2.
Annual volumes of surface and groundwater registered for agricultural use in the municipalities of the study area.
Since the water rights registered in REPDA correspond to agricultural use at the municipal level and do not systematically identify the volumes assigned to individual crops, a proportional allocation method based on irrigated agricultural area was adopted. This approach avoids assuming that the entire agricultural water volume of a municipality is available for a single crop and provides a basis for estimating an upper limit on water allocation.
The proportional allocation factor () for each municipality r was defined as:
where represents the irrigated avocado area in municipality , and is the total irrigated agricultural area , including all annual and perennial crops reported in the SIAP [31].
This factor was then applied separately to the annual volumes of surface water () and groundwater () registered in REPDA:
where and represent the estimated annual surface water and groundwater allocation limits for avocado production (). These limits were applied independently to each municipality and water source in the optimization model. They represent estimated administrative water allocation limits for avocado production and should not be interpreted as official water concessions granted exclusively to this crop.
Table 3 summarizes the irrigated agricultural areas, allocation factors, and estimated water volumes obtained using the proportional allocation method.
Table 3.
Irrigated agricultural area, proportional allocation factors, and estimated annual water volumes associated with avocado cultivation in the study area.
The proportional allocation method assumes that agricultural water rights can be estimated based on a uniform distribution of water per unit of irrigated agricultural area within each municipality [51]. The use of the allocation factor is supported by water management principles applied when direct measurements of water use at the field level are not available. Studies on water rights management indicate that proportional allocation is a commonly used rule for distributing annual water allocations within an aquifer or river basin, providing a similar water volume per irrigated hectare regardless of crop type or productivity [52]. Gillet and Biancalani [53] indicate that the total harvested irrigated crop area provides a close relationship between irrigation water use and actual agricultural production. This supports the use of agricultural area as a practical basis for estimating water allocation when crop-specific data are unavailable, while avoiding the assumption that all municipal agricultural water rights are intended for a single crop.
However, this approach represents a modeling assumption rather than a direct measurement of crop-specific water rights. Therefore, the proportional allocation factors should be understood as a transparent approximation of the water rights potentially associated with avocado production, rather than their actual legal distribution. Consequently, the feasibility of the optimization model indicates whether avocado irrigation requirements can be met under the estimated administrative water allocation limits, but it does not establish whether agricultural water use is environmentally sustainable in the long term.
2.3. Mathematical Optimization Model
Table 4 summarizes the sets, indices, and elements considered in the model. Sets (R) and (M) represent the municipalities and months, respectively, and are used in the linear programming optimization, while set (K) represents the irrigation technologies evaluated in the optimization scenarios. In contrast, set (Y) represents the crop response factor Ky scenarios (1.10, 1.20, and 1.30), which are used in the subsequent post-optimization sensitivity analysis to estimate potential avocado yield losses under water-deficit conditions.
Table 4.
Sets, Indices, and Elements Considered in Optimization and Crop Response Analysis.
A linear programming model with monthly resolution was developed to allocate irrigation water within the modeled surface-water and groundwater allocation limits for avocado production in the six municipalities of the study area. The irrigated area remained constant across all scenarios; therefore, the model does not adjust the area served as a means of reducing demand. Water transfers between municipalities were also not considered; that is, each municipality is subject to its own limits regarding the allocation of surface water and groundwater, established through models, as well as to the theoretical rainwater harvesting and storage capacity defined for each scenario.
Three application efficiency scenarios were analyzed: 0.70 for sprinkler irrigation, 0.80 for micro-sprinkler irrigation, and 0.95 for drip irrigation. Each scenario was analyzed independently. In the first stage, the total water deficit was minimized; while maintaining that result, groundwater use was then minimized, followed by surface water use. Finally, the deficit was redistributed across months within each municipality while preserving the annual regional and municipal results for deficit and water source use obtained in the previous stages.
2.3.1. Irrigation Requirements and Water Balance
The model is based on the monthly gross requirement calculated for 70% efficiency. Starting from that baseline scenario, the requirement per hectare is adjusted according to the efficiency of each technology:
The monthly balance is calculated for each municipality and month:
Demand is met with groundwater, surface water, and previously stored rainwater. The volume that cannot be met is recorded as a shortfall. The monthly water intake first enters storage and can then be used for irrigation through . Furthermore, variables related to water transfers between municipalities are not included, so water allocated to one municipality cannot be used to meet the demand of another. This restriction reflects the municipality-level management perspective adopted in this study. Allowing unrestricted transfers between municipalities could compensate for local water deficits using resources allocated to other administrative areas and would therefore mask spatial differences in irrigation requirements and represented water-allocation limits. Maintaining independent municipal water balances allows the optimization to identify where irrigation efficiency is sufficient to satisfy modeled demand and where water allocation constraints persist despite technological improvements.
2.3.2. Water Source Restrictions and Rainwater Storage
Annual water use is capped separately for each municipality:
Sensitivity Analysis of Monthly Water-Delivery Capacity
The optimization model was formulated as a strategic water-allocation framework in which groundwater and surface water withdrawals are constrained by municipality-specific annual allocation limits derived from REPDA records. These limits represent the modeled annual allocation associated with avocado cultivation rather than direct measurements of monthly hydrological availability or installed water-delivery capacity.
Because the temporal distribution of irrigation water may also depend on pumping, diversion, and conveyance capacities, an additional sensitivity analysis was conducted to assess the implications of monthly delivery constraints without modifying the principal optimization framework.
For each municipality , month , and water source , the following supplementary constraint was introduced:
where is the monthly water allocation (), is the modeled annual allocation limit for the corresponding source (), is the number of days in month (), and is a dimensionless monthly delivery-capacity multiplier.
The original formulation was retained as the reference case, with no additional monthly delivery-capacity constraints. Two alternative scenarios were evaluated: A1, with = 2.0, and A2, with = 1.5, applied independently to surface water and groundwater.
These values were selected as illustrative capacity stress tests rather than as empirically calibrated infrastructure parameters. The original annual allocation constraints remained active in both scenarios, ensuring that the supplementary monthly restrictions did not increase the total water available over the year.
All scenarios retained the same crop water requirements, irrigation efficiencies, irrigated areas, rainwater-harvesting assumptions, and four-stage optimization procedure. Consequently, differences among the original scenario, A1, and A2 can be attributed to the imposed monthly delivery-capacity constraints.
This analysis quantifies the sensitivity of the modeled water allocation to temporal delivery limitations. It does not establish the actual monthly availability of surface water or groundwater, which would require source-specific hydrological observations and information on installed pumping and conveyance infrastructure.
Given the scarcity of water resources for agriculture, rainwater harvesting is a promising alternative [54]. In this study, given the lack of information on installed infrastructure or catchment coefficients specifically calibrated for the municipalities analyzed, rainwater capture and storage were incorporated as hypothetical management scenarios. The literature indicates that the volume that can actually be harnessed depends on precipitation, runoff, the characteristics of the catchment area, and the design of the storage structures; therefore, these parameters must be defined based on the specific conditions of the system [54,55,56]. In this context, a rainwater capture fraction of was adopted, equivalent to 10% of non-effective precipitation, and a storage capacity of the annual catchment potential. Both values were used as scenario assumptions and do not represent measured or calibrated coefficients for the region. Therefore, the resulting rainwater storage potential should be interpreted as a scenario-based management option rather than as a representation of existing harvesting infrastructure. The purpose of including this source is to evaluate its potential contribution to seasonal irrigation supply under the assumed harvesting conditions. Consequently, the results do not imply that the corresponding storage capacity is currently installed or that the estimated harvested volumes represent measured withdrawals.
Captured rainwater is considered an available water resource, with no explicit cost associated with its collection, conveyance, or storage. Therefore, when it is available and feasible within the constraints of the model, it can be prioritized for irrigation, which reduces the modeled demand for groundwater and surface water extraction. This premise does not imply that rainwater harvesting is free in practice, as infrastructure, maintenance, and storage may entail additional costs that are not accounted for in the current framework.
where 10 is the conversion factor used to convert rainfall depth (mm) into water volume ().
The monthly volume of collected rainwater is constrained by the estimated harvesting potential, as follows:
Storage capacity per hectare was defined as a fraction of the annual recharge potential:
The storage balance links the months through an inventory balance:
For January, the storage balance is linked to the final storage volume of December through the following cyclic condition:
The stored volume cannot exceed the available capacity:
so that the water stored during the wet season can be used during the following dry season.
Rainwater Harvesting and Storage Sensitivity Analysis
Rainwater harvesting was incorporated as a hypothetical water-management alternative rather than as a representation of existing infrastructure. The reference scenario assumes that 10% of the difference between total and effective precipitation can potentially be recovered over the irrigated avocado area. This fraction represents an aggregate recovery assumption and does not correspond to a measured runoff coefficient, an identified physical catchment area, or an empirically determined collection efficiency.
In physical rainwater-harvesting systems, the recoverable volume depends on rainfall, contributing catchment area, runoff characteristics, and collection efficiency [56,57]. Moreover, the difference between total and effective precipitation cannot be directly interpreted as physically collectable runoff.
The storage-capacity parameter was defined as 75% of the estimated annual harvesting potential. This parameter represents a hypothetical maximum storage capacity rather than a measured storage efficiency or existing reservoir volume. Previous research has demonstrated that storage performance depends on reservoir dimensions, seasonal water availability, and water losses [58,59].
To evaluate the uncertainty associated with these assumptions, three additional scenarios were considered: H0, with no rainwater harvesting or storage; H1, with the harvesting fraction reduced from 10% to 5%; and H2, with the storage-capacity factor reduced from 75% to 38%.
All scenarios maintained the same crop water requirements, irrigation technologies, agricultural areas, and annual surface-water and groundwater allocation limits. Consequently, differences in irrigation deficits can be attributed to changes in the assumed rainwater-harvesting and storage parameters.
The analysis evaluates the potential contribution of rainwater harvesting to regional irrigation management. It does not establish the existence, technical feasibility, or economic viability of the corresponding infrastructure.
Sensitivity Analysis of Annual Water-Allocation Limits
To evaluate the sensitivity of irrigation coverage to the annual water-allocation constraints, two additional scenarios were considered. In scenario R80, the annual municipal surface-water and groundwater allocation limits were reduced by 20%, whereas scenario R60 applied a 40% reduction to both sources. The reference scenario retained the original allocation limits estimated from REPDA records.
All scenarios maintained the same irrigated areas, seasonal crop coefficients, climatic conditions, irrigation efficiencies, and rainwater-harvesting and storage assumptions. The four-stage lexicographic optimization procedure was applied independently to each scenario and irrigation technology. Municipal irrigation coverage was calculated as the percentage of annual gross irrigation demand satisfied by the optimized water allocation.
These scenarios represent hypothetical reductions in administrative water-allocation limits and should not be interpreted as simulations of observed hydrological drought conditions.
2.3.3. Optimization Strategy
The optimization hierarchy was established to prioritize the satisfaction of irrigation demand before considering water-source utilization and temporal deficit distribution. Stage one minimizes the total irrigation deficit, stage two minimizes groundwater withdrawal, and stage three minimizes surface-water withdrawal. Stage four then minimizes the maximum monthly relative irrigation deficit while maintaining the annual allocation results within predefined preservation tolerances. This sequential approach establishes the priority of each objective and limits deviations from the outcomes of the preceding stages.
The first phase focuses on minimizing the regional water deficit:
The minimum value obtained is denoted as , and to ensure that this deficit level does not worsen in later stages of the optimization, the following constraint is imposed:
where represents a small numerical tolerance used to preserve the achieved optimum.
Equation (20) corresponds to the second stage:
In other words, after identifying the smallest possible deficit, the model now seeks to use as little groundwater as possible, without allowing the minimum deficit determined in Stage 1 to increase.
The minimum groundwater level obtained is identified as In the third stage, that value is also maintained, and surface water is minimized:
Numerical Implementation
The four-stage lexicographic linear programming model was implemented in GAMS version 48.6.1 and solved using IBM ILOG CPLEX version 22.1.1.0. The absolute tolerances used to preserve the previously optimized deficit and groundwater objectives during the initial lexicographic stages were set to εD = εGW = εSW = 0.001 m3. In Stage 4, bilateral preservation bands of were imposed on the annual municipal and regional totals of irrigation deficit, groundwater withdrawals, and surface-water withdrawals.
The fourth-stage objective minimizes the maximum monthly relative irrigation deficit across all municipality-month combinations with positive irrigation demand. This is a global minimax objective rather than the sum of municipality-specific maximum deficits. Accordingly, optimization reduces the worst monthly relative deficit while allowing the temporal allocation pattern to change within the specified annual preservation constraints. It does not guarantee uniform monthly deficit distribution for every municipality.
All four optimization stages returned an optimal model status (ModelStat = 1) and normal solver completion (SolveStat = 1) for the three-reference irrigation-efficiency scenarios. The optimal objective values are reported in Table 5.
Table 5.
Optimal objective values obtained from the four-stage lexicographic optimization under different irrigation technologies.
2.3.4. Temporal Adjustment of the Monthly Deficit
The first three optimization stages determine the annual irrigation deficit and the corresponding groundwater and surface-water allocations. However, these annual results do not uniquely define their monthly distribution. Therefore, a fourth optimization stage was introduced to minimize the maximum monthly relative irrigation deficit across all municipalities and months with positive irrigation demand.
At the end of stage three, the annual municipal allocations are recorded, together with the regional objective values obtained in the preceding stages. During stage four, these values are preserved within bilateral tolerance bands of , as defined in Equations (22) and (23).
Equation (22) establishes the preservation limits for the annual regional deficit and groundwater and surface-water withdrawals. Equation (23) applies the same principle to the annual totals of each municipality. These constraints allow limited deviations from the previously optimized results without imposing exact equality.
For both equations, , , and were set to 10 m3. The values marked with an asterisk (*) represent the reference results obtained in the preceding optimization stages.
For months with positive irrigation demand, the monthly relative deficit is calculated as follows:
where represents the portion of monthly demand that cannot be met.
The variable represents an upper bound on the relative monthly irrigation deficits across all municipalities and months with positive irrigation demand:
The objective function of the fourth optimization stage minimizes the maximum relative monthly irrigation deficit across all municipalities, while preserving the annual municipal and regional outcomes obtained in the previous optimization stages within the specified numerical tolerances:
In the optimal solution, represents the largest relative monthly irrigation deficit across the study region. By minimizing this value, Stage 4 seeks to reduce the most severe relative monthly shortage while maintaining the annual regional and municipal water-allocation results within the established tolerance bands. This formulation does not guarantee uniform deficits across municipalities or months. The monthly distribution of water sources, irrigation deficits, and rainwater storage may change without increasing the available water resources.
2.4. Sensitivity Analysis of Production Using Ky
Once the water solution for each efficiency scenario was obtained, the potential effect of irrigation deficit on avocado production was estimated. This analysis was performed after optimization; therefore, does not alter water allocation or affect the model’s objective functions. Its purpose is to express the sensitivity of yield to a reduction in water availability [60]. The relationship was based on the formulation of the performance response to water deficit [61]:
where and correspond to the actual and maximum yields, respectively, while and represent the actual and maximum evapotranspiration.
For the sensitivity analysis, three values of , based on avocado studies conducted in Michoacán, which reported yield response factors in the range of 1.10–1.30 [17].
Crop water requirements were estimated by considering crop evapotranspiration, effective precipitation, and irrigation application efficiency. Allen et al. [43] describe the estimation of crop evapotranspiration and irrigation requirements, while Döll and Siebert [62] establish the relationship between net and gross irrigation requirements in water demand modeling.
Accordingly, the relative evapotranspiration deficit was estimated by converting the annual unmet gross irrigation volume into an equivalent net water deficit:
where is the estimated relative evapotranspiration deficit; is irrigation application efficiency; is the annual unmet gross irrigation demand (); is the irrigated area (ha); and is the annual crop evapotranspiration requirement (mm), obtained by summing the monthly values calculated using the FAO-56 methodology [43]. The factor 10 converts water volume and irrigated area into an equivalent water depth.
This formulation assumes that unmet net irrigation demand results in an equivalent evapotranspiration deficit, without additional compensation from soil-water reserves. Effective precipitation is already accounted for in the calculation of net irrigation requirements.
The annual gross irrigation requirement per hectare was calculated as:
The total annual gross irrigation demand was determined by multiplying the annual requirement per hectare by the reference irrigated area:
The annual irrigation deficit was obtained by summing the monthly unmet irrigation volumes resulting from the optimization:
where represents the annual unmet irrigation demand of municipality, and is the corresponding monthly irrigation deficit. Each irrigation technology scenario was evaluated independently.
The reference production coefficient defined in (1) was used to calculate the reference production associated with the irrigated area.
Using the estimated relative evapotranspiration deficit and the selected values, adjusted production was calculated for each irrigation efficiency and yield response scenario:
where represents the estimated adjusted production (ton), and is the reference production derived from SIAP records. The non-negativity condition prevents negative production estimates under severe water deficit scenarios.
Estimated production losses were calculated as the difference between reference and adjusted production:
Finally, the performance factor was calculated as the ratio of adjusted production to baseline production:
The resulting values provide an assessment of avocado production sensitivity under different irrigation efficiency and water availability scenarios. Nevertheless, actual crop evapotranspiration also depends on soil-water availability within the root zone and plant water status [43,63]. Experimental evidence further indicates that irrigation regimes influence avocado yield and fruit quality [64].
Therefore, the estimated production losses should be interpreted as assumption-dependent sensitivity outcomes rather than experimentally validated yield predictions. Furthermore, SIAP-reported production was used as the reference production level and does not necessarily represent the maximum attainable yield assumed in the original yield-response relationship.
3. Results
All results presented in this section are contingent upon scenarios regarding irrigation technical efficiency, allocation limits derived from the REPDA, and the hypothetical assumptions concerning rainwater harvesting and storage described above. Consequently, the variations in demand and deficit represent model-derived results and should not be interpreted as observed water savings or measured changes in water withdrawals.
The optimal objective values obtained at each stage of the lexicographic optimization are summarized in Table 5. The results demonstrate the sequential minimization of irrigation deficits, groundwater withdrawals, and surface-water withdrawals, followed by the minimization of the maximum relative monthly deficit while preserving the annual allocation outcomes within the specified numerical tolerances.
3.1. Regional Water Balance Response to Changes in Irrigation Efficiency
Figure 3 illustrates the regional water balance under the three irrigation efficiency scenarios, considering a fixed irrigated avocado area of 45,501 ha. Increasing irrigation efficiency from 70% to 95% reduced the modeled gross irrigation demand from 308.23 to 227.11 , representing a decrease of 26%. Under the intermediate micro-sprinkler scenario (80%), gross irrigation demand reached 269.70 . The improvement in irrigation efficiency also reduced the use of conventional water sources. Surface water use decreased from 229.61 to 185.51 , while groundwater use declined from 36.55 to 14.94 . In contrast, the volume of harvested rainwater used remained practically constant across all three scenarios, at approximately 15.75 Mm3 year−1.
Figure 3.
Regional balance under the three efficiency scenarios.
The regional irrigation deficit decreased from 26.31 under sprinkler irrigation to 18.57 with micro-sprinkler irrigation and 10.91 under drip irrigation. This represents a 59% reduction in unmet irrigation demand between the 70% and 95% efficiency scenarios. Consequently, regional water-demand coverage increased from 92% to 95%. These improvements are primarily associated with the reduction in gross irrigation requirements needed to maintain the same cultivated area, rather than an increase in water availability. Therefore, the results demonstrate the potential contribution of irrigation efficiency improvements to reducing water deficits and dependence on conventional water sources under the allocation limits and rainwater-harvesting assumptions considered in the model.
3.2. Municipal Differences in Meeting Demand
Although irrigation efficiency improvements reduced regional water demand and irrigation deficits, their effects varied considerably among the six municipalities (Table 6). Under the scenario, Uruapan, Peribán, Ario de Rosales, and Tacámbaro achieved complete annual water-demand coverage even with sprinkler irrigation (η = 0.70). Tancítaro presented a relatively small deficit under this technology but reached full coverage with micro-sprinkler irrigation (η = 0.80). In contrast, Salvador Escalante continued to experience substantial irrigation deficits under all three technologies. These results indicate that the benefits of irrigation modernization depend on the relationship between local irrigation requirements and the water-allocation limits represented in the model.
Table 6.
Annual water deficit and water supply coverage by municipality under the efficiency scenarios.
In Uruapan, the gross irrigation requirement decreased from 76.56 under sprinkler irrigation to 56.41 with drip irrigation, representing a reduction of 26%. Unlike the previous formulation, this scenario indicates that the municipality achieves complete annual coverage under all three irrigation technologies. Therefore, the principal benefit of increasing irrigation efficiency is not the elimination of an existing deficit, but rather the reduction in the volume required from conventional water sources. Under drip irrigation, groundwater extraction becomes practically unnecessary, illustrating how improved efficiency can reduce dependence on groundwater while maintaining the irrigated area.
Tancítaro exhibited a different response. Under sprinkler irrigation, the municipality presented an annual deficit of 0.81 , corresponding to 96% water-demand coverage. Increasing irrigation efficiency to 80% eliminated this modeled deficit, and complete coverage was maintained under drip irrigation. This result suggests that, under reference allocation limits and assumed rainwater-harvesting conditions, moderate improvements in irrigation efficiency are sufficient to satisfy the municipality’s annual irrigation requirements.
Peribán, Ario de Rosales, and Tacámbaro maintained complete annual coverage across the three irrigation technologies. For these municipalities, greater application efficiency primarily reduced gross irrigation requirements and the volume allocated from surface and groundwater sources, rather than increasing the proportion of demand satisfied.
Salvador Escalante remained the most water-constrained municipality. Under sprinkler irrigation, its annual deficit reached 25.50 , corresponding to water-demand coverage of only 54%. Micro-sprinkler irrigation reduced the deficit to 18.57 and increased coverage to 62%. Under drip irrigation, the remaining deficit decreased to 10.91 , while coverage increased to 73%. The transition from 70% to 95% irrigation efficiency therefore reduced the municipality’s unmet irrigation demand by approximately 57%. Nevertheless, 27% of its annual irrigation requirement remained unsatisfied, indicating that technological improvements alone were insufficient to achieve full coverage under the represented water-allocation constraints.
The concentration of irrigation deficits also changed at the regional level. Under sprinkler irrigation, Salvador Escalante accounted for approximately 97% of the total regional deficit of 26.31 , with the remaining deficit occurring in Tancítaro. Under micro-sprinkler and drip irrigation, essentially all the regional deficit was concentrated in Salvador Escalante. Consequently, the regional water-demand coverage of 95% obtained under drip irrigation masks considerable municipal differences: five municipalities achieved complete coverage, whereas Salvador Escalante remained at 73%. This highlights the importance of municipality-specific water management strategies rather than relying exclusively on regional performance indicators.
Figure 4 illustrates the annual composition of modeled water supply and residual irrigation deficits for the six municipalities under drip irrigation . The results distinguish the contribution of each water source to total irrigation demand from the percentage utilization of the corresponding annual allocation limit. These indicators have different denominators and must therefore be interpreted separately.
Figure 4.
Annual breakdown of water supply by municipality under the drip irrigation scenario (η = 0.95).
In Uruapan, the annual gross irrigation requirement reached approximately 56.41 . Surface water supplied 50.79 , representing 90% of total demand, while collected rainwater contributed approximately 5.63 (10%). Groundwater use was practically zero. Despite being the principal water source, surface water utilization represented approximately 94% of the annual surface-water allocation limit incorporated into the model. Thus, Uruapan achieved full coverage without exhausting the represented surface-water limit or requiring appreciable groundwater extraction.
Tancítaro also achieved complete annual coverage under drip irrigation, although its supply composition differed from that of Uruapan. Surface water contributed approximately 7.80 (48% of total demand), groundwater supplied 6.40 Mm3 year−1 (40%), and collected rainwater provided the remaining 1.995 (12%). Surface-water use reached practically 100% of the annual limit represented in the model, whereas groundwater extraction accounted for approximately 56% of its corresponding limit.
Peribán, Ario de Rosales, and Tacámbaro relied predominantly on surface water. Under drip irrigation, surface water supplied approximately 92%, 96%, and 94% of their respective irrigation requirements. However, these contributions represented only 68%, 64%, and 52% of the corresponding modeled annual surface-water limits. Groundwater extraction was practically unnecessary in these municipalities, while collected rainwater supplied the remaining demand. Therefore, irrigation modernization provided an opportunity to reduce the utilization of conventional water sources in municipalities where water-demand coverage was already complete.
Salvador Escalante presented the most restrictive supply conditions. Under drip irrigation, its annual gross irrigation demand reached approximately 40.84 .
Surface water contributed 19.51 (48% of total demand), groundwater supplied 8.54 (21%), and collected rainwater provided 1.89 (5%). Both surface-water and groundwater withdrawals reached practically 100% of their respective annual modeled limits. Nevertheless, an unmet demand of 10.91 remained.
These results indicate that the persistent deficit in Salvador Escalante cannot be eliminated solely by reallocating water among the sources represented in the model. Even with the highest irrigation efficiency and full utilization of the conventional annual allocation limits, the available modeled supply remains insufficient to meet total irrigation requirements. Consequently, additional management alternatives would be necessary to address the remaining deficit. The results should be interpreted within the estimated administrative water-allocation limits and hypothetical rainwater-harvesting assumptions considered in the study, rather than as direct measurements of hydrological availability or actual water withdrawals.
To ensure the transparency and reproducibility of the water-allocation results, a detailed municipality-level annual water balance is provided in Supplementary Table S1 for the three irrigation efficiency scenarios. The table includes gross irrigation demand, surface-water and groundwater withdrawals, rainwater harvested and used, residual irrigation deficits, annual storage changes, and numerical balance residuals.
3.3. Monthly Breakdown of the Deficit
The monthly analysis of the updated scenario reveals a marked seasonal distribution of irrigation deficits, with the largest shortages occurring between January and May, particularly during April and May (Figure 5). During the main rainfall accumulation period, from June to September, the modeled irrigation deficits were practically zero across all six municipalities. However, irrigation shortages reappeared in October and continued through November and December, reflecting the seasonal variation in crop water requirements associated with the variable crop coefficient.
Figure 5.
Monthly irrigation water deficit under different irrigation systems: (a) sprinkler irrigation (η = 0.70); (b) micro-sprinkler irrigation (η = 0.80); (c) drip irrigation (η = 0.95).
The distribution of monthly deficits differed substantially among municipalities and irrigation technologies. Under sprinkler irrigation , Salvador Escalante presented the largest shortages, with monthly deficits increasing from 1.78 in January to 5.32 Mm3 in May. After the rainy season, the deficit reappeared in October (0.71 Mm3) and increased to approximately 2.87 in December. Tancítaro registered a smaller deficit of approximately 0.81 , concentrated in April, while Uruapan, Peribán, Ario de Rosales, and Tacámbaro maintained practically complete monthly coverage. Consequently, Salvador Escalante accounted for approximately 97% of the regional annual irrigation deficit under sprinkler irrigation.
With micro-sprinkler irrigation , the deficit in Tancítaro was eliminated, while Salvador Escalante remained the only municipality with a substantial water shortage. Its monthly deficit reached 3.84 Mm3 in April and 3.87 in May, compared with 5.27 and 5.32 , respectively, under sprinkler irrigation. The annual deficit in Salvador Escalante decreased from 25.50 to 18.57 , demonstrating the contribution of improved irrigation efficiency to reducing seasonal water shortages without changing the irrigated area.
Under drip irrigation , the monthly deficit was further reduced, although it was not completely eliminated in Salvador Escalante. The maximum monthly shortage occurred in May, reaching approximately 2.28 , followed closely by April (2.26 ). During the final months of the year, deficits of 0.30, 1.13, and 1.23 were recorded in October, November, and December, respectively. The annual deficit decreased to 10.91 , representing a reduction of approximately 57% compared with sprinkler irrigation. The remaining five municipalities maintained practically complete monthly water-demand coverage.
These results demonstrate that increasing irrigation efficiency reduces both the magnitude and spatial extent of monthly irrigation deficits. Nevertheless, the persistence of shortages in Salvador Escalante indicates that improving application efficiency alone is insufficient to satisfy irrigation requirements under the represented annual water-allocation limits. The temporal distribution also highlights the importance of considering seasonal irrigation demand, since annual aggregate indicators do not fully describe when water shortages occur.
The monthly allocation patterns shown in Figure 5 represent optimized water-management schedules under the assumptions of the scenario. They should not be interpreted as observed irrigation operations or hydraulically validated pumping and diversion schedules. The sensitivity analysis of monthly delivery-capacity constraints provides an additional assessment of the effects of limiting temporal water availability.
3.4. Monthly Water Allocation and Rainwater Storage Under Drip Irrigation
The monthly water allocation and storage patterns under drip irrigation reveal important differences in the use of conventional water sources and collected rainwater across the study area. The monthly water-balance results for each municipality, including irrigation demand, water supply, rainwater harvesting, unmet demand, and storage variations, are provided in Tables S2–S7 of the Supplementary Material. To illustrate these differences, Salvador Escalante, Uruapan, and Tancítaro were selected for detailed analysis because they represent three distinct water-management conditions: persistent irrigation deficits, complete coverage without appreciable groundwater extraction, and complete coverage through a combination of surface water, groundwater, and rainwater storage.
The monthly results correspond to the optimized allocations obtained under the variable crop-coefficient scenario, considering the annual water-allocation limits and hypothetical rainwater-harvesting assumptions established in the model. The monthly water-supply patterns for Ario de Rosales, Peribán, and Tacámbaro are presented in Figures S1–S3, respectively, in the Supplementary Material.
3.4.1. Salvador Escalante
Salvador Escalante remained the most water-constrained municipality under drip irrigation . Its annual gross irrigation demand reached 40.84 Mm3, of which 19.51 was supplied by surface water, 8.54 by groundwater, and 1.89 Mm3 by collected rainwater. Nevertheless, an annual deficit of 10.91 remained, corresponding to 27% of its irrigation requirements.
As shown in Figure 6, irrigation deficits were concentrated primarily between January and May, when crop water requirements were highest. The maximum monthly deficits occurred in April and May, reaching approximately 2.26 and 2.28 , respectively. During these months, the available water from conventional sources was insufficient to meet the modeled irrigation requirements. Although groundwater provided a substantial contribution during May, the municipality continued to experience significant water shortages.
Figure 6.
Monthly water supply in Salvador Escalante with drip irrigation (η = 0.95).
3.4.2. Uruapan
Uruapan exhibited a different water-management pattern, achieving complete annual irrigation coverage under drip irrigation. Its annual demand reached 56.41 Mm3, supplied by approximately 50.79 of surface water and 5.63 Mm3 of collected rainwater. Groundwater extraction was practically unnecessary under the optimized allocation.
Figure 7 shows that surface water supplied most irrigation requirements during the dry season, particularly between January and May. The largest monthly demand occurred in April, reaching approximately 12.00 , followed by May with 11.95 . Despite these relatively high requirements, the municipality maintained complete monthly coverage within the represented water-allocation limits.
Figure 7.
Monthly water supply in Uruapan with drip irrigation (η = 0.95).
Rainwater storage began increasing in June, reaching approximately 1.44 . During the following months, the stored volume continued to increase, reaching 5.55 Mm3 in September and remaining at approximately the same level in October.
When irrigation demand reappeared in November, collected rainwater supplied approximately 5.32 , covering practically the entire monthly requirement without additional surface-water or groundwater extraction. By December, the stored volume had been substantially depleted, and surface water again became the principal supply source.
These results demonstrate the potential contribution of seasonal rainwater storage to reducing the use of conventional water sources. Under the modeled conditions, the combination of irrigation efficiency and stored rainwater allowed Uruapan to satisfy its annual requirements without appreciable groundwater extraction. However, this outcome depends on the assumed rainwater-harvesting and storage capacities and should not be interpreted as evidence of existing infrastructure or measured water availability.
3.4.3. Tancítaro
Tancítaro also achieved complete irrigation coverage under drip irrigation, although its water supply depended on a more diversified combination of sources. Its annual gross irrigation demand reached 16.20 , supplied by approximately 7.80 of surface water, 6.40 of groundwater, and 2.00 of collected rainwater.
As illustrated in Figure 8, surface water provided most of the irrigation supply during the first months of the year. However, groundwater became particularly important during April and May, contributing approximately 3.75 and 2.65 , respectively. These months coincided with the period of greatest irrigation requirements, indicating that groundwater was necessary to maintain complete coverage under the optimized allocation.
Figure 8.
Monthly water supply in Tancítaro with drip irrigation (η = 0.95).
Rainwater storage increased during the rainy season, reaching approximately 1.94 Mm3 in September and remaining at a similar level in October. In November, collected rainwater supplied approximately 0.74 , covering the monthly irrigation requirement without conventional water extraction.
Unlike Uruapan, Tancítaro maintained a greater dependence on groundwater during periods of peak irrigation demand. The annual groundwater extraction represented approximately 56% of the corresponding modeled allocation limit, while surface-water use reached practically 100% of its annual limit.
The remaining stored volume at the end of December was approximately 1.22 , reflecting the cyclic storage-balance assumption incorporated into the optimization model. This condition permits the transfer of stored water between the end and beginning of the representative annual cycle.
Consequently, Tancítaro illustrates a water-management condition in which complete irrigation coverage is achieved through the complementary use of surface water, groundwater, and collected rainwater. In contrast to Uruapan, improvements in irrigation efficiency and rainwater harvesting do not eliminate the need for groundwater extraction under the modeled allocation conditions.
Overall, the three municipalities demonstrate that the effects of irrigation efficiency and rainwater storage depend strongly on local water constraints and supply composition. While collected rainwater contributes to reducing conventional water use, its effect is insufficient to eliminate irrigation deficits in Salvador Escalante. In Uruapan, it allows complete coverage without appreciable groundwater extraction, whereas in Tancítaro, groundwater remains necessary during periods of high irrigation demand. These differences reinforce the importance of municipality-specific water-management strategies within the Water–Food Nexus framework.
3.5. Sensitivity to Monthly Water-Delivery Capacity
To assess the influence of monthly water-delivery constraints on the optimization results, two hypothetical capacity scenarios (A1 and A2) were compared with the reference scenario. Table 7 presents the resulting annual irrigation deficits, regional water-demand coverage, and maximum monthly relative deficits for the three irrigation technologies. The comparison allows the sensitivity of water-allocation outcomes to temporal delivery limitations to be evaluated while maintaining the same annual water-allocation limits and irrigation requirements.
Table 7.
Sensitivity of regional irrigation deficits, water-demand coverage, and maximum monthly relative deficits to monthly water-delivery capacity constraints under different irrigation technologies.
The sensitivity analysis indicates that the effect of monthly delivery restrictions depends on both the assumed capacity multiplier and the irrigation technology.
Under drip irrigation the annual regional deficit remained at 10.91 Mm3 in the allocation scenario and A1, corresponding to a water-demand coverage of 95%. However, the maximum relative monthly deficit increased from 27% to 34%. This indicates that additional monthly restrictions may alter the temporal distribution of irrigation shortages even when the annual unmet demand remains unchanged.
Under the more restrictive scenario A2, the annual regional deficit increased to 15.95 Mm3, representing a 46% increase relative to allocation scenario. Regional water-demand coverage decreased from 95% to 93%, while the maximum relative monthly deficit increased to 48%.
At the municipal level, Uruapan and Tancítaro achieved essentially complete annual coverage under the reference scenario and A1. In A2, their annual coverage decreased to 99% and 97%, respectively. Salvador Escalante remained the most water-constrained municipality, with annual coverage decreasing from 73% in the allocation scenario to 65% in A2.
The results therefore indicate that the complete annual coverage obtained for Uruapan and Tancítaro under drip irrigation is conditional on sufficient temporal flexibility in water delivery. The modeled benefits of improved irrigation efficiency remain evident, but the magnitude and distribution of unmet demand may change when monthly delivery-capacity restrictions are imposed.
These results should be interpreted as a sensitivity assessment of the strategic allocation framework. The monthly-capacity multipliers are hypothetical and do not constitute estimates of measured water availability or installed hydraulic capacity in the study municipalities.
3.6. Sensitivity to Rainwater Harvesting and Storage Assumptions
To assess the influence of the assumptions adopted for rainwater harvesting and storage, three sensitivity scenarios (H0, H1, and H2) were compared with the reference scenario. The analysis considered the three irrigation technologies while maintaining the same crop water requirements, irrigated areas, and annual surface-water and groundwater allocation limits. Table 8 presents the corresponding irrigation deficits, water-demand coverage, and annual volume of collected rainwater used.
Table 8.
Sensitivity of regional irrigation deficits, water-demand coverage, and collected rainwater utilization to rainwater-harvesting and storage assumptions under different irrigation technologies.
The results indicate that rainwater harvesting and storage contribute to reducing irrigation deficits, although the magnitude of their effect depends on irrigation efficiency. Under the reference scenario, the annual volume of collected rainwater used reached approximately 15.75 Mm3 across the six municipalities. Eliminating rainwater harvesting and storage (H0) increased the regional irrigation deficit from 26.31 to 34.99 Mm3 under sprinkler irrigation, corresponding to a 33% increase. Under micro-sprinkler irrigation, the deficit increased from 18.57 to 20.52 Mm3, representing a 10% increase.
Under drip irrigation (η = 0.95), the regional deficit increased from 10.91 Mm3 in the reference scenario to 12.80 Mm3 in H0, representing a 17% increase. Consequently, regional water-demand coverage decreased from 95% to 94%. These results indicate that eliminating the assumed contribution of collected rainwater increases dependence on conventional water sources and, where the modeled allocation limits are insufficient, results in additional unmet irrigation demand.
Reducing the rainwater-harvesting fraction from 10% to 5% (H1) decreased annual collected rainwater utilization from approximately 15.75 to 7.88 Mm3. Under sprinkler irrigation, the regional deficit increased to 30.24 Mm3, while micro-sprinkler and drip irrigation resulted in deficits of 19.51 and 11.86 Mm3, respectively. Compared with the reference scenario, these changes represent increases in unmet irrigation demand of 15%, 5%, and 9% for the three technologies.
In scenario H2, reducing the storage-capacity factor from 75% to 38% resulted in annual collected rainwater utilization of approximately 8.05 Mm3. The regional deficit increased to 30.12 Mm3 under sprinkler irrigation, 19.46 Mm3 under micro-sprinkler irrigation, and 11.80 Mm3 under drip irrigation. Relative to the reference scenario, these deficits represent increases of 15%, 5%, and 8%, respectively.
Although H1 and H2 had the same nominal storage capacity, their results were not identical. Scenario H2 allowed a slightly greater annual utilization of collected rainwater than H1 because it maintained the original harvesting fraction while restricting the amount that could be stored. This distinction indicates that reducing the amount of rainfall potentially recovered and reducing storage capacity can produce different temporal supply patterns, even when their nominal storage capacities are equivalent.
At the municipal level, Salvador Escalante remained the most water-constrained municipality under drip irrigation. Its annual deficit increased from 10.91 Mm3 in the reference scenario to 12.80 Mm3 in H0, 11.86 Mm3 in H1, and 11.80 Mm3 in H2. Corresponding water-demand coverage decreased from 73% to 69%, 71%, and 71%, respectively. In contrast, the remaining five municipalities maintained practically complete annual coverage under drip irrigation, although the composition of water supply changed as the contribution of collected rainwater was reduced.
These findings demonstrate that rainwater harvesting and storage can complement conventional irrigation water sources and contribute to reducing modeled water deficits. However, their contribution remains dependent on the assumed recovery fractions, storage capacities, and municipal water-allocation constraints. In Salvador Escalante, rainwater harvesting reduced the magnitude of the deficit but was insufficient to eliminate it, even under the reference scenario.
The results should be interpreted as a sensitivity assessment of hypothetical water-management alternatives. The assumed harvesting fractions and storage capacities do not represent measured runoff, existing infrastructure, or empirically validated hydraulic performance. Therefore, the findings quantify the potential contribution of rainwater harvesting within the optimization framework but do not establish the technical feasibility or economic viability of implementing the corresponding systems.
3.7. Sensitivity to Reductions in Annual Water-Allocation Limits
The sensitivity analysis evaluated reductions of 20% (R80) and 40% (R60) in annual surface-water and groundwater allocation limits, while maintaining the remaining model parameters unchanged. Regional irrigation coverage decreased from 92% to 69% under sprinkler irrigation, from 93% to 78% under micro-sprinkler irrigation, and from 95.2% to 86% under drip irrigation when comparing the reference scenario with R60. The municipal irrigation deficits and water-demand coverage under reduced allocation limits are summarized in Table 9.
Table 9.
Municipal irrigation deficits and water-demand coverage under reduced annual water-allocation limits for drip irrigation (η = 0.95).
Under drip irrigation, Uruapan and Tancítaro maintained practically complete coverage in R80, but their coverage decreased to 86% and 83%, respectively, in R60. In contrast, Peribán, Ario de Rosales, and Tacámbaro maintained practically complete coverage under both reductions, demonstrating greater robustness. Salvador Escalante remained the most constrained municipality, with coverage declining from 73% in the reference scenario to 46% in R60.
The robustness of complete coverage also depended on irrigation technology. Under R60, no municipality maintained complete coverage with sprinkler irrigation, whereas Peribán and Tacámbaro did so with micro-sprinkler irrigation. These results demonstrate that municipal irrigation coverage depends on both irrigation efficiency and allocation limits. The scenarios represent hypothetical administrative allocation reductions rather than observed drought conditions.
3.8. Impact of Water Shortages on Production
The relationship between irrigation water availability and avocado production was evaluated using the optimized irrigation deficits obtained under the variable crop-coefficient scenario. The reference irrigated production considered in the model was 556,245 , corresponding to the six municipalities analyzed. Three yield response factors (Ky = 1.10, 1.20, and 1.30) were applied to assess the sensitivity of estimated production losses to different levels of water stress. The calculations were performed after the water allocation optimization and therefore did not modify the optimized water distribution.
As shown in Figure 9, estimated production losses decreased consistently as irrigation efficiency increased, regardless of the Ky value considered. Under sprinkler irrigation (η = 0.70), production losses ranged from 25.45 to 30.07 103 . With micro-sprinkler irrigation (η = 0.80), losses decreased to between 20.60 and 24.35 103 . Under drip irrigation (η = 0.95), the lowest estimated losses were obtained, ranging from 14.38 to 16.99 103 . These results indicate that improving irrigation efficiency reduces the potential productive consequences of unmet irrigation demand under the water-allocation constraints considered in the model.
Figure 9.
Estimated regional production loss under sprinkler, micro-sprinkler, and drip irrigation scenarios for (Ky = 1.10, 1.20 and 1.30).
For the intermediate yield response factor (Ky = 1.20), estimated production losses decreased from 27.76 × 10³ t year−1 under sprinkler irrigation to 22.48 103 with micro-sprinkler irrigation and 15.68 × 10³ t year−1 under drip irrigation. The transition from sprinkler to drip irrigation therefore reduced the estimated production loss by approximately 44%. Consequently, adjusted regional production increased from 528.49 to 540.56 103 , representing a difference of approximately 12.08 103
The variation in Ky affected the magnitude of estimated production losses but did not change the relative performance of the irrigation technologies. For a given irrigation system, higher Ky values resulted in greater production losses because of the increased assumed sensitivity of yield to water stress. Nevertheless, drip irrigation consistently produced the lowest estimated losses across all three Ky scenarios, reflecting the reduction in unmet irrigation requirements obtained through improved application efficiency.
These results demonstrate the potential productive benefits associated with reducing irrigation deficits. However, the estimated losses should be interpreted as sensitivity outcomes rather than direct predictions of actual agricultural production. The calculation assumes that unmet net irrigation requirements produce an equivalent evapotranspiration deficit, without additional compensation from soil-water reserves. Furthermore, SIAP-reported production was used as the reference production level and does not necessarily represent the maximum attainable yield assumed in the original yield-response relationship. Therefore, the results provide a comparative assessment of the potential effects of irrigation efficiency on avocado production under the assumptions established in the Water–Food Nexus model.
4. Discussion
4.1. Effect of Irrigation Efficiency on Water Demand and Water Deficit
The results demonstrate that improving irrigation application efficiency reduces the gross water requirements necessary to maintain the 45,501 ha of irrigated avocado cultivation considered in the study. Under the updated formulation incorporating a variable crop coefficient (Kc), increasing irrigation efficiency from 0.70 to 0.95 reduced regional gross irrigation demand from 308.23 to 227.11 Mm3 year−1, representing a decrease of 26%. The regional irrigation deficit decreased from 26.31 to 10.91 Mm3 year−1, equivalent to a reduction of 59%, while water-demand coverage increased from 92% to 95%.
The potential benefits of improved irrigation management are consistent with the findings of Beyá-Marshall et al. [63], who reported that monitoring soil-water content and plant water status in ‘Hass’ avocado orchards can reduce irrigation application without significantly affecting fruit size or yield. Similarly, Cárceles Rodríguez et al. [65] emphasized the importance of irrigation management strategies that improve water-use efficiency while considering the sensitivity of avocado production to water stress.
Although higher irrigation efficiency reduced modeled gross water requirements and withdrawals, these reductions should not be interpreted as equivalent net water savings at the basin scale. The model assumes a fixed irrigated area and does not explicitly quantify consumptive use, runoff, deep percolation, or recoverable return flows. As discussed by Perry [4], improvements in application efficiency do not necessarily reduce basin-scale water depletion. Moreover, potential rebound effects associated with agricultural expansion or intensification [66] are not represented in the present framework. Therefore, the reported benefits correspond to reductions in modeled irrigation demand under the specified allocation constraints.
Although the incorporation of a seasonal crop coefficient ( provides a more realistic representation of avocado water requirements than a constant annual coefficient, uncertainties remain regarding its magnitude and phenological timing. The adopted values and stage durations were based on published studies conducted in Michoacán and were applied consistently across the six municipalities to establish a comparable reference scenario. Given the absence of detailed municipality-specific phenological observations and field-calibrated crop coefficients, alternative trajectories were not evaluated in the present study. Furthermore, the analysis was based on the 1991–2020 climatological reference period rather than on the meteorological conditions of an individual agricultural year. A specific dry-year scenario was not included because the model considers administrative water-allocation limits derived from registered water rights rather than observed monthly hydrological availability. Simulating drought conditions would therefore require additional assumptions regarding the availability of surface water and groundwater, which could introduce uncertainties beyond those addressed by the current framework. Consequently, the estimated municipal irrigation coverage should be interpreted as conditional on the adopted seasonal schedule, reference climatic conditions, and modeled water-allocation limits. The effects of alternative phenological patterns, crop coefficients, and drought conditions remain unquantified and represent limitations to be addressed in future research.
4.2. Municipal Differences and the Need for Spatially Differentiated Management
The municipal results reveal substantial spatial differences in the benefits of irrigation modernization. While most municipalities achieved practically complete irrigation coverage under the reference conditions, Salvador Escalante maintained significant deficits even with drip irrigation. The sensitivity analyses further showed that complete coverage in Uruapan and Tancítaro depends on the assumed allocation limits and monthly delivery conditions, whereas Peribán, Ario de Rosales, and Tacámbaro exhibited greater robustness under the evaluated allocation reductions. These findings support differentiated irrigation-management strategies rather than uniform technological recommendations.
These findings are consistent with the importance of spatially differentiated water-management strategies emphasized by Zhang et al. [67], who demonstrated the relevance of incorporating agricultural water use, cultivated area, and production requirements into integrated optimization frameworks. Similarly, Campana et al. [68], showed that irrigation management outcomes depend on local environmental and agricultural conditions.
The sensitivity analyses further demonstrate that complete irrigation coverage is conditional on the assumed availability and temporal distribution of water resources. Under drip irrigation, Uruapan and Tancítaro maintained practically complete coverage when the annual allocation limits were reduced by 20%. However, when these limits were reduced by 40%, their coverage decreased to 86% and 83%, respectively. Likewise, under the more restrictive monthly delivery-capacity scenario (A2), their coverage decreased to 98% and 97%.
Therefore, the complete coverage obtained in some municipalities should be interpreted as a feasible outcome under the reference model assumptions, rather than as a guaranteed result of irrigation modernization. These differences support the development of municipality-specific management strategies based on local irrigation requirements, water-allocation limits, and temporal supply constraints.
4.3. Temporal Water Shortages and Irrigation Management
The monthly results demonstrate that annual water-allocation limits alone do not fully describe the temporal occurrence of irrigation deficits. Under the updated E1 scenario, unmet irrigation demand was concentrated mainly between January and May, particularly during April and May, when crop water requirements were greatest. During the main rainfall period, from June to September, irrigation deficits were practically zero, while shortages reappeared during the final months of the year.
These findings highlight the importance of considering the seasonal distribution of irrigation requirements. Cárceles Rodríguez et al. [65] emphasized that the effects of irrigation management depend on crop water requirements and physiological responses to water stress. Similarly, Chen et al. [69] reported that the consequences of deficit irrigation in woody crops depend not only on the magnitude of water shortages but also on their timing relative to crop development.
The fourth stage of the lexicographic optimization was therefore relevant for obtaining a more balanced temporal distribution of irrigation deficits while preserving the annual municipal allocation results within the established numerical tolerances. Nevertheless, these allocations represent optimized management schedules rather than observed pumping or diversion operations.
The sensitivity analysis of monthly water-delivery capacity confirmed the importance of temporal restrictions. Under drip irrigation, scenario A1 maintained the regional annual deficit at approximately 10.91 Mm3 but increased the maximum monthly relative deficit from 27% to 34%. Under the more restrictive scenario A2, the annual deficit increased to 15.95 Mm3, while the maximum monthly relative deficit reached 48%. These results demonstrate that temporal delivery limitations can affect both the magnitude and distribution of irrigation shortages, even when annual water-allocation limits remain unchanged.
Rainwater harvesting and storage provided an additional opportunity to redistribute water availability across the annual cycle. Under the reference scenario, approximately 15.75 Mm3 year−1 of collected rainwater was used for irrigation. However, the sensitivity analysis showed that eliminating harvesting and storage (H0) increased the regional deficit under drip irrigation from 10.91 to 12.80 Mm3 year−1, representing an increase of 17%. Reducing the harvesting fraction (H1) or storage-capacity factor (H2) increased the deficit by 9% and 8%, respectively.
Rainwater harvesting through on-farm storage ponds may also have environmental and social implications. In the Michoacán Avocado Belt, water appropriation for avocado irrigation has generated conflicts over access to water resources [42]. Intercepting runoff for agricultural storage may reduce downstream streamflow and water availability for other users. Therefore, although rainwater harvesting reduces modeled irrigation deficits, its implementation requires consideration of downstream water needs and watershed-level hydrological impacts, which are not explicitly represented in the present optimization framework.
These results indicate that rainwater harvesting can complement conventional water sources, although its contribution depends on the assumed recovery fraction and storage capacity. In Uruapan and Tancítaro, practically complete coverage was maintained under drip irrigation even without harvesting, given the reference annual allocation limits. In Salvador Escalante, however, the contribution of collected rainwater reduced the magnitude of the deficit without eliminating it.
It is important to emphasize that rainwater harvesting, and storage were represented as hypothetical management alternatives, rather than existing infrastructure. The results therefore quantify their potential contribution within the optimization framework but do not establish their technical or economic feasibility. Similarly, the annual allocation limits derived from REPDA should not be interpreted as measurements of actual hydrological availability.
4.4. Production Implications of Irrigation Deficit
The production sensitivity analysis showed that improving irrigation efficiency reduced estimated production losses across all yield response factors (Ky = 1.10, 1.20, and 1.30). Under sprinkler irrigation, estimated losses ranged from 25.45 to 30.07 × 10³ t year−1, decreasing to under drip irrigation. For Ky = 1.20, the estimated loss decreased from 27.76 to 15.68 , representing a reduction of 44%.
This behavior is consistent with the relationship between water availability and yield described for woody crops. Chen et al. [69] note that moderate reductions in water application, generally in the range of 20–30%, can have relatively small effects on the yield of many woody crops while simultaneously increasing water use efficiency. However, when water constraints are more severe, the yield response becomes more pronounced and depends on the species and the timing of the stress.
Cárceles Rodríguez et al. [65] specifically emphasize that water stress affects physiological processes associated with yield and that deficit irrigation strategies require striking a balance between water savings and acceptable yield losses. Consequently, the yield losses obtained in this study should be interpreted as a measure of sensitivity rather than as a direct prediction of actual yield.
4.5. Implications from a Water–Food Nexus Perspective
The results show a direct relationship between water use efficiency and the system’s capacity to meet irrigation requirements while maintaining the reference irrigated production area under the modeled constraints, which constitutes the main water–food nexus analyzed in this study. A reduction in irrigation demand not only decreases the deficit but also alters the share of different water sources and reduces potential production losses.
Nexus frameworks are particularly useful for interpreting these types of relationships because they allow us to move beyond an assessment based exclusively on water availability. Zhang et al. [67] note that the joint incorporation of irrigation water, agricultural land area, yield, and production variables into optimization models makes it possible to identify interactions and trade-offs that are not apparent when these components are studied independently. Additionally, Campana et al. [68] showed that Nexus models can support irrigation scheduling strategies aimed simultaneously at improving water productivity and maintaining agricultural production.
The results for Salvador Escalante indicate that improving irrigation efficiency alone may not be sufficient to eliminate water deficits under the resource constraints considered. Previous studies have shown that optimization-based approaches can im-prove regional irrigation water allocation while maintaining agricultural benefits, although their effectiveness depends on water availability and crop requirements [70]. Moreover, multi-objective linear programming has been used to evaluate trade-offs between agricultural production and the environmental impacts associated with water consumption [71]. In this context, reclaimed wastewater could be explored as a complementary irrigation source to reduce fresh-water demand and address seasonal water shortages. Recent research has demonstrated its potential to meet crop water requirements during dry periods, while also highlighting the need to manage salinity and sodium concentrations to prevent soil degradation [72]. This alternative could be assessed in future extensions of the model, subject to local availability and water-quality requirements, without changing the scope of the present analysis.
Although the present analysis focuses on the interactions between water availability, irrigation management, and agricultural production, the Water–Food Nexus can be further explored by incorporating additional dimensions in future research. These could include the energy requirements associated with water pumping and distribution, the economic costs of irrigation modernization, environmental flow requirements, and land-use dynamics. Integrating these aspects would provide a broader understanding of the trade-offs associated with agricultural water management and help assess the implications of irrigation strategies beyond the water-production interactions examined in the present study.
5. Conclusions
The Water–Food Nexus approach enabled an integrated assessment of how irrigation-efficiency scenarios and municipality-specific water-allocation constraints influence gross irrigation demand, unmet demand, and potential production losses in irrigated avocado production. Under the modeled assumptions, higher irrigation efficiency reduced gross irrigation requirements and substantially decreased unmet irrigation demand, although the magnitude of these effects differed among municipalities.
Increasing irrigation efficiency from 70% to 95% reduced regional gross irrigation demand from 308.23 to 227.11 (26%) and unmet demand from 26.31 to 10.91 (59%), achieving 95% regional coverage. At the municipal level, Uruapan and Tancítaro achieved practically complete coverage under drip irrigation, while Salvador Escalante maintained a substantial deficit, with only 73% coverage. Sensitivity analyses demonstrated that complete coverage depends on water-allocation and delivery conditions, whereas Salvador Escalante consistently remained the most water-constrained municipality.
The reported improvements represent reductions in modeled gross irrigation requirements underestimated administrative allocation limits, rather than verified net water savings or changes in hydrological availability. Furthermore, the assumed rainwater-harvesting system does not represent existing infrastructure. These considerations delimit the interpretation of the results and highlight the need for hydrological and field-based validation in future applications.
Rainwater harvesting contributed to reducing irrigation deficits, although its effectiveness depended on the assumed collection and storage capacities. Furthermore, the production sensitivity analysis indicated a 44% reduction in estimated production losses when transitioning from sprinkler to drip irrigation for Ky = 1.20. These estimates remain dependent on the adopted evapotranspiration-deficit assumptions and should not be interpreted as validated yield predictions. Overall, the proposed framework provides a basis for identifying municipal water constraints, assessing management alternatives, and supporting spatially differentiated strategies for avocado production.
Supplementary Materials
The following supporting information can be downloaded at https://www.mdpi.com/article/10.3390/resources15110149/s1, Table S1. Municipality-level annual water-balance verification under the E1 variable crop-coefficient scenario, Table S2. Monthly irrigation water balance and rainwater storage in Uruapan, Table S3. Monthly irrigation water balance and rainwater storage in Tancítaro, Table S4. Monthly irrigation water balance and rainwater storage in Peribán, Table S5. Monthly irrigation water balance and rainwater storage in Ario de Rosales, Table S6. Monthly irrigation water balance and rainwater storage in Salvador Escalante, Table S7. Monthly irrigation water balance and rainwater storage in Tacámbaro, Figure S1: Monthly water supply in Ario de Rosales with drip irrigation (η = 0.95); Figure S2: Monthly water supply in Peribán with drip irrigation (η = 0.95); Figure S3: Monthly water supply in Tacámbaro with drip irrigation (η = 0.95).
Author Contributions
Conceptualization, G.B.-B., D.K.Z.-V., H.A.-G. and J.M.P.-O.; methodology, G.B.-B., D.K.Z.-V. and H.A.-G.; software, G.B.-B.; validation, G.B.-B., D.K.Z.-V., H.A.-G., F.J.L.-F., C.R.-M. and J.M.P.-O.; formal analysis, G.B.-B., D.K.Z.-V. and H.A.-G.; investigation, G.B.-B. and D.K.Z.-V.; data curation, G.B.-B. and D.K.Z.-V.; writing—original draft preparation, G.B.-B. and D.K.Z.-V.; writing—review and editing, H.A.-G., F.J.L.-F., C.R.-M. and J.M.P.-O.; visualization, G.B.-B.; supervision, H.A.-G. and J.M.P.-O. All authors have read and agreed to the published version of the manuscript.
Funding
This research received no external funding.
Data Availability Statement
The data used in this study were obtained from publicly available sources. Agricultural production data were obtained from the Servicio de Información Agroalimentaria y Pesquera (SIAP) through the Avance de Siembras y Cosechas database (https://nube.agricultura.gob.mx/avance_agricola/ (accessed on 10 september 2026)). Precipitation data were obtained from the Climate Hazards Group InfraRed Precipitation with Stations version 3 (CHIRPS3) dataset (https://doi.org/10.15780/G2JQ0P). Reference evapotranspiration data were obtained from the AgERA5 dataset available through the Copernicus Climate Data Store (https://doi.org/10.24381/cds.6c68c9bb). Agricultural surface- and groundwater-right records were obtained from the Registro Público de Derechos de Agua (REPDA) of the Comisión Nacional del Agua (CONAGUA) (https://app.conagua.gob.mx/ConsultaRepda.aspx (accessed on 10 september 2026)). Municipal boundaries were obtained from the INEGI Marco Geoestadístico 2025. The GAMS code and processed input data supporting the findings of this study are publicly available in the GitHub repository at (https://github.com/Alcocer-Garcia/Integrated-Assessment-and-Optimization-of-the-Water-Food-Nexus-in-Avocado-Production (accessed on 05 november 2026)).
Acknowledgments
The authors appreciate the support provided by the Secretaría de Ciencia, Humanidades, Tecnología e Innovación (SECIHTI), and the Coordinación de la Investigación Científica of the Universidad Michoacana de San Nicolás de Hidalgo (CIC-UMSNH).
Conflicts of Interest
The authors declare no conflicts of interest.
Abbreviations
| AgERA5 | Agrometeorological indicators derived from ERA5 reanalysis |
| CHIRPS | Climate Hazards Group InfraRed Precipitation with Stations |
| CONAGUA | Comisión Nacional del Agua (National Water Commission of Mexico) |
| CROPWAT | FAO software for crop water requirements and irrigation scheduling |
| CWR | Crop Water Requirement |
| FAO | Food and Agriculture Organization of the United Nations |
| GAMS | General Algebraic Modeling System |
| INEGI | Instituto Nacional de Estadística y Geografía (National Institute of Statistics and Geography) |
| REPDA | Registro Público de Derechos de Agua (Public Registry of Water Rights) |
| SIAP | Servicio de Información Agroalimentaria y Pesquera (Agrifood and Fisheries Information Service) |
| WFN | Water–Food Nexus |
| Symbols | |
| Reference evapotranspiration | |
| Crop evapotranspiration | |
| Crop coefficient | |
| Yield response factor to water deficit | |
| Irrigation application efficiency | |
| Monthly precipitation | |
| Effective precipitation | |
| Crop water requirement | |
| Irrigation water deficit | |
| Groundwater use | |
| Surface-water use |
References
- Food and Agriculture Organization of the United Nations (Ed.) The Future of Food and Agriculture: Trends and Challenges; The Future of Food and Agriculture; Food and Agriculture Organization of the United Nations: Rome, Italy, 2017. [Google Scholar]
- Burek, P.; Satoh, Y.; Fischer, G.; Taher Kahil, M.; Scherzer, A.; Tramberend, S.; Nava, L.; Wada, Y.; Eisner, S.; Flörke, M.; et al. Water Futures and Solution—Fast Track Initiative (Final Report); International Institute for Applied Systems Analysis (IIASA): Laxenburg, Austria, 2016. [Google Scholar]
- United Nations Department of Economic and Social Affairs. World Population Prospects 2024: Summary of Results; United Nations: New York, NY, USA, 2024. [Google Scholar]
- Perry, C. Efficient Irrigation; Inefficient Communication; Flawed Recommendations. Irrig. Drain. 2007, 56, 367–378. [Google Scholar] [CrossRef] [Scilit]
- Corona-López, E.; Román-Gutiérrez, A.D.; Otazo-Sánchez, E.M.; Guzmán-Ortiz, F.A.; Acevedo-Sandoval, O.A. Water–Food Nexus Assessment in Agriculture: A Systematic Review. Int. J. Environ. Res. Public Health 2021, 18, 4983. [Google Scholar] [CrossRef] [Scilit] [PubMed]
- GWP Centroamérica. Memoria. Foro Centroamericano y de República Dominicana: Seguridad Hídrica y Alimentaria: El Nexo Entre el Agua y la Producción de Alimentos; GWP Centroamérica: Tegucigalpa, Honduras, 2013. [Google Scholar]
- Land Use Statistics and Indicators 2000–2021: Global, Regional and Country Trends; FAO: Rome, Italy, 2023.
- Hernández Lagana, M.; Mejias Moreno, P. AQUASTAT Water Data Snapshot 2025; Food and Agriculture Organization of the United Nations: Rome, Italy, 2025. [Google Scholar]
- Hamidov, A.; Helming, K. Sustainability Considerations in Water–Energy–Food Nexus Research in Irrigated Agriculture. Sustainability 2020, 12, 6274. [Google Scholar] [CrossRef] [Scilit]
- Brauman, K.A.; Siebert, S.; Foley, J.A. Improvements in Crop Water Productivity Increase Water Sustainability and Food Security—A Global Analysis. Environ. Res. Lett. 2013, 8, 024030. [Google Scholar] [CrossRef] [Scilit]
- Hashemy Shahdany, S.M.; Firoozfar, A.; Maestre, J.M.; Mallakpour, I.; Taghvaeian, S.; Karimi, P. Operational Performance Improvements in Irrigation Canals to Overcome Groundwater Overexploitation. Agric. Water Manag. 2018, 204, 234–246. [Google Scholar] [CrossRef] [Scilit]
- Yao, L.; Li, Y.; Chen, X. A Robust Water-Food-Land Nexus Optimization Model for Sustainable Agricultural Development in the Yangtze River Basin. Agric. Water Manag. 2021, 256, 107103. [Google Scholar] [CrossRef] [Scilit]
- Villazón-León, V.; Ramírez-Márquez, C.; Rubio-Castro, E.; Ponce-Ortega, J.M. Review of Water-Energy-Food Nexus Agriculture Applications. Process Integr. Optim. Sustain. 2026, 1–36. [Google Scholar] [CrossRef] [Scilit]
- Yuan, M.; Zheng, N.; Yang, Y.; Liu, C. Robust Optimization for Sustainable Agricultural Management of the Water-Land-Food Nexus under Uncertainty. J. Clean. Prod. 2023, 403, 136846. [Google Scholar] [CrossRef] [Scilit]
- Pereira, L.; Oweis, T.; Zairi, A. Irrigation Management under Water Scarcity. Agric. Water Manag. 2002, 57, 175–206. [Google Scholar] [CrossRef] [Scilit]
- De La Vega-Rivera, A.; Merino-Pérez, L. Socio-Environmental Impacts of the Avocado Boom in the Meseta Purépecha, Michoacán, Mexico. Sustainability 2021, 13, 7247. [Google Scholar] [CrossRef] [Scilit]
- Fuerte-Velázquez, D.J.; Seguí-Amórtegui, L.; Gómez-Tagle, A.; Guerrero-García-Rojas, H. Avocado Water Footprint for Two Municipalities in Michoacán, Mexico: A Research of the Blue and Green WF. Agriculture 2024, 14, 981. [Google Scholar] [CrossRef] [Scilit]
- Gómez-Tagle, A.F.; Gómez-Tagle, A.; Fuerte-Velázquez, D.J.; Barajas-Alcalá, A.G.; Quiroz-Rivera, F.; Alarcón-Chaires, P.E.; Guerrero-García-Rojas, H. Blue and Green Water Footprint of Agro-Industrial Avocado Production in Central Mexico. Sustainability 2022, 14, 9664. [Google Scholar] [CrossRef] [Scilit]
- Ramírez-Mejía, D.; Levers, C.; Kolb, M.; Ghilardi, A.; Godínez-Gomez, O.; Mas, J.-F. Mapping Spatiotemporal Patterns of Avocado Expansion and Land-Use Intensity in Central Mexico and Their Effects on Landscape Connectivity. Environ. Res. Lett. 2024, 19, 124090. [Google Scholar] [CrossRef] [Scilit]
- Barsimantov, J.; Navia Antezana, J. Forest Cover Change and Land Tenure Change in Mexico’s Avocado Region: Is Community Forestry Related to Reduced Deforestation for High Value Crops? Appl. Geogr. 2012, 32, 844–853. [Google Scholar] [CrossRef] [Scilit]
- Reyes-Gómez, H.; Martínez-González, E.G.; Aguilar-Ávila, J.; Aguilar-Gallegos, N. Sistemas agroalimentarios sostenibles: El caso de la cadena de valor del aguacate en México. Probl. Desarro. Rev. Latinoam. Econ. 2024, 55, 29–60. [Google Scholar] [CrossRef] [Scilit]
- Difallah, W.; Benahmed, K.; Draoui, B.; Bounaama, F. Linear Optimization Model for Efficient Use of Irrigation Water. Int. J. Agron. 2017, 2017, 5353648. [Google Scholar] [CrossRef] [Scilit]
- Gong, X.; Zhang, H.; Ren, C.; Sun, D.; Yang, J. Optimization Allocation of Irrigation Water Resources Based on Crop Water Requirement under Considering Effective Precipitation and Uncertainty. Agric. Water Manag. 2020, 239, 106264. [Google Scholar] [CrossRef] [Scilit]
- Mizyed, A. Sustainable Water Footprint Management in Agriculture: A Review of Linear Programming-Based Models and Future Directions. Integr. Environ. Assess. Manag. 2026, 22, 352–361. [Google Scholar] [CrossRef] [Scilit] [PubMed]
- Umutoni, L.; Samadi, V. Application of Machine Learning Approaches in Supporting Irrigation Decision Making: A Review. Agric. Water Manag. 2024, 294, 108710. [Google Scholar] [CrossRef] [Scilit]
- Parra-López, C.; Ben Abdallah, S.; Garcia-Garcia, G.; Hassoun, A.; Trollman, H.; Jagtap, S.; Gupta, S.; Aït-Kaddour, A.; Makmuang, S.; Carmona-Torres, C. Digital Technologies for Water Use and Management in Agriculture: Recent Applications and Future Outlook. Agric. Water Manag. 2025, 309, 109347. [Google Scholar] [CrossRef] [Scilit]
- Farajpour, M. Current Applications of Artificial Intelligence for Advancing Agriculture, Sustainability and Climate Mitigation. Discov. Artif. Intell. 2026, 6, 1525. [Google Scholar] [CrossRef] [Scilit]
- Arima, E.Y.; Denvir, A.; Young, K.R.; González-Rodríguez, A.; García-Oliva, F. Modelling Avocado-Driven Deforestation in Michoacán, Mexico. Environ. Res. Lett. 2022, 17, 034015. [Google Scholar] [CrossRef]
- Denvir, A.; Arima, E.Y.; González-Rodríguez, A.; Young, K.R. Ecological and Human Dimensions of Avocado Expansion in México: Towards Supply-Chain Sustainability. Ambio 2022, 51, 152–166. [Google Scholar] [CrossRef] [Scilit] [PubMed]
- Instituto Nacional de Estadística y Geografía (INEGI) Marco Geoestadístico 2025. Available online: https://www.inegi.org.mx/temas/mg/ (accessed on 10 September 2026).
- Servicio de Información Agroalimentaria y Pesquera Avance de Siembras y Cosechas. Available online: https://nube.agricultura.gob.mx/avance_agricola/ (accessed on 30 September 2026).
- Ippolito, M.; De Caro, D.; Cannarozzo, M.; Provenzano, G.; Ciraolo, G. Evaluation of Daily Crop Reference Evapotranspiration and Sensitivity Analysis of FAO Penman-Monteith Equation Using ERA5-Land Reanalysis Database in Sicily, Italy. Agric. Water Manag. 2024, 295, 108732. [Google Scholar] [CrossRef] [Scilit]
- Copernicus Climate Change Service. Agrometeorological Indicators from 1979 up to 2020 Derived from Reanalysis. Available online: https://cds.climate.copernicus.eu/doi/10.24381/cds.6c68c9bb (accessed on 29 September 2026).
- Soulis, K.; Dosiadis, E.; Nikitakis, E.; Charalambopoulos, I.; Kairis, O.; Katsogiannou, A.; Palli Gravani, S.; Kalivas, D. Assessing AgERA5 and MERRA-2 Global Climate Datasets for Small-Scale Agricultural Applications. Atmosphere 2025, 16, 263. [Google Scholar] [CrossRef] [Scilit]
- Climate Hazards Center. Climate Hazards Center Infrared Precipitation with Stations Version 3 (CHIRPS3) Data Repository. Available online: https://data.chc.ucsb.edu/products/CHIRPS/v3.0/ (accessed on 4 November 2026).
- Demir, M.S.; Muratoglu, A. Water Footprint Concept, Approaches, and Applications: A Comprehensive Review for the Agricultural Sector. Water Environ. J. 2025, 39, 128–142. [Google Scholar] [CrossRef] [Scilit]
- Kaneko, T.; Gould, N.; Campbell, D.; Snelgar, P.; Clearwater, M.J. The Effect of Soil Type, Fruit Load and Shaded Area on ‘Hass’ Avocado (Persea americana Mill.) Water Use and Crop Coefficients. Agric. Water Manag. 2022, 264, 107519. [Google Scholar] [CrossRef] [Scilit]
- Yin, Y.; Wu, S.; Zheng, D.; Yang, Q. Radiation Calibration of FAO56 Penman–Monteith Model to Estimate Reference Crop Evapotranspiration in China. Agric. Water Manag. 2008, 95, 77–84. [Google Scholar] [CrossRef] [Scilit]
- Soomro, S.; Solangi, G.S.; Siyal, A.A.; Golo, A.; Bhatti, N.B.; Soomro, A.G.; Memon, A.H.; Panhwar, S.; Keerio, H.A. Estimation of Irrigation Water Requirement and Irrigation Scheduling for Major Crops Using the CROPWAT Model and Climatic Data. Water Pract. Technol. 2023, 18, 685–700. [Google Scholar] [CrossRef] [Scilit]
- Solangi, G.S.; Shah, S.A.; Alharbi, R.S.; Panhwar, S.; Keerio, H.A.; Kim, T.-W.; Memon, J.A.; Bughio, A.D. Investigation of Irrigation Water Requirements for Major Crops Using CROPWAT Model Based on Climate Data. Water 2022, 14, 2578. [Google Scholar] [CrossRef] [Scilit]
- Rocha-Arroyo, J.L.; Salazar-García, S.; Bárcenas-Ortega, A.E.; González-Durán, I.J.L.; Cossio-Vargas, L.E. FENOLOGÍA DEL AGUACATE ‘HASS’ EN MICHOACÁN. Rev. Mex. Cienc. Agríc. 2011, 2, 303–316. [Google Scholar]
- Fuerte-Velázquez, D.J.; Gómez-Tagle, A. Water Footprint and Water Sustainability of Agroindustrial Avocado Production in a Warm Tropical Climate Municipality: A Case Study in the Michoacan Avocado Belt in Central México. Water 2024, 16, 1719. [Google Scholar] [CrossRef] [Scilit]
- Allen, R.G.; Pereira, L.S.; Raes, D.; Smith, M. Crop Evapotranspiration: Guidelines for Computing Crop Water Requirements; FAO Irrigation and Drainage Paper; Food and Agriculture Organization of the United Nations (FAO): Rome, Italy, 1998. [Google Scholar]
- Montazar, A.; Faber, B.; Corwin, D.; Pourreza, A.; Snyder, R.L. Quantifying Evapotranspiration and Crop Coefficients of California “Hass” Avocado Affected by Various Environmental and Plant Factors. Agric. Water Manag. 2025, 313, 109481. [Google Scholar] [CrossRef] [Scilit]
- Rodríguez-Herrera, J.G.; Amante-Orozco, A.; Muñoz-Robles, C.A.; Pimentel-López, J.; Ruiz-Vera, V.M.; Salvador-Osuna, E. Evaluation of Precipitation Data from CHIRPS Images in Dry and Tropical (San Luis Potosi) and Temperate (Mexico State) Basins in Mexico. Terra Latinoam. 2025, 43, 1–13. [Google Scholar] [CrossRef] [Scilit]
- Rivera, J.A.; Marianetti, G.; Hinrichs, S. Validation of CHIRPS Precipitation Dataset along the Central Andes of Argentina. Atmos. Res. 2018, 213, 437–449. [Google Scholar] [CrossRef] [Scilit]
- Erazo-Mesa, E.; Ramírez-Gil, J.G.; Sánchez, A.E. Avocado Cv. Hass Needs Water Irrigation in Tropical Precipitation Regime: Evidence from Colombia. Water 2021, 13, 1942. [Google Scholar] [CrossRef] [Scilit]
- Al-Jamal, M.S.; Ball, S.; Sammis, T.W. Comparison of Sprinkler, Trickle and Furrow Irrigation Efficiencies for Onion Production. Agric. Water Manag. 2001, 46, 253–266. [Google Scholar] [CrossRef] [Scilit]
- Serra-Wittling, C.; Molle, B.; Cheviron, B. Plot Level Assessment of Irrigation Water Savings Due to the Shift from Sprinkler to Localized Irrigation Systems or to the Use of Soil Hydric Status Probes. Application in the French Context. Agric. Water Manag. 2019, 223, 105682. [Google Scholar] [CrossRef] [Scilit]
- Comisión Nacional del Agua Comisión Nacional Del Agua. Available online: https://app.conagua.gob.mx/consultarepda.aspx (accessed on 10 September 2026).
- Puy, A.; Borgonovo, E.; Lo Piano, S.; Levin, S.A.; Saltelli, A. Irrigated Areas Drive Irrigation Water Withdrawals. Nat. Commun. 2021, 12, 4525. [Google Scholar] [CrossRef] [Scilit] [PubMed]
- Goetz, R.U.; Martinez, Y.; Rodrigo, J. Water Allocation by Social Choice Rules: The Case of Sequential Rules. Ecol. Econ. 2008, 65, 304–314. [Google Scholar] [CrossRef] [Scilit]
- Gillet, V.; Biancalani, R. Guidelines for the Calculation of the Agriculture Water Use Efficiency for Global Reporting; SDG 6.4 Monitoring Sustainable Use of Water Resources Papers; FAO: Rome, Italy, 2022. [Google Scholar]
- Velasco-Muñoz, J.F.; Aznar-Sánchez, J.A.; Batlles-delaFuente, A.; Fidelibus, M.D. Rainwater Harvesting for Agricultural Irrigation: An Analysis of Global Research. Water 2019, 11, 1320. [Google Scholar] [CrossRef] [Scilit]
- Deo, A.; Karmakar, S.; Arora, A. Rainwater Harvesting and Water Balance Simulation-Optimization Scheme to Plan Sustainable Second Crop in Small Rain-Fed Systems. J. Environ. Manag. 2022, 323, 116135. [Google Scholar] [CrossRef] [Scilit] [PubMed]
- Martínez-Acosta, L.; López-Lambraño, A.A.; López-Ramos, A. Design Criteria for Planning the Agricultural Rainwater Harvesting Systems: A Review. Appl. Sci. 2019, 9, 5298. [Google Scholar] [CrossRef] [Scilit]
- Boers, T.; Ben-Asher, J. A Review of Rainwater Harvesting. Agric. Water Manag. 1982, 5, 145–158. [Google Scholar] [CrossRef] [Scilit]
- Ngigi, S.N.; Savenije, H.H.G.; Thome, J.N.; Rockström, J.; De Vries, F.W.T.P. Agro-Hydrological Evaluation of on-Farm Rainwater Storage Systems for Supplemental Irrigation in Laikipia District, Kenya. Agric. Water Manag. 2005, 73, 21–41. [Google Scholar] [CrossRef] [Scilit]
- Vico, G.; Tamburino, L.; Rigby, J.R. Designing On-Farm Irrigation Ponds for High and Stable Yield for Different Climates and Risk-Coping Attitudes. J. Hydrol. 2020, 584, 124634. [Google Scholar] [CrossRef] [Scilit]
- Motlagh, A.H.; Veysi, S.; Mohammadi, A.S.; Naseri, A.A. Derivation of Crop Yield Response Factor (Ky) Based on Satellite Data and Machine Learning Methods. Agric. Water Manag. 2026, 330, 110260. [Google Scholar] [CrossRef] [Scilit]
- Garg, N.K.; Dadhich, S.M. A Proposed Method to Determine Yield Response Factors of Different Crops under Deficit Irrigation Using Inverse Formulation Approach. Agric. Water Manag. 2014, 137, 68–74. [Google Scholar] [CrossRef] [Scilit]
- Döll, P.; Siebert, S. Global Modeling of Irrigation Water Requirements. Water Resour. Res. 2002, 38, 8-1–8-10. [Google Scholar] [CrossRef] [Scilit]
- Beyá-Marshall, V.; Arcos, E.; Seguel, Ó.; Galleguillos, M.; Kremer, C. Optimal Irrigation Management for Avocado (Cv. ’Hass’) Trees by Monitoring Soil Water Content and Plant Water Status. Agric. Water Manag. 2022, 271, 107794. [Google Scholar] [CrossRef] [Scilit]
- Moreno-Ortega, G.; Pliego, C.; Sarmiento, D.; Barceló, A.; Martínez-Ferri, E. Yield and Fruit Quality of Avocado Trees under Different Regimes of Water Supply in the Subtropical Coast of Spain. Agric. Water Manag. 2019, 221, 192–201. [Google Scholar] [CrossRef] [Scilit]
- Cárceles Rodríguez, B.; Durán Zuazo, V.H.; Franco Tarifa, D.; Cuadros Tavira, S.; Sacristan, P.C.; García-Tejero, I.F. Irrigation Alternatives for Avocado (Persea americana Mill.) in the Mediterranean Subtropical Region in the Context of Climate Change: A Review. Agriculture 2023, 13, 1049. [Google Scholar] [CrossRef] [Scilit]
- Xu, H.; Song, J. Drivers of the Irrigation Water Rebound Effect: A Case Study of Hetao Irrigation District in Yellow River Basin, China. Agric. Water Manag. 2022, 266, 107567. [Google Scholar] [CrossRef] [Scilit]
- Zhang, C.; Yang, G.; Wang, C.; Huo, Z. Linking Agricultural Water-Food-Environment Nexus with Crop Area Planning: A Fuzzy Credibility-Based Multi-Objective Linear Fractional Programming Approach. Agric. Water Manag. 2023, 277, 108135. [Google Scholar] [CrossRef] [Scilit]
- Campana, P.E.; Lastanao, P.; Zainali, S.; Zhang, J.; Landelius, T.; Melton, F. Towards an Operational Irrigation Management System for Sweden with a Water–Food–Energy Nexus Perspective. Agric. Water Manag. 2022, 271, 107734. [Google Scholar] [CrossRef] [Scilit]
- Chen, Y.; Zhang, J.-H.; Chen, M.-X.; Zhu, F.-Y.; Song, T. Optimizing Water Conservation and Utilization with a Regulated Deficit Irrigation Strategy in Woody Crops: A Review. Agric. Water Manag. 2023, 289, 108523. [Google Scholar] [CrossRef] [Scilit]
- Jiang, Y.; Xu, X.; Huang, Q.; Huo, Z.; Huang, G. Optimizing Regional Irrigation Water Use by Integrating a Two-Level Optimization Model and an Agro-Hydrological Model. Agric. Water Manag. 2016, 178, 76–88. [Google Scholar] [CrossRef] [Scilit]
- Galán-Martín, Á.; Vaskan, P.; Antón, A.; Esteller, L.J.; Guillén-Gosálbez, G. Multi-Objective Optimization of Rainfed and Irrigated Agricultural Areas Considering Production and Environmental Criteria: A Case Study of Wheat Production in Spain. J. Clean. Prod. 2017, 140, 816–830. [Google Scholar] [CrossRef] [Scilit]
- Mizyed, A. A Strategic Framework for Reusing Partially Treated Wastewater in Agriculture: Viability and Sustainability Prospects. Agric. Water Manag. 2025, 317, 109676. [Google Scholar] [CrossRef] [Scilit]
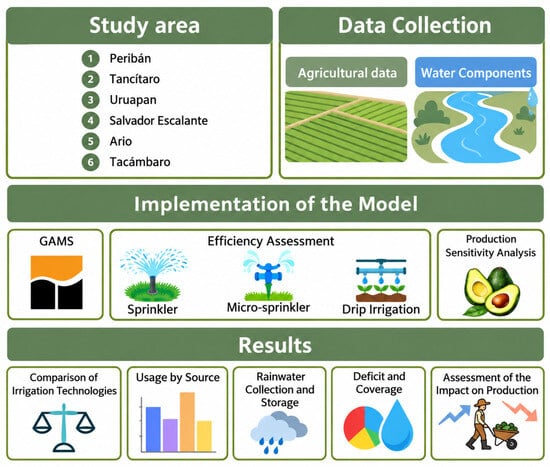
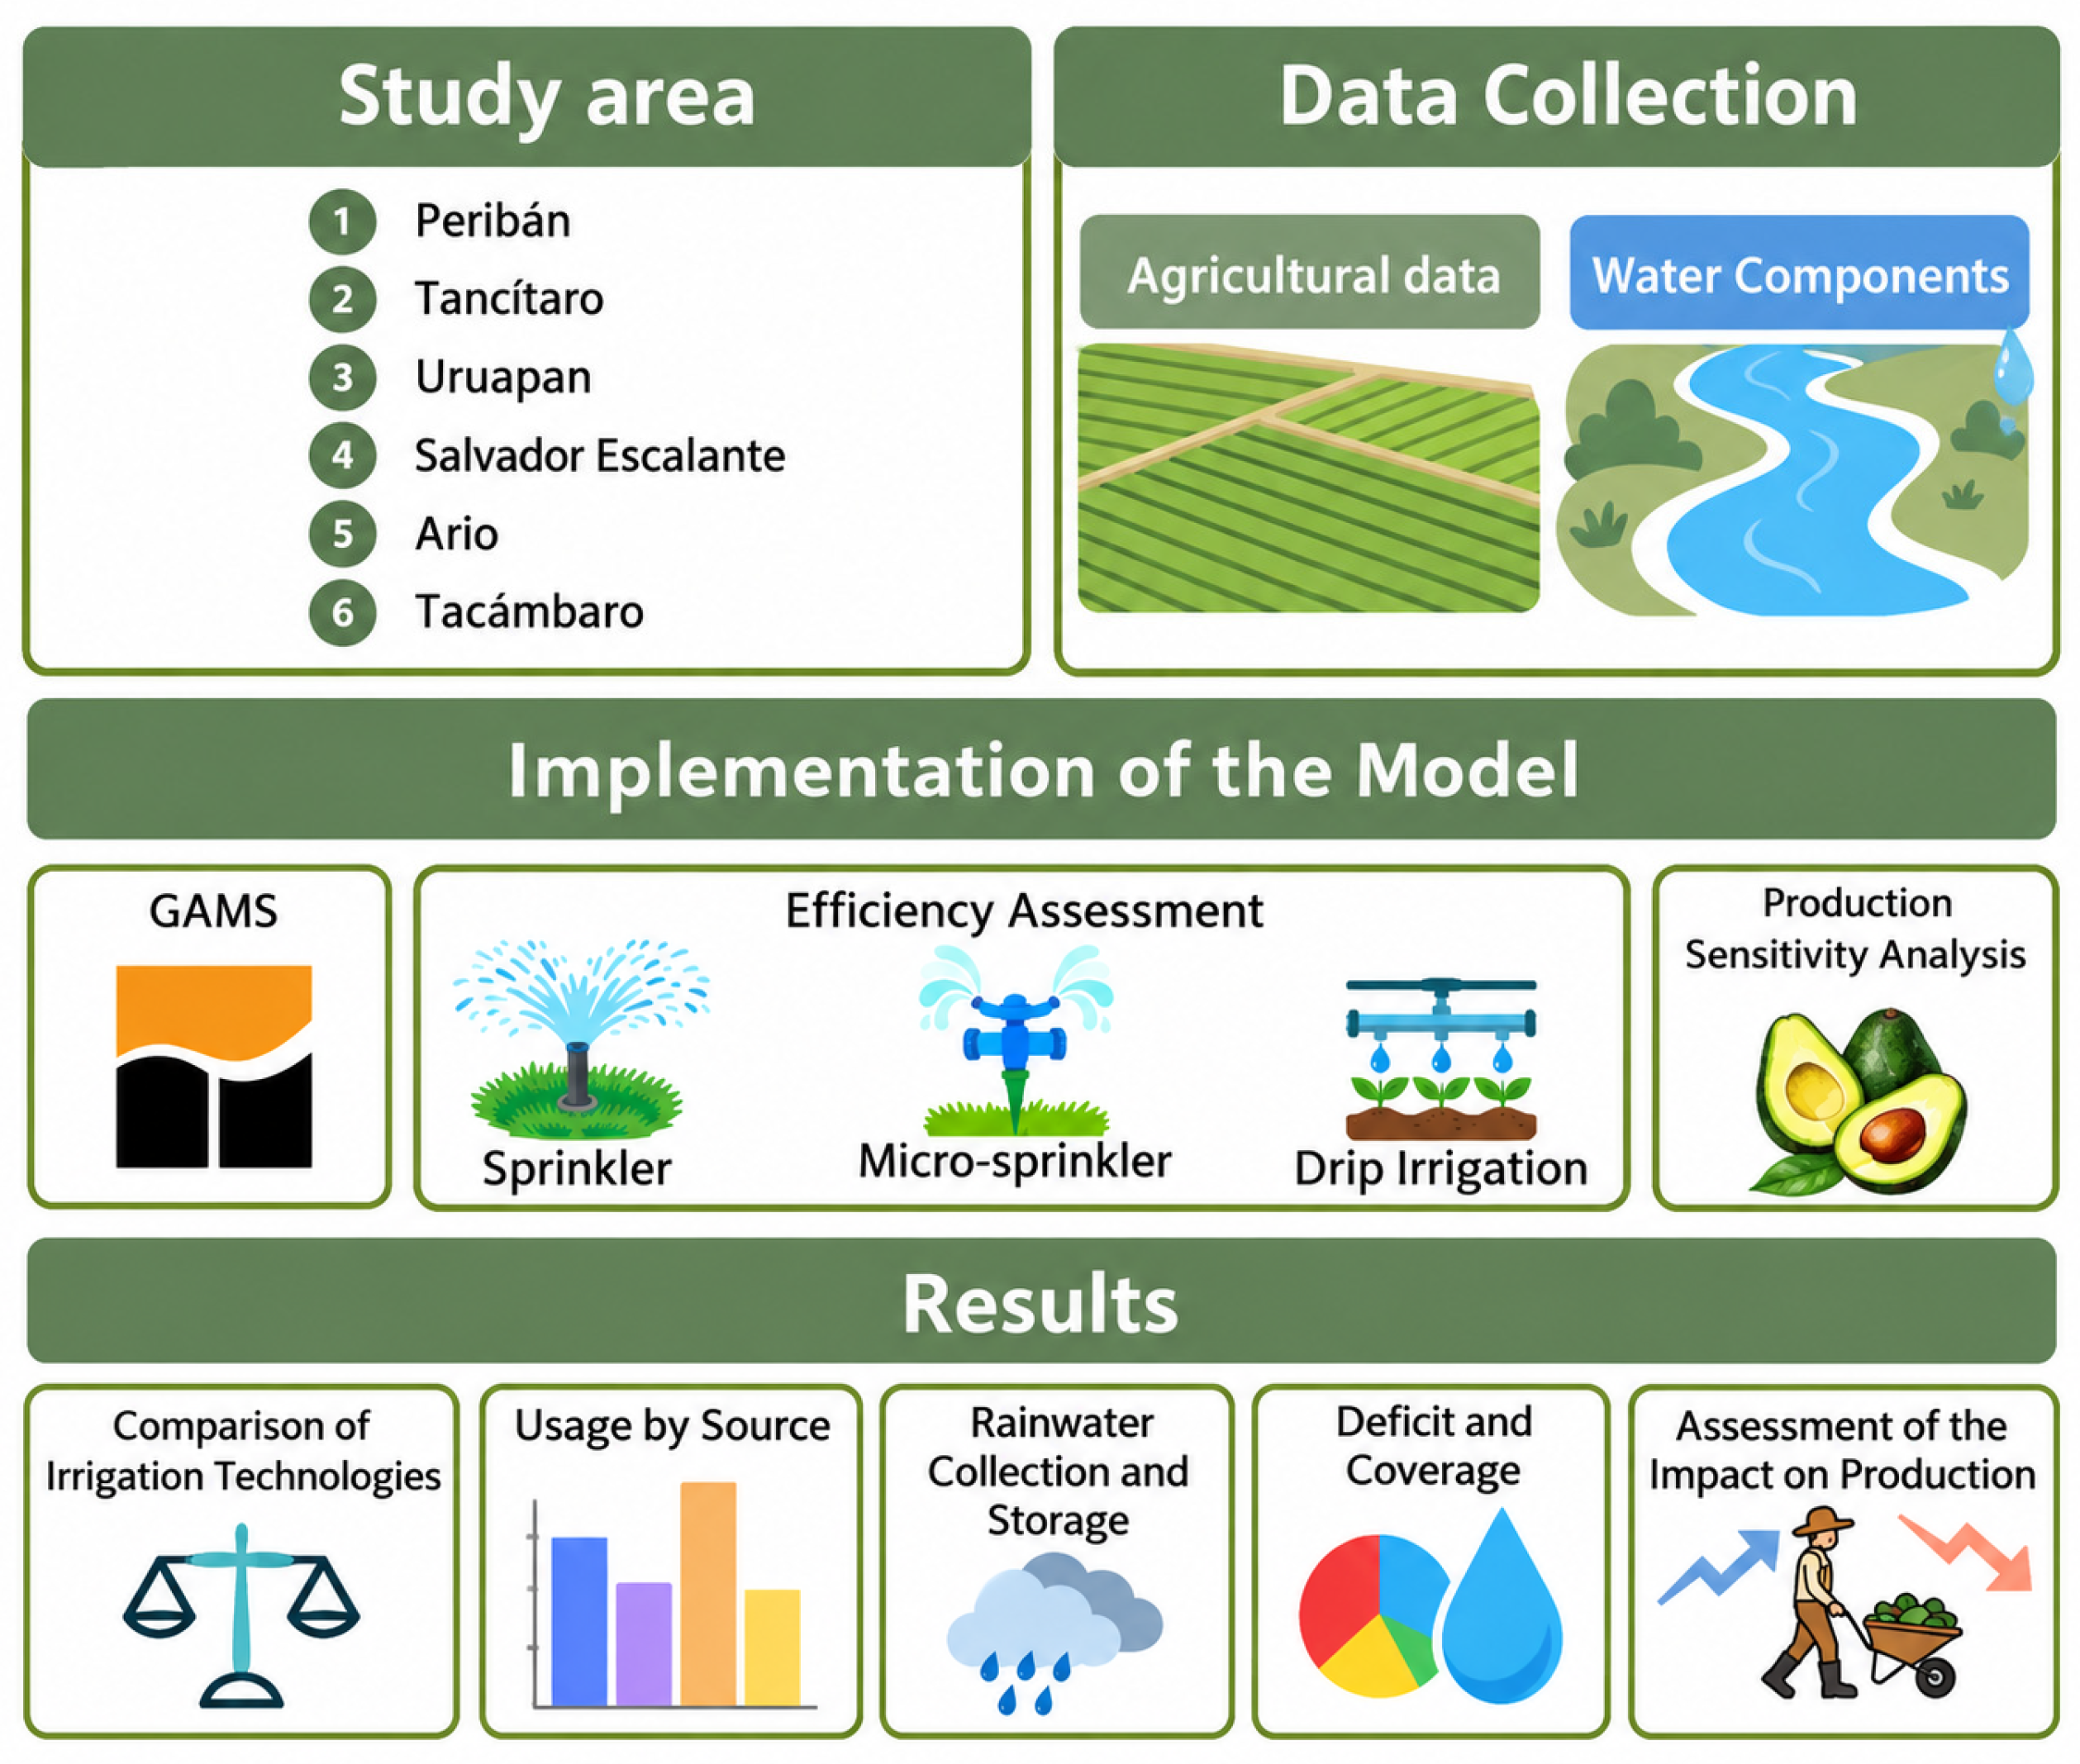
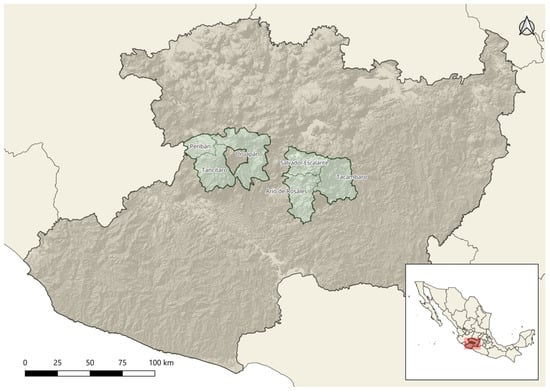
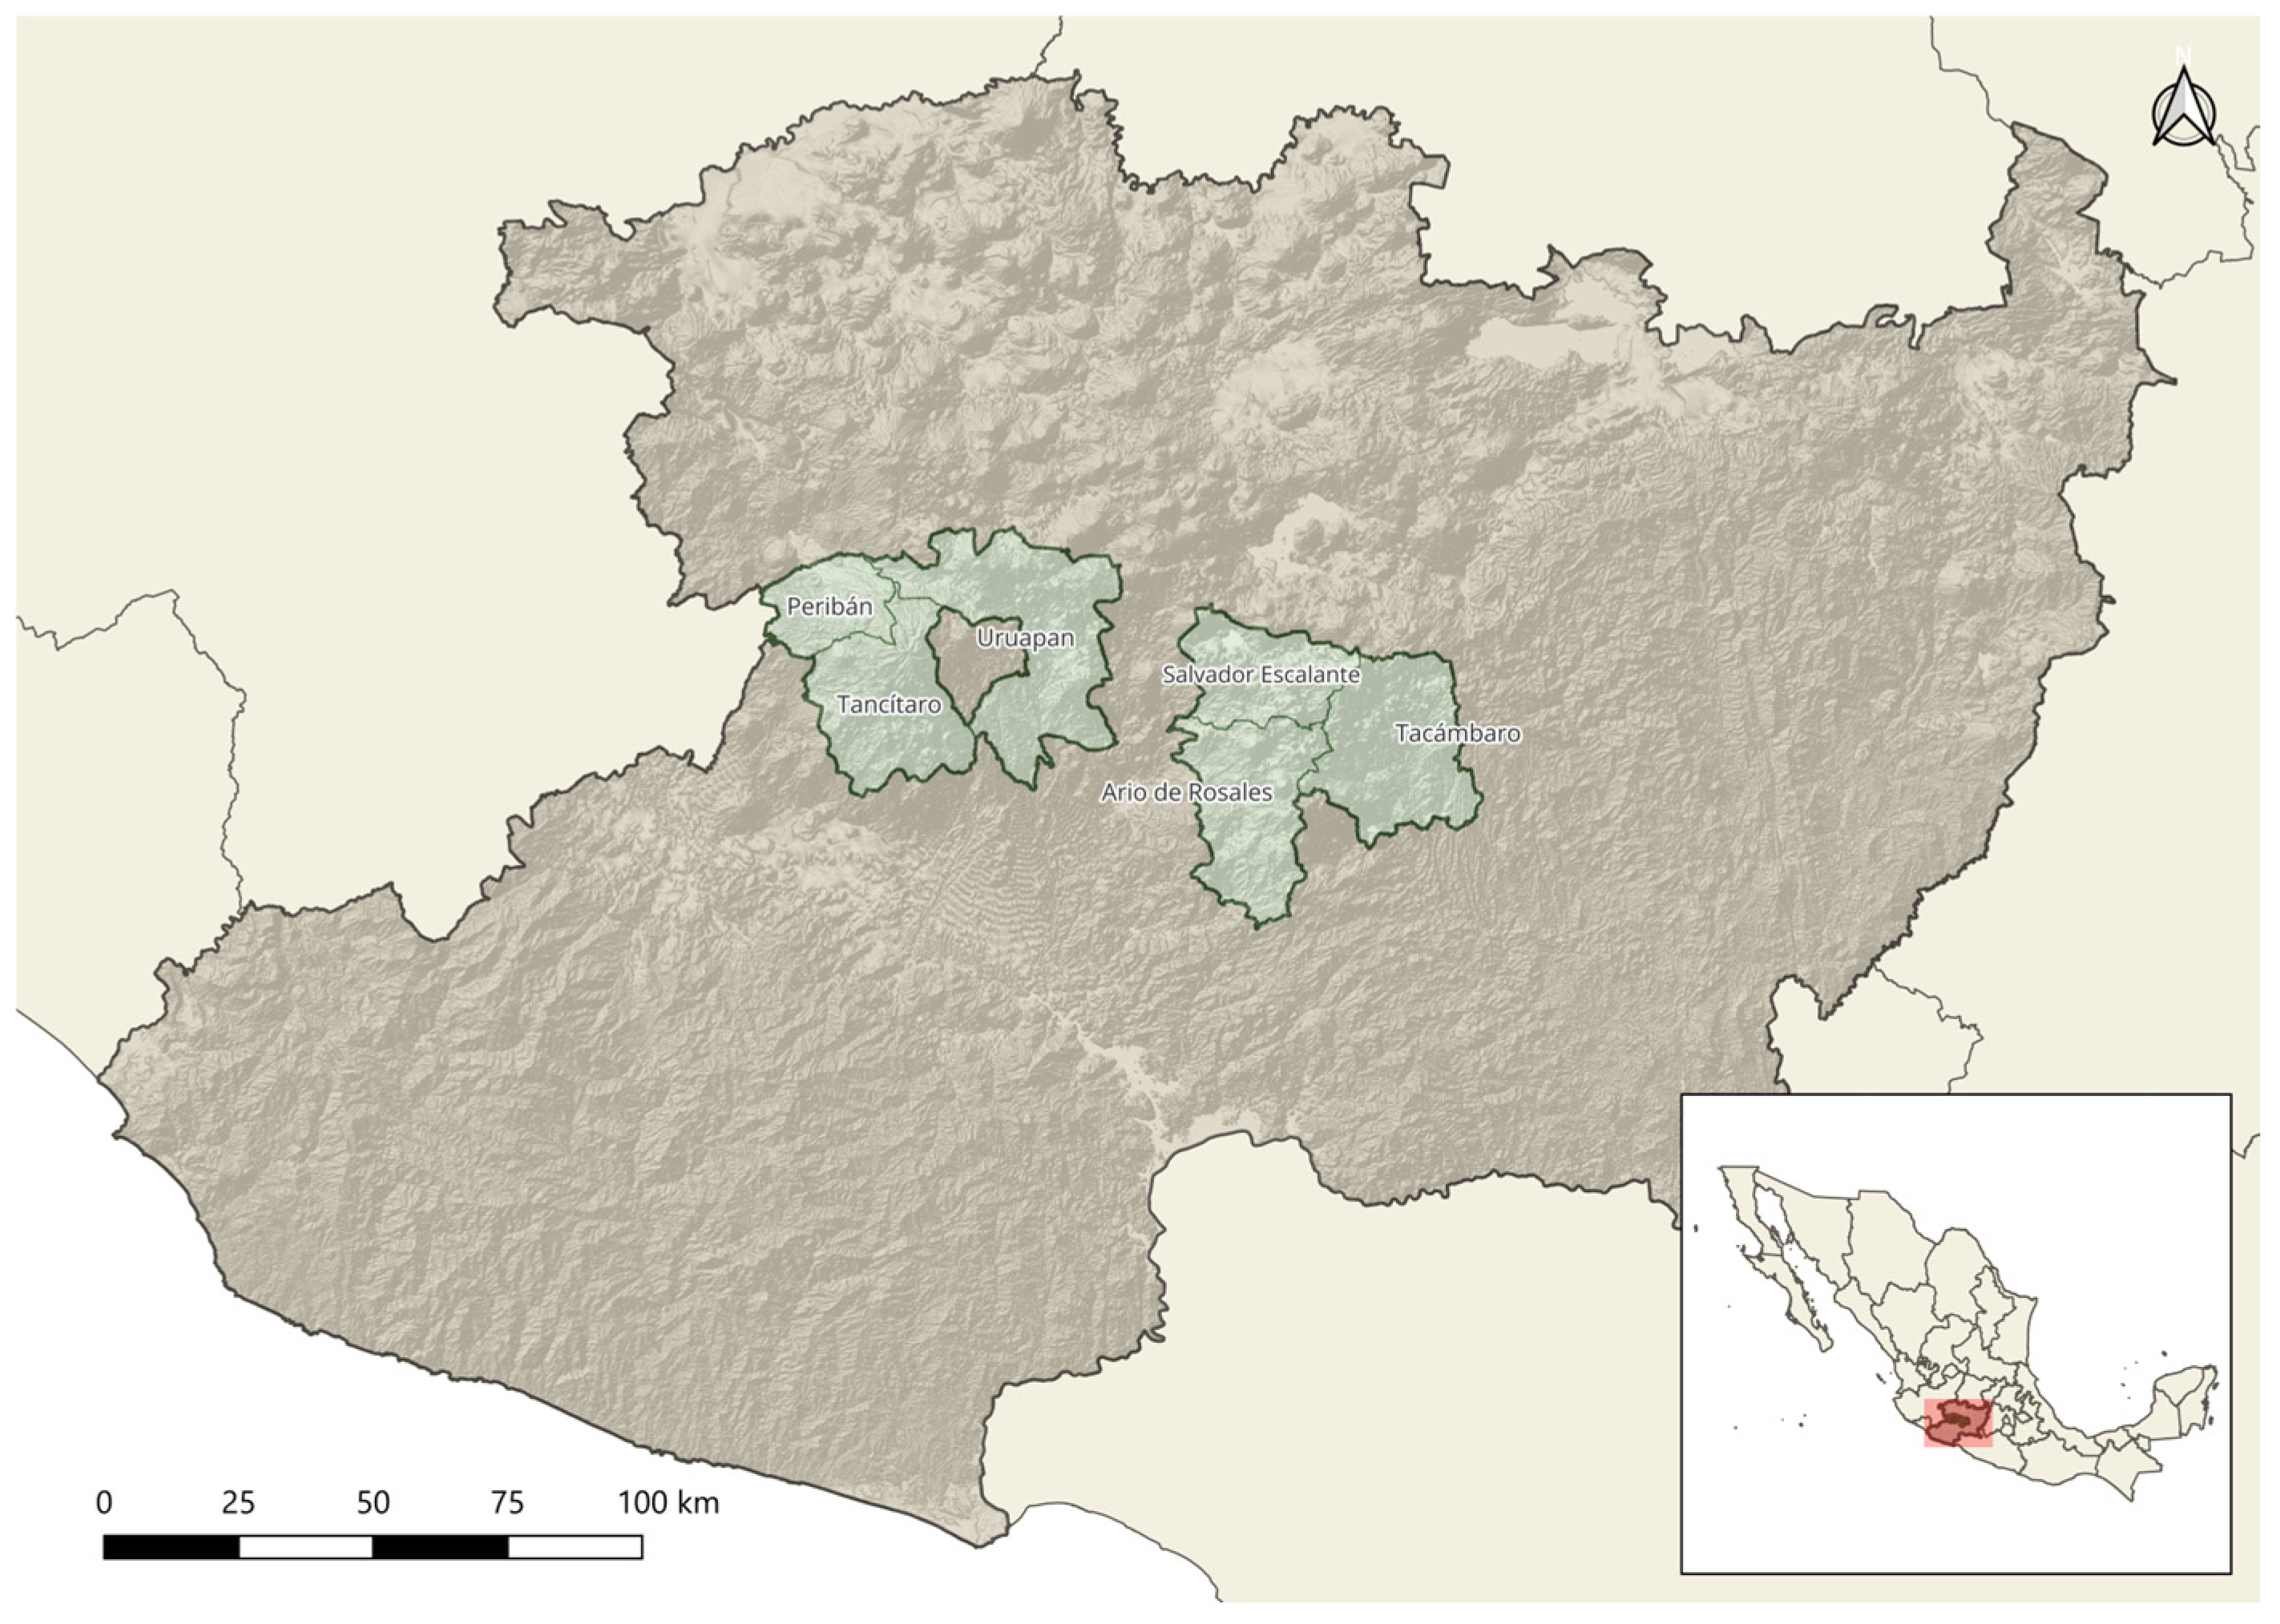
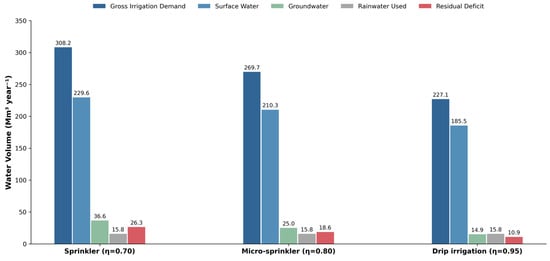
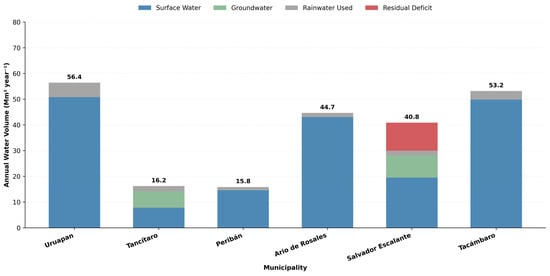
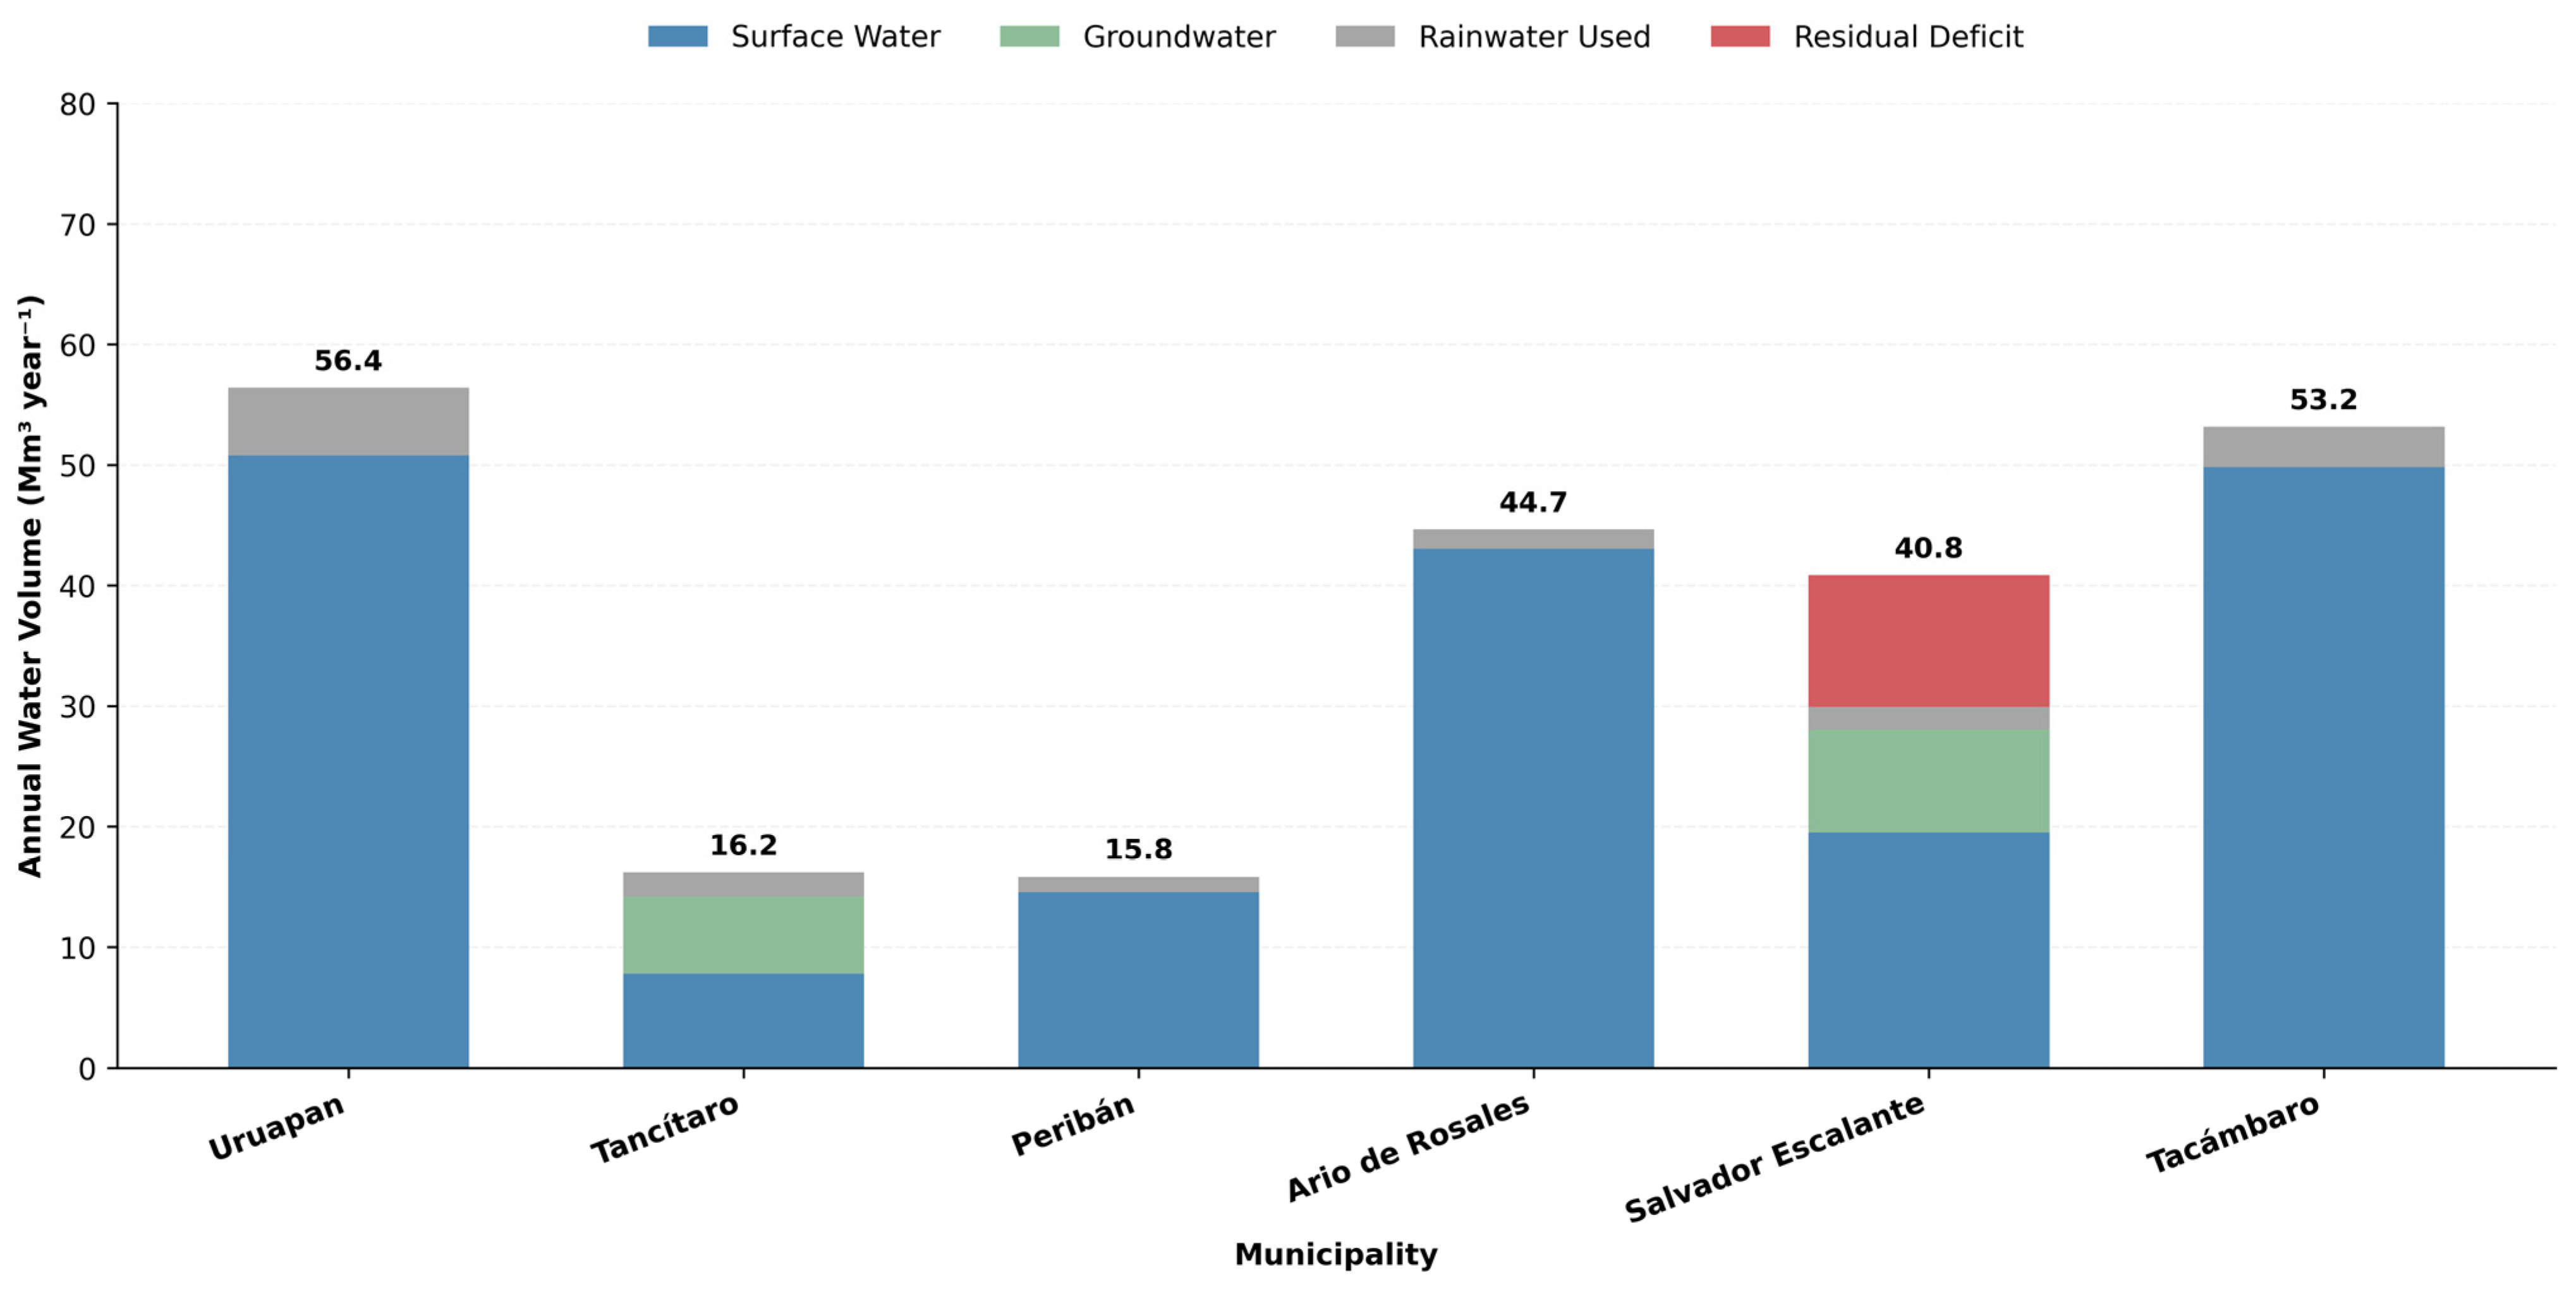
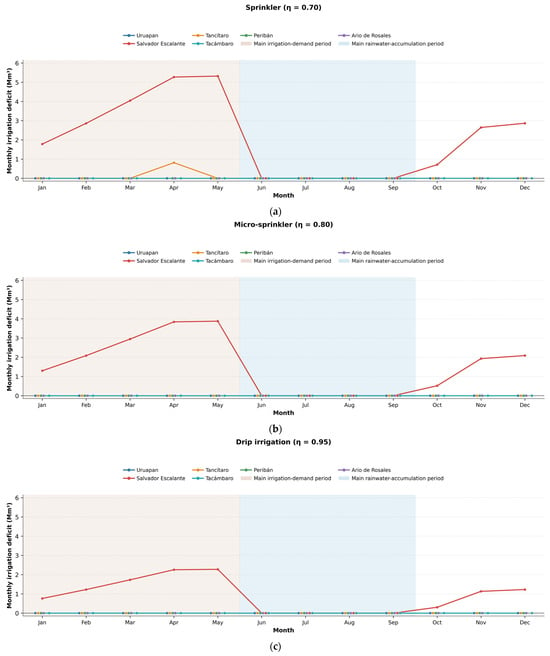
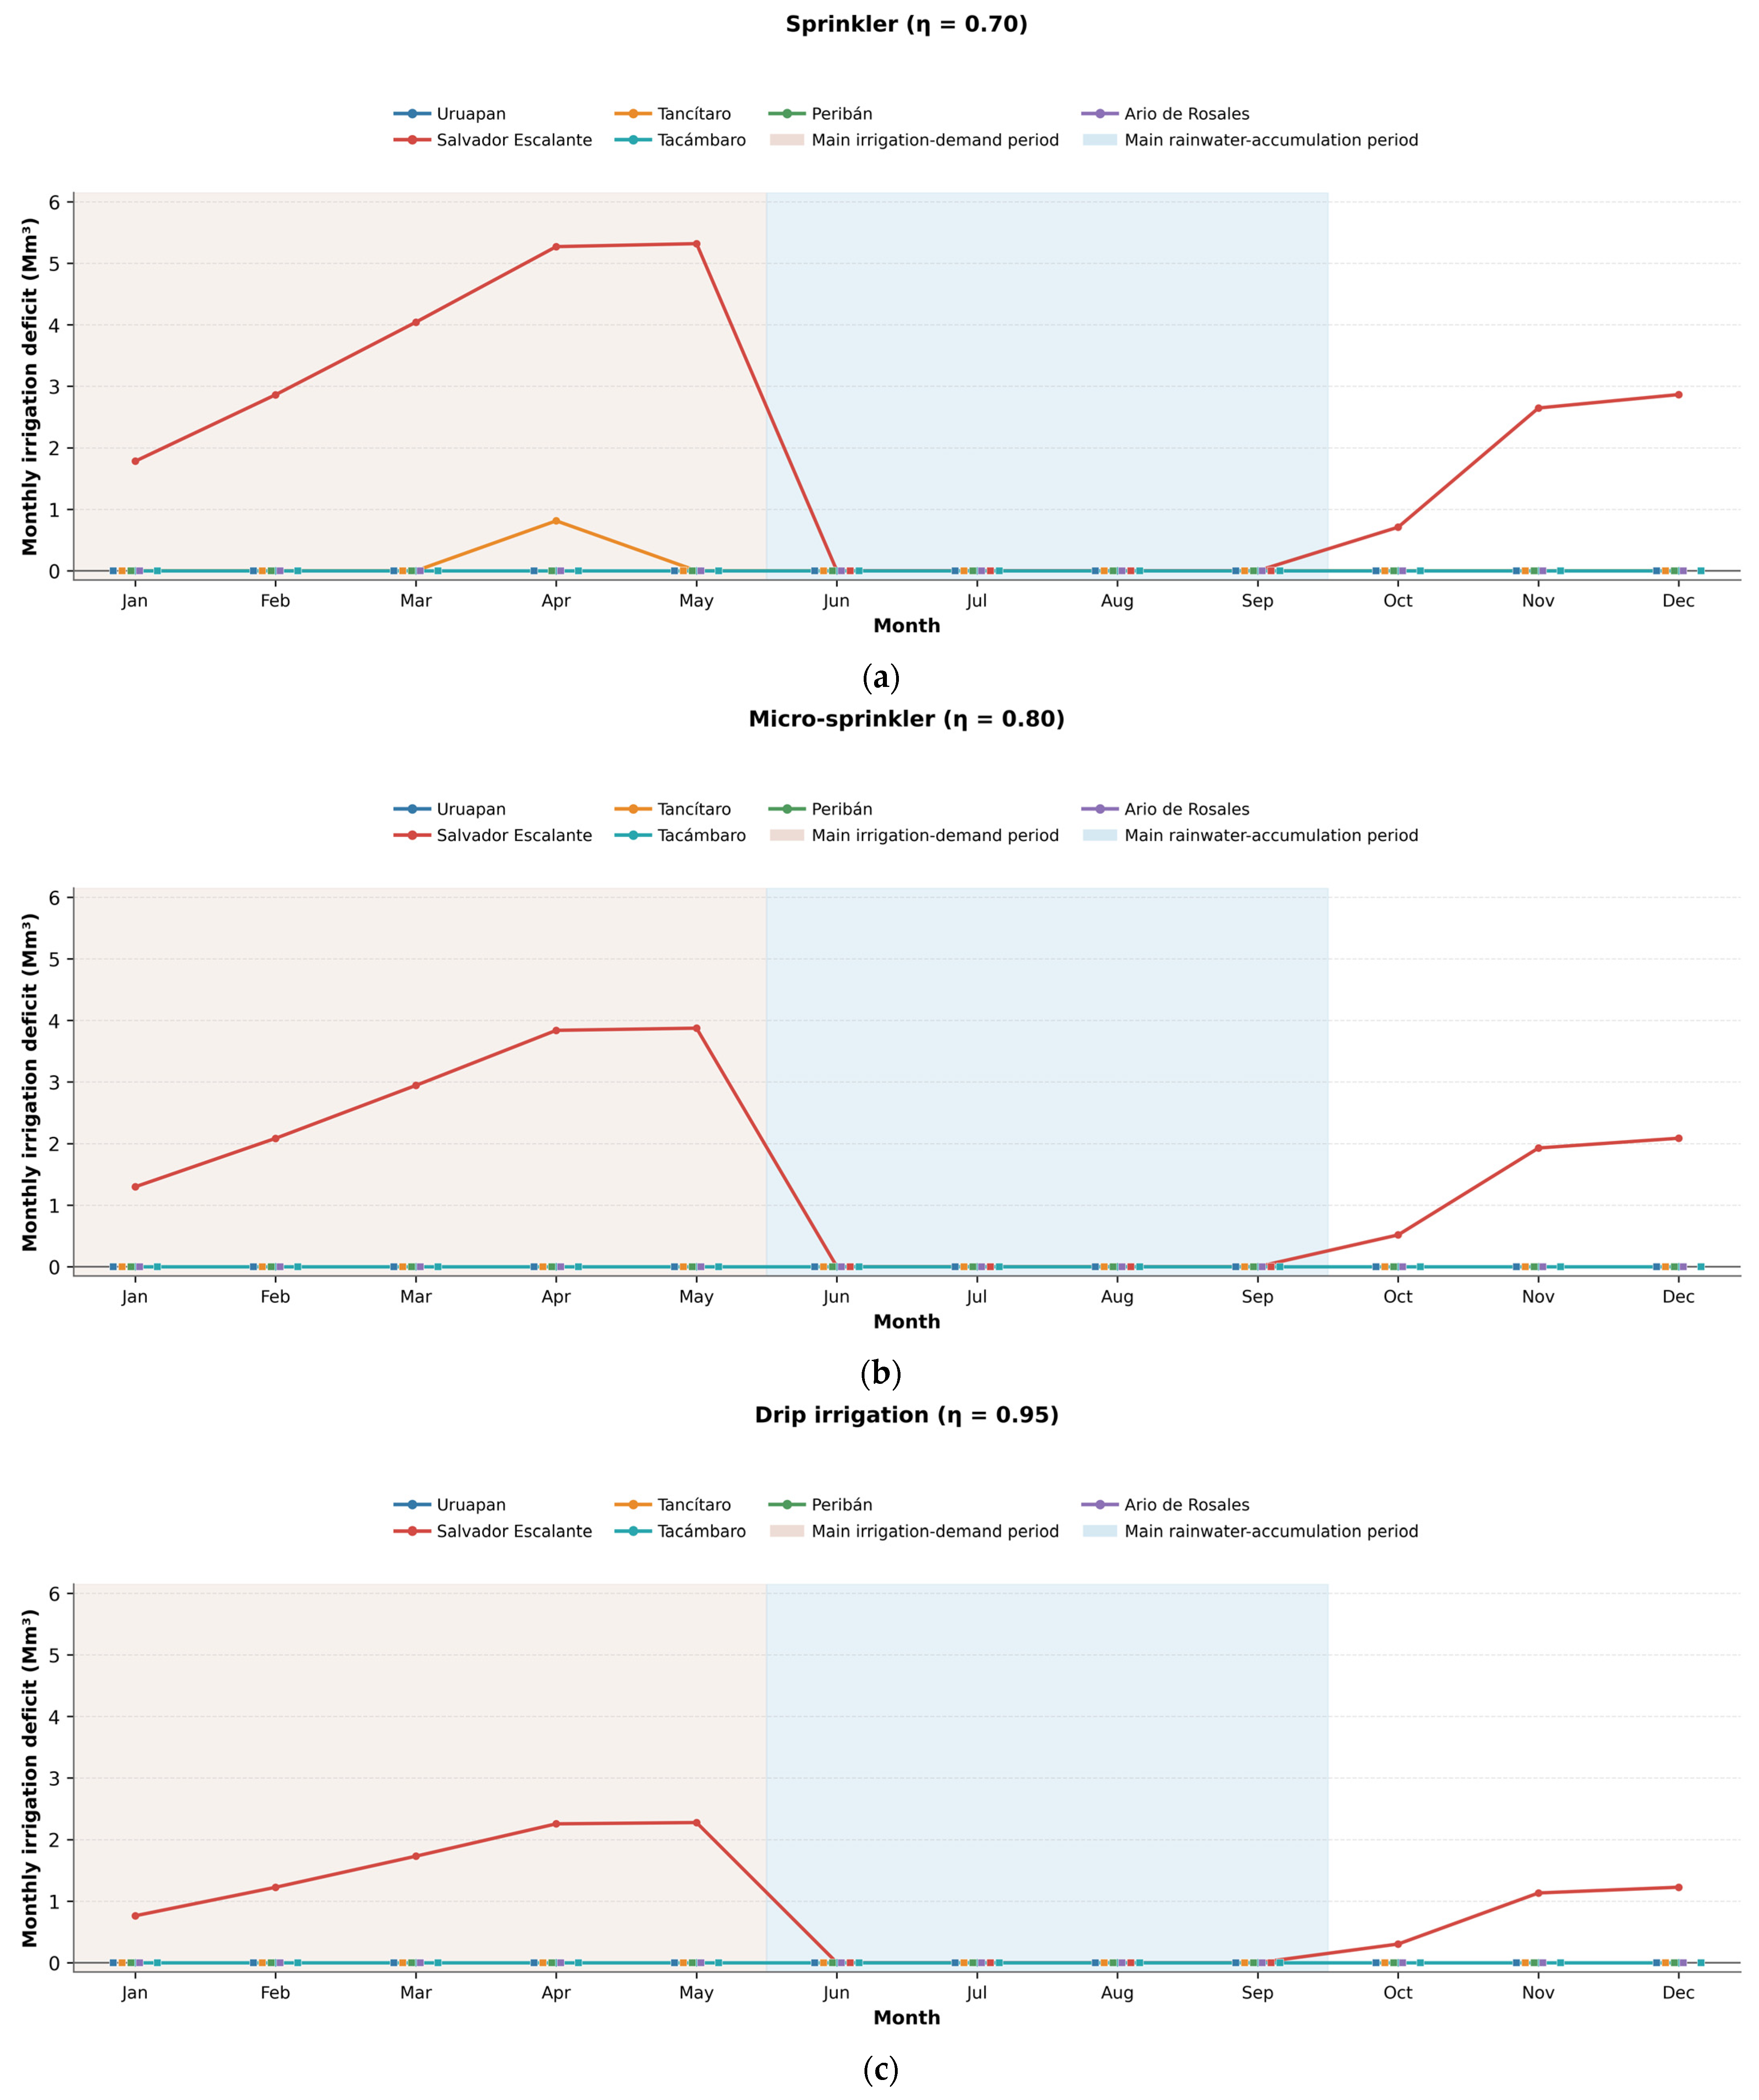
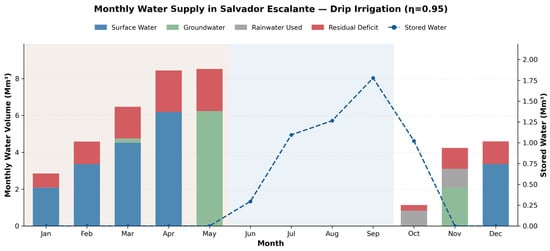
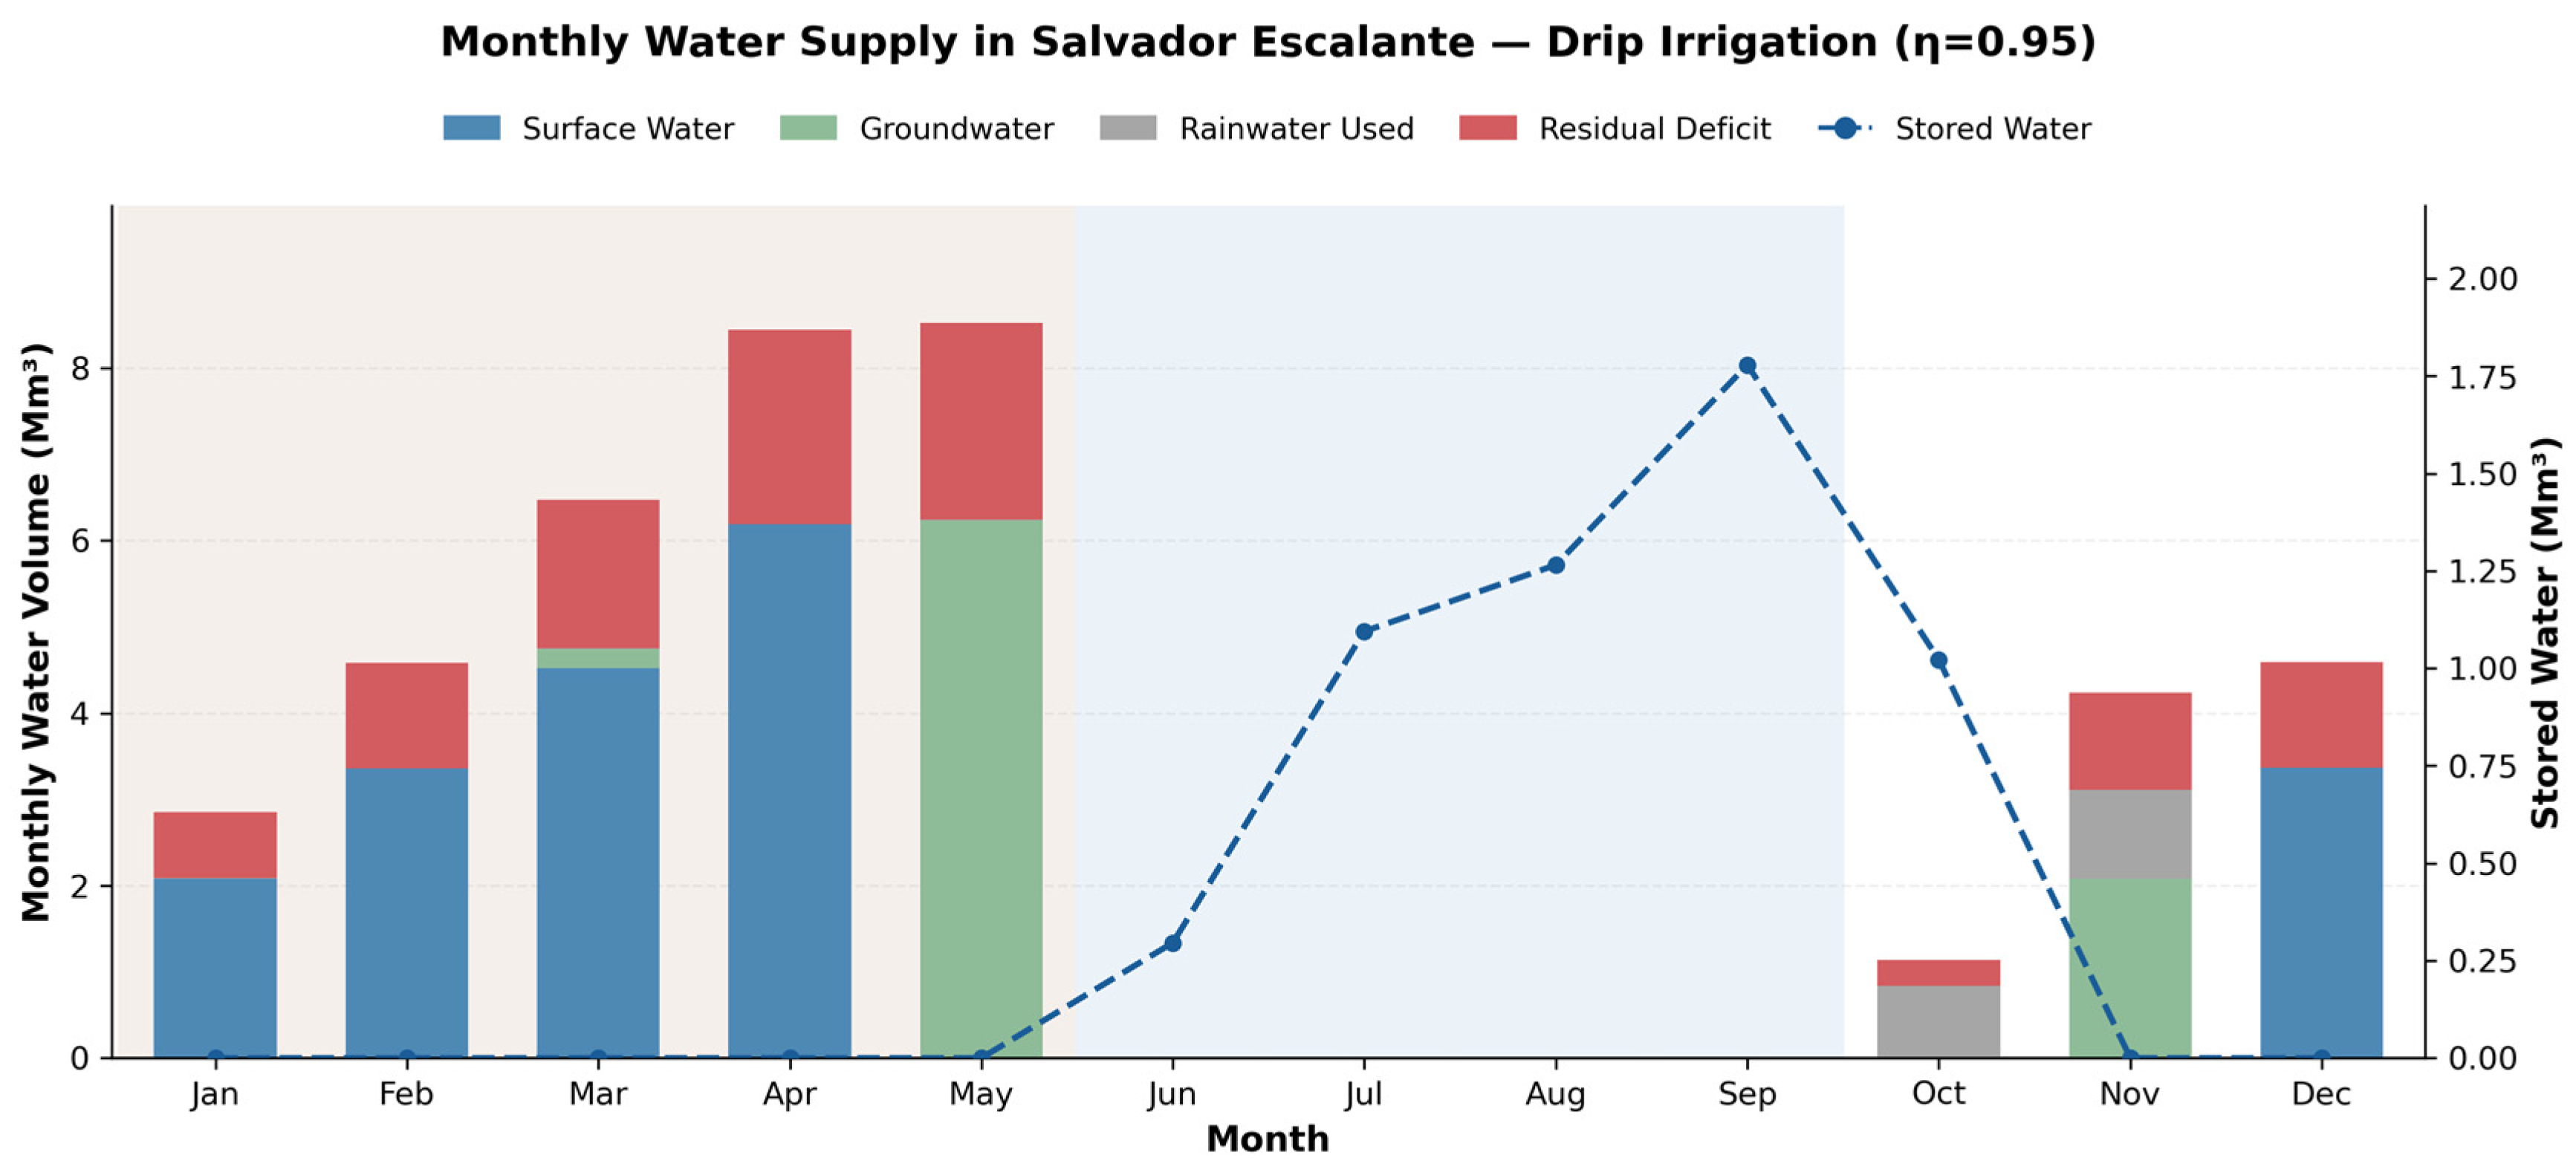
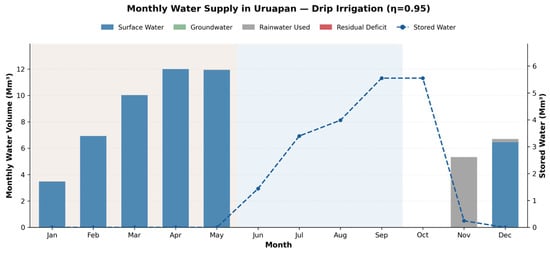
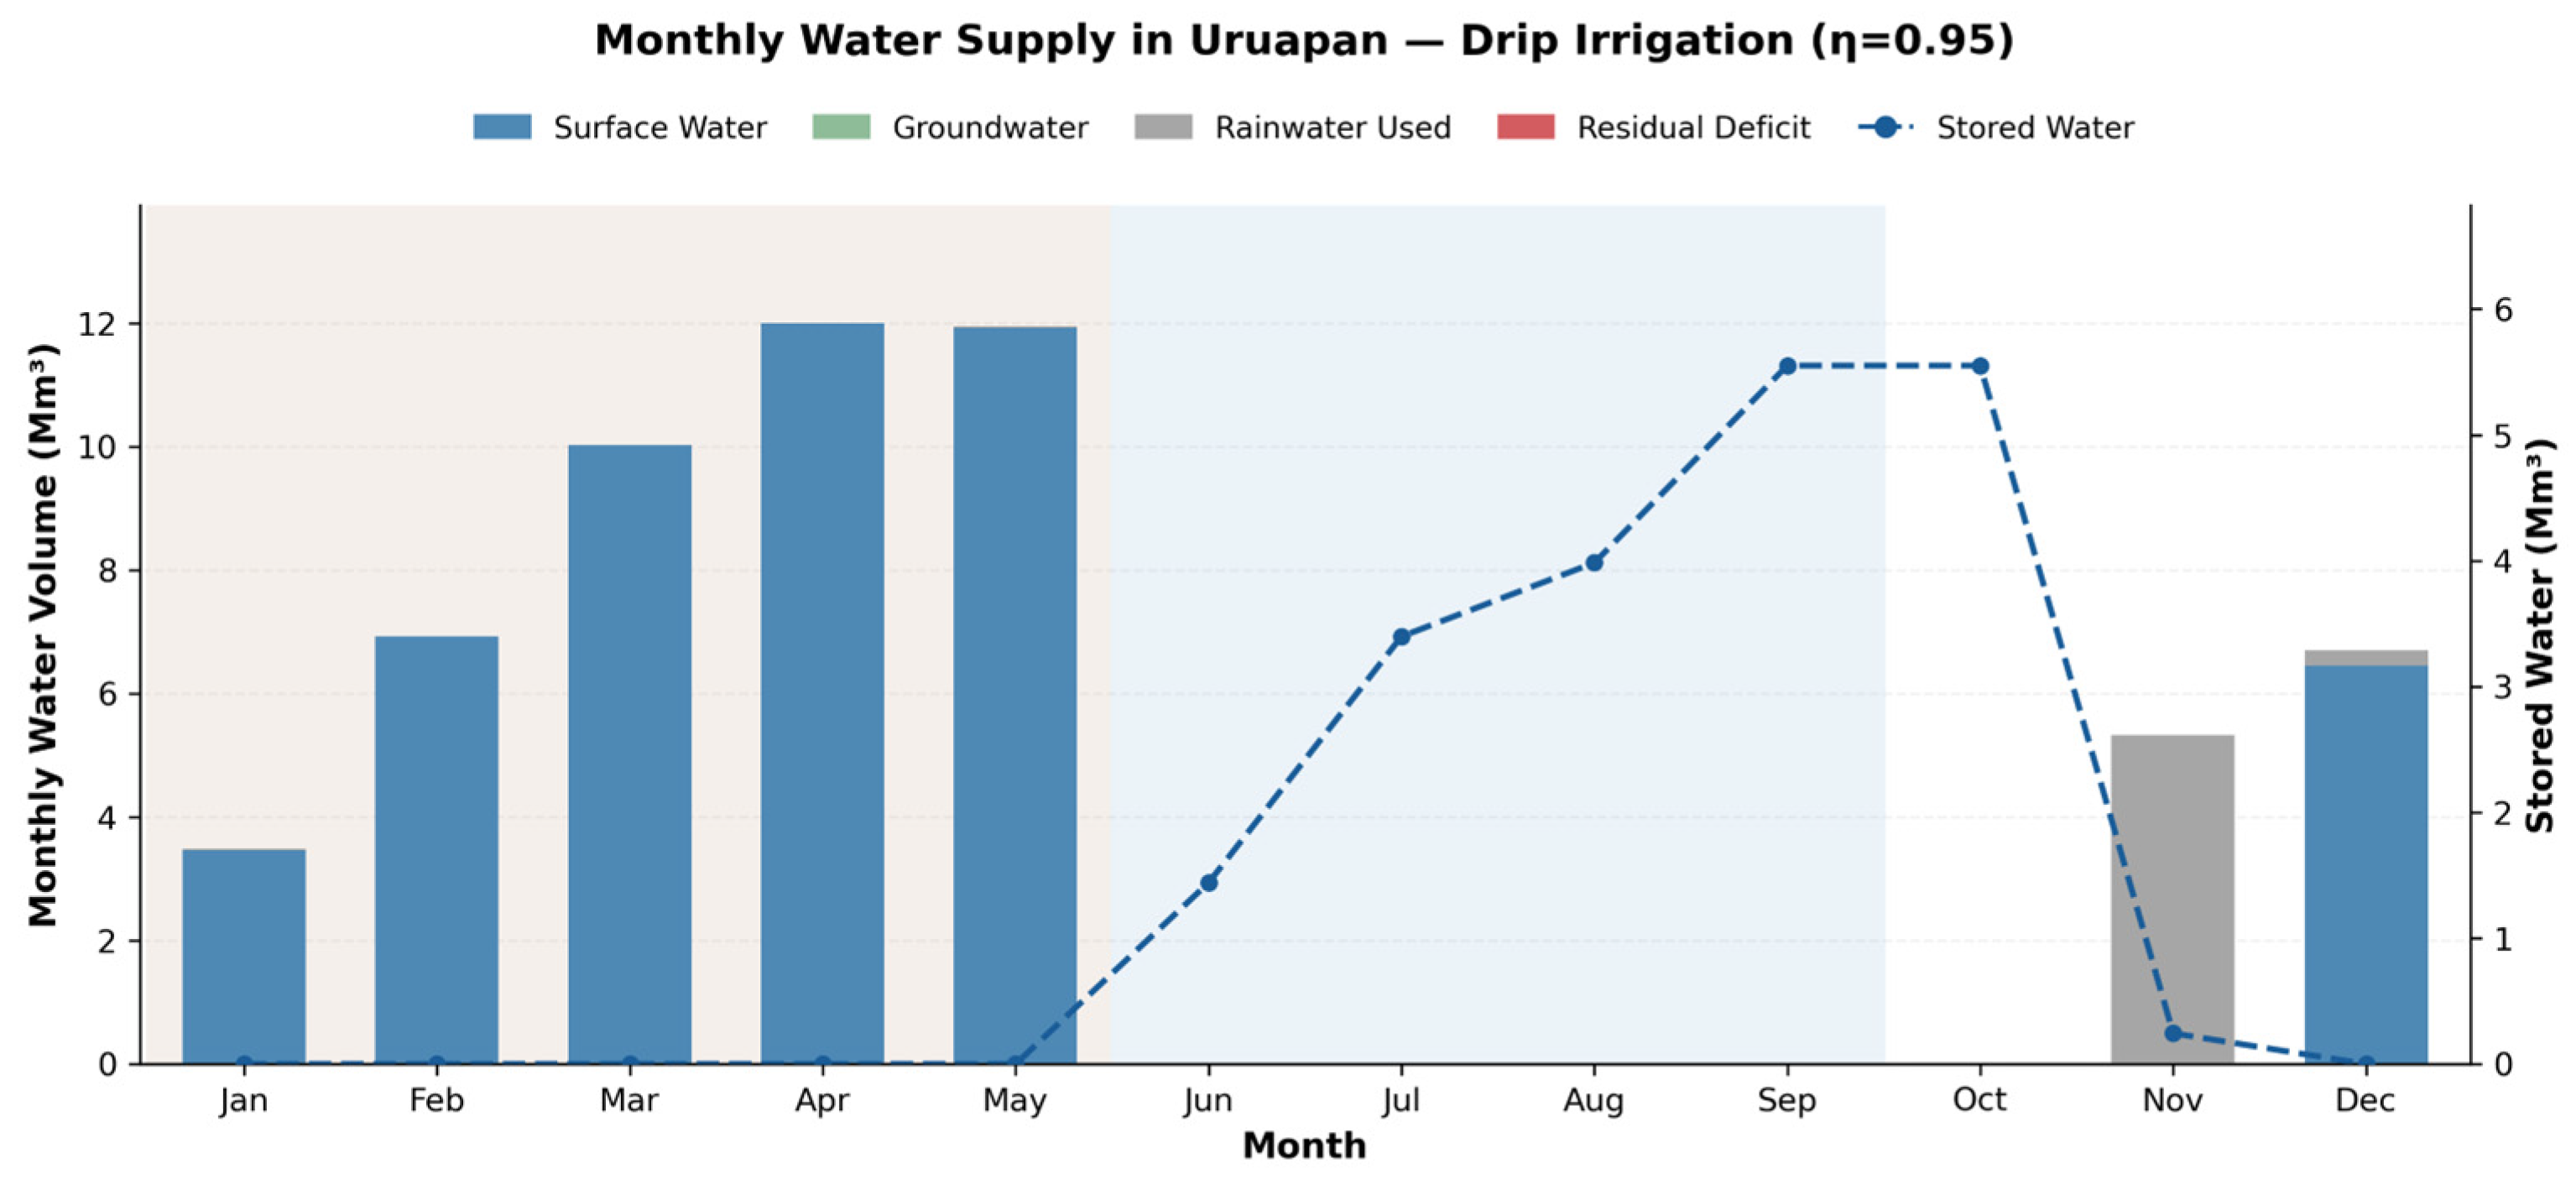
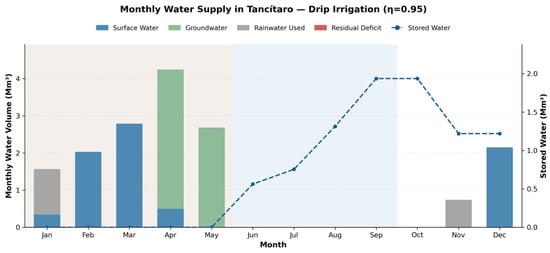
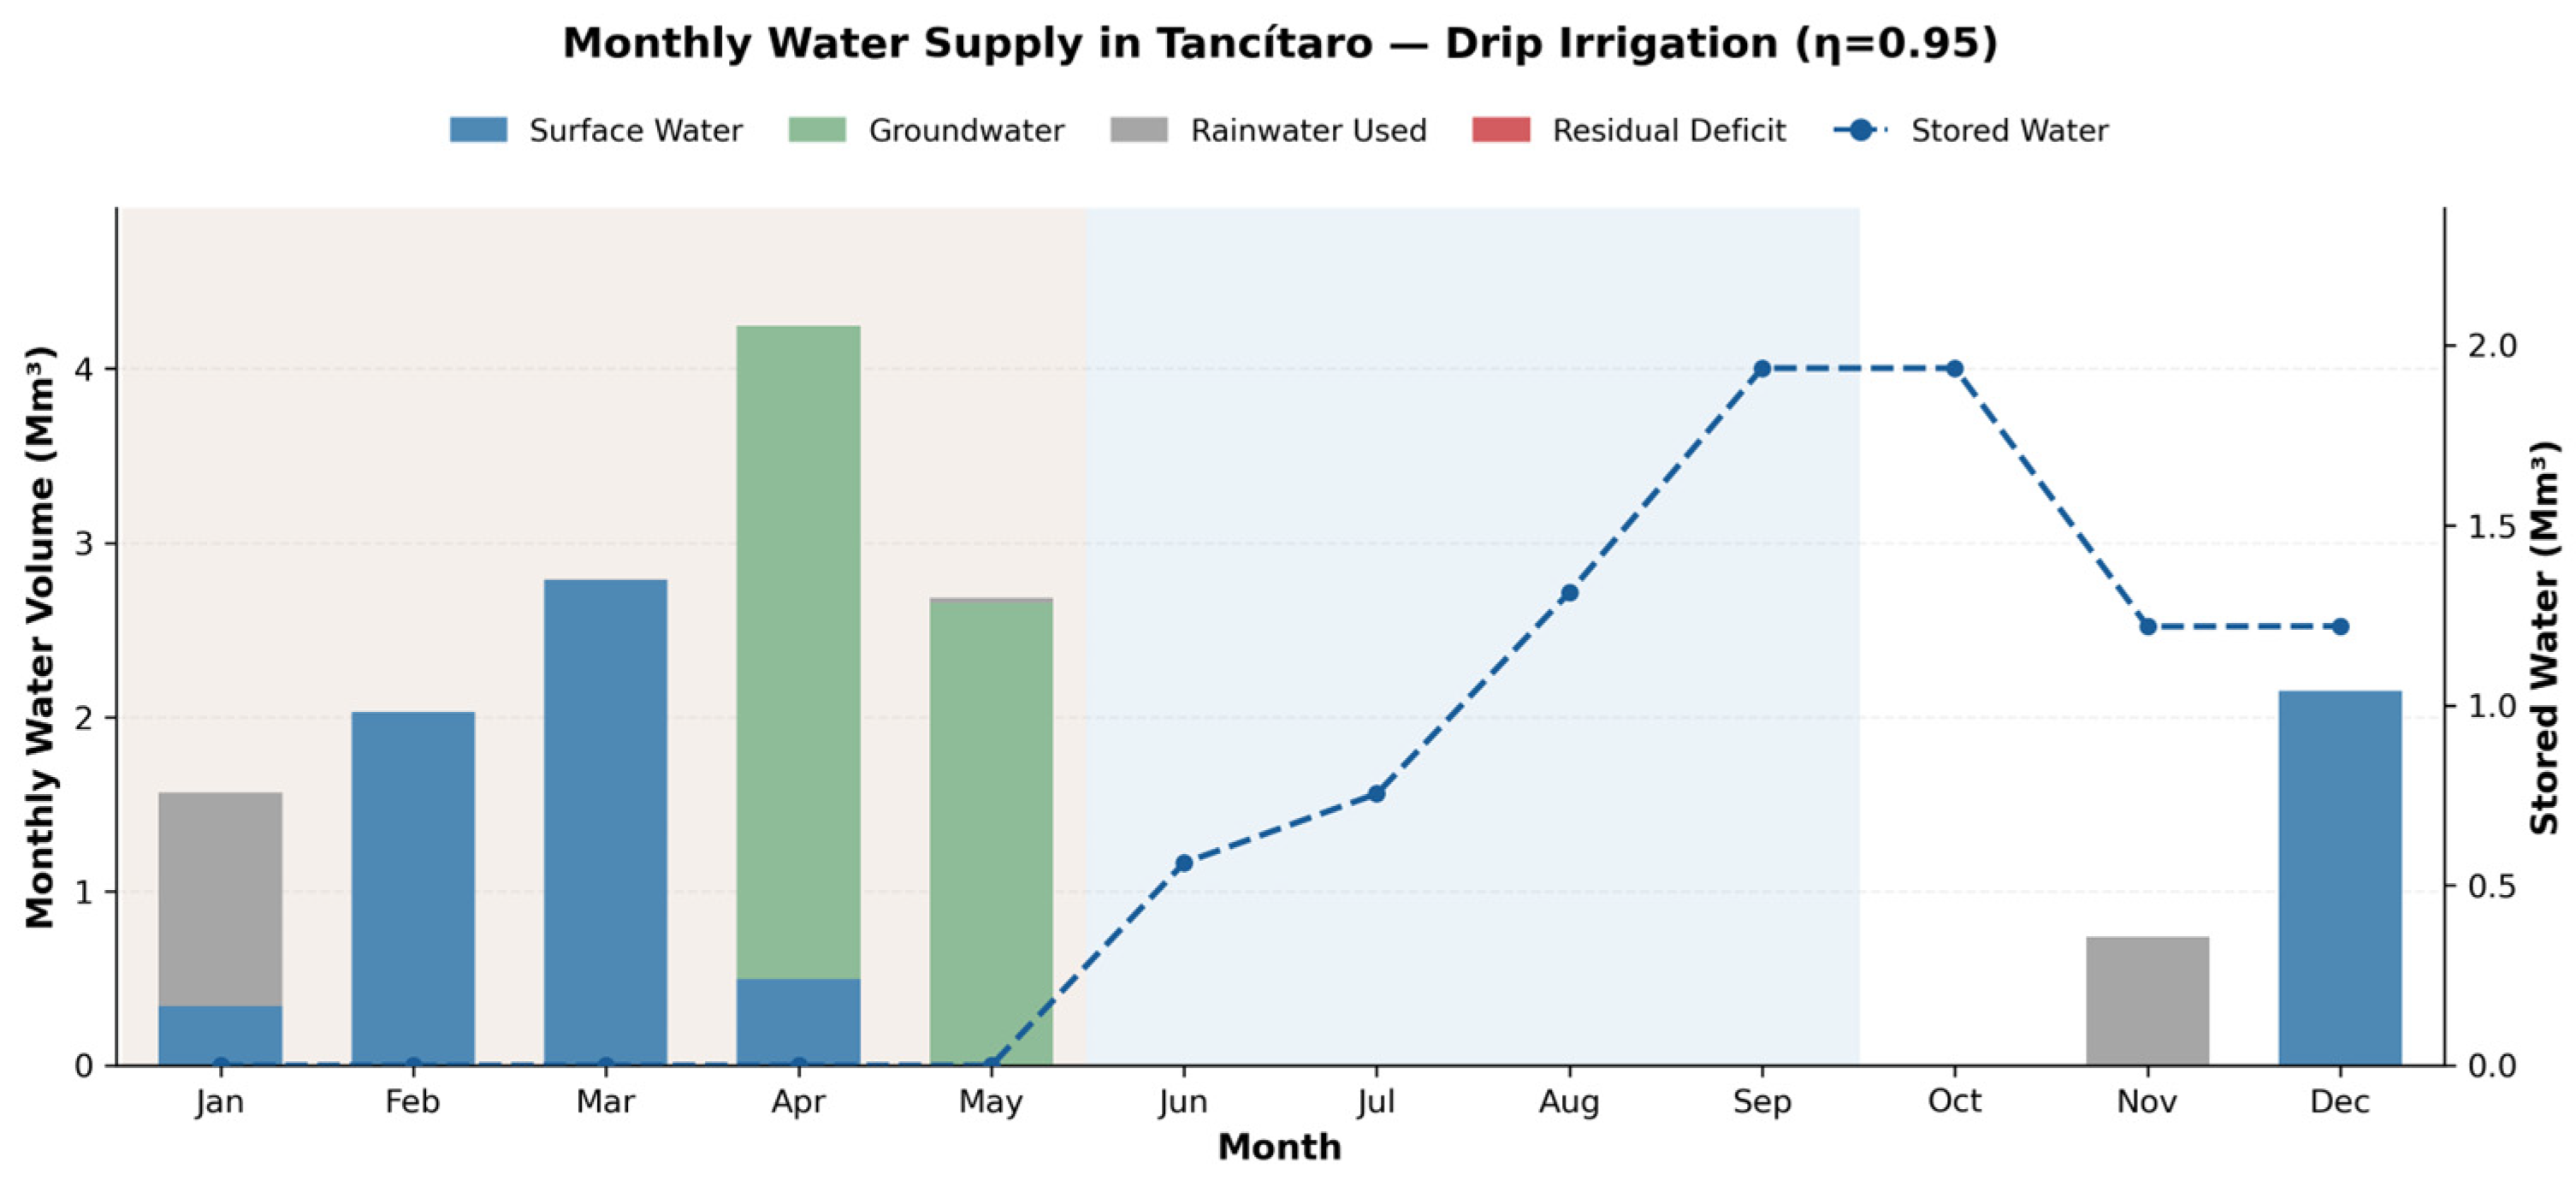
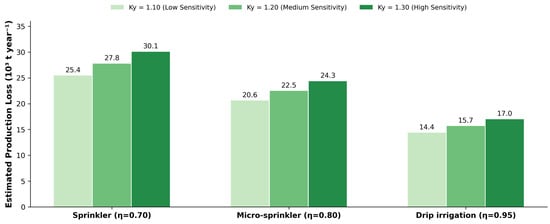
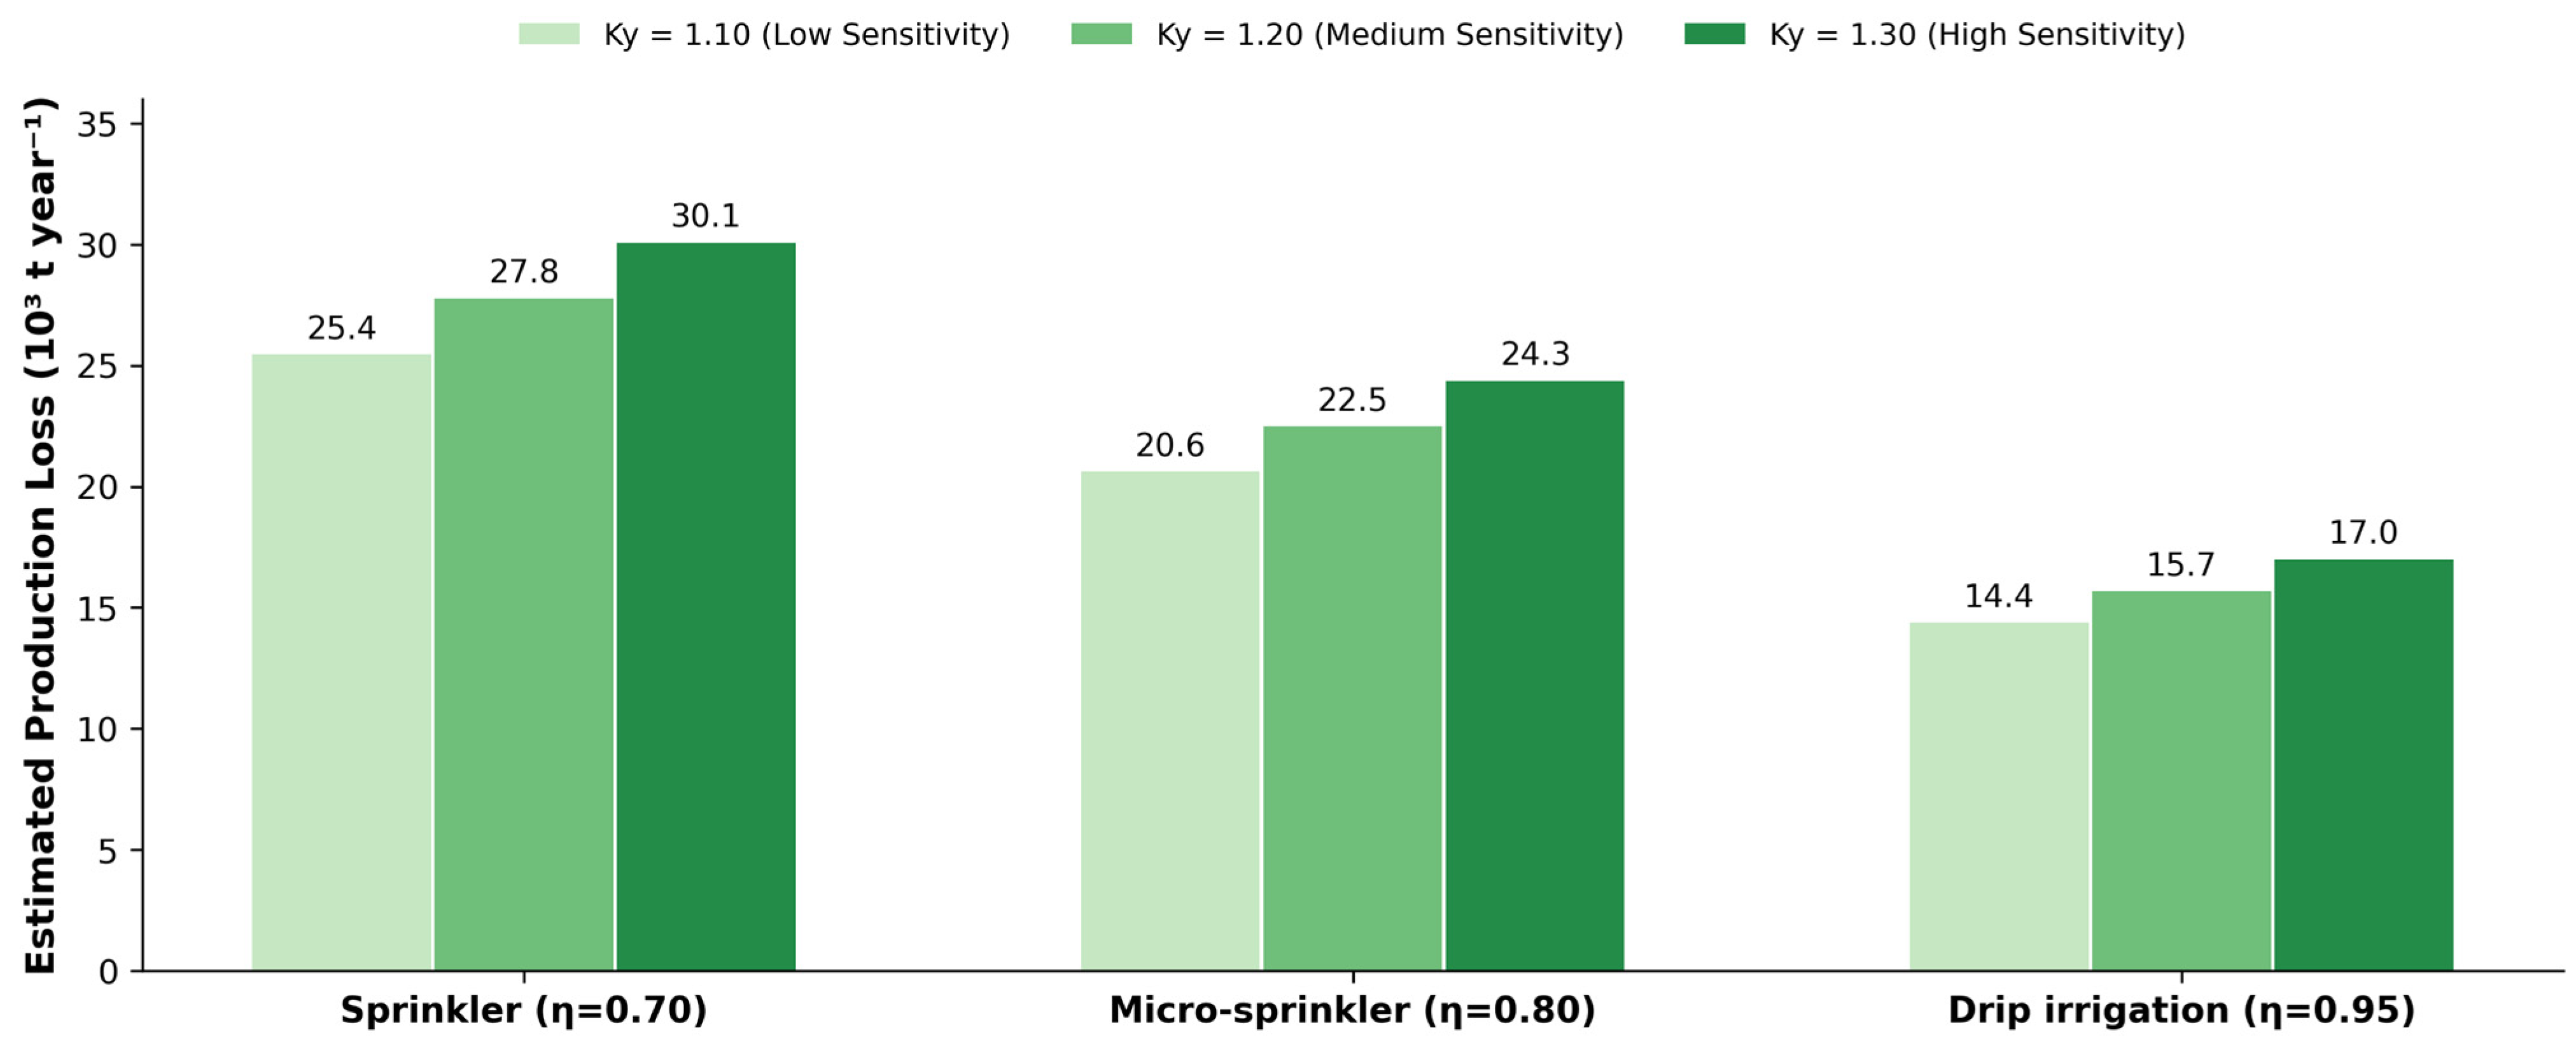

Disclaimer/Publisher’s Note: The statements, opinions and data contained in all publications are solely those of the individual author(s) and contributor(s) and not of MDPI and/or the editor(s). MDPI and/or the editor(s) disclaim responsibility for any injury to people or property resulting from any ideas, methods, instructions or products referred to in the content. |
© 2026 by the authors. Licensee MDPI, Basel, Switzerland. This article is an open access article distributed under the terms and conditions of the Creative Commons Attribution (CC BY) license.