


Abstract
Brazil holds a large rare-earth endowment and, since 2024, a commercial upstream operation, yet geological abundance has not translated into secure access to separated oxides, metals and magnets. This study examines how far Brazilian rare-earth capability extends along the value chain and why. We combine official mineral and trade statistics, facility disclosures, policy documents and peer-reviewed literature to score seven stages annually from 2015 to 2026 against explicit decision rules, distinguishing technological from commercial maturity and measuring how many consecutive stages from extraction operate at each level. Commercial capability now covers mining, beneficiation and the production of a mixed chemical intermediate, while separation, metallisation, magnet manufacture and circular recovery remain at research or pilot level. The record also reveals a discontinuity: pilot separation capacity documented in the mid-2010s was not sustained. Part of the recent downstream progress is disconnected from domestic feed, and the main commercial operation has been integrated into a foreign mine-to-magnet chain. We describe this configuration as a downstreaming paradox. For resource-rich economies, the findings indicate that resilience depends on connecting conversion stages in sequence, selectively and subject to explicit environmental safeguards that should be independently assessed before scale-up, rather than on extraction alone.
1. Introduction
Rare earth elements (REEs), the fifteen lanthanides from lanthanum to lutetium plus scandium and yttrium, are inputs to high-performance permanent magnets (chiefly neodymium-iron-boron magnets, built from neodymium, praseodymium, dysprosium and terbium), electric motors, wind turbines, advanced electronics, aerospace systems and defence technologies. Their strategic character does not arise from crustal scarcity. Supply risk results from the interaction of ore mineralogy, mainly bastnasite, monazite, xenotime and ionic-adsorption clays, complex separation chemistry, environmental controls, long project lead times, product qualification and the geographic concentration of processing and magnet manufacturing [1,2,3,4]. A country may therefore hold sizeable deposits and still depend on external networks for the material forms that industry actually uses.
The global distribution of capability makes this distinction consequential. In 2024, China supplied about 60% of mined magnet rare earths, roughly 91% of refined output and approximately 94% of sintered permanent magnets [1]. Concentration increases as material moves downstream, and geographically diversified refining and magnet capacity expected by 2035 remains smaller than diversified mined supply [1,5]. The licensing requirements that China introduced in April 2025 for seven medium and heavy rare earths, including their oxides, alloys and magnets, showed that this concentration can be converted into supply conditionality at short notice [6]. Diversifying mining, by itself, does not remove processing bottlenecks.
Brazil is an analytically revealing case. The National Mining Agency (ANM) reported 11.4 million tonnes of proved and probable rare-earth reserves for 2024, while contemporary commercial mining only began in 2024 [7,8,9]. For most of the preceding decade, reported beneficiated output came from residual monazite stocks rather than from a continuing mine-to-market chain. Monazite is a phosphate mineral that concentrates light rare earths together with thorium and uranium, and it has historically been Brazil’s main domestic rare-earth resource, extracted as a by-product of heavy-mineral-sand mining. The country is not, however, a newcomer to rare-earth chemistry. Monazite was processed industrially in São Paulo from 1949, a solvent-extraction demonstration unit operated at Buena between 1993 and 1996, and a monazite chemical-treatment unit completed at Caldas in 1999 never entered operation [10]; semi-industrial and pilot separation capacity was documented again in the mid-2010s [11]. A 2026 assessment commissioned by the Ministry of Science, Technology and Innovation concluded that no solvent-extraction separation plant was operating at industrial scale [10,12]. At the same time, the main commercial operation, Serra Verde’s Pela Ema mine, became part of a United States mine-to-magnet group in September 2026, with its Phase I output contracted to a government-backed offtake vehicle [13,14]. Brazil therefore combines geological strength, a renewed upstream, recurring technological activity and limited domestic transformation.
We use the term downstreaming paradox to describe this configuration: a resource-rich economy can expand extraction and demonstrate technologies without achieving commensurate transformation capability or resilient access to processed materials. The term is not introduced as a new general theory. It adapts to rare earths a recent analysis of Indonesian copper, which shows that expansion of domestic processing can coexist with structural imbalances between reserves, refining and domestic absorption [15], and it connects to the broader literature on commodity linkages and resource-based industrialisation [16,17]. The Brazilian case examines the complementary problem, in which upstream renewal and technical experimentation advance while dependable downstream capability remains incomplete. This is not an argument for autarky. External processing can support resilience when suppliers, routes, contracts and technologies are diversified; domestic capacity may remain fragile if it is concentrated in one facility, lacks qualified customers or depends on imported reagents and know-how [18,19,20,21]. The relevant question is whether critical capabilities and alternatives are sufficient to keep material moving through the resource system.
The analysis adopts a resource-system perspective, in which the object is not only an industrial supply chain but the accessibility, transformation, stewardship, resilience and circular use of a mineral resource. Recent work shows that resource security depends on the relation among extraction, processing, trade flows, industrial demand, environmental burdens and recovery options [22,23,24,25]. Mineral-flow reconstruction has been linked to country-level supply resilience [22], and secondary and extractive-waste resources contribute to critical-material supply only when recovery is technically and economically actionable [23]. Brazil offers a configuration in which a strong resource base and a renewed upstream coexist with incomplete conversion stages, a choice between maximising extraction and building selected transformation capabilities that many resource-rich economies face.
1.1. Research Questions
The study addresses three questions. RQ1: How did Brazil’s resource endowment, production regime and external trade in rare-earth products evolve between 2015 and 2024? RQ2: How far did technological and commercial capability extend along the rare-earth value chain between 2015 and 2026, and how continuous was that capability from extraction onwards? RQ3: Which stages interrupt the contiguous chain, and under which environmental and governance conditions could they be addressed?
1.2. Contributions
The contribution is empirical, methodological and conceptual. Empirically, the study reconstructs Brazil’s trajectory annually from 2015 to 2026 without treating legacy stock processing as mine production or announced capacity as operating supply, and it documents both a discontinuity in mid-2010s separation capability and the foreign integration of the main commercial operation. Methodologically, it introduces a route-neutral stage taxonomy that accommodates ionic-adsorption clays, explicit decision rules for maturity scoring, and a contiguity measure that complements chain-completeness indices by showing how far domestic material can travel through the chain. These measures complement material-flow, trade-network and reserve-resilience approaches [18,19,22,24] and respond to known limitations of readiness scales when applied to systems rather than single technologies [26,27]. Conceptually, the study adapts the downstreaming-paradox discussion to a system in which the central imbalance lies between renewed upstream activity and incomplete, partly disconnected downstream conversion [15]. The rules are transparent and can be applied to other critical minerals and resource-rich economies.
2. Conceptual Framework
2.1. Rare Earths as a Sequential Resource System
A rare-earth resource becomes industrially useful through a sequence of technically distinct conversions, each of which changes the material form. Mining delivers run-of-mine ore; physical beneficiation upgrades it; chemical processing yields a mixed rare-earth intermediate such as a carbonate, hydroxide, chloride or double sulphate; separation produces group or individual oxides; metallisation converts oxides into metals and master alloys; magnet manufacturing turns alloys into strip, powder and sintered or bonded magnets; and circular recovery returns secondary material to one of the conversion stages [2,3,4]. Because composition and specification change at each step, capacity at one stage cannot substitute for capacity at another.
The sequence is defined here by material form rather than by plant location, because the location of each conversion depends on the deposit type. In hard-rock and placer deposits, a mineral concentrate such as monazite is produced by physical methods and is then cracked and leached, often at a separate site. In ionic-adsorption clays, typically kaolinite- and halloysite-rich regolith developed over weathered granitic or syenitic rock, rare earths are held on clay surfaces and can be desorbed with salt solutions [28,29]; desorption, filtration and precipitation at the mine site yield a mixed rare-earth carbonate without crushing or milling [30]. In this route the first chemical intermediate is produced upstream, so a taxonomy built only on the hard-rock sequence would misclassify ionic-clay operations as physical beneficiation. Brazil hosts both routes: monazite from heavy-mineral sands and niobium-mine tailings, and ionic clays in Goiás and Minas Gerais.
For a serial system, effective throughput is constrained by the least available critical stage. Inventories, imports, alternative specifications and substitution can relax a bottleneck, but they do not remove the underlying dependency. We express this logic as:
where Csystem is effective system capability and Cj is usable capacity at stage j. The expression is conceptual rather than an engineering estimate. Its purpose is to prevent the inference that a large reserve or an operating mine implies secure access to separated oxides, metals or magnets.
Csystem ≤ min(C1, C2, …, Cn)
The serial logic has a further implication that coverage measures do not capture. A capability located downstream of a missing stage cannot draw on domestic material; it must be supplied with imported inputs, and its contribution to resilience is conditional on those imports. Two systems with the same number of capable stages can therefore differ in continuity. In one, the capable stages form an unbroken chain from the resource; in the other, they are isolated. We therefore complement the chain-completeness indices introduced in Section 2.2 with a contiguity measure, defined in Section 3.5, that counts how many consecutive stages from extraction meet a given maturity threshold. Coverage shows where capability exists; contiguity shows how far domestic material can travel through the chain before it must leave the country or be replaced by imports. The contiguity measure is a coverage construct: it establishes that consecutive stages have documented domestic capability, not that a specific unit of material is verified to move between them at the required specification and scale. Sprecher et al. [31] distinguish this kind of structural coverage from a system’s demonstrated capacity to absorb disruption, and the distinction matters directly for this case, because the facilities that register consecutive stage presence in 2026 are not all the same operation (Section 3.4 and Section 4.3).
Figure 1 translates this logic into the analytical architecture of the study. Resource endowment becomes supply resilience only when material can move through successive conversion stages, and the two processing routes converge at separation. The technology-to-scale gap is represented as a stage-spanning condition that may arise wherever technically demonstrated capability has not become dependable commercial operation.
Figure 1.
Sequential resource-system logic, processing routes by deposit type, and the stage-spanning interpretation of the technology-to-scale gap. Source: authors’ conceptualisation.
2.2. Chain Completeness and the Technology-to-Scale Gap
Scientific competence usually precedes dependable industrial supply, but the transition is neither automatic nor adequately represented by a binary present or absent measure. Laboratory work reduces technical uncertainty; a pilot demonstrates physical feasibility; a demonstration plant tests integration and repeatability; initial commercial production establishes market supply; and mature commercial capability adds sustained throughput, qualified products, customers and operational redundancy. This logic is familiar from technology readiness levels [26], whose use in practice has been criticised for weak treatment of integration between technologies and of the conditions that separate a working prototype from a supplied product [27]. The maturity scale used here therefore scores stages of a material chain rather than individual technologies, and it separates technological presence from commercial capability through two thresholds.
Chain-completeness indices measure the share of stages that reach each threshold, and the technology-to-scale gap (TSG) is the difference between the technological and the commercial index (Section 3.5). Because the scale is ordinal and cumulative, the gap equals the share of stages at which at least pilot capability is documented but commercial capability has not been established. It is not a percentage of physical material, productive capacity, economic value or unmet demand. A positive gap can indicate useful experimentation, yet it also identifies where technological capability has not translated into dependable market supply. The TSG is a descriptive construct introduced in this study rather than an established industry metric, and it is read together with the contiguity measure introduced in Section 2.1. The CCI is a stage-coverage diagnostic, not a quantitative estimate of supply resilience, productive capacity, economic value or environmental performance: it does not measure tonnages, effective capacity, yields, costs, product quality, feedstock availability, supplier redundancy, substitution time or the exposure of industrial users. A CCI of 42.9% therefore means that three of seven stages meet the threshold, not that 42.9% of resilience has been achieved.
2.3. External Dependence and Network Redundancy
Missing domestic stages create different levels of vulnerability depending on the structure of external supply. A diversified network can provide redundancy; dependence on one country, firm, route or process can amplify disruption [20,21]. Trade-network studies consequently distinguish import volume from concentration and competition [18,19]. Ownership and contractual destination matter as well: a domestic stage whose output is committed to a single foreign buyer adds extraction capacity to another country’s chain rather than processing options to the domestic one. The analysis therefore records ownership, financing and product destination alongside stage capability, and it measures supplier concentration at the level of individual product codes.
2.4. Downstreaming, Environmental Burden and Circularity
Downstreaming can capture value and knowledge, but processing also relocates burdens. Cracking and separation may require acids, alkalis, solvents, energy, water, tailings control and management of radioactive co-products, while magnet production adds metallurgical and quality-control requirements [2,3,4]. The environmental profile also depends on the route: monazite carries thorium and uranium, whereas ionic clays have low in-situ radioactivity but raise concerns about leaching reagents and groundwater [29,30]. Recycling requires collection, disassembly, pre-processing and a route back into separation or alloy production [32,33], and secondary-resource potential becomes meaningful only when technical recovery, material volumes, environmental conditions and economic viability are considered together [23]. More domestic processing is therefore not automatically more sustainable.
Selective downstreaming follows from this trade-off. A resource-rich country should prioritise the stages that offer substantial gains in resilience and industrial learning relative to their economic and environmental costs. Expansion of processing capacity can itself generate structural pressures when reserves, downstream absorption and industrial capacity are poorly aligned [15,17]. Where domestic production is not efficient or sufficiently redundant, qualified external routes can complement domestic capability [22,24].
2.5. Analytical Propositions
The framework leads to four expectations that guide the empirical analysis rather than statistical hypotheses. First, if resilience depends on continuity across conversion stages, geological endowment should not by itself translate into access to processed materials; we refer to this as proposition P1, resource-system continuity. Second, because pilots and demonstrations can be financed and operated without customers, technological capability may advance faster than commercially dependable capability and may appear at stages that are not connected to domestic feed; this is P2, technology-to-scale divergence. Third, if downstream stages remain incomplete, upstream expansion should not reduce external dependence for transformed products and may instead increase the export of intermediates; this is P3, downstream exposure. Fourth, resilience gains from new domestic stages should depend on redundancy, environmental performance and the availability of diversified external or circular routes; this is P4, conditional downstreaming.
3. Materials and Methods
3.1. Research Design and System Boundary
We used a longitudinal, evidence-triangulation design. The trade and production series cover 2015 to 2024, the latest year for which complete official mineral statistics were available; facility, technology and policy evidence was collected through 23 September 2026. The system boundary begins with extraction of rare-earth-bearing material and ends with circular recovery into usable rare-earth feed. Product use is represented only where it provides evidence of downstream exposure; the study does not estimate final consumption or life-cycle impacts.
The analysis integrates four blocks: (i) reported reserves and historical beneficiated output; (ii) exports and imports of rare-earth products, supplier shares and product-level evidence on magnets; (iii) facility, project and policy evidence; and (iv) annual stage-level maturity scores and the indicators derived from them. All scoring rules were fixed before the evidence was coded. Announced capacities were not treated as operating capacities, and company targets were used only to characterise the project pipeline.
3.2. Data Sources
Table 1 summarises the sources, the period covered by each and their analytical function. The design separates official statistics from facility disclosures, policy documents and peer-reviewed literature so that reserve, trade, maturity and project-status claims do not rest on a single type of source.
Table 1.
Data sources, periods and analytical roles.
The Supplementary Materials contain the historical series, the annual maturity matrix, the evidence registry with a dated source for every stage-year, the decision rules, the NCM taxonomy, the robustness simulations and the scripts that extract the ComexStat data and reproduce the robustness analysis.
3.3. Reserve-Series Break and Production Regimes
The ANM reserve series has a definitional break. Through base year 2021, the summaries reported figures under the legacy lavráveis terminology; from base year 2022, the figure refers to proved plus probable reserves. The apparent decline from about 21 Mt in 2021 to 11.4 Mt in 2022 is therefore treated as a classification discontinuity rather than physical depletion. Original definitions are retained in the dataset, and no growth rate is calculated across the break.
Historical beneficiated output from residual monazite stocks held by Indústrias Nucleares do Brasil (INB) is coded as legacy stock processing, not as contemporary mine production. Monazite is a nuclear mineral under Brazilian law because of its thorium and uranium content, and its mining and processing fall under the constitutional regime for nuclear minerals [34]. The modern commercial upstream regime begins with the commissioning and commercial operation of Serra Verde’s ionic-clay operation [9,35].
3.4. Value-Chain Taxonomy
The value chain was operationalised into seven stages defined by the material form each stage produces (Table 2). The definitions are route-neutral: for each stage, Table 2 describes the corresponding operations in the hard-rock or monazite route and in the ionic-clay route, and specifies the minimum evidence required for classification. This design prevents two errors. The first is treating upstream activity as evidence of downstream capability. The second is treating an ionic-clay operation as a mine with physical beneficiation only, when its product is already a chemical intermediate.
Table 2.
Route-neutral stage taxonomy and evidence required for maturity classification.
Two classification decisions follow from the taxonomy. First, the Pela Ema operation is assessed across three stages: extraction (S1), screening and rejection of oversize (S2), and desorption by ion exchange, filtration and precipitation of a mixed rare-earth concentrate (S3) [9,30]. Second, S5 is restricted to metallisation, that is, the reduction of oxides to metals and the production of master alloys. Casting of magnet alloy strip, hydrogen decrepitation and milling are assigned to S6, because they are integrated into magnet manufacture and can be performed on imported metal. The distinction matters in the Brazilian case, where pilot magnet production relies on imported neodymium metal [36]. The manuscript documents that these three stages are present in Brazil; it does not verify a material flow between Pela Ema’s concentrate and a specific downstream processor at the required feed specification and scale. This distinction is carried through Section 3.5 and Section 4.3, where the separation evidence that extends technological coverage in 2026 is shown to involve a different operator and route than Pela Ema’s ionic-clay output.
Ownership, financing and product destination are not stage attributes. They are recorded separately as governance attributes (rule R7 in Table 3). The scores therefore measure capability located in Brazil, while the analysis can still show whether that capability is integrated into domestic or foreign downstream chains.
Table 3.
Decision rules applied in maturity scoring.
3.5. Maturity Scoring, Chain Completeness and Contiguity
Each stage was scored annually from 2015 to 2026, giving 84 stage-years (i.e., 7 stages × 12 years). Scores refer to the status at 31 December of each year; the 2026 score refers to the status on 23 September 2026. Annual scoring makes discontinuities visible, including capabilities that appeared and were not sustained. Each stage-year is linked to at least one dated source in the evidence registry.
The scale has six ordinal levels: 0 = no verified domestic capability; 1 = research, laboratory or funded technology development; 2 = pilot; 3 = demonstration, semi-industrial or pre-commercial operation; 4 = initial commercial production; and 5 = mature commercial capability. A score of 4 requires verified commercial production. Seven decision rules, fixed before scoring, govern borderline cases (Table 3). A score of 4 records that commercial production has started from continuing feed; it does not establish that supply is dependable at the scale, specification and continuity that industrial users require, which the scale reserves for a score of 5. The terms pilot, demonstration, commercial and documented capability are used only in the sense defined by this scale throughout the manuscript.
For J stages and maturity score Mjt at time t, chain completeness at threshold τ is:
with τ = 2 for technological capability, τ = 3 for demonstration or higher and τ = 4 for commercial capability. The technology-to-scale gap is TSGt = CCI2t − CCI4t. Contiguous extension is the number of consecutive stages, counted from S1, that meet the threshold:
so that K = 0 whenever S1 is below the threshold. K4t measures how far domestic material can move through commercially operating stages, and K2t measures the same for pilot or higher capability. When CCIτt exceeds Kτt/J, some capable stages are disconnected from the domestic resource and depend on imported inputs. Because the scale is ordinal, the median score is reported as the measure of central tendency.
CCIτt = (1/J) Σj I(Mjt ≥ τ)
Kτt = max{ k ∈ {0, …, J} : Mjt ≥ τ for all j ≤ k }
The seven stages are equally weighted in the main results because no Brazilian data on stage throughput, capacity or value added exist for most of the chain, and because equal weights keep the index transparent. Equal weighting does not imply that stages have equal economic, environmental or strategic importance. Three weighting scenarios were therefore specified together with the scoring rules and before the indicators were computed: (i) equal weights; (ii) criticality weights, which give more weight to the conversion stages where global supply is concentrated (S1 and S2: 0.10 each; S3 and S5: 0.15 each; S4 and S6: 0.20 each; S7: 0.10); and (iii) concentration weights proportional to China’s share of global capacity at each stage in 2024, taken from the IEA (mining 60% for S1 and S2; refining 91% for S3 to S5; magnets 94% for S6), with S7 assigned the mean of the other stages [1]. The concentration weights are a proxy for external concentration used only as a sensitivity scenario; global concentration is not equivalent to criticality, risk or importance for Brazil, and these weights do not represent a normative valuation of Brazilian stages. Weights based on capacity or volume could not be constructed, because physical throughput is not reported for most stages; for this reason, and whatever the weighting, the CCI is interpreted only as an index of structural coverage. A further check excludes circular recovery from the system boundary. A fourth check tests an alternative taxonomy that merges mining and physical beneficiation into a single macro-stage, scored as the bottleneck of the two, to assess whether the headline percentages depend on the particular subdivision of upstream activities (Section 4.3).
Scoring was therefore performed by a single coder, and inter-coder reliability was not measured. Two features limit the dependence of the results on individual judgement. First, the scoring is fully traceable: every stage-year is linked to a dated source, and the decision rules were fixed before scoring, so that any reader can re-score the matrix. Second, the robustness analysis described in Section 3.6 tests whether the main conclusions survive plausible changes in the scores that require judgement. Where later documentation of a stage is absent, the evidence registry distinguishes four status categories rather than treating absence uniformly: confirmed closure or divestment, announced suspension, reduced but continuing activity, and undocumented status in the sources reviewed. Only the first two are read as evidence that activity ceased; undocumented status is reported as such, not inferred as closure (rule R4, Table 3).
3.6. Robustness to Scoring Judgements
The analysis distinguishes anchored cells from judgement cells. Scores of 0 (no documented activity) and 4 (declared commercial production) rest on verifiable facts and are held fixed. Scores of 1 to 3 require interpretation of the boundary between research, pilot and demonstration activity and are treated as judgement cells; 50 of the 84 stage-years fall into this category. Two procedures were applied. In targeted scenarios, nine plausible alternative readings of the evidence were tested, such as counting synthetic-feed separation pilots as pilot capability, rejecting the 2026 real-feed separation tests, or assuming that the CBMM units continued at pilot level after 2016. In a Monte Carlo analysis, each judgement cell was moved one level up or down with probability p, bounded between 0 and 3, in 10,000 draws, with p = 0.25 as a moderate scenario and p = 0.50 as a stress scenario. Five conclusions were tracked: (C1) separation is the first missing stage of the contiguous commercial chain in 2026; (C2) the technology-to-scale gap in 2026 is positive; (C3) the contiguous technological chain in 2026 breaks at or before metallisation; (C4) technological coverage in 2015 and 2016 exceeds that of 2017 to 2022; and (C5) technological coverage in 2026 exceeds that of 2024. Because judgement cells for a given stage are often uncertain for the same underlying reason across consecutive years, for example one disputed facility, a block variant of the Monte Carlo analysis was added: it perturbs all judgement-cell years of a stage together, in one direction, with the same probability p, rather than perturbing each stage-year independently. Results of both variants are reported in Section 4.4 and Supplementary Table S6.
3.7. Trade Indicators
Aggregate values reported by ANM are expressed in current USD million on an FOB basis; the 2017 aggregates are bridge estimates reconstructed from official year-on-year changes, and all conclusions were checked with 2017 excluded. ANM publishes rounded balances, which differ from exports minus imports by USD 0.1 million in 2019 to 2021; cumulative figures are reported from the components, with the ANM-based total noted for comparison.
Each eight-digit NCM code in the rare-earth product scope was assigned to a stage (Supplementary Table S5) [37]. Two codes require separate treatment. Catalytic preparations containing rare-earth oxides (NCM 3815.90.93), used mainly in petroleum refining, are reported separately because they do not belong to the magnet chain. Permanent magnets of metal (NCM 8505.11.00) lie outside the mineral statistics and also cover non-rare-earth metal magnets; magnet exposure is therefore documented with the import tonnage and supplier shares computed from customs records, rather than inferred from the aggregate series. Supplier exposure is measured by the leading-supplier share reported by ANM and, for the product groups reported in Section 4.2, by the Herfindahl–Hirschman index (HHI) and CR1 computed from the ComexStat panel. The Supplementary Materials include the scripts that extract the ComexStat data by NCM code, partner country and year (Scripts S1 and S1b) and the resulting panel (Table S9), which reports unit values, HHI, CR1, CR3 and the effective number of suppliers, so that the concentration analysis can be reproduced and extended.
3.8. Identification of Chain Interruptions
To answer RQ3, the first stage beyond the contiguous commercial extension (stage K4 + 1) is identified as the first missing stage in the contiguous commercial chain, and the first stage beyond the contiguous technological extension (stage K2 + 1) as the first missing stage in the contiguous technological chain. This is a diagnostic classification derived from the stage sequence, not a causal identification: it shows where domestic material stops moving through the chain, but it does not establish that this stage is the largest economic or physical bottleneck, which would require data on costs, capacities and substitution. The classification is then compared with product-level import evidence to judge whether the interruption coincides with material external exposure. This classification does not by itself identify the economic mechanisms that keep a stage from reaching commercial scale; Section 5.2 discusses financing, scale and qualification factors that a cost-and-capacity study would need to quantify before a bottleneck claim could be made causal.
3.9. Illustrative International Benchmark
To illustrate whether the Brazilian configuration is distinctive, the contiguous commercial extension was assessed for Australia and the United States in 2025 and 2026, using the same rules and company disclosures. Only commercial capability located in each country was counted; separation performed abroad by a domestic firm was recorded as the destination of the next conversion rather than as domestic capability. The benchmark is illustrative and is not a full test of international supply resilience.
3.10. Validation
After the scores were fixed, the interpretation was compared with an independent assessment of Brazilian capabilities through 2025 [38] and with the 2026 CGEE assessment [12]. Fixing the scores before that comparison reduces the risk of adjusting the evidence to fit an external narrative.
4. Results
4.1. Resource Endowment and the Historical Production Regime
Brazil consistently reported a large rare-earth reserve figure, but its meaning changed during the observation window. Legacy figures were near 21 to 22 Mt through 2021; proved plus probable reserves were 11.4 Mt from 2022 through 2024. Because the series break is definitional, the data do not support a claim that almost half of the physical reserve was depleted in one year. Brazil remained strongly endowed under both reporting regimes [7,8].
Output history does not show a parallel modern industrial trajectory. Reported beneficiated material in 2015, 2016 and 2018 to 2023 largely reflected processing of residual monazite stocks, with values between 600 t (2019) and 4525 t (2016) among years with data. Serra Verde began commissioning in June 2023 and declared commercial production in January 2024 [9,35], a structural break from stock processing to a contemporary operating upstream. Table 4 consolidates the historical evidence.
Table 4.
Historical resource, production and aggregate trade indicators, 2015–2024.
4.2. External Trade and Supplier Exposure
Imports exceeded exports in every year. Over 2015 to 2024, rare-earth-related imports reported by ANM totalled USD 81.34 million and exports USD 21.34 million, a cumulative deficit of USD 60.00 million from the components (USD 59.70 million from the rounded ANM balances). Exports covered 26.2% of imports. Excluding the reconstructed 2017 observation leaves every remaining year negative and a cumulative deficit of USD 57.67 million. The 2024 upstream transition narrowed but did not close the gap: exports rose from USD 1.4 million in 2023 to USD 3.6 million in 2024, while imports declined from USD 11.5 million to USD 10.0 million (Figure 2).
Figure 2.
Aggregate rare-earth-related imports, exports and trade balance, 2015–2024. Source: authors’ calculations from ANM and MDIC data.
The composition of these aggregates matters for interpretation. Catalytic preparations containing rare-earth oxides (NCM 3815.90.93) were the leading import item in both 2023 and 2024, at about USD 5.59 million and USD 5.55 million [8], more than half of the 2024 total. These products serve petroleum refining rather than the magnet chain, so the aggregate deficit understates dependence on magnet materials and overstates dependence at intermediate stages. China was the leading supplier in every year for which a share was reported, averaging 51.2% across 2018 to 2024; its share fell to 37.0% in 2024, when France and the United States accounted for 22.4% and 14.9% [8]. A product-level reconstruction from the ComexStat API, by eight-digit NCM code and partner country, reproduces this aggregate within rounding error in every year from 2015 to 2024 (maximum difference USD 0.15 million), which validates the product scope defined in Section 3.7, and extends it to 2025, a year not yet covered by ANM’s published mineral summaries.
Magnet trade shows that the aggregate series captures only part of the exposure. Customs records show that imports of metal permanent magnets (NCM 8505.11.00) rose from about 410 t in 2016 to between 1010 t and 1110 t a year from 2021 to 2025 (Supplementary Table S9), of the same order as the roughly 1200 t of rare-earth magnets a year that the president of Codemge, the Minas Gerais state development company, described as imported for domestic consumption [39]. Imports of permanent magnets (NCM 8505.11.00) from China alone fell 45% year-on-year to USD 3.3 million in the first quarter of 2025 [40]. China’s dual-use licensing regime for rare-earth magnets was introduced in April 2025, after this quarter ended, so the first-quarter decline cannot be attributed to that measure and more plausibly reflects broader trade tensions or buyer behaviour ahead of the announced controls; data for the quarters following the licensing measure were not available for this revision. The first-quarter figure nonetheless corresponds to about one third of the annual rare-earth-related imports reported by ANM for 2024, which illustrates how much of Brazil’s exposure the aggregate series omits. A 2026 sector assessment estimates that Brazil imports more than 85% of the magnets it consumes [10]. The full annual series confirms that this is not specific to the first quarter of 2025: metal permanent-magnet imports (NCM 8505.11.00) ranged from USD 12.4 million to USD 35.0 million a year between 2015 and 2025, consistently two to three times the entire ANM-tracked rare-earth aggregate; in 2024, magnet imports alone (USD 20.1 million) were twice the full mineral aggregate (USD 10.0 million). Supplier concentration is higher for magnets than for any other product group: China’s leading-supplier share ranged from 61% to 90% across the eleven years, with a Herfindahl-Hirschman index between 0.59 and 0.81, peaking in 2022 (HHI 0.81, China 89.9%). Dependence is therefore concentrated in products that mineral statistics do not classify as rare-earth trade, at the single stage, magnet manufacture, where domestic capability is weakest.
Table 5 separates the evidence by product group and reports supplier concentration computed from the full NCM-partner-year panel (Supplementary Table S9), rather than from the aggregate alone. Mineral, intermediate, separated and metallic rare-earth products, catalytic preparations and permanent magnets have different end uses and should not be combined in a single measure of dependence. Catalysts are the least concentrated of the three groups (Herfindahl-Hirschman index 0.19 to 0.31, four to five effective suppliers), consistent with their non-magnet use. Imports of chemical-intermediate and separated products (S3 and S4) show the diversification already noted in Section 4.2: China’s leading-supplier share fell from 63 to 89% in 2015 to 2023 to 52% in 2024 and 44% in 2025, with France becoming the leading supplier in both years. Exports in this same product group show the opposite pattern on the upstream side: after years of negligible or no recorded exports (USD 5700 in 2023), exports of the mixed rare-earth compound code (NCM 2846.90.90) rose to USD 2.17 million in 2024 and USD 11.98 million in 2025, more than 99.8% of it to China in both years. Because Serra Verde was, on the evidence in Section 4.3, the only domestic producer of a mixed rare-earth intermediate at commercial scale in this period, this points to a material share of Brazil’s new commercial upstream output having been exported to China before the September 2026 offtake agreement with USA Rare Earth took effect (Section 4.5); this is a trade-data observation, not a confirmed shipment record, because customs data do not identify the exporting firm. Permanent magnets are not part of the ANM aggregate at all. The NCM code for metal permanent magnets also covers non-rare-earth magnets such as aluminium-nickel-cobalt alloys, so the magnet values are an upper-bound indicator of rare-earth magnet trade and are interpreted together with the import tonnage reported in customs records (Supplementary Table S9).
Table 5.
Rare-earth-related trade evidence by product group.
4.3. Industrial Maturity, Contiguity and the Technology-to-Scale Gap
Figure 3 and Table 6 summarise the annual maturity assessment. Three phases are visible. In 2015 and 2016, beneficiation of legacy monazite stocks (score 3, capped by R2) coexisted with a semi-industrial double-sulphate unit and a pilot solvent-extraction unit operated by CBMM at Araxá, which produced cerium, lanthanum and didymium oxides from domestic feed [11], and with laboratory reduction of didymium oxide to metal [41,42]. Technological completeness was 42.9%, but no stage was commercial and, with no primary mine in operation, the contiguous extension was zero.
Figure 3.
(a) Annual maturity score by stage, 2015–2026; (b) technology and commercial chain completeness and contiguous commercial extension. Source: authors’ calculations from the evidence registry.
Table 6.
Chain completeness, contiguity and robustness, selected years.
From 2017 to 2022, no continued operation of the CBMM units was documented; specialists of the mining agency later described the solvent-extraction pilot as suspended, and the company stated in 2026 that industrial-scale recovery at Araxá had not proved economically viable [43,44]. The chemical-intermediate and separation stages therefore revert to research level under R4. Separation research continued at CETEM, including continuous counter-current pilot runs, but on synthetic solutions prepared from purchased reagents [36,45,46], which R3 scores at 1. Technological completeness fell to 14.3%. The pattern is one of discontinuity in documented capability rather than steady accumulation: for S3 and S4 in this period, the registry records an absence of later confirmation, and for the CBMM units specifically, later sources describe the pilot as suspended and industrial-scale recovery as not proven economically viable, which is closer to confirmed suspension than to a simple gap in reporting (R4, Table 3).
From 2023, Serra Verde’s commissioning and commercial start moved mining, beneficiation and the chemical intermediate to scores of 3 and then 4 [9,30,35]. Pilot and demonstration production of mixed carbonate by other ionic-clay developers in Minas Gerais adds technical redundancy at S3 but not commercial capacity [47,48]. Commercial completeness reached 42.9% in 2024 and remained there through 2026, with a contiguous commercial extension of three stages. Downstream, the CIT SENAI ITR laboratory-factory in Lagoa Santa began pilot production of NdFeB magnets in 2025 within the MagBras programme [36,49,50,51], after a decade of development in which commissioning, planned for 2022, was delayed and the plant changed owner [52,53,54,55], and in 2026 CETEM reported continuous solvent-extraction tests with D2EHPA and P-507 on a light-REE hydroxide concentrate supplied by CBMM, that is, on real domestic feed [10,38]. Technological completeness therefore rose to 57.1% in 2025 and 71.4% in 2026, and the technology-to-scale gap widened to 28.6 percentage points. This test used a concentrate from CBMM’s hard-rock operation at Araxá, a different operator and route from Serra Verde’s ionic-clay concentrate at Pela Ema; the 2026 technological chain therefore combines evidence from two facilities, and no source available to this study verifies a material flow between them.
Contiguity adds information that coverage does not. In 2026 the technological chain is continuous from mining to separation (K2 = 4) and breaks at metallisation, which has remained at laboratory level throughout the period [41,56]. The magnet pilot therefore operates on imported neodymium metal [36]: it adds to technological coverage but is disconnected from domestic feed. Table 7 shows that the qualitative result does not depend on the weighting. In 2026 the technology index exceeds the commercial index under all three weighting scenarios, with gaps between 28.6 and 40.0 percentage points, and excluding circular recovery widens the gap to 33.3 points. These values describe structural coverage and should not be read as shares of resilience or capacity. A taxonomy check that merges mining and physical beneficiation into one macro-stage, scored as their bottleneck (Section 3.5), gives a six-stage structure in which 2026 technology coverage is 66.7%, commercial coverage is 33.3% and the gap is 33.3 percentage points; the qualitative diagnosis, a positive gap concentrated from separation onward, is unchanged.
Table 7.
Sensitivity of 2026 indicators to stage weights and system boundary.
The weighting results reinforce the reading of Table 6 rather than change it.
4.4. Robustness of the Scores
Figure 4 reports how often each conclusion holds under perturbation of the judgement cells. The interruption of the contiguous commercial chain at separation (C1) holds in every targeted scenario and every simulation; because C1 depends only on the anchored cells (scores of 0 and 4, which rest on documented facts rather than interpretation; Section 3.6), this persistence is a property of the design rather than independent empirical confirmation. It shows that C1 is not an artefact of judgement-cell scoring, not that it has been separately tested. The positive technology-to-scale gap in 2026 (C2) and the capability discontinuity after 2016 (C4) hold in all nine targeted scenarios and in at least 95% of draws even under the stress scenario; the 2026 gap ranges from 14.3 to 42.9 percentage points in the targeted scenarios, with a simulated mean of 28.4 points. Two findings are more sensitive and are stated with that qualification. The location of the technological break at metallisation (C3) holds in 89% of moderate and 82% of stress draws, and fails if metallisation is scored at pilot level, which the evidence of imported neodymium metal does not support [36]. The increase in technological coverage between 2024 and 2026 (C5) holds in 86% and 66% of draws, respectively, and is therefore interpreted as a tendency rather than as an established result. A block variant of the simulation, which perturbs all judgement-cell years of a stage together rather than independently (Section 3.6), gives materially the same results (Figure 4a,c): C2 holds in 96 to 99% of draws, C4 in 94 to 98%, and the 2026 technology-to-scale gap keeps a mean of about 28.5 percentage points, which indicates that the independence assumption in the main simulation does not drive the findings. Full results for both variants are reported in Supplementary Table S6.
Figure 4.
Robustness of the main conclusions to scoring judgements, under two perturbation designs: (a) share of draws in which each conclusion holds, independent-cell versus block (facility-level) Monte Carlo, moderate (p = 0.25) and stress (p = 0.50) scenarios; (b) distribution of the 2026 technology-to-scale gap across independent-cell draws (moderate scenario); (c) summary statistics of the 2026 technology-to-scale gap under the block design. Source: authors’ calculations (Script S2).
4.5. Governance of the Commercial Upstream
The single commercial operation shapes where Brazilian material goes next. Serra Verde entered commercial production with offtakes already in place for a large share of output with established processors [9]. In 2026 it obtained a USD 565 million financing arrangement from the U.S. International Development Finance Corporation and a 15-year offtake with price floors for neodymium, praseodymium, dysprosium and terbium [57]; the offtake vehicle, capitalised by U.S. government agencies and private sources, will purchase all Phase I production [14]. The combination with USA Rare Earth, which owns metal-making and magnet assets in the United Kingdom and the United States, was completed on 3 September 2026 [13]. The next conversions of Brazil’s commercial output are therefore contracted abroad. Table 8 separates the governance dimensions that these facts combine. Corporate ownership, the physical location of capacity, the contractual destination of output, the location of the next processing step and control over the chain are distinct attributes, and none of them is equivalent to supply resilience. A long-term foreign offtake with price floors reduces market and financing risk for the project. Table 8 reports the contractual commitments documented in company disclosures; it does not evaluate undocumented or indirect channels, such as technology transfer, local supplier development or future renegotiation, through which foreign ownership could still affect domestic access, nor does it imply that domestic ownership would guarantee domestic availability of output. On the evidence available, the separated oxides, metals and magnets derived from the ore are contracted for production and sale elsewhere, which is the documented position as of September 2026. The project pipeline shows the same pattern: one developer plans to separate carbonate from Goiás in the United States and opened a pilot separation plant there in 2026 [58], while only a minority of projects plan domestic separation [59,60,61].
Table 8.
Governance attributes of the Pela Ema operation and their implications, September 2026.
4.6. Illustrative International Benchmark
Table 9 places the Brazilian configuration in comparative perspective. Australia also stops at the chemical intermediate within its territory: Lynas produces mixed rare-earth carbonate at Kalgoorlie and ships it to its Malaysian plant for separation [62,63]. The United States has commercial capability from mining through metallisation, with magnet manufacturing in qualification: magnets were delivered to an automaker for in-vehicle testing in 2026, and commercial shipments are expected in the fourth quarter of that year [64,65]. Brazil’s contiguous extension equals Australia’s, but the next conversion is controlled by a foreign group and contracted to a foreign government-backed buyer, whereas in Australia it remains within a domestic firm operating abroad.
Table 9.
Illustrative benchmark of contiguous commercial capability and next-stage location, 2025–2026.
4.7. The Downstreaming Paradox
Brazil’s position can be understood as an uneven and discontinuous transition. The country has a large reported reserve base and, since 2024, a commercial upstream that already produces a chemical intermediate [8,9,30]. It has credible pilots beyond that point [38,49], and it had pilot separation from domestic feed a decade earlier [11]. What it does not have is a commercially connected chain capable of supplying separated oxides, metals, alloys, magnets or recovered feed at dependable scale, and the commercial upstream that does exist is integrated into a foreign chain. The downstreaming paradox lies in that coexistence: geological strength and technological movement are real, but neither has produced industrial continuity.
5. Discussion
5.1. Resource Abundance Is Not Resource-System Resilience
The Brazilian case is consistent with P1: reserve rankings appear to be weak proxies for supply security. Reserves describe economically relevant geological inventory under a reporting framework; they do not measure whether material can be processed into the form required by domestic users. The result accords with the global asymmetry documented by the IEA and trade-network studies, in which processing and magnet manufacture are more concentrated than mining and dependence varies by stage [1,18,19], and with evidence that reserve resilience, material-flow resilience and downstream capability are distinct dimensions [15,22,24]. A strategy that measures success through mine capacity alone can increase exports of intermediates while leaving users dependent on external oxides, metals and magnets.
Figure 5 places the Brazilian scores against the concentration of global supply. Brazilian commercial capability extends from mining into the first step of the refining segment, the chemical intermediate, and stops at separation. All stages without domestic commercial capability belong to segments in which China’s share of global capacity exceeds 90% [1]. The domestic interruption therefore coincides with high external concentration, which is where the absence of domestic capability weighs on exposure.
Figure 5.
China’s share of global capacity by segment in 2024 and Brazilian maturity scores by stage in 2026. The IEA refining share is applied to S3 to S5 and the mining share to S1 and S2. Sources: [1] for global shares; authors’ evidence registry for Brazilian scores.
The benchmark qualifies this conclusion. A contiguous extension of three stages is not unusual among resource-rich exporters, as the Australian case shows. What distinguishes Brazil is the governance of the next conversion. When the first missing stage is operated abroad by a domestic firm, the country retains some control over the route; when it is operated abroad under foreign ownership and a long-term foreign offtake, the upstream becomes a feed source for another country’s resilience strategy. This is consistent with P3 and extends the downstreaming literature, which has focused on export bans and domestic smelting [15,17], to cases where the constraint is contractual rather than physical.
5.2. Discontinuity and the Technology-to-Scale Gap
The annual scores change the diagnosis in two ways. First, the gap is not only a lag between experimentation and scale. Separation from domestic feed was scored at pilot level in 2015 and 2016 and was not confirmed afterwards, while magnet capability took about a decade from project studies to pilot output [11,49,52]. The registry records this as a discontinuity in documented capability rather than a uniformly confirmed closure (R4, Table 3): for the CBMM units specifically, later sources describe the separation pilot as suspended and industrial-scale recovery as not proven economically viable [43,44], which is closer to confirmed suspension than to a simple gap in reporting, though the same certainty is not available for every stage-year in this period. Whichever reading applies, capabilities that are not connected to continuing feed, customers and finance appear less likely to persist, which is consistent with P2 and suggests that the relevant policy variable is continuity of operation rather than the number of projects launched. Second, contiguity shows that part of the technological progress is disconnected: magnet pilots on imported metal, and separation research that, in 2026, drew for the first time on a real domestic concentrate from a different operator than the commercial mine, add coverage without yet extending a single connected domestic chain [36]. The TSG and the contiguous extension should therefore be read together; a rising technology index with an unchanged contiguous extension signals implementation bottlenecks at specific interfaces, not necessarily their cause.
These interfaces have an economic as well as a technical dimension that the maturity scores do not quantify. Vespignani and Smyth [66] model a back-ended risk premium that rises with unresolved technical and non-technical risk and show that it can be large enough to keep an otherwise viable project below the threshold required to attract investment; applied to this case, the premium would plausibly be higher for separation and metallisation, where process risk, offtake uncertainty and the absence of qualified local customers compound, than for mining or physical beneficiation, where the product specification is simpler and buyers already exist. Financing cost, minimum efficient scale, qualification by magnet makers and the reliability of offtake therefore plausibly help separate a successful pilot from a commercial plant, but this study did not collect the facility-level cost, scale and contract data that would be needed to attribute the gap to one factor rather than another, and the claim is offered as an interpretation of the pattern rather than as a tested mechanism. The gap is also not uniform across rare-earth applications. Binnemans et al. [67] describe a balance problem in which the elements recovered from an ore body do not match the elements the market demands, so that aggregate rare-earth output can expand while the magnet-relevant elements, neodymium, praseodymium, dysprosium and terbium, remain scarce relative to the lanthanum- and cerium-rich bulk of the ore; a catalyst user, a magnet maker and a producer of mixed compounds therefore face different degrees of exposure even when they draw on the same Brazilian deposit, consistent with the product-level differences already reported in Table 5 and Section 4.2.
These findings respond to known limitations of readiness scales, which tend to assess technologies in isolation and to neglect integration [27]. Scoring stages of a material chain, requiring representative feed and prohibiting automatic carry-forward make the measure sensitive to integration and to decay. For cross-country use, thresholds should remain explicit, the ordinal logic should be preserved and the evidence registry should be audited periodically.
Table 10 summarises how each proposition was assessed. Because the evidence is descriptive and the case is single, the propositions are evaluated for consistency with observable indicators, not tested as causal hypotheses.
Table 10.
Assessment of the analytical propositions.
5.3. Selective Downstreaming Is More Defensible than Full Localisation
The findings do not support replicating every stage domestically, consistent with P4. Full localisation can replace external dependence with single-facility dependence and impose chemical, energy, water and waste burdens [2,3,23]. Selective downstreaming asks which stages offer more resilience and learning per unit of economic and environmental cost. The chain interruptions identified with the rule in Section 3.8 point to two interfaces; the identification is diagnostic and does not by itself show that these stages are the largest economic bottlenecks. Separation (S4) is the first missing stage in the contiguous commercial chain: without qualified separated oxides, the commercial intermediate cannot connect to domestic metallisation or magnets. Metallisation (S5) is the first missing stage in the contiguous technological chain: without it, domestic magnet capability remains tied to imported metal, which has been subject to export licensing since 2025 for several heavy rare earths [6]. Import evidence points in the same direction: magnets, the product that depends on both interfaces, are largely imported, and a single quarter of magnet imports from China is equivalent to about one third of the annual rare-earth-related imports recorded in mineral statistics [10,40].
International partnerships remain part of this strategy. Long-term offtake, joint ventures, toll processing, reciprocal stockpiles and diversified qualification can provide redundancy while domestic capacity develops [24,25]. The Brazilian case shows, however, that offtake arrangements can also lock output into a single foreign route. Contract terms that reserve part of production for domestic separation, or that link offtake to local processing milestones, are one way to reconcile external finance with domestic continuity. The appropriate mix differs by element and product: neodymium-praseodymium magnet materials, heavy rare earths, cerium compounds and refining catalysts should not be treated as interchangeable.
A systematic comparison of these alternatives, domestic processing, toll processing, diversified imports, strategic inventories and international partnerships, requires evidence this study does not collect: domestic demand by product and specification, processing costs and minimum efficient scale in Brazil, available infrastructure and energy, and the number and reliability of alternative suppliers. Saadaoui et al. [68] compare stockpiling and friend-shoring for countries exposed to concentrated Chinese refining and conclude that stockpiling refined materials, rather than ores, offers more protection than diversifying the location of raw-material supply alone; because Brazil is a resource holder rather than a refining-dependent importer, the same logic suggests that the country’s leverage lies in where its intermediate is refined and under what contractual terms, rather than in stockpiling. Assessing that choice for Brazil specifically would require the country-level evidence listed above, which this study does not have.
5.4. Environmental Safeguards for Scale-Up
Domestic value capture is not equivalent to sustainability. Separation can transfer chemical and radioactive-residue burdens to producing regions, and recovery from secondary resources requires evidence that recoverable material can be processed at meaningful scale [2,23]. The two Brazilian routes illustrate the contrast. Monazite processing involves thorium and uranium and falls under the constitutional regime for nuclear minerals [34]. The ionic-clay operator reports low in-situ radioactivity, desorption with sodium chloride or ammonium sulphate, recirculation of about 90% of process water and dry-stack tailings [30]. These are company disclosures, not an independent environmental assessment, and this study does not measure water use, energy, reagents, residues, radioactivity or closure performance. The environmental discussion is therefore limited to the safeguards that should be evaluated before new stages are scaled up: water balance, reagent intensity, energy source, residue chemistry, tailings stability, occupational and radiological exposure, cumulative impacts where several projects share a district, and closure arrangements, each verified independently rather than self-reported.
Circular recovery is attractive because it can add feedstock diversity and reduce pressure on primary extraction. Yet collection without separation, alloy or magnet routes does not create usable supply [32,33]. Brazil’s circular score of 1 recognises research activity documented since at least 2014 [69,70] while avoiding an assumption of operating secondary supply. Planned recovery from phosphogypsum [71] would be scored only once physical output is verified.
5.5. Interpreting Trade Evidence
A persistent deficit supports external exposure but is not, by itself, proof of industrial weakness. Trade balance can reflect demand growth, relative prices, intra-firm trade and efficient specialisation, and the falling Chinese share in 2024 may indicate diversification, product-mix change or both. The stronger conclusion comes from triangulation between stage scores, contiguity and product-level trade, along the lines that Sprecher et al. [31] and Saadaoui et al. [72] use to separate price- or volume-based measures of exposure from a system’s demonstrated capacity to respond to a shock. The magnet evidence shows that dependence is greater precisely at the stage where domestic capability is weakest, and that most of it is recorded under manufactured-product codes rather than under rare-earth codes [39,40]. The full partner-by-NCM panel specified in Section 3.7 (Supplementary Table S9) confirms this at the product level: concentration is highest exactly where domestic capability is weakest. Magnets, the product tied to the missing metallisation and magnet-manufacturing stages, show the highest supplier concentration of the three groups (HHI up to 0.81) and are imported in volumes two to three times the entire mineral aggregate; catalysts, which are outside the magnet chain, are the least concentrated (HHI 0.19 to 0.31). The panel also shows that Brazil’s new intermediate output was exported overwhelmingly to China in 2024 and 2025, before the Serra Verde offtake agreement with a foreign buyer took effect in September 2026 (Section 4.5), which extends P3 beyond the governance evidence already discussed to an independent trade-data observation. Taken together, the findings are consistent with P1 through P3; P4 is better described as plausible than as tested, because the evidence on redundancy, environmental performance and external routes is illustrative rather than systematic (Table 10), and the four propositions operate as an integrated diagnostic logic rather than as independently tested causal hypotheses.
6. Implications for Resource Governance and Operations
6.1. A Stage-Gated Policy Sequence
Policy support should follow the evidence available at each stage. Early support can fund characterisation, pilot validation on representative feed and environmental baselines; scale-up finance should follow only after technical and commercial milestones have been demonstrated. Recent instruments move in this direction but remain focused on the cost of capital: a public call by BNDES and Finep for the transformation of strategic minerals selected 56 investment plans, ten of them in rare earths, and a bill establishing a national policy for critical and strategic minerals passed the Chamber of Deputies in May 2026 [10]. The CGEE roadmap proposes a first industrial separation plant between 2026 and 2030 [12]. Official statistics should distinguish mine output, physically upgraded concentrate, mixed chemical intermediates, separated oxides, metals and finished products, and should record the destination of intermediate exports. Table 11 converts the diagnosis into stage-gated action areas.
Table 11.
Selective-downstreaming action areas for a resilient rare-earth resource system.
6.2. Implications for Firms
Manufacturers and procurement teams should map rare-earth exposure beyond the country of mine origin, because dependency and concentration vary across processing and trade-network stages [1,18,19]. The relevant vulnerability may occur at separation, metallisation, alloy preparation or magnet qualification, and export licensing can affect alloys and magnets as well as oxides [6]. Contracts should identify material form, processing origin, alternative specifications, inventory cover and recovery options. Pilot projects should be evaluated against a scale-up dossier that includes throughput, yield variance, impurity control, customer validation, operating cost and environmental performance.
6.3. A Transferable Diagnostic for Resource-Rich Economies
The framework can be applied to lithium, graphite, nickel, cobalt, phosphate and other critical raw materials, whether chemical elements, industrial minerals or mineral-derived compounds. The stage taxonomy will change, but the diagnostic questions remain: Is the reserve series comparable? Is reported production primary, secondary or stock-derived? Which stages have physical output from representative feed? Which have commercial customers? How far does the contiguous chain extend, and who controls the next conversion? Where are external routes concentrated? Which environmental burdens move with downstreaming? Separating these questions yields more generalisable insight than a single localisation ratio.
7. Limitations and Future Research
The analysis is constrained by the available evidence. Aggregate trade data include one reconstructed year, and NCM categories do not map perfectly to technologies; the permanent-magnet code covers non-rare-earth metal magnets and is interpreted as an upper-bound indicator. Part of the facility evidence comes from company disclosures and news reports. Conservative scoring, the representativeness and carry-forward rules, source triangulation and the robustness analysis reduce this risk but cannot remove it; in particular, an undocumented stage-year is reported as undocumented rather than inferred as closed, following the four status categories in Section 3.5; this is conservative by construction (R1) but depends on the completeness of the sources reviewed, and should be revisited if new evidence emerges, particularly for facilities such as the CBMM units whose later status is described only in secondary reporting. Supplier concentration is measured by the leading-supplier share and, from the full partner-level panel (Supplementary Table S9), by the Herfindahl-Hirschman index and CR1; the panel was extracted through the ComexStat API rather than the bulk microdata files, and its 2025 observations are preliminary, not yet covered by ANM’s own published mineral summaries, and customs data do not identify the exporting or importing firm, so the finding on intermediate exports to China (Section 4.2) is inferred from the product code and period, not from a shipment-level record. Scoring was performed by a single coder and inter-coder reliability was not measured; traceability of every score and the robustness analysis mitigate, but do not replace, independent double coding. The contiguity measure establishes documented stage presence rather than a verified material flow between specific facilities (Section 2.1 and Section 3.4), and the block Monte Carlo variant that correlates perturbations within a stage (Section 3.6) is a simplification of the many ways in which uncertainty about one facility could be correlated with uncertainty about others. Environmental performance is discussed only through safeguards and company disclosures and is not measured. Equal stage weights keep the index transparent but do not represent differences in strategic value, throughput, substitution, environmental burden or economic feasibility, and the benchmark covers only two countries.
Future research should extend the benchmark, connect mine output, intermediates, imports, use, stocks and waste through material-flow analysis, and compare domestic separation, toll processing, joint ventures and diversified imports through techno-economic and life-cycle studies. Dynamic scoring could test whether pilot-to-commercial conversion narrows import exposure after appropriate lags, and whether contractual arrangements such as long-term offtakes affect the probability that domestic downstream stages are built.
8. Conclusions
Brazil’s rare-earth system has crossed an important threshold. For most of the period analysed, reported output came from residual monazite stocks; since 2024 the country has had a commercial upstream operation that already produces a mixed chemical intermediate, together with a broader set of pilot and demonstration projects. The industrial system nevertheless remains incomplete at the stages where rare earths acquire much of their strategic value. Separation, metallisation, magnet manufacture and circular recovery have not reached dependable commercial scale, and the commercial output that exists is contracted to a foreign chain.
The study contributes a diagnostic that can be reproduced and audited. A route-neutral taxonomy accommodates both hard-rock and ionic-clay deposits, seven decision rules fixed before scoring prevent announcements and synthetic-feed pilots from being counted as capability, and annual scoring from 2015 to 2026 makes both progress and decay visible. The contiguity measure adds what coverage indicators miss: it shows how far domestic material can travel through the chain before it must leave the country or be replaced by imports. Every score is linked to a dated source, and the main conclusions hold across plausible alternative readings of the evidence.
The central finding is that the contiguous commercial chain stops at separation, and the technological chain stops at metallisation. These two interfaces, rather than mining capacity, determine whether Brazilian material can reach domestic users as oxides, metals or magnets. Pilot magnet production on imported metal and separation research on synthetic solutions add to technological coverage but not to continuity. The identification is diagnostic: it locates where the chain is interrupted, and it indicates where cost, capacity and substitution studies should concentrate before investment decisions are taken.
The Brazilian record also shows that documented technological capability does not always persist. Pilot separation from domestic feed and a semi-industrial intermediate unit existed in the mid-2010s and were not confirmed afterwards, repeating an earlier history of plants that stopped or never entered operation; for the CBMM units, later sources describe confirmed suspension rather than mere absence of reporting. The relevant policy variable is therefore continuity of operation, not the number of projects launched. Pilots connected to continuing feed, customers and finance appear more likely to reach scale; pilots that are not connected appear more exposed to discontinuation, and the resources invested in them are not recovered as industrial capability.
Governance of the commercial upstream matters as much as its physical capacity. Ownership, financing and a long-term foreign offtake have integrated Brazil’s commercial output into another country’s mine-to-magnet chain. Such arrangements reduce financial risk for the project, but they do not by themselves increase the resilience of Brazilian users. The illustrative benchmark shows that a contiguous chain ending at the chemical intermediate is not unusual among resource-rich exporters; what distinguishes Brazil is that the next conversion is controlled and contracted abroad. The downstreaming question is therefore contractual as well as physical.
These results point to a stage-gated agenda that can be implemented with existing instruments. Public finance for strategic minerals can give priority to separation capacity that uses domestic intermediate feed and is linked to identified buyers, and to metallisation pilots that supply the existing magnet pilot. Offtake and financing agreements can include clauses that reserve part of production for domestic processing or link export commitments to local processing milestones. Official statistics can report output and trade by material form and destination, so that progress is measured as continuity rather than tonnage. Environmental safeguards for new stages should be defined in advance and assessed independently rather than self-reported.
The downstreaming paradox thus describes a resource system in which geological abundance and technological activity coexist with limited industrial continuity. For Brazil, the task is to connect the interfaces that interrupt its chain, qualify alternative external routes where domestic production is not efficient and link recovery initiatives to processing pathways that return material to industry. For other resource-rich economies, the same diagnostic can be applied to lithium, graphite, nickel or phosphate, with the stage taxonomy adapted to each material. Strategic position depends less on how much can be extracted than on how reliably, responsibly and continuously resources can be converted into materials that industry can use.
Supplementary Materials
The following supporting information can be downloaded at: https://www.mdpi.com/xxx/s1, Table S1: Maturity scale and decision rules; Table S2: Route-neutral stage taxonomy; Table S3: Evidence registry with dated sources for 84 stage-years, project pipeline and governance attributes; Table S4: Annual maturity matrix and indicators; Table S5: NCM mapping; Table S6: Robustness of conclusions to scoring judgements (targeted scenarios and Monte Carlo simulations); Table S7: Historical resource, production and trade series and stage weights; Table S8: Source log; Table S9: Full NCM-partner-year trade panel with FOB value, net weight, unit value, HHI, CR1, CR3 and effective number of suppliers, 2015–2025; Script S1: ComexStat raw-microdata extraction and concentration indicators; Script S1b: lightweight ComexStat API extraction used to build Table S9; Script S2: Robustness analysis.
Author Contributions
Conceptualization, A.A.G. and A.C.M.d.S.; methodology, A.C.M.d.S. and S.L.F.d.C.S.; validation, A.A.G., M.C.D.e.C. and S.L.F.d.C.S.; formal analysis, A.C.M.d.S.; investigation, A.A.G., A.C.M.d.S., M.C.D.e.C. and S.L.F.d.C.S.; data curation, A.C.M.d.S., M.C.D.e.C. and S.L.F.d.C.S.; writing (original draft preparation), A.A.G.; writing (review and editing), A.A.G., A.C.M.d.S., M.C.D.e.C. and S.L.F.d.C.S.; visualization, A.C.M.d.S.; supervision, A.C.M.d.S., M.C.D.e.C. and S.L.F.d.C.S. All authors have read and agreed to the published version of the manuscript.
Funding
This research received no external funding.
Institutional Review Board Statement
Not applicable.
Informed Consent Statement
Not applicable.
Data Availability Statement
The original contributions presented in this study are included in the Supplementary Materials, which contain the annual maturity matrix, evidence registry, decision rules, NCM mapping, historical series, robustness results and scripts. Primary trade data are available from MDIC/SECEX (ComexStat) under open-data terms. Further inquiries can be directed to the corresponding author.
Acknowledgments
During the preparation of this manuscript, the authors used Claude Opus 5.5 (Anthropic, accessed via claude.ai, September–October 2026) solely to format the text and references in accordance with the journal’s submission guidelines. The authors have reviewed the final version and take full responsibility for the content of this publication.
Conflicts of Interest
The authors declare no conflicts of interest.
References
- International Energy Agency. Rare Earth Elements: Pathways to Secure and Diversified Supply Chains; IEA: Paris, France, 2026; Available online: https://www.iea.org/reports/rare-earth-elements (accessed on 22 September 2026).
- Salim, H.; Sahin, O.; Elsawah, S.; Turan, H.; Stewart, R.A. A critical review on tackling complex rare earth supply security problem. Resour. Policy 2022, 77, 102697. [Google Scholar] [CrossRef] [Scilit]
- Diao, H.; Yang, H.; Tan, T.; Ren, G.; You, M.; Wu, L.; Yang, M.; Bai, Y.; Xia, S.; Song, S.; et al. Navigating the rare earth elements landscape: Challenges, innovations, and sustainability. Miner. Eng. 2024, 216, 108889. [Google Scholar] [CrossRef] [Scilit]
- Xue, H.; Lv, G.; Wang, L.; Zhang, T.-A. Review of rare earth extraction and product preparation technologies and new thinking for clean utilization. Miner. Eng. 2024, 215, 108796. [Google Scholar] [CrossRef] [Scilit]
- International Energy Agency. Global Critical Minerals Outlook 2026; IEA: Paris, France, 2026; Available online: https://www.iea.org/reports/global-critical-minerals-outlook-2026 (accessed on 22 September 2026).
- International Energy Agency. Export Controls on Certain Medium and Heavy Rare Earth Items (MOFCOM and GACC Announcement No. 18 of 2025); IEA Policies Database: Paris, France, 2025; Available online: https://www.iea.org/policies/26796 (accessed on 23 September 2026).
- Agência Nacional de Mineração. Terras Raras 2024 (Ano-Base 2023); ANM: Brasília, Brazil, 2024. Available online: https://www.gov.br/anm/pt-br/assuntos/economia-mineral/publicacoes/sumario-mineral/sumario-mineral-brasileiro-2024/terras-raras-2024-ano-base-2023.pdf/view (accessed on 22 September 2026).
- Agência Nacional de Mineração. Sumário Mineral 2025 (Ano-Base 2024); ANM: Brasília, Brazil, 2025. Available online: https://www.gov.br/anm/pt-br/assuntos/economia-mineral/publicacoes/sumario-mineral/sumario-mineral-brasileiro-2025/sumario-2025.pdf (accessed on 22 September 2026).
- Serra Verde. Serra Verde Enters Commercial Production. 2024. Available online: https://www.serraverde.com/2024/01/serra-verde-enters-commercial-production/ (accessed on 22 September 2026).
- Brasil Mineral. Terras Raras: 21 Projetos, Uma Mina, Nenhuma Refinaria. Brasil Mineral. 25 August 2026. Available online: https://brasilmineral.com.br/noticias/vinte-e-um-projetos-uma-mina-nenhuma-refinaria (accessed on 23 September 2026).
- Oliveira, M. A primeira etapa do superímã. FAPESP 2016, 241, 72–73. Available online: https://revistapesquisa.fapesp.br/a-primeira-etapa-do-superima (accessed on 14 October 2026).
- Centro de Gestão e Estudos Estratégicos. Terras Raras No Brasil: Estado da Arte, Cenários e um Mapa do Caminho Estratégico para 2026–2040; CGEE: Brasília, Brazil, 2026; Available online: https://www.cgee.org.br/documents/37878/157505/LIVRO_miolo_CGEE_terras_raras_v22_20260623+1.pdf/810fc3c4-1d32-20dd-9e3f-2cd68132a061 (accessed on 14 October 2026).
- USA Rare Earth, Inc. USA Rare Earth Completes Combination with Serra Verde Group. GlobeNewswire, 4 September 2026. Available online: https://www.globenewswire.com/news-release/2026/09/04/3356489/0/en/usa-rare-earth-completes-combination-with-serra-verde-group.html (accessed on 23 September 2026).
- USA Rare Earth, Inc. USA Rare Earth Announces Completion of Upsized $1.55 Billion Capitalization of the U.S. Government-Backed Special Purpose Vehicle for Serra Verde Offtake. GlobeNewswire, 24 August 2026. Available online: https://www.globenewswire.com/news-release/2026/08/24/3349611/0/en/usa-rare-earth-nasdaq-usar-announces-completion-of-upsized-1-55-billion-capitalization-of-the-u-s-government-backed-special-purpose-vehicle-spv-for-serra-verde-offtake.html (accessed on 23 September 2026).
- Suseno, T.; Zulfahmi, Z.; Haryadi, H.; Daranin, E.A.; Dahlan, Y.; Ishlah, T.; Santoso, E.W.; Padmawidjaja, T.; Sendjaja, P.; Hanafi, M.; et al. The paradox of mineral downstreaming: Evaluating copper ore reserve resilience and structural industrial challenges in Indonesia. Resources 2026, 15, 91. [Google Scholar] [CrossRef] [Scilit]
- Morris, M.; Kaplinsky, R.; Kaplan, D. “One thing leads to another”: Commodities, linkages and industrial development. Resour. Policy 2012, 37, 408–416. [Google Scholar] [CrossRef] [Scilit]
- Muhyiddin. IMIP Morowali as a national strategic project: The political economy of nickel downstream industrialization in Indonesia. Indones. J. Dev. Plan. 2026, 10, 142–158. [Google Scholar] [CrossRef] [Scilit]
- Guo, Q.; Wang, Y. Rare earth trade dependence network structure and its impact on trade prices: An industry chain perspective. Resour. Policy 2024, 91, 104930. [Google Scholar] [CrossRef] [Scilit]
- Xu, J.; Li, J.; Charles, V.; Zhao, X. Evolution of the rare earth trade network: A perspective of dependency and competition. Geosci. Front. 2024, 15, 101653. [Google Scholar] [CrossRef] [Scilit]
- Sprecher, B.; Daigo, I.; Murakami, S.; Kleijn, R.; Vos, M.; Kramer, G.J. Framework for resilience in material supply chains, with a case study from the 2010 rare earth crisis. Environ. Sci. Technol. 2015, 49, 6740–6750. [Google Scholar] [CrossRef] [Scilit] [PubMed]
- Mancheri, N.A.; Sprecher, B.; Bailey, G.; Ge, J.; Tukker, A. Effect of Chinese policies on rare earth supply chain resilience. Resour. Conserv. Recycl. 2019, 142, 101–112. [Google Scholar] [CrossRef] [Scilit]
- Raddant, M.; Bertau, M.; Steiner, G. Advancing the analysis of resilience of global phosphate flows. Resources 2025, 14, 151. [Google Scholar] [CrossRef] [Scilit]
- Zhao, X.; Khelifi, F.; Casale, M.; Cavallo, A.; Padoan, E.; Yang, K.; Dino, G.A. Critical raw materials supply: Challenges and potentialities to exploit rare earth elements from siliceous stones and extractive waste. Resources 2024, 13, 97. [Google Scholar] [CrossRef] [Scilit]
- Yildirim Ayyildiz, M.; Ölmez, J.A.; Hilgers, C. Probability assessment of strategic and total rare earth element supply for the EU under the EU Critical Raw Materials Act. Resources 2026, 15, 73. [Google Scholar] [CrossRef] [Scilit]
- Koese, M.; Parzer, M.; Sprecher, B.; Kleijn, R. Self-sufficiency of the European Union in critical raw materials for e-mobility. Resour. Conserv. Recycl. 2024, 212, 108009. [Google Scholar] [CrossRef] [Scilit]
- Mankins, J.C. Technology readiness assessments: A retrospective. Acta Astronaut. 2009, 65, 1216–1223. [Google Scholar] [CrossRef] [Scilit]
- Olechowski, A.L.; Eppinger, S.D.; Joglekar, N.; Tomaschek, K. Technology readiness levels: Shortcomings and improvement opportunities. Syst. Eng. 2020, 23, 395–408. [Google Scholar] [CrossRef] [Scilit]
- Borst, A.M.; Smith, M.P.; Finch, A.A.; Estrade, G.; Villanova-de-Benavent, C.; Nason, P.; Marquis, E.; Horsburgh, N.J.; Goodenough, K.M.; Xu, C.; et al. Adsorption of rare earth elements in regolith-hosted clay deposits. Nat. Commun. 2020, 11, 4386. [Google Scholar] [CrossRef] [Scilit] [PubMed]
- Wu, Z.; Chen, Y.; Wang, Y.; Xu, Y.; Lin, Z.; Liang, X.; Cheng, H. Review of rare earth element (REE) adsorption on and desorption from clay minerals: Application to formation and mining of ion-adsorption REE deposits. Ore Geol. Rev. 2023, 157, 105446. [Google Scholar] [CrossRef] [Scilit]
- USA Rare Earth, Inc. Form 8-K, Exhibit 99.2: Information about Serra Verde; U.S. Securities and Exchange Commission: Washington, DC, USA, 2026. Available online: https://www.sec.gov/Archives/edgar/data/0001970622/000121390026055511/ea029029301ex99-2.htm (accessed on 23 September 2026).
- Sprecher, B.; Dalgo , I.; Spekknk, W.; Vos, M.; Kleijn, R.; Murakami, S.; Kramer, G.J. Novel indicators for the quantification of resilience in critical material supply chains, with a 2010 rare earth crisis case study. Environ. Sci. Technol. 2017. [Google Scholar] [CrossRef] [Scilit] [PubMed]
- Binnemans, K.; Jones, P.T.; Blanpain, B.; Van Gerven, T.; Yang, Y.; Walton, A.; Buchert, M. Recycling of rare earths: A critical review. J. Clean. Prod. 2013, 51, 1–22. [Google Scholar] [CrossRef] [Scilit]
- Burkhardt, C. An overview of hydrogen assisted (direct) recycling of rare earth permanent magnets. J. Magn. Magn. Mater. 2023, 588, 171475. [Google Scholar] [CrossRef] [Scilit]
- Brasil. Constituição da República Federativa do Brasil de 1988; Art. 21, XXIII, and Art. 177, V. Available online: https://www.planalto.gov.br/ccivil_03/constituicao/constituicao.htm (accessed on 23 September 2026).
- Rani, A. Serra Verde Begins Phase I Commissioning of Brazilian Rare Earths Mine. Mining Technology, 23 June 2023. Available online: https://mining-technology.com/newsletters/serra-commissioning-rare-earths (accessed on 23 September 2026).
- Revista Pesquisa FAPESP. Brasil Investe em Pesquisa para Dominar o Ciclo Produtivo das Terras-Raras e dos Superímãs. Pesquisa FAPESP. 2025. Available online: https://revistapesquisa.fapesp.br/brasil-investe-em-pesquisa-para-dominar-o-ciclo-produtivo-das-terras-raras-e-dos-superimas/ (accessed on 23 September 2026).
- Ministério do Desenvolvimento, Indústria, Comércio e Serviços. Estatísticas de Comércio Exterior em Dados Abertos. Available online: https://www.gov.br/mdic/pt-br/assuntos/comercio-exterior/estatisticas/base-de-dados-bruta (accessed on 22 September 2026).
- França, S.C.A.; Vera, Y.M. Geopolítica e desenvolvimento tecnológico para a cadeia produtiva de terras-raras no Brasil. Lanterna 2026, 4, 66–75. Available online: https://www.gov.br/cetem/pt-br/assuntos/noticias/geopolitica-e-desenvolvimento-tecnologico-para-a-cadeia-produtiva-de-terras-raras-no-brasil-silvia-cristina-alves-franca-e-ysrael-marrero-vera.pdf (accessed on 14 October 2026).
- Diário do Comércio. Obras de Fábrica de Ímãs Avançam na RMBH. Instalação do Primeiro Laboratório-Fábrica de Ímãs de Terras-Raras do país Avança em Minas. Available online: https://diariodocomercio.com.br/negocios/obras-de-fabrica-de-imas-avancam-na-rmbh/ (accessed on 5 October 2026).
- Logcomex. China Restringe Exportação de Terras Raras e Ímãs para os EUA. 2025. Available online: https://insights.logcomex.com/noticias/comercio-exterior-n/china-restringe-exportacao-de-terras-raras-e-imas-para-os-eua/ (accessed on 23 September 2026).
- Agência FAPESP. IPT e CBMM Obtêm Didímio Metálico Utilizado em Superímãs. 18 February 2016. Available online: https://agencia.fapesp.br/ipt-e-cbmm-obtem-didimio-metalico-utilizado-em-superimas/22704 (accessed on 23 September 2026).
- Ferreira Neto, J.B.; Landgraf, F.J.G.; Ett, G.; Santos, C.A.L.; Silva, A.L.N.; Silveira, J.R.F.; Vieira, F.Y.M.; Luz, M.S. Obtenção de didímio metálico a partir dos óxidos de terras raras produzidos em Araxá, Brasil. In Proceedings of the 72nd Congresso Anual da ABM, São Paulo, Brazil, 2–6 October 2017; ABM: São Paulo, Brazil, 2017; pp. 2282–2294. [Google Scholar]
- Heider, M.; Siqueira, D.F. Novos Potenciais das Terras Raras No Brasil: Argilas Iônicas. In The Mine. 2025. Available online: https://www.inthemine.com.br/site/novos-potenciais-das-terras-raras-no-brasil-argilas-ionicas/ (accessed on 23 September 2026).
- Clarim. CBMM Projeta R$ 13 Bilhões em Investimentos e Explica Impasse Sobre Terras-Raras em Araxá. Clarim. September 2026. Available online: https://clarim.net.br/cbmm-projeta-r-13-bilhoes-em-investimentos-e-explica-impasse-sobre-terras-raras-em-araxa/ (accessed on 23 September 2026).
- Lemos, F.A.; Nascimento, M.; Vera, Y.M.; Masson, I.O.C. Emprego de Extração por Solvente na Recuperação de Ítrio e Itérbio. 2018. Available online: https://repositorio.ufc.br/bitstream/riufc/54368/1/2018_eve_falemos.pdf (accessed on 14 October 2026).
- Vera, Y.M. Aplicação da simulação do processo para separar elementos terras-raras por extração por solvente. In Proceedings of the VI Seminário Brasileiro de Terras Raras, Rio de Janeiro, Brazil, 7–8 November 2023; CETEM: Rio de Janeiro, Brazil, 2023. Available online: https://www.gov.br/cetem/pt-br/assuntos/VI-Seminario-Brasileiro-de-Terras-Raras/ApresentaoYsraelMVeraCETEMVISBTR2.pdf (accessed on 23 September 2026).
- Meteoric Resources NL. Transitional Annual Report for the Period Ending 31 December 2025; Meteoric Resources NL: West Perth, Australia, 2026. Available online: https://announcements.asx.com.au/asxpdf/20260326/pdf/06xvh5nd9xz70l.pdf (accessed on 22 September 2026).
- Agência Minas Gerais. Com Apoio do Governo de Minas, Multinacional Inaugura uma das Maiores Plantas de Terras Raras Fora da China. 2026. Available online: https://www.agenciaminas.mg.gov.br/noticia/com-apoio-do-governo-de-minas-multinacional-inaugura-uma-das-maiores-plantas-de-terras-raras-fora-da-china (accessed on 22 September 2026).
- Diário do Comércio. Centro de Inovação em Terras Raras é Estratégico para Minas Gerais. 2025. Available online: https://diariodocomercio.com.br/negocios/centro-de-inovacao-em-terras-raras-e-estrategico-para-minas-gerais/ (accessed on 23 September 2026).
- Centro de Tecnologia Mineral. MagBras: Demonstrador Industrial do Ciclo Completo de Produção Brasileira de Ímãs Permanentes de Terras Raras. 2025. Available online: https://www.gov.br/cetem/pt-br/acesso-a-informacao/acoes-e-programas/projetos-financiados-por-agencias-e-ou-recursos-publicos/em-curso/magbras-2013-demonstrador-industrial-do-ciclo-completo-de-producao-brasileira-de-imas-permanentes-de-terras-raras-1 (accessed on 22 September 2026).
- Ministério de Minas e Energia. MME Visita Projeto de Tecnologia Nacional para Produção de Ímãs de Terras Raras em Minas Gerais. 14 May 2026. Republished by Sou News, 15 May 2026. MME Visita Projeto de Tecnologia Nacional para Produção de Ímãs de Terras Raras em Minas Gerais. 2026. Available online: https://sounews.com.br/mme-visita-projeto-de-tecnologia-nacional-para-producao-de-imas-de-terras-raras-em-minas-gerais/ (accessed on 14 October 2026).
- Agência Minas Gerais. Comitiva do 1º Laboratório-Fábrica de Ímãs de Terras-Raras Do Hemisfério sul Viaja à China. 2019. Available online: https://codemge.com.br/noticia/comitiva-do-1o-laboratorio-fabrica-de-imas-de-terras-raras-do-hemisferio-sul-viaja-a-china/ (accessed on 23 September 2026).
- Agência Minas Gerais. Codemge Finaliza Obras do Primeiro Laboratório-Fábrica de Terras Raras do Hemisfério sul. 2021. Available online: https://diariodocomercio.com.br/economia/laboratorio-de-imas-de-terras-raras-na-rmbh-e-concluido-pela-codemge/ (accessed on 14 October 2026).
- Companhia de Desenvolvimento de Minas Gerais. Laboratório-Fábrica de Ligas e Ímãs de Terras-Raras (LabFabITR). In Proceedings of the VI Seminário Brasileiro de Terras Raras, Rio de Janeiro, Brazil, 7–8 November 2023; CETEM: Rio de Janeiro, Brazil, 2023. Available online: https://www.gov.br/cetem/pt-br/assuntos/VI-Seminario-Brasileiro-de-Terras-Raras/LabFabITRVISeminrioBrasileirodeTerrasRaras.pdf (accessed on 23 September 2026).
- Diário do Comércio. Fiemg Adquire Laboratório de Produção de Ímãs de Terras-Raras. December 2023. Available online: https://diariodocomercio.com.br/economia/fiemg-adquire-laboratorio-producao-imas-terras-raras/ (accessed on 23 September 2026).
- Santos, C.A.L. A experiência do IPT na obtenção de metais e ligas de terras-raras. In Proceedings of the VI Seminário Brasileiro de Terras Raras, Rio de Janeiro, Brazil, 7–8 November 2023; CETEM: Rio de Janeiro, Brazil, 2023. Available online: https://www.gov.br/cetem/pt-br/assuntos/VI-Seminario-Brasileiro-de-Terras-Raras/Apresentacao_AexperienciadoIPT_CeliaSantos.pdf (accessed on 14 October 2026).
- USA Rare Earth, Inc. Form DEFA14A, Exhibit 99.3: Overview of USA Rare Earth Acquisition of Serra Verde; U.S. Securities and Exchange Commission: Washington, DC, USA, 2026. Available online: https://www.sec.gov/Archives/edgar/data/0001970622/000121390026045342/ea028691001ex99-3.htm (accessed on 23 September 2026).
- Lima, R. Aclara Inaugura Planta Piloto de Separação de Terras Raras Nos EUA. Minera Brasil, 20 March 2026. Available online: https://minerabrasil.com.br/aclara-inaugura-planta-piloto-de-separacao-de-terras-raras-nos-eua/2026/03/20/ (accessed on 23 September 2026).
- Diário do Comércio. Meteoric Resources Fará Refino de Terras-Raras No Brasil, Marcando Avanço na Cadeia Produtiva. 2026. Available online: https://diariodocomercio.com.br/negocios/meteoric-resources-terras-raras-refino/ (accessed on 23 September 2026).
- Rumbo Minero. Brazilian Rare Earths Pone en Marcha Planta Piloto y Produce Primer Concentrado de Tierras Raras en Brasil. 8 September 2026. Available online: https://www.rumbominero.com/brasil/brazilian-rare-earths-planta-piloto-concentrado-tierras-raras-brasil/ (accessed on 23 September 2026).
- Capital Digital. BNDES Financia Tecnologia de Terras Raras sem Definir Patentes. September 2026. Available online: https://capitaldigital.com.br/bndes-financia-tecnologia-de-terras-raras-sem-definir-patentes-75-da-producao-pode-seguir-para-franca/ (accessed on 23 September 2026).
- Global Mining Review. Lynas Opens First Rare Earths Processing Facility in Australia. 12 November 2024. Available online: https://www.globalminingreview.com/mining/12112024/lynas-opens-first-rare-earths-processing-facility-in-australia/ (accessed on 23 September 2026).
- Lynas Rare Earths Ltd. FY25 Performance and Towards 2030 Strategy. ASX Announcement, 28 August 2025. Available online: https://announcements.asx.com.au/asxpdf/20250828/pdf/06ngtrk361hdnd.pdf (accessed on 23 September 2026).
- MP Materials. MP Materials Restores U.S. Rare Earth Magnet Production. 22 January 2025. Available online: https://mpmaterials.com/news/mp-materials-restores-u-s-rare-earth-magnet-production (accessed on 23 September 2026).
- The Motley Fool. MP Materials (MP) Q2 2026 Earnings Call Transcript. 13 August 2026. Available online: https://www.fool.com/earnings/call-transcripts/2026/08/13/mp-materials-mp-q2-2026-earnings-call-transcript/ (accessed on 23 September 2026).
- Vespignani, J.; Smyth, R. Artificial intelligence investments reduce risks to critical mineral supply. Nat. Commun. 2024, 15, 7304. [Google Scholar] [CrossRef] [Scilit] [PubMed]
- Binnemans, K.; Jones, P.T.; Müller, T.; Yurramendi, L. Rare earths and the balance problem: How to deal with changing markets? J. Sustain. Metall. 2018, 4, 126–146. [Google Scholar] [CrossRef] [Scilit]
- Saadaoui, J.; Smyth, R.; Vespignani, J.; Wang, Y. Critical minerals in an age of geopolitical rivalry: Stockpiling, refining constraints, and the limits of friend-shoring. Oxf. Rev. Econ. Policy 2026, 42, 111–130. [Google Scholar] [CrossRef] [Scilit]
- Brasil Mineral. Estado Poderá Suprir 20% da Demanda Mundial de Terras Raras. Brasil Mineral 2026, 460. Available online: https://brasilmineral.com.br/revistas/460/estado-podera-suprir-20-da-demanda-mundial-de-terras-raras (accessed on 23 September 2026).
- Laboratório de Reciclagem, Tratamento de Resíduos e Extração (LAREX-USP). Separação de Elementos Terras Raras por Extração por Solventes a Partir de Fontes Secundárias. Available online: https://larex.poli.usp.br/estudo-dos-compostos-organometalicos-para-separacao-de-elementos-terras-raras-por-extracao-por-solvente/ (accessed on 23 September 2026).
- Orsoli, C.R.R.; Codelo, F.N.; Moraes, V.T.; Espinosa, D.C.R. Reciclagem de terras raras a partir de resíduos de baterias de níquel metal hidreto: Etapa de caracterização. In Proceedings of the 69º Congresso Anual da ABM, São Paulo, Brazil, 21–25 July 2014; ABM: São Paulo, Brazil, 2014; Available online: https://abmproceedings.com.br/ptbr/article/download-pdf/reciclagem-de-terras-raras-a-partir-de-resduos-de-baterias-de-nquel-metal-hidreto-etapa-de-caracterizao (accessed on 23 September 2026).
- Saadaoui, J.; Smyth, R.; Vespignani, J. Ensuring the security of the clean energy transition: Examining the impact of geopolitical risk on the price of critical minerals. Energy Econ. 2025, 142, 108195. [Google Scholar] [CrossRef] [Scilit]
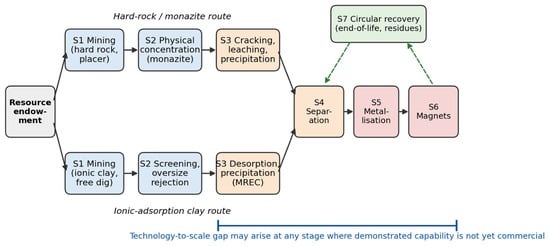
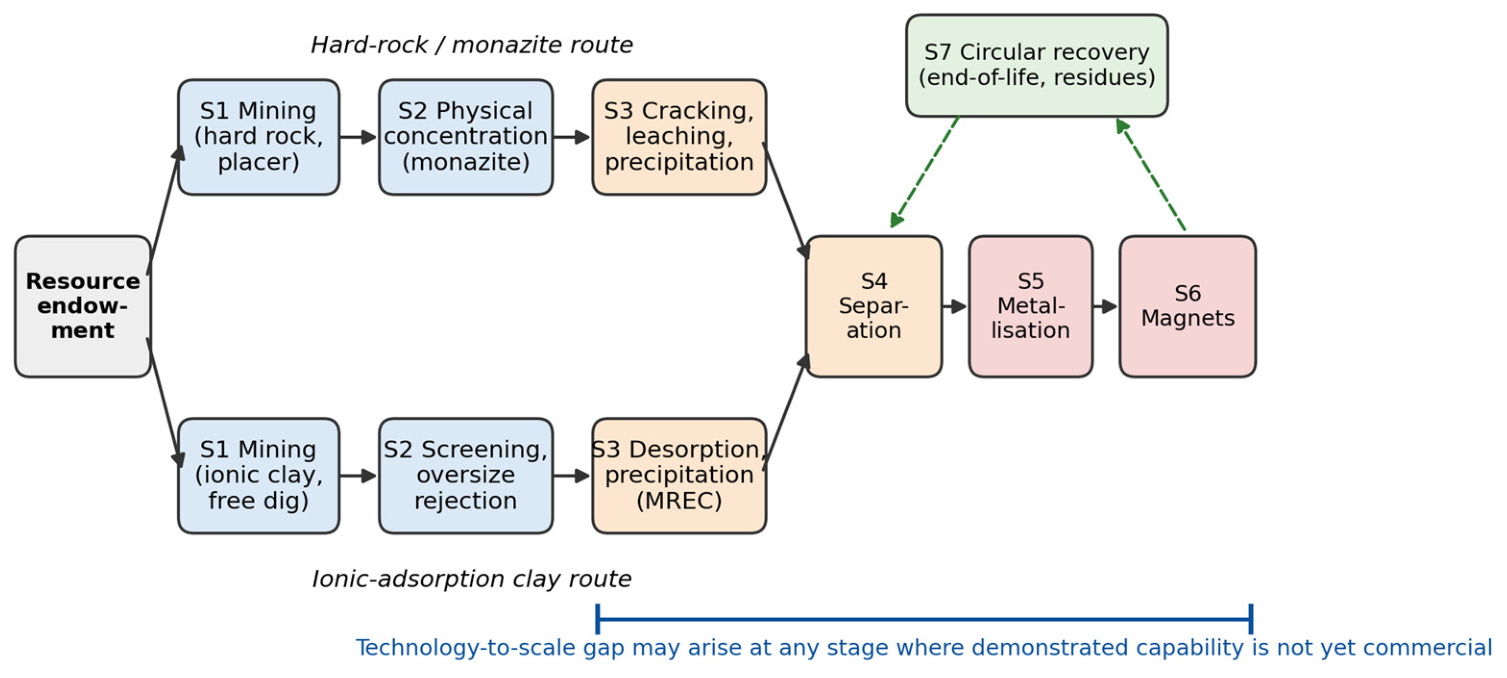
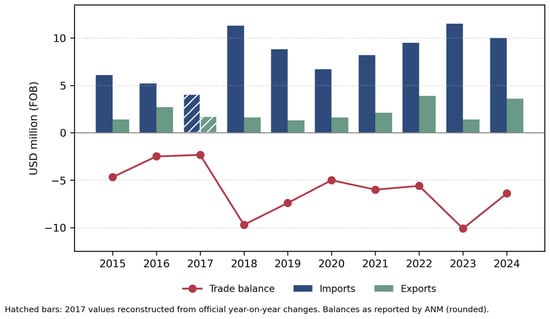
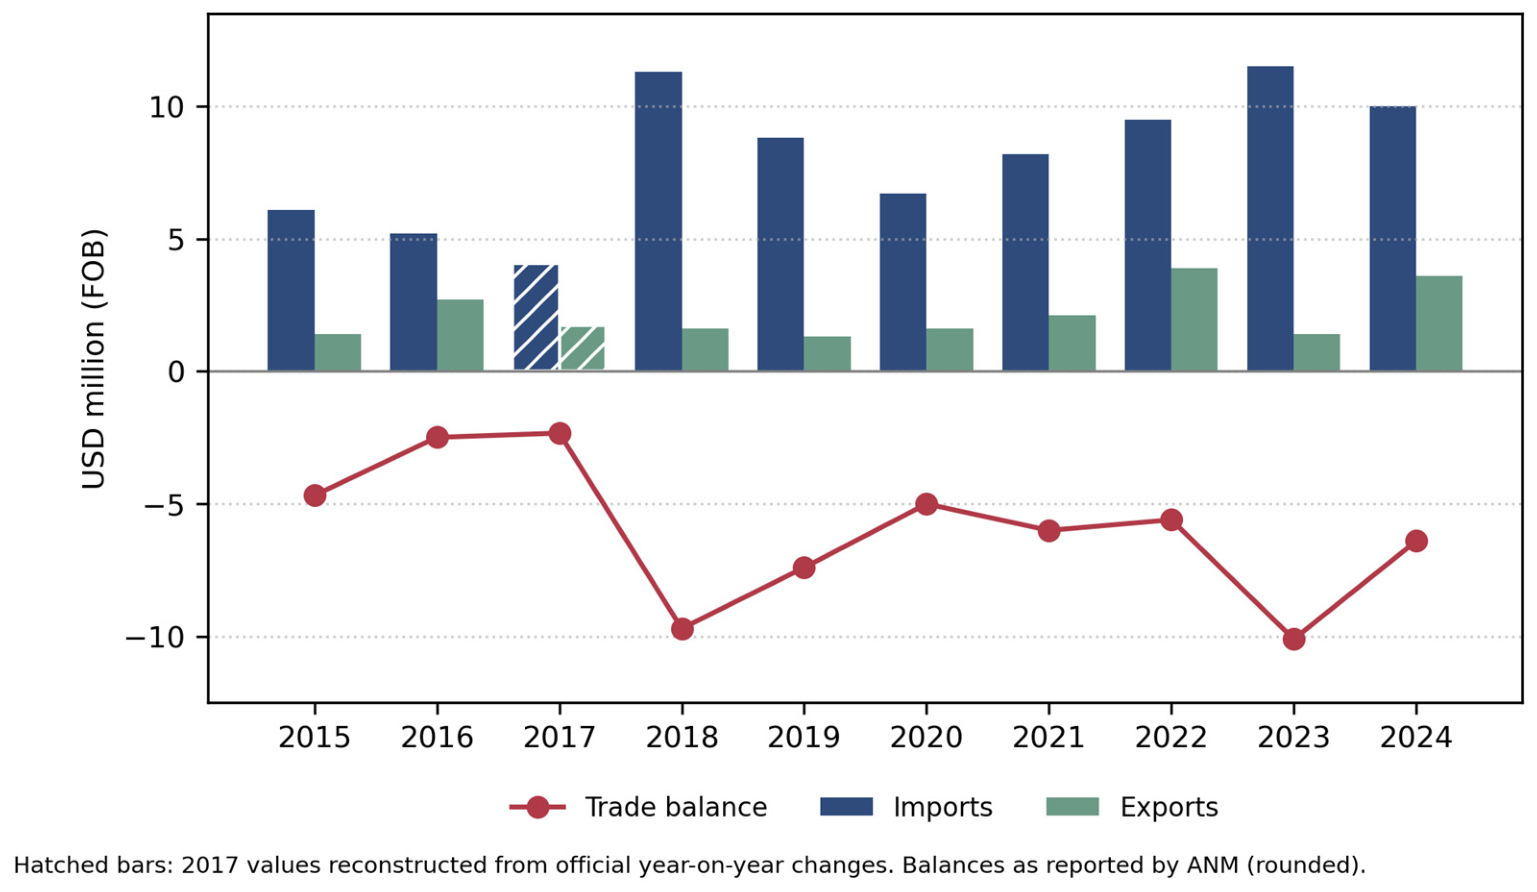
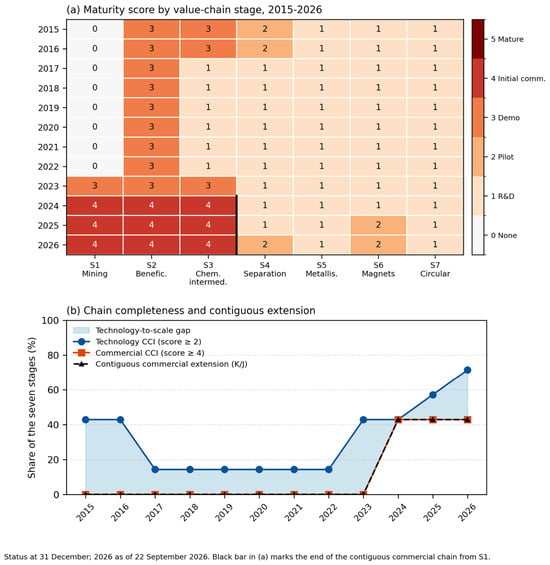
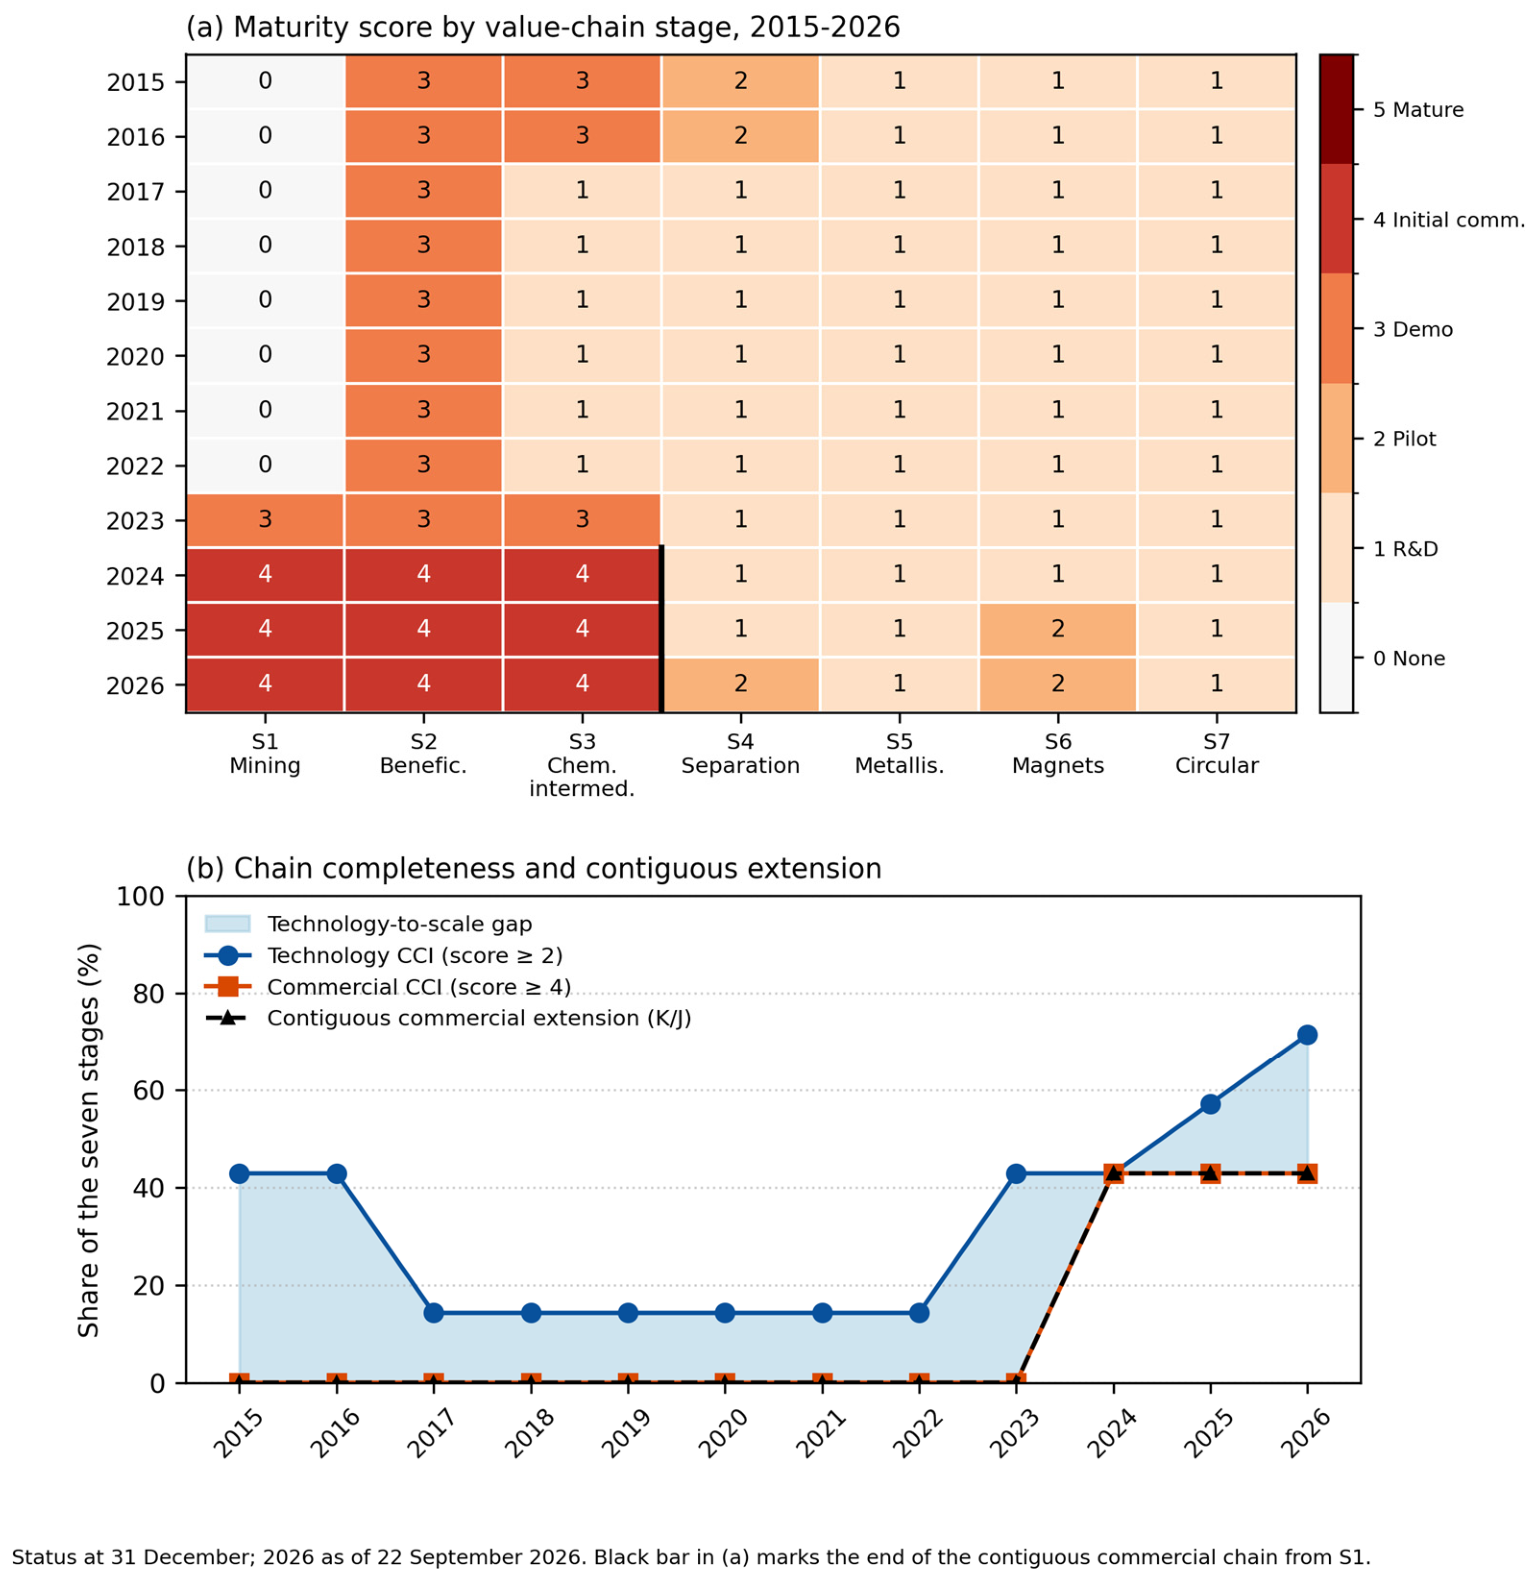
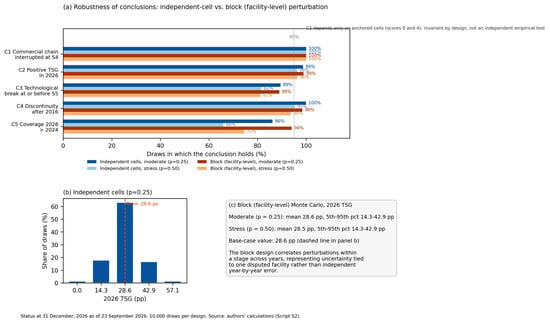
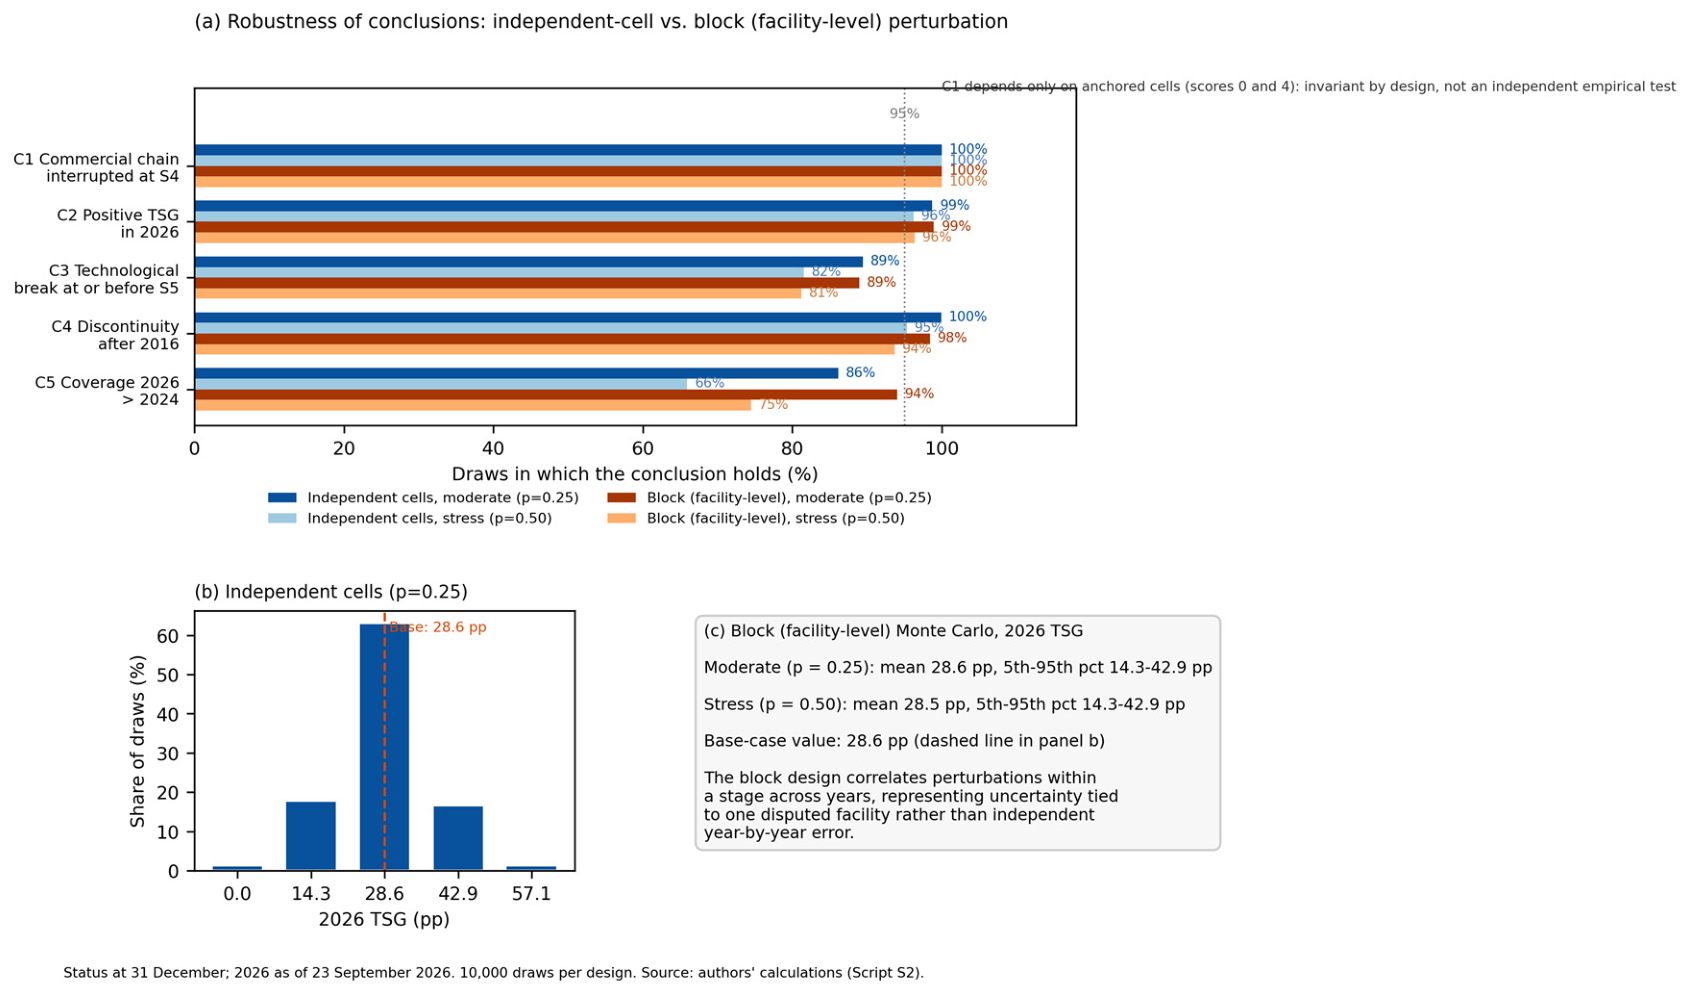
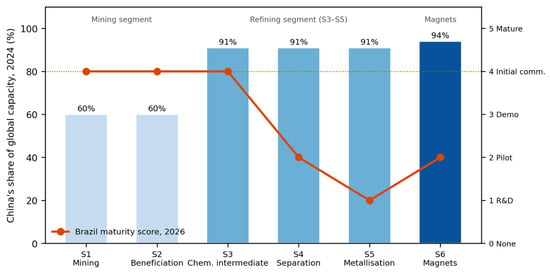

Disclaimer/Publisher’s Note: The statements, opinions and data contained in all publications are solely those of the individual author(s) and contributor(s) and not of MDPI and/or the editor(s). MDPI and/or the editor(s) disclaim responsibility for any injury to people or property resulting from any ideas, methods, instructions or products referred to in the content. |
© 2026 by the authors. Licensee MDPI, Basel, Switzerland. This article is an open access article distributed under the terms and conditions of the Creative Commons Attribution (CC BY) license.