


Abstract
As agriculture is the largest user of water resources in India, its efficient management is crucial for the food and water security of the country. However, prices of water and energy used in agriculture are distorted due to government interventions. It keeps the price of irrigation water artificially low and does not reflect its scarcity value. Such a situation largely affects the efficiency of water resource management and farm performance. In this context, the study examines the economics of water resource management in agriculture by estimating the degree and sources of technical inefficiency among farmers, evaluating the productivity effects of water-efficient technology adoption, and estimating the shadow price of irrigation water. The study applied a selectivity-bias-corrected directional distance function (DDF) approach to control for selection bias in estimating technical inefficiency and found substantial technical inefficiency in the production system. Adoption of water-efficient technology, here laser land leveling, appeared to significantly improve farm productivity. The study estimated shadow price (SP) of irrigation water using the duality relationship between DDF and the profit function. The estimated SP of irrigation water was low, indicating low incentives among farmers to optimize the use of irrigation water, largely caused by market distortions. The results indicate the possibility of improving water resource management in agriculture by upscaling water-efficient technologies and reducing factor market distortions. A mix of policy measures that combines the choice of realistic water and energy prices for agricultural use, scaling up of water-efficient agricultural technologies, and interlinking economic incentives to the scaling up of water-efficient technologies seem crucial towards sustainable and efficient water resource management in agriculture.
1. Introduction
Water stress is a major threat in India, mostly in regions dominated by irrigated rice–wheat systems. Punjab is one of those states in India that has nearly 100% of total cultivated land under irrigation and about 95% of the groundwater extracted in the state is used for irrigation purposes [1]. However, highly subsidized energy (electricity) policy for the agriculture sector has led to over extraction of groundwater, severely depleting the major groundwater aquifers in the state. Between 2000 and 2019, the groundwater table declined by an average of 8.91 m in this state [2]. Since groundwater takes substantially long time (>100 years) to replenish naturally, its overuse can lead to serious depletion [3], instigating catastrophic risks to the environment, agriculture, and ecosystems. Consequently, understanding the economic as well as technological aspects of water resource management in agriculture is crucial for sustainable agriculture and achievement of multiple sustainable development goals (SDGs) in the country.
Understanding the causes of over-extraction of groundwater requires examining multiple dimensions such as legal, institutional, technological, economic and governance dimensions. The legal framework in groundwater use in India is based on the Indian Easement Act 1882, which grants landowners the rights to extract unlimited amount of groundwater beneath their land. With this legal system, landowners perceive groundwater under their land as a private good, though it has multiple and serious public implications. Several laws regarding groundwater management were introduced in Punjab such as ‘The Punjab State Tube-well Act of 1954’, ‘The Punjab Irrigation and Drainage Authority Act of 1997’, ‘The Punjab Groundwater (Control and Regulation) Act of 1998’, and the ‘Punjab Water Resources (Management & Regulation) Act of 2020’ (https://pwrda.punjab.gov.in/en/about, accessed on 9 September 2026). However, these acts were all faced with implementation challenges and were not successful enough in creating an environment needed for the efficient management of water resources in agriculture.
On the governance aspects, water resource governance, especially groundwater governance, faces multiple challenges including institutional fragmentation, overlapping responsibilities across multiple state agencies, and lack of clear governance framework. The governance problem has become more complicated due to limited financial and technical resources with state agencies.
From economic perspectives, provision of free or highly subsidized electricity for agricultural use, lack of proper water pricing, and minimum support price for water-intensive cropping systems such as rice and wheat can be considered as the major reasons behind over-exploitation of groundwater. Due to assured market prices for rice and wheat, the area under rice cultivation increased from 390 thousand hectares to 3103 thousand hectares between 1970 and 2019 and the area under wheat cultivation increased from 2299 thousand hectares to 3520 thousand hectares during the same period [2]. In Punjab, rice–wheat cropping system covers around 85% of the total land under cultivation [2]. Farmers barely pay the actual cost of groundwater used in agriculture and do not consider the needs of future generations in their farm production decisions. Hence, proper water pricing can be an appropriate economic instrument for water resource management [4]. In the absence of properly functioning water market, this study uses the shadow price to estimate the value of irrigation water [5,6].
To address the proper management of water resources in agriculture and stagnating crop yield, there is a need for technology that both improves yield and enhances water use efficiency. Laser Land Leveler is one of the water-efficient technologies that contributes to reducing irrigation water loss and improves crop yield through better crop establishment and less use of inputs such as fertilizer, electricity, and water [7,8,9,10]. Given these issues, this study focuses primarily on the economics of water resource management in agriculture using data from the Punjab State of India. Legal, institutional and governance aspects are not the central focus of this study, though they are discussed as needed to explain the economic aspects of water resource management. To explore the economics of water resource management, this study examines the degree and source of technical inefficiency among farmers, evaluates the productivity effects of water saving technology adoption (i.e., laser land leveler in this case), and estimates the shadow price of irrigation water. The study followed this approach because there are two major ways to increase resource use efficiency. First, by improving technical efficiency, i.e., producing higher output (more crop yield) with the same level of inputs (here, irrigation water) and technology or producing the same level of outputs with fewer inputs or through the adoption of new and improved technology. Second, improving resource allocation through a choice of proper pricing, i.e., reducing price distortions. Therefore, the main research questions of this study are: (1) Does water-efficient technology adoption improve agricultural water resource management? and (2) Does factor price distortions (here, price of irrigation water) lead to inefficient use of water resource in agriculture? In order to answer these questions, this study examines the degree and source of technical inefficiency among farmers, assesses the productivity differential between water-efficient technology (here laser land leveler) adopters and non-adopters, and estimates the economic value of agricultural water to farmers.
Despite the numerous studies that have highlighted laser land leveler (LLL) as a water-efficient technology using data from researcher-managed field trials [7,8,9,11], its impact on water resource management in farmers’ fields remains a relatively unexplored area. Further, farmers in Punjab grow multiple crops in a year. However, previous studies focused on the technical efficiency of farm households either by aggregating multiple outputs as output revenue [12,13,14,15,16] or by examining the production efficiency of a single crop using a production function, single output–multiple input production technology [17,18]. Unobserved factors influencing efficiency may also affect technology adoption [19], emphasizing the need to address self-selection bias. Notably, none of the papers estimating the impact of technology adoption corrected for this self-selection bias. While Krishna and Veettil [20] assessed the on-farm impacts of zero tillage in India, they did not consider self-selection bias. Aravindakshan et al. [21] employed a bias-corrected DEA meta frontier to estimate technical efficiency of wheat growers in Bangladesh using different tillage practices. However, this model is confined to a single output technology and a deterministic approach that treats all the deviations from the frontier as technical inefficiency. Additionally, recent studies by Khanal et al. [22]; Paz et al. [23]; Zheng et al. [24] that addressed sample selection bias using stochastic frontier model is limited to single output–multiple input case.
Additionally, there is no formal market for irrigation water. Still, there are not many studies that examined the shadow price of irrigation water using micro-level data in India. For instance, Bierkens et al. [25] estimated shadow prices of irrigation water at the country level for major groundwater-depleting countries. Although Smith et al. [26] estimated the shadow price of water for Punjab, India, the value they calculated covers only the shadow rental rate of water, i.e., the unit cost of groundwater extraction. To date, no study has estimated the current marginal value of water as an extra value of crops that can be produced by an additional unit of water consumed, keeping the quantity of other inputs such as seeds and fertilizers constant.
This study makes several original contributions. First, this is the first attempt to estimate the technical efficiency of farmers using a sample selection-bias-corrected multiple-output production frontier framework for India. The framework by Greene [19] was followed to account for the correlation between the unobserved error term in the selection model (Probit) for LLL adoption and the noise term in the directional distance function (DDF) frontier model. While this approach addresses self-selection on unobservable, it does not establish a causal treatment effect in the experimental sense, it provides selection corrected evidence on the strengths and statistical significance of the productivity gap associated with adoption. Second, we used DDF with output–input orientation incorporated multiple outputs produced by farm households. The value of DDF is the inefficiency measure that accounts for possible input reduction and output expansion simultaneously. Allowing both output enhancement and input reduction in efficiency measurement is appropriate because there is no evidence that farmers cannot suffer from inefficiencies in both input use and output production simultaneously. Third, we investigate the productivity effects of LLL adoption and other farm and farmer characteristics in India.
Lastly, this is the first study that used frontier and marginal productivity approaches to estimate the value of water used for irrigation in Punjab, India. Although non-frontier approaches, such as residual valuation and the general equilibrium model, can be used to determine shadow prices, they do not account for inefficiency. Studies evaluating smallholder agriculture’s performance (e.g., [15,20,27]) often report the presence of considerable inefficiency. Therefore, it is appropriate to use a more general framework that allows for the estimation of inefficiency and shadow prices together [28] rather than making the unrealistic assumption of full efficiency when estimating technology parameters and shadow prices.
The remainder of this paper is structured as follows. Section 2 presents the analytical framework. Empirical methods used in the analysis are described in Section 3, while Section 4 briefly provides information on the study area and data. Section 5 reports and discusses the main findings. Section 6 provides some policy implications of our findings for water resource management in agriculture and Section 7 concludes the paper.
2. Analytical Framework
Water-efficient agricultural technology adoption can enhance water management in agriculture. However, many unobserved factors which affect farm efficiency can also influence agricultural technology adoption decisions [19]. That is why bias arising from self-selection needs to be adequately addressed when estimating technical (in)efficiency. Therefore, we estimate both the selection (Probit) and a directional distance function (DDF) models representing the underlying production technology as a stochastic frontier and allowing for possible correlation between the noise terms in the selection and stochastic frontier models.
In our case, farm households produce multiple outputs. Thus, using a single-output and multi-input production technology is not appropriate. Given that distance functions are multi-output, multi-input production technology models, they can address the limitations of the standard production function approach. Distance functions can be estimated using two approaches. The first approach is parametric method, which can be estimated using stochastic frontier (e.g., [29,30,31]) or deterministic frontier (e.g., [28,32]). The second approach is a non-parametric approach or set representation known as data envelopment analysis (e.g., [33,34]). The main advantage of using the distance function approach is that the production frontier can be estimated without assuming the separability of inputs and outputs [35].
Distance functions measure distances to the frontier in relative (radial) or absolute terms (directional). Distance functions can be input-oriented, output-oriented, or both input–output-oriented. Using an input-oriented or output-oriented approach to measuring technical efficiency is appropriate when the producer has control over the inputs or outputs, respectively [35], e.g., cost-minimizing and revenue-maximizing producers. An input–output-oriented approach is appropriate when both output and inputs are under the control of the farmer, such as in a profit maximization problem. Our research questions were addressed by applying the input–output-oriented directional distance function approach since farmers can reduce input use and expand production simultaneously.
An input-oriented model would restrict the farmers to reducing inputs while holding outputs fixed, thereby ignoring the yield-enhancing possibilities. Conversely, an output-oriented model would restrict farmers to expanding output while holding inputs fixed, for instance, a water-saving channel. Only the input–output orientation captures the dual nature of the production technology, where the directional vector allows simultaneous movement toward the frontier through proportional input contraction and output expansion. This specification is therefore the most economically appropriate for modeling profit-maximizing behavior in the presence of technology that improves technical efficiency on both margins.
Distance functions can be radial (e.g., [30,36]), hyperbolic (e.g., [37,38]) or directional (e.g., [29,31,39]). In a radial distance function, the directional vector for proportional (radial) input contraction or output expansion from the observed input–output vector towards the technology frontier is data-driven (dictated by input–output mix for each observation) and thus outside the control of the analyst [32,40]. Hyperbolic distance functions apply the scaling to both inputs and outputs but are rarely used because the associated inefficiency measure does not have a straightforward cost, revenue or profit interpretation. DDF approach sets a uniform translation vector for measuring distance or inefficiency from the observed input–output point to the technology frontier [32,40,41]. Since a common direction vector or numeraire is used in the DDF, the inefficiency values can be aggregated across observations because they are absolute numbers. Therefore, we use a DDF approach in our analysis.
In the absence of market for irrigation water in the study area, we used the shadow price concept of economics. We used Several studies have applied econometric estimation of shadow price of irrigation water by estimating production function (for example, [42,43,44,45,46,47]). Proper pricing of irrigation water has remained an issue even in developed countries like United States [6]. In order to estimate the shadow price of irrigation water, this study uses the duality relationship between the DDF and the profit function. The shadow price reflects the marginal value of water, i.e., the extra value of crops that can be produced by an additional unit of water consumed, given the quantity of other inputs such as seed and fertilizers. Hence, shadow price is estimated in order to take into account the presence of distortionary market instruments such as subsidies, quotas and support prices for certain crops. In our case, subsidies in electricity used in agriculture and no price of groundwater used by the landowner are key issues leading to market distortions and affecting the economics of water resource management in agriculture.
3. Empirical Methods
3.1. Sample Selection Bias-Corrected Model
This study applied the sample selection-bias-corrected model developed by Greene [19]. According to this model, unobservable factors in the selection model (Probit) are correlated with the statistical noise in the stochastic frontier model, and hence, correction of selection bias is crucial. The model is expressed as follows:
Equation (1) represents a binary (Probit) model for selection, where is equal to 1 for a farmer who has adopted laser land leveling (LLL) and 0 for non-adopter; is a vector of explanatory variables and the error term. Equation (2) represents stochastic frontier model where is the unobservable composed error terms consisting of noise () and inefficiency ; is the vector of outputs, vector of inputs; and and are the vector of parameters to be estimated in the adoption and DDF models, while and are the direction vectors of the DDF. The coefficient of captures the correlation between the error term in the selection model and the noise term () in the stochastic frontier model. A statistically significant implies the presence of self-selection bias attributable to unobservable variables that influence both technology adoption and farm efficiency.
The study applies production function frontiers to estimate DDF frontiers. Application of this method contributes to addressing bias arising from self-selection while ensuring a robust estimate of the production functions and technical efficiency. Further, the study uses Bayesian estimation techniques to estimate the adoption model and the stochastic frontier, as it is relatively easier to impose regularity conditions on the frontier estimation with this estimation [48,49] while allowing for measurement errors. The quadratic functional form is used for DDF because it is flexible and allows for the global imposition of the translation property [40]. Moreover, it handles zero output levels easily as (unlike in the translog) logged inputs or outputs are not needed. We use the sample data point to set the direction vector for both inputs and outputs. However, because we first normalize our input and output data variables by their respective sample mean values, our direction vector is set to a unitary vector. By assigning the mean vector for direction, the DDF value estimates the maximum feasible unit reduction in inputs and expansion in output from the observed input–output combination towards the frontier with the unit (or yardstick) for the projection defined as the sample mean input–output bundle. The quadratic functional form is expressed as:
where is a vector of input , is a vector of output as measured in terms of net revenue from wheat or rice and cotton production; is a shifter variable (e.g., a district dummy variable); is the vector of inefficiency variables and their estimated coefficients; and are, respectively, the one-sided or positive exponentially distributed inefficiency term and the symmetric noise term. The models specified in Equations (1), (2) and (11) are estimated in R 4.1.3 version using the APEAR package [50].
3.2. Directional Distance Function
The production technology of a farm using N inputs to produce M outputs can be represented as a technology set, T, which maps out all feasible input–output combinations:
where is a vector of inputs capable of producing a vector of outputs . is a convex set that satisfies the free disposability of inputs and (desirable) outputs. Given output and input direction vectors and with dimensions corresponding to output and input vectors, we can represent the production technology using an output–input directional distance function as follows [51]:
where and The value of the function indicates the maximal number of units that the observation can be translated in the direction of and still remain technically feasible. Both the direction and numeraire (yardstick) for the translation are determined by the direction vector. For any firm on the boundary, the value of the directional distance function value is zero, meaning the producer is operating on the frontier and is efficient. And any firm operating below the frontier is inefficient (has a positive directional distance function value) and can be translated towards the frontier in the direction given by and .
The DDF has the following properties [51]: (i) it is concave in ; (ii) its value is non-negative for observed input–output combinations; (iii) it is monotonic, which indicates the DDF is decreasing in outputs and increasing in inputs; and (iv) it satisfies the translation property: adding a multiple of the direction vector to input–output bundle reduces the distance function by that multiple values, i.e., .
3.3. Shadow Price of Water
The shadow price of irrigation water is obtained from the duality relationship between the DDF and the profit function. Let denote the vector of input prices and denote the vector of output prices. The duality between the profit and the DDF can be written as [40]:
The duality relationship can be used to recover one function from the other. It can also be used to derive shadow prices by solving the following:
For a differentiable directional distance, the following normalized shadow prices can be derived from the duality relationship [40]:
If we take a ratio of any of the above shadow prices, the normalization factors cancel out. Consequently, the ratio of shadow prices we obtain will become ratios of the derivatives of the DDF. If we take inputs and output , we can express the ratio of their shadow prices as:
If we assume that for a marketed output (e.g., wheat), the shadow price is equal to its market price , then we can estimate the shadow price of (e.g., water) using the above equation as:
4. Study Area and Data
4.1. Study Area
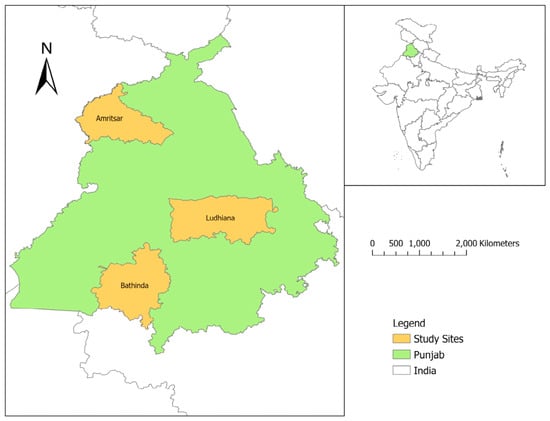
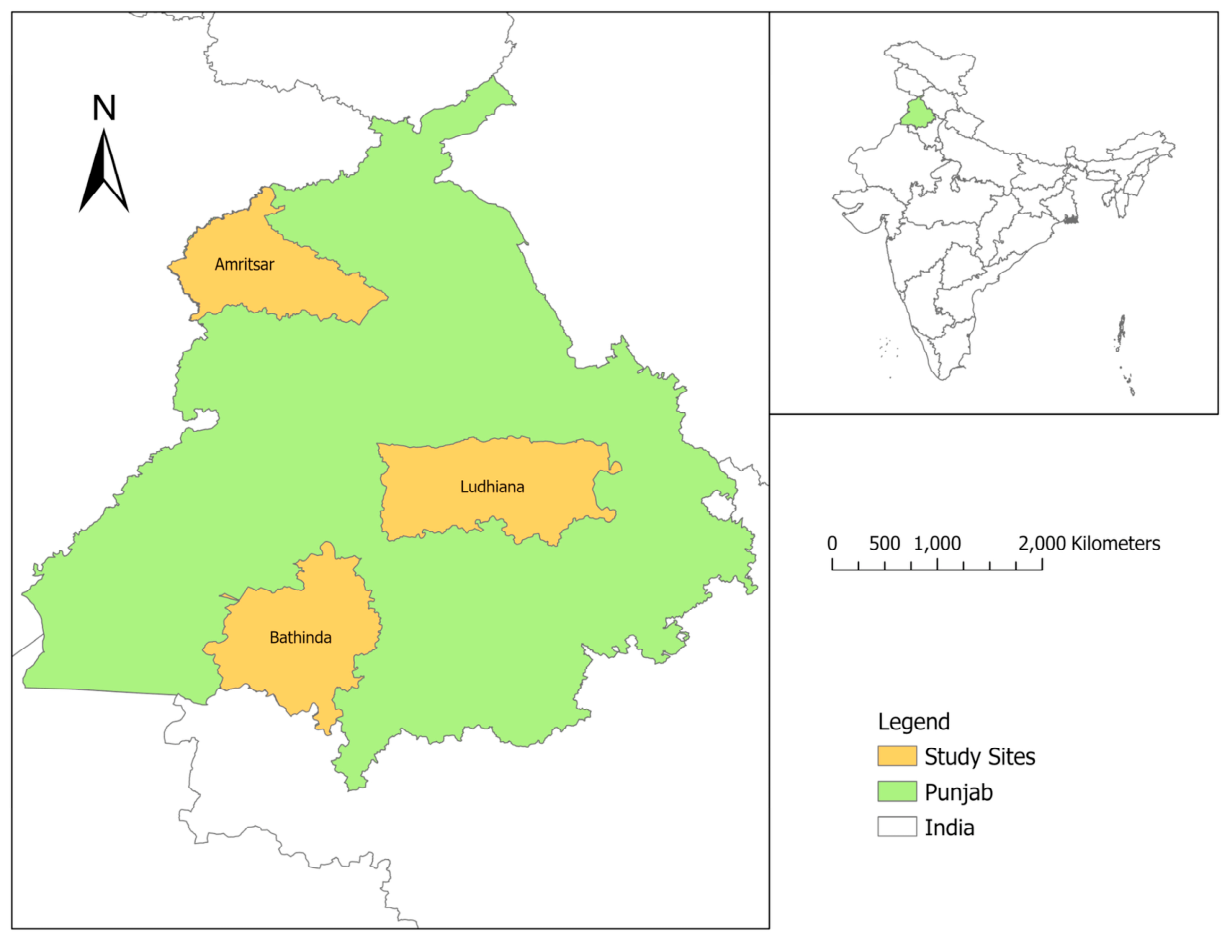
This study uses primary data collected in 2015 from Amritsar, Bhatinda, and Ludhiana districts of Punjab state, India (Figure 1). Rice–wheat is the primary cropping system in Amritsar and Ludhiana whereas cotton–wheat and rice–wheat are common in Bhatinda. Rice and cotton are grown in the rainy season and wheat in the winter season. All three crops are grown under irrigated conditions. Groundwater is the primary source of irrigation in the Amritsar and Ludhiana while both surface (canal) and groundwater are used for irrigation in Bhatinda. Amritsar and Ludhiana have a semi-arid climate with an annual rainfall of 650 mm while Bhatinda has an arid climate with an annual rainfall of 375 mm [2]. The declining groundwater table has become as threatening an issue in the study areas as in the whole Punjab state. Electricity is the major energy source for irrigation, which is provided free of cost for agriculture purposes. Most of the farmers used laser land leveling service as it helps reduce irrigation water loss. The laser land leveling service is provided by agricultural cooperatives through the rental market.
Figure 1.
Study districts in Punjab State of India.
4.2. Data
This survey collected information on farm and household characteristics, cropping patterns and a number of socio-economic capital variables. We used primary data collected from 345 farm-households from Amritsar, Bhatinda, and Ludhiana in 2015 (i.e., 115 households from each district). Descriptive statistics on the outputs and inputs used in the stochastic frontier are provided in Table 1. The model has two outputs measured in terms of net wheat revenue (USD) and net rice and cotton revenue (USD). It is possible to estimate two separate models: one for regions growing cotton and wheat and the other for rice and wheat. However, it would reduce the sample size in estimating the models, resulting in low degrees of freedom, and unreliable sample estimates. Therefore, focusing on similarities in these regions, rice and cotton were estimated together to obtain a more robust estimate. Net revenue was calculated by deducting the other variable costs (seed, fertilizer, machinery, and contract labor costs) from the respective crop gross revenue. In estimating the model, we grouped these inputs and deducted from gross revenue because they were highly correlated with land. It is common practice to group variables to reduce the model size to avoid the problems associated with measurement issues. Similarly, it is convenient to reduce the number of variables, and to proceed with parsimonious model to achieve a reasonable result than a model with many variables [52,53]. Therefore, the inputs included are land (acres), labor (total man days) and water (‘000 cubic meters). We grouped rice and cotton crops because they are produced in the same (rainy) season.
Table 1.
Descriptive statistics of the variables used in directional distance function frontier.
Soil fertility, use of laser land leveler, years of laser land leveling, and district dummies are used as shifter variables. Years of laser land leveling used is included because the effectiveness of laser land leveling declines over time. District dummies are assumed to capture the district effect and agro-ecological differences across districts.
The inefficiency variables were selected based on existing literature [14,36,54]. As land is the major productive asset of farmers, land ownership gives them freedom and commitment to using soil and water-conserving technologies that could benefit them in the long run [55]. Hence, farming in owner-cultivated land is expected to be more efficient than farming on leased land.
Similarly, the household head’s education represents human capital and is generally assumed to be positively associated with farm efficiency [56]. Education level influences technical efficiency through its association with technical aspects of crop production [36]. The age of the household head is used as the proxy for experience, assuming that experienced farmers may allocate scarce resources more prudently, leading to higher efficiency [57]. Contrarily, higher age of a household head can be linked with physical inactivity and is more likely to associate with larger technical inefficiency.
Livestock ownership can have mixed effects as households with livestock mostly follow integrated crop–livestock systems. On one hand, in this kind of system, by-products from one system can be used as input in another, increasing the technical efficiency and increasing the scope for economies of scale [58]. On the other hand, a household that spends more time on livestock has less time for crop production and can therefore increase inefficiency in crop production.
Receiving information on water-saving technologies means farmers are aware of available innovative water-saving technologies. Similarly, having an agricultural institution membership provides better access to inputs, credit, and information. Many studies have found agricultural institution membership is positively associated with the adoption of improved agricultural technologies [59,60].
4.3. Identification Strategy and Exclusion Restrictions
This section presents the variable used to identify the sample selection correction and provides economic rationale. The following variables are included in adoption equation but excluded in efficiency equation: (i) distance to service provider, (ii) agricultural training, (iii) seen operating laser land leveler (LLL), (iv) perception on benefits of LLL adoption (better crop establishment, reduced irrigation time), (v) perception on farm land characteristics (soil fertility, land level/elevation), (vi) experienced groundwater decline, (vii) perception on groundwater decline as a problem in future and (viii) Kishan credit card. These variables influence the adoption decision but are excluded from SFA because they do not directly affect farmers’ efficiency, i.e., how efficiently they convert given inputs into outputs once the production decision is made. Economic justification of each variable is explained below.
Distance to the service provider: Distance captures the transaction and travel costs of hiring a laser land leveler. The distance to the service provider influences the adoption decision of farmers [10,61,62]. The distance to service providers is reflected in the price of the service. If the service provider comes from a greater distance, they may charge extra for the distance traveled. Also, the service provider may be unwilling to provide the service until the minimum area demand is met in the village [61]. Hence, farms located farther from the rental market are likely to delay their adoption decision. However, once adoption decision is made, distance to the service provider does not directly affect the farmer’s managerial or technical efficiency in using those inputs.
Seen operating laser land leveler. Observational learning reduces uncertainty about the technology and lowers the information barrier to adoption [63]. Seeing the machine operate affects the adoption decision through subjective risk assessment and social learning, but it does not directly alter the farmer’s innate technical efficiency in production.
Perception of the benefits of the laser land leveler. Subjective expected benefits (e.g., water savings, yield improvement, ease of irrigation) drive the utility maximization calculus behind adoption [64,65]. These perceptions are decision-making constructs that influence whether a farmer adopts; they do not represent a direct input or managerial capability in the production process itself.
Perception in groundwater decline: Farmer perception of environmental risks influences agricultural technology adoption decisions [66]. This perception affects the net benefit calculation of adoption but does not directly determine the technical efficiency with which a farmer applies water, labor, or other inputs in a given season.
Farm land characteristics (land level, soil fertility): Farmers’ subjective assessment of soil fertility, land elevation are important factors affecting technology adoption decisions [59,67]. However, the perception of soil fertility and land level does not directly enter the technical efficiency relationship once input levels are accounted for in the frontier.
Kishan credit card: Credit access relaxes liquidity constraints for the lumpy investment required to hire LLL services [68]. Credit availability affects the adoption decision through the budget constraint but does not directly influence the technical efficiency of production once inputs are chosen.
Agricultural training: Training in soil and water conservation technologies reduces information asymmetry and increases awareness of these technologies, thereby increasing the probability of adoption [69]. We exclude this from the inefficiency model because, conditional on the farmer’s human capital (captured by education and age), general agricultural training primarily affects technology awareness rather than the day-to-day input management that determines technical inefficiency.
5. Results and Discussions
The DDF was estimated using both stochastic frontier and deterministic models to model farm efficiency. The stochastic DDF frontier was estimated using Bayesian methods. A deterministic version of the DDF frontier was estimated using mathematical programming (MP) with bootstrapping for comparison with Bayesian results and robustness check. The deterministic version assumes all the deviations from the frontier as technical inefficiency, while the stochastic version allows for both noise and inefficiency components in the deviation. Therefore, we focus on the results from the stochastic DDF frontier estimate.
It is possible that the unobserved factors affecting inefficiency can also influence technology adoption, i.e., farmers who have higher efficiency might be those who are more or less likely to adopt the LLL technology. This correlation is captured by estimate in Table 2. The selection model is estimated using Probit function and the results are presented in Appendix A, Table A1. The Greene [19] stochastic frontier model with sample selection correction addresses bias that arises when unobserved factors influencing adoption decisions are correlated with the error structure of the production frontier. The statistically significant correlation parameter (ρ) confirms that such selection bias is present and that correcting for it is methodologically appropriate. However, this correction does not, by itself, establish that adoption causes the observed frontier shift or inefficiency reduction in the manner of an experimental or quasi-experimental design.
Table 2.
Estimates of the stochastic directional distance function without concavity restriction.
Our estimates represent the conditional productivity differential between adopters and non-adopters after accounting for selection on unobservable captured by the correlation structure. They do not rule out other sources of endogeneity, such as reverse causality (where more productive farmers are more likely to adopt), omitted variables that affect productivity but are uncorrelated with the error structure, or measurement error in inputs and outputs, that could bias the estimated relationship. Consequently, our findings should be interpreted as strong descriptive evidence that LLL is associated with higher productivity and lower technical inefficiency, conditional on observed and certain unobserved characteristics, rather than as definitive proof of a causal effect on productivity. Future research employing instrumental variables, propensity score matching, regression discontinuity, or randomized controlled designs would be valuable to corroborate these associations with causal identification strategies.
The stochastic DDF frontier was estimated with and without concavity assumptions, but below we only discuss results from the non-concave version because the fitness measure suggests that the model with non-concavity assumption has better fit, although there is a strong similarity in most of the results from the concave and non-concave versions. The coefficient estimates for the non-concave version of the DDF are presented in Table 2 and the concave results in Appendix A, Table A2.
The gamma (the ratio of variances values of inefficiency variable and noise term) and lambda (the ratio of the standard deviation values of inefficiency and the noise term) indicate that inefficiency is a significant and the dominant source of variation around the production frontier. Inefficiency accounts for about 85% of the variance of the composite error term of the DDF frontier. The statistically significant and positive or correlation coefficient estimate indicates that the unobserved variables influencing inefficiency also influences LLL adoption decision.
To identify the sources of inefficiency, we investigated the relationship between farm and farmer characteristics, and computed technical inefficiency (TI) indices [56]. Our results indicated that most of the variables were found to be insignificant; therefore, we only included variables shown in Table 2 to keep the model simple. Contrary to our expectation, education was found to have a negative and significant effect on technical efficiency, indicating that farm inefficiency increases with education level. This result supports the findings of Coelli et al. [57] and Chang et al. [70]. This might be because farmers with higher levels of education are more likely to engage in off-farm work and less dependent on farming as the major source of livelihoods. A recent study by Aryal et al. [71] found that agricultural training is more crucial than formal education of the farmer in the case of technology adoption.
Regarding the shifter variables, as expected, the coefficient for LLL is positive and statistically significant. This indicates that the adoption of LLL shifted the production frontier upwards, i.e., adopters of LLL are estimated to have 4% higher productivity than non-adopters. The 4% increase in productivity is an absolute measure, meaning that a farmer adopting LLL could increase outputs and reduce inputs by absolute amounts equal to 4% of the average sample output and inputs. This finding is similar to the findings from experimental data (e.g., [11,72]). Comparing production technology frontiers across the three regions shows that Ludhiana is more productive than Bhatinda. That is, given the same level of inputs, we would expect output to be higher in Ludhiana, followed by Bhatinda. However, the relative productivity of the frontier does not determine the relative efficiency levels, as the latter depends on where the farms in a district operate relative to the relevant frontier. No significant difference is found between Ludhiana and Amritsar.
Since there are many estimates for inputs and outputs, it is easier to get a sense of the importance of the different inputs and outputs. Therefore, we present the sample mean derivative values of the derivatives of each input and output, returns to scale, distance value, and shadow price of irrigation water as shown in Table 3. The results show that both inputs and outputs have the expected signs and are significant. The positive sign for inputs indicates that using more input (outputs and other inputs held constant) would push the farm household away from the frontier, making it more inefficient. Producing more outputs brings the farm household closer to the frontier, making it more efficient. The results show that among the outputs, wheat, and among the inputs, land, have higher mean derivative values. This indicates that wheat and land area are important.
Table 3.
Mean derivative of coefficient estimates of a directional distance function.
For Bayesian estimation, it is common to report standard deviation (SD) and higher posterior density (HPD) instead of standard errors and confidence interval. The significance of estimates is decided based on HPD rather than traditional p-values. HPD in Bayesian statistics is equivalent to p-values in classical econometrics. HPD gives the shortest range, incorporating 95% of the posterior distribution for the parameter of interest. If zero is not in the HPD interval, we can consider that it is equivalent to the p-value in classical statistics being below 5% (there is a less than 5% chance that the parameter value is zero). See, e.g., Fernández et al. [73]; Griffin and Steel [74]; Oum et al. [75] for more.
The model estimates indicate that farm households in the study area exhibit increasing returns to scale (IRTS), with a sample average value of 1.25. It is possible to have IRTS together with technical inefficiency because returns to scale is the characteristic of the technology frontier and relates to how outputs respond to the scaling of input use. In contrast, efficiency shows where the individual farmer stands in terms of performance relative to the estimated frontier. The returns to scale range from 1.17 to 1.32, indicating that all farm households in the sample have IRTS.
In a DDF model, TI is measured by the distance function value termed as distance in Table 3. TI provides a measure of how far the observed point is from the technology frontier with respect to the direction vector used as a numeraire or yardstick [32]. The mean TI is 0.15. This TI score is similar to Pradhan and Mukherjee [16], who estimated the TI for Indian farmers at 14% and slightly lower than Chandel et al. [76], who found TI to be 28% for rice farmers in Uttar Pradesh. This result indicates a considerable level of inefficiency among the sample farm households. The TI estimate of 0.15 is an absolute directional distance from the production frontier, measured along the direction vector normalized by sample mean inputs and outputs reported in Table 1. Under this normalization, the TI of 0.15 indicates that if the average farmer operated efficiently, s/he could have earned 15% higher net revenue while simultaneously achieving a 15% reduction in costs, with the percentages calculated relative to the sample mean values for net revenue and input costs reported in Table 1. The value of the directional inefficiency ranges from 0.01 to 2.18 (Table 4). The TI value of 0 means the producer is operating at the frontier and any value above 0 represents inefficiency. Since the minimum TI is 0.01 none of the households are operating at the frontier. However, 50% of farm households are operating below the median inefficiency (0.099) level.
Table 4.
Distribution of technical inefficiency.
Table 5 presents the results of the DDF measure from Bayesian and Bootstrapped (MP) methods. The mean TI estimate obtained from a Bayesian and bootstrap is 0.15 and 0.25, respectively. The mean TI estimate from the Bayesian estimate is lower than the Bootstrapping result. This divergence arises because the two methods handle the noise inefficiency decomposition differently. The bootstrap is a resampling procedure that replicates the sampling distribution of the frequentist inefficiency predictor. Since it re-estimates the frontier using pseudo-samples, it propagates sampling noise into the inefficiency distribution inflating the mean estimate. In contrast, the Bayesian approach computes the posterior mean of the latent inefficiency variable, E[u|data], which explicitly conditions on the separation between the symmetric noise component (v) and the one-sided inefficiency component (u). The posterior mean acts as a shrinkage estimator that pulls individual farm estimates toward the population mean, thereby filtering out more noise and producing a lower average. The variability of the MP estimates is also much higher than the Bayesian estimates, as reflected in the standard deviation and 95% confidence interval estimates.
Table 5.
Estimated directional distance function measure of technical inefficiency (TI).
The shadow price (SP) for water is estimated using Equation (11). It is estimated by applying the formula to measure the implied trade-off with wheat output or wheat revenue. Wheat was used because its price is more reliable, as the government sets minimum support price for wheat. The minimum support price for wheat in 2014–15 was INR 14/kg (USD 0.22 (1 USD = INR 64.132 in 2015)). The mean of the estimated shadow prices for irrigation water is INR 0.50/mill m3 (0.008 USD/mill m3) and the estimate ranges from 0.232 to 0.834 INR/mill m3 (0.004–0.013 USD/mill m3). The estimated shadow price can be interpreted as the implicit price of non-marketed goods (water). Comparable shadow price estimates based on the frontier approach are not readily available for Punjab. However, there is ample evidence that reflects the SP of water in India can be very low. For instance, Hellegers and Perry [77], estimated SP of USD 0.04/mill m3 for rice production in Haryana. Similarly, Hellegers and Davidson [78] estimated the shadow price of irrigation water in rice production at USD 0.003/mill m3 for the Musi sub-basin, and Smith et al. [26], estimated the SP was USD 0.72/mill m3 in 2012 in Punjab.
In states like Punjab, farmers do not incur any variable cost for water and energy used for irrigation because of free electricity and no cost for irrigation water use. With water priced at zero, profit-maximizing farmers apply water until its marginal product is driven down toward zero. As a result, excessive water usage is prevalent since the only cost is the purchase and installation of irrigation pumps. This leads to a very low or negligible shadow price estimate for water, as evidenced by our results and those from previous studies. At the micro level, due to lack of groundwater market, the availability of groundwater does not constrain agricultural production until it is severely depleted. Additionally, energy used for pumping groundwater is heavily subsidized, which means that farmers lack any incentive to conserve water, leading to the overexploitation of groundwater. Other countries have experienced similar issues. For instance, although China has well-developed institutions that address water price distortions and promote the rational allocation of agricultural water, it faces a similar issue of low water prices. For instance, Yang et al. [79] found that water prices in most parts of China are far below operating and maintenance costs.
6. Policy Implications
Our results have some important policy implications, which are as follows:
Firstly, policymakers associated with agriculture and water resource management need to carefully consider the importance of setting realistic prices for irrigation water used in agriculture. Given the depletion of groundwater resources in major crop producing areas of the country, India needs to evaluate multiple possible options to enhance water resource management in agriculture. In many cases, there are possibilities that the tradeoffs occur between profitable crop production and improved water resource management. Hence, it requires evaluating multiple possible scenarios and these can vary across the locations.
Secondly, market distortions need to be properly addressed. For past several years, due to inappropriate government interventions such as the provision of unmetered/flat-rated electricity, the perceived marginal pumping cost is closely zero for farmers. Additionally, the absence of volumetric water pricing and groundwater markets in the study districts, and the open-access nature of the aquifer, have led to the inefficient use of groundwater resources in agriculture. Therefore, policymakers and the other stakeholders in agriculture need to rethink the existing policies that affect water resource depletion and also reduce farm performance. There is a need to rethink the proper use of economic instruments so that market distortions can be minimal and resource depleting behavior is not encouraged.
Thirdly, given that productivity is higher when farmers adopted water-efficient technology, interlinking economic instruments with the adoption of natural resource management practices and technologies in agriculture can be a policy departure for efficient and sustainable water resource management in agriculture.
7. Conclusions
This study examines the economics of water resource management in agriculture using data from the Punjab state of India. In order to examine this, we applied the multiple-output–multiple input framework and investigated the degree and source of technical inefficiency, along with the productivity effect of water-efficient technology adoption and the shadow price of irrigation water. To examine these objectives, we first estimated DDF jointly with an adoption model to address potential self-selection bias in adoption of LLL, to estimate inefficiency robustly. Then, a duality relationship between DDF and the profit function was used to derive the shadow price of irrigation water. With these estimations, we tried to answer our two research questions related to water resource management in agriculture.
Firstly, we conclude that water-efficient technology adoption and/or reducing inefficiency in production can reduce inefficient use of irrigation water. Our results indicate the presence of a substantial level of inefficiency (0.15) in farming, implying the possibility of increasing the economic performance of farming and reducing the inefficient use of irrigation water through eliminating technical inefficiency. Additionally, the adoption of water-efficient technology such as laser land levelers has increased farm productivity by 4%, indicating that proper technology choice contributes towards both higher economic performance and improved water resource management in agriculture. Among the districts under study, Ludhiana is found to be more productive than Bhatinda. It suggests that given the same level of inputs, the level of output to be achieved will be higher for Ludhiana, followed by Bhatinda.
Secondly, we conclude that a very low shadow price of irrigation water has some serious implications for water resource management in agriculture associated with market price distortions. The estimated shadow price of irrigation water USD 0.008/mill m3. This result suggests that at the farm level, farmers do not consider irrigation water as constraint and assume that it is freely accessible to all. Contrary to this perception, groundwater depletion has already become a national concern in India. Despite this, it remains inadequately comprehended by farmers in the study areas. Hence, there is a need for more understanding among farmers and key stakeholders about the importance of groundwater resources in sustaining agriculture. This is also crucial to design policy and other economic incentive structures needed to enhance the efficient management of water in agriculture sector.
Author Contributions
Conceptualization: S.M., J.P.A. and A.H.; Methodology: S.M., A.H. and J.P.A.; Software: S.M. and A.H.; Validation: S.M. and A.H.; Formal Analysis: S.M. and A.H.; Investigation: J.P.A. and S.M.; Resources: S.M., J.P.A. and M.F.R.-R.; Data Curation: S.M. and A.H.; Writing—Original Draft Preparation: S.M., J.P.A., A.H., R.P. and M.F.R.-R.; Writing—Review and Editing: S.M., J.P.A., A.H., R.P. and M.F.R.-R.; Supervision: A.H., R.P. and M.F.R.-R.; Project Administration: J.P.A.; Funding Acquisition (field survey and project): J.P.A.; Funding acquisition (data analysis and write up): S.M., A.H., R.P. and M.F.R.-R. All authors have read and agreed to the published version of the manuscript.
Funding
This research was funded by the International Maize and Wheat Improvement Center (CIMMYT), Mexico under the support of the CGIAR Research Programs (CRPs) on Climate Change, Agriculture, and Food Security (CCAFS) and Wheat Agri-Food Systems (CRP WHEAT).
Data Availability Statement
The data supporting the findings of this study are available from the corresponding author upon reasonable request.
Acknowledgments
The authors acknowledge the support of the CGIAR Research Programs (CRPs) on Climate Change, Agriculture and Food Security (CCAFS) and Wheat Agri-Food Systems (CRP WHEAT) for this study. Thanks also to all field staffs for their sincere efforts while collecting data in Punjab state of India. We sincerely acknowledge the support from the farmers and the field staff. The views expressed here are those of the authors and do not necessarily reflect the views of the funders or associated institutions. The usual disclaimer applies and the authors are responsible for any remaining errors and inferences. The authors have reviewed and edited the output and take full responsibility for the content of this publication.
Conflicts of Interest
The authors declare no conflicts of interest.
Appendix A
Table A1.
Results of selection (Probit) model.
Table A2.
Estimates of the stochastic directional distance function with concavity restriction.
Appendix B
The shadow price is a technological shadow value. The water shadow prices reported above are derived from the directional distance function via duality, and as such are technological shadow values: they measure the marginal rate of transformation between water and the chosen numéraire implied by the estimated production frontier, not a market price. Formally, for the directional distance function , where denotes variable inputs, applied irrigation water, output, input prices and output prices the shadow price of water relative to numéraire output (e.g., wheat) is
Three implications follow. First, the level of depends on the production technology, the output and input prices entering revenue, water productivity at the observed input mix, and the choice of and numéraire. A low value is therefore not, by itself, diagnostic of anything. Water may be a weakly limiting factor given complementary inputs, the crop in question may be low-valued, or the normalization may scale the magnitude. Second, what is invariant to the normalization are the relative shadow prices across crops, districts, or depletion regimes, and their comparison with an appropriately defined cost benchmark. Our policy claims rest exclusively on these invariant objects. Third, because farmers face no volumetric water price, no behavioral (market-clearing) interpretation of is available from the estimation itself.
The price–cost wedge, not the shadow-price level, identifies the distortion. The farmer’s static optimality condition equates the marginal value product of water to its marginal private cost:
Under cost minimization, estimated estimates , the distortion measure is therefore the wedge (, not the level of alone. With water priced at zero, profit-maximizing farmers apply water until its marginal product is driven down toward zero, so a low estimated shadow price is precisely what the subsidy regime predicts, but establishing that this low value represents misallocation rather than genuine abundance requires the institutional comparison.
The shadow price of water () is interpreted as an allocative distortion on the basis of three features of the institutional environment, none of which is estimated here: (i) electricity for irrigation is unmetered or flat-rated, so perceived by the farmer is near zero; (ii) there is no volumetric water price and no functioning groundwater market in the study districts, so no alternative price signal disciplines extraction; and (iii) groundwater is an open-access resource, so no scarcity rent is internalized. Under these conditions, , measures the marginal value foregone by the absence of a water price. We avoid causal language regarding the level of . We claim only that the wedge, the cross-crop rankings, and their variation with water-table depth quantify the value at stake under the existing regime.
Appendix C
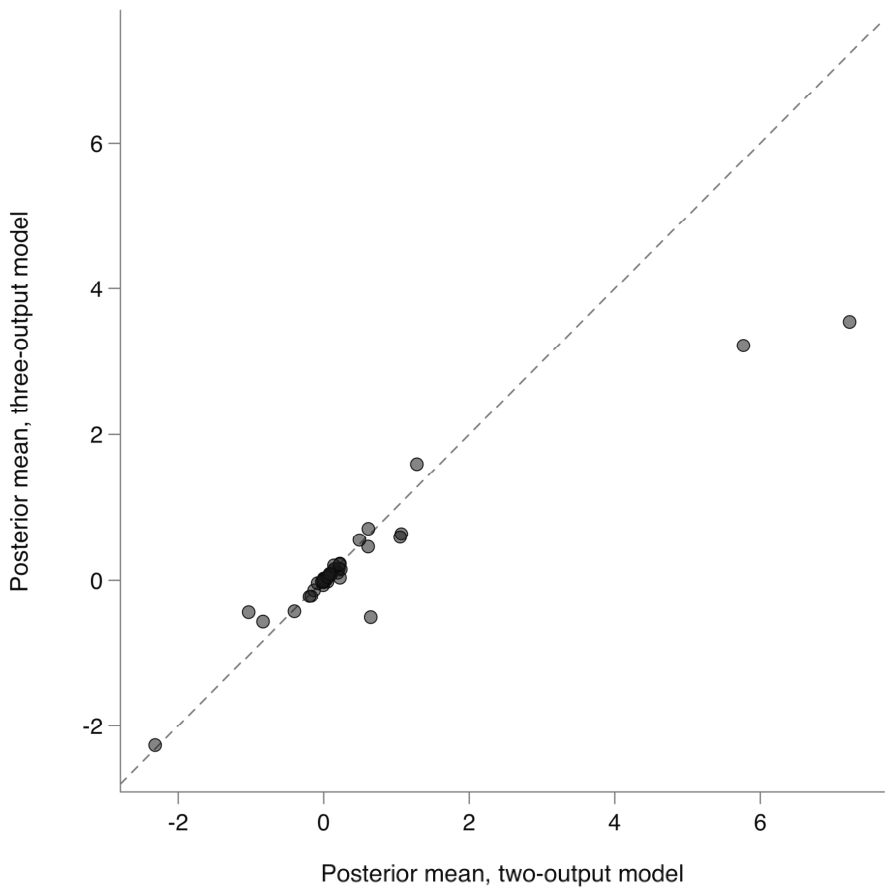
In order to check how sensitive the efficiency and elasticity estimates are to output aggregation, we estimated a model with 3 outputs that does not require aggregating rice and cotton but uses output direction vectors consistent with what is grown in the district. The results show that the efficiency and coefficient estimate from the three-output model are highly consistent with those obtained from the two-output model. The correlation coefficient between the efficiency estimates from the two approaches is 93%, indicating that the two-output model does not yield a different story from the three-output model. A plot of the coefficient and efficiency estimate is presented below for the two-output vs. three-output models.
Figure A1.
Inefficiency comparison between 2 and 3 output models.
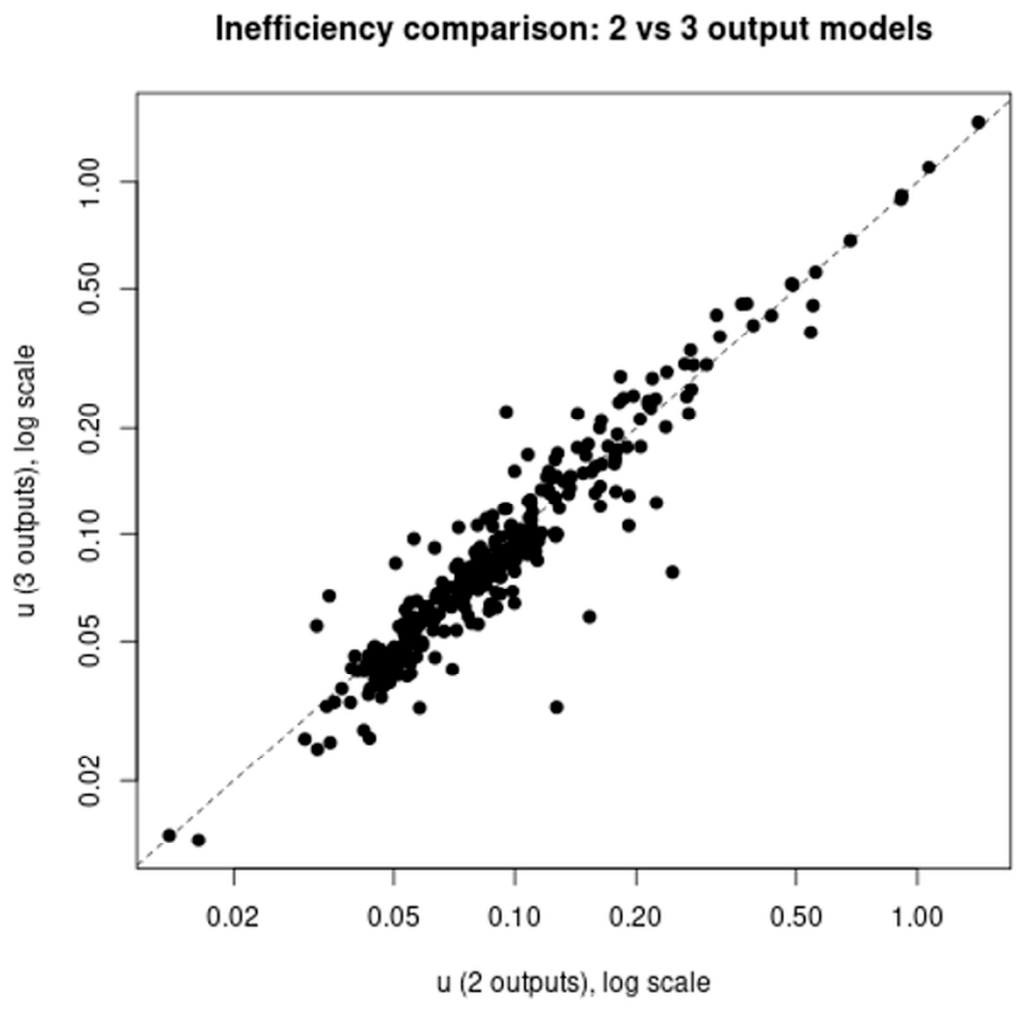
Figure A2.
Coefficients value comparison between 2 and 3 outputs models.
References
- Government of Punjab. Punjab Economic Survey. 2022. Available online: http://www.esopb.gov.in/ (accessed on 7 July 2026).
- Sidhu, B.S.; Sharda, R.; Singh, S. Spatio-temporal assessment of groundwater depletion in Punjab, India. Groundw. Sustain. Dev. 2021, 12, 100498. [Google Scholar] [CrossRef] [Scilit]
- Gleeson, T.; Wada, Y.; Bierkens, M.F.P.; Van Beek, L.P.H. Water balance of global aquifers revealed by groundwater footprint. Nature 2012, 488, 197–200. [Google Scholar] [CrossRef] [Scilit]
- He, J.; Chen, X.; Shi, Y.; Li, A. Dynamic Computable General Equilibrium Model and Sensitivity Analysis for Shadow Price of Water Resource in China. Water Resour. Manag. 2007, 21, 1517–1533. [Google Scholar] [CrossRef] [Scilit]
- Liu, X.; Chen, X.; Wang, S. Evaluating and Predicting Shadow Prices of Water Resources in China and Its Nine Major River Basins. Water Resour. Manag. 2009, 23, 1467–1478. [Google Scholar] [CrossRef] [Scilit]
- Ziolkowska, J.R. Shadow price of water for irrigation—A case of the High Plains. Agric. Water Manag. 2015, 153, 20–31. [Google Scholar] [CrossRef] [Scilit]
- Abdullaev, I.; Ul Hassan, M.; Jumaboev, K. Water saving and economic impacts of land leveling: The case study of cotton production in Tajikistan. Irrig. Drain. Syst. 2007, 21, 251–263. [Google Scholar] [CrossRef] [Scilit]
- Jat, M.L.; Gathala, M.K.; Ladha, J.K.; Saharawat, Y.S.; Jat, A.S.; Kumar, V.; Sharma, S.K.; Kumar, V.; Gupta, R. Evaluation of precision land leveling and double zero-till systems in the rice–wheat rotation: Water use, productivity, profitability and soil physical properties. Soil Tillage Res. 2009, 105, 112–121. [Google Scholar] [CrossRef] [Scilit]
- Jat, M.; Gupta, R.; Ramasundaram, P.; Gathala, M.; Sidhu, H.; Singh, S.; Singh, R.G.; Saharawat, Y.; Kumar, V.; Chandna, P. Laser assisted precision land leveling: A potential technology for resource conservation in irrigated intensive production systems of Indo-Gangetic plains (chapter 8). In Integrated Crop and Resource Management in the Rice-Wheat System of South Asia; Ladha, J.K., Yadvinder-Singh, E.O., Hardy, B., Eds.; International Rice Research Institute: Los Banos, Philippines, 2009; pp. 223–236. Available online: https://www.adb.org/publications/integrated-crop-and-resource-management-rice-wheat-system-south-asia (accessed on 7 March 2024).
- Aryal, J.P.; Mehrotra, M.B.; Jat, M.L.; Sidhu, H.S. Impacts of laser land leveling in rice–wheat systems of the north–western indo-gangetic plains of India. Food Secur. 2015, 7, 725–738. [Google Scholar] [CrossRef] [Scilit]
- Naresh, R.K.; Bhatt, R.; Chandra, M.S.; Laing, A.M.; Gaber, A.; Sayed, S.; Hossain, A. Soil Organic Carbon and System Environmental Footprint in Sugarcane-Based Cropping Systems Are Improved by Precision Land Leveling. Agronomy 2021, 11, 1964. [Google Scholar] [CrossRef] [Scilit]
- Bibi, Z.; Khan, D.; Haq, I.U. Technical and environmental efficiency of agriculture sector in South Asia: A stochastic frontier analysis approach. Environ. Dev. Sustain. 2021, 23, 9260–9279. [Google Scholar] [CrossRef] [Scilit]
- Chan, C.; Sipes, B.; Ayman, A.; Zhang, X.; LaPorte, P.; Fernandes, F.; Pradhan, A.; Chan-Dentoni, J.; Roul, P. Efficiency of Conservation Agriculture Production Systems for Smallholders in Rain-Fed Uplands of India: A Transformative Approach to Food Security. Land 2017, 6, 58. [Google Scholar] [CrossRef] [Scilit]
- Coelli, T.J.; Battese, G.E. Identification of Factors Which Influence the Technical Inefficiency of Indian Farmers. Aust. J. Agric. Econ. 1996, 40, 103–128. [Google Scholar] [CrossRef] [Scilit]
- Huang, C.J.; Bagi, F.S. Technical Efficiency on Individual Farms in Northwest India. South. Econ. J. 1984, 51, 108–115. [Google Scholar] [CrossRef] [Scilit]
- Pradhan, K.C.; Mukherjee, S. Examining Technical Efficiency in Indian Agricultural Production Using Production Frontier Model. S. Asia Econ. J. 2018, 19, 22–42. [Google Scholar] [CrossRef] [Scilit]
- Jha, R.; Chitkara, P.; Gupta, S. Productivity, technical and allocative efficiency and farm size in wheat farming in India: A DEA approach. Appl. Econ. Lett. 2000, 7, 1–5. [Google Scholar] [CrossRef] [Scilit]
- Kalirajan, K.P.; Obwona, M.B.; Zhao, S. A Decomposition of Total Factor Productivity Growth: The Case of Chinese Agricultural Growth before and after Reforms. Am. J. Agric. Econ. 1996, 78, 331–338. [Google Scholar] [CrossRef] [Scilit]
- Greene, W. A stochastic frontier model with correction for sample selection. J. Product. Anal. 2010, 34, 15–24. [Google Scholar] [CrossRef] [Scilit]
- Krishna, V.V.; Veettil, P.C. Productivity and efficiency impacts of conservation tillage in northwest Indo-Gangetic Plains. Agric. Syst. 2014, 127, 126–138. [Google Scholar] [CrossRef] [Scilit]
- Aravindakshan, S.; Rossi, F.; Amjath-Babu, T.S.; Veettil, P.C.; Krupnik, T.J. Application of a bias-corrected meta-frontier approach and an endogenous switching regression to analyze the technical efficiency of conservation tillage for wheat in South Asia. J. Product. Anal. 2018, 49, 153–171. [Google Scholar] [CrossRef] [Scilit]
- Khanal, U.; Wilson, C.; Rahman, S.; Lee, B.L.; Hoang, V.-N. Smallholder farmers’ adaptation to climate change and its potential contribution to UN’s sustainable development goals of zero hunger and no poverty. J. Clean. Prod. 2021, 281, 124999. [Google Scholar] [CrossRef] [Scilit]
- Paz, B.; Hailu, A.; Rola-Rubzen, M.F.; Rashid, M.M. Conservation agriculture-based sustainable intensification improves technical efficiency in Northern Bangladesh: The case of Rangpur. Aust. J. Agric. Resour. Econ. 2024, 68, 125–145. [Google Scholar] [CrossRef] [Scilit]
- Zheng, H.; Ma, W.; Wang, F.; Li, G. Does internet use improve technical efficiency of banana production in China? Evidence from a selectivity-corrected analysis. Food Policy 2021, 102, 102044. [Google Scholar] [CrossRef] [Scilit]
- Bierkens, M.F.P.; Reinhard, S.; De Bruijn, J.A.; Veninga, W.; Wada, Y. The Shadow Price of Irrigation Water in Major Groundwater-Depleting Countries. Water Resour. Res. 2019, 55, 4266–4287. [Google Scholar] [CrossRef] [Scilit]
- Smith, R.B.W.; Nelson, H.; Roe, T.L. Groundwater and Economic Dynamics, Shadow Rents and Shadow Prices: The Punjab. Water Econ. Policy 2015, 01, 1550014. [Google Scholar] [CrossRef] [Scilit]
- Kamruzzaman, M.; Islam, M.H. Technical efficiency of wheat growers in some selected sites of Dinajpur district of Bangladesh. Bangladesh J. Agric. Res. 2008, 33, 363–373. [Google Scholar]
- Khataza, R.R.B.; Hailu, A.; Kragt, M.E.; Doole, G.J. Estimating shadow price for symbiotic nitrogen and technical efficiency for legume-based conservation agriculture in Malawi. Aust. J. Agric. Resour. Econ. 2017, 61, 462–480. [Google Scholar] [CrossRef] [Scilit]
- Khataza, R.R.B.; Hailu, A.; Doole, G.J.; Kragt, M.E.; Alene, A.D. Examining the relationship between farm size and productive efficiency: A Bayesian directional distance function approach. Agric. Econ. 2019, 50, 237–246. [Google Scholar] [CrossRef] [Scilit]
- Rahman, S.; Anik, A.R. Productivity and efficiency impact of climate change and agroecology on Bangladesh agriculture. Land Use Policy 2020, 94, 104507. [Google Scholar] [CrossRef] [Scilit]
- Yu-Ying Lin, E.; Chen, P.-Y.; Chen, C.-C. Measuring the environmental efficiency of countries: A directional distance function metafrontier approach. J. Environ. Manag. 2013, 119, 134–142. [Google Scholar] [CrossRef] [Scilit]
- Hailu, A.; Chambers, R.G. A Luenberger soil-quality indicator. J. Product. Anal. 2012, 38, 145–154. [Google Scholar] [CrossRef] [Scilit]
- Sahoo, B.K.; Mehdiloozad, M.; Tone, K. Cost, revenue and profit efficiency measurement in DEA: A directional distance function approach. Eur. J. Oper. Res. 2014, 237, 921–931. [Google Scholar] [CrossRef] [Scilit]
- Xu, Y.; Park, Y.S.; Park, J.D.; Cho, W. Evaluating the environmental efficiency of the U.S. airline industry using a directional distance function DEA approach. J. Manag. Anal. 2021, 8, 1–18. [Google Scholar] [CrossRef] [Scilit]
- Kumbhakar, S.C.; Orea, L.; Rodríguez-Álvarez, A.; Tsionas, E.G. Do we estimate an input or an output distance function? An application of the mixture approach to European railways. J. Product. Anal. 2007, 27, 87–100. [Google Scholar] [CrossRef] [Scilit]
- Rahman, S. Whether crop diversification is a desired strategy for agricultural growth in Bangladesh? Food Policy 2009, 34, 340–349. [Google Scholar] [CrossRef] [Scilit]
- Cuesta, R.A.; Lovell, C.A.K.; Zofío, J.L. Environmental efficiency measurement with translog distance functions: A parametric approach. Ecol. Econ. 2009, 68, 2232–2242. [Google Scholar] [CrossRef] [Scilit]
- Rosano Peña, C.; Serrano, A.L.M.; De Britto, P.A.P.; Franco, V.R.; Guarnieri, P.; Thomé, K.M. Environmental preservation costs and eco-efficiency in Amazonian agriculture: Application of hyperbolic distance functions. J. Clean. Prod. 2018, 197, 699–707. [Google Scholar] [CrossRef] [Scilit]
- Bai, Y.; Deng, X.; Jiang, S.; Zhao, Z.; Miao, Y. Relationship between climate change and low-carbon agricultural production: A case study in Hebei Province, China. Ecol. Indic. 2019, 105, 438–447. [Google Scholar] [CrossRef] [Scilit]
- Färe, R.; Grosskopf, S.; Margaritis, D. Efficiency and Productivity: Malmquist and More. In The Measurement of Productive Efficiency and Productivity Change; Fried, H.O., Lovell, C.A.K., Schmidt, S.S., Eds.; Oxford University Press: Oxford, UK, 2008; pp. 522–622. [Google Scholar] [CrossRef] [Scilit]
- Färe, R.; Grosskopf, S.; Roland, B.-E.; Weber, W.L. License Fees: The Case of Norwegian Salmon Farming. Aquac. Econ. Manag. 2009, 13, 1–21. [Google Scholar] [CrossRef] [Scilit]
- Buttinelli, R.; Cortignani, R.; Caracciolo, F. Irrigation water economic value and productivity: An econometric estimation for maize grain production in Italy. Agric. Water Manag. 2024, 295, 108757. [Google Scholar] [CrossRef] [Scilit]
- Molinos-Senante, M.; Maziotis, A.; Sala-Garrido, R. Estimating the cost of improving service quality in water supply: A shadow price approach for England and wales. Sci. Total Environ. 2016, 539, 470–477. [Google Scholar] [CrossRef] [Scilit]
- Mu, Y.; Shen, Z.; Vardanyan, M. Shadow-pricing of greenhouse gas emissions on multiple levels of production frontiers: An application to global crop production. J. Product. Anal. 2026, 65, 38. [Google Scholar] [CrossRef] [Scilit]
- Shen, X.; Lin, B. The shadow prices and demand elasticities of agricultural water in China: A StoNED-based analysis. Resour. Conserv. Recycl. 2017, 127, 21–28. [Google Scholar] [CrossRef] [Scilit]
- Smith, A. Shadow Price Calculations in Distorted Economies. Scand. J. Econ. 1987, 89, 287–302. [Google Scholar] [CrossRef] [Scilit]
- Wuyts, W. Market Distortions Encouraging Wasteful Consumption. In Responsible Consumption and Production; Encyclopedia of the UN Sustainable Development Goals; Leal Filho, W., Azul, A.M., Brandli, L., Özuyar, P.G., Wall, T., Eds.; Springer International Publishing: Cham, Switzerland, 2020; pp. 443–453. [Google Scholar] [CrossRef] [Scilit]
- Koop, G.; Osiewalski, J.; Steel, M.F.J. Bayesian efficiency analysis through individual effects: Hospital cost frontiers. J. Econom. 1997, 76, 77–105. [Google Scholar] [CrossRef] [Scilit]
- O’Donnell, C.J.; Coelli, T.J. A Bayesian approach to imposing curvature on distance functions. J. Econom. 2005, 126, 493–523. [Google Scholar] [CrossRef] [Scilit]
- Hailu, A. A Package for Productivity and Efficiency Analysis in R (Apear); The University of Western Australia: Perth, WA, Australia, 2013. [Google Scholar]
- Chambers, R.G.; Chung, Y.; Färe, R. Benefit and distance functions. J. Econ. Theory 1996, 70, 407–419. [Google Scholar] [CrossRef] [Scilit]
- Gauch, H.G. Scientific Method in Practice; Cambridge University Press: Cambridge, UK, 2003. [Google Scholar]
- Gauch, H.G. Prediction, parsimony and noise. Am. Sci. 1993, 81, 468–478. [Google Scholar]
- Abdulai, A.-N.; Abdulai, A. Examining the impact of conservation agriculture on environmental efficiency among maize farmers in Zambia. Environ. Dev. Econ. 2017, 22, 177–201. [Google Scholar] [CrossRef] [Scilit]
- Abdulai, A.; Owusu, V.; Goetz, R. Land tenure differences and investment in land improvement measures: Theoretical and empirical analyses. J. Dev. Econ. 2011, 96, 66–78. [Google Scholar] [CrossRef] [Scilit]
- Bravo-Ureta, B.E.; Pinheiro, A.E. Technical, Economic, and Allocative Efficiency in Peasant Farming: Evidence from the Dominican Republic. Dev. Econ. 1997, 35, 48–67. [Google Scholar] [CrossRef] [Scilit]
- Coelli, T.; Rahman, S.; Thirtle, C. A stochastic frontier approach to total factor productivity measurement in Bangladesh crop agriculture, 1961–92. J. Int. Dev. 2003, 15, 321–333. [Google Scholar] [CrossRef] [Scilit]
- Asante, B.O.; Villano, R.A.; Battese, G.E. Evaluating complementary synergies in integrated crop-livestock systems in Ghana. Int. J. Soc. Econ. 2019, 47, 72–85. [Google Scholar] [CrossRef] [Scilit]
- Aryal, J.P.; Khatri-Chhetri, A.; Sapkota, T.B.; Rahut, D.B.; Erenstein, O. Adoption and economic impacts of laser land leveling in the irrigated rice-wheat system in Haryana, India using endogenous switching regression. Nat. Resour. Forum 2020, 44, 255–273. [Google Scholar] [CrossRef] [Scilit]
- Keil, A.; D’souza, A.; McDonald, A. Zero-tillage is a proven technology for sustainable wheat intensification in the Eastern Indo-Gangetic Plains: What determines farmer awareness and adoption? Food Secur. 2017, 9, 723–743. [Google Scholar] [CrossRef] [Scilit]
- Gulati, K.; Lybbert, T.J.; Spielman, D.J. Diffusing to level fields: Evolution of laser land leveling technology markets in India. In Proceedings of the 2017 Agricultural & Applied Economics Association Annual Meeting, Chicago, IL, USA, 30 July–1 August 2017. [Google Scholar]
- Sheikh, A.T.; Mugera, A.; Pandit, R.; Burton, M.; Davies, S. The adoption of laser land leveler technology and its impact on groundwater use by irrigated farmland in Punjab, Pakistan. Land Degrad. Dev. 2022, 33, 2026–2038. [Google Scholar] [CrossRef] [Scilit]
- Foster, A.D.; Rosenzweig, M.R. Microeconomics of Technology Adoption. Annu. Rev. Econ. 2010, 2, 395–424. [Google Scholar] [CrossRef] [Scilit]
- Pannell, D.J.; Marshall, G.R.; Barr, N.; Curtis, A.; Vanclay, F.; Wilkinson, R. Understanding and promoting adoption of conservation practices by rural landholders. Aust. J. Exp. Agric. 2006, 46, 1407–1424. [Google Scholar] [CrossRef] [Scilit]
- D’Emden, F.H.; Llewellyn, R.S.; Burton, M.P. Adoption of conservation tillage in Australian cropping regions: An application of duration analysis. Technol. Forecast. Soc. Change 2006, 73, 630–647. [Google Scholar] [CrossRef] [Scilit]
- Knowler, D.; Bradshaw, B. Farmers’ adoption of conservation agriculture: A review and synthesis of recent research. Food Policy 2007, 32, 25–48. [Google Scholar] [CrossRef] [Scilit]
- Aryal, J.P.; Rahut, D.B.; Jat, M.L.; Maharjan, S.; Erenstein, O. Factors determining the adoption of laser land leveling in the irrigated rice–wheat system in Haryana, India. J. Crop Improv. 2018, 32, 477–492. [Google Scholar] [CrossRef] [Scilit]
- Croppenstedt, A.; Demeke, M.; Meschi, M.M. Technology adoption in the presence of constraints: The case of fertilizer demand in Ethiopia. Rev. Dev. Econ. 2003, 7, 58–70. [Google Scholar] [CrossRef] [Scilit]
- Kassie, M.; Jaleta, M.; Shiferaw, B.; Mmbando, F.; Mekuria, M. Adoption of interrelated sustainable agricultural practices in smallholder systems: Evidence from rural Tanzania. Technol. Forecast. Soc. Change 2013, 80, 525–540. [Google Scholar] [CrossRef] [Scilit]
- Chang, M.; Liu, J.; Shi, H.; Guo, T. The Effect of Off-Farm Employment on Agricultural Production Efficiency: Micro Evidence in China. Sustainability 2022, 14, 3385. [Google Scholar] [CrossRef] [Scilit]
- Aryal, J.P.; Becerra Lopez-Lavalle, L.A.; El-Naggar, A.H. Crop Loss Due to Soil Salinity and Agricultural Adaptations to It in the Middle East and North Africa Region. Resources 2025, 14, 139. [Google Scholar] [CrossRef] [Scilit]
- Sapkal, S.; Deshmukh, B.; Kumar, P.; Kar, A.; Jha, G. Impact of laser land levelling technology on ricewheat production in Haryana. Int. J. Chem. Stud. 2019, 7, 641–646. [Google Scholar]
- Fernández, C.; Koop, G.; Steel, M.F.J. Multiple-Output Production with Undesirable Outputs: An Application to Nitrogen Surplus in Agriculture. J. Am. Stat. Assoc. 2002, 97, 432–442. [Google Scholar] [CrossRef] [Scilit]
- Griffin, J.E.; Steel, M.F.J. Bayesian stochastic frontier analysis using WinBUGS. J. Product. Anal. 2007, 27, 163–176. [Google Scholar] [CrossRef] [Scilit]
- Oum, T.H.; Yan, J.; Yu, C. Ownership forms matter for airport efficiency: A stochastic frontier investigation of worldwide airports. J. Urban Econ. 2008, 64, 422–435. [Google Scholar] [CrossRef] [Scilit]
- Chandel, R.B.S.; Khan, A.; Li, X.; Xia, X. Farm-Level Technical Efficiency and Its Determinants of Rice Production in Indo-Gangetic Plains: A Stochastic Frontier Model Approach. Sustainability 2022, 14, 2267. [Google Scholar] [CrossRef] [Scilit]
- Hellegers, P.J.; Perry, C.J. Water as an Economic Good in Irrigated Agriculture: Theory and Practice; 2004 Report 3.04.12; Agricultural Economics Research Institute (LEI): Helsinki, Finland, 2004. [Google Scholar]
- Hellegers, P.; Davidson, B. Determining the disaggregated economic value of irrigation water in the Musi sub-basin in India. Agric. Water Manag. 2010, 97, 933–938. [Google Scholar] [CrossRef] [Scilit]
- Yang, X.; Hou, M.; Wang, J.; Zhang, X.; Weng, S. Integrated agricultural water pricing reform (IAWPR) in China: A state-of-the-art review with focus on strategic significance, policy design, reform process and case reform effect. Water Policy 2022, 24, 242–260. [Google Scholar] [CrossRef] [Scilit]

Disclaimer/Publisher’s Note: The statements, opinions and data contained in all publications are solely those of the individual author(s) and contributor(s) and not of MDPI and/or the editor(s). MDPI and/or the editor(s) disclaim responsibility for any injury to people or property resulting from any ideas, methods, instructions or products referred to in the content. |
© 2026 by the authors. Licensee MDPI, Basel, Switzerland. This article is an open access article distributed under the terms and conditions of the Creative Commons Attribution (CC BY) license.