


Highlights
Please indicate how your work links to systems science via your contributions to systems practice, theory, and/or methodology.
- The study treats a national smart port equipment programme not as a single-sector engineering project but as an impulse propagating through a structured system of interdependent industries, showing that the material, value, and employment consequences of one intervention are borne by structurally different parts of the economy.
- It contributes a reproducible systems methodology for composite technology programmes: the programme is delineated by explicit membership at the level of the 380 basic sectors (disaggregation rather than aggregation of parent groups), exogenously specified to exclude self-effects, and estimated on the total and domestic transaction tables in parallel, in demand-driven and supply-driven form—a procedure transferable to any programme whose activity is scattered across several industries.
What are the main findings and/or the implications of the main findings?
- A KRW 1 increase in programme output induces KRW 0.8358 of production and KRW 0.2958 of value added in other industries, and KRW 1 billion induces 2.9758 jobs; on the domestic table these fall to KRW 0.5163, KRW 0.1872 and 1.9912 jobs, so roughly two-fifths of the gross inducement leaks abroad—and that leakage is concentrated in the upstream mineral and material supply chain, which is where a self-reliance objective is most exposed.
- The three inducement channels diverge systematically: production inducement falls upstream (chemicals, primary metals, mining) while value-added and employment inducement fall downstream (wholesale and retail, business support services). Single-channel appraisal therefore misstates where a programme’s effects land, and policies seeking employment returns should attend to the deployment and service layer rather than to equipment fabrication alone.
Abstract
Countries operating major container ports without a domestic equipment supply base are pursuing self-reliance in smart port technology, but such programmes are hard to assess because their effects diffuse across the economy through inter-industry linkages. This study estimates inducement coefficients for the Korean Smart Port Technology Self-Reliance Equipment Development Project. Using the 2023 Input–Output Tables of the Bank of Korea, the programme is defined at the basic-sector level: 67 of the 380 basic sectors, spanning port equipment manufacture, construction, logistics services, software, and R&D, are extracted from their parent groups and consolidated into one sector, leaving the unrelated residuals endogenous. That sector is exogenously specified, capturing only repercussions on the remaining 33 sectors. A KRW 1 increase in programme output induces KRW 0.8358 of production and KRW 0.2958 of value added elsewhere, and KRW 1 billion induces 2.9758 jobs; on the domestic table these fall to KRW 0.5163, KRW 0.1872, and 1.9912 jobs, so about two-fifths of the gross inducement leaks abroad through imports. Production inducement falls upstream in materials, value-added, and employment inducement downstream in services. On the supply side, a KRW 1 shortfall in the sector’s domestic supply disrupts KRW 0.4013 of production among its users, and the sector shows the highest forward-linkage sensitivity of the 34-sector system. Eleven alternative delineations leave the structural findings unchanged. The coefficient vector is reported in full, so the estimates are reproducible.
1. Introduction
Maritime ports occupy a structurally distinctive position in national economies [1,2]. They are not merely nodes at which cargo changes mode, but complex socio-technical systems in which heavy capital equipment, civil infrastructure, information, and communication technology (ICT), logistics services, labour, and regulation are tightly coupled. Since roughly four-fifths of global merchandise trade by volume moves by sea [3], the performance of this system propagates into the competitiveness of the industries it serves [4,5,6,7]. Port modernisation programmes are therefore unlikely to be assessed adequately when treated as isolated engineering projects, as their consequences are distributed across a wide set of industries whose connections remain invisible in project-level accounting.
Over the past decade, the notion of the “smart port” has consolidated this systemic view [8,9,10,11,12]. A smart port integrates automated container handling equipment—automated stacking cranes, automated guided vehicles, and remote-controlled quay cranes—with digital twins, terminal operating systems, sensor networks, and data-driven decision support, so that the physical and informational layers of terminal operation are jointly optimised [13]. The economic rationale is relatively direct: automation and digitalisation raise berth productivity, shorten dwell times, reduce accident rates and lower emissions per unit of throughput [14,15]. The systems rationale is subtler. Because the smart port bundles equipment, construction, ICT, and services into a single technological package, an intervention directed at one layer tends to mobilise the others.
For countries that operate globally significant container ports without a domestic supply base for the associated equipment, this coupling may constitute a strategic vulnerability. The Republic of Korea is a salient case. Korean ports handle very large container volumes and Korean shipbuilding retains internationally competitive capability, yet the core automated handling equipment installed in Korean terminals has been procured predominantly from a small number of foreign suppliers. The resulting dependence is not solely a matter of price. It may expose terminal operators to supply disruption, constrain the customisation of equipment to domestic operating conditions, and create uncertainty over maintenance and spare-part lifecycles, and because terminal operating systems and equipment control systems exchange operational data continuously, it also raises questions of security and data sovereignty. Against this background, the Korean government has pursued a Smart Port Technology Self-Reliance Equipment Development Project [16], whose purpose is to establish domestic design, manufacturing, integration and operational capability for smart port equipment.
Programmes of this kind pose a distinctive evaluation problem. Much of what such a programme sets in motion lies not in the output of the funded sector itself but in the activity that output induces elsewhere: the chemical and metal inputs drawn into equipment fabrication, the engineering work required for installation, the distribution and business services that accompany deployment, and the employment generated across all of these. An assessment that counts only the direct output of the equipment sector is likely to understate the programme; one that counts the sector’s own output as an induced benefit double-counts it. What is required is a framework that traces the repercussions of the programme through the structure of inter-industry transactions while explicitly excluding its self-effects. The coefficients such a framework yields are per-unit measures: converting them into a monetary benefit for a specific programme requires, in addition, that programme’s output change, which is not estimated here.
Inter-industry analysis, developed by Leontief [17,18] and formalised for applied policy work by Miller and Blair [19], provides such a framework. The input–output table records, for a given period, the complete set of transactions through which each industry purchases intermediate goods and services and sells its output to other industries and to final demand. From this table, the Leontief inverse recovers the direct and indirect production required throughout the economy to sustain a given change in output. Coupling the inverse with value-added and employment coefficients extends the same logic to value creation and job creation. Of particular relevance to the present problem, an industry of interest can be exogenously specified—removed from the endogenous system and treated as an external driver—so that the effects measured are those on other industries alone.
A substantial applied literature has used this framework to characterise the economic role of maritime and technology-intensive industries [20,21,22]. For Korea, exogenous-specification studies exist for the maritime industry [23] and for shipbuilding [24], together with input–output assessments of port investment [25], and the same approach has recently been applied to composite technology industries such as connected and autonomous vehicles [26], smart farming [27], logistics [28] and smart tourism platforms [29]; in the European context, input–output analysis has been used to assess the shipping industry under the EU Green Deal [30]. Closest to the present study, Jun, Lee, and Choi [31] estimated the economic impact of the Korean smart port industry by defining that industry as a weighted combination of existing sectors, with the weights elicited through Delphi surveys of experts. The present study addresses the same objective by a different route: rather than weighting whole sectors by expert judgement, it defines the programme by explicit membership at the level of the 380 basic sectors of the official classification, so that the definition is reproducible from published data and the unrelated residuals of the parent groups remain endogenous. In addition, where the earlier literature reports coefficients on a single transaction table, the present study estimates them on the total and the domestic tables in parallel, which is what allows the import content of the inducement to be measured. A further feature of this literature bears on the design of the present study: the exogenous-specification tradition pairs the demand-driven inducement coefficients with supply-driven shortage and price-side counterparts [23], and the fourth research question below extends the present analysis to that fuller canon.
Applying this framework to a smart port equipment programme raises a definitional difficulty that is easy to overlook. The programme spans ICT, electrical equipment, machinery, transport equipment, construction, transportation services, information and communication, and research and development. None of these major groups corresponds to the programme, and each contains a great deal of activity that has nothing to do with ports: the computer and electronics group contains mobile phones and televisions, the transport equipment group contains passenger cars, and the software group contains game publishing. Defining the programme as the union of the parent groups would therefore construct an aggregate several times the size of the programme and would, in effect, exogenise a large part of Korean manufacturing. The present study avoids this by working at the level of the 380 basic sectors of the input–output classification, extracting only those basic sectors that correspond to port handling machinery, drive and control equipment, port civil works, cargo handling and warehousing services, terminal software, and engineering R&D, and leaving the unrelated residuals of the parent groups in the endogenous system.
These questions, and the framework that answers them, admit an explicitly systems-theoretic reading, which the paper develops as its point of connection to systems science. An input–output table is among the oldest formal representations of a national economy as a system: a set of interdependent components whose collective behaviour is governed by the structure of their connections rather than by the properties of any component taken alone [17,19], which is the founding concern of general system theory [32]. Read in this way, the analytical devices employed below are systems operations. Exogenous specification redraws the boundary of the system: the programme sector is moved outside it, acts as an environment-side driver, and the measured response is wholly internal to the remaining structure. The Leontief inverse is the closed-loop operator of that structure: it resolves a boundary-crossing impulse into an infinite regress of inter-industry feedback rounds, and Section 4.2 makes the propagation visible round by round. Estimating on the total and the domestic transaction tables in parallel treats the economy as an open system and measures what crosses its outer boundary as import leakage. The divergence of the production, value-added, and employment channels examined in Section 4.1 is a structure–function relation: one impulse, three functionally distinct responses of the same structure.
The delineation of the programme sector is itself grounded in a systems principle. Simon’s account of near-decomposability [33] cautions that the apparent blocks of a classification—here, the major industry groups—are aggregates of subsystems whose internal couplings differ from their external ones; a programme that cuts across eight such groups is misrepresented by every one of them, and must be delineated at the level of the elementary components, which is what the basic-sector construction of Section 2.2 does. The same structural view of production has re-entered economics through the literature on production networks, in which sectoral shocks propagate along input–output linkages into aggregate outcomes [34,35], and supply chains have long been read in operations research as complex adaptive systems whose behaviour is dominated by connectivity [36]; recent work in this journal traces exactly such propagation of disruption through multilayer supply networks [37]. Along this line, the present study contributes the case of a deliberately constructed composite sector, observed in official transaction data, whose demand-side, supply-side, and boundary-crossing behaviour are measured on one and the same structure.
Four research questions guide the analysis. RQ1: What are the production-inducing, value-added-inducing, and employment-inducing coefficients of the smart port equipment technology sector, measured on other industries with self-effects excluded? RQ2: How much of that inducement is retained within the domestic economy, and in which industries is the import leakage concentrated? RQ3: How are the three inducement channels distributed across upstream and downstream parts of the economy? RQ4: How exposed are other industries to the sector itself—what production losses does a shortfall in its supply impose on them, what cost pressure does a change in its price transmit, and where does the sector stand in the backward and forward linkage structure of the economy?
This study applies the exogenous-specification framework to the Korean Smart Port Technology Self-Reliance Equipment Development Project, estimating the inducement coefficients associated with its sectoral composition rather than valuing the programme itself. With respect to systems research, the contribution lies in treating the programme not as a single-sector intervention but as an impulse propagating through a structured system of interdependent industries, and in quantifying how that structure distributes the programme’s material, value and employment consequences across parts of the economy that behave very differently. The methodological contribution is fourfold, corresponding to the four research questions. First, the programme sector is constructed by disaggregation rather than by aggregation of whole major groups, so that the residual activity of the parent groups remains a recipient of inducement rather than part of the exogenous block. Second, the coefficients are estimated on both the total and the domestic transaction tables, which separates gross inducement from the part retained domestically—a distinction that matters directly for a programme whose rationale is import substitution. Third, the constructed input coefficient vector is reported in full, so that every estimate can be reproduced from the published tables. Fourth, the demand-side coefficients are complemented by supply-driven shortage, price-side and linkage estimates, and the stability of the structural findings is established over eleven alternative delineations of the programme sector.
The remainder of the paper is organised as follows. Section 2 defines the scope of the programme and describes the data, the construction of the programme sector, the input–output framework, and the exogenous specification procedure. Section 3 presents the estimation results, on the demand side and on the supply side. Section 4 examines the propagation structure of the estimates, their robustness to the delineation of the sector and to the employment-coefficient year, their comparison with adjacent industries, and their policy and systems implications, together with limitations. Section 5 concludes.
2. Materials and Methods
2.1. Data
The primary data are the 2023 Input–Output Tables published by the Bank of Korea [38], used at the level of the 380 basic sectors of the 2020 benchmark-year commodity classification. The 2020 benchmark year refers to the classification and compilation framework, not to the vintage of the transactions: the 2023 extension tables record transaction values, total inputs and value added as observed in 2023, so that the input coefficients estimated here embody the 2023 production structure rather than that of the pandemic year. Two transaction tables are used in parallel: the total transaction table at producers’ prices, which is inclusive of imported intermediates, and the domestic transaction table, which records only domestically produced intermediates. Total input and value added by sector are taken from the total table. Estimating on both tables separates gross inducement on domestic industries from the part of that inducement which is actually retained within the national economy.
Employment coefficients are taken from the employment tables that accompany the Bank of Korea’s Input–Output Tables [38]. These are published for benchmark and extension years up to 2022, and no 2023 vector is available at the time of writing; the 2022 coefficients are therefore applied to the 2023 transaction structure. The employed-persons concept is used, comprising employees together with the self-employed and unpaid family workers, and coefficients are expressed as persons per KRW 1 billion of output. The sensitivity of the employment estimates to the choice of coefficient year is examined in Section 4.6, and the one-year mismatch is noted among the limitations in Section 4.9.
2.2. Scope Definition
The Smart Port Technology Self-Reliance Equipment Development Project is not confined to equipment manufacture. Its technological content spans automated handling machinery, the electrical drive and control systems that operate it, the civil works in which it is installed, the cargo handling and warehousing services it performs, the software and communications that coordinate it, and the engineering research and development that underpins it. These activities are distributed across eight major groups of the input–output classification, but they do not exhaust those groups.
Membership of the programme sector was therefore determined at the level of the basic sectors, by three explicit criteria applied in sequence. First (C1), the technological content of the programme was mapped onto six functional areas—handling machinery; electrical drive and control equipment; port civil works; cargo handling, storage and related transport services; software, communications and information services; and engineering research and development—which identify 38 small sectors distributed across eight parent groups. Second (C2), every basic sector belonging to those 38 small sectors was taken as a candidate, yielding 78 basic sectors. Third (C3), candidate basic sectors whose output is oriented to final consumers or to passenger transport, and which therefore have no plausible role as inputs to or outputs of port automation, were excluded: mobile phones, televisions, video equipment, audio equipment, watches and clocks, passenger cars, electric passenger cars, buses, motorcycles, game software publishing, and road passenger transport services. Sixty-seven basic sectors remain and constitute the programme sector; Table 1 reports the composition. Conversely, candidate sectors that supply intermediate technological content to port automation were retained in their entirety even where their output also serves other uses—semiconductors, trucks and special-purpose vehicles are the principal cases—and the resulting breadth of the definition is acknowledged among the limitations in Section 4.9. The residual activity of each parent group—for example, the part of the semiconductor and electronics group not extracted—continues to appear in the endogenous system as a recipient of inducement rather than as part of the exogenous block.
Table 1.
Composition of the reconstructed programme sector.
2.3. Construction of the Programme Sector
The programme sector was constructed by withdrawing the 67 basic sectors of Table 1 from the 380-sector transaction table and consolidating them into a single sector. Its intermediate purchases from each remaining part of the economy are the sums of the corresponding purchases of the 67 constituent basic sectors, and its total input is the sum of their total inputs. Because consolidation is performed on transaction values rather than on coefficients, the constituent sectors enter the composite in proportion to their total inputs; the resulting implicit shares by parent group are reported in Table 1.
The remaining 313 basic sectors were then aggregated to the 33 major groups of the classification for reporting. Where a major group contributed basic sectors to the programme, the group survives in the endogenous system in residual form, comprising only those of its basic sectors that were not extracted. The system on which the analysis operates therefore comprises 33 endogenous groups together with the exogenously specified programme sector.
2.4. Inter-Industry Analysis
Inter-industry analysis, also known as input–output analysis, is a method for identifying quantitatively the interdependencies among industries that arise through production activity. In a national economy, each industry forms relationships with the others by purchasing goods and services and selling its own output to other industries. These relationships are captured by the input–output table, which organises into a single statistical table the economic transactions describing how the goods and services produced by each industry over a given period—normally one year—are distributed among industries and to final demand components such as exports and consumption. In Korea, the table is compiled and published by the Bank of Korea [38,39]. Because inter-industry analysis reaches the industry-to-industry relationships that macroeconomic analysis cannot resolve, it is widely used to characterise detailed economic structure.
The input coefficient matrix is obtained by dividing each column of the transaction matrix by the total input of the corresponding sector, and expresses how much of each sector’s output is used as input by every other sector. It thus quantifies the interdependence structure among industries and provides the basis for the Leontief inverse [18,19]; a supply-driven counterpart based on allocation coefficients [40] exists and is employed here for RQ4, subject to the interpretive caution that attaches to it [41]: where the demand-driven model traces the purchases a sector’s expansion requires from others, the allocation-coefficient model traces the deliveries its supply makes possible for others, which is the relevant direction for a question about supply disruption (Section 2.5).
The input–output framework was preferred over computable general equilibrium (CGE) and network-analytic alternatives for reasons that follow from the object of the study. The quantities sought here are per-unit inducement coefficients attached to a newly constructed composite sector, and the input–output model delivers them directly from officially published transaction data, with no behavioural parameters to calibrate; every figure reported below is reproducible by a third party from the Bank of Korea tables together with the membership list of Table 1. A CGE treatment would additionally represent price adjustment, input substitution and factor reallocation, but at the cost of elasticity assumptions and calibration choices that would place the results beyond independent reproduction, and its comparative advantage lies in valuing a specified shock rather than in characterising per-unit linkage structure. Network-analytic methods describe the topology of inter-industry connections but do not yield the demand-driven inducement magnitudes that the research questions require. The two approaches are complements rather than substitutes: the coefficients estimated here are the kind of structural input on which a subsequent CGE valuation of the programme could draw, and this extension is identified in Section 4.9.
The price of this transparency is a set of known restrictions—fixed input coefficients, constant returns to scale, and the absence of supply constraints—whose implications in the present setting, including the substitution pressures created by recent geopolitical disruption of energy and materials supply chains, are discussed in Section 4.9 rather than assumed away. One restriction can, however, be relaxed within the framework itself: because the total and the domestic transaction tables are used in parallel, the import content of every inducement channel is measured rather than assumed, which is precisely the margin along which supply-chain reconfiguration operates.
2.5. Exogenous Specification
To analyse the programme itself, rather than the industries in which it is embedded, the corresponding sector must be treated by exogenous specification. Under the conventional final-demand-driven approach, the effects received by industries other than the sector whose activity changes are difficult to examine adequately, because that sector’s own effects are entangled with the rest of the system. In inter-industry analysis, where endogenous and exogenous variables are mixed, the exogenous variable is separated out, and the influence it exerts on the endogenous part of the economy is examined; this procedure is termed exogenous specification [21,22,23,24]. Through it, the self-effects of a specific industry are excluded, and the repercussions on other industries can be identified more clearly.
Let the programme sector be denoted the K sector. In the demand-driven model with the K sector exogenously specified, the production-inducing effect is written as
where ΔXe is the vector of output changes in the 33 endogenous groups; (I − Ae)−1 is the Leontief inverse of the endogenous block; Ak is the column vector of input coefficients of the programme sector over the endogenous groups; and ΔXk is the change in the output of the programme sector.
The existence of the Leontief inverse in Equation (1) requires that the spectral radius of the endogenous coefficient matrix satisfy ρ(Ae) < 1, which is equivalent to the Hawkins–Simon condition for a productive system. Both estimated matrices satisfy the condition comfortably: ρ(Ae) = 0.5596 on the total transaction table and 0.4097 on the domestic transaction table. A sufficient condition is also met directly, since every column sum of the endogenous coefficient matrix is strictly below unity (the maximum is 0.9446): each endogenous group’s total input is partly absorbed by value added or by purchases from the exogenously specified sector, neither of which appears in Ae. The inverse is therefore well defined, and the Neumann series of inter-industry rounds converges; Section 4.2 reports how quickly.
The elements of Ak follow from the construction described in Section 2.3: for each endogenous group i, the coefficient is the consolidated intermediate purchase from i divided by the consolidated total input, that is
where B denotes the set of 67 basic sectors listed in Table 1, zi,b the intermediate purchase of basic sector b from endogenous group i, and xb the total input of basic sector b. The resulting 33-element vector is reported in full in Table A1 of Appendix A, for both the total and the domestic transaction tables.
Equation (1) yields the production-inducing effect centred on the programme and indicates its direct and indirect effects on other sectors. Investment in the programme therefore does not stop at its own output effect: through linkage effects [42,43,44] it induces production in other industries and thereby stimulates production across the industrial system.
Second, the value added generated in domestic production activity can likewise be regarded as induced. To derive the value-added-inducing effect of an increase in the output of the programme sector on other sectors, the sector is exogenously specified under the assumption of no change in final demand, giving
where Be is the (33 × 33) diagonal matrix of value-added coefficients of the endogenous groups, each element being that group’s value added divided by its total input.
Third, because the production induced in turn induces labour demand, the employment-inducing effect is computed by combining the employment coefficient with the production-inducing effect. The employment coefficient ni is the amount of labour Ni used in production activity over a given period divided by total output Xi, that is, ni = Ni/Xi. With the programme sector exogenously specified, the employment-inducing effect is
where ΔNe is the change in the number of employed persons in each endogenous group and ne is the (33 × 33) diagonal matrix of employment coefficients.
Equations (1), (3), and (4) are estimated twice: once on the total transaction table and once on the domestic transaction table. In the latter case, the coefficient matrix, the Leontief inverse, and the programme column are all constructed from domestically produced intermediates alone, so that the resulting coefficients measure inducement retained within the national economy.
The demand-driven model traces what an expansion of the programme sector draws from other industries. RQ4 poses the converse question—what the rest of the economy stands to lose when the sector’s own supply falls short—and is answered in the supply-driven model of Ghosh [40], with the programme sector again exogenously specified. On the domestic transaction table, on which each row allocates exactly the domestically produced output of its sector, the allocation coefficient rij = zij/Xi expresses the share of sector i’s output delivered to sector j, with Xi taken as total output. The supply-shortage effect of a KRW 1 shortfall in the domestic supply of the programme sector on the endogenous groups is then
where rk is the (1 × 33) row vector of allocation coefficients of the programme sector over the endogenous groups and Re the (33 × 33) allocation-coefficient matrix of the endogenous block. The effect is measured symmetrically with Equations (1), (3), and (4), on industries other than the programme sector itself; it characterises forward transmission, complementing the backward transmission of Equation (1). Following the critique of the supply-driven model [41], the estimate is read as a measure of short-run exposure—the production put at risk while input proportions cannot yet adjust—rather than as a prediction of equilibrium reallocation.
A price-side counterpart traces the cost pressure that a change in the programme sector’s price transmits to the prices of the endogenous groups. In the Leontief price model with the K sector exogenously specified, computed on domestic input coefficients so that import prices are held fixed,
where is the domestic input-coefficient matrix of the endogenous block (the prime in Equation (6) denoting transposition), akd the (33 × 1) vector of domestic input coefficients of the programme sector’s output in the cost structures of the endogenous groups, and ΔPk the exogenous change in the programme sector’s price, set at 10 per cent in Section 3.4.
Finally, the sector’s position within the linkage structure as a whole is summarised by the Rasmussen–Hirschman indices [42,43], computed on the full 34-sector system—the 33 residual groups together with the programme sector treated endogenously—so that the sector’s own row and column participate. With lij the elements of the Leontief inverse of that system on the domestic transaction table and n = 34, the index of the power of dispersion (backward linkage) of sector j and the index of the sensitivity of dispersion (forward linkage) of sector i are
values above unity marking sectors whose backward pull on, or forward exposure to, the rest of the system exceeds the system average. Figure 1 summarises the analytical framework assembled in this section.
Figure 1.
Analytical framework. The programme sector (67 basic sectors from eight parent groups) is exogenously specified. On the demand side, its input requirements Ak drive the endogenous system of 33 residual groups, whose internal feedback (I − Ae)−1 resolves the impulse into production, value-added and employment inducement (Equations (1), (3) and (4)); on the supply side, its allocation vector rk transmits a supply shortfall, and its cost share akd a price change, forward through the same structure (Equations (5) and (6)). Estimation on the total and the domestic transaction tables in parallel measures the part of every effect that crosses the system boundary as import leakage. The dashed line marks the system boundary; arrows indicate the direction of transmission.
3. Results
The production-inducing, value-added-inducing and employment-inducing effects of the programme sector were estimated on the 2023 Input–Output Tables, on both the total and the domestic transaction tables. The demand-side results are reported in Table 2; the supply-shortage, price, and linkage estimates follow in Section 3.4 and Section 3.5.
Table 2.
Estimated inducement coefficients of the smart port logistics equipment technology sector on other industries.
3.1. Production-Inducing Effect
Estimated on the total transaction table, a KRW 1 increase in the output of the smart port logistics equipment technology sector induces KRW 0.8358 of production in other industries. On the domestic transaction table, the corresponding figure is KRW 0.5163, so that approximately 38 per cent of the gross production inducement is met by imported intermediates rather than by domestic production.
By industry, the largest production-inducing effects on the total table arise in [7. Chemical products] (0.1048) and [9. Primary metal products] (0.0867), followed by [2. Mining and quarrying products] (0.0647). The prominence of chemicals and primary metals is consistent with the material composition of port handling equipment, in which synthetic resins, industrial rubber products, primary steel, and metal castings are used intensively in structures, drives, and running gear. On the domestic table, the ordering of the first two reverses: primary metals (0.0538) exceeds chemicals (0.0531), and mining falls from 0.0647 to 0.0014, effectively disappearing from the domestic ranking. This contrast reflects the import dependence of the sectors concerned rather than any difference in the programme’s requirements: Korea imports the great majority of its mineral raw materials, so that the inducement transmitted to mining is realised almost entirely abroad, whereas primary metals retain a substantially larger domestic component.
The residual parts of the parent groups also receive inducement. The residual of [11. Computer, electronic and optical equipment] records 0.0213 and the residual of [12. Electrical equipment] 0.0190, indicating that the extracted programme activities draw on electronics and electrical products that were not themselves classified as part of the programme. By contrast, [29. Education services] (0.0011) and [33. Others] (0.0017) show the smallest inducement, and [19. Construction] shows none, for the reason given in the note to Table 2.
3.2. Value-Added-Inducing Effect
A KRW 1 increase in the output of the programme sector induces KRW 0.2958 of value added in other industries on the total table, and KRW 0.1872 on the domestic table.
The largest value-added-inducing effects arise in [20. Wholesale, retail and commodity brokerage services] (0.0320) and [27. Business support services] (0.0272), followed by [2. Mining and quarrying products] (0.0262) and [7. Chemical products] (0.0253). The ordering differs markedly from that of production inducement: chemicals and primary metals, which absorb the largest volumes of induced production, rank fourth and seventh in value added, whereas distribution and business services, which absorb considerably less production, rank first and second. The pattern is stable on the domestic table for the service sectors—wholesale and retail (0.0258) and business support services (0.0178) remain first and second—while mining again falls away. The lowest value-added inducement arises in [28. Public administration, defence and social security] (0.0012) and [29. Education services] (0.0008), sectors whose output is public-good in character rather than production-oriented, so that expansion of the programme does not translate into value creation within them.
3.3. Employment-Inducing Effect
A KRW 1 billion increase in the output of the programme sector induces 2.9758 jobs in other industries on the total table, and 1.9912 jobs on the domestic table.
The largest employment-inducing effects arise in [20. Wholesale, retail and commodity brokerage services] (0.4529 persons) and [27. Business support services] (0.4283), followed by [26. Professional, scientific and technical services (residual)] (0.2688) and [21. Transportation services (residual)] (0.2353). Together, the first two account for roughly 30 per cent of the total employment inducement. The concentration mirrors the value-added result and reflects the labour intensity of distribution, facility management, and manpower supply activities that accompany the deployment and operation of equipment. The smallest effects arise in [6. Coal and petroleum products] (0.0023) and in [19. Construction] and [33. Others] (zero); the coal and petroleum sector is capital- and facility-intensive, so that expansion of its production does not translate into a proportionate increase in employment.
3.4. Supply-Shortage and Price Effects
This subsection addresses RQ4. Estimated by Equation (5) on the domestic transaction table, a KRW 1 shortfall in the domestic supply of the programme sector disrupts KRW 0.4013 of production in other industries. The estimate is not sensitive to the convention chosen for the allocation coefficients: re-estimating on the total transaction table, with each row normalised by total supply, yields 0.3944. Table 3 reports the sectoral incidence, together with the price effects of Equation (6).
Table 3.
Supply-shortage and price effects of the programme sector on other industries.
The incidence of the supply-shortage effect is concentrated downstream, among the industries the programme sector supplies. The largest disruption falls on the residual of [14. Transport equipment] (0.0498)—the passenger-vehicle industries, which draw engines, parts, semiconductors and batteries from basic sectors inside the programme composite—followed by the residual of [19. Construction] (0.0348), whose building activity depends on the engineering and civil-works services extracted into the composite, and by [20. Wholesale, retail and commodity brokerage services] (0.0318). The price effects are distributed in much the same way: a 10 per cent rise in the programme sector’s price raises the price level of the residual transport-equipment group by 4.02 per cent, and those of [2. Mining and quarrying products] and the residual of [12. Electrical equipment] by about 2 per cent, with an output-weighted mean of 1.06 per cent across the endogenous system. Both channels tell one story from the supply side: the programme sector is not only a purchaser whose expansion stimulates upstream industries, but an embedded supplier whose failure or cost inflation would propagate widely—which is the systemic content of the self-reliance rationale.
3.5. Position in the Linkage Structure
Table 4 places the programme sector within the linkage structure of the full 34-sector system by Equation (7). Its index of the power of dispersion is 0.9748 on the domestic table—backward pull close to the system average, consistent with the high value-added share and internalised intra-composite purchases discussed in Section 4.4—while its index of the sensitivity of dispersion is 3.1935, the highest of all 34 sectors, ahead of chemical products (1.8435) and wholesale and retail trade (1.7163). The prominence is not an artefact of any single constituent: removing semiconductors from the composite lowers the index to 3.1184, and removing semiconductors and ships together to 3.0562, in both cases still the highest in the system. The composite is, in short, the sector to whose supply the rest of the economy is most sensitive—a structural restatement of the exposure that RQ4 quantifies and that a self-reliance programme is intended to reduce.
Table 4.
Rasmussen–Hirschman linkage indices in the 34-sector system, domestic transaction table.
4. Discussion
4.1. Divergence Between the Three Channels
This subsection addresses RQ3. The three inducement channels do not terminate in the same place. Production inducement runs upstream, concentrating in chemical products, primary metals, and mining—the material base from which cranes, vehicles, and structures are built. Value-added and employment inducement run downstream, concentrating in wholesale and retail and in business support services. The sectors absorbing the greatest volume of induced production are therefore not those capturing the greatest induced value or employment.
The direction of this divergence is not specific to the smart port case. Upstream material sectors are capital-intensive, process-based, and highly productive per worker, converting large monetary flows into modest labour requirements and thin margins per unit; downstream distribution and support services are labour-intensive and margin-bearing, converting smaller monetary flows into large labour requirements and substantial value added. Because value-added and employment coefficients differ systematically between manufacturing and services in this way, a divergence of this kind is expected for any exogenously specified manufacturing sector, and the present results should be read as quantifying its magnitude in this particular case rather than as establishing the pattern itself. The contrast is clearest between chemical products, ranked first in production inducement but tenth in employment, and wholesale and retail, ranked fourth in production but first in both value added and employment. A programme justified on production volume alone would therefore prioritise substantially different industries from one justified on employment.
The practical significance of the divergence lies in assessment rather than in theory. The three channels transmit the same impulse to structurally different parts of the economy, so an assessment reporting only one of them—as project-level appraisals commonly do—conveys a partial picture of where the programme’s effects are borne. This is a limitation of single-channel reporting rather than a property of the smart port system as such.
4.2. Propagation Rounds and Mediated Inducement
The Leontief inverse compresses an infinite sequence of inter-industry rounds into one operator; expanding it as the Neumann series (I − Ae)−1Ak = Ak + AeAk + Ae2Ak + ⋯ shows how much of the inducement each round carries, and thereby how deep into the system the programme’s impulse travels. Figure 2a reports the cumulative shares. On the total transaction table, the direct requirement Ak accounts for 43.1 per cent of the production-inducing effect; two rounds accumulate 67.8 per cent and four rounds 89.9 per cent. On the domestic table, convergence is faster—59.0, 83.4, and 97.3 per cent respectively—because import leakage drains each successive round of domestic re-spending. The systemic content of the coefficients is therefore substantial: more than half of the gross inducement, and about two-fifths of the domestic, arises not from what the programme buys, but from what its suppliers, and theirs in turn, must buy.
Figure 2.
Round-by-round decomposition of the production-inducing effect (Neumann series of the Leontief inverse). (a) Cumulative share of the total effect by inter-industry round, total and domestic transaction tables. (b) Cumulative share of the inducement received by mining and quarrying (total table), whose direct coefficient is close to zero: the effect is almost entirely mediated through the second and higher rounds.
The decomposition also identifies where inducement is mediated rather than direct, and mining and quarrying is the clearest case (Figure 2b). The programme sector purchases almost nothing from it directly—a direct coefficient of 0.0002—yet mining ranks third in total production inducement (0.0647). Only 0.3 per cent of that inducement arrives in the first round; 39.1 per cent has accumulated by the second round and 66.0 per cent by the third, as the impulse passes through chemicals and primary metals and only then reaches their mineral inputs. The programme’s largest upstream consequence is thus invisible to any project-level account of its procurement and exists only by virtue of the structure of the system—the concrete sense in which the programme is an impulse propagating through interdependent industries rather than a set of transactions between identifiable parties. Read together with Section 4.3, the decomposition also explains why import leakage is so uneven: effects that arrive through long mediated chains are exposed at every link to the import content of the intervening sectors, which is why mining—reached almost entirely through mediated rounds, and itself supplied almost entirely from abroad—retains barely 2 per cent of its gross inducement domestically.
4.3. Gross and Domestic Inducement
This subsection addresses RQ2. Estimating on both transaction tables makes the import content of the inducement visible. For each channel c ∈ {production, value added, employment}, the import-leakage ratio is defined as
the complement of the ratio of the domestic-table to the total-table column sums of the channel in question, where 1′ denotes summation over the 33 endogenous groups. The estimated ratios are λprod = 0.382, λva = 0.367, and λemp = 0.331: the domestic production-inducing coefficient (0.5163) is approximately 62 per cent of the gross coefficient (0.8358), and the corresponding retention ratios are 63 per cent for value added and 67 per cent for employment. Roughly two-fifths of the gross production inducement generated by the programme is therefore satisfied by imported intermediates and does not accrue to domestic industries.
The incidence of this leakage is uneven (Figure 3), and its pattern is informative for a programme whose rationale is import substitution. Mining and quarrying illustrates the extreme case: it ranks third in gross production inducement (0.0647) but falls to 0.0014 on the domestic table, because Korea imports nearly all of its mineral raw materials. Chemical products retain 51 per cent and primary metals 62 per cent of their gross production inducement, whereas the service sectors retain most of theirs: wholesale and retail retain 81 per cent of both their production and their employment inducement. Import leakage is thus concentrated in precisely the upstream material sectors that dominate the gross production ranking, while the downstream services that dominate the value-added and employment rankings are largely insulated from it.
Figure 3.
Gross and domestic production inducement by industry. Each pair of markers connects the total-table (gross) and domestic-table estimates for one endogenous group; the gap between them is the part of the inducement met by imports. Import leakage is concentrated in the upstream material sectors—mining and quarrying all but disappear from the domestic ranking—while downstream services retain most of their inducement. “res.” denotes the residual of a parent group.
This has a direct bearing on how the self-reliance rationale should be understood. The programme’s domestic recirculation is smaller than the gross figures suggest, and the difference is not a uniform discount but is concentrated in the material supply chain. An argument for the programme framed in terms of retaining expenditure within the national economy is better supported by the domestic estimates than by the gross ones, and the gap between the two indicates where domestic capability would have to deepen for the self-reliance objective to be realised in full.
4.4. Comparison with an Undisaggregated Definition and with Adjacent Industries
Defining the programme as the union of the eight parent groups—rather than extracting the relevant basic sectors from them—would construct an exogenous aggregate whose total input is roughly 1.8 times that of the sector used here and would remove from the endogenous system the whole of Korean semiconductor, shipbuilding, and construction activity. Two consequences follow, and both can now be quantified because the undisaggregated variant has been re-estimated on the same data and by the same procedure; its coefficients are reported in the final row of Table 5. First, the resulting coefficients would not describe the programme but a synthetic aggregate approximating a large part of Korean advanced manufacturing. Second, the estimated inducement would be lower rather than higher: on the total table the undisaggregated definition yields a production-inducing coefficient of 0.6383 against 0.8358, an understatement of 24 per cent, with value added understated by a similar margin (0.2263 against 0.2958) and employment by 26 per cent (2.1931 against 2.9758). The mechanism is that the high-linkage manufacturing groups sit inside the exogenous block, so the transactions between them are internalised and can no longer register as inducement on other industries. The disaggregated definition adopted here therefore yields both a more interpretable and a larger set of coefficients, and it preserves the residual activity of the parent groups as recipients of inducement, which is where they belong.
Table 5.
Inducement and supply-shortage coefficients of the programme sector and of adjacent industries under identical exogenous specification.
To place the magnitudes in context, Table 5 also reports the coefficients obtained when adjacent industries are exogenously specified one at a time, using the identical data year, aggregation procedure, and employment vector. The comparison set comprises ships, motor vehicles, water transport services, cargo handling and warehousing, and semiconductors—industries that either supply, operate within, or technologically neighbour the port system.
Four observations follow. First, the programme’s coefficients are of the same order of magnitude as those of its industrial neighbours, which supports their economic plausibility. Second, the programme’s levels are lower than those of any single adjacent industry, and the gap is explained by composition rather than by weak linkages. The programme composite carries a value-added share of total input of 38 per cent—reflecting its R&D, engineering, and software content—against 21 per cent for ships, so less of each won of output takes the form of intermediate purchases at all; and 26 percentage points of its input are purchases within the composite itself, which exogenous specification removes from the measured inducement, against 12 percentage points of intra-sector purchases for ships. The comparison thus illustrates empirically the property already visible in the undisaggregated row: the larger and more internally connected the exogenous block, the more of its supply chain is internalised and the lower the measured inducement on others. Third, the domestic columns reveal how sharply import dependence differs across the comparison set: water transport services retain barely an eighth of their gross production inducement, reflecting imported vessels and bunker fuel, whereas cargo handling and warehousing retain about two-thirds; the programme’s retention ratio of 62 per cent places it in the upper part of this range. Fourth, the supply-shortage column orders the comparison set quite differently from the demand-side columns: cargo handling and warehousing, a modest demand-side inducer, is by far the most supply-critical sector of the set (1.5638), the programme composite is second (0.4013), and shipbuilding—the strongest demand-side inducer—is the least (0.1255), selling as it does into final demand rather than into other industries’ production. Backward and forward importance are different properties of a sector’s position in the system, and a programme rationale that rests on supply security is properly assessed by the latter.
4.5. Sensitivity to the Delineation of the Programme Sector
The delineation of Section 2.2 rests on judgement, and Section 4.4 has shown that the coarsest alternative—the undisaggregated composite—understates the coefficients substantially. This subsection quantifies the sensitivity systematically. Eleven variants of the programme sector were re-estimated by the identical procedure of Section 2.3 and Section 2.5: eight leave-one-group-out variants, each returning to the endogenous system the basic sectors that one parent group contributes to the composite, and three narrow variants removing the constituents acknowledged in Section 2.2 as broadest—semiconductors, ships, and the two together. Table 6 reports the totals.
Table 6.
Inducement coefficients under eleven alternative delineations of the programme sector.
Two regularities emerge. First, the magnitudes move within a moderate band: the production-inducing coefficient ranges from 0.8064 to 0.9555 on the total table around the baseline 0.8358, and from 0.4940 to 0.5826 on the domestic table, with value added and employment moving in proportion. Removals more often raise the coefficients than lower them, because a smaller composite internalises fewer of its own supply linkages—the mechanism of Section 4.4 operating in reverse. Second, and more importantly, the structural findings are invariant: chemical products and primary metals are the two largest recipients of production inducement in all twelve estimations, wholesale and retail is the largest recipient of employment inducement in all twelve, and the upstream–downstream divergence of Section 4.1 appears in every one. The conclusions of the paper are therefore properties not of one contestable membership list but of the region of plausible delineations around it.
4.6. Robustness of the Employment Estimates
Because the employment coefficients are those of 2022 applied to the 2023 transaction structure, the employment estimates were re-computed with the 2020 and 2021 coefficient vectors from the same employment tables, holding everything else fixed. Table 7 reports the totals.
Table 7.
Employment-inducing effect under alternative employment-coefficient years.
The totals decline monotonically across coefficient years—from 3.5766 (2020) through 3.2201 (2021) to 2.9758 (2022) on the total table, and correspondingly on the domestic table—consistent with rising nominal labour productivity, which mechanically lowers persons employed per KRW 1 billion of output. Two points follow for the interpretation of the headline estimate. First, the structural findings are insensitive to the choice of year: wholesale and retail and business support services rank first and second in every variant, and the upstream–downstream divergence of Section 4.1 is unchanged. Second, the estimates reported in Table 2 use the most recent available vector and are therefore the most conservative of the three; had labour productivity continued to rise into 2023, the true employment inducement would be somewhat lower still, and the adjacent-year comparison brackets the plausible magnitude of that adjustment at roughly eight per cent, the gap between the 2021 and 2022 variants.
4.7. Policy Implications
Four implications may be drawn. First, the estimates are relevant to programme assessment, but their admissible role is doubly circumscribed. They are per-unit coefficients, so any monetary statement would require the programme’s output change in addition; and inducement coefficients are gross of opportunity cost and presuppose unemployed resources, so the KDI General Guidelines [45] treat inter-industry inducement effects as inputs to policy and regional balanced-development analysis rather than as components of the benefit–cost ratio. The estimates reported here accordingly inform the policy analysis component of an assessment, not a B/C calculation.
Second, for industrial strategy, the concentration of value added and employment in distribution and business support services suggests that policies seeking to maximise the programme’s employment return might attend to the deployment and service layer—maintenance regimes, operations support, and manpower supply—rather than to equipment fabrication alone, even though fabrication is where the programme’s expenditure nominally sits. This reading is consistent with recent empirical evidence that automation investment does not translate into performance gains unless it is integrated with operations, training, and service capabilities [14,46].
Third, the divergence between the gross and domestic estimates identifies where a self-reliance objective is most exposed. The leakage is concentrated in mineral raw materials and, to a lesser extent, in chemicals and primary metals. Domestic equipment development will not by itself alter the import dependence of the mineral base, and claims that the programme recirculates expenditure within the national economy should be calibrated to the domestic coefficients rather than the gross ones.
Fourth, the supply-side estimates give the self-reliance rationale its sharpest formulation. The programme sector carries the highest forward-linkage sensitivity in the 34-sector system (Section 3.5), and a KRW 1 shortfall in its domestic supply disrupts KRW 0.4013 of production among its users, with the incidence concentrated in vehicle manufacturing, construction, and distribution (Section 3.4). The case for domestic capability in smart port equipment therefore does not rest only on what the programme’s expansion would stimulate; it rests equally on what the economy already stands to lose through the sector’s supply and cost channels, and that exposure is now measured on the structure of the domestic economy itself rather than asserted from the foreign origin of installed equipment.
4.8. Implications for Systems Research and Practice
For systems research, the findings are instances of general propositions about structured systems, observed here in official transaction data. The three inducement channels exhibit a structure–function relation: a single impulse, entering at a single boundary point, produces functionally distinct responses whose maxima lie in different parts of the structure (Section 4.1). The round decomposition exhibits mediated causation: the system’s third-largest material consequence arises in a sector with which the programme barely transacts (Section 4.2). The total–domestic comparison measures the openness of the system and shows that boundary-crossing flows are concentrated at specific structural locations rather than spread as a uniform discount (Section 4.3). The supply-side estimates show that the same node can be unremarkable as a purchaser yet critical as a supplier (Section 3.4 and Section 3.5)—backward and forward embeddedness are separate coordinates of systemic position, as the production-network literature emphasises [34,35]. Additionally, the delineation analysis illustrates near-decomposability in Simon’s sense [33]: conclusions drawn at the level of the elementary components survive perturbation of the block boundaries, where conclusions drawn from the parent groups themselves would not (Section 4.4 and Section 4.5).
For systems practice, the transferable object is the procedure rather than the Korean coefficients: delineate a composite intervention by explicit membership over the elementary sectors of an official classification; specify it exogenously, so that the system boundary coincides with the object of assessment; estimate demand-driven, supply-driven and price-side responses on the total and domestic tables in parallel; decompose the propagation into rounds; and stress the delineation. Any technology programme whose activity is scattered across the blocks of an industrial classification—connected and autonomous vehicles, smart farming, and smart tourism platforms among recent examples [26,27,29]—can be assessed by this sequence from published data alone, and disruption-oriented studies of supply networks [36,37] gain from it a transaction-table counterpart in which the magnitudes of propagation, and not only its topology, are measured.
4.9. Limitations and Future Research
Several limitations qualify these findings. The definition of the programme sector rests on a judgement as to which of the 380 basic sectors are implicated in port automation. That judgement is stated as explicit criteria (C1–C3) in Section 2.2, its composition is documented in Table 1, and Section 4.5 now quantifies its consequences: eleven alternative delineations move the totals within a moderate band and leave the structural findings unchanged. What remains is that the programme sector is broader than the funded project, since basic sectors such as semiconductors or ships are retained in their entirety once selected; the narrow variants of Section 4.5 bound the effect of the two broadest inclusions, but no weighting by the share of each basic sector plausibly attributable to port applications is applied.
The employment coefficients are those of 2022, the most recent published vector, applied to the 2023 transaction structure; Section 4.6 shows that the resulting uncertainty is of the order of eight per cent on the totals and does not affect the sectoral rankings. The robustness analyses of the paper are discrete—alternative delineations, employment-coefficient years, and allocation-coefficient conventions—and no stochastic uncertainty analysis, such as simulation over perturbed coefficients, accompanies the point estimates. The coefficients are per-unit measures and are not converted into a monetary benefit, which would require an estimate of the programme’s output change.
Further limitations are inherent to the method. Input–output analysis assumes fixed input coefficients, constant returns to scale and an absence of supply constraints, so the estimates describe a demand-driven short-run response rather than an equilibrium outcome. These restrictions bind with particular force in the present period, in which geopolitical disruption has forced rapid substitution among suppliers of energy carriers and critical materials and has rerouted maritime flows; the fixed-coefficient model cannot represent such substitution, and a computable general equilibrium treatment—for which the coefficients estimated here would serve as structural inputs—would allow for price adjustment and factor reallocation. The coefficients embed the technology of the base year, whereas a self-reliance programme is intended precisely to alter the underlying input structure over time—a tension inherent in applying input–output methods to technology development programmes. Against these restrictions should be set the corresponding strength of the data: the 2023 extension tables are the most recent official record of the Korean transaction structure, so the estimates rest on the most current and credible factual approximation available rather than on calibrated or projected structures. Finally, the analysis is silent on the environmental and safety benefits of port automation, on the distributional incidence of the induced employment, and on the displacement of incumbent port labour [15,47]. Extending the framework to an environmentally extended or multi-regional input–output model, and complementing it with stated-preference estimates of the public’s willingness to pay for domestic technology sovereignty, would together afford a more complete account of the programme’s socioeconomic value.
5. Conclusions
This study estimated inter-industry inducement coefficients for the Korean Smart Port Technology Self-Reliance Equipment Development Project using input–output analysis with exogenous specification. The programme was defined at the level of the 380 basic sectors of the 2023 Input–Output Tables: 67 basic sectors spanning port handling machinery, drive and control equipment, port civil works, cargo handling and warehousing services, terminal software, and engineering R&D were extracted from their parent groups and consolidated into a single sector, which was then removed from the endogenous system so that only its repercussions on other industries were measured.
In answer to RQ1, a KRW 1 increase in the sector’s output is estimated to induce KRW 0.8358 of production and KRW 0.2958 of value added in other industries, and KRW 1 billion of output to induce 2.9758 jobs. In answer to RQ2, the corresponding figures on the domestic transaction table are KRW 0.5163, KRW 0.1872, and 1.9912 jobs, indicating that roughly two-fifths of the gross inducement is met by imported intermediates. The leakage is concentrated in the upstream material sectors—most acutely in mining, which all but disappears from the domestic ranking—while downstream distribution and business services retain the greater part of their inducement.
In answer to RQ4, the dependence also runs the other way. A KRW 1 shortfall in the domestic supply of the sector disrupts KRW 0.4013 of production among its users, concentrated in vehicle manufacturing, construction and distribution; a 10 per cent rise in its price raises other industries’ prices by 1.06 per cent on average; and the sector carries the highest forward-linkage sensitivity of the 34-sector system, a position that survives substantial narrowing of the composite. Eleven alternative delineations of the sector move the totals only moderately and leave the structural findings unchanged.
In answer to RQ3, and beyond these magnitudes, the analysis shows that the programme’s effects travel along channels that diverge structurally: production inducement falls upstream in chemicals, primary metals, and mining, whereas value-added and employment inducement fall downstream in wholesale and retail and in business support services. A smart port equipment programme may therefore be regarded as an intervention whose material, value, and employment consequences are borne by different parts of the economy, and one unlikely to be assessed adequately through the output of the equipment sector alone. Subject to the limitations set out in Section 4.9, the estimates offer a quantitative point of reference for the policy analysis component of a programme assessment, on the understanding that they are per-unit coefficients rather than a monetary valuation.
The framework itself travels beyond the port case. Any technology programme whose activity is scattered across the basic sectors of several parent groups—connected and autonomous vehicles, smart farming, and smart tourism platforms are recent examples analysed by related means [26,27,29]—can be delineated by explicit basic-sector membership, exogenously specified, estimated on the total and domestic tables in parallel and in demand-driven and supply-driven form, and stressed over alternative delineations; the procedure requires nothing beyond the published tables and a documented membership list. Future research should extend the present estimates in three directions: a computable general equilibrium treatment using these coefficients as structural inputs, to admit price adjustment and input substitution; an environmentally extended or multi-regional formulation, to capture emissions and regional incidence; and stated-preference valuation of the public’s willingness to pay for technology sovereignty, to complement the linkage evidence with demand-side welfare measures.
Author Contributions
Conceptualisation, J.K. and J.L.; methodology, J.K. and J.L.; formal analysis, J.K.; investigation, J.K.; data curation, J.K.; writing—original draft preparation, J.K.; writing—review and editing, J.L.; visualisation, J.K.; supervision, J.L.; project administration, J.L.; funding acquisition, J.L. All authors have read and agreed to the published version of the manuscript.
Funding
This research was funded by the 5th Educational Training Programme for the Shipping, Port, and Logistics of the Ministry of Oceans and Fisheries, Republic of Korea.
Institutional Review Board Statement
Not applicable.
Informed Consent Statement
Not applicable.
Data Availability Statement
Publicly available datasets were analysed in this study. These data can be found here: Bank of Korea, Economic Statistics System (ECOS), https://ecos.bok.or.kr (2023 Input–Output Tables and the accompanying employment tables). The calculation code covering all reported analyses is available from the corresponding author on request.
Conflicts of Interest
The authors declare no conflicts of interest.
Abbreviations
The following abbreviations are used in this manuscript:
| I–O | Input–Output |
| ICT | Information and Communication Technology |
| KRW | Korean Won |
| R&D | Research and Development |
Appendix A
Table A1 reports the input coefficient vector of the constructed programme sector, computed as set out in Equation (2), on both the total and the domestic transaction tables. This vector is the sole analyst-constructed input to Equations (1), (3), and (4); together with the published Bank of Korea tables, it is sufficient to reproduce every coefficient reported in Table 2.
Table A1.
Input coefficient vector of the constructed programme sector.
References
- Notteboom, T.; Pallis, A.; Rodrigue, J.-P. Port Economics, Management and Policy; Routledge: London, UK, 2022. [Google Scholar]
- Song, D.-W.; Panayides, P.M. Global Supply Chain and Port/Terminal: Integration and Competitiveness. Marit. Policy Manag. 2008, 35, 73–87. [Google Scholar] [CrossRef] [Scilit]
- UNCTAD. Review of Maritime Transport 2024; United Nations Conference on Trade and Development: Geneva, Switzerland, 2024. [Google Scholar]
- Bottasso, A.; Conti, M.; Ferrari, C.; Tei, A. Ports and Regional Development: A Spatial Analysis on a Panel of European Regions. Transp. Res. Part A Policy Pract. 2014, 65, 44–55. [Google Scholar] [CrossRef] [Scilit]
- Ferrari, C.; Merk, O.; Bottasso, A.; Conti, M.; Tei, A. Ports and Regional Development: A European Perspective; OECD Regional Development Working Papers 2012/07; OECD Publishing: Paris, France, 2012. [Google Scholar]
- Jung, B.-M. Economic Contribution of Ports to the Local Economies in Korea. Asian J. Shipp. Logist. 2011, 27, 1–30. [Google Scholar] [CrossRef] [Scilit]
- Zhao, Q.; Xu, H.; Wall, R.S.; Stavropoulos, S. Building a Bridge between Port and City: Improving the Urban Competitiveness of Port Cities. J. Transp. Geogr. 2017, 59, 120–133. [Google Scholar] [CrossRef] [Scilit]
- Molavi, A.; Lim, G.J.; Race, B. A Framework for Building a Smart Port and Smart Port Index. Int. J. Sustain. Transp. 2020, 14, 686–700. [Google Scholar] [CrossRef] [Scilit]
- Yau, K.-L.A.; Peng, S.; Qadir, J.; Low, Y.-C.; Ling, M.H. Towards Smart Port Infrastructures: Enhancing Port Activities Using Information and Communications Technology. IEEE Access 2020, 8, 83387–83404. [Google Scholar] [CrossRef] [Scilit]
- Heilig, L.; Lalla-Ruiz, E.; Voß, S. Digital Transformation in Maritime Ports: Analysis and a Game Theoretic Framework. Netnomics 2017, 18, 227–254. [Google Scholar] [CrossRef] [Scilit]
- Lee, P.T.-W.; Lam, J.S.L. Developing the Fifth Generation Ports Model. In Dynamic Shipping and Port Development in the Globalized Economy; Lee, P.T.-W., Cullinane, K., Eds.; Palgrave Macmillan: London, UK, 2016; pp. 186–210. [Google Scholar]
- Li, K.X.; Li, M.; Zhu, Y.; Yuen, K.F.; Tong, H.; Zhou, H. Smart Port: A Bibliometric Review and Future Research Directions. Transp. Res. Part E Logist. Transp. Rev. 2023, 174, 103098. [Google Scholar] [CrossRef] [Scilit]
- Gharehgozli, A.H.; Roy, D.; de Koster, R. Sea Container Terminals: New Technologies and OR Models. Marit. Econ. Logist. 2016, 18, 103–140. [Google Scholar] [CrossRef] [Scilit]
- Knatz, G.; Notteboom, T.; Pallis, A.A. Container Terminal Automation: Assessment of Drivers and Benefits. Marit. Policy Manag. 2024, 51, 1252–1276. [Google Scholar] [CrossRef] [Scilit]
- International Transport Forum. Container Port Automation: Impacts and Implications; ITF Policy Papers No. 96; OECD Publishing: Paris, France, 2021. [Google Scholar]
- Ministry of Oceans and Fisheries. Master Plan for Smart Port Development; Ministry of Oceans and Fisheries: Sejong, Republic of Korea, 2023.
- Leontief, W. Quantitative Input and Output Relations in the Economic Systems of the United States. Rev. Econ. Stat. 1936, 18, 105–125. [Google Scholar] [CrossRef] [Scilit]
- Leontief, W. Input–Output Economics, 2nd ed.; Oxford University Press: New York, NY, USA, 1986. [Google Scholar]
- Miller, R.E.; Blair, P.D. Input–Output Analysis: Foundations and Extensions, 2nd ed.; Cambridge University Press: Cambridge, UK, 2009. [Google Scholar]
- Wu, R.-H.; Chen, C.-Y. On the Application of Input–Output Analysis to Energy Issues. Energy Econ. 1990, 12, 71–76. [Google Scholar] [CrossRef] [Scilit]
- Kim, K.; Jung, J.-K.; Choi, J.Y. Impact of the Smart City Industry on the Korean National Economy: Input-Output Analysis. Sustainability 2016, 8, 649. [Google Scholar] [CrossRef] [Scilit]
- Kim, B.-J.; Hyun, M.-K.; Yoo, S.-H. Economic Effects of the Hydrogen Fuel Cell Sector in South Korea: An Input-Output Analysis. Int. J. Hydrogen Energy 2024, 68, 955–969. [Google Scholar] [CrossRef] [Scilit]
- Kwak, S.-J.; Yoo, S.-H.; Chang, J.-I. The Role of the Maritime Industry in the Korean National Economy: An Input–Output Analysis. Mar. Policy 2005, 29, 371–383. [Google Scholar] [CrossRef] [Scilit]
- Chung, Y.-K.; Lim, E.-S. National Economic Effects of the Korea Shipbuilding Industry. J. Korea Port Econ. Assoc. 2011, 27, 129. (In Korean) [Google Scholar]
- Yoo, H.; Kim, Y.S.; Shin, J.; Chung, B.Y. Regional Economic Effects of the Development in New Port: Focused on Incheon Port. J. Korea Port Econ. Assoc. 2010, 26, 240–258. (In Korean) [Google Scholar]
- Jun, W.K.; An, M.H.; Choi, J.Y. Impact of the Connected & Autonomous Vehicle Industry on the Korean National Economy Using Input–Output Analysis. Technol. Forecast. Soc. Change 2022, 178, 121572. [Google Scholar] [CrossRef] [Scilit]
- Choi, S.-W.; Shin, Y.J. Role of Smart Farm as a Tool for Sustainable Economic Growth of Korean Agriculture: Using Input–Output Analysis. Sustainability 2023, 15, 3450. [Google Scholar] [CrossRef] [Scilit]
- Kim, T.-J.; Tromp, N. The Economic Impact of the Logistics Industry in South Korea: Based on an Input–Output Approach. LOGI Sci. J. Transp. Logist. 2022, 13, 174–185. [Google Scholar] [CrossRef] [Scilit]
- Lee, H.; Koo, C.; Chung, N. Assessing the Economic Effects of Investment in Smart Tourism Platform. Tour. Econ. 2025, 31, 263–284. [Google Scholar] [CrossRef] [Scilit]
- Goyal, S.; Llop, M. The Shipping Industry under the EU Green Deal: An Input–Output Impact Analysis. Transp. Res. Part A Policy Pract. 2024, 182, 104035. [Google Scholar] [CrossRef] [Scilit]
- Jun, W.K.; Lee, M.-K.; Choi, J.Y. Impact of the Smart Port Industry on the Korean National Economy Using Input–Output Analysis. Transp. Res. Part A Policy Pract. 2018, 118, 480–493. [Google Scholar] [CrossRef] [Scilit]
- von Bertalanffy, L. General System Theory: Foundations, Development, Applications; George Braziller: New York, NY, USA, 1968. [Google Scholar]
- Simon, H.A. The Architecture of Complexity. Proc. Am. Philos. Soc. 1962, 106, 467–482. [Google Scholar]
- Acemoglu, D.; Carvalho, V.M.; Ozdaglar, A.; Tahbaz-Salehi, A. The Network Origins of Aggregate Fluctuations. Econometrica 2012, 80, 1977–2016. [Google Scholar] [CrossRef] [Scilit]
- Carvalho, V.M.; Tahbaz-Salehi, A. Production Networks: A Primer. Annu. Rev. Econ. 2019, 11, 635–663. [Google Scholar] [CrossRef] [Scilit]
- Choi, T.Y.; Dooley, K.J.; Rungtusanatham, M. Supply Networks and Complex Adaptive Systems: Control versus Emergence. J. Oper. Manag. 2001, 19, 351–366. [Google Scholar] [CrossRef] [Scilit]
- Yue, X.; Zhong, Q. Critical Systemic Risks in Multilayer Automotive Supply Networks: Static and Dynamic Network Perspectives. Systems 2026, 14, 93. [Google Scholar] [CrossRef] [Scilit]
- Bank of Korea. 2023 Input–Output Tables (Extension Tables); Bank of Korea: Seoul, Republic of Korea, 2025.
- Bank of Korea. Explanation of Input–Output Statistics; Bank of Korea: Seoul, Republic of Korea, 2014.
- Ghosh, A. Input–Output Approach in an Allocation System. Economica 1958, 25, 58–64. [Google Scholar] [CrossRef] [Scilit]
- Oosterhaven, J. On the Plausibility of the Supply-Driven Input–Output Model. J. Reg. Sci. 1988, 28, 203–217. [Google Scholar] [CrossRef] [Scilit]
- Rasmussen, P.N. Studies in Inter-Sectoral Relations; North-Holland: Amsterdam, The Netherlands, 1956. [Google Scholar]
- Hirschman, A.O. The Strategy of Economic Development; Yale University Press: New Haven, CT, USA, 1958. [Google Scholar]
- Chenery, H.B.; Watanabe, T. International Comparisons of the Structure of Production. Econometrica 1958, 26, 487–521. [Google Scholar] [CrossRef] [Scilit]
- Korea Development Institute. General Guidelines for Preliminary Feasibility Study, 6th ed.; Korea Development Institute: Sejong, Republic of Korea, 2023.
- Tsagkaris, P.; Moschovou, T.P. The Impact of Automation on the Efficiency of Port Container Terminals. Future Transp. 2025, 5, 155. [Google Scholar] [CrossRef] [Scilit]
- Bottalico, A. Towards the Mapping of Port Labour Systems and Conflicts across Europe: A Literature Review. Work Organ. Labour Glob. 2019, 13, 130–154. [Google Scholar] [CrossRef] [Scilit]
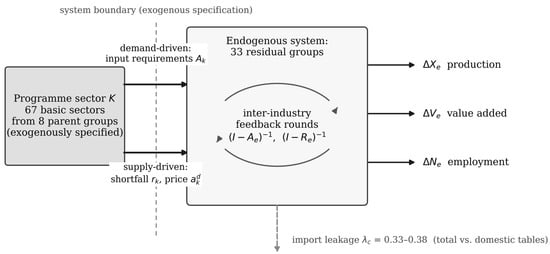
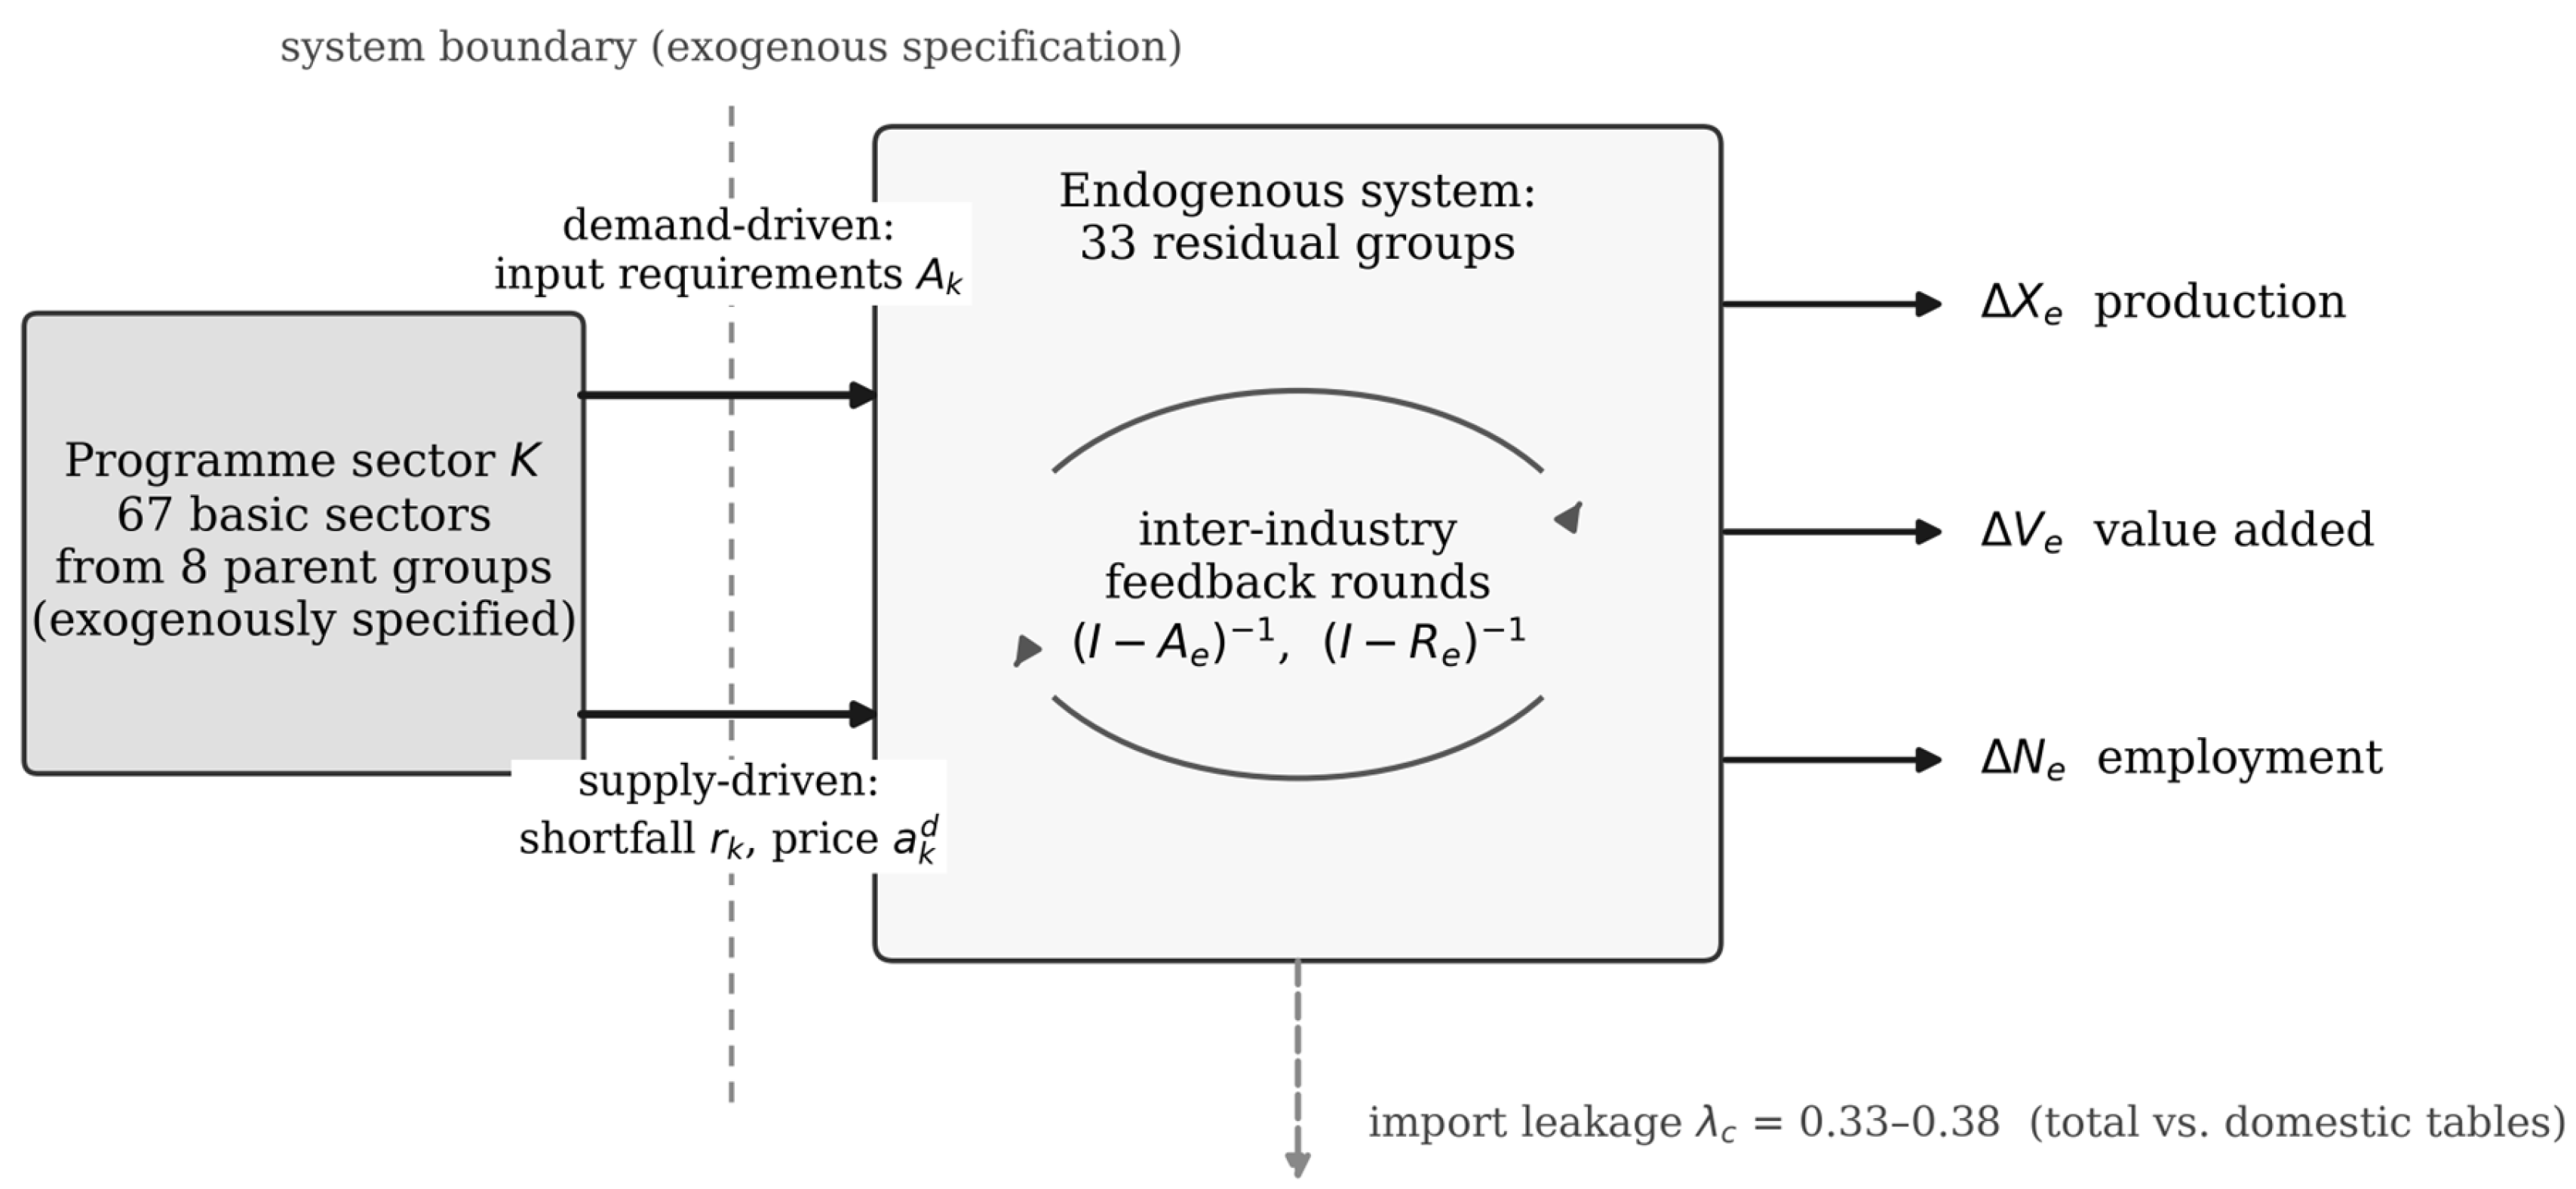
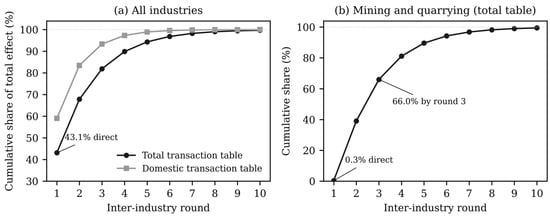
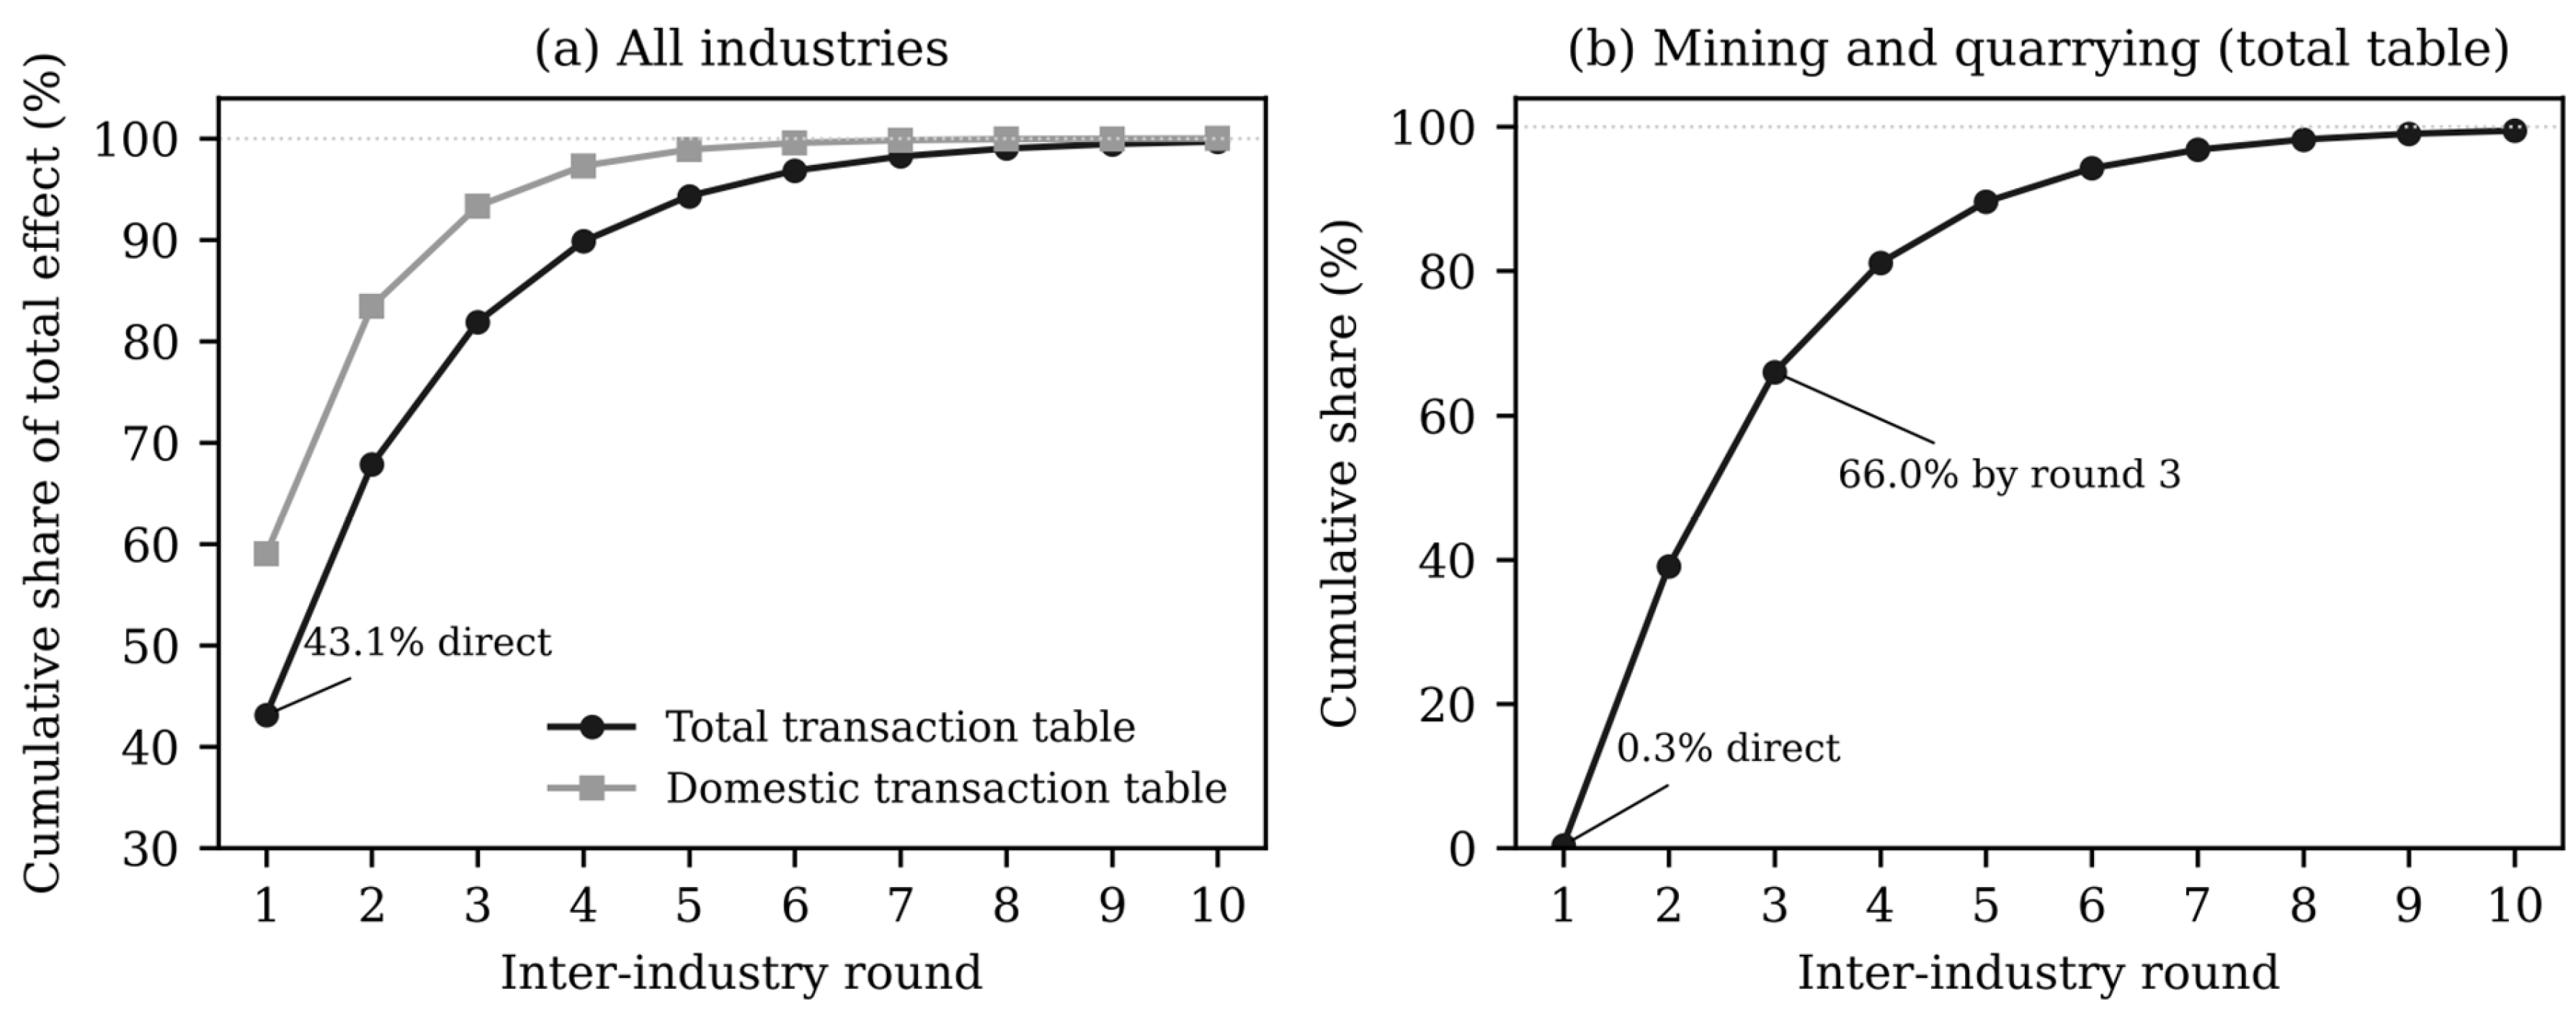
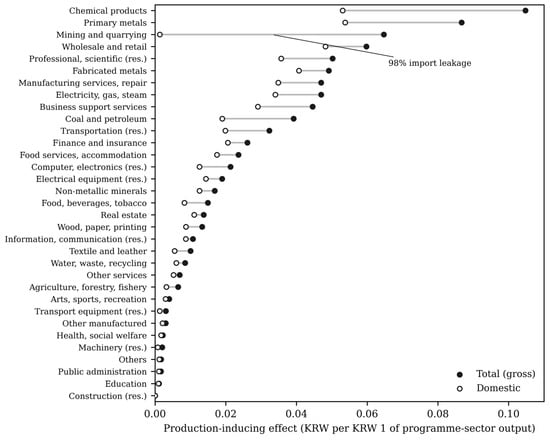
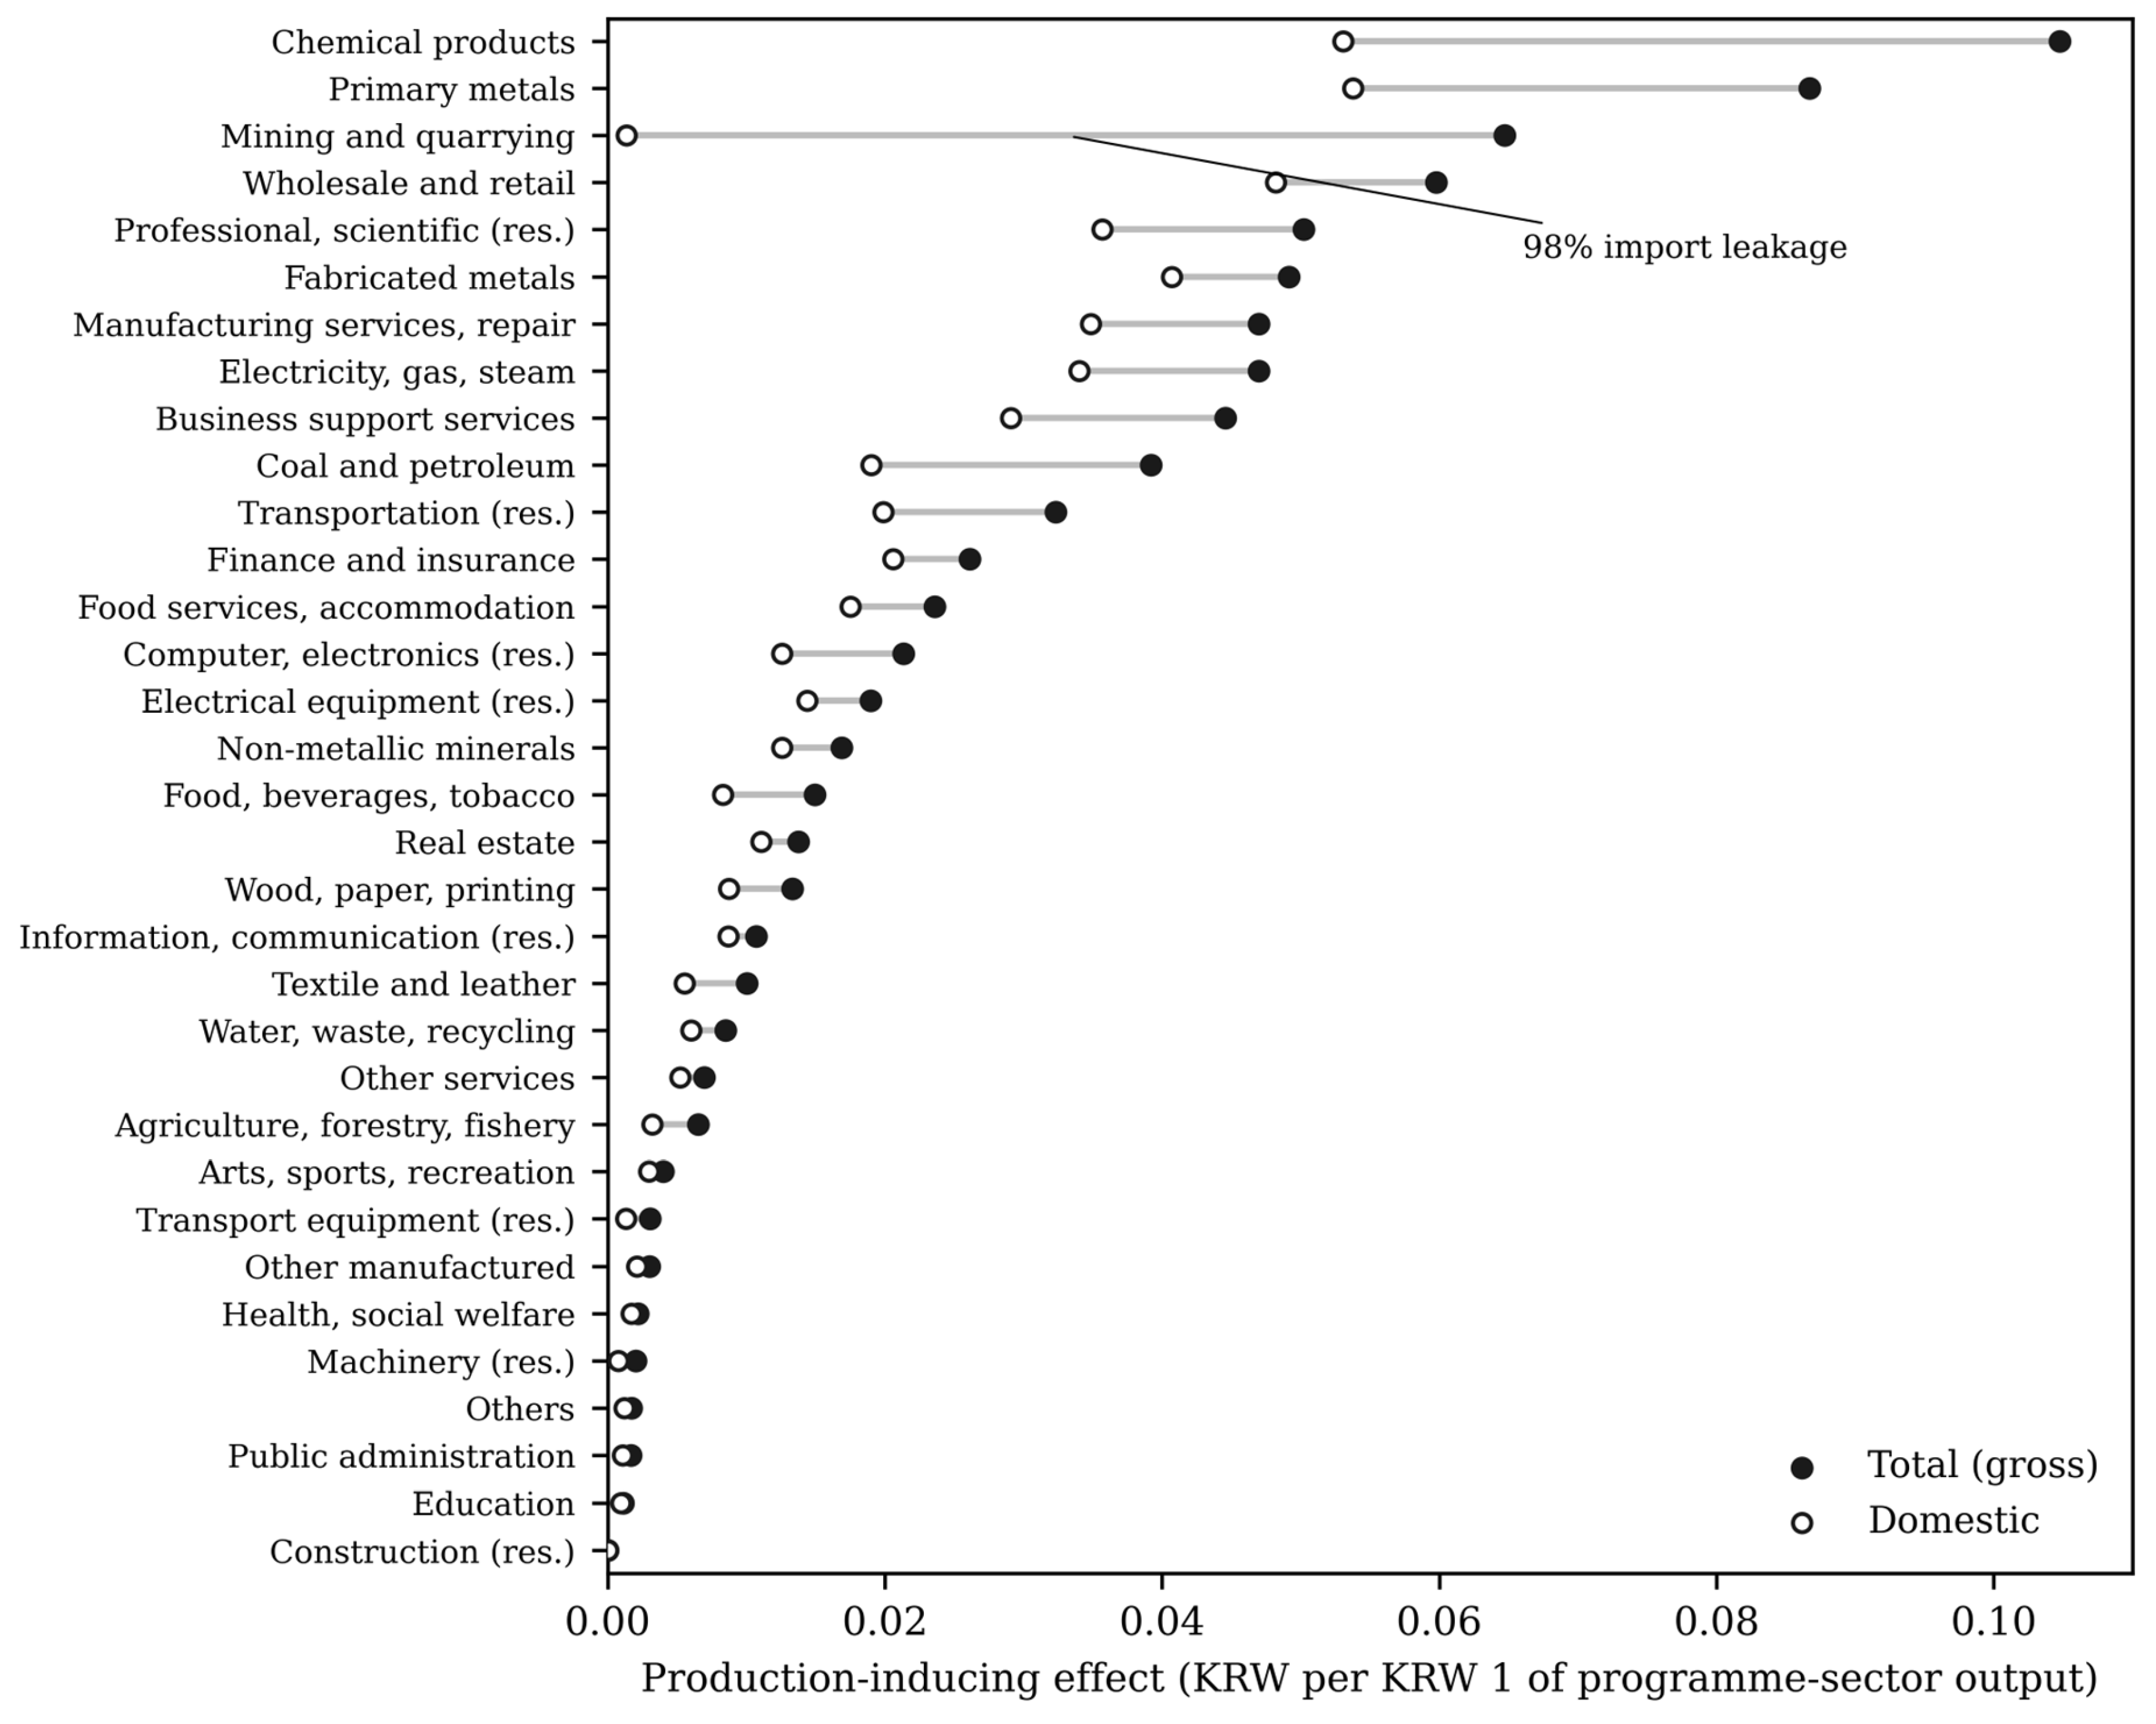

Disclaimer/Publisher’s Note: The statements, opinions and data contained in all publications are solely those of the individual author(s) and contributor(s) and not of MDPI and/or the editor(s). MDPI and/or the editor(s) disclaim responsibility for any injury to people or property resulting from any ideas, methods, instructions or products referred to in the content. |
© 2026 by the authors. Licensee MDPI, Basel, Switzerland. This article is an open access article distributed under the terms and conditions of the Creative Commons Attribution (CC BY) license.