


Highlights
Please indicate how your work links to systems science via your contributions to systems practice, theory, and/or methodology.
- Integrates monetary conditions, bank asset quality, financing structure, and renewable-energy transition within a systems framework.
- Identifies credit-risk pricing as a distinct channel linking banking conditions to renewable-energy outcomes.
What are the main findings and/or the implications of the main findings?
- Shows that elevated non-performing loans strengthen the adverse association between lending risk premia and renewable-energy shares.
- Demonstrates that bank-based financial depth alone does not necessarily translate into stronger renewable-energy transition.
Abstract
This study examines how real interest-rate conditions and bank-based financial depth are associated with bank asset quality and renewable-energy share in a longitudinal cross-country panel. The empirical design combines country and year fixed effects with country-clustered standard errors, model-specific attrition diagnostics, common-sample comparisons, and sensitivity estimators. The findings provide limited evidence that higher real rates coincide with weaker bank asset quality, no support for an association between bank depth and non-performing loans, mixed evidence of a negative real-rate association with renewable-energy share, and cautious evidence of a negative bank-depth association. The formal moderation hypothesis linking real rates, lagged non-performing loans, and renewable energy is unsupported. A supplementary matched-sample analysis instead indicates that higher lending risk premia are more adversely associated with renewable-energy share when lagged non-performing loans are elevated, although this pattern weakens under first differences and more aggressive outlier treatment. The evidence is therefore associational and mechanism-specific: asset-quality stress appears to condition credit-risk pricing rather than broad real-rate transmission. This study contributes by separating macro-rate transmission from a narrower credit-risk-pricing channel and by demonstrating the importance of inference, timing, sample comparability, and financing-system structure.
1. Introduction
Monetary and credit-price conditions are usually evaluated through inflation, output, lending, and financial-stability channels. Their sustainability implications are less direct because a common financing shock can reach renewable-energy activity through several routes: borrower debt service, bank loan pricing, external-finance premia, credit supply, and capital-market substitution [1,2,3,4,5,6,7]. The unit of analysis in this study is therefore the country–year, and all estimates are interpreted as conditional associations rather than as causal policy effects.
The banking channel is only one part of national finance. Large firms may issue bonds or equity and thereby bypass bank balance sheets, whereas smaller firms and infrastructure projects may remain bank dependent [8,9,10,11,12,13,14,15,16,17,18]. We hence operationalize bank-based financial depth as the ratio of private credit extended by banks to gross domestic product (GDP) and use market capitalization and total domestic private debt securities as additional matched-sample tests. Bank credit is therefore treated as a meaningful transmission channel but not as a complete description of external finance [10,13].
Renewable-energy transition is also shaped by resource endowments, energy intensity, access to electricity, institutional quality, and policy support, in addition to financing conditions [19,20,21,22,23,24,25,26,27,28,29]. The empirical models therefore add complete-year fixed effects for global common shocks and examine energy intensity, fossil-fuel rents, market capitalization, and private debt securities where data permit. These controls cannot eliminate all omitted-variable risks, but they permit more disciplined comparisons and reveal sensitivity to sample coverage [29,30].
This study asks three connected questions. First, are real interest-rate conditions and bank-based financial depth associated with bank asset-quality stress, measured by the non-performing-loan (NPL) ratio? Second, are those financial conditions associated with the renewable energy share? Third, does lagged asset-quality stress condition the renewable-energy association of a financing-price measure? “Interest-rate conditions” refers specifically to the World Bank real-interest-rate series in the formal hypotheses. Lending rates, interest-rate spreads, and the lending risk premium are distinct supplementary credit-price measures rather than interchangeable labels [31,32].
The contribution is mechanism specific. Country- and year-fixed-effect models with country-clustered standard errors do not support a broad real-interest-rate × NPL moderation relationship. A supplementary matched-sample analysis instead identifies a negative risk-premium × lagged-NPL interaction that is stable across timing, multiplicity, and influence checks but not under first differences or aggressive outlier treatment. The evidence therefore points to a narrower credit-risk-pricing association under high asset-quality stress, rather than to generalized claims about banking resilience or causal monetary-policy transmission [32,33,34,35].
The remainder of this paper synthesizes the relevant literature, develops five ex ante hypotheses and one explicitly supplementary question, describes the unbalanced panel and model-specific controls, presents the inferential sequence, and discusses the limits of the evidence. The formal hypothesis decisions are based on the prespecified real-rate models; the risk-premium analysis remains separate so that a mechanism-specific supplementary result is not treated as retrospective support for the formal real-rate hypothesis.
2. Literature Review
2.1. Monetary-Policy Transmission and the Banking System
The credit-channel literature distinguishes the direct cost-of-capital effect of interest rates from balance-sheet and bank-lending mechanisms [1,2,3,4]. At the borrower level, a higher real financing cost can reduce repayment capacity and raise the external-finance premium; at the bank level, deteriorating borrower performance can weaken loan-portfolio quality and alter screening, pricing, or credit supply. This agent-level sequence supplies the microeconomic logic linking a country-level rate indicator to the NPL ratio without equating every NPL movement with systemic failure.
Bank regulation and capital buffers can absorb expected and unexpected losses, so NPLs should not be described as a complete measure of financial stability. In this paper, the NPL ratio is used more precisely as an inverse indicator of bank asset quality. Higher NPLs indicate weaker loan-portfolio performance, but whether that deterioration becomes systemic also depends on provisioning, capital, liquidity, risk transfer, and supervision [36,37,38,39,40,41].
The credit spread and lending risk premium adds a conceptually different margin. The World Development Indicators (WDI) real interest rate is a lending rate adjusted for inflation, whereas the WDI lending risk premium is the lending-rate gap relative to a short-term government-security reference rate [31]. Euro-area evidence further shows that the stock of net NPLs is associated with newly granted lending rates, linking asset quality to a credit-pricing margin that is not identical to the broad real rate [32]. The analysis therefore compares these measures on a common sample rather than treating them as independent replications of the same construct.
2.2. Bank-Based Financial Depth and Intermediation
Financial development spans depth, access, efficiency, and stability [8,9,10,11,12]. Domestic credit to the private sector by banks captures the scale of bank intermediation, not the full availability of bond, equity, insurance, development-bank, or digital-finance channels. The construct is therefore labeled bank-based financial depth throughout this study [10,13].
A larger bank-credit sector can improve monitoring and formal access, but it can also reflect leverage accumulation or lending to mature carbon-intensive sectors [10,11,12,13,14,15,16]. Recent global evidence documents the banking sector’s continuing provision of syndicated debt to fossil-fuel companies, confirming that a large credit system is not inherently aligned with renewable investment [42]. The sign of bank depth’s association with NPLs or renewable energy is therefore not predetermined. More importantly, the two outcomes need not share a single mediation chain: bank depth may be unrelated to within-country NPL movements yet remain associated with how aggregate credit is allocated across energy uses.
Disintermediation is addressed empirically with market capitalization and outstanding domestic private debt securities. Because bank and nonbank credit can diverge, these measures help distinguish bank intermediation from broader private-credit provision [13]. Their narrower coverage requires the added-control estimates to be interpreted only within matched samples; the tests do not assume that market finance is an equivalent substitute for bank lending in every country [10,13].
2.3. Renewable-Energy Transition and Financial Conditions
Renewable-energy projects frequently involve high initial capital expenditure, long operating horizons, and sensitivity to discount rates [19,20,21,22,23,24,25,26,27,34,35]. Financing prices can therefore affect project feasibility and the timing of investment. The empirical outcome, however, is renewable energy as a share of total final energy consumption, so it also reflects legacy energy systems, demand composition, and policy choices rather than investment finance alone [29].
Prior findings on financial development and renewable energy are mixed across samples and methods [19,20,21,22,23,24,25]. A positive association can arise when finance relaxes project constraints; a negative association can arise when credit supports conventional production or when renewable-intensive low-access economies have shallow formal finance. The literature therefore motivates conditional tests and careful sample diagnostics rather than an assumption that more credit is automatically greener.
The control strategy follows that synthesis. Economic growth, inflation, trade openness, and institutional quality enter all core models; energy access enters renewable-energy models; and energy intensity and fossil-fuel rents are added in sensitivity tests. The inclusion of political, socioeconomic, and country-specific energy factors is consistent with comparative evidence on the determinants of renewable-energy deployment [29]. Country fixed effects absorb persistent geography and resource differences, while year fixed effects absorb common annual shocks [30].
2.4. Systems Perspective and Research Gap
A systems perspective is useful only if it clarifies interactions rather than relabeling correlations [43,44,45]. In the present setting, the monetary-price signal, bank asset quality, the scale of bank intermediation, nonbank financing capacity, and the energy mix are connected but non-equivalent subsystems. The empirical task is to test whether their relationships change with system state while retaining the limits of macro-level observational data.
The research gap is therefore specific: does bank asset-quality stress condition the association between a credit-price measure and renewable-energy share after separating the formal real-rate hypothesis from supplementary pricing measures? The distinction follows evidence that impaired loans are associated with both credit quantity and newly granted lending rates, while renewable projects are particularly sensitive to financing costs [32,33,34,35]. If capital and liquidity interactions are absent, the evidence cannot be generalized from NPLs to banking resilience [46].
Five hypotheses structure the conceptual sequence. H1–H4 examine direct country-level associations. H5 concerns the real-rate × lagged-NPL interaction and is explicitly an asset-quality-stress hypothesis. A subsequent supplementary question examines whether a more risk-specific lending-price measure produces a conditional pattern that the broad real-rate proxy does not [31,32].
3. Theoretical Framework and Hypotheses Development
3.1. System-Based Credit-Transmission Framework
The framework combines the bank credit channel with an agent-based financing sequence. Borrowers compare expected project returns with debt-service and external-finance costs; banks price, screen, and ration loans subject to asset quality, capital, and liquidity; firms with market access may substitute bonds or equity; and the observed energy share aggregates those financing decisions with technology, policy, and resource conditions [1,2,3,4,5,6,7,8,9,10,11,12,13,14,15,16,17,18,19,20,21,22,23,24,25,26,27,28,43,44,45]. This micro-to-macro sequence provides theoretical logic while recognizing that the available data identify country-level associations only.
Real interest rates, lending rates, interest-rate spreads, and risk premia are not treated as synonyms. The real rate is the formal macro-financing indicator used in H1, H3, and H5. Lending rates are a related nominal price, the spread captures the lending–deposit margin, and the lending risk premium is the lending rate minus a short-term reference rate [31]. The latter two measures are used to assess whether any conditional association is specific to credit-risk pricing [32].
Direct and conditional hypotheses are separated. A direct association between bank depth and renewable energy does not require bank depth first to affect NPLs; it may operate through sectoral credit allocation. Conversely, interaction with NPLs does not prove that NPLs cause the outcome. Lagging the moderator reduces contemporaneous conditioning on a potential post-treatment variable, but it does not by itself resolve endogeneity: lag identification can shift the untestable assumption to the dynamics of unobserved factors and can still yield incorrect inferences [47]. Residual dynamic endogeneity is therefore addressed through cautious interpretation and first-difference sensitivity tests.
3.2. Interest-Rate Conditions and Bank Asset Quality
A rise in real borrowing costs can weaken repayment capacity by increasing the debt-service burden of variable-rate and refinanced loans. Cross-country evidence identifies the lending rate as a significant macroeconomic determinant of non-performing loans and attributes the relationship to higher debt-service costs, while sectoral evidence likewise links interest-rate increases to impaired repayment performance [36,37]. At the bank-portfolio level, this borrower-side pressure can appear as a higher NPL ratio.
The strength of that association should vary with borrower composition and loan-contract structure. Evidence from Greece shows that lending rates have especially noticeable effects for consumer non-performing loans and documents both direct and longer-run effects across loan categories [36]. Global evidence also reports that the lending-rate association persists after accounting for growth, unemployment, exchange rates, and equity prices, which supports treating the rate channel as distinct from the general macroeconomic cycle [37].
Asset-quality deterioration can also feed back into bank behavior. Higher NPL ratios are associated with weaker loan growth across countries, and this relationship varies with bank capitalization [33]. Net NPL stocks are also positively associated with rates on newly granted loans, while loan-loss reserves partly offset that pricing relationship [32]. These findings imply that NPLs capture impaired portfolio performance, not complete banking instability, and that buffers can modify the transmission of borrower stress.
The distinction between ex ante pricing and the quality of the portfolio realized is crucial. H1 does not assume that lenders do not price the expected credit risk at origination, nor does it imply that a higher NPL ratio necessarily reduces the risk-adjusted return of the lender. It asks whether changes in actual funding conditions at the country level are linked to the actual write-down of the loan portfolio. Once asset quality deteriorates, the stock of non-performing loans may still coincide with a lower growth in loans or higher mark-ups on newly issued loans, subject to capitalization and coverage of loan losses [32,33].
Taken together, the debt-service and bank-response mechanisms predict a positive conditional association between the real interest rate and the NPL ratio. The prediction is deliberately associational because fixed effects and controls cannot identify an exogenous policy-rate shock or remove all time-varying confounding [32,33,36,37]. Thus, the following hypothesis is proposed:
H1.
Real interest-rate conditions are positively associated with bank asset-quality stress, measured by the NPL ratio [36,37].
3.3. Bank-Based Financial Depth and Bank Asset Quality
Deeper financial systems can ease external-finance constraints by improving information production, risk evaluation, corporate control, and the allocation of capital [10,13]. When these functions operate through banks, a larger formal credit sector may improve screening and monitoring and distribute exposure across a broader borrower base. This mechanism predicts stronger portfolio performance as bank-based financial depth expands.
Credit quantity is nevertheless an imperfect measure of financial-system quality. Private credit can be supplied by banks or by nonbank intermediaries, and the two measures can diverge when market-based or shadow-banking activity expands [13]. Bank credit relative to GDP therefore captures the scale of bank intermediation, not the full depth, access, efficiency, or stability of the national financial system [10,13].
The relationship can also turn adverse when finance becomes excessive or is allocated toward household leverage, speculative activity, or other uses with weak productive returns. Evidence on the non-monotonic effects of financial depth emphasizes that the allocation and composition of credit matter, while evidence on NPLs shows that impaired portfolios can subsequently constrain loan growth [13,33]. A large banking sector is therefore not sufficient evidence of sound credit allocation.
These competing mechanisms yield a nondirectional prediction. The test asks whether within-country changes in bank-based financial depth are associated with the NPL ratio, conditional on the common controls and fixed effects. It remains logically separate from the renewable-energy hypothesis because the scale of bank credit may affect sectoral allocation even when it does not predict average portfolio impairment [10,13,33].
Since these mechanisms can work in opposite directions, and because aggregate data cannot determine whether the depth of banks precedes the quality of assets or whether weaker borrowers remain more dependent on banks, H2 is deliberately non-directional. This is an ex ante inter-country association test and not a statement that the depth of the banks is causing the NPLs or that the NPLs are causing the depth of the banks [10,13,33]. Thus, the following hypothesis is proposed:
H2.
Bank-based financial depth is associated with bank asset-quality stress.
3.4. Interest-Rate Conditions and Renewable-Energy Transition
Renewable-power projects commonly require high up-front capital expenditure while incurring little or no fuel costs during operation. Their levelized cost is consequently more sensitive to the weighted average cost of capital than that of fuel-intensive conventional generation [34]. A higher real financing rate can therefore raise the cost of developing renewable capacity even when the underlying energy resource is unchanged.
Cross-country solar evidence demonstrates the economic importance of this channel: differences in financing costs can outweigh differences in solar irradiation when explaining levelized electricity costs [35]. Because investment outlays are recovered over long operating horizons, discounting affects the present value of future revenues and can delay or prevent projects near the viability margin [34,35]. This mechanism predicts a negative rate–renewable-energy association.
Renewable energy as a share of final consumption is not, however, a direct measure of project investment. Comparative evidence identifies energy security, policy design, renewable-resource conditions, and the incumbent energy mix as important determinants of renewable-energy growth [29]. These factors can amplify, attenuate, or offset the financing-cost channel, particularly in a heterogeneous cross-country panel.
The resulting prediction is a negative conditional association rather than a universal financing effect. Country and year fixed effects, energy-system controls, matched-sample comparisons, and sensitivity estimators are used to separate the proposed financing mechanism from persistent national characteristics and common shocks, while the interpretation remains associational [29,34,35]. Thus, the following hypothesis is proposed:
H3.
Real interest-rate conditions are negatively associated with renewable-energy transition.
3.5. Bank-Based Financial Depth and Renewable-Energy Transition
Financial development can support renewable-energy use when financial institutions relax external-finance constraints and mobilize capital for investment [10,19]. Cross-country evidence reports a positive full-sample relationship between financial development and renewable-energy consumption that is driven principally by the financial-institution component [19]. This mechanism predicts that deeper bank intermediation can support transition activity when credit reaches renewable generation and related infrastructure.
The effect is heterogeneous rather than automatic. The renewable-energy relationship differs across levels and dimensions of financial development, and evidence on stock-market development and foreign investment likewise shows that institutional context shapes clean-energy outcomes [19,26]. Bank credit and market finance should therefore be treated as distinct financing channels rather than as interchangeable indicators of one latent construct.
Bank depth is also not inherently green. Global evidence documents the banking sector’s continuing and substantial provision of bonds and syndicated loans to fossil-fuel companies [42]. Comparative research further shows that the incumbent energy mix and policy environment influence renewable-energy growth [29]. Additional bank lending can consequently support conventional as well as renewable activity, making the net sign theoretically ambiguous.
H4 therefore tests the net within-country association without imposing a positive direction. Matched-sample controls for market capitalization, private debt securities, energy intensity, and fossil-fuel rents are used to distinguish the bank-depth coefficient from nonbank financing capacity and energy-system structure [13,19,26,29,42].
National regressors should not be interpreted as project financial allocations. The depth of banks at the country level does not determine whether a renewable energy project is financed by domestic banks, cross-border syndicates, foreign direct investment (FDI) or securities markets [7,26,27]. The core data also do not separately capture the structure of renewable-energy policy in individual countries. The comparative evidence already mentioned shows that the uptake is sensitive to feed-in tariffs and other policy incentives [29]; therefore guarantees, off-takes and grid support may remain among the unmet project conditions. Thus, H3 and H4 do not estimate a project-specific cost of capital or determine the domestic origin of finance; instead, they test reduced-form national associations following fixed effects and available controls.
H4.
Bank-based financial depth is associated with renewable-energy transition.
3.6. Bank Asset Quality as a Moderator
H5 concerns asset-quality stress rather than generalized banking resilience. Cross-country bank-level evidence associates higher NPL ratios with lower loan growth, with the strength of the relationship varying by capitalization [33]. This evidence supports a restricted credit-quantity mechanism: impaired portfolios can coincide with weaker lending, but the NPL ratio does not by itself measure capital adequacy, liquidity, or the probability of systemic failure.
Asset-quality stress can also operate through price. Net NPL stocks are positively associated with rates on newly granted loans, while loan-loss reserves partly offset that association [32]. The result supports a credit-risk-pricing mechanism in which impaired assets can coincide with a wider borrower-facing financing margin, without implying that every increase in NPLs mechanically causes a uniform price response.
Renewable-energy projects are particularly exposed to this financing state because high up-front capital expenditure and low fuel costs make their levelized cost sensitive to the weighted average cost of capital [34]. Cross-country solar evidence further shows that financing-cost differences can outweigh resource-quality differences in explaining levelized costs [35]. A financing-price increase may therefore be more adverse for renewable-energy activity when bank asset quality is already weak.
Combining these mechanisms produces a state-dependent prediction. If impaired assets coincide with weaker loan growth or higher lending prices, and renewable projects are unusually sensitive to financing costs, then the adverse association between real interest-rate conditions and renewable-energy share should strengthen as lagged NPLs rise [32,33,34,35]. This is a specific asset-quality mechanism, not a claim that all dimensions of banking resilience operate identically.
The timing choice remains an inferential limitation. Lagged NPLs reduce reliance on a contemporaneous moderator that can itself respond to rate and macroeconomic conditions, but lagging does not establish exogeneity and can shift the identifying assumption to unobserved dynamics [47]. Capital and liquidity are separate, interrelated balance-sheet dimensions and are therefore examined only as distinct sensitivity moderators [46].
The one-year lag is not intended to replicate the quarterly internal risk review cycle of banks or to imply that lenders are not taking the most recent financial information into account. It is a time-ordering choice for the annual moderator at the country level. The empirical analysis therefore compares the current-NPL model with the lagged and strict-lag specifications. As each version remains observational, the lag is used as protection against concurrent conditions and not as an identification tool [47].
H5.
Lagged bank asset-quality stress, measured by the NPL ratio, moderates the association between real interest-rate conditions and renewable-energy transition, such that the association becomes more negative as lagged NPLs rise.
3.7. Supplementary Credit-Risk-Pricing Question
The formal H5 test is distinct from a mechanism-specific supplementary question. If the broad real-rate × lagged-NPL interaction is absent, does the lending risk premium—which measures the lending-rate gap relative to a short-term reference rate—show an NPL-conditioned association with renewable-energy share [31]? Evidence that net NPL stocks are related to newly granted lending rates provides the credit-pricing rationale for this comparison [32]. The question is examined on matched samples across four credit-price measures, with multiplicity correction and explicit sensitivity tests.
The supplementary test is not used to redefine or retroactively support H5. Its role is to determine whether any conditional association is better described as asset-quality-conditioned credit-risk pricing than as generalized real-rate transmission. Keeping the constructs separate follows, both the World Bank definitions and evidence linking impaired assets specifically to newly granted lending rates [31,32].
4. Materials and Methods
4.1. Data, Sample, and Sample Construction
The dataset is an unbalanced annual country–year panel assembled for 2000–2025 from the World Development Indicators (WDI), Worldwide Governance Indicators (WGI), Global Financial Development Database, and the World Bank’s historical income classifications [31,48,49]. The 5642 figure is the 217 × 26 grid of potential country–year cells, not a count of complete observations. Regional and income aggregates are excluded.
Coverage differs sharply by variable. For example, renewable-energy share has 4702 observations, NPLs 2105, the real rate 3065, and the lending risk premium 1663. Listwise deletion therefore produces model-specific samples: 1209 observations/95 countries for Model 1, 2129/128 for Model 2, 1109/93 for the contemporaneous Model 3, 1032/92 for the preferred lagged-NPL model, and 570/56 for the risk-premium model. Table 1 reports coverage, estimation years, and average years per country.
Table 1.
Variable coverage and estimation-sample audit.
Sample composition is not random. Within the Model 2 sample, observations excluded from the Model 3 sample have a higher mean renewable share (32.84 versus 29.70; p = 0.011) and lower electricity access (74.64 versus 86.83; p < 0.001). Risk-premium availability creates a further shift. These comparisons are reported rather than treated as a problem that fixed effects automatically solve.
4.2. Variable Definitions and Sources
The outcome labeled NPL is bank non-performing loans to total gross loans (%); higher values mean weaker asset quality. Renewable-energy transition is renewable energy consumption as a share of total final energy consumption. The formal rate measure is the WDI real interest rate, defined as a lending rate adjusted for inflation [31,48].
Bank-based financial depth is domestic credit to the private sector by banks (% of GDP). Model 1 controls growth, inflation, trade openness, and institutional quality. Models 2–4 add electricity access because it is an energy-system control. Energy intensity, fossil-fuel rents, market capitalization, and outstanding domestic private debt securities are added only in the relevant matched-sample sensitivity models [31,48,49]. Table 2 states these model-specific roles explicitly.
Table 2.
Variable definitions, model roles, and sources.
4.3. Model Specification
The core estimators include country fixed effects (αc) and complete-year fixed effects (λt), following standard panel-data practice [30,50]. Country effects absorb time-invariant geography, legal traditions, and persistent financial structure. Year effects absorb all common annual shocks, including COVID-19, the 2022 energy shock, and the global tightening/easing cycle; separate overlapping event dummies are therefore not jointly identified with the year indicators.
Annual consumer price inflation is included in all core specifications, and the World Bank’s real interest-rate policy adjusts the credit rate for inflation [31,48]. The full-year effects absorb common global price shocks. The models do not specifically identify country-specific inflation volatility or changes in the plausibility of the price regime; these remain residual macroeconomic constraints.
Model 1: NPLct = αc + λt + β1RealRatect + β2BankDepthct + γ′X1,ct + εct
Model 2: RETct = αc + λt + β1RealRatect + β2BankDepthct + γ′X2,ct + εct
Model 3: RETct = αc + λt + β1RealRatect + β2NPLc,t − 1 + β3(RealRatect × NPLc,t − 1) + β4BankDepthct + γ′X2,ct + εct
Supplementary Model 4 replaces RealRate in Model 3 with the lending risk premium. The country-specific intercept αc is absorbed by fixed effects and is not interpreted as the renewable-energy share or NPL ratio when every observed regressor equals zero. Year coefficients are included in estimations but compressed in the tables to a single “Years included” row.
H1 and H2 are evaluated in Model 1, H3 and H4 in Model 2, and H5 in Model 3. The supplementary risk-premium interaction is evaluated in Model 4 and is not used to change the formal H5 decision.
4.4. Estimation, Diagnostics, and Robustness Strategy
The preferred inference uses country-clustered standard errors because observations can have correlated disturbances within countries over time; cluster-robust inference is designed for precisely this grouped-error structure [51]. Serial correlation and groupwise heteroskedasticity are also detected. All core specifications include country and year fixed effects. Model 2 is re-estimated on the Model 3 sample, and current-NPL and lagged-NPL interaction models are bridged on an identical sample before the preferred lagged specification is estimated.
Diagnostics include within-transformed variance inflation factors (VIFs), partial correlations, a Wooldridge–Drukker serial-correlation test [52], a modified Wald test, cross-sectional-dependence diagnostics, and Fisher-type unit-root tests. Because renewable-energy share and bank depth fail to reject the unit-root null in levels, first-difference and Driscoll–Kraay results are reported as sensitivity evidence. Driscoll–Kraay covariance estimates are robust to general forms of spatial and temporal dependence under their stated large-time-dimension conditions [53]; neither this estimator nor fixed effects is presented as resolving endogeneity. The supplementary risk-premium analysis reports common-sample comparisons with the real rate, lending rate, and interest-rate spread; a four-test Bonferroni adjustment; contemporaneous and strict-lag bridges; within-year winsorization and trimming; leave-one-country-out estimates; first differences; and marginal effects. Core variables retain the prespecified within-year outlier treatment. Risk-premium results are shown for the untransformed WDI series and for 1/99, 2.5/97.5, and 5/95 alternatives, including null sensitivity outcomes [31]. All analyses were performed in Stata 15.0 (StataCorp LLC, College Station, TX, USA).
5. Results
5.1. Descriptive Statistics and Sample Composition
Table 3 reports the main descriptive statistics and the sample-selection comparisons. The NPL ratio varies meaningfully (mean = 6.18; standard deviation (SD) = 5.62), while the risk-premium subsample is smaller and positively skewed (mean = 7.24; SD = 8.73). Model 3 retains a larger share of upper-middle-income observations and a smaller share of low-income observations than Model 2. The excluded and included observations also differ in renewable-energy share and electricity access, so cross-model coefficient changes cannot be attributed to moderation alone.
Table 3.
Descriptive statistics and sample-selection comparisons.
5.2. Multicollinearity and Panel-Data Diagnostics
Within-transformed VIFs are low (mean = 1.18; maximum = 1.30), so institutional quality is not suppressing H2 through material multicollinearity. Removing institutional quality leaves the bank-depth coefficient small and nonsignificant (β = −0.0145, p = 0.513). Serial correlation and groupwise heteroskedasticity are strong, supporting country-clustered inference. Unit-root tests fail to reject the null for renewable-energy share and bank depth; Driscoll–Kraay and first-difference estimates are therefore reported and used to qualify the level results. Table 4 summarizes these diagnostics and sample-composition checks.
Table 4.
Multicollinearity, panel diagnostics, and sample-composition checks.
5.3. Main Two-Way Fixed-Effect Results
Model 1 yields a positive real-rate coefficient for NPLs (β = 0.056, p = 0.055). This is marginal at the 10% level rather than conventional 5% support, so H1 receives limited evidence. Bank-based financial depth is nonsignificant (β = −0.014, p = 0.533), and the same conclusion holds without institutional quality; H2 is not supported. Table 5 reports the four core fixed-effects specifications.
Table 5.
Two-way fixed-effect models with country-clustered standard errors.
In Model 2, the real-rate coefficient is negative but marginal (β = −0.038, p = 0.089), and it becomes nonsignificant on the Model 3 sample (p = 0.186), under Driscoll–Kraay inference (p = 0.112), and in first differences (p = 0.309). H3 therefore receives mixed rather than robust support. Bank depth is negative and marginal in the full sample (β = −0.050, p = 0.062), significant on the Model 3 sample (β = −0.057, p = 0.023), and remains significant under Driscoll–Kraay and first differences; H4 is supported with a negative sign and explicit sample qualifications.
The preferred Model 3 uses lagged NPLs. The real-rate × lagged-NPL interaction is small and nonsignificant (β = −0.004, p = 0.480), and the contemporaneous clustered version is also nonsignificant (p = 0.240). H5 is therefore not supported. This decision is not changed by the supplementary risk-premium evidence reported below.
5.4. Matched Credit-Price Comparison and Risk-Premium Marginal Effects
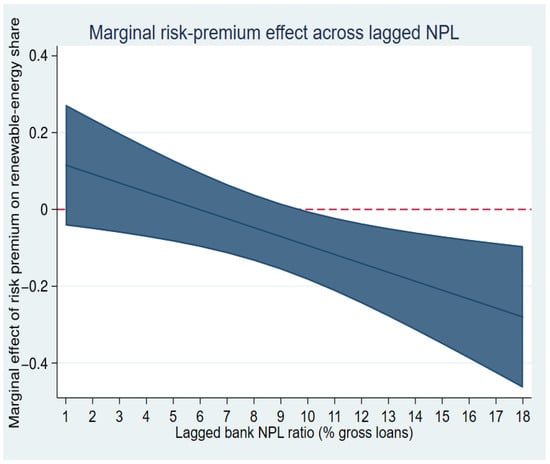
On the four-price common sample, only the lending-risk-premium × lagged-NPL interaction is significant (β = −0.0242, p = 0.0087; Bonferroni-adjusted p = 0.035). The corresponding real-rate, lending-rate, and interest-spread interactions are null. In the preferred 570-observation risk-premium sample, marginal effects are not significant at lagged NPL values from 1% through 9%; they become negative at 10% (−0.0939, p = 0.0386) and grow in magnitude thereafter. The 10% point is an observed high-stress region, not a universal regulatory crisis cutoff. Table 6 reports the matched interactions and marginal effects.
Table 6.
Matched credit-price interactions and risk-premium marginal effects.
5.5. Timing, Specification Bridge, and Post-Treatment Safeguards
The specification bridge changes one feature at a time. Adding year fixed effects leaves the conventional-standard-error real-rate interaction significant, but country clustering more than doubles its standard error and raises p to 0.240. Restricting to the common lag-eligible sample and then replacing current with lagged NPL produces similarly null estimates. The strict-lag and first-difference versions are also null. The contrast shows that the apparent H5 relationship depends on conventional rather than country-clustered standard errors and is not stable across the preferred inferential sequence [47,51]. Figure 1 visualizes the risk-premium marginal-effect profile, and Table 7 reports the timing and specification bridge.
Figure 1.
Marginal effect of the lending risk premium on renewable-energy share across lagged non-performing-loan (NPL) ratios (95% confidence intervals). The solid blue line represents the estimated marginal effect, the blue shaded area indicates the 95% confidence interval, and the red dashed horizontal line marks zero.
Table 7.
Timing, specification bridge, and first-difference checks.
5.6. Added Controls and Disintermediation Checks
Energy intensity and fossil-fuel rents do not overturn the negative bank-depth coefficient in the renewable-energy model, although significance varies with coverage. Market-capitalization and private-debt controls substantially reduce the sample and yield imprecise focal estimates. The joint disintermediation model has only 276 observations and 22 countries, so it is informative about sensitivity, not a replacement for the core specification. Across added-control H5 models, the real-rate × lagged-NPL interaction remains nonsignificant. Table 8 reports these added-control and disintermediation checks.
Table 8.
Additional controls and disintermediation checks.
The risk-premium interaction is stable in contemporaneous, lagged-common-sample, strict-lag, Driscoll–Kraay, 2.5/97.5 winsorized, 2.5/97.5 trimmed, and leave-one-country-out checks. It is negative in all 56 leave-one-out estimates and significant in 54. However, the first-difference estimate and the 5/95 winsorized estimate are nonsignificant. Interactions using lagged bank capital and liquidity are also null, confirming that the evidence is specific to NPL-based asset-quality stress rather than generalized banking resilience. Capital has a smaller SD than NPL, but liquidity has a larger SD; limited dispersion alone therefore cannot explain both null results. Table 9 presents these sensitivity results, and Table 10 summarizes the formal hypothesis decisions and the boundary of the supplementary finding.
Table 9.
Risk-premium sensitivity checks and alternative bank indicators.
Table 10.
Hypothesis and supplementary-test decision summary.
6. Discussion
Overall, the results provide selective rather than uniform support for the hypotheses as proposed but provide greater insights into the conditions under which the hypothesized relationships arise, distinguishing the broader real-rate moderation effect from the more specific supplementary risk-premium channel and also demonstrating how inference, temporal specification, and sample composition influence the observed relationships, thus helping clarify the boundaries of the proposed mechanisms and lending support to interpretation of the contribution of this study.
H1 receives limited evidence: the real rate is positively associated with the NPL ratio at the 10% level in the two-way fixed-effect model, but the lagged-rate estimate is nonsignificant. This pattern is consistent with evidence that lending rates affect borrower debt-service burdens and non-performing loans [36,37], while remaining too fragile for a strong causal claim. The NPL ratio is therefore interpreted as bank asset-quality stress rather than as a complete measure of banking-system stability [32,33]. At the hypothesis level, this implies that the debt-service channel as predicted is visible, but it is not stable enough to be considered a robust cross-country regularity. Empirically, this could mean that higher real borrowing costs go along with deterioration in loan performance [37], but the evidence does not suggest that this mechanism works uniformly once temporal ordering is enforced.
H2 is not supported, and the diagnostic evidence rejects multicollinearity with institutional quality as the explanation. This null does not contradict H4. H2 concerns whether the scale of bank credit predicts the average NPL ratio; H4 concerns whether that scale is associated with the allocation and composition of finance relevant to the energy mix. Financial depth can affect capital allocation even though bank-credit quantity is an incomplete measure of financial-system quality, and impaired portfolios can affect lending without serving as a necessary mediator of every sectoral credit relationship [10,13,33]. Therefore, the lack of support for H2 implies that bank asset quality and financial-system scale are empirically different dimensions: growth in bank credit in relation to GDP does not, by itself, reveal whether loan portfolios improve or deteriorate. The outcome emphasizes the quality and composition of credit allocation more than just credit volume [13].
H3 receives only mixed evidence. The negative level coefficient is marginal and does not survive the common-sample, Driscoll–Kraay, or first-difference checks. H4 is comparatively more stable: bank depth is negatively associated with renewable-energy share in the common sample and under both Driscoll–Kraay and first differences. The sign should not be interpreted as finance being intrinsically harmful; banks provide substantial finance to fossil-fuel companies, while renewable-energy growth also depends on policy and the incumbent energy mix [29,42]. Credit allocation toward conventional sectors and the composition of the unbalanced sample are therefore plausible, but unobserved, explanations. With respect to H3, the predicted effect of the financing cost measure is consistent with the theory but depends on the specification used, such that general real interest-rate conditions represent just one of many factors affecting renewable energy share [29,34,35]. Yet, the H4 negative correlation suggests that higher levels of bank involvement in the sample are associated with lower levels of renewables; one plausible factor is credit allocation, and not necessarily a causal one [29,42].
The formal H5 is not supported once country clustering and lagged asset quality are used. The supplementary result is narrower: the price component most closely related to risky lending, rather than the broad real rate, becomes more negatively associated with renewable-energy share as lagged NPLs rise. This interpretation is consistent with evidence relating net NPL stocks to newly granted lending rates [32] and with the financing-cost sensitivity of capital-intensive renewable projects [34,35]. Because the real-rate, lending-rate, and spread interactions are null on the same sample, the evidence is better described as asset-quality-conditioned credit-risk pricing. The unsupported H5 is also informative because it specifically disconfirms the stronger hypothesis that lagged asset-quality stress is associated with a stronger renewable-energy association of the broad real interest rate. This additional risk-premium finding restricts the mechanism: the NPL conditioning factor appears to be relevant only when the financing-price measure is explicitly linked to lending risk, not when it represents the economy-wide real cost of borrowing [32,34,35].
The marginal-effect pattern is concentrated at lagged NPL ratios around 10% and above. We do not label 10% as a universal crisis threshold or infer that central banks should mechanically ease or supervisors should grant forbearance. The policy implication is more limited: because NPL stocks can be associated with lending prices [32] and financing costs materially affect capital-intensive renewable projects [34,35], monetary, supervisory, and energy-finance authorities should monitor both indicators when asset-quality stress is already high. The observational estimates do not establish that the channel operates in this sample or identify the welfare-optimal policy response.
Several limitations materially bound this contribution. NPL and risk-premium coverage selects a nonrandom subset of countries and years; the risk sample differs in renewable share and electricity access. Renewable-energy share and bank depth show nonstationary features in levels. First-difference and aggressive outlier-treatment results are null for the risk interaction. Capital-market controls are available for small matched samples, and aggregate country data cannot observe project-level optimization, risk pricing, green-credit allocation, or regulatory capital adequacy. These limitations make this contribution genuine but incremental. Fixed country and annual effects, the inflation rate observed and corresponding non-financial controls do not absorb changes in the design of renewable support, the availability of cross-border project finance or inflation volatility in individual countries. Therefore, models at the country level should not be interpreted as tests for project finance attribution.
7. Conclusions
This study re-examines the links among real interest-rate conditions, bank-based financial depth, bank asset quality, and renewable-energy share using two-way fixed effects and country-clustered inference. H1 receives limited evidence, H2 is not supported, H3 is mixed, H4 is supported with a negative and sample-sensitive sign, and the formal real-rate × lagged-NPL H5 is not supported.
A supplementary matched-sample analysis identifies a negative lending-risk-premium × lagged-NPL interaction that survives multiplicity correction, strict lags, Driscoll–Kraay inference, moderate outlier treatment, and most leave-one-country-out checks. The marginal effect becomes negative in the observed high-stress region around NPL ratios of 10% and above. This finding preserves a narrower version of this paper’s novelty: asset-quality stress appears to condition credit-risk-price associations with renewable-energy transition.
The result is not evidence that broad monetary tightening generally reduces renewable energy, that NPLs capture all dimensions of resilience, or that the estimated interaction is causal. Nonrandom coverage, level nonstationarity, and the null first-difference and 5/95 sensitivity results remain important constraints. Future work should use project- or bank-level lending data, policy-rate shocks, green-credit allocation, and richer capital-market measures to distinguish pricing, rationing, and substitution mechanisms.
Author Contributions
Conceptualization, O.A. and M.S.; methodology, O.A. and M.S.; software, O.A.; validation, O.A. and M.S.; formal analysis, O.A.; investigation, O.A. and M.S.; resources, O.A. and M.S.; data curation, O.A.; writing—original draft preparation, O.A.; writing—review and editing, O.A. and M.S.; visualization, O.A.; project administration, O.A. and M.S. All authors have read and agreed to the published version of the manuscript.
Funding
This research received no external funding.
Data Availability Statement
The data are compiled from publicly available World Bank databases. The processed country–year dataset, Stata 15.0 code, model logs, and exported result tables are available from the authors and can be deposited with the accepted article.
Conflicts of Interest
The authors declare no conflicts of interest.
References
- Bernanke, B.S.; Gertler, M. Inside the black box: The credit channel of monetary policy transmission. J. Econ. Perspect. 1995, 9, 27–48. [Google Scholar] [CrossRef] [Scilit]
- Bernanke, B.S.; Blinder, A.S. The Federal Funds Rate and the Channels of Monetary Transmission. NBER Working Paper No. 3487. 1990. Available online: https://www.nber.org/papers/w3487 (accessed on 4 June 2026).
- Kashyap, A.K.; Stein, J.C. What do a million observations on banks say about the transmission of monetary policy? Am. Econ. Rev. 2000, 90, 407–428. [Google Scholar] [CrossRef] [Scilit]
- Jimenez, G.; Ongena, S.; Peydro, J.-L.; Saurina, J. Credit supply and monetary policy: Identifying the bank balance-sheet channel with loan applications. Am. Econ. Rev. 2012, 102, 2301–2326. [Google Scholar] [CrossRef] [Scilit]
- Wang, O. Banks, low interest rates, and monetary policy transmission. J. Financ. 2025, 80, 1379–1416. [Google Scholar] [CrossRef] [Scilit]
- Mohanti, D.; Banerjee, S. Credit channel of monetary policy transmission: Evidence from India. Investig. Manag. Financ. Innov. 2024, 21, 287–299. [Google Scholar] [CrossRef] [Scilit]
- Demirguc-Kunt, A.; Horvath, B.L.; Huizinga, H. Foreign banks and international transmission of monetary policy: Evidence from the syndicated loan market. Eur. Econ. Rev. 2020, 129, 103542. [Google Scholar] [CrossRef] [Scilit]
- Cihak, M.; Demirguc-Kunt, A.; Feyen, E.; Levine, R. Financial Development in 205 Economies, 1960 to 2010. NBER Working Paper No. 18946. 2013. Available online: https://www.nber.org/papers/w18946 (accessed on 4 June 2026).
- Beck, T.; Demirgüç-Kunt, A.; Levine, R. A New Database on the Structure and Development of the Financial Sector. World Bank Econ. Rev. 2000, 14, 597–605. [Google Scholar] [CrossRef] [Scilit]
- Levine, R. Finance and growth: Theory and evidence. In Handbook of Economic Growth; Aghion, P., Durlauf, S.N., Eds.; Elsevier: Amsterdam, The Netherlands, 2005; Volume 1A, pp. 865–934. [Google Scholar] [CrossRef] [Scilit]
- King, R.G.; Levine, R. Finance and growth: Schumpeter might be right. Q. J. Econ. 1993, 108, 717–737. [Google Scholar] [CrossRef] [Scilit]
- Pagano, M. Financial markets and growth: An overview. Eur. Econ. Rev. 1993, 37, 613–622. [Google Scholar] [CrossRef] [Scilit]
- Arcand, J.-L.; Berkes, E.; Panizza, U. Too much finance? J. Econ. Growth 2015, 20, 105–148. [Google Scholar] [CrossRef] [Scilit]
- Aizenman, J.; Jinjarak, Y.; Park, D. Financial Development and Output Growth in Developing Asia and Latin America: A Comparative Sectoral Analysis. NBER Working Paper No. 20917. 2015. Available online: https://www.nber.org/papers/w20917 (accessed on 4 June 2026).
- Ismail, K.; Ahokpossi, C.; Koulet-Vickot, M. Financial depth in the WAEMU. In IMF Working Paper No. 13/161; International Monetary Fund: Washington, DC, USA, 2013. [Google Scholar] [CrossRef] [Scilit]
- Demirguc-Kunt, A.; Levine, R. Finance, Financial Sector Policies, and Long-Run Growth; World Bank Policy Research Working Paper No. 4469; World Bank: Washington, DC, USA, 2008. [Google Scholar] [CrossRef] [Scilit]
- Kaufmann, D.; Kraay, A.; Mastruzzi, M. The Worldwide Governance Indicators: Methodology and analytical issues. Hague J. Rule Law 2011, 3, 220–246. [Google Scholar] [CrossRef] [Scilit]
- La Porta, R.; Lopez-de-Silanes, F.; Shleifer, A.; Vishny, R.W. Legal determinants of external finance. J. Financ. 1997, 52, 1131–1150. [Google Scholar] [CrossRef]
- Sun, Z.; Zhang, X.; Gao, Y. The impact of financial development on renewable energy consumption: A multidimensional analysis based on global panel data. Int. J. Environ. Res. Public Health 2023, 20, 3124. [Google Scholar] [CrossRef] [Scilit] [PubMed]
- Majeed, M.T.; Hussain, Z. Financial sector development and renewable energy consumption nexus: Evidence from global dynamic panel threshold analysis. Nat. Resour. Forum 2025, 49, 2299–2323. [Google Scholar] [CrossRef] [Scilit]
- Alinsato, A.S.; Dossou, T.A.M.; Dossou, P.K.; Kambaye, E.N.; Asongu, S.A. The financial development and renewable energy consumption nexus in Africa: Does the quality of governance matter? Nat. Resour. Forum 2024, 49, 2845–2868. [Google Scholar] [CrossRef] [Scilit]
- Jozwik, B.; Dogan, M.; Gursoy, S. The impact of renewable energy consumption on environmental quality in Central European countries: The mediating role of digitalization and financial development. Energies 2023, 16, 7041. [Google Scholar] [CrossRef] [Scilit]
- Apergis, N.; Payne, J.E. Renewable energy consumption and economic growth: Evidence from a panel of OECD countries. Energy Policy 2010, 38, 656–660. [Google Scholar] [CrossRef] [Scilit]
- Sadorsky, P. Renewable energy consumption and income in emerging economies. Energy Policy 2009, 37, 4021–4028. [Google Scholar] [CrossRef] [Scilit]
- Bhattacharya, M.; Paramati, S.R.; Ozturk, I.; Bhattacharya, S. The effect of renewable energy consumption on economic growth: Evidence from top 38 countries. Appl. Energy 2016, 162, 733–741. [Google Scholar] [CrossRef] [Scilit]
- Paramati, S.R.; Ummalla, M.; Apergis, N. The effect of foreign direct investment and stock market growth on clean energy use across a panel of emerging market economies. Energy Econ. 2016, 56, 29–41. [Google Scholar] [CrossRef] [Scilit]
- Polzin, F. Mobilizing private finance for low-carbon innovation—A systematic review of barriers and solutions. Renew. Sustain. Energy Rev. 2017, 77, 525–535. [Google Scholar] [CrossRef] [Scilit]
- Dafermos, Y.; Nikolaidi, M.; Galanis, G. Climate change, financial stability and monetary policy. Ecol. Econ. 2018, 152, 219–234. [Google Scholar] [CrossRef] [Scilit]
- Aguirre, M.; Ibikunle, G. Determinants of renewable energy growth: A global sample analysis. Energy Policy 2014, 69, 374–384. [Google Scholar] [CrossRef] [Scilit]
- Baltagi, B.H. Econometric Analysis of Panel Data, 6th ed.; Springer: Cham, Switzerland, 2021. [Google Scholar] [CrossRef] [Scilit]
- World Bank. World Development Indicators. World Bank DataBank. Available online: https://databank.worldbank.org/source/world-development-indicators (accessed on 4 June 2026).
- Bredl, S. The role of non-performing loans for bank lending rates. Jahrb. Natl. Stat. 2022, 242, 223–276. [Google Scholar] [CrossRef] [Scilit]
- Gjeçi, A.; Marinč, M.; Rant, V. Non-performing loans and bank lending behaviour. Risk Manag. 2023, 25, 7. [Google Scholar] [CrossRef] [Scilit]
- Halstead, M.; Donker, J.; Dalla Longa, F.; van der Zwaan, B. The importance of fossil fuel divestment and competitive procurement for financing Europe’s energy transition. J. Sustain. Financ. Investig. 2019, 9, 349–355. [Google Scholar] [CrossRef] [Scilit]
- Ondraczek, J.; Komendantova, N.; Patt, A. WACC the dog: The effect of financing costs on the levelized cost of solar PV power. Renew. Energy 2015, 75, 888–898. [Google Scholar] [CrossRef] [Scilit]
- Louzis, D.P.; Vouldis, A.T.; Metaxas, V.L. Macroeconomic and bank-specific determinants of non-performing loans in Greece: A comparative study of mortgage, business and consumer loan portfolios. J. Bank. Financ. 2012, 36, 1012–1027. [Google Scholar] [CrossRef] [Scilit]
- Beck, R.; Jakubik, P.; Piloiu, A. Key determinants of non-performing loans: New evidence from a global sample. Open Econ. Rev. 2015, 26, 525–550. [Google Scholar] [CrossRef] [Scilit]
- Choudhary, M.A.; Jain, A.K. Corporate stress and bank nonperforming loans: Evidence from Pakistan. J. Bank. Financ. 2021, 133, 106234. [Google Scholar] [CrossRef] [Scilit]
- Tao, Y.; Ye, Y.; Hou, W. Corruption-induced bank nonperforming loans. Manag. Decis. Econ. 2023, 46, 2014–2028. [Google Scholar] [CrossRef] [Scilit]
- Berger, A.N.; DeYoung, R. Problem loans and cost efficiency in commercial banks. J. Bank. Financ. 1997, 21, 849–870. [Google Scholar] [CrossRef] [Scilit]
- Bondarenko, E.; Zhuravka, O.; Aiyedogbon, J.O.; Sunday, O.E.; Andrieieva, V. Structural modeling of the impact of bank nonperforming loans on the banking sector: The Ukrainian experience. Banks Bank Syst. 2020, 15, 67–78. [Google Scholar] [CrossRef] [Scilit]
- Rickman, J.; Falkenberg, M.; Kothari, S.; Larosa, F.; Grubb, M.; Ameli, N. The challenge of phasing-out fossil fuel finance in the banking sector. Nat. Commun. 2024, 15, 7881. [Google Scholar] [CrossRef] [Scilit] [PubMed]
- Sterman, J.D. Business Dynamics: Systems Thinking and Modeling for a Complex World; McGraw-Hill: Boston, MA, USA, 2000. [Google Scholar]
- von Bertalanffy, L. General System Theory: Foundations, Development, Applications; George Braziller: New York, NY, USA, 1968. [Google Scholar]
- Yang, Z.; Chen, L. Beyond additivity: Digital-green synergy in sustainable development policy systems and corporate ESG performance. Systems 2026, 14, 471. [Google Scholar] [CrossRef] [Scilit]
- Distinguin, I.; Roulet, C.; Tarazi, A. Bank regulatory capital and liquidity: Evidence from US and European publicly traded banks. J. Bank. Financ. 2013, 37, 3295–3317. [Google Scholar] [CrossRef] [Scilit]
- Bellemare, M.F.; Masaki, T.; Pepinsky, T.B. Lagged explanatory variables and the estimation of causal effect. J. Politics 2017, 79, 949–963. [Google Scholar] [CrossRef] [Scilit] [PubMed]
- World Bank. Global Financial Development Database. World Bank DataBank. Available online: https://databank.worldbank.org/source/global-financial-development (accessed on 4 June 2026).
- World Bank. Worldwide Governance Indicators. World Bank DataBank. Available online: https://databank.worldbank.org/source/worldwide-governance-indicators (accessed on 4 June 2026).
- Wooldridge, J.M. Econometric Analysis of Cross Section and Panel Data, 2nd ed.; MIT Press: Cambridge, MA, USA, 2010. [Google Scholar]
- Cameron, A.C.; Miller, D.L. A practitioner’s guide to cluster-robust inference. J. Hum. Resour. 2015, 50, 317–372. [Google Scholar] [CrossRef] [Scilit]
- Drukker, D.M. Testing for serial correlation in linear panel-data models. Stata J. 2003, 3, 168–177. [Google Scholar] [CrossRef] [Scilit]
- Driscoll, J.C.; Kraay, A.C. Consistent covariance matrix estimation with spatially dependent panel data. Rev. Econ. Stat. 1998, 80, 549–560. [Google Scholar] [CrossRef] [Scilit]

Disclaimer/Publisher’s Note: The statements, opinions and data contained in all publications are solely those of the individual author(s) and contributor(s) and not of MDPI and/or the editor(s). MDPI and/or the editor(s) disclaim responsibility for any injury to people or property resulting from any ideas, methods, instructions or products referred to in the content. |
© 2026 by the authors. Licensee MDPI, Basel, Switzerland. This article is an open access article distributed under the terms and conditions of the Creative Commons Attribution (CC BY) license.