


Highlights
Please indicate how your work links to systems science via your contributions to systems practice, theory, and/or methodology.
- Conceptualizes artificial intelligence (AI) and high-quality energy development (HED) as interdependent subsystems with bidirectional interactions, advancing a systems perspective on digital and energy transitions.
- Develops an integrated framework combining multidimensional subsystem evaluation, the coupling coordination degree model, spatial autocorrelation, and GTWR to diagnose AI-HED coupling coordination (AHCC) and its heterogeneous drivers.
What are the main findings and/or the implications of the main findings?
- China’s national average AHCC rose from 0.301 to 0.454 from 2012 to 2022, yet most provinces remained imbalanced and spatial clustering intensified, reinforcing regional polarization.
- Technological innovation, economic development, and industrial upgrading promoted AHCC, whereas environmental regulation, urbanization, and government intervention inhibited it; these effects varied markedly across space and time, calling for integrated digital–energy planning and region-specific policies.
Abstract
The coordinated development of artificial intelligence (AI) and high-quality energy development (HED) is essential for advancing digital transformation and energy transition. However, existing research primarily explores the unidirectional impact of AI on HED, neglecting their bidirectional relationship. Drawing on provincial data from China during 2012–2022, this study examines the coupling coordination between AI and HED (AHCC) and its spatiotemporal differentiation and driving factors. Results show that although both AI and HED advanced steadily, AI started from a lower base and remained below HED, and their spatial distributions were mismatched. The national average AHCC improved from mild imbalance to marginal imbalance, but large regional disparities persisted. Only several provinces—six in the east and two in the west—entered coordination stages, with most remaining in imbalance. Intensifying spatial autocorrelation of AHCC indicates that strong or weak regions are increasingly locked into self-reinforcing trajectories, making balanced regional development difficult. Regression results indicate that technological innovation, economic development level, and industrial structure upgrading significantly promote AHCC, whereas environmental regulation, urbanization level, and government intervention inhibit it. These effects exhibit pronounced spatiotemporal heterogeneity. This study enriches the theoretical understanding of AHCC and provides empirical evidence to inform coordinated digital and energy transition policies.
1. Introduction
In the era of global digitalization and energy transformation, artificial intelligence (AI) and energy transition have shown great potential to advance sustainable development and facilitate low-carbon transformation [1]. AI, as a key force in the ongoing technological revolution and industrial transformation, is reshaping production processes, governance mechanisms, and innovation paradigms across sectors [2]. Meanwhile, achieving a safe, stable, cost-effective, efficient, clean, and low-carbon energy system—a vision known in the Chinese context as high-quality energy development (HED)—has become a fundamental pathway toward carbon neutrality [3]. Importantly, the development of AI and HED is increasingly interdependent [4]. AI technologies offer powerful tools for improving grid stability, optimizing energy management, enabling real-time operational decision-making, and enhancing power system reliability [5]. At the same time, sustainable and reliable energy infrastructure is essential for meeting the high energy demands of AI systems, particularly large-scale computing clusters and data centers [6]. As underscored in the International Energy Agency (IEA)’s special report Energy and AI (2025), AI and energy have entered a “symbiotic relationship,” where energy systems provide the material foundation for AI development, and AI becomes a critical tool for transforming energy systems. This co-evolution is reshaping the global energy landscape and calls for integrated strategies across sectors [7]. However, despite this interdependence, their development is not always well-coordinated. Rapid digital expansion may exceed energy system capacity, while energy transitions often proceed without sufficient AI support [8]. Such a mismatch may impair the performance and reliability of digital infrastructure due to inadequate energy supply or undermine the efficiency and flexibility of energy transition in the absence of intelligent coordination [9]. Understanding how AI and HED evolve in coordination is thus essential for guiding policy decisions to enable a synergistic digital and green transition [10].
Most existing studies adopt a unidirectional perspective, primarily focusing on how AI promotes HED. For instance, Wang et al. [4] found that AI exerts both a direct positive impact on HED and an indirect effect via green innovation and R&D intensity, with effects amplified in regions with more developed digital economies. Similarly, Skare et al. [11] demonstrated that AI-related patents and research activities exert significant positive effects on reducing energy intensity and promoting sustainable energy transition by optimizing energy resource allocation and utilization efficiency, thereby improving energy system performance. While these studies offer valuable insights into the role of AI in driving HED, they give limited consideration to the reverse influence of HED on AI. In reality, the development of AI and HED is closely coupled and requires coordinated advancement. However, few studies have conceptualized or empirically investigated the coupling coordination between AI and HED (AHCC). In particular, the spatiotemporal differentiation and driving mechanisms of AHCC remain largely unexplored. Addressing this gap is critical for deepening theoretical understanding of AI–HED interdependence and providing empirical evidence to support twin transitions.
Motivated by the above research gap, this study explores the spatiotemporal evolution and underlying driving mechanisms of AHCC, using China as a representative case. Given China’s concurrent advances in digital innovation and clean energy reform, it offers an ideal empirical setting for examining the dynamic interaction between these two strategic domains. Specifically, this study addresses three key questions: (1) How can AHCC be effectively measured? (2) How has AHCC evolved over time and space? (3) What are the key factors influencing AHCC? To answer these questions, we first construct multidimensional indicator systems for both AI and HED and derive their composite indices using the entropy weight method. Based on these indices, we assess the degree of AHCC using the coupling coordination degree (CCD) model and examine its spatial dependence through spatial autocorrelation analysis. Finally, we employ the geographically and temporally weighted regression (GTWR) model to analyze how the effects of key influencing factors on AHCC vary across time and space.
This study makes three key contributions. First, it investigates the bidirectional relationship between AI and HED, moving beyond the unidirectional focus of prior research. It conceptually explains the coupling mechanism through which these two systems interact and reinforce each other, offering insights into their sustainable and coordinated development. Second, it develops a multidimensional evaluation system to assess the performance of AI and HED, enabling a systematic understanding of their historical evolution and current status. The resulting indices help policymakers identify development trends and formulate targeted interventions. Third, it constructs an integrated analytical framework to measure AHCC, uncovering its spatiotemporal differentiation and key influencing factors. The framework and the empirical findings provide a reference for other countries aiming to assess and promote the coordinated development of AI and HED.
The remainder of the paper is organized as follows. Section 2 analyzes the coupling mechanism between AI and HED as well as the driving factors of AHCC. Section 3 introduces the methodology and data. Section 4 presents the empirical results. Section 5 discusses the main findings, highlights theoretical contributions and practical implications, and concludes with limitations and future directions.
2. Theoretical Analysis
2.1. Coupling Mechanism Between AI and HED
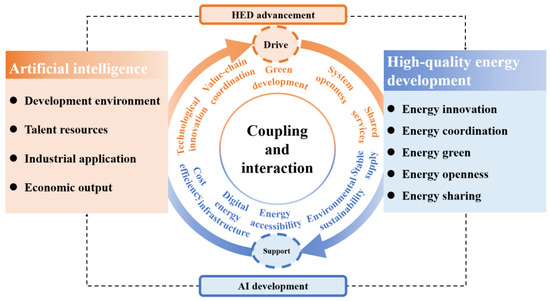
The coupling and coordination between AI and HED reflect a bidirectional relationship in which the two systems are interdependent and mutually reinforcing, as illustrated in Figure 1. On the one hand, AI drives the advancement of HED. First, AI drives technological innovation in the energy sector. AI technologies—particularly deep learning and reinforcement learning—have been increasingly applied to renewable energy forecasting, fault detection, power flow optimization, and anomaly diagnosis. These capabilities enhance the integration of variable renewables, improve the reliability of grid operations, and accelerate the digital transformation of legacy infrastructure [12]. Second, AI strengthens coordination across the energy value chain. Through intelligent platforms, AI enables real-time monitoring and dynamic scheduling of generation, transmission, and consumption processes. This reduces information asymmetry, improves energy dispatch precision, and enhances the responsiveness and flexibility of the entire system [13]. Third, AI advances green and low-carbon energy development by improving the operational efficiency of transportation, manufacturing, and other sectors, optimizing resource utilization, and facilitating green production practices, thereby reducing energy consumption and environmental impacts while advancing sustainable development [14]. Fourth, by providing intelligent optimal transaction pricing models, artificial intelligence ensures energy trade security, reduces transaction risks, promotes fair market behavior, protects the interests of both energy trading parties, and enhances the openness and vitality of energy markets [15]. Fifth, AI promotes shared energy services. By enabling smart grids, virtual power plants, intelligent charging, and personalized energy management systems, AI enhances user engagement and fosters more equitable distribution of energy benefits [16].
Figure 1.
Diagram of coupling mechanism.
On the other hand, HED supports the development of AI. First, HED ensures a stable, sufficient, and resilient energy supply for AI infrastructure. The rapid expansion of AI infrastructure has substantially increased electricity demand and carbon emissions. As AI systems are highly energy-intensive and sensitive to power quality fluctuations, a reliable, low-carbon, and diversified energy supply is essential to ensure their sustainable, stable, and secure operation [17]. Second, the decarbonization of the energy system enhances the environmental sustainability of AI development. As public concerns grow over the carbon footprint of AI model training and inference, HED expands the supply of low-carbon electricity, enabling greener AI applications aligned with global climate goals [18]. Third, HED expands energy accessibility and infrastructure coverage, especially in underdeveloped and remote regions. Enhanced physical reach of energy systems lowers geographic barriers to deploying AI-driven services such as precision agriculture, remote healthcare, and rural education, thereby fostering the spatial diffusion of AI technologies [19]. Fourth, HED promotes the development of digital energy infrastructure—such as smart meters, distributed sensors, and automated control systems—that generate high-frequency, real-time operational data. While these systems are primarily designed for energy optimization, the resulting data streams also provide valuable inputs for training and refining AI models in applications like energy forecasting, demand response, and fault diagnostics [20]. Fifth, HED lowers electricity costs and improves price predictability through structural upgrades and market reforms. For small enterprises and public organizations, affordable and stable electricity reduces the economic barriers to adopting AI technologies, supporting broader and more equitable diffusion of AI across sectors [21].
2.2. Driving Factors of AHCC
The evolution of AHCC is shaped by a range of socioeconomic, institutional, and technological conditions. This study identifies six factors that may influence AHCC via distinct transmission channels. First, environmental regulation. Environmental regulation reflects the strength of regional environmental governance, which is essential for promoting cleaner production and efficient resource use [22]. Stricter regulations may incentivize the deployment of intelligent technologies and cleaner energy solutions, thereby enabling AI applications in environmental governance and energy optimization while ultimately reinforcing synergies between AI development and green energy transitions [23]. Second, industrial structure upgrading. The transition toward a service-oriented and knowledge-intensive economy supports both digital and low-carbon development [24]. A larger tertiary sector is often associated with greater demand for AI-enabled services and reduced energy intensity, providing a structural basis for the coordinated advancement of AI and HED [4]. Third, urbanization level. Urbanization promotes the concentration of population, industries, and infrastructure, creating favorable conditions for the joint development of AI and high-quality energy systems [25]. Urban areas often feature advanced communication networks, smart grids, and higher energy demand elasticity, which support AI deployment and energy system modernization [26]. Fourth, government intervention. Government intervention plays a vital role in advancing AI and energy transitions through fiscal spending, infrastructure investment, and policy coordination [23]. Higher levels of public expenditure may accelerate the deployment of smart grids, AI pilot programs, and green initiatives, thus fostering institutional environments conducive to AHCC [27]. Fifth, technological innovation. Innovation capacity underpins the development and diffusion of AI applications in the energy sector [4]. Regions with stronger innovation ecosystems are better positioned to achieve breakthroughs in smart energy technologies, enabling data-driven, AI-supported energy governance that promotes AHCC [22]. Sixth, economic development level. Greater economic development is generally associated with more advanced infrastructure, stronger fiscal capacity, and growing demand for intelligent and sustainable solutions [28]. The overall economic strength of a region affects its ability to invest in both AI systems and high-quality energy transitions, and to foster synergies between them [29].
3. Methodology and Data
3.1. Methodology
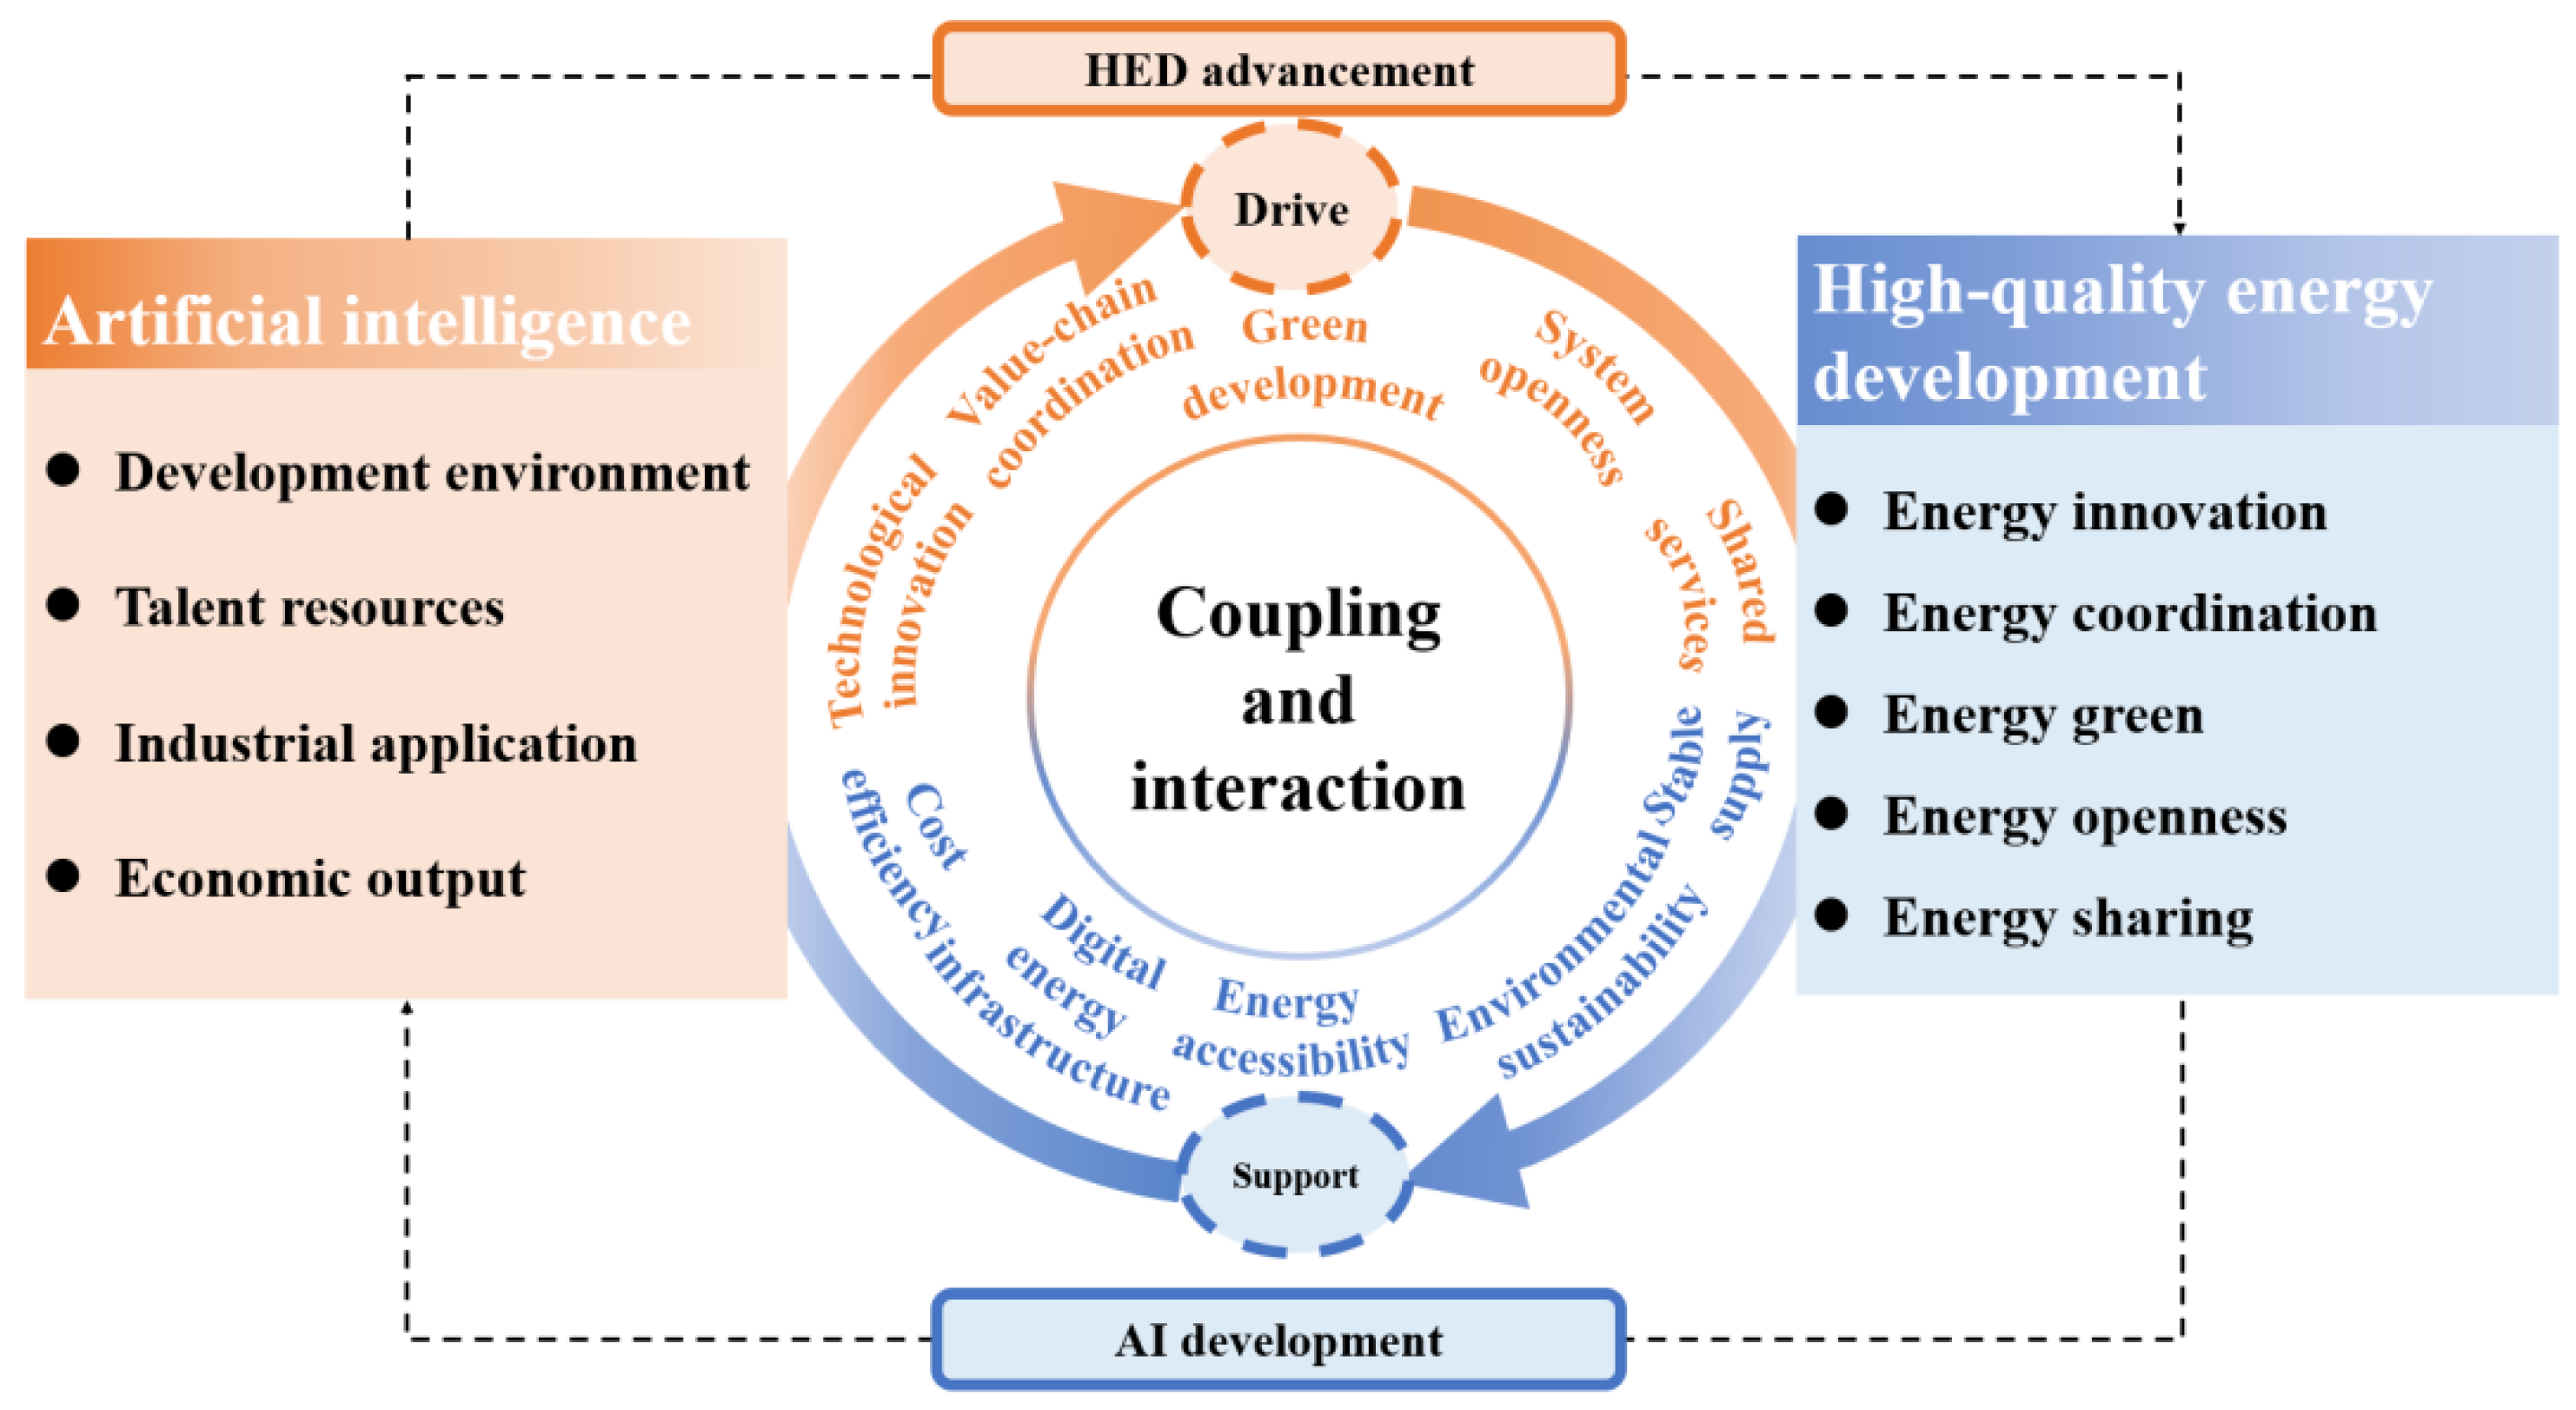
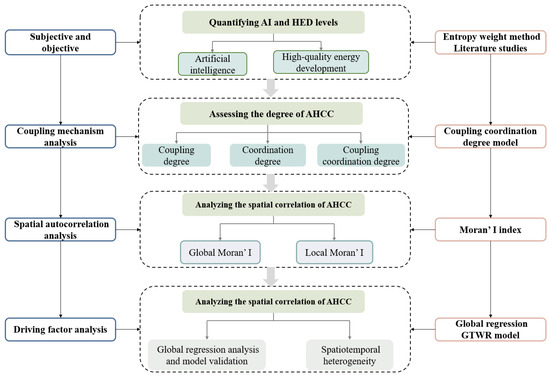
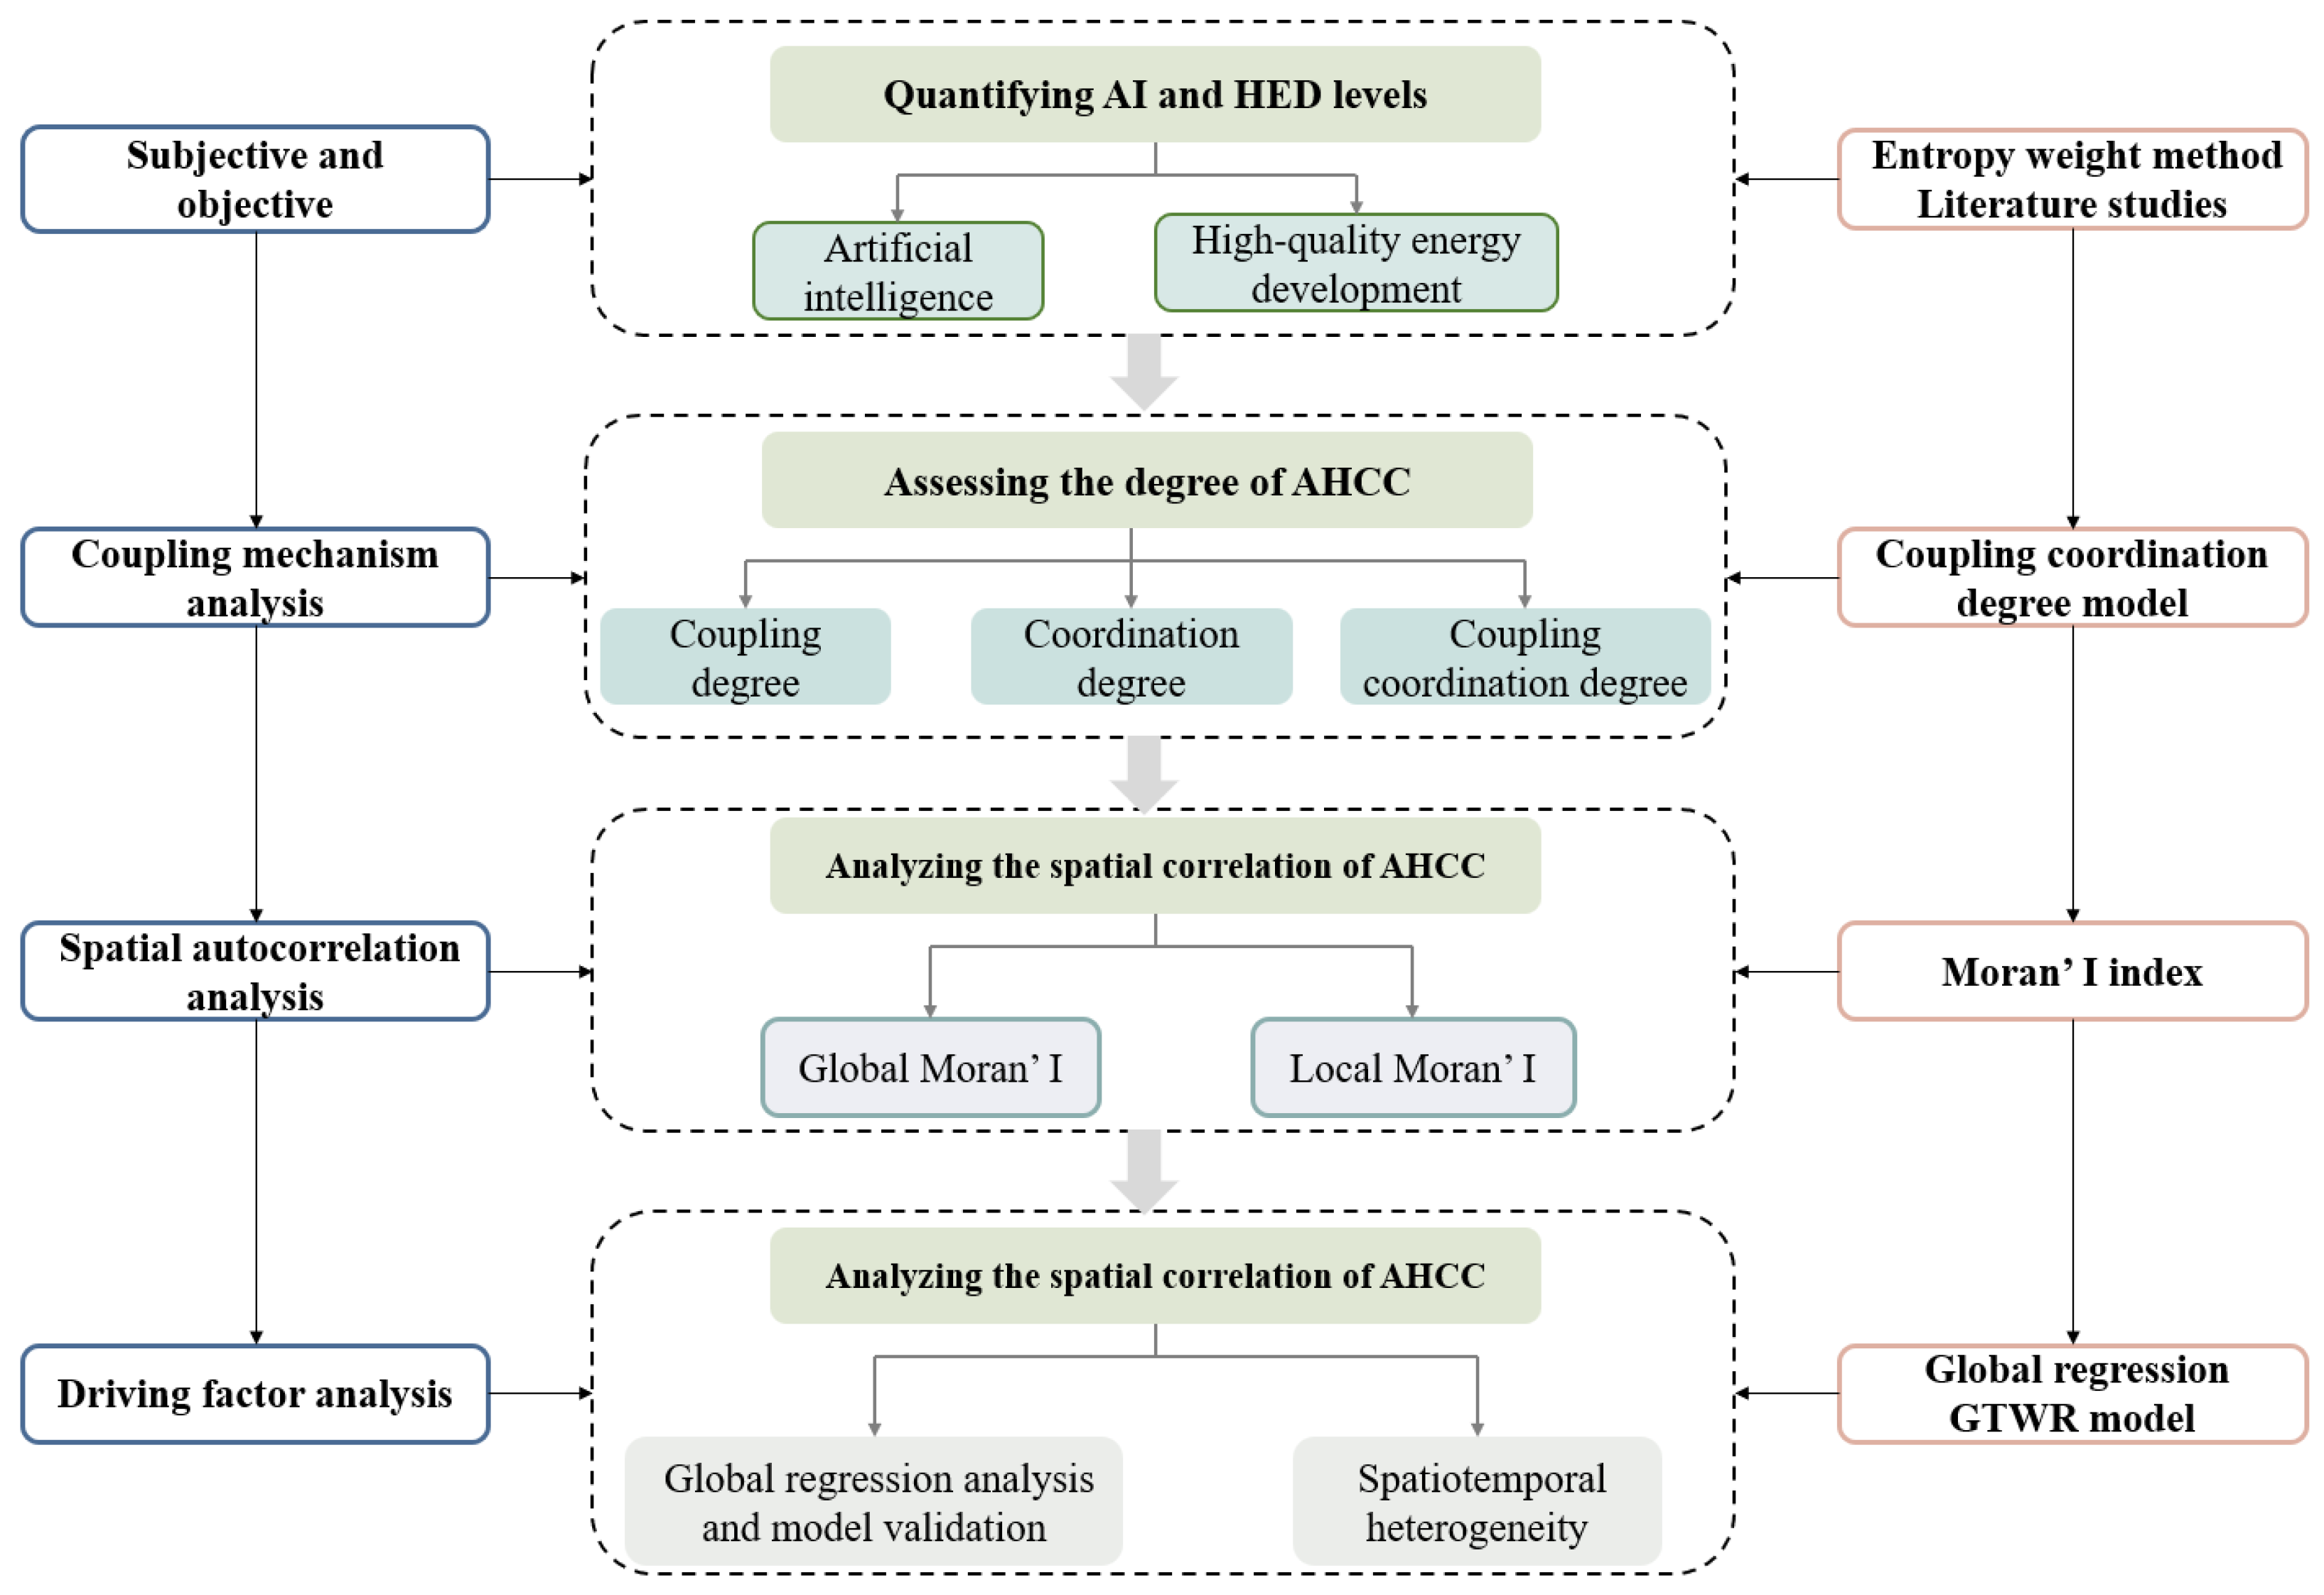
To systematically examine the spatiotemporal differentiation and influencing factors of AHCC, this study adopts a four-step methodological framework. Figure 2 shows the empirical strategy applied in this study. First, AI and HED levels are quantified by constructing comprehensive evaluation index systems and applying the entropy weight method to derive objective composite scores. Second, a CCD model is used to assess the degree of AHCC, capturing the dynamic relationship between the two systems. Third, spatial autocorrelation analysis is performed using global and local Moran’s I indices to detect the presence and patterns of spatial dependence in AHCC across provinces. Finally, a GTWR model is employed to explore the spatiotemporal heterogeneity of AHCC drivers, enabling more refined and localized insights.
Figure 2.
Framework of the empirical strategy.
3.1.1. Quantifying AI and HED Levels
Establishing the Evaluation Index System
A comprehensive evaluation of AI development requires assessing not only its applications and outputs but also the supporting resources essential for its sustained growth. Drawing on existing indicator frameworks and available data [2,23,30], this study constructs a four-dimensional evaluation system encompassing the development environment, talent resources, industrial applications, and economic outputs. Specific indicators and definitions are presented in Table 1. According to the Classification of Strategic Emerging Industries (2018) issued by the National Bureau of Statistics (NBS), the AI industry includes four sub-industries: basic software development, application software development, information system integration services, and intelligent consumer equipment manufacturing [31]. The first three fall under the software and information technology services industry, while the fourth is classified under the electronics and communication equipment manufacturing industry. In addition, the number of newly established AI enterprises and industrial robot density are used to characterize AI industrial development and technological application, respectively. The former reflects the expansion of the AI industrial ecosystem, whereas the latter measures the diffusion and adoption of AI-enabled intelligent manufacturing technologies in industrial production. AI invention patent applications are employed as a proxy for AI innovation output, representing the technological innovation capability that underpins the development and competitiveness of the AI industry.
For the evaluation of HED, this study adopts the conceptual framework outlined in the White Paper on China’s Energy Development in the New Era, which advocates the principles of innovation, coordination, greenness, openness, and sharing [32]. These principles, respectively, emphasize innovation as the primary driver, coordination as an intrinsic feature, greenness as the dominant model, openness as the necessary path, and sharing as the ultimate goal. Guided by this framework and relevant research [3,33,34], this study develops an evaluation system comprising five dimensions: energy innovation, energy coordination, energy greenness, energy openness, and energy sharing, as detailed in Table 1.
Table 1.
Evaluation index systems for AI and HED.
Entropy Weight Method
Based on information entropy, the entropy weight method determines indicator weights according to the dispersion of each indicator across observations. As it provides an objective, data-driven weighting scheme by capturing the information content of the indicators, we adopt this method [42]. Prior to computing the entropy weights, the indicators are normalized as follows:
where aij is the original value of sample i on indicator j, aj is the set of original values of all samples on indicator j, and xij is the normalized value of sample i on indicator j.
First, the normalized weight of each sample under each indicator is calculated, as shown below:
where wij is the weight of sample i on indicator j, and n is the total number of samples.
Second, the entropy value ej of indicator j is calculated, as shown below:
where and .
Third, indicators with higher utility values are considered more important and are assigned greater weights. The utility value of each indicator is calculated as follows:
Fourth, the final weight Wj of indicator j is calculated based on its utility value, as shown below:
3.1.2. Assessing the Degree of AHCC
Given that AHCC reflects the interaction between AI and HED as interrelated systems, the CCD model is well-suited to evaluating their level of coordinated development [43]. We employ the CCD model to measure the level of AHCC across regions and over time, laying the foundation for analyzing its spatiotemporal differentiation and evolutionary characteristics. A key metric is the coupling degree, denoted as C, which measures the degree of interconnection between the two systems—a higher value indicates stronger interdependence. It is calculated as follows:
where U1 and U2 represent the comprehensive development level of AI and HED, respectively, calculated using the weighted average method based on the entropy-derived weights and corresponding indicator data.
Since some regions may exhibit strong coupling between AI and HED despite low development levels, the coordination degree—denoted as T—is introduced to avoid overestimating their coordination level. This indicator evaluates the consistency and overall level of development between the two systems. A larger value indicates a more balanced and advanced development status. It is calculated as follows:
where α and β denote the relative weights of AI and HED, respectively. Given their equal importance in this study, each is assigned a weight of 0.5.
The CCD integrates both the coupling degree and the coordination degree, capturing not only the degree of interconnection but also the overall development level of the two systems. It serves as the primary indicator for assessing AHCC in this study and is denoted as D, calculated as follows:
Based on existing studies [27,29], the CCD values are divided into ten levels within the range of 0–1. Considering the relatively concentrated distribution of AHCC values in this study, the interval width is set as 0.1 to further classify CCD into ten categories, as detailed in Table 2.
Table 2.
Classification of the CCD.
3.1.3. Spatial Autocorrelation Analysis
Tobler’s First Law of Geography posits that “everything is related to everything else, but near things are more related than distant things” [44]. Accordingly, this study empirically examines whether AHCC exhibits spatial autocorrelation across regions. Moran’s I index is used to evaluate the spatial distribution characteristics of AHCC. Moran’s I ranges from −1 to 1: values above 0 indicate positive spatial autocorrelation (i.e., spatial clustering), while values below 0 indicate negative spatial autocorrelation (i.e., spatial dispersion), and a value of 0 implies a random spatial pattern with no correlation. Moran’s I includes two forms: global and local. The global Moran’s I measures overall spatial autocorrelation and is calculated as:
The local Moran’s I, which captures spatial dependence at the individual regional level, is given by:
where n is the number of provinces, yi is the AHCC value of province i, is the national average, and wij is the spatial weight between provinces i and j. We use a 0–1 adjacency matrix (w1) where if provinces i and j share a border, and 0 otherwise. For robustness, we also use the geographic distance matrix (w2), defined as the inverse of the Euclidean distance between provincial capitals, and the economic–geographic distance matrix (w3), calculated as , where is the average per capita GDP of province i, and is the national average over the sample period [27].
Based on local Moran’s I, provinces are classified into four spatial autocorrelation types. High–High (HH): provinces with high AHCC values surrounded by high-value neighbors, indicating positive spatial autocorrelation. Low–High (LH): provinces with low AHCC values surrounded by high-value neighbors, indicating negative spatial autocorrelation. Low–Low (LL): provinces with low AHCC values surrounded by low-value neighbors, indicating positive spatial autocorrelation. High–Low (HL): provinces with high AHCC values surrounded by low-value neighbors, indicating negative spatial autocorrelation.
3.1.4. Driving Factor Analysis
To explore the influencing factors of AHCC, this study employs the GTWR model. Unlike traditional global models with fixed coefficients, GTWR captures spatial and temporal heterogeneity, enabling analysis of how these factors affect AHCC differently across regions and over time. Its expression is as follows:
where is the dependent variable of sample i; , , and represent the longitude, latitude, and time coordinates of sample i, respectively, forming its spatiotemporal coordinates . is the intercept term, and is the regression coefficient for the kth explanatory variable . is the random error term. The parameter estimation method of GTWR is as follows:
where is the spatiotemporal distance decay function.
In this study, the GTWR model was implemented using the GTWR 4.0 software with a fixed kernel, and the optimal bandwidth h was automatically determined by minimizing the corrected Akaike Information Criterion (AICc).
3.2. Data Sources
Owing to data availability, this study uses panel data for 30 Chinese provinces from 2012 to 2022, excluding Tibet, Taiwan, Hong Kong, and Macao. Table 1 presents the sources of all indicators, while Table 3 reports descriptive statistics and corresponding sources for each driving factor.
Table 3.
Descriptive statistics of driving factors.
4. Results
4.1. Evolution of AI and HED Levels
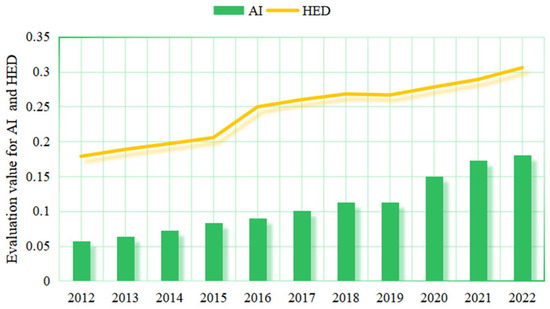
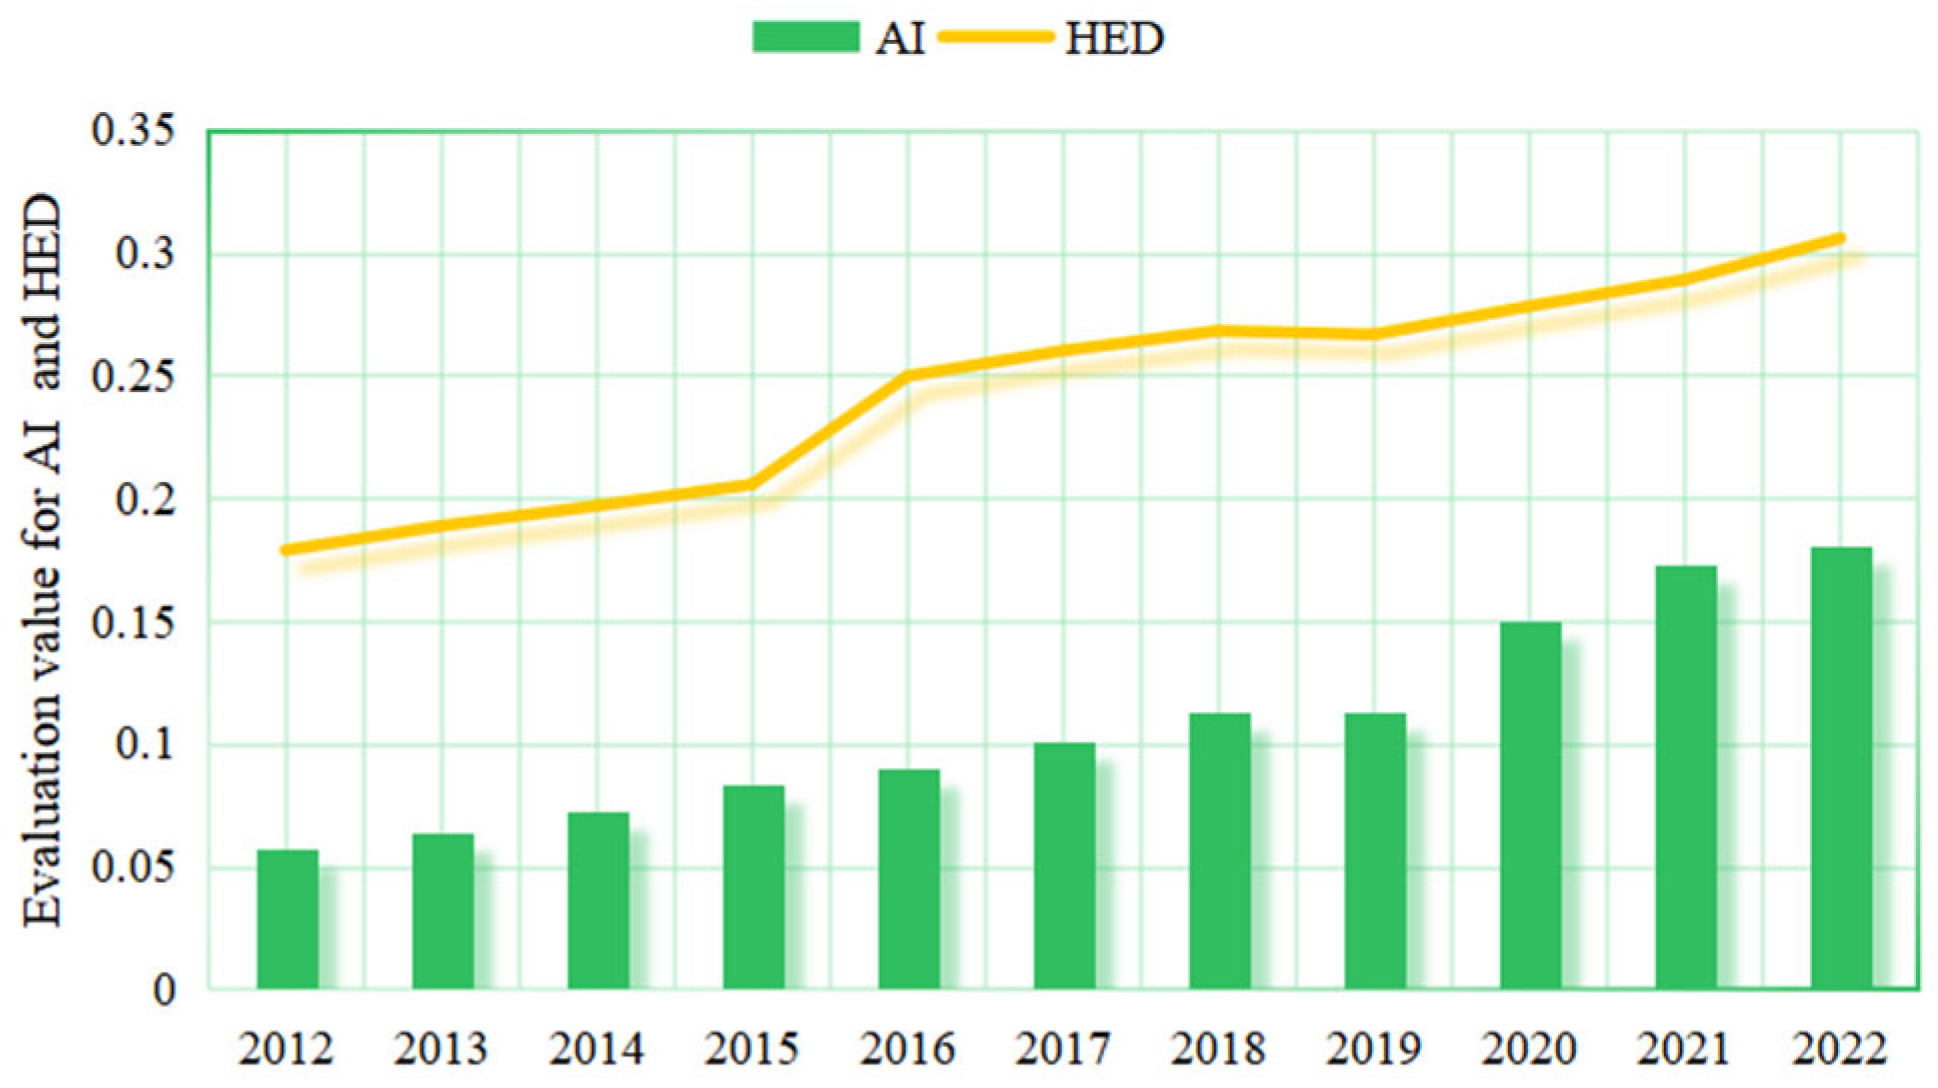
Figure 3 presents the evolution of AI and HED levels in China from 2012 to 2022. Overall, both systems exhibit an upward trajectory, though with distinct growth patterns. From 2012 to 2016, AI development progressed slowly, with its index increasing from around 0.06 to 0.09. This phase corresponds to the early stage of digital infrastructure construction and the absence of a national AI strategy. In contrast, HED maintained a higher and more stable level, rising from approximately 0.18 to 0.25, supported by policies aimed at improving energy efficiency and optimizing the energy mix, such as the 2014 Energy Development Strategy Action Plan [47]. A marked acceleration in AI development occurred after 2017, following the release of the New Generation Artificial Intelligence Development Plan [48], which catalyzed investment, accelerated industrial deployment, and fostered technological innovation. By 2022, the AI index was more than three times higher than in 2012. Meanwhile, HED also advanced, particularly between 2016 and 2018, driven by deepening energy system reforms and the expansion of non-fossil energy capacity. After 2019, although both systems continued to grow, AI progressed at a faster pace, gradually narrowing its gap with HED. This trend reflects the acceleration of China’s digital transformation in recent years. The sustained upward trends of both indicators underscore the country’s dual commitment to digitalization and green energy transition, laying a solid foundation for stronger coupling coordination between the two systems.
Figure 3.
Temporal evolution of AI and HED levels.
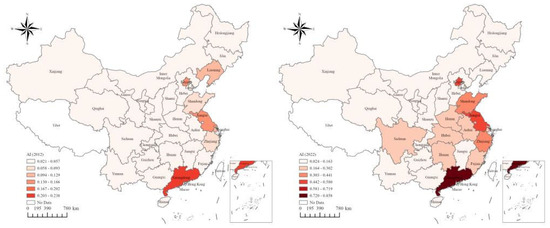
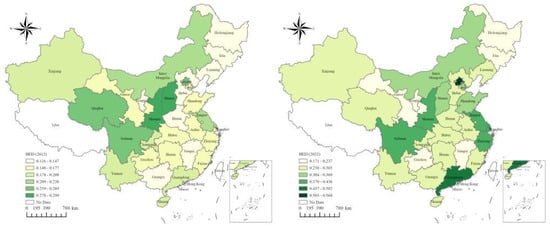
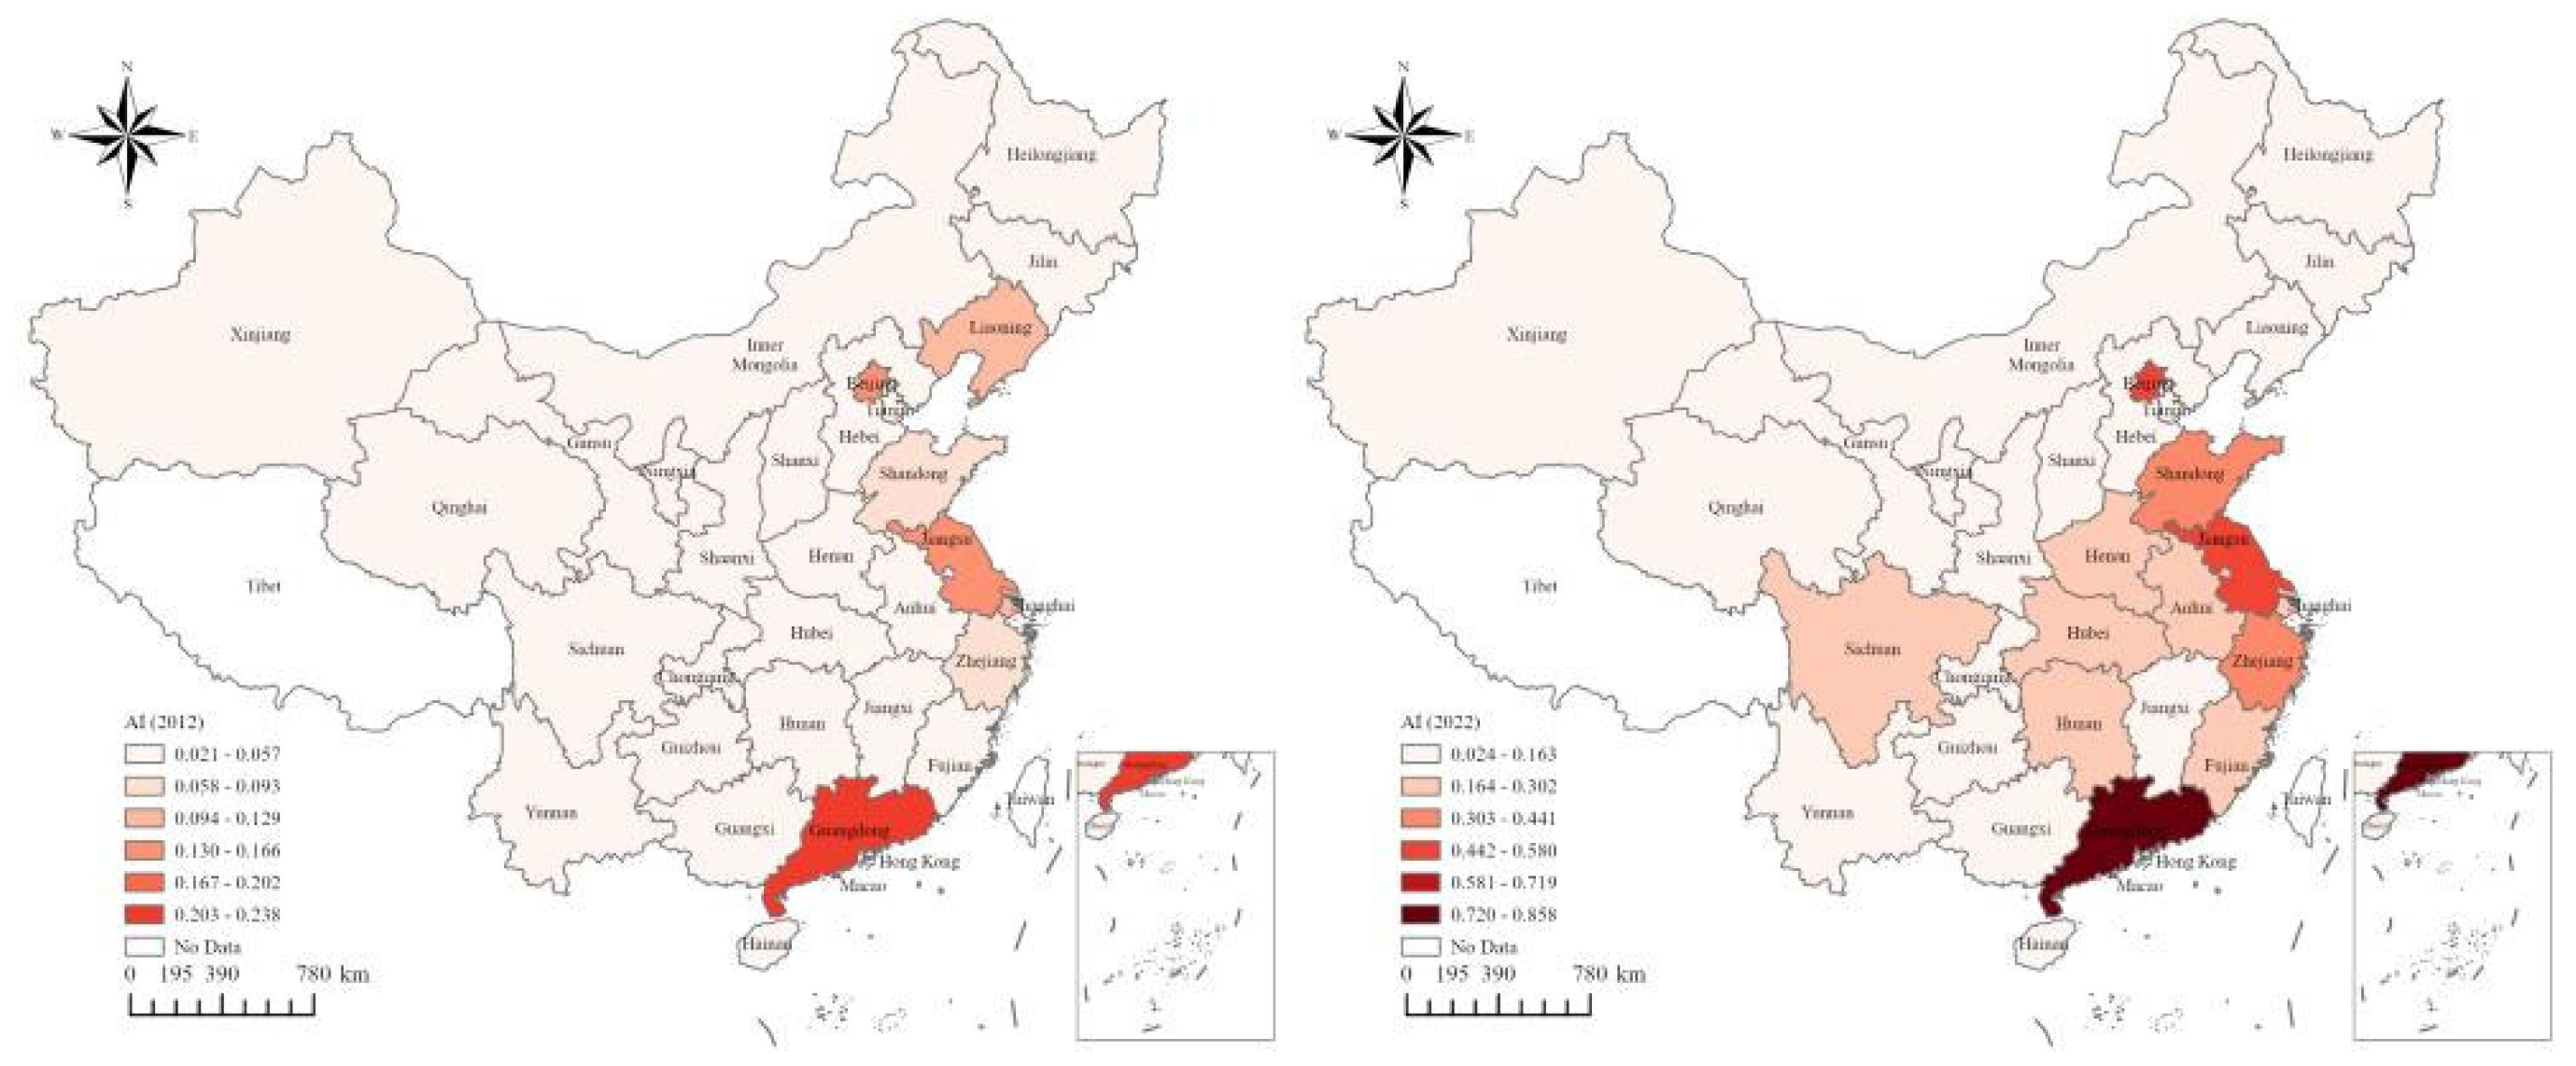
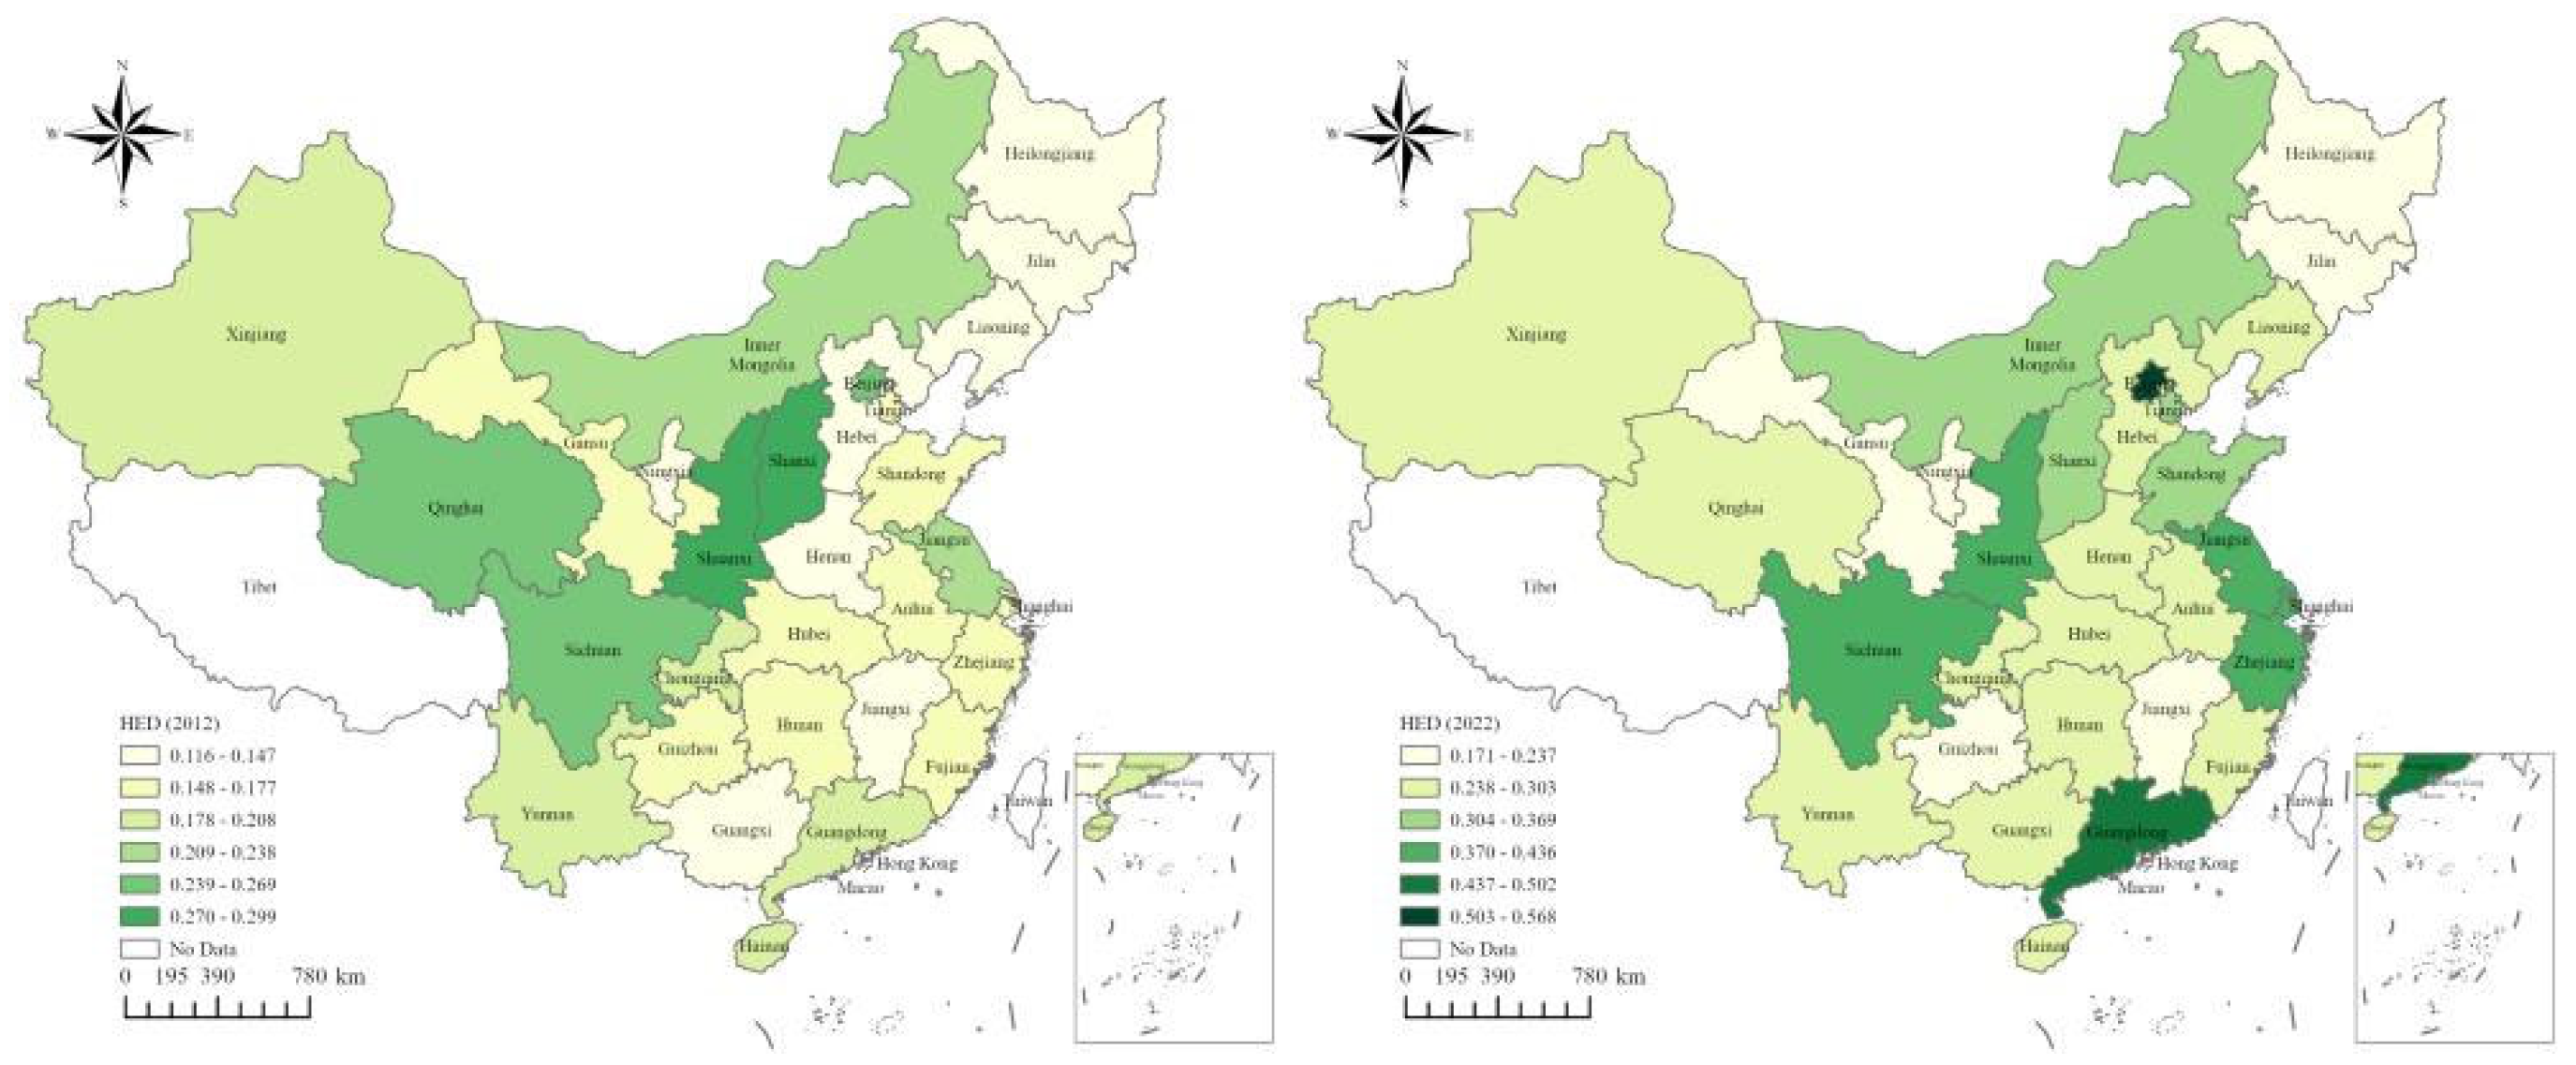
Figure 4 illustrates the spatial distribution of AI and HED levels across 30 provinces in 2012 and 2022. Despite substantial progress in both systems, their spatial development patterns diverged considerably, revealing a spatial mismatch between digital advancement and energy transition. In 2012, AI development was concentrated in a few eastern coastal provinces—particularly Guangdong, Jiangsu, Beijing, and Shanghai—while most central and western regions remained underdeveloped. By 2022, this concentration had intensified, with Guangdong and Jiangsu retaining their lead, while Zhejiang and Shandong demonstrated notable progress. A persistent east–west divide underscored ongoing disparities in digital infrastructure and innovation capacity. In contrast, HED exhibited a more balanced spatial pattern. In 2012, although overall HED levels were low, provinces such as Shaanxi, Shanxi, and Sichuan ranked relatively higher, benefiting from diversified energy structures and early investments in energy efficiency. By 2022, HED levels rose nationwide, with Beijing, Guangdong, and Jiangsu emerging as new leaders. Compared with AI, spatial disparities in HED were less pronounced, reflecting broader diffusion of national green energy policies and infrastructure. These contrasting spatial patterns reveal a mismatch between AI and HED. Provinces with relatively high AI levels—such as Hubei and Anhui—had only modest HED performance, potentially constraining the sustainability of their digital growth. Conversely, provinces advanced in energy transition, such as Shaanxi and Shanxi—with limited AI infrastructure and application capacity—may face difficulties in applying intelligent technologies for energy optimization.
Figure 4.
Spatial evolution of AI and HED levels.
4.2. Evolution of AHCC
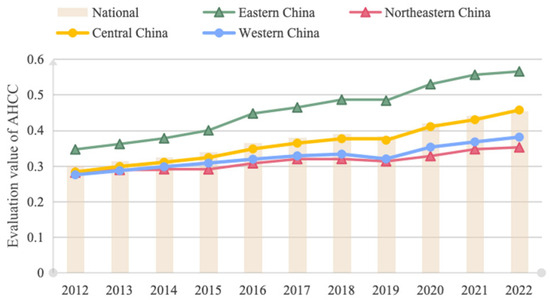
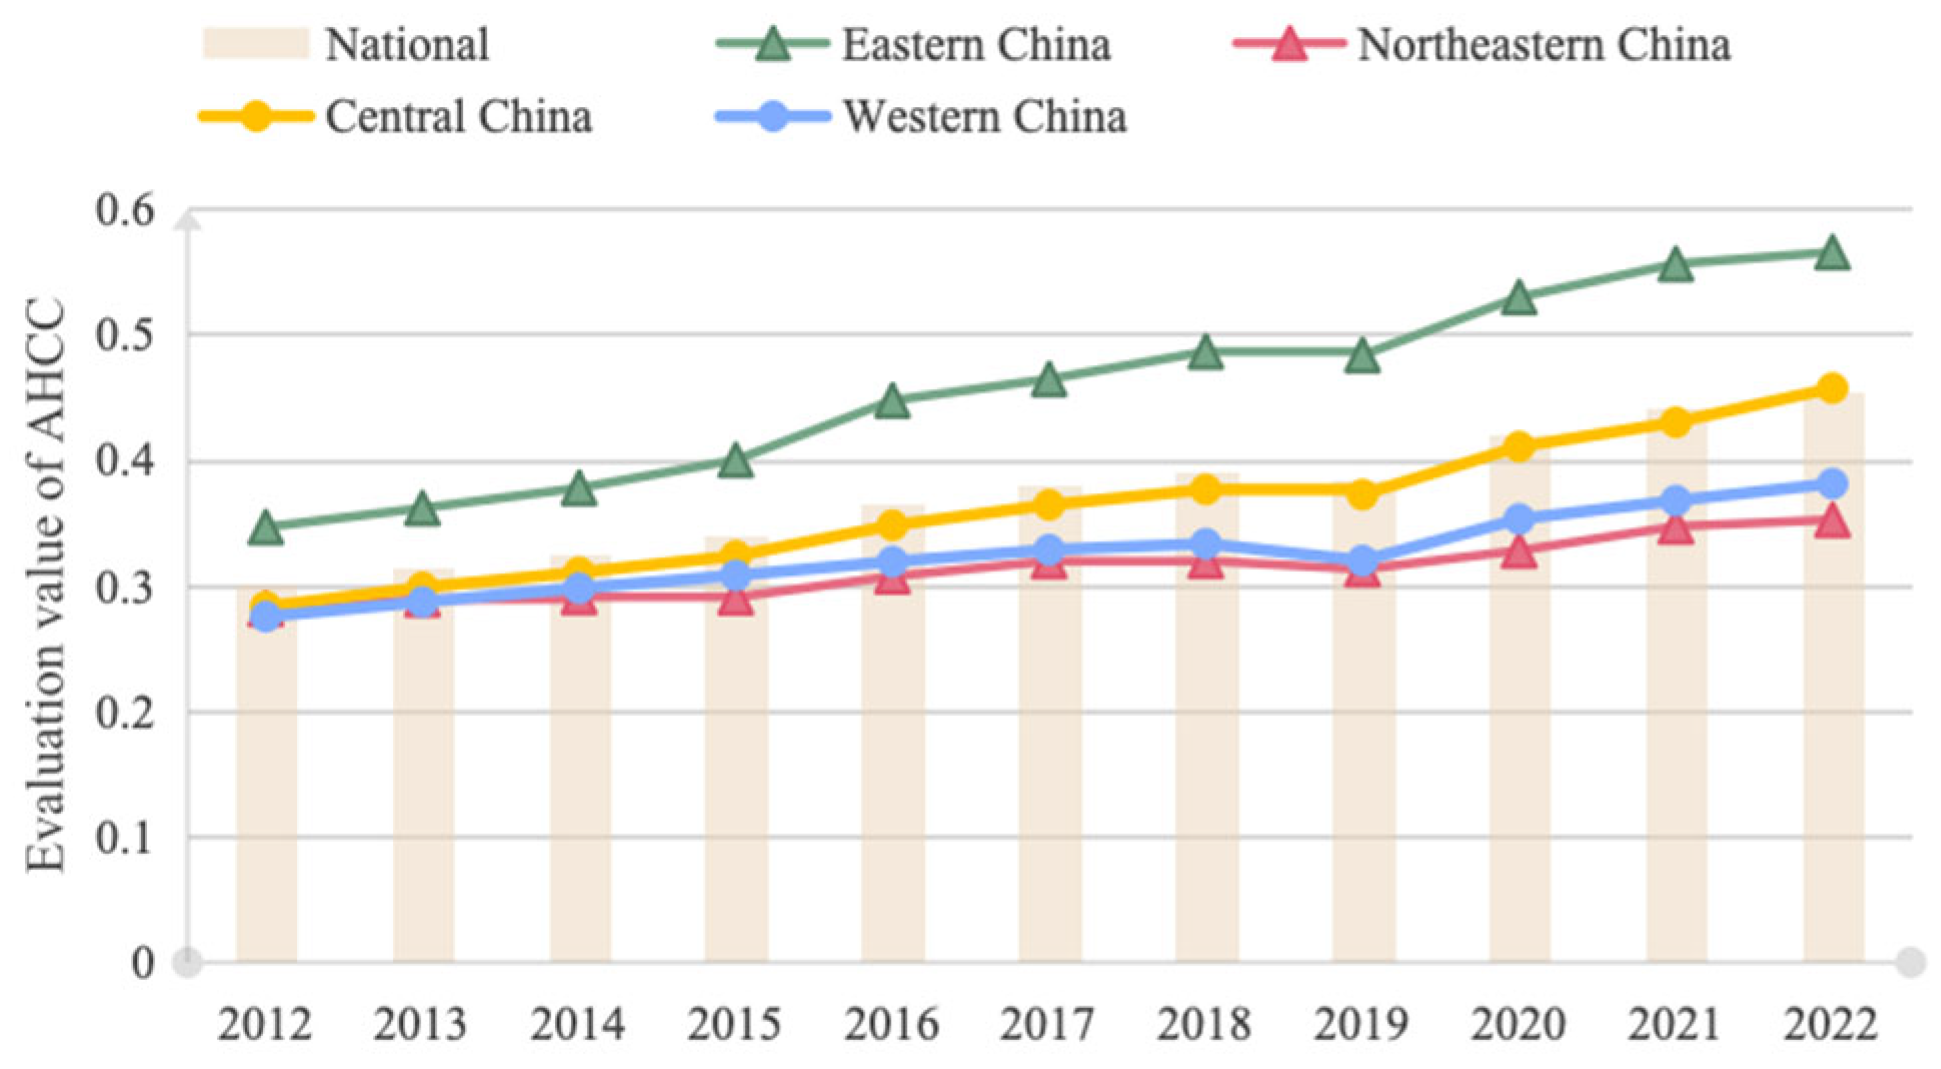
Figure 5 displays the temporal evolution of AHCC across China’s four major regions and at the national level from 2012 to 2022. Several key trends emerge from the data. First, the national AHCC rose steadily from 0.301 to 0.454, indicating a progression from mild to marginal imbalance. This reflects growing synergy between digital and energy systems nationwide. However, the national level remained within the imbalance stages throughout the period, implying that integration between AI and HED is still in its formative stage and far from optimal. Second, notable regional disparities persist. The eastern region consistently led all others, with AHCC rising from 0.346 to 0.565 and entering the preliminary coordination stage after 2020. Such progress reflects the region’s robust digital infrastructure, vibrant innovation ecosystems, and proactive energy transition policies. In contrast, the central and western regions exhibited slower yet steady growth, reaching 0.457 and 0.381 in 2022—falling into the marginal and mild imbalance stages, respectively. These results suggest growing AI–HED synergy in inland areas, although gaps remain. Third, the northeast region consistently recorded the lowest AHCC levels, increasing only from 0.281 to 0.352. Although progressing from moderate to mild imbalance, the region remained the weakest nationwide. The persistent lag may stem from structural constraints such as demographic decline, industrial rigidity, and sluggish technological upgrading.
Figure 5.
Temporal evolution of AHCC.
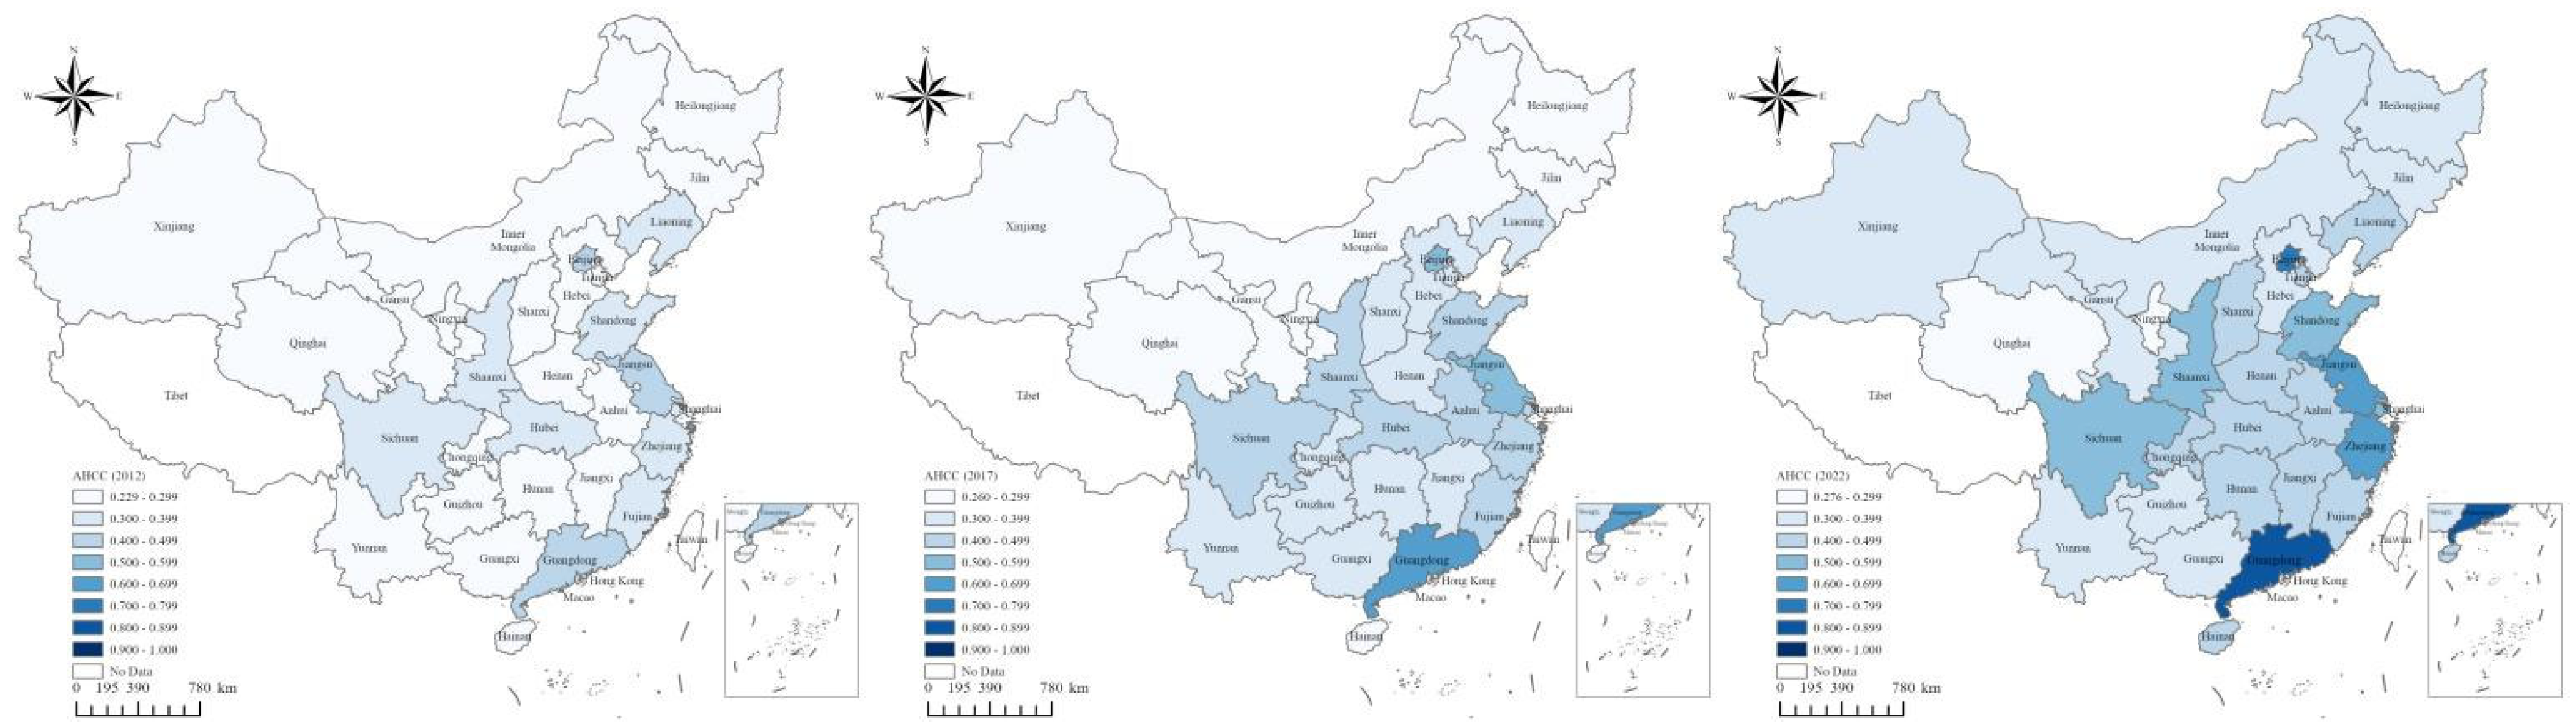
Figure 6 illustrates the spatial evolution of AHCC across 30 provinces in 2012, 2017, and 2022, highlighting notable regional disparities. In 2012, 27 provinces remained within the imbalance range (D < 0.5), primarily exhibiting moderate or mild imbalance. Only Guangdong (0.463), Beijing (0.441), and Jiangsu (0.433) approached the upper end of the imbalance spectrum, indicating relatively better AI–HED integration. In contrast, western (e.g., Ningxia: 0.229), central (e.g., Jiangxi: 0.241), and northeastern (e.g., Jilin: 0.245) provinces lagged behind, reflecting weak coordination between digital and energy systems. By 2017, spatial differentiation became more pronounced. More eastern coastal provinces advanced toward higher coordination. For example, Guangdong (0.676), Jiangsu (0.588), and Beijing (0.585) exceeded the 0.5 threshold and attained preliminary or primary coordination. However, many western, northeastern, and central provinces (e.g., Ningxia: 0.266, Heilongjiang: 0.289, Shanxi: 0.321) remained in mild or moderate imbalance. By 2022, spatial divergence further intensified. Most eastern provinces had entered various coordination stages (D > 0.5), with Guangdong (0.805), Beijing (0.724), Jiangsu (0.689), Zhejiang (0.607), Shandong (0.581), and Shanghai (0.561) attaining preliminary, primary, intermediate, or good coordination. Central provinces such as Hubei (0.489) and Anhui (0.477) were approaching the preliminary coordination threshold, reflecting gradual improvement. Western provinces like Sichuan (0.542) and Shaanxi (0.503) showed signs of catching up, having surpassed the 0.5 threshold. However, many western and northeastern provinces (e.g., Ningxia: 0.276, Heilongjiang: 0.325) remained in mild or moderate imbalance, indicating persistent regional disparities in AI–HED integration.
Figure 6.
Spatial evolution of AHCC.
4.3. Spatial Autocorrelation of AHCC
Table 4 reports the global Moran’s I values of AHCC from 2012 to 2022 based on three spatial weight matrices: the 0–1 adjacency matrix (w1), the geographic distance matrix (w2), and the economic–geographic distance matrix (w3). Under w1, Moran’s I values exhibit an upward trend, turning positive in 2016 and becoming statistically significant from 2020, indicating a gradual strengthening of spatial autocorrelation. w2 yields more consistent results, with positive and significant values from 2016 onward, reflecting a relatively stable spatial autocorrelation driven by geographic proximity. w3 presents the strongest and most robust pattern: Moran’s I values remain positive and significant throughout the period, indicating that AHCC exhibits stronger spatial autocorrelation when both geographical proximity and economic similarity are considered.
Table 4.
Global Moran’s I of AHCC.
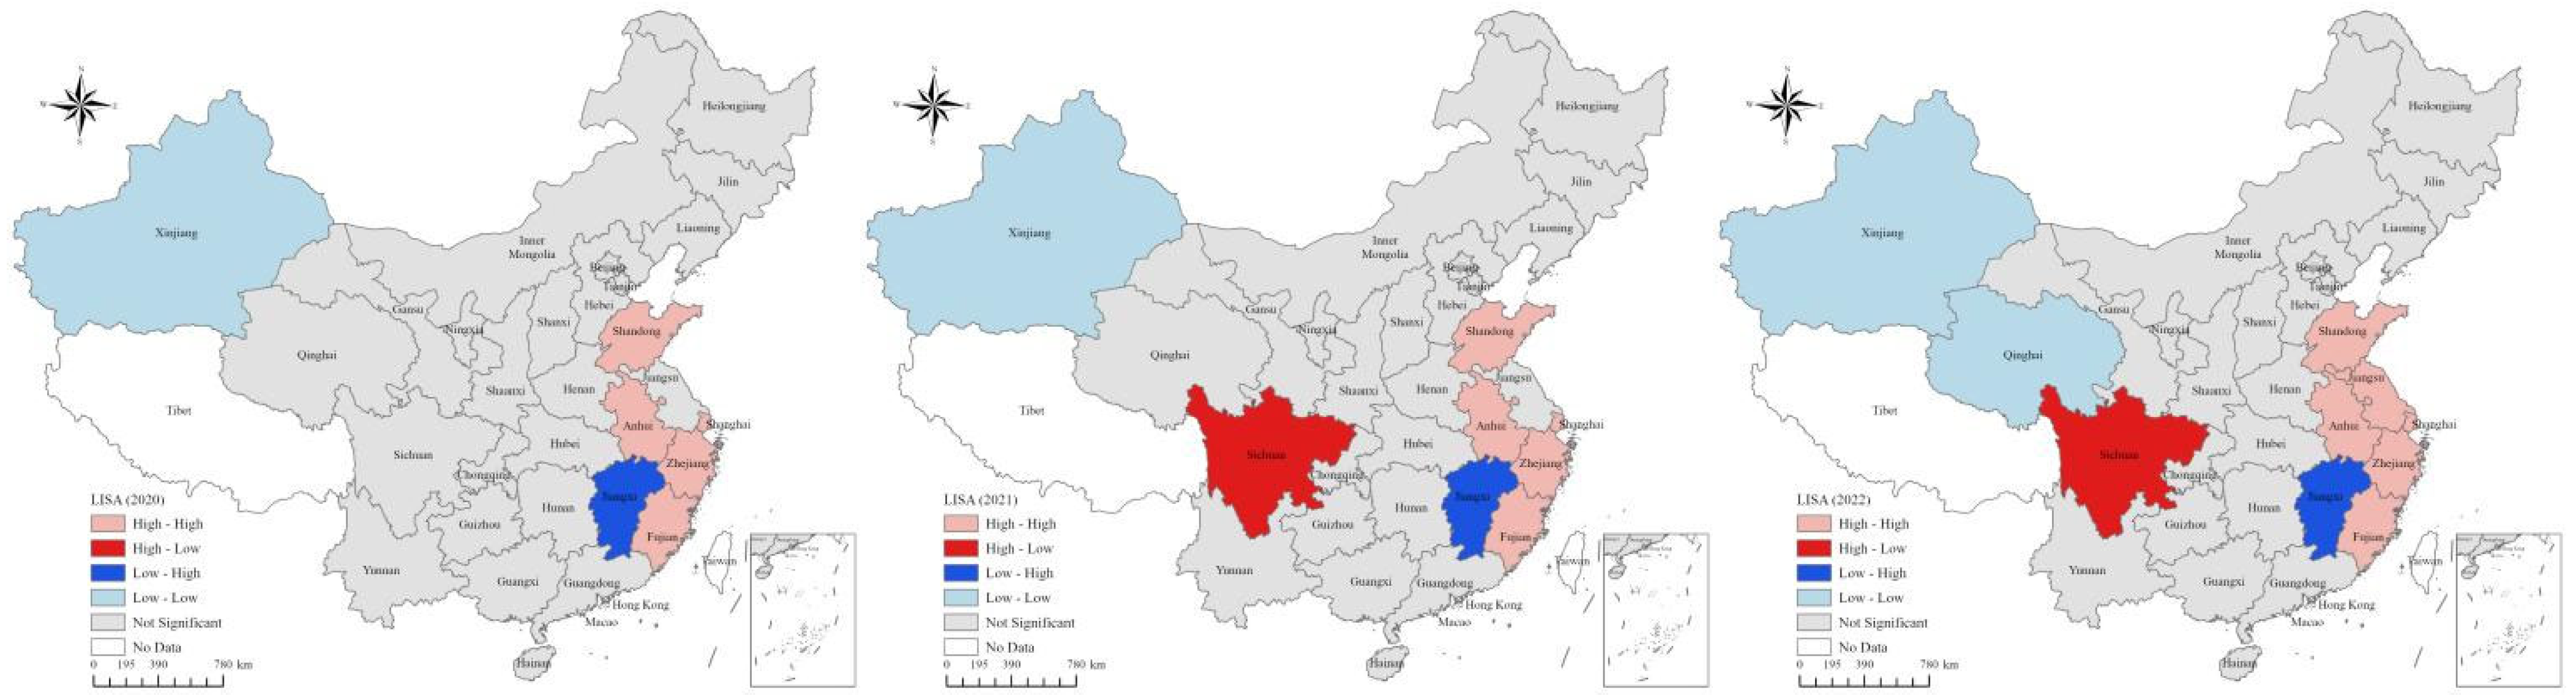
Figure 7 presents the local indicators of spatial association (LISA) cluster maps of AHCC for selected years, revealing significant local spatial patterns. Four spatial association types are identified: High–High (HH), Low–Low (LL), High–Low (HL), and Low–High (LH). Provinces such as Shanghai, Zhejiang, Fujian, Anhui, Shandong, and Jiangsu are frequently located in HH clusters, indicating that high-AHCC provinces are often surrounded by similarly well-performing neighbors. Conversely, Xinjiang and Qinghai appear in LL clusters, reflecting the spatial concentration of low AHCC levels. Sporadic occurrences of HL and LH patterns, such as HL in Sichuan or LH in Jiangxi, reveal spatial outliers where local AHCC levels diverge from their neighboring regions. These results confirm the presence of significant local spatial autocorrelation in AHCC, revealing heterogeneous clustering and dispersion patterns across regions. The observed spatial autocorrelation supports the application of GTWR to assess the spatiotemporally varying influences of key determinants on AHCC.
Figure 7.
LISA cluster map of AHCC.
4.4. Driving Factors of AHCC
4.4.1. Global Regression Analysis and Model Validation
Table 5 presents the results of the variance inflation factor (VIF) analysis and the baseline ordinary least squares (OLS) regression. Although the VIF values for EDL and UL slightly exceeded 5, both remained below 10. Because VIF thresholds serve as diagnostic guidelines rather than automatic exclusion criteria, and because EDL and UL capture theoretically distinct dimensions of regional development, both variables were retained in the regression model. Overall, the diagnostic results did not indicate multicollinearity at a level that warranted model respecification. The OLS model exhibits a high goodness-of-fit (R2 = 0.881, adjusted R2 = 0.879), suggesting that the selected drivers jointly explain a substantial proportion of the variation in AHCC. Among the six explanatory variables, technological innovation (TI) exerts the strongest positive impact on AHCC, underscoring its central role in fostering synergies between AI development and energy transitions. Economic development level (EDL) also has a significant positive effect, reflecting the foundational role of economic strength in supporting digital infrastructure and clean energy modernization. Industrial structure upgrading (ISU) contributes positively as well, indicating that the shift toward advanced, service-oriented, and low-carbon industries fosters better AI–energy coordination. In contrast, environmental regulation (ER), urbanization level (UL), and government intervention (GI) are significantly negatively associated with AHCC. These findings imply that rigid regulatory controls, rapid urban expansion, and excessive administrative interventions may hinder the flexible integration of AI and energy systems, particularly in regions lacking enabling market mechanisms or technological foundations.
Table 5.
Results of the VIF analysis and the baseline OLS regression.
To verify the robustness of the OLS regression results, three additional tests were conducted, and the results are reported in Table 6. First, a Tobit model was used to account for the limited range of the dependent variable (AHCC ∈ [0, 1]). The estimated coefficients remained significant and consistent in sign with the baseline model. Second, a variable substitution was performed by replacing the original indicator of industrial structure upgrading with the ratio of tertiary to secondary industry value-added. The results remained stable, with TI, EDL, and ISU showing significant positive effects, while ER, UL, and GI retained significant negative impacts. Third, a sample adjustment was applied by excluding observations from 2019 to 2021—the peak years of the COVID-19 pandemic. The results remained largely unchanged, confirming the robustness of the core findings.
Table 6.
Robustness test.
To explore the spatiotemporal heterogeneity in the driving mechanisms of AHCC, three local regression models—TWR (temporally weighted regression), GWR (geographically weighted regression), and GTWR—were constructed and compared with the global OLS model. As shown in Table 7, the explanatory power improves sequentially from OLS to GTWR. Specifically, the GTWR model achieves the highest R2 (0.975) and adjusted R2 (0.975), along with the lowest AICc (−1526.890) and RSS (0.103) among all models, indicating an improved model fit after accounting for spatiotemporal heterogeneity. Moreover, model performance was evaluated comprehensively using multiple diagnostic statistics, including adjusted R2, AICc, RSS, and bandwidth. Based on this comprehensive evaluation, the GTWR model is selected as the optimal specification for the subsequent analysis of AHCC’s driving factors.
Table 7.
Comparison of regression model performance.
4.4.2. Spatiotemporal Heterogeneity of Driving Effects
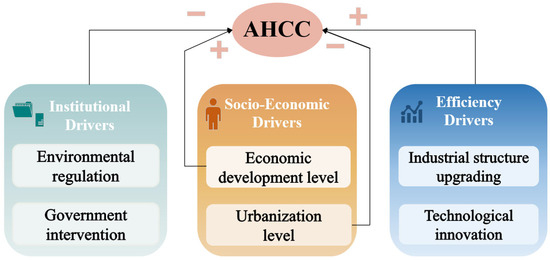
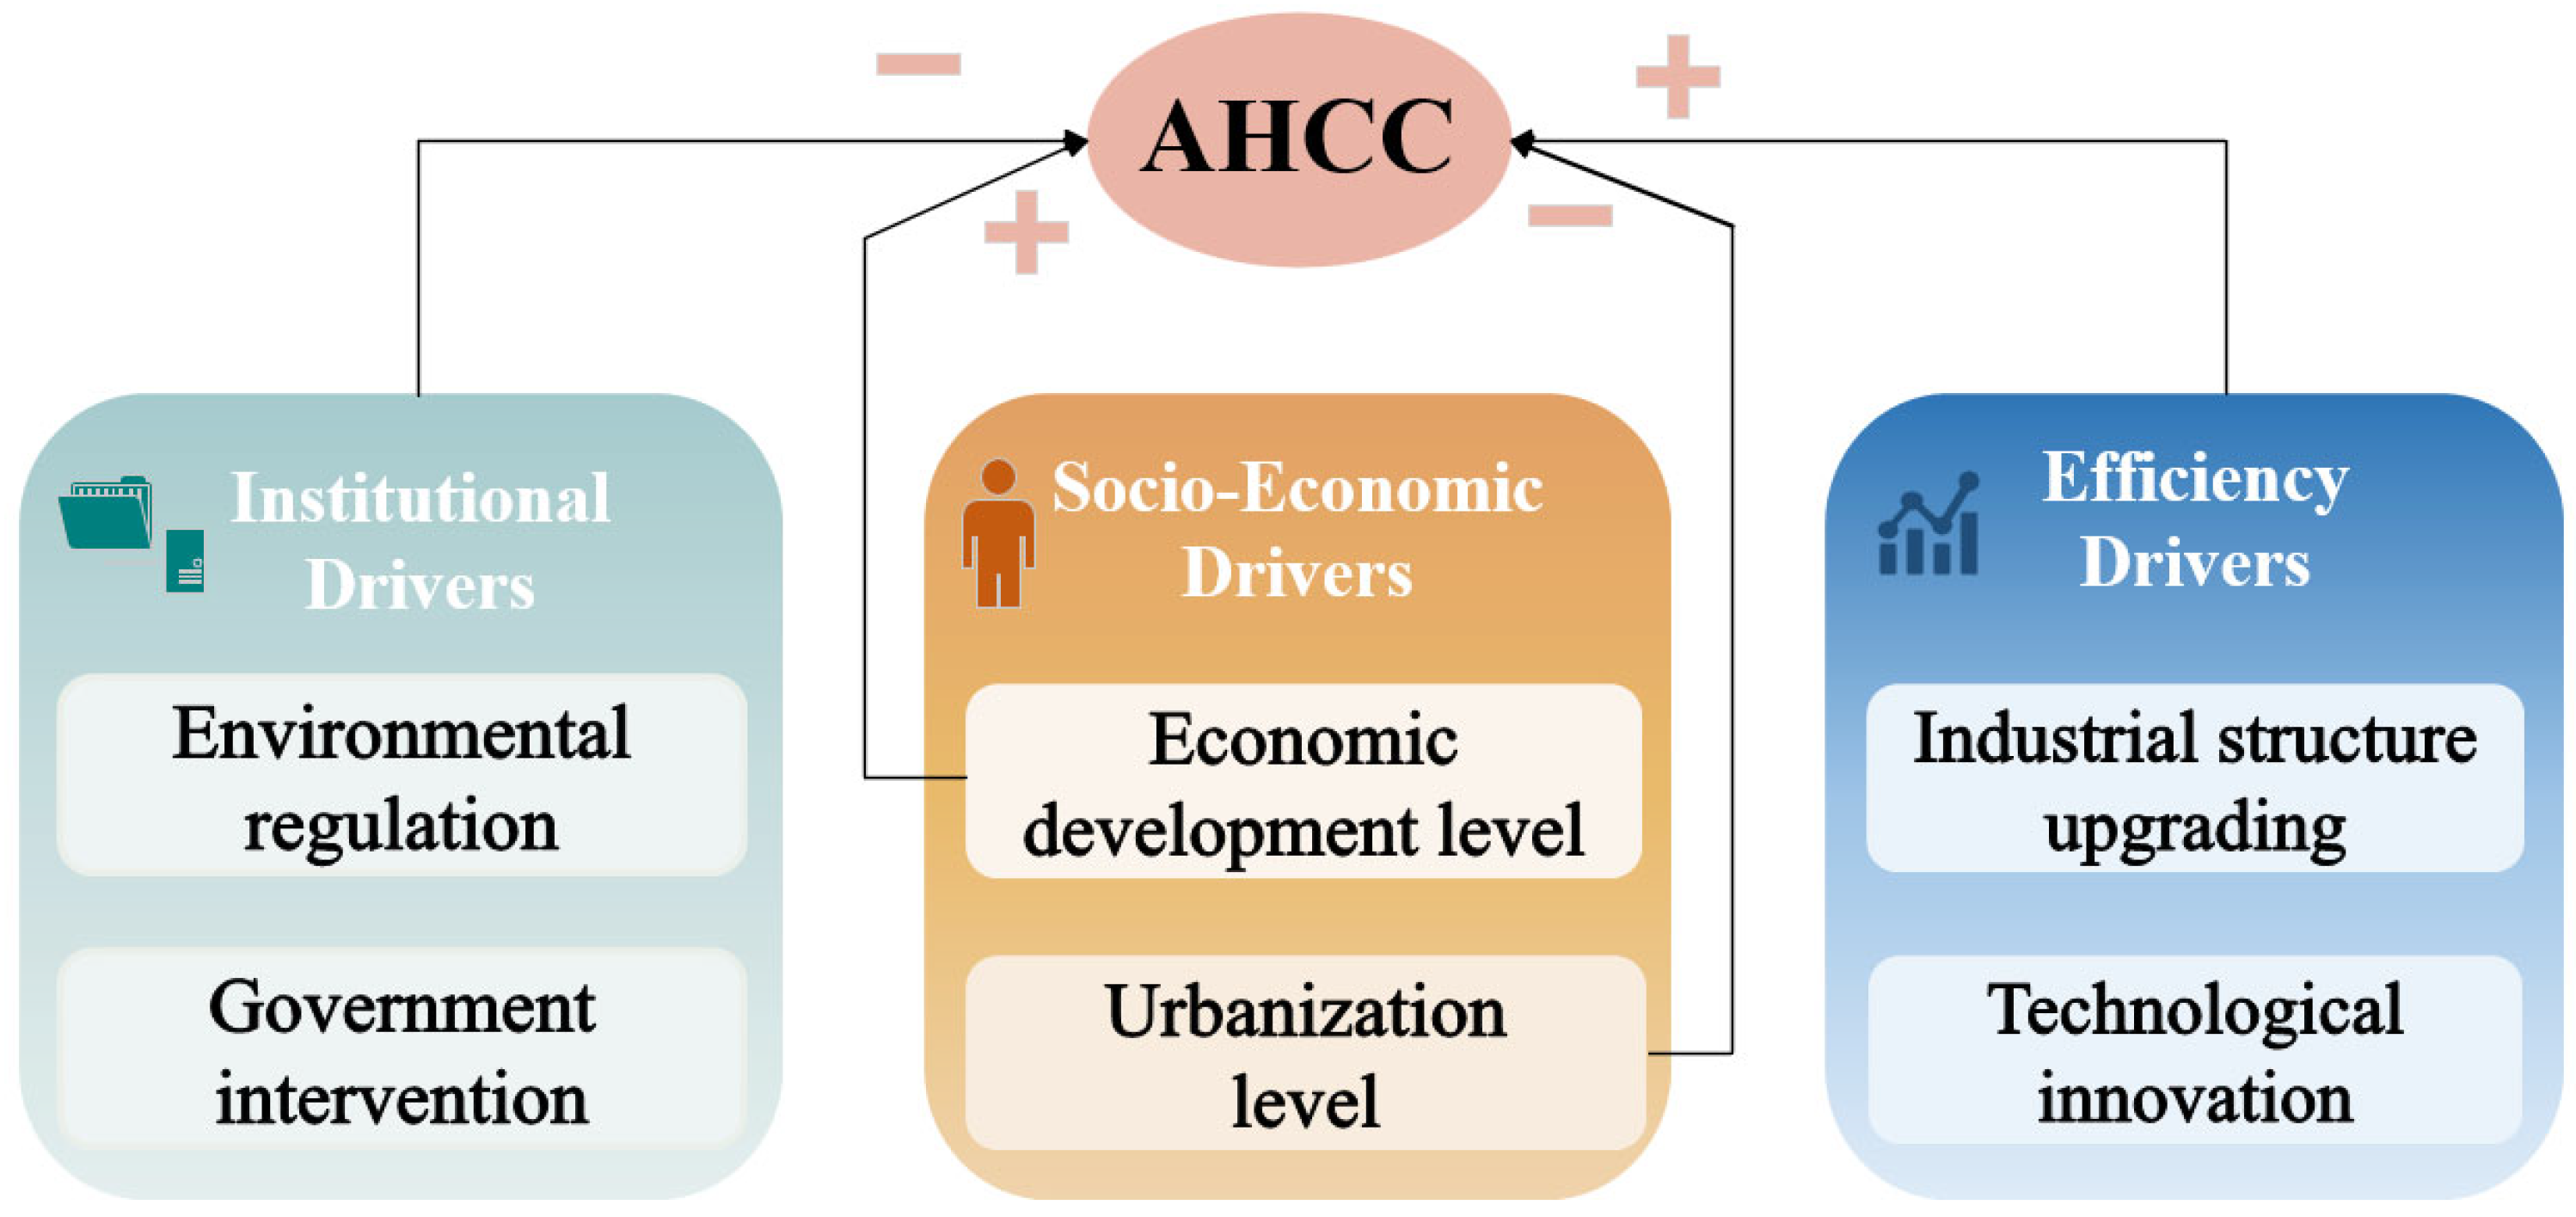
The six drivers exert heterogeneous effects on AHCC. As illustrated in Figure 8, they can be grouped into three dimensions—institutional, socio-economic, and efficiency-related drivers—which interact and jointly shape AHCC.
Figure 8.
Diagram of the driving mechanism of AHCC.
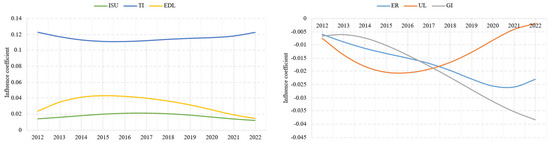
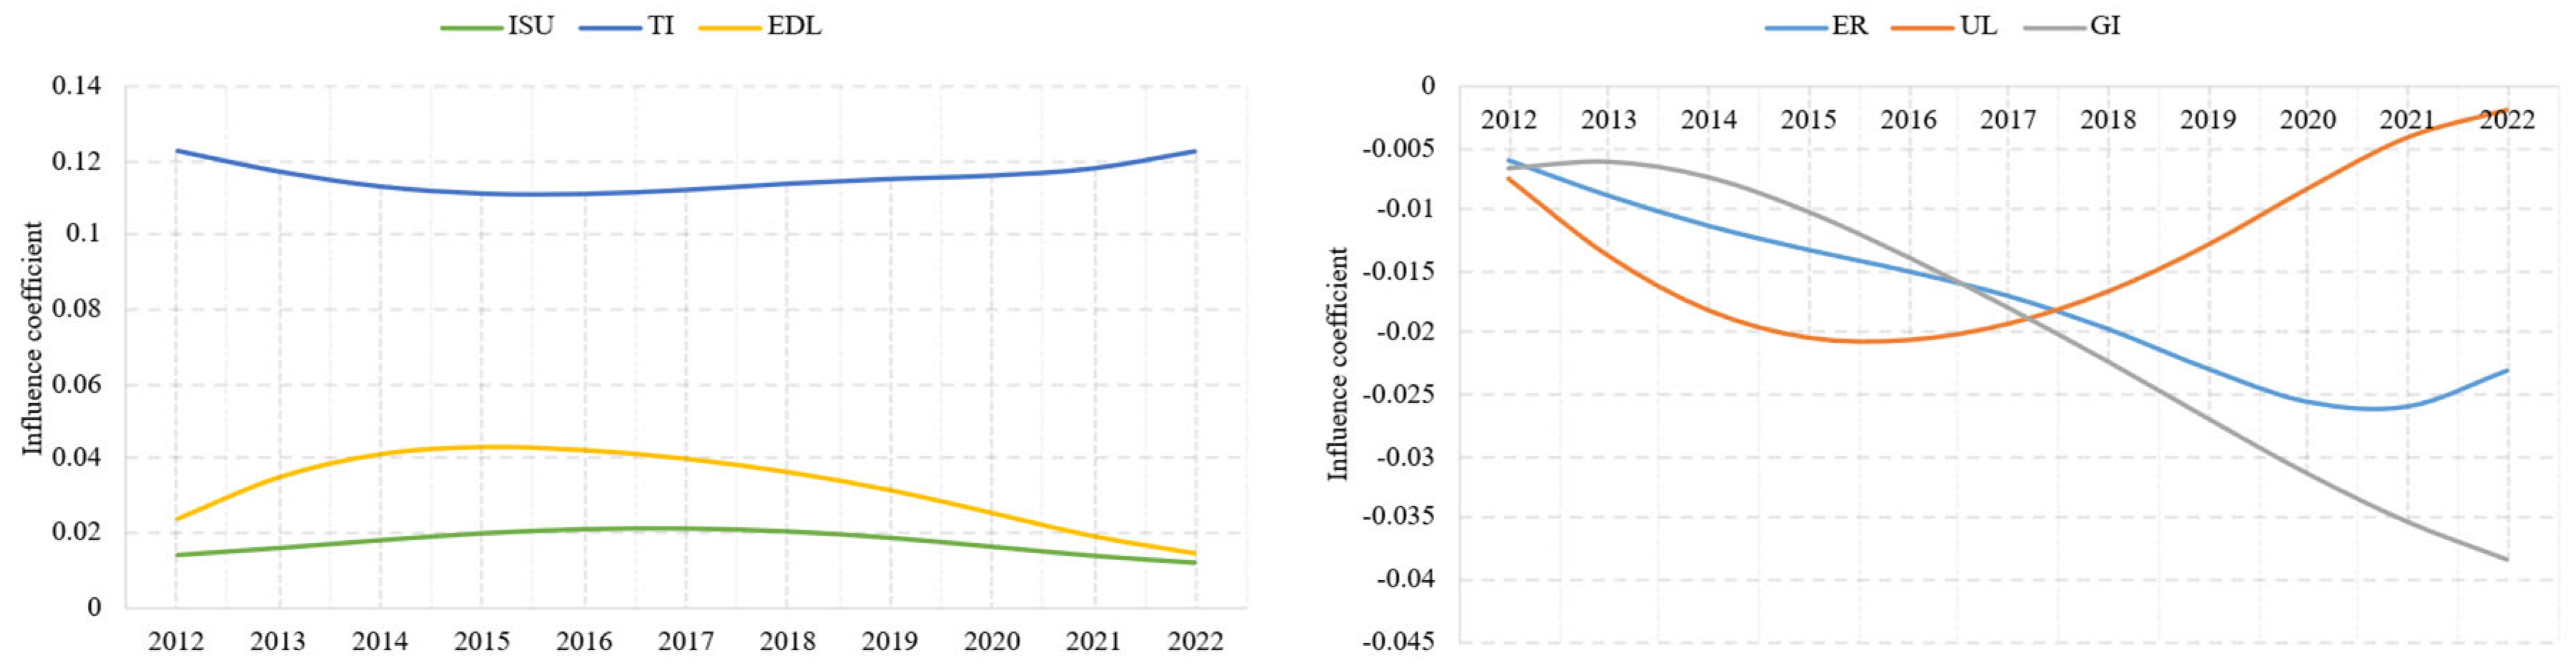
Figure 9 illustrates the temporal dynamics of the influence coefficients of the six selected drivers on AHCC from 2012 to 2022, as estimated by the GTWR model. The results reveal clear differences in the temporal trajectories of positively and negatively associated variables. Among the positive drivers, TI consistently emerges as the most influential and stable driver of AHCC, underscoring the sustained role of innovation capacity in fostering synergies between AI and high-quality energy systems. The influence of EDL follows an inverted U-shaped trend—rising steadily until 2015 and then gradually declining—suggesting that while early-stage economic growth supports AI–energy integration, diminishing marginal returns may emerge beyond a certain development threshold. ISU exerts a positive yet relatively modest influence, which gradually declines after 2017, reflecting the saturation of structural transformation benefits. In contrast, the three negative drivers display more pronounced and divergent trends. GI shows a steadily increasing negative effect, suggesting that excessive administrative interference has become an escalating barrier to AI–energy coordination. UL initially exerts the strongest negative effect, but its influence weakens over time, possibly indicating that urban systems are gradually adapting to the demands of digital–energy coordination. ER presents a nonlinear trajectory, with its negative impact worsening between 2012 and 2020, followed by a modest rebound in 2021–2022, which may reflect a time-lagged response to regulatory adjustments.
Figure 9.
Temporal evolution of AHCC driving factors.
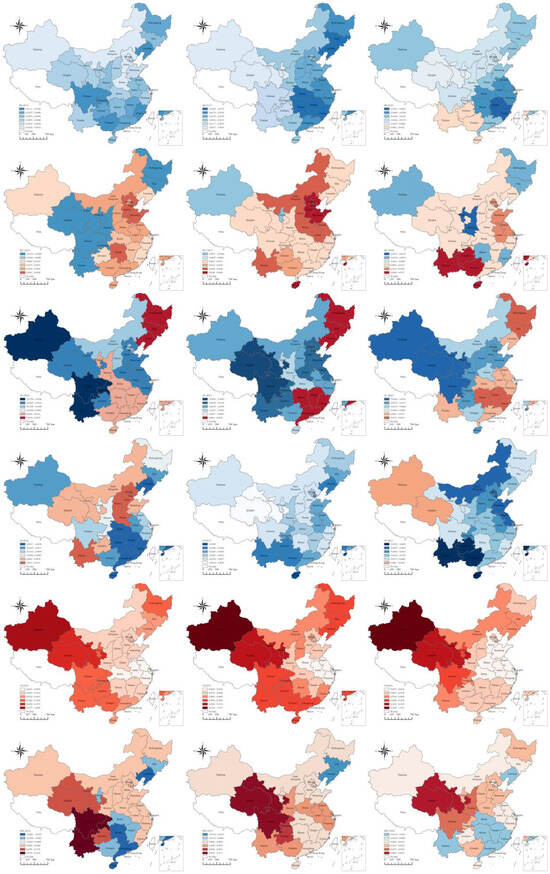
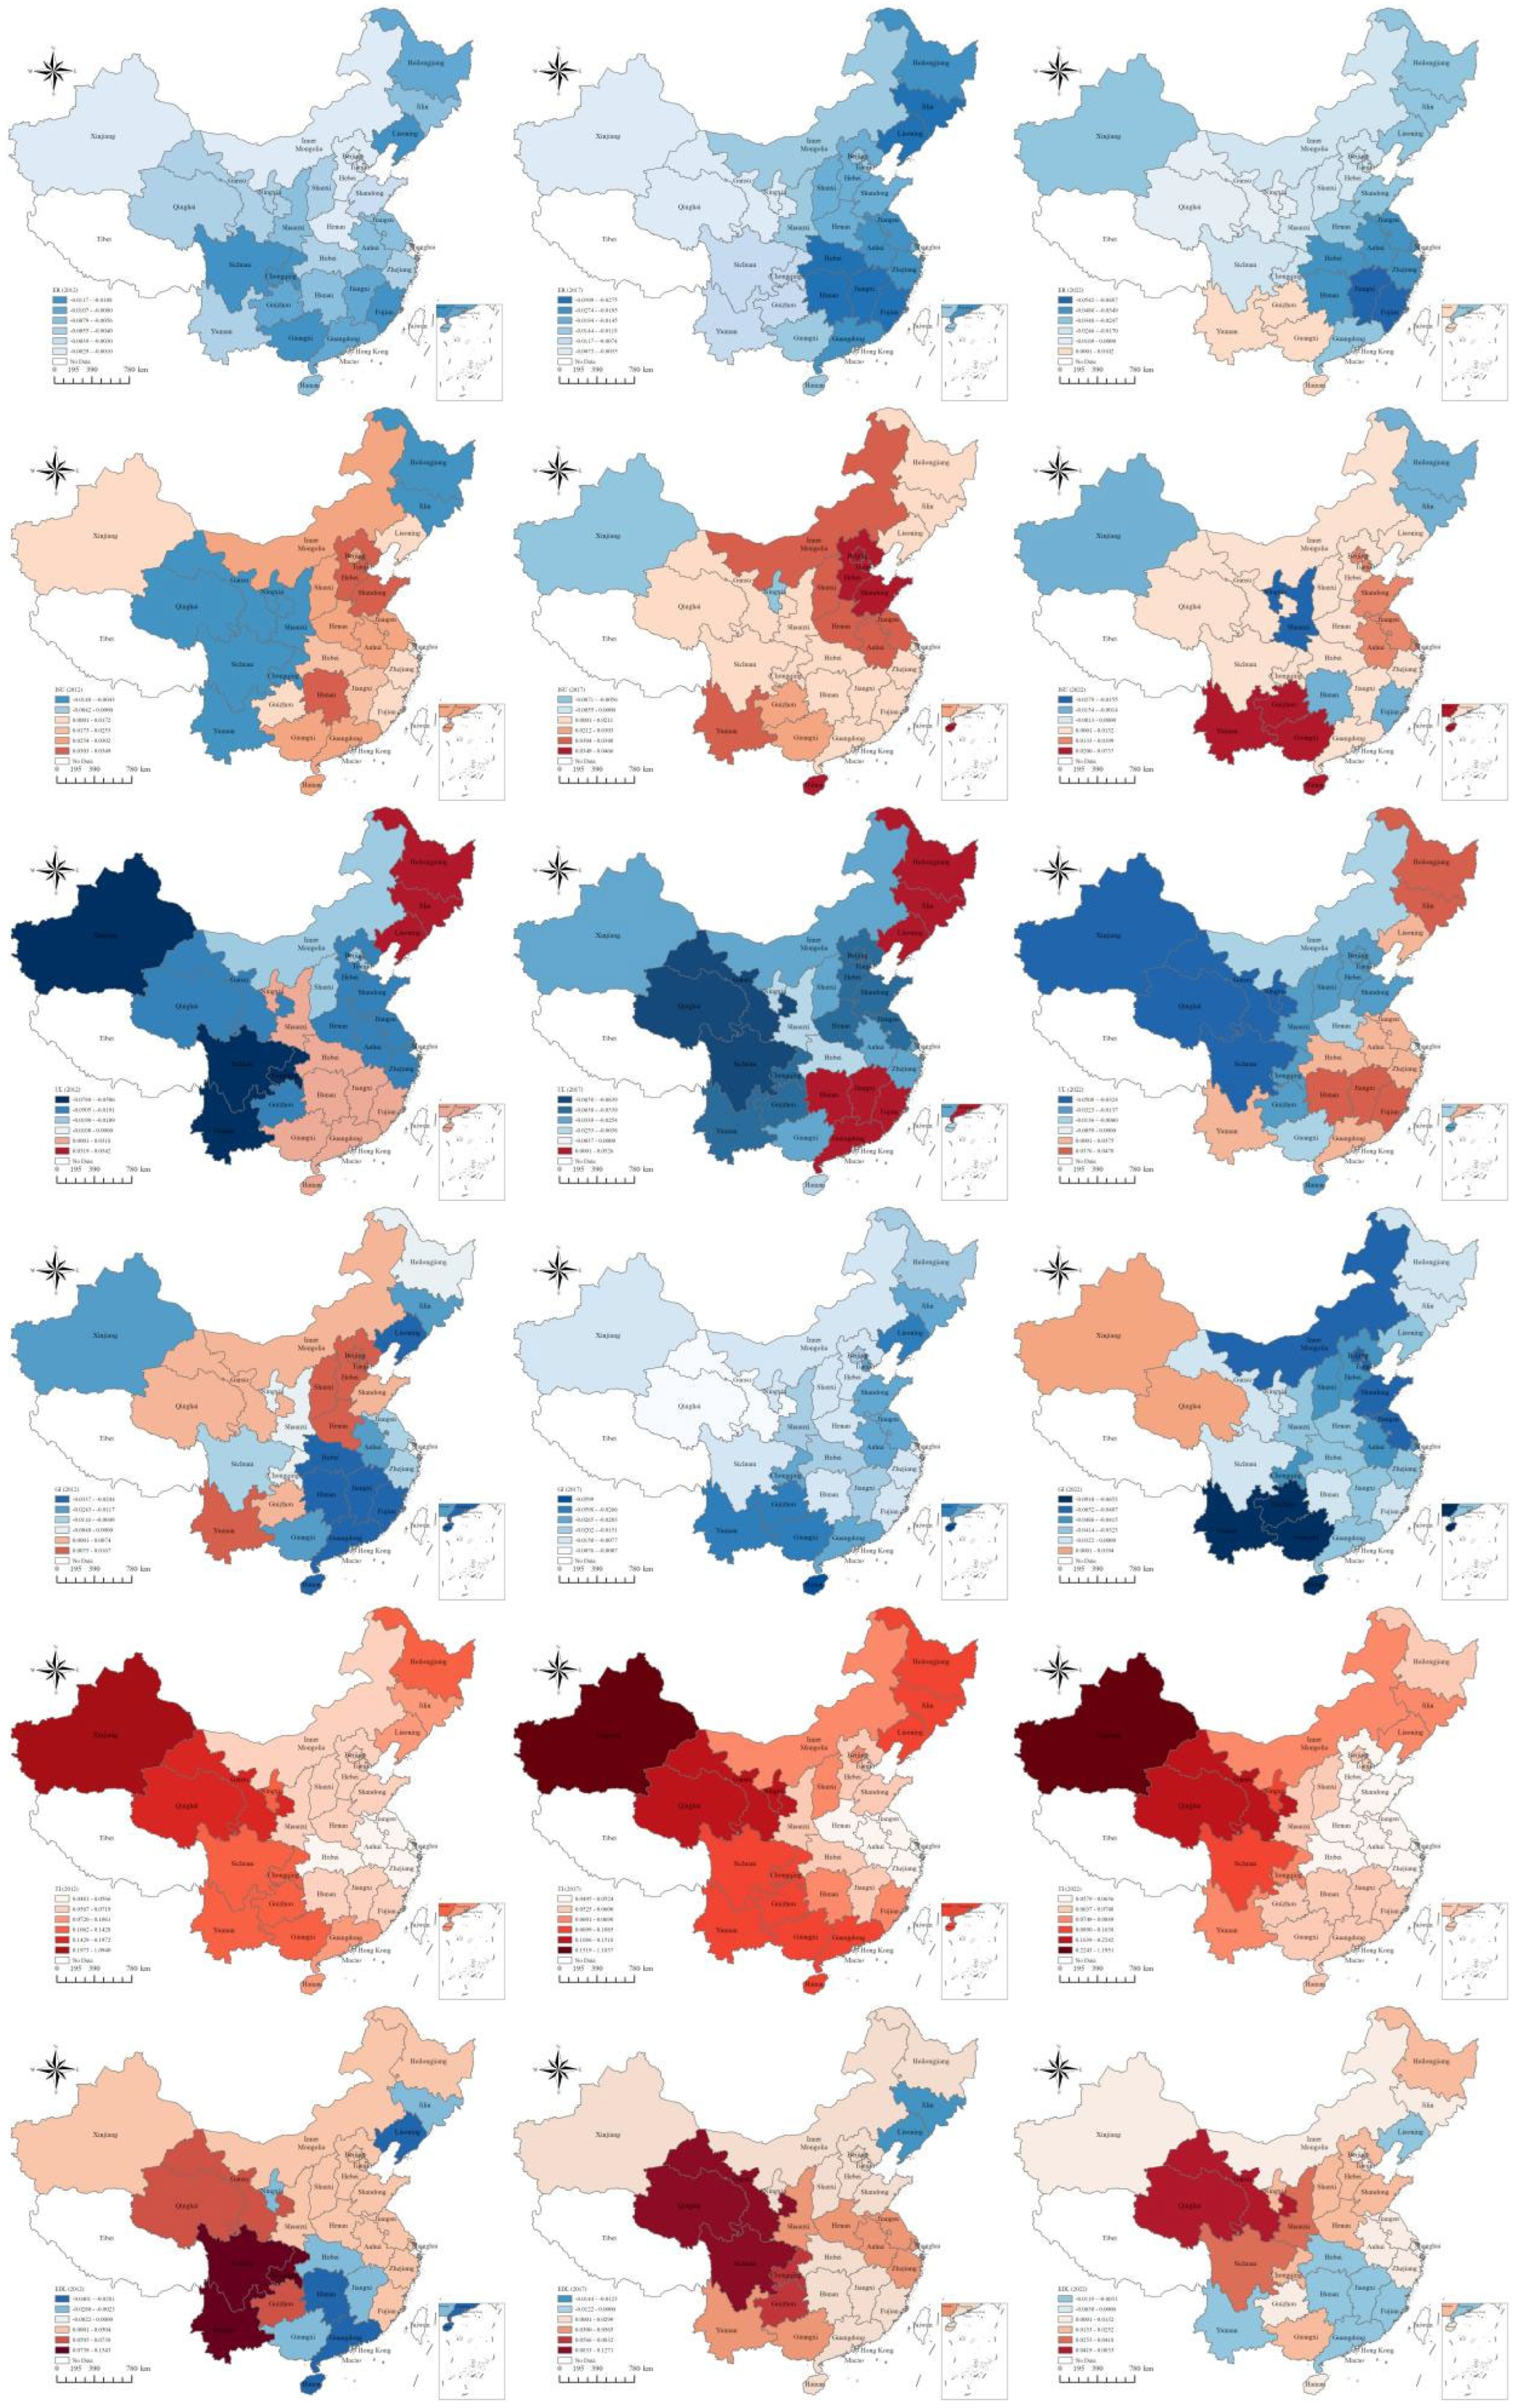
Figure 10 illustrates the spatial variation in the effects of six key factors on AHCC across Chinese provinces. Among them, ER exhibits a pronounced east–west disparity, with increasingly negative effects observed in the eastern and central regions. In 2012, environmental constraints were relatively mild nationwide. By 2017, the negative effects became more concentrated in southeastern coastal provinces and the middle and lower Yangtze River basin, where both resource-intensive and export-oriented sectors faced rising compliance costs under the dual pressures of excess capacity reduction and stricter emissions control. This dual-policy burden not only raised operational costs but also constrained firms’ flexibility to invest in digital and energy innovations, thereby weakening AHCC. By 2022, the east–west disparity had further widened. Provinces in eastern and central China—such as Jiangxi, Hubei, Fujian, and Zhejiang, characterized by either heavy industry or export-oriented manufacturing—remained among the most adversely affected. In contrast, several less-developed southwestern provinces shifted from negative to positive effects, suggesting that environmental mandates in these areas have been increasingly reframed as enabling mechanisms for AHCC, supported by instruments such as ecological compensation and green finance.
Figure 10.
Spatial evolution of AHCC driving factors.
ISU generally exerts a positive influence on AHCC, with the spatial distribution of high values shifting over time from the Bohai Rim in the north to the southwest and southern coastal provinces. In 2012 and 2017, relatively higher positive coefficients were concentrated in the Bohai Rim region, particularly in Shandong, Tianjin, Hebei, and Beijing, reflecting the role of early-stage manufacturing upgrading and service sector expansion in facilitating AI–energy integration. By 2022, however, the high-value areas had shifted southwestward to provinces such as Hainan, Guangxi, Guizhou, and Yunnan, where industrial transformation was increasingly coupled with clean energy development and digitalization, enabling greater synergies between AI adoption and energy systems. Conversely, several northwestern and central provinces, including Ningxia, Shaanxi, and Xinjiang, recorded negative coefficients in 2022. These regions, dominated by resource- and energy-intensive industries, experienced greater transition frictions and higher technology substitution costs, which constrained effective AHCC.
UL generally exerts a negative influence on AHCC, with a persistent northwest–southwest “negative belt.” In 2012, strong inhibitory effects were found in provinces such as Sichuan, Chongqing, Xinjiang, and Yunnan, driven by rapid urban expansion—land development and population agglomeration in the southwest, and resource-based industrial growth in Xinjiang—without parallel clean energy or digital infrastructure upgrades. By 2017, negative coefficients expanded to a wider set of provinces, including Guangxi, Hubei, Shaanxi, Ningxia, and Hainan, reflecting transitional frictions from industrial relocation, surging energy demand, and lagging smart-grid integration. In 2022, the core negative area remained concentrated in the northwest and southwest. Several provinces, such as Zhejiang and Jiangsu, shifted from negative values to mildly positive, indicating that where urbanization aligns with service-sector upgrading, renewable energy integration, and digital infrastructure deployment, its constraining effects on AHCC are mitigated.
GI exhibits predominantly negative effects on AHCC, with intensifying inhibition concentrated in the south–southwest. In 2012, negative values were scattered across the southeast coast and parts of the southwest, but by 2017 all provinces recorded negative coefficients. By 2022, two high-intensity clusters became evident: one in the south–southwest (Hainan, Yunnan, Guizhou, Guangxi) and another in the Bohai Rim–eastern coastal region (Shandong, Tianjin, Beijing, Jiangsu, Hebei). In the southwest, fragmented approval systems, complex subsidy settlement, and low grid interconnection have increased transaction and coordination costs. In industrialized coastal and resource-based provinces, rigid capacity and energy-consumption controls have not been accompanied by adequately matching market mechanisms and fully integrated digital grid upgrades, limiting demand response, renewable integration, and AI-enabled retrofitting, thereby hindering AI–energy synergy.
TI exerts a consistently positive effect on AHCC, with the most pronounced promotion concentrated in the northwest. From 2012 to 2022, Xinjiang maintained coefficients substantially higher than in any other province, followed by a second tier including Qinghai, Gansu, and Ningxia. This “plateau–desert” cluster, endowed with abundant wind–solar resources but constrained by weaker grid infrastructure, has gained the greatest marginal benefits from AI-enabled improvements in renewable energy consumption and long-distance power dispatch. In contrast, provinces in the Yangtze River Delta—such as Jiangsu, Shanghai, and Zhejiang—consistently recorded the lowest coefficients, as their relatively mature digital and energy infrastructures limit the marginal gains from additional innovation inputs. The spatial pattern has remained largely stable over time, indicating the sustained advantage of resource-rich but infrastructure-limited regions in leveraging TI to enhance AHCC.
EDL generally exerts a positive effect on AHCC, with high coefficients initially concentrated in the southwest and later extending into the northwest. In 2012, the strongest effects were in Sichuan, Yunnan, and Chongqing, where rapid economic growth from a low base was accompanied by large-scale infrastructure investment, boosting both digital capacity and renewable energy integration. By 2017, the high-value cluster expanded to Gansu and Qinghai, reflecting targeted development strategies that strengthened AI–energy linkages in western provinces. In 2022, the positive effect weakened in much of the southwest, suggesting diminishing marginal returns after core infrastructure and early-stage industrial transformation were completed. Mature coastal economies—such as Shanghai, Jiangsu, and Zhejiang—maintained mild positive effects, reflecting incremental but limited gains, whereas intermittent negatives in certain regions likely stem from resource- and energy-intensive growth with limited spillovers or from saturation effects that limit the translation of growth into digital–energy upgrading.
5. Discussion and Conclusions
5.1. Main Findings
This study examines the evolution of AHCC and identifies the following main findings. First, from 2012 to 2022, both AI and HED in China exhibited steady growth, with the AI index increasing from approximately 0.06 to 0.18, and the HED index from about 0.18 to 0.31. Although the AI–HED gap narrowed slightly after 2019, AI consistently lagged behind HED throughout the study period. Spatially, AI development was highly concentrated in eastern provinces. By contrast, HED was distributed more evenly across provinces, with relatively high levels in 2012. Overall, despite progress in both systems, their spatial distributions did not fully coincide. These contrasting patterns reflect the eastern region’s strong AI ecosystem, supported by leading firms, research institutions, and market demand, while the western region benefits from abundant renewable energy resources and national energy strategies, giving it a comparative advantage in HED.
Second, the AHCC improved nationwide from 0.301 to 0.454, progressing from mild imbalance to marginal imbalance. The eastern region consistently led, while the central and western regions showed gradual but slower gains, and the northeast lagged behind. By 2022, most eastern provinces entered various coordination stages, most central provinces were nearing preliminary coordination, and several western provinces reached it; yet most western and all northeastern provinces remained in imbalance. Global Moran’s I results confirmed the strengthening spatial autocorrelation of AHCC, particularly when considering both geographic and economic proximity. LISA analysis revealed High–High clusters in economically dynamic eastern provinces, reflecting the combined effects of strong technological capabilities, supportive policies, and mature industrial ecosystems that facilitate the coordinated development of AI and HED. Low–Low clusters in less-developed northwestern regions, where weaker economic foundations and limited technological capacity constrained coordination, together with a few High–Low and Low–High spatial outliers.
Third, regression analysis identified TI, EDL, and ISU as positive drivers of AHCC, while ER, UL, and GI had negative effects. TI was the most influential factor, with the strongest effects in resource-rich but infrastructure-limited northwestern provinces. Supported by China’s innovation-driven development strategy and regional coordination policies, the western region has steadily enhanced its indigenous innovation capacity. EDL’s core positive influence shifted from the southwest to the northwest, while its overall positive effect weakened in mature coastal economies due to diminishing marginal gains. ISU’s benefits were concentrated in the southwest and southern coastal provinces, while its effects were negative in resource- and energy-intensive regions. ER’s inhibitory effects intensified in eastern and central provinces with heavy industrial or export-oriented structures, while UL formed a persistent northwest–southwest “negative belt” owing to urban expansion without parallel digital–energy upgrades. GI’s negative influence strengthened in the south–southwest, where rigid capacity controls and administrative inefficiencies constrained AHCC.
5.2. Theoretical Contributions
This study makes three main theoretical contributions. First, this research advances the theoretical understanding of the relationship between AI and HED by moving beyond the prevailing focus on unidirectional effects. While most prior studies have primarily examined the influence of AI on energy systems, this study conceptualizes AI and HED as two interdependent subsystems and investigates their bidirectional coupling mechanism, whereby the two systems continuously interact and mutually reinforce each other. By highlighting these reciprocal interactions, this study offers a new perspective for understanding the coordinated evolution of digital intelligence and energy transition.
Second, the study constructs a multidimensional and integrative evaluation system designed to assess the development levels of AI and HED across spatial and temporal dimensions. Specifically, the AI subsystem includes four dimensions— development environment, talent resources, industrial application, and economic output, while the HED subsystem comprises five: innovation, coordination, greenness, openness, and sharing. The structured index system enables systematic evaluation of the overall state and dynamics of each subsystem and provides a replicable basis for cross-regional and cross-national comparative studies on digital and energy transitions.
Third, the study establishes a comprehensive analytical framework to evaluate AHCC, integrating spatiotemporal differentiation analysis with an investigation of key driving factors. This framework enables a nuanced understanding of how digital and energy systems interact across space and time, providing a theoretical basis for analyzing cross-sectoral coordination processes. By applying this framework to the case of China, the study contributes to the empirical literature on digital–energy integration in large developing economies and offers a transferable reference for other countries—particularly those undergoing simultaneous digitalization and energy transformation—to guide their coordinated development efforts.
5.3. Practical Implications
First, the persistent mismatch between AI and HED highlights the need for integrated planning frameworks that jointly guide digital infrastructure expansion and energy system transformation. Policymakers should avoid treating AI and HED as separate agendas. Instead, they should design coordinated policy packages that align AI deployment with HED, while tailoring policy measures to regional development conditions and policy priorities. For instance, in provinces where AI is advancing faster than HED—such as Anhui and Hubei—regulatory incentives could prioritize the integration of AI-enabled energy management systems, smart grid retrofitting, and clean power scheduling. In contrast, in regions like Shaanxi and Shanxi with high HED but weak AI capacity, investments should target AI-related talent cultivation, data-sharing platforms, and adaptive algorithms tailored to local energy assets. Central government guidance should also encourage pilot zones for digital–energy synergy, offering replicable models for other provinces.
Second, the observed spatial divergence and growing spatial autocorrelation of AHCC call for enhanced regional coordination mechanisms and interprovincial spillover channels. In eastern High–High clusters such as Jiangsu and Zhejiang, cross-regional demonstration projects could diffuse effective AHCC practices by establishing joint ventures between tech firms and energy utilities, building open platforms for collaborative innovation, and developing interprovincial energy data exchange standards. In northwestern Low–Low clusters like Xinjiang and Qinghai, targeted support should focus on enabling infrastructure and institutional conditions by establishing interregional digital control centers for real-time energy coordination, subsidizing joint investments in AI and renewables, and optimizing interprovincial grid connectivity for clean power transmission. Linking fiscal transfers to AHCC performance can help reduce coordination gaps and foster positive spillovers.
Third, the heterogeneous effects of driving factors underscore the need for adaptive and context-sensitive policies. In regions where TI yields strong marginal returns, especially in the northwest, governments should prioritize AI R&D on energy dispatch, forecasting, and efficiency optimization. In provinces with diminishing EDL effects (e.g., Shanghai or Jiangsu), efforts should shift toward institutional innovation, flexible regulation, and green-digital business model incubation. Regions benefiting from ISU, notably in the southwest, should further incentivize digital–industrial upgrading aligned with clean energy transition, especially in advanced manufacturing, green logistics, and smart services. In provinces where ER and GI remain constraining (e.g., Jiangxi or Guangxi), policy should shift from command-and-control to market-compatible frameworks, including emissions trading, performance-based subsidies, and regulatory sandboxes for digital–energy pilots. Similarly, the adverse impacts of UL in the southwest call for smart urban planning to jointly deploy AI and renewable infrastructure.
5.4. Limitations and Future Research
This study has several limitations that could be explored in future research. First, this study is based on provincial-level data, which provides macro-level insights but may not capture intra-provincial heterogeneity. Future research could incorporate city- or enterprise-level data to reveal more detailed patterns of AHCC. Second, although the CCD model effectively evaluates the coordinated development of AI and HED, it cannot establish causal relationships between the two systems. Future research could employ causal inference methods to validate the underlying mechanisms. Third, the indicator system was developed based on the existing literature and data availability and may not fully capture all dimensions of AI and HED. Future research could refine the indicator system as more comprehensive data become available. Fourth, institutional and other qualitative factors were not explicitly incorporated into the analysis due to data limitations. Future research could integrate these factors and extend the analysis to cross-country comparisons.
Author Contributions
Conceptualization, M.Y.; Data curation, W.Z.; Formal analysis, M.Y.; Funding acquisition, M.Y.; Methodology, W.Z.; Project administration, G.C.; Software, W.Z.; Supervision, G.C.; Validation, M.Y.; Visualization, W.Z.; Writing—original draft, M.Y.; Writing—review and editing, G.C. All authors have read and agreed to the published version of the manuscript.
Funding
This work was supported by the National Natural Science Foundation of China (No. 72304278) and the Development Plan of Innovation Team in Colleges and Universities of Shandong Province (No. 2023RW016).
Institutional Review Board Statement
Not applicable.
Informed Consent Statement
Not applicable.
Data Availability Statement
The data presented in this study are available on request from the corresponding author.
Conflicts of Interest
The authors declare that they have no known competing financial interests or personal relationships that could have appeared to influence the work reported in this paper.
References
- Al-Maadid, A.; Ali, M.S.B.; Mohammed, K.S. Driving the Energy Transition in the GCC: The Role of Artificial Intelligence, Technology and Energy Prices. Energy Strategy Rev. 2026, 63, 102029. [Google Scholar] [CrossRef] [Scilit]
- Shi, J.; Mei, J.; Zhu, L.; Wang, Y. Estimating the innovation efficiency of the artificial intelligence industry in China based on the three-stage DEA model. IEEE Trans. Eng. Manag. 2024, 71, 9217–9228. [Google Scholar] [CrossRef] [Scilit]
- Wang, B.; Zhao, J.; Dong, K.; Jiang, Q. High-quality energy development in China: Comprehensive assessment and its impact on CO2 emissions. Energy Econ. 2022, 110, 106027. [Google Scholar] [CrossRef] [Scilit]
- Wang, B.; Wang, J.; Dong, K.; Nepal, R. How does artificial intelligence affect high-quality energy development? Achieving a clean energy transition society. Energy Policy 2024, 186, 114010. [Google Scholar] [CrossRef] [Scilit]
- Anis, G.; Naz, N.S.; Ghazal, T.M.; Farooq, M.S.; Saleem, M.; Yeun, C.Y.; Ahmad, M.; Adnan, K.M. Smart and Transparent Grid Stability Prediction for Efficient Energy Management Using Explainable AI. Energy Strategy Rev. 2026, 64, 102083. [Google Scholar] [CrossRef] [Scilit]
- Wang, S.; Wang, A.; Liu, S.; Zhang, C.; Qiao, L.; Li, X. Research on the coupling coordination relationship between the digital economy and high-quality energy development: Evidence from China. Heliyon 2024, 10, e24637. [Google Scholar] [CrossRef] [Scilit] [PubMed]
- International Energy Agency Energy and AI. Available online: https://www.iea.org/reports/energy-and-ai (accessed on 16 July 2025).
- Rizzo, S.A. To be Artificial Intelligence for sustainability or not to be sustainable Artificial Intelligence. Renew. Sustain. Energy Rev. 2025, 223, 116063. [Google Scholar] [CrossRef] [Scilit]
- Wang, Q.; Li, Y.; Li, R. Integrating artificial intelligence in energy transition: A comprehensive review. Energy Strategy Rev. 2025, 57, 101600. [Google Scholar] [CrossRef] [Scilit]
- Stern, N.; Romani, M.; Pierfederici, R.; Braun, M.; Barraclough, D.; Lingeswaran, S.; Weirich-Benet, E.; Niemann, N. Green and intelligent: The role of AI in the climate transition. npj Clim. Action 2025, 4, 56. [Google Scholar] [CrossRef] [Scilit]
- Skare, M.; Gavurova, B.; Sinkovic, D. Measuring Artificial Intelligence’s Impact on Sustainable Energy Transition: Empirical Insights and Policy Implications. Energy Econ. 2025, 150, 108825. [Google Scholar] [CrossRef] [Scilit]
- Ejiyi, C.J.; Cai, D.; Thomas, D.; Obiora, S.; Osei-Mensah, E.; Acen, C.; Eze, F.O.; Sam, F.; Zhang, Q.; Bamisile, O.O. Comprehensive review of artificial intelligence applications in renewable energy systems: Current implementations and emerging trends. J. Big Data 2025, 12, 169. [Google Scholar] [CrossRef] [Scilit]
- Javed, H.; Eid, F.; El-Sappagh, S.; Abuhmed, T. Sustainable energy management in the AI era: A comprehensive analysis of ML and DL approaches. Computing 2025, 107, 132. [Google Scholar] [CrossRef] [Scilit]
- Destek, G.; Aydın, S.; Okumuş, N.; Destek, M.A. The Role of Artificial Intelligence in Sustainable Transportation and Manufacturing: Empirical Findings From Southeast Asian Countries. Bus. Strategy Environ. 2026, 35, 167–178. [Google Scholar] [CrossRef] [Scilit]
- Tabassum, F.; Azim, M.I.; Islam, M.R.; Rahman, M.A.; Ali, L.; Rahman, M.M.; Hossain, M.J. Energy Data Security and Pricing Model in Local Energy Markets Using Artificial Intelligence. Appl. Energy 2025, 401, 126737. [Google Scholar] [CrossRef] [Scilit]
- Delina, L.L.; Tung, Y.S.M. Towards a just AI-assisted energy transitions for vulnerable communities. Energy Res. Soc. Sci. 2024, 118, 103752. [Google Scholar] [CrossRef] [Scilit]
- Hankendi, C.; Coskun, A.K.; Sovacool, B.K. Beyond the Carbon Emissions of Artificial Intelligence (AI): A Whole-Systems Energy and Environmental Sustainability Analysis of Datacenters in Denmark, Germany and Norway. Energy Res. Soc. Sci. 2026, 138, 104839. [Google Scholar] [CrossRef] [Scilit]
- Slimani, S.; Omri, A.; Ben Jabeur, S. When and how does artificial intelligence impact environmental performance? Energy Econ. 2025, 148, 108643. [Google Scholar] [CrossRef] [Scilit]
- Dadjiogou, K.Z.; Ajavon, A.S.A.; Bokovi, Y. Enhancing energy access in rural areas: Intelligent microgrid management for universal telecommunications and electricity. Clean. Energy Syst. 2024, 9, 100136. [Google Scholar] [CrossRef] [Scilit]
- Wang, X.; Wang, H.; Bhandari, B.; Cheng, L. AI-empowered methods for smart energy consumption: A review of load forecasting, anomaly detection and demand response. Int. J. Precis. Eng. Manuf.-Green Tech. 2024, 11, 963–993. [Google Scholar] [CrossRef] [Scilit]
- Kolb, S.; Dillig, M.; Plankenbühler, T.; Karl, J. The impact of renewables on electricity prices in Germany—An update for the years 2014–2018. Renew. Sustain. Energy Rev. 2020, 134, 110307. [Google Scholar] [CrossRef] [Scilit]
- Wang, Z.; Xi, Y.; Li, L.; Lei, Y.; Wu, S.; Cui, Y.; Chen, J. The spatial-temporal characterization of the driving factors of China’s energy transition and prediction of future transition potential. Renew. Energy 2025, 249, 123234. [Google Scholar] [CrossRef] [Scilit]
- Feng, C.; Ye, X.; Li, J.; Yang, J. How does artificial intelligence affect the transformation of China’s green economic growth? An analysis from internal-structure perspective. J. Environ. Manag. 2024, 351, 119923. [Google Scholar] [CrossRef] [Scilit] [PubMed]
- Ding, T.; Li, J.; Shi, X.; Li, X.; Chen, Y. Is artificial intelligence associated with carbon emissions reduction? Case of China. Resour. Policy 2023, 85, 103892. [Google Scholar] [CrossRef] [Scilit]
- Dang, N.; Wang, Q.; Zhou, K.; Zhou, T. Coordinated transition of the supply and demand sides of China’s energy system. Renew. Sustain. Energy Rev. 2024, 203, 114744. [Google Scholar] [CrossRef] [Scilit]
- Wang, J.; Wang, B.; Dong, K.; Dong, X. How does the digital economy improve high-quality energy development? The case of China. Technol. Forecast. Soc. Change 2022, 184, 121960. [Google Scholar] [CrossRef] [Scilit]
- Li, M.; Han, C.; Meng, L.; Liu, P.; Shao, Z. Spatiotemporal dynamics and driving factors of the coupling coordination between solar photovoltaic efficiency and installed capacity in China (2015–2023). Renew. Energy 2025, 247, 122991. [Google Scholar] [CrossRef] [Scilit]
- Sheng, Z.; Liu, Y.; Wang, X.; Chiu, A.S.F. The impact of charging infrastructure on coupling coordination of urbanization and ecological environment: Evidence from China. Technol. Forecast. Soc. Change 2024, 199, 122992. [Google Scholar] [CrossRef] [Scilit]
- Li, M.; Han, C.; Meng, L.; Liu, P. Spatiotemporal dynamics and factors of renewable energy mismatch in China. Renew. Sustain. Energy Rev. 2025, 212, 115424. [Google Scholar] [CrossRef] [Scilit]
- Liu, Y.; Zhu, X.; Wang, Y. Revisiting and evaluation of the index of sustainable economic welfare based on artificial intelligence: Data from 30 Chinese provinces from 2003 to 2019. Environ. Dev. Sustain. 2023, 25, 3123–3152. [Google Scholar] [CrossRef] [Scilit]
- National Bureau of Statistics. Classification of Strategic Emerging Industries. Available online: https://www.gov.cn/zhengce/zhengceku/2018-12/31/content_5433037.htm (accessed on 28 July 2025).
- The State Council of the People’s Republic of China. White Paper on China’s Energy Development in the New Era. Available online: https://www.gov.cn/zhengce/2020-12/21/content_5571916.htm (accessed on 28 July 2025).
- Huang, Z.; Li, X.; Chen, J.; Zhang, D. Does the Three-Year Action Plan for Winning the Blue Sky Defense Battle implementation enabling the high-quality development of regional energy? A quasi-natural experiment from China. Energy 2024, 312, 133405. [Google Scholar] [CrossRef] [Scilit]
- Xu, J.; Wang, J.; Li, R.; Gu, M. Is green finance fostering high-quality energy development in China? A spatial spillover perspective. Energy Strategy Rev. 2023, 50, 101201. [Google Scholar] [CrossRef] [Scilit]
- Wang, Q.; Zhang, F.; Li, R. Artificial intelligence and sustainable development during urbanization: Perspectives on AI R&D innovation, AI infrastructure, and AI market advantage. Sustain. Dev. 2025, 33, 1136–1156. [Google Scholar] [CrossRef] [Scilit]
- Lee, C.-C.; Yan, J. Will artificial intelligence make energy cleaner? Evidence of nonlinearity. Appl. Energy 2024, 363, 123081. [Google Scholar] [CrossRef] [Scilit]
- Lin, B.; Xu, C. Enhancing energy-environmental performance through industrial intelligence: Insights from Chinese prefectural-level cities. Appl. Energy 2024, 365, 123245. [Google Scholar] [CrossRef] [Scilit]
- Li, L.; Zhao, J.; Yang, Y.; Ma, D. Artificial intelligence and green development well-being: Effects and mechanisms in China. Energy Econ. 2025, 141, 108094. [Google Scholar] [CrossRef] [Scilit]
- Lee, C.-C.; Li, J.; Wang, F. The role of green finance in the construction of new energy system: Evidence from China. Energy Econ. 2024, 139, 107878. [Google Scholar] [CrossRef] [Scilit]
- Li, K.; Lin, B. Impact of energy technology patents in China: Evidence from a panel cointegration and error correction model. Energy Policy 2016, 89, 214–223. [Google Scholar] [CrossRef] [Scilit]
- Wang, B.; Dong, K.; Zhong, W.; Zhao, C. Can high-quality energy development and energy security achieve a win-win situation? The case of China. Econ. Anal. Policy 2024, 83, 17–28. [Google Scholar] [CrossRef] [Scilit]
- Zournatzidou, G.; Staikouras, C.; Ragazou, K.; Zopounidis, C.; Sariannidis, N. Unlocking the Threshold Effects of ESG Performance towards Policy Energy Efficiency of the European Energy Sector: A Hybrid Multi-Criteria Decision-Making Approach Based on Weight-Entropy TOPSIS. Energy Econ. 2025, 151, 108915. [Google Scholar] [CrossRef] [Scilit]
- Lin, T.; Zhang, L.; Li, J. Coupling and coordinated development of green finance and renewable energy industry in China: Spatiotemporal differentiation and driving factors. Renew. Energy 2024, 235, 121255. [Google Scholar] [CrossRef] [Scilit]
- Tobler, W.R. A Computer Movie Simulating Urban Growth in the Detroit Region. Econ. Geogr. 1970, 46, 234–240. [Google Scholar] [CrossRef] [Scilit] [PubMed]
- Xu, J.; Lv, T.; Hou, X.; Deng, X.; Li, N.; Liu, F. Spatiotemporal characteristics and influencing factors of renewable energy production in China: A spatial econometric analysis. Energy Econ. 2022, 116, 106399. [Google Scholar] [CrossRef] [Scilit]
- Liu, G.; Xu, W.; Nguyen, Q.M. Can the energy transition drive economic development? Empirical analysis of China’s provincial panel data. Technol. Forecast. Soc. Change 2024, 206, 123541. [Google Scholar] [CrossRef] [Scilit]
- The State Council of the People’s Republic of China. Energy Development Strategy Action Plan. Available online: https://www.gov.cn/gongbao/content/2014/content_2781468.htm (accessed on 31 July 2025).
- The State Council of the People’s Republic of China. New Generation Artificial Intelligence Development Plan. Available online: https://www.gov.cn/zhengce/content/2017-07/20/content_5211996.htm (accessed on 31 July 2025).

Disclaimer/Publisher’s Note: The statements, opinions and data contained in all publications are solely those of the individual author(s) and contributor(s) and not of MDPI and/or the editor(s). MDPI and/or the editor(s) disclaim responsibility for any injury to people or property resulting from any ideas, methods, instructions or products referred to in the content. |
© 2026 by the authors. Licensee MDPI, Basel, Switzerland. This article is an open access article distributed under the terms and conditions of the Creative Commons Attribution (CC BY) license.