


Abstract
A large number of potential knowledge associations in scientific and technological innovation activities have not yet become explicit. How to identify potential valuable innovation opportunity clues from complex knowledge structures has therefore become an important issue in intelligence analysis research. This study takes the field of rice drought-tolerant breeding as an empirical case. Based on PMC full-text literature data, the LightRAG model was employed to extract innovation-related entities and their semantic relationships, including varieties, genes, proteins, phenotypes, and technological methods. A technology-data heterogeneous network for rice drought-tolerant breeding was then constructed, and the HetGNN link prediction method was introduced to predict potential relationships within the network. To evaluate the effectiveness of the proposed model, literature published from 2006 to 2020 was used to construct the training network, while newly emerging relationships extracted from literature published between 2021 and 2023 were used as a future validation set. Adamic-Adar and Node2Vec were further selected as baseline models for comparison. The experimental results show that the proposed method achieved an AUC of 0.8901, an AP of 0.9190, and an F1@0.5 of 0.8322 on the internal testing set, outperforming the baseline models in overall performance. In the temporal holdout validation, the model was able to identify some newly emerging knowledge associations that subsequently appeared in the 2021–2023 literature. The prediction results based on the full dataset indicate that the potential relationships are mainly concentrated in influence relationships between data elements and drought-tolerant phenotypes, as well as support relationships between technological methods and drought-tolerant phenotype research. This study constructs an analytical framework consisting of “innovation element extraction, heterogeneous network modeling, temporal holdout validation, and potential relationship interpretation,” thereby providing a methodological reference for identifying potential innovation opportunity clues from complex scientific knowledge structures.
1. Introduction
The identification of innovation opportunities has long been a central issue in the fields of information resource management, science and technology intelligence studies, and innovation management. Its essence lies in the systematic analysis of technological information and its knowledge elements to uncover research directions, technological pathways, or knowledge combinations that have not yet received sufficient attention but possess potential innovative value [1]. Innovation theory generally holds that innovation does not emerge in a linear manner; rather, it arises from the recombination and reconfiguration of knowledge elements within continuously evolving environments [2]. From the perspective of information science, the formation and discovery of innovation opportunities are highly dependent on information acquisition, analysis, and cognition. Innovation opportunities do not naturally spontaneously; instead, they are gradually identified and confirmed through analytical judgment as information accumulates, interacts, and recombines over time [3,4]. In the context of scientific and technological activities characterized by both increasing specialization and interdisciplinary integration, the scale of scientific information continues to expand, and its structure has become more complex. Meanwhile, the knowledge elements involved in innovation activities are becoming more diverse, and their interrelationships become increasingly intertwined. Under such circumstances, traditional approaches to identifying innovation opportunities, which often rely on experiential judgment or a single analytical perspective, are no longer sufficient to effectively address the complexity of modern innovation environments, thereby creating an urgent need for more systematic and forward-looking analytical methods.
Research on innovation opportunity identification has developed relatively systematic explorations at multiple levels, including scientific innovation, technological innovation, and product innovation. In the domain of scientific innovation, studies often adopt the perspective of interdisciplinary knowledge transfer and recombination, identifying potential academic innovation opportunities through approaches such as “problem-method” knowledge element combinations, cross-disciplinary combinations of outlier topic terms, and the generation of new knowledge representations driven by generative models [5,6]. In the fields of technological and product innovation, related research mainly relies on patents, user demands, and multi-source textual data, and employs methods such as SAO (Subject–Action–Object) semantic analysis, multidimensional technological innovation mapping, and evolutionary analysis of technological combinations to identify and characterize the structural features and evolutionary pathways of innovation opportunities [7,8]. Although these studies have made progress in methodological diversification and the expansion of application scenarios, they largely focus on mining explicit relationships among existing knowledge elements. As a result, their identification results rely heavily on co-occurrence relationships, semantic similarity, or predefined rules, while relatively limited attention has been paid to potential associations that have not yet formed explicit connections but may contain latent innovative value.
At the same time, complex network analysis has gradually been introduced into research on scientific knowledge and technological innovation [9]. In this approach, literature, technological elements, and research activities are abstracted as network systems composed of nodes and relationships, enabling the representation of knowledge structures and their evolutionary processes. On this basis, link prediction methods have been proposed to infer potential connections that have not yet appeared in the network but show a high likelihood of emerging. The core idea of link prediction is to use network structural characteristics and node similarity to predict associations that may form in the future [10]. Related studies have shown that, when applied to contexts such as citation networks, knowledge networks, and technological networks, link prediction methods can move beyond reliance on explicit relationships, effectively identifying latent associations and reveal network evolution trends. However, real-world innovation systems often involve multiple types of knowledge elements and diverse relationships. Networks composed of a single type of node or relation are therefore insufficient to fully represent the complex interactions among different elements. To address this limitation, heterogeneous information network analysis has been developed to model different types of nodes and relationships within a unified framework and thereby providing a more flexible analytical structure for mining potential relationships in complex systems [11]. In recent years, methods such as representation learning and graph neural networks have further enhanced the ability to jointly characterize network structures and node attributes, providing a methodological foundation for link prediction in complex knowledge networks [12].
From the perspective of information science research, link prediction methods are conceptually aligned with innovation opportunity identification, as both focus on relationships that have not yet explicitly emerged but may exert a significant influence on future innovation. However, a review of existing studies reveals that, although the methodological framework for innovation opportunity identification has continued to expand, the systematic incorporation of link prediction and heterogeneous network analysis remains relatively limited in this field. As a result, a stable application paradigm oriented toward science and technology intelligence analysis has not yet been fully established, and the methodological value and applicability of these approaches for innovation opportunity identification still require further systematic examination.
Building on the above background, this paper introduces heterogeneous information networks and link prediction methods from the perspective of intelligence research to explore their application value in innovation opportunity identification. The study takes multiple types of knowledge elements involved in innovation activities as the analysis object, builds a heterogeneous knowledge network model, and uses link prediction methods to identify potential correlations that have not yet formed explicit connections in the network, and regards the predicted high-probability potential connections as possible clues of innovation opportunities. From the perspective of network structure and the evolution of latent relationships, this study aims to provide a new analytical approach for identifying innovation opportunities, enrich the methodological framework of science and technology intelligence analysis, and offer references for related research and practical applications.
2. Theoretical Foundations of Innovation Opportunity Identification and Link Prediction
2.1. Network-Based Research Foundations of Innovation Opportunity Identification
Existing studies indicate that earlier research on innovation opportunities primarily regarded enterprises as the main actors of innovation and analyzed factors influencing innovation performance from perspectives such as knowledge management, organizational structure, and the market environment. In recent years, the research perspective has gradually shifted toward the identification and discovery of potential innovation outcomes, with the identification of innovation opportunities based on scientific literature emerging as an important research direction.
From a methodological perspective, existing research on innovation opportunity identification has mainly developed three methodological pathways (Table 1). The first category comprises feature-based approaches for discovering innovation opportunities. These methods employ techniques such as bibliometrics, text mining, and network analysis to extract features from scientific publications or research topics (including novelty, burstiness, high impact, and interdisciplinarity) in order to evaluate their innovation potential [13,14]. Among these features, bibliometric indicators such as the number of publications, citation counts, number of authors, and funding support are widely used to identify research outputs with potential breakthrough significance [15]. Network analysis methods further utilize the structural characteristics and dynamic changes of co-word and citation networks to trace the evolution of research topics, identifying potential research frontiers through indicators such as burst terms and centrality measures [16]. However, such approaches typically become effective only when a research field has entered the development or maturity stage, and therefore exhibit limited capability for the early identification of innovation opportunities.
The second category comprises knowledge-association-based approaches for discovering innovation opportunities. Related studies suggest that innovation often arises from latent connections among different disciplines or knowledge units, and identifying such connections is key to uncovering innovation opportunities [17]. Literature-Based Discovery (LBD) methods explore implicit relationships among documents from different domains, providing an important approach for promoting interdisciplinary integration and innovation [18]. In practical implementations, some studies construct knowledge association networks based on keyword co-occurrence or citation relationships to identify cross-disciplinary knowledge combinations [19,20]. Meanwhile, other scholars have explored potential links between objects and methods, as well as between problems and technologies, from perspectives such as semantic association, causal relationships, and problem orientation, in order to discover more forward-looking innovation opportunities [21,22]. However, analyses based on co-occurrence or citation relationships still primarily rely on already established connections and are therefore influenced by factors such as the Matthew effect (i.e., well-established and highly cited topics tend to attract disproportionately more attention) and citation latency.
The third category comprises cross-integration-based approaches for discovering innovation opportunities, which emphasize the important roles of interdisciplinary collaboration, technological convergence, and problem-driven research in innovation. Related studies reveal potential opportunities for breakthrough innovation by measuring the degree of interdisciplinarity, predicting trends in technological convergence, or identifying potential cross-disciplinary collaboration combinations [23,24]. In this process, research objects and their relationships are gradually abstracted into network structures, and innovation opportunities are understood as potential combinations of associations within the network that have not yet explicitly emerged but have a high likelihood of formation.
Table 1.
Major methods for innovation opportunity identification.
2.2. Basic Concepts and Research Contexts of Link Prediction
Link prediction is an important concept in network science. In 2000, Ramesh R. Sarukkai applied a Markov chain approach to describe hyperlink information on the World Wide Web, marking the beginning of research on link prediction [25]. In 2003, David Liben-Nowell and Jon Kleinberg conducted one of the earliest studies on link prediction in social networks and carried out empirical analysis. Their experiments demonstrated that information about future interactions could be inferred solely from the topological structure of the network [26]. Since then, link prediction has attracted widespread attention.
Typical tasks of link prediction include new link prediction, missing link recovery, relationship type prediction, and network evolution analysis. At present, these methods are mainly applied in fields such as social networks, recommender systems, and scientific research. In the context of innovation opportunity identification, link prediction methods can support a variety of analytical tasks. Examples include: (1) predicting potential future collaborations among researchers based on scientific collaboration networks; (2) identifying emerging research hotspots through citation networks, and thereby help researchers keep track of the latest research directions in a timely manner; (3) discovering potential technological development trends and innovation opportunities by analyzing patent citation networks and technological association data [27].
Early research on link prediction primarily focused on homogeneous networks. At this stage, researchers developed various methods for predicting potential links in such networks, including similarity-based approaches, probability- and likelihood-based methods, and dimensionality reduction techniques. As research progressed, link prediction methods continued to evolve, and their application scope gradually expanded to more complex heterogeneous networks. Heterogeneous networks contain multiple types of nodes and edges. Therefore, link prediction in heterogeneous networks requires consideration of the characteristics and interactions among different types of nodes and relationships. To address the complexity, researchers have generally adopted two main approaches. One approach involves improving traditional link prediction methods originally designed for homogeneous networks. The other approach develops new methods specifically tailored to the characteristics of heterogeneous networks. For example, meta-path-based similarity measures capture associations between different types of nodes through predefined path types [28]. In addition, methods based on graph convolutional networks and graph attention networks map networks into low-dimensional vector spaces, facilitating the computation and analysis of relationships among nodes [29]. By effectively utilizing the diverse information contained in heterogeneous networks, these approaches significantly improve the accuracy of link prediction.
At present, link prediction methods for heterogeneous networks can generally be categorized into three main types (Table 2): (1) path-preserving proximity-based methods, (2) relation-based methods, and (3) message-passing and neural network-based methods.
Table 2.
Link prediction methods for heterogeneous networks.
From the perspective of research objectives, link prediction and innovation opportunity identification are highly conceptually consistent. Innovation opportunity identification focuses on uncovering research directions or knowledge associations within innovation systems that have not yet become explicit but possess potential value. Similarly, link prediction aims to infer potential links that have not yet formed in a network by mining its structural information. In the context of innovation research, such potential links can be interpreted as latent innovation opportunities among different research objects, technological methods, or knowledge units that have not yet been systematically explored. Therefore, modeling the entities involved in innovation activities and their relationships as a network structure, and introducing link prediction methods to infer potential associations within the network, provides a structured and quantifiable analytical approach for identifying innovation opportunities. This perspective not only expands the application scenarios of link prediction methods but also establishes a theoretical foundation for the forward-looking identification of innovation opportunities.
3. Framework for Innovation Opportunity Identification Based on Heterogeneous Networks
To present the overall research approach of the proposed innovation opportunity identification method, this study constructs a framework based on link prediction in heterogeneous networks (Figure 1). Innovation-related multi-source data collection and curation, relation extraction and structuralization, heterogeneous network construction, link prediction modeling, and interpretation and validation of innovation opportunities. Through entity and relation extraction, unstructured innovation knowledge is transformed into structured innovation elements and organized into a technology–data heterogeneous network. Based on this network, link prediction methods are employed to identify potential associations that have not yet explicitly appeared in the existing knowledge structure. The predicted relationships are subsequently interpreted and validated through science and technology intelligence analysis, thereby supporting the systematic identification of potential innovation opportunities.
Figure 1.
Framework of the innovation opportunity identification method based on heterogeneous network link prediction.
3.1. Semantic Identification and Relation Extraction of Innovation Element Entities
Innovation elements refer to the key factors that drive the innovation process and constitute the foundation for the successful implementation of innovation activities [38]. From the perspective of the entire innovation process, innovation elements include not only environmental factors, such as policies and institutional arrangements, but also input factors such as talents, capital, technologies, and data. This study focuses on factors that influence technological innovation within the scientific research process. Therefore, the analysis concentrates on technological elements and data elements of innovation (scientific data elements) (Figure 2).
Figure 2.
Composition of innovation elements.
In our previous research, we proposed a conceptual model of innovation element entity relationships oriented toward the scientific experimental process [39]. The model was designed to support the representation and interpretation of innovation processes in scientific research from the perspective of interactions between scientific data and technological methods. The conceptual model includes two categories of innovation elements, namely scientific data elements and technological innovation elements. It further defines five types of innovation element entities: experimental materials, experimental environments, experimental objectives, wet-lab techniques, and dry-lab techniques. In addition, eight types of relationships among innovation element entities are defined, including Composition, Transcription_or_Translation, Regulation_Of_Rxpression, Interaction, Tissue_Development, Influence, Technical_Cooperation, and Technical_Support. Building on this previous work, the present study adopts the conceptual model as the theoretical framework for identifying and structurally representing innovation elements. Based on this framework, relevant entities and their relationships in scientific literature are systematically analyzed through semantic parsing and standardized annotation, thereby transforming innovation elements from unstructured textual information into structured data.
Retrieval-Augmented Generation (RAG) is an artificial intelligence approach that integrates information retrieval techniques with language generation models. Its workflow generally consists of three key steps: retrieval, augmentation, and generation. First, information relevant to a given query is retrieved from a pre-established knowledge base, providing contextual information and a knowledge foundation for the subsequent generation process. Second, the retrieved information is incorporated into the generation model as contextual input, enhancing the model’s ability to understand and respond to specific questions. Finally, the large language model (LLM) generates output text by integrating the retrieved information, while the external knowledge base helps reduce issues such as hallucinations (incorrect responses) and strengthens the model’s capability to handle knowledge-intensive tasks. In graph-enhanced entity and relation extraction, LightRAG improves retrieval efficiency by segmenting documents into smaller, more manageable units, allowing relevant information to be quickly identified and accessed without analyzing the entire document. It employs large language models to identify and extract various entities (such as names, dates, locations, and events) and their relationships, thereby constructing a knowledge graph. During the entity and relation extraction process, the large language model identifies entities (nodes) and their relationships (edges) within the text and subsequently generates corresponding key-value pairs. For graph deduplication, LightRAG can identify and merge identical entities and relationships appearing in different segments of the original text. This process not only reduces the size of the graph but also lowers computational complexity, thereby improving data processing efficiency [40]. The architecture of the LightRAG model mainly consists of two components (Figure 3). The first is the graph indexing stage, in which a large language model extracts entities and relationships from each text segment. The second is the graph retrieval stage, in which relevant keywords are first generated by the large language model, following a process similar to that used in current RAG systems. Considering factors such as the scale of domain-specific data, computational resources, and data consistency, this study adopts the LightRAG model to perform semantic identification and relation extraction of innovation element entities.
Figure 3.
Architecture diagram of LightRAG model.
3.2. Network-Based Representation of Innovation Elements
To systematically characterize multiple types of innovation elements and their complex relationships, network-based representation provides an effective approach. Compared with traditional linear or single-dimensional analytical methods, network models can simultaneously represent innovation elements and their interrelationships within a unified framework, thereby facilitating the analysis of the operational characteristics of innovation systems from an overall structural perspective [41]. A multilayer heterogeneous network consists of different types of nodes interconnected by different types of edges, enabling the exploration of complex multilayer entities and relationships. Building on the aforementioned research, this study employs a multilayer heterogeneous network to represent the innovation system, as well as to illustrate the complex associations between scientific data elements and technological innovation elements during the scientific experimental process. Specifically, the constructed network includes a scientific data element subnetwork, a technological innovation element subnetwork, and a technology-data heterogeneous network.
From a symbolic representation perspective, the network is a complex system composed of multiple types of nodes and edges, which can be represented as:
Here, denotes the scientific data element subnetwork, denotes the technological innovation element subnetwork, and represents the multilayer heterogeneous network that connects the technological innovation element subnetwork to the scientific data element subnetwork.
Each layer of the network can be abstracted as a quadruple structure:
Here, denotes the set of nodes in the -th layer, containing all nodes within that layer; denotes the set of edges in the -th layer, including all edges within the layer; represents the set of node types; and denotes the weights of the edges.
From the perspectives of network structure and relational characteristics, the nodes in this network correspond to five types of innovation element entities, and node labels represent the entity types of innovation elements, which are used to indicate the attributes and functions of the nodes. The scientific data element subnetwork contains three types of nodes and corresponding labels, while the technological innovation element subnetwork contains two types of nodes and labels. Within the heterogeneous network, nodes are connected by either homogeneous or heterogeneous edges. Homogeneous edges connect nodes with the same labels, whereas heterogeneous edges connect nodes with different labels. In the multilayer heterogeneous network constructed in this study for the scientific experimental process, four types of homogeneous edges are defined, with edge labels including Composition, Translation, Expression, and same-type technical cooperation. In addition, five types of heterogeneous edges are defined, with edge labels including Interaction, Regulation, Influence, cross-type technical cooperation, and Technical_Support (Figure 4). Based on the definitions provided in the aforementioned conceptual model, the constructed multilayer heterogeneous network satisfies the following four conditions:
Figure 4.
Schematic diagram of multi-layer heterogeneous network of innovation element entities.
- (1)
- Both nodes and edges are typed (labeled);
- (2)
- Bidirectional edges do not exist, i.e., ;
- (3)
- A unidirectional relationship exists from the technological innovation element subnetwork () to the scientific data element subnetwork (), denoted as ();
- (4)
- Self-loops are not allowed, meaning that no edge exists from a node to itself, i.e., (→), does not occur.
3.3. Innovation Opportunity Identification Based on Link Prediction
After completing the network-based representation of innovation elements, the key issue becomes how to identify potential associations that have not yet explicitly formed within a structure containing multiple types of nodes and relationships. In heterogeneous networks, the emergence of potential edges often corresponds to new combinations of elements or directions of cross-domain knowledge integration and therefore can be regarded as potential innovation opportunities. Compared with traditional link prediction methods based on structural similarity or single-layer networks, heterogeneous networks contain not only multiple types of nodes and relational semantics but also rich textual content information. Relying solely on topological structure is therefore insufficient to fully capture the complex associative characteristics among innovation elements. Consequently, it is necessary to introduce heterogeneous graph representation learning methods capable of integrating both node content information and structural neighborhood features. HetGNN is a representation learning approach designed for content-rich heterogeneous graphs [42], and it can be applied to various tasks such as link prediction, recommendation systems, and node classification. In this study, the HetGNN link prediction method based on a graph convolutional network (GCN) is adopted to identify potential innovation opportunities that may arise during the scientific experimental process. The specific procedure is as follows:
(1) Sampling heterogeneous neighboring nodes. For any node v, a Random Walk with Restart (RWR) strategy is employed, in which the walk returns to the starting node with probability (p), and the process is iterated until a fixed number of neighboring nodes is sampled. The generated sequence is denoted as RW R (v), ensuring that neighbors of all types are included.
(2) Encoding heterogeneous content information. Different types of content embeddings are pretrained in advance. For example, textual information is represented using Paragraph Vector (Par2Vec), while image information is encoded through feature extraction with a convolutional neural network (CNN). The content embedding representation of node v is computed as follows:
where denotes a fully connected neural network parameterized by (feature transformation function), represents the concatenation operation, and denotes the set of content features of node v.
(3) Aggregation of heterogeneous neighbor information, which includes the following steps:
① Aggregation of same-type neighbors. For neighbors of the same type t, the set of type-(t) neighbors sampled for node v is denoted as . A Bi-directional Long Short-Term Memory network (Bi-LSTM) is employed to aggregate their features, which can be computed as follows:
where denotes the (d)-dimensional vector obtained after aggregation, and represents the content embedding of the neighboring node v′.
② Aggregation of different-type neighbors. Since neighbors of different types contribute differently to the final node representation, an attention mechanism is employed to assign different weights to them. The final node embedding representation is computed as follows:
where represents the importance weight assigned to different embeddings, and denotes the set of all neighbor types.
The embedding set is defined as follows:
The final output embedding representation of node v is given as:
where denotes the parameter matrix of the attention mechanism.
(4) Definition of the objective function. The objective function is designed to maximize the probability of node v and its neighboring nodes, including both first-order and second-order neighbors:
where denotes the set of type-(t) neighbors of node v.
The neighbor probability is calculated as follows:
To optimize the objective function, negative sampling is introduced, and the objective can be approximated as follows:
where M denotes the number of negative samples (typically set to 1), and represents the Sigmoid activation function.
The final objective function is defined as follows:
4. Empirical Analysis
4.1. Data Sources and Preprocessing
This study takes the field of rice drought-tolerant breeding as the empirical research domain and selects full-text literature in NXML format from the PMC (PubMed Central) database as the data source. Rice drought-tolerance research involves multiple types of technological elements, including gene regulation, quantitative trait locus analysis, marker-assisted selection, genomic selection, and gene editing. The research process is characterized by multi-element coupling and cross-technology collaboration. Complex association structures are formed among different experimental materials, technological methods, and target traits, giving the field typical heterogeneous network characteristics. Therefore, it is well suited for constructing multi-type innovation element networks and conducting link prediction analysis. In addition, PMC provides open-access, high-quality full-text life science data, and the NXML format contains clearly structured tags, which facilitate entity recognition and relationship extraction. These features provide a reliable data foundation for the standardized representation of innovation-related elements and heterogeneous network modeling.
Drawing on related studies in the field of rice abiotic stress breeding [43], and under the guidance of domain experts, the following search query was used: TS = (((drought* or arid*) near/5 (resist* or toleran* or prevent* or anti) or anti-drought* or anti-arid*) and (rice or paddy or “oryza sativa”)). A total of 384 drought-related research articles published between 2006 and 2023 were retrieved in full text from the PMC database as the empirical analysis dataset.
Based on previous studies defining innovation-related entities and association relationships in the field of rice breeding, the LightRAG model was employed to identify and extract nine types of entities and eight types of association relationships from the 384 drought-tolerant breeding articles. In total, 11,176 innovation-related entities and 5588 association relationships were extracted (Table 3). These extracted data provided the foundation for the subsequent construction of a multi-layer heterogeneous network in the field of rice drought-tolerant breeding.
Table 3.
Extraction quantity of innovation element entities and relationships in drought-tolerant rice breeding.
To evaluate the reliability of the entity and relationship extraction results, this study further selected 50 articles related to rice drought-tolerance breeding from the dataset for manual annotation. The manually annotated results were used as the benchmark for assessing the performance of entity extraction and relationship extraction. The evaluation metrics included Precision, Recall, and F1-score. Entity extraction was evaluated in terms of the model’s ability to identify innovation-related entities, including varieties, genes, proteins, phenotypes, and technological methods. Relationship extraction was used to evaluate the model’s ability to identify semantic relationships, including influence relationships, technical support relationships, and technical collaboration relationships. To compare the performance of different extraction methods, BERT, BERT + Union, and BERT + Intersect were selected as baseline models. Model performance was evaluated from the perspectives of both entity extraction and relationship extraction (Table 4).
Table 4.
Performance of entity and relationship extraction.
The results indicate that the proposed extraction model achieved strong overall performance in both entity extraction and relationship extraction tasks. Specifically, the F1-score for entity extraction reached 86.53%, while the F1-score for relationship extraction reached 76.26%. Both scores were higher than those of the comparison models, including BERT, BERT + Union, and BERT + Intersect. These results demonstrate that the proposed model can effectively identify innovation-related entities and their semantic associations in the literature on rice drought-tolerance breeding.
More specifically, although BERT + Union achieved relatively high recall in relationship extraction, its precision was comparatively low, making it prone to introducing a large number of noisy relationships. In contrast, BERT + Intersect achieved relatively high precision in entity extraction but showed lower recall, which may lead to the omission of some valid entities and relationships. Compared with these methods, the proposed model achieved a better balance between precision and recall, thereby providing a relatively reliable data foundation for subsequent heterogeneous network construction and link prediction analysis.
In addition, some of the extraction results were manually reviewed and standardized. Variations in letter case, abbreviations, hyphen usage, and synonymous expressions were normalized. Entities that were prone to type confusion, such as commercial reagent brands, subspecies names, and general experimental tools, were corrected or removed based on contextual semantics and entity category definitions. This process helped reduce the influence of entity misclassification and relationship noise on network construction and link prediction results.
To address the requirement of prospective validation in the link prediction task, the dataset was further divided into temporal slices according to publication years in the subsequent experiments. Literature published from 2006 to 2020 was used to construct the training time window, while literature published from 2021 to 2023 was used to construct the testing time window. This design was intended to evaluate the model’s ability to retrospectively predict newly emerging knowledge associations in subsequent years. At the same time, all literature published from 2006 to 2023 was used to construct the complete heterogeneous network for the final identification and interpretation of potential innovation opportunities.
4.2. Construction and Analysis of the Heterogeneous Network
Based on the technological innovation entities, scientific data entities, and their association relationships extracted in Section 3.1, this study further constructed a technology-data heterogeneous network in the field of rice drought-tolerant breeding. In the network, nodes represent different types of innovation-related entities, while edges represent semantic association relationships among entities. To avoid network redundancy caused by repeated occurrences of the same entity across different articles or paragraphs, entity deduplication and normalization were first performed on the extracted results. Variations in letter case, abbreviations, and synonymous expressions were merged, while entity type and relationship type information was retained. On this basis, nine categories of innovation-related entities were defined as node types, and eight categories of association relationships were defined as edge types, thereby constructing a multilayer heterogeneous network composed of both scientific data elements and technological innovation elements.
In the visualization of complex entity association networks, commonly used software tools include Gephi, Ucinet, Pajek, Neo4j, Cytoscape, NodeXL, NetMiner, NWBTool, Arbor, NetworkX, and Visone [44], and each tool is suitable for different application scenarios. In selecting the network visualization tool, this study comprehensively considered factors including network scale, open-source availability, visualization modes for single-layer and multi-layer heterogeneous networks, and node and edge layout capabilities. Finally, Gephi was selected to visualize the rice drought-tolerant breeding technology-data heterogeneous network.
After merging identical nodes, the constructed rice drought-tolerant breeding technology-data heterogeneous network contained 4199 nodes and 5588 edges. The node labels corresponded to nine categories of innovation-related entities, while the edge labels corresponded to eight categories of association relationships. The network layout adopted the Isometric Layout algorithm to highlight the hierarchical structure and association relationships between technological innovation elements and scientific data elements. As shown in Figure 5a, the overall network exhibits a relatively clear dual-layer technology-data structure. The technological innovation element layer mainly consists of nodes related to genetic breeding technologies, molecular breeding technologies, and computer technologies, which represent experimental methods, molecular detection techniques, and data analysis tools in rice drought-tolerant breeding research. The scientific data element layer mainly consists of nodes related to varieties, genes, proteins, phenotypes, environmental factors, as well as tissues/cells and organs, which represent research objects, genetic resources, biological mechanisms, and target traits. These two layers are interconnected through “technical support” relationships, indicating that rice drought-tolerant breeding research is not driven by a single type of knowledge element. Instead, it reflects the collaborative associations between technological methods and scientific data elements.
Figure 5.
Overall structure of the rice drought-tolerant breeding technology-data heterogeneous network and phenotype association subgraph. (a) Overall structure of the rice drought-tolerant breeding technology-data heterogeneous network. (b) Key association subgraph of drought-tolerant and related stress phenotypes.
To further enhance the interpretability of the overall network graph, this study extracted a local association subgraph centered on drought tolerance and related stress phenotype nodes. As shown in Figure 5b, the subgraph includes not only stress phenotype or stress response nodes, such as drought tolerance, drought stress, salt stress, salt and drought stress, and salt tolerance, but also multiple categories of innovation-related elements associated with rice stress research. Gene or protein nodes such as OsHAK1, OsHKT1;3, OsSOS1, and OsNHX1, together with variety material nodes such as Pokkali, Nipponbare, TN1, and Bengal, reflect the dependence of drought tolerance and related stress phenotype research on genetic resources, functional genes, and physiological response mechanisms. Experimental technologies and data analysis tool nodes, including qRT-PCR, GWAS, transcriptome analysis, whole genome resequencing analysis, CRISPR/Cas9, SPSS software, and SAS software, further indicate that related studies require support from molecular detection, omics analysis, statistical modeling, and phenotype analysis methods. Figure 5b further illustrates the major distribution patterns of potential associations in the field of drought-tolerant breeding from the perspective of local network structure. One category involves influence relationships between data elements, such as genes, proteins, and varieties, and stress-related phenotypes. The other category involves support relationships between molecular breeding technologies, computer technologies, experimental analysis tools, and phenotype research. These structural characteristics provide the basis for defining candidate relationship types in subsequent link prediction tasks and for interpreting the prediction results from the perspective of science and technology intelligence analysis.
4.3. Retrospective Validation, Model Comparison, and Indicator Analysis
4.3.1. Retrospective Validation Experimental Design
To evaluate the effectiveness of the heterogeneous network link prediction model in identifying potential innovation opportunities, this study designed a temporal holdout validation experiment before conducting prediction on the full dataset. Temporal holdout validation uses knowledge relationships that appeared within an earlier time window as the training basis and then examines whether the potential relationships predicted by the model subsequently appear in later time windows. This design is more consistent with the core objective of innovation opportunity identification, namely, the early discovery of potential knowledge associations. Specifically, the training time window and validation time window were divided according to the publication years of the literature. Literature published from 2006 to 2020 was used to construct the training network, while literature published from 2021 to 2023 was used to construct the future validation network. During the model training, only entities and relationships appearing in the 2006–2020 literature were used for node representation learning and parameter training. During the prediction stage, node pairs that had not yet appeared in the training network but satisfied the candidate relationship type constraints were scored and ranked. During the validation stage, the potential edges predicted by the model were matched with newly emerging real edges extracted from the 2021–2023 literature to determine whether the model could identify knowledge associations that later appeared in subsequent studies.
From the perspective of validation logic, edges that already existed in the 2006–2020 training network were defined as “known relationships.” Edges that did not appear in the 2006–2020 training network but appeared in the 2021–2023 literature were defined as “future emerging relationships.” High-scoring candidate edges predicted by the model based on the training network were defined as “potential predicted relationships.” If a potential predicted relationship subsequently appeared in the 2021–2023 future validation network, the prediction was regarded as a successful hit in the retrospective validation. A strict five-tuple matching rule was adopted during the matching process. A prediction was considered a hit only when the source entity, relationship type, and target entity of the predicted edge were fully consistent with the <Source, Source_attribute, Relation_type, Target, Target_attribute> structure in the future validation network. Through this design, potential innovation opportunities were operationally defined as potential knowledge associations that had not explicitly appeared within the training time window, received high prediction scores from the model, and were subsequently supported by observed literature relationships in the later time window.
Based on the structural characteristics of the rice drought-tolerant breeding technology-data heterogeneous network, this study defined nine categories of candidate relationships around two types of potential innovation opportunities: “scientific data element-driven” opportunities and “technological innovation element-supported” opportunities. Scientific data element-driven relationships included <gene, influence, phenotype>, <protein, influence, phenotype>, and <variety, influence, phenotype>, which were used to characterize the potential influence of genes, proteins, and variety materials on target phenotypes. Technological innovation element-supported relationships included <traditional_technology, technical_cooperation, computer_technology>, <molecular_technology, technical_cooperation, computer_technology>, <traditional_technology, technical_cooperation, molecular_technology>, <computer_technology, technical_cooperation, molecular_technology>, <computer_technology, technical_support, phenotype>, and <molecular_technology, technical_support, phenotype>. These relationships were used to characterize cooperation among technological methods and the supporting role of technological methods in phenotype research.
The network constructed from the 2006–2020 training time window contained 2901 original edges. To reduce the interference of background nodes in model learning, edges directly related to environmental factor nodes were removed, leaving 2554 edges. After further filtering according to the nine categories of candidate relationships, 763 valid task-specific edges were obtained (Table 5). Among them, the data-driven relationships included 237 variety–phenotype relationships, 187 gene–phenotype relationships, and 37 protein–phenotype relationships. The technological support relationships included 181 computer_technology–molecular_technology technical cooperation relationships, 55 molecular_technology–phenotype technical support relationships, 43 computer_technology–phenotype technical support relationships, and several technical cooperation relationships between traditional_technology and other types of technologies. The model input contained 1155 nodes. Node features were constructed by concatenating 8-dimensional node type features with 128-dimensional TF-IDF textual features derived from node names, resulting in a final 136-dimensional node feature representation.
Table 5.
Distribution of samples across nine categories of candidate relationships within the training time window.
To enhance the reproducibility of the experiment, this study further summarizes the key settings related to model training, node feature construction, negative sampling strategy, edge weight processing, and evaluation metrics (Table 6).
Table 6.
Parameter settings for model training and link prediction experiments.
Among them, type-constrained negative sampling refers to a strategy in which the head entity type, relationship type, and tail entity type of negative samples are consistent with the predefined candidate relationship types, while the corresponding node pairs have no edges in the training network. This strategy avoids generating obviously unreasonable negative samples and ensures that positive and negative samples remain comparable in terms of entity types and relationship semantics.
4.3.2. Model Performance Evaluation and Retrospective Validation Results
Within the 2006–2020 training time window, this study further evaluated the basic generalization ability of the model through a training–testing split experiment. Specifically, the 763 valid task edges were divided into 610 training positive samples and 153 testing positive samples. An equal number of negative samples were constructed using the type-constrained negative sampling strategy. In this strategy, the head entity type, relationship type, and tail entity type of negative samples were required to remain consistent with the predefined candidate relationship types, while the corresponding entity pairs had no edges in the training network. As a result, the training set contained 610 positive and 610 negative samples, totaling 1220 samples, while the testing set contained 153 positive samples and 153 negative samples, totaling 306 samples.
To prevent the model from using testing positive edges during the graph convolution message propagation stage, these edges were removed when constructing the training graph, and only the network structure observable during the training stage was retained. The edge index size of the training graph was torch.Size ([2, 4802]), corresponding to the bidirectional edges used for message propagation. During model training, an edge weight-based sample weighting mechanism was introduced. The original positive edge weights ranged from 1 to 14, with an average value of 1.13. After normalization, the edge weights were mapped to the range of 1–3, enabling high-frequency or high-confidence relationships to contribute more strongly to model training. The training results show that the loss function decreased from 0.7008 at the initial stage to 0.2056 at epoch 119, indicating that the model gradually learned the structural association patterns among different types of nodes in the heterogeneous network.
To comprehensively evaluate model performance, this study adopted AUC, AP, Precision, Recall, F1-score, and Top-K ranking metrics. Among them, AUC was used to measure the overall ability of the model to distinguish real edges from negative sample edges. AP was used to evaluate the average precision of positive and negative sample ranking. Precision, Recall, and F1-score were used to measure classification performance under a threshold of 0.5. Precision@K and Recall@K were used to evaluate the ranking capability of the model in screening high-scoring candidate relationships. The internal testing results are shown in Table 7.
Table 7.
Internal testing results of the model within the training time window.
Overall, both AUC and AP were close to 0.9, indicating that the model was able to effectively distinguish real edges from type-constrained negative sample edges. The F1@0.5 value reached 0.8322, demonstrating a good balance between precision and recall. Both Precision@10 and Precision@20 reached 1.0000, indicating that all candidate relationships ranked within the top 10 and top 20 in the testing set were true positive samples. This result suggests that the model performs well in screening high-confidence candidate relationships. Recall@10 and Recall@20 were relatively low because the testing set contained 153 positive samples, whereas Top10 and Top20 metrics only evaluate a small number of the highest-ranked candidate edges. Therefore, recall values under small K settings are generally limited. In innovation opportunity identification scenarios, models are typically used to prioritize a small number of high-confidence candidate relationships. Consequently, Precision@K more effectively reflects the intelligence screening value of the model.
After completing the internal testing, the potential edges predicted by the model based on the 2006–2020 training network were further retrospectively compared with the observed newly emerging relationships from 2021 to 2023. Specifically, the model first predicted the nine categories of candidate edges that did not appear in the training network and ranked them in descending order according to their Predicted_Logit scores. Subsequently, the prediction results were matched with the newly emerging relationships that observed in the 2021–2023 literature. If a predicted edge represented by <Source, Source_attribute, Relation_type, Target, Target_attribute> was found in the future validation edge set from 2021 to 2023, it was regarded as a hit; otherwise, it was regarded as a miss.
This study employed Hits@K, Precision@K, Recall@K, and MRR to evaluate the model’s capability in predicting future emerging relationships. Hits@K was used to determine whether at least one observed future emerging relationships appeared within the Top-K prediction results. Precision@K was used to measure the proportion of future real emerging relationships among the Top-K prediction results. Recall@K was used to measure the proportion of future real emerging relationships covered by the Top-K prediction results. MRR was used to evaluate the ranking position of the first correctly predicted relationship.
Based on the above validation rules, a total of 533 future real emerging edges were identified within the nine categories of candidate relationships from 2021 to 2023. Among the Top500 prediction results generated by the model, 17 future emerging relationships were successfully matched. The first hit appeared at rank 4, resulting in an MRR value of 0.2500. As shown in Table 8, the model identified two future emerging relationships within the Top10 prediction results and four future emerging relationships within the Top20 prediction results. Both Precision@10 and Precision@20 reached 0.2000, indicating that the model was capable of identifying some knowledge associations among the high-scoring candidate relationships before they actually appeared in subsequent studies. Hits@10, Hits@20, Hits@50, and Hits@100 all reached 1, indicating that future literature-validated prediction relationships existed within different Top-K ranges. The Recall@K values were relatively low mainly because the total number of future emerging relationships from 2021 to 2023 was relatively large, whereas Top10 and Top20 metrics only evaluate a limited number of the highest-ranked candidate relationships (Table 8). In innovation opportunity identification tasks, the primary role of the model is not to exhaustively identify all future relationships, but rather to prioritize a small number of high-confidence clues from a large set of candidate relationships. Therefore, Precision@K and Hits@K better reflect the intelligence screening value of the model.
Table 8.
Retrospective validation results between prediction results and newly emerging relationships from 2021 to 2023.
Further analysis of the hit results by relationship type shows that the model achieved successful predictions in both the data-driven pathway and the technological support pathway across the nine categories of candidate relationships (Table 9). Among them, the Top20 prediction results for protein → influence → phenotype matched four future emerging relationships, with a Precision@K value of 0.2000. The Top20 prediction results for computer_technology → technical_support → phenotype matched two future emerging relationships, with a Precision@K value of 0.1000. The Top20 prediction results for variety → influence → phenotype also matched two future emerging relationships, with a Precision@K value of 0.1000. In addition, gene → influence → phenotype and molecular_technology → technical_support → phenotype each matched one future emerging relationship. Furthermore, within the technical cooperation relationships, computer_technology → technical_cooperation → molecular_technology matched one future emerging relationship.
Table 9.
Hit results of future emerging relationships across different relationship types.
As shown in Table 9, the model achieved relatively strong hit performance for relationship types such as protein → influence → phenotype, computer_technology → technical_support → phenotype, and variety → influence → phenotype. This indicates that the model is capable of identifying some subsequently emerging associations between data elements and phenotypes, as well as support relationships between technological methods and phenotype research. Specifically, the Recall@K value for protein → influence → phenotype reached 0.0851, indicating that the Top20 prediction results for this relationship type covered some future emerging protein–phenotype relationships. The Recall@K value for computer_technology → technical_support → phenotype reached 0.0645, suggesting that the model could identify in advance some future support relationships between data analysis tools or computational methods and phenotype research. In contrast, the number of hits for certain technical cooperation relationships was relatively low. This may be related to the relatively small number of candidate relationships of these types within the Top500 prediction results, the imbalance in sample distribution, and the broader semantic scope of technical cooperation relationships.
From the perspective of specific hit relationships, the prediction results included both potential influence relationships in the data-driven pathway and potential support relationships in the technological support pathway. For example, relationships such as degs → salt tolerance, indica → salt tolerance, sod → salt tolerance, h+-atpase → salt tolerance, koshihikari → salt tolerance, osnhx1 → salt tolerance, and oryza sativa → drought tolerance belong to the influence relationship type. These results indicate that the model could identify in advance some subsequently emerging associations between biological entities and phenotypes. Relationships such as rt-qpcr → drought tolerance, tassel → salt tolerance, anova → salt tolerance, and cufflinks → drought tolerance belong to the technical_support relationship type, suggesting that the model could identify the potential supporting roles of experimental technologies, statistical analysis tools, and bioinformatics tools in stress-related phenotype research. In addition, anova → qrt-pcr belongs to the technical_cooperation relationship type, reflecting the model’s ability to predict potential collaborative relationships among technological methods.
These results demonstrate that some high-scoring candidate relationships predicted from the 2006–2020 training network were subsequently validated by real relationships appearing in the 2021–2023 literature. This provides temporal evidence supporting the model’s capability for prospective relationship discovery. It should also be noted that high-scoring candidate relationships that were not validated by the 2021–2023 literature do not necessarily represent incorrect predictions. Some of these relationships may still remain in a latent state that has not yet been explicitly documented in the literature. Further validation using literature from longer time windows, external databases, or expert judgment is still required.
4.3.3. Baseline Model Comparison and Interpretation of Prediction Results
To further evaluate model performance, this study selected two representative baseline methods for comparison. The first was the classical heuristic link prediction method Adamic-Adar, which was used to evaluate the predictive capability of local topological similarity-based approaches. The second was the shallow graph embedding method Node2Vec, which was used to evaluate the predictive capability of random walk-based node representation learning approaches. All models were evaluated using the same 2006–2020 training network, the same nine categories of candidate relationship spaces, and the same testing edge set. A unified set of evaluation metrics, including AUC, AP, Precision@K, Recall@K, and F1-score, was adopted for comparison. For non-probabilistic methods such as Adamic-Adar and Node2Vec, F1@0.5 was calculated based on normalized prediction scores, while AUC, AP, and Top-K metrics were calculated based on the original ranking scores (Table 10).
Table 10.
Performance comparison of different link prediction methods.
As shown in Table 10, Adamic-Adar achieved relatively strong performance in Precision@10 and Precision@20, indicating that local common-neighbor structures play a certain role in screening high-confidence candidate relationships. However, its AUC, AP, and F1 values were all lower than those of the proposed method, suggesting that relying solely on local topological similarity is insufficient for stably distinguishing real edges from negative sample edges. Node2Vec achieved AUC and AP values of 0.5041 and 0.5384, respectively, indicating relatively weak overall discriminative capability. This result suggests that shallow random walk-based embeddings are insufficient to fully capture node types, relationship semantics, and candidate edge constraints within the technology-data heterogeneous network. In contrast, the proposed method achieved better performance in AUC, AP, F1@0.5, and Precision@20, demonstrating that integrating node types, textual features of node names, edge weights, and network structural information helps improve the prediction performance of potential relationships.
From the prediction results, the top-ranked candidate relationships generated by the joint model across the nine relationship categories included both technical_support relationships, such as rt-pcr → salt tolerance and rt-qpcr → drought tolerance, and influence relationships, such as degs → salt tolerance and n22 → salt tolerance. These results indicate that the model can simultaneously identify potential associations within both the technological support pathway and the data-driven pathway. Since the Predicted_Score values of some high-scoring candidate relationships were close to 1, this study additionally retained the original model output value, Predicted_Logit, and used it as the primary ranking criterion to more clearly distinguish the relative differences among high-confidence candidate relationships. It should be noted that the prediction results represent candidate associations that have not yet explicitly appeared in the current knowledge network and still require further validation using subsequent literature, external databases, or expert knowledge.
4.4. Innovation Opportunity Identification Results Based on the Full Dataset
After completing model performance evaluation, temporal holdout validation, and baseline model comparison, this section further trained the model using the full-period dataset to identify candidate innovation opportunities that remained unconnected within the complete knowledge network. To reduce the interference of background nodes on prediction results, edges directly related to environmental factor nodes were removed during the candidate relationship prediction stage, and link prediction was conducted under the constraints of the nine categories of candidate relationships. The full dataset originally contained 4858 edges. After removing edges related to environmental_factor nodes, 4321 edges remained. Further filtering based on the nine categories of candidate relationships resulted in 1296 valid task edges. Among them, variety → influence → phenotype, computer_technology → technical_cooperation → molecular_technology, and gene → influence → phenotype were the most frequent relationship types, containing 352, 351, and 314 edges, respectively.
Based on the structural relationships among data elements, technological methods, and experimental objectives in rice drought-tolerant breeding research, this study classified potential innovation opportunities into two categories. The first category comprises opportunities driven by scientific data elements, which are mainly reflected as potential influence relationships between genes, proteins, or variety materials and drought-tolerant phenotypes. The second category consists of innovation opportunities supported by technological innovation elements, which are mainly reflected as potential technical support relationships between molecular breeding technologies, computer technologies, and drought-tolerant phenotype research.
During the model prediction stage, node pairs satisfying the candidate relationship type constraints but not yet explicitly connected in the current heterogeneous network were scored. Considering that the Sigmoid function tends to compress the Predicted_Score values of high-confidence candidate relationships into a range close to 1, this study prioritized the original model output value, Predicted_Logit, for ranking candidate relationships, while using Predicted_Score as an auxiliary confidence score. Table 11 presents two representative categories of potential relationships with drought tolerance as the target entity.
Table 11.
Representative potential relationships related to drought tolerance in the full dataset.
As shown in Table 11, the high-scoring candidate relationships identified by the model are mainly distributed across two pathways: the data-driven pathway and the technological support pathway. In the data-driven pathway, variety nodes such as ir29, zhonghua, zhonghua11, cocodrie, and nsic rc, as well as gene nodes such as osif, osnramp5, osexpa7, and qgas1, formed potential influence relationships with drought tolerance. In the technological support pathway, molecular breeding technologies such as rt-pcr, qpcr, rna sequencing, crispr/cas9, and transgenic, together with computer technologies such as spss software, tassel, excel, and mega, formed potential technical_support relationships with drought tolerance. Overall, the full-dataset prediction results reveal two major categories of candidate association structures: “data elements-target phenotype” relationships and “technological methods-target phenotype” relationships. These results provide the foundation for subsequent intelligence interpretation and rationality analysis.
4.5. Intelligence Interpretation and Rationality Analysis of Potential Innovation Opportunities
To further interpret the intelligence implications of the link prediction results, this study analyzed the representative candidate relationships related to drought tolerance shown in Table 11 from multiple perspectives, including node types, research evidence types, potential research value, and stages of the scientific experimental process. Rather than directly treating the prediction results as established scientific conclusions, this section primarily explains, from the perspective of science and technology intelligence analysis, why these candidate nodes deserve further attention and validation. Based on the major stages of the scientific experimental process [41], the candidate nodes can be mapped to different stages, including material preparation, hypothesis generation, experimental operation, data recording and analysis, and result validation and interpretation. This mapping helps reveal their potential roles in rice drought-tolerant breeding research (Table 12).
Table 12.
Intelligence interpretation of potential innovation opportunities.
From the perspective of data elements, the variety nodes shown in Table 12 mainly correspond to the “data and material preparation” stage of the scientific experimental process. Nodes such as ir29, zhonghua, zhonghua11, cocodrie, and nsic rc represent rice material resources that can be used for drought-tolerance trait comparison, experimental material screening, and genetic background analysis. Unlike simple node co-occurrence, these candidate relationships suggest that the model can identify material objects with potential value for further phenotype analysis from the heterogeneous network structure.
From the perspective of candidate genes, nodes such as osif, osnramp5, osexpa7, and qgas1 mainly correspond to the stages of “hypothesis generation” and “result validation and interpretation.” The potential associations between these nodes and drought tolerance may provide clues for proposing hypotheses related to drought-tolerance regulatory mechanisms, designing functional validation experiments, and screening candidate genes. In particular, genes related to transport processes, growth regulation, or quantitative traits are often potentially associated with plant stress responses, physiological regulation, or agronomic trait formation. Therefore, they are worthy of further tracking and validation.
From the perspective of technological methods, molecular breeding technologies and computer technologies mainly correspond to the stages of “experimental operation,” “data recording and analysis,” and “result validation and interpretation.” Technologies such as rt-pcr and qpcr can be used for candidate gene expression detection, while rna sequencing can be used for expression profile analysis under drought stress. crispr/cas9 and transgenic technologies can be used for functional validation and material development. In addition, tools such as spss software, tassel, excel, and mega support statistical analysis, association analysis, data organization, and phylogenetic analysis, respectively. These findings indicate that the technological nodes identified by the model are not isolated tools, but can be integrated into the experimental and data analysis workflows of drought-tolerant breeding research.
Overall, the candidate nodes shown in Table 12 correspond to key stages in drought-tolerant breeding research, including material resources, mechanism hypotheses, experimental operations, and data analysis, thereby reflecting the value for intelligence organization and analysis of the link prediction results. The potential relationships identified by the model not only suggest possible biological entities of interest, but also reveal the technological pathways that may support the investigation of these entities. Consequently, they can provide candidate clues for subsequent problem formulation, experimental design, and evidence accumulation in drought-tolerant breeding research.
5. Conclusions and Future Prospects
This study proposed an innovation opportunity identification method based on heterogeneous information networks and link prediction and validated its feasibility and application value using the field of rice drought-tolerant breeding as an empirical case. The research first focused on innovation-related elements involved in the scientific experimental process and constructed a multi-layer heterogeneous network integrating scientific data elements and technological innovation elements. A large language model combined with the LightRAG method was then employed to automatically identify and extract entities and relationships from scientific literature, thereby enabling the structured representation of innovation-related elements. On this basis, the HetGNN model based on graph convolutional networks was applied to learn and predict potential relationships within the heterogeneous network, allowing the identification of association relationships that had not yet explicitly formed but possessed potential innovation value from the perspective of network structure.
The empirical results demonstrate that the proposed method can identify potential influence relationships between scientific data elements, such as varieties and genes, and drought-tolerant phenotypes, as well as potential support relationships between molecular breeding technologies, computer technologies, and drought-tolerance research. Further temporal holdout validation and baseline model comparison showed that the proposed model achieved strong performance in AUC, AP, F1, and Precision@K metrics and was able to identify some knowledge associations before they subsequently appeared in real studies among high-scoring candidate relationships. The intelligence interpretation of the prediction results further indicates that the candidate nodes identified by the model can be mapped to different stages of the scientific experimental process, including material preparation, candidate gene discovery, experimental operation, data recording, and data analysis. These findings reflect a dual-pathway characteristic of “data-driven” and “technology-supported” innovation discovery. Overall, the results suggest that heterogeneous network link prediction methods can mine potential innovation opportunity clues from complex scientific knowledge structures and provide methodological support for science and technology intelligence analysis and research direction assessment.
Future research can be further expanded in several aspects. First, multi-source data such as patents, research projects, experimental databases, and germplasm resource databases can be incorporated to enrich the structural information and evidence sources of innovation element networks. Second, entity normalization and synonym disambiguation methods can be further improved to reduce the influence of entity expression differences across literature on relationship-matching and model-prediction results. Third, dynamic network analysis, temporal-aware graph neural networks, and more advanced heterogeneous graph representation learning methods can be integrated to further improve the accuracy and prospective capability of potential innovation opportunity identification. Finally, domain expert evaluation and experimental database validation can be introduced to conduct multi-dimensional verification of high-scoring candidate relationships identified by the model, thereby enhancing the interpretability and practical value of the proposed approach.
Author Contributions
Conceptualization, X.Z. and Q.L.; methodology, Q.L. and G.X.; software, G.X. and Q.L.; validation, Z.H. and Q.L.; formal analysis, D.W.; investigation, Q.L. and Z.X.; resources, X.Z. and T.S.; data curation, G.X. and D.W.; writing—original draft preparation, Q.L.; writing—review and editing, D.W. and Z.X.; visualization, Z.H.; supervision, X.Z. and T.S.; project administration, X.Z. and T.S.; funding acquisition, X.Z. All authors have read and agreed to the published version of the manuscript.
Funding
This research was funded by the National Office for Philosophy and Social Sciences, Beijing, China [grant number 23BTQ054, 2023].
Institutional Review Board Statement
Not applicable.
Informed Consent Statement
Not applicable.
Data Availability Statement
The original literature data used in this study were obtained from the publicly available Science Data Bank repository (https://doi.org/10.57760/sciencedb.j00001.01587, accessed on 1 August 2025). The extracted knowledge graph data, model implementation code, and hyperparameter configurations used in this study will be made publicly available in an online repository upon acceptance of the manuscript.
Conflicts of Interest
The authors declare no conflicts of interest.
References
- Small, H.; Boyack, K.W.; Klavans, R. Identifying emerging topics in science and technology. Res. Policy 2014, 43, 1450–1467. [Google Scholar] [CrossRef] [Scilit]
- Schumpeter, J.; Backhaus, U. The Theory of Economic Development. In Joseph Alois Schumpeter: Entrepreneurship, Style and Vision; Backhaus, J., Ed.; Springer: Boston, MA, USA, 2003; pp. 61–116. [Google Scholar]
- Ardichvili, A.; Cardozo, R.; Ray, S. A theory of entrepreneurial opportunity identification and development. J. Bus. Ventur. 2003, 18, 105–123. [Google Scholar] [CrossRef] [Scilit]
- Shane, S. Prior Knowledge and the Discovery of Entrepreneurial Opportunities. Organ. Sci. 2000, 11, 448–469. [Google Scholar] [CrossRef] [Scilit]
- Cao, X.; Chen, X.; Huang, L.; Deng, L.; Cai, Y.; Ren, H. Detecting technological recombination using semantic analysis and dynamic network analysis. Scientometrics 2024, 129, 7385–7416. [Google Scholar] [CrossRef] [Scilit]
- Xiao, T.; Makhija, M.; Karim, S. A Knowledge Recombination Perspective of Innovation: Review and New Research Directions. J. Manag. 2021, 48, 1724–1777. [Google Scholar] [CrossRef] [Scilit]
- Wang, J.; Zhang, Z.; Feng, L.; Lin, K.-Y.; Liu, P. Development of technology opportunity analysis based on technology landscape by extending technology elements with BERT and TRIZ. Technol. Forecast. Soc. Change 2023, 191, 122481. [Google Scholar] [CrossRef] [Scilit]
- Lee, S.; Yoon, B.; Park, Y. An approach to discovering new technology opportunities: Keyword-based patent map approach. Technovation 2009, 29, 481–497. [Google Scholar] [CrossRef] [Scilit]
- Newman, M.E.J. The Structure and Function of Complex Networks. SIAM Rev. 2003, 45, 167–256. [Google Scholar] [CrossRef] [Scilit]
- Lü, L.; Zhou, T. Link prediction in complex networks: A survey. Phys. A Stat. Mech. Its Appl. 2011, 390, 1150–1170. [Google Scholar] [CrossRef] [Scilit]
- Sun, Y.; Han, J. Mining heterogeneous information networks: A structural analysis approach. SIGKDD Explor. Newsl. 2013, 14, 20–28. [Google Scholar] [CrossRef] [Scilit]
- Kipf, T.N.; Welling, M. Semi-Supervised Classification with Graph Convolutional Networks. arXiv 2016, arXiv:1609.02907. [Google Scholar] [CrossRef] [Scilit]
- Kwon, S.; Youtie, J.; Porter, A.L. Interdisciplinary knowledge combinations and emerging technological topics: Implications for reducing uncertainties in research evaluation. Res. Eval. 2021, 30, 127–140. [Google Scholar] [CrossRef] [Scilit]
- Boyack, K.W.; Klavans, R. Co-citation analysis, bibliographic coupling, and direct citation: Which citation approach represents the research front most accurately? J. Am. Soc. Inf. Sci. Technol. 2010, 61, 2389–2404. [Google Scholar] [CrossRef] [Scilit]
- Small, H. Maps of science as interdisciplinary discourse: Co-citation contexts and the role of analogy. Scientometrics 2010, 83, 835–849. [Google Scholar] [CrossRef] [Scilit]
- Chen, C. Predictive effects of structural variation on citation counts. J. Am. Soc. Inf. Sci. Technol. 2012, 63, 431–449. [Google Scholar] [CrossRef] [Scilit]
- Uzzi, B.; Mukherjee, S.; Stringer, M.; Jones, B. Atypical combinations and scientific impact. Science 2013, 342, 468–472. [Google Scholar] [CrossRef] [Scilit] [PubMed]
- Kostoff, R.N. Literature-Related Discovery (LRD): Introduction and background. Technol. Forecast. Soc. Change 2008, 75, 165–185. [Google Scholar] [CrossRef] [Scilit]
- Chaoguang, H.; Yueji, H.; Fanfan, H.; Chenwei, Z. An approach for interdisciplinary knowledge discovery: Link prediction between topics. Phys. A Stat. Mech. Its Appl. 2025, 665, 130517. [Google Scholar] [CrossRef] [Scilit]
- Cobo, M.J.; López-Herrera, A.G.; Herrera-Viedma, E.; Herrera, F. Science mapping software tools: Review, analysis, and cooperative study among tools. J. Am. Soc. Inf. Sci. Technol. 2011, 62, 1382–1402. [Google Scholar] [CrossRef] [Scilit]
- Wang, Z.; Guo, W.; Shao, H.; Wang, L.; Chang, Z.; Zhang, Y.; Liu, Z. From technology opportunities to solutions generation via patent analysis: Application of machine learning-based link prediction. Adv. Eng. Inform. 2024, 62, 102944. [Google Scholar] [CrossRef] [Scilit]
- Klavans, R.; Boyack, K.W. Which Type of Citation Analysis Generates the Most Accurate Taxonomy of Scientific and Technical Knowledge? J. Assoc. Inf. Sci. Technol. 2017, 68, 984–998. [Google Scholar] [CrossRef] [Scilit]
- Lee, Y.; Kim, S.Y.; Song, I.; Park, Y.; Shin, J. Technology opportunity identification customized to the technological capability of SMEs through two-stage patent analysis. Scientometrics 2014, 100, 227–244. [Google Scholar] [CrossRef] [Scilit]
- Park, I.; Yoon, B. Technological opportunity discovery for technological convergence based on the prediction of technology knowledge flow in a citation network. J. Informetr. 2018, 12, 1199–1222. [Google Scholar] [CrossRef] [Scilit] [PubMed]
- Sarukkai, R.R. Link prediction and path analysis using Markov chains1This work was done by the author prior to his employment at Yahoo Inc.1. Comput. Netw. 2000, 33, 377–386. [Google Scholar] [CrossRef] [Scilit]
- Liben-Nowell, D.; Kleinberg, J. The link prediction problem for social networks. In Proceedings of the Twelfth International Conference on Information and Knowledge Management, New Orleans, LA, USA, 3–8 November 2003; pp. 556–559. [Google Scholar]
- Kay, L.; Newman, N.; Youtie, J.; Porter, A.L.; Rafols, I. Patent overlay mapping: Visualizing technological distance. J. Assoc. Inf. Sci. Technol. 2014, 65, 2432–2443. [Google Scholar] [CrossRef] [Scilit]
- Sun, Y.; Han, J.; Yan, X.; Yu, P.S.; Wu, T. PathSim: Meta path-based top-K similarity search in heterogeneous information networks. Proc. VLDB Endow. 2011, 4, 992–1003. [Google Scholar] [CrossRef] [Scilit]
- Shi, C.; Li, Y.; Zhang, J.; Sun, Y.; Yu, P.S. A survey of heterogeneous information network analysis. IEEE Trans. Knowl. Data Eng. 2017, 29, 17–37. [Google Scholar] [CrossRef] [Scilit]
- Goyal, P.; Ferrara, E. Graph embedding techniques, applications, and performance: A survey. Knowl.-Based Syst. 2018, 151, 78–94. [Google Scholar] [CrossRef] [Scilit]
- Cai, H.; Zheng, V.W.; Chen-Chuan Chang, K. A Comprehensive Survey of Graph Embedding: Problems, Techniques and Applications. arXiv 2017, arXiv:1709.07604. [Google Scholar] [CrossRef] [Scilit]
- Nickel, M.; Murphy, K.; Tresp, V.; Gabrilovich, E. A Review of Relational Machine Learning for Knowledge Graphs. Proc. IEEE 2016, 104, 11–33. [Google Scholar] [CrossRef] [Scilit]
- Wang, Q.; Mao, Z.; Wang, B.; Guo, L. Knowledge Graph Embedding: A Survey of Approaches and Applications. IEEE Trans. Knowl. Data Eng. 2017, 29, 2724–2743. [Google Scholar] [CrossRef] [Scilit]
- Wu, Z.; Pan, S.; Chen, F.; Long, G.; Zhang, C.; Yu, P.S. A Comprehensive Survey on Graph Neural Networks. IEEE Trans. Neural Netw. Learn. Syst. 2021, 32, 4–24. [Google Scholar] [CrossRef] [Scilit] [PubMed]
- Zhou, J.; Cui, G.; Hu, S.; Zhang, Z.; Yang, C.; Liu, Z.; Wang, L.; Li, C.; Sun, M. Graph neural networks: A review of methods and applications. AI Open 2020, 1, 57–81. [Google Scholar] [CrossRef] [Scilit]
- Bing, R.; Yuan, G.; Zhu, M.; Meng, F.; Ma, H.; Qiao, S. Heterogeneous graph neural networks analysis: A survey of techniques, evaluations and applications. Artif. Intell. Rev. 2023, 56, 8003–8042. [Google Scholar] [CrossRef] [Scilit]
- Sun, C.; Li, C.; Lin, X.; Zheng, T.; Meng, F.; Rui, X.; Wang, Z. Attention-based graph neural networks: A survey. Artif. Intell. Rev. 2023, 56, 2263–2310. [Google Scholar] [CrossRef] [Scilit]
- Shang, H.; Jiang, L.; Pan, X. Does R&D element flow promote the spatial convergence of regional carbon efficiency? J. Environ. Manag. 2022, 322, 116080. [Google Scholar] [CrossRef] [Scilit] [PubMed]
- Qiao, L.; Nanling, D.; Guojian, X.; Yu, W.; Tan, S.; Xuefu, Z. An Entity-Relationship Conceptual Model of Innovation Elements for Scientific Experiment Processes and Its Application. Libr. Inf. Serv. 2025, 70, 31–42. (In Chinese) [Google Scholar] [CrossRef]
- Guo, Z.; Xia, L.; Yu, Y.; Ao, T.; Huang, C. LightRAG: Simple and Fast Retrieval-Augmented Generation. arXiv 2025, arXiv:2410.05779. [Google Scholar]
- Pilosof, S.; Porter, M.A.; Pascual, M.; Kéfi, S. The multilayer nature of ecological networks. Nat. Ecol. Evol. 2017, 1, 0101. [Google Scholar] [CrossRef] [Scilit] [PubMed]
- Zhang, C.; Song, D.; Huang, C.; Swami, A.; Chawla, N.V. Heterogeneous Graph Neural Network. In Proceedings of the 25th ACM SIGKDD International Conference on Knowledge Discovery & Data Mining, Anchorage, AK, USA, 4–8 August 2019; pp. 793–803. [Google Scholar]
- Kumar, A.; Dixit, S.; Ram, T.; Yadaw, R.B.; Mishra, K.K.; Mandal, N.P. Breeding high-yielding drought-tolerant rice: Genetic variations and conventional and molecular approaches. J. Exp. Bot. 2014, 65, 6265–6278. [Google Scholar] [CrossRef] [Scilit] [PubMed]
- Shannon, P.; Markiel, A.; Ozier, O.; Baliga, N.S.; Wang, J.T.; Ramage, D.; Amin, N.; Schwikowski, B.; Ideker, T. Cytoscape: A software environment for integrated models of biomolecular interaction networks. Genome Res. 2003, 13, 2498–2504. [Google Scholar] [CrossRef] [Scilit] [PubMed]
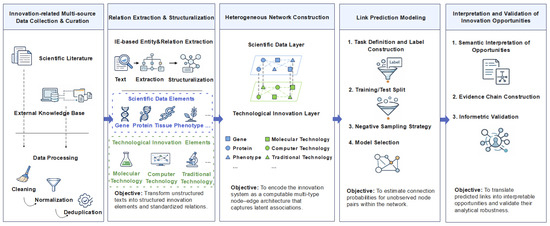
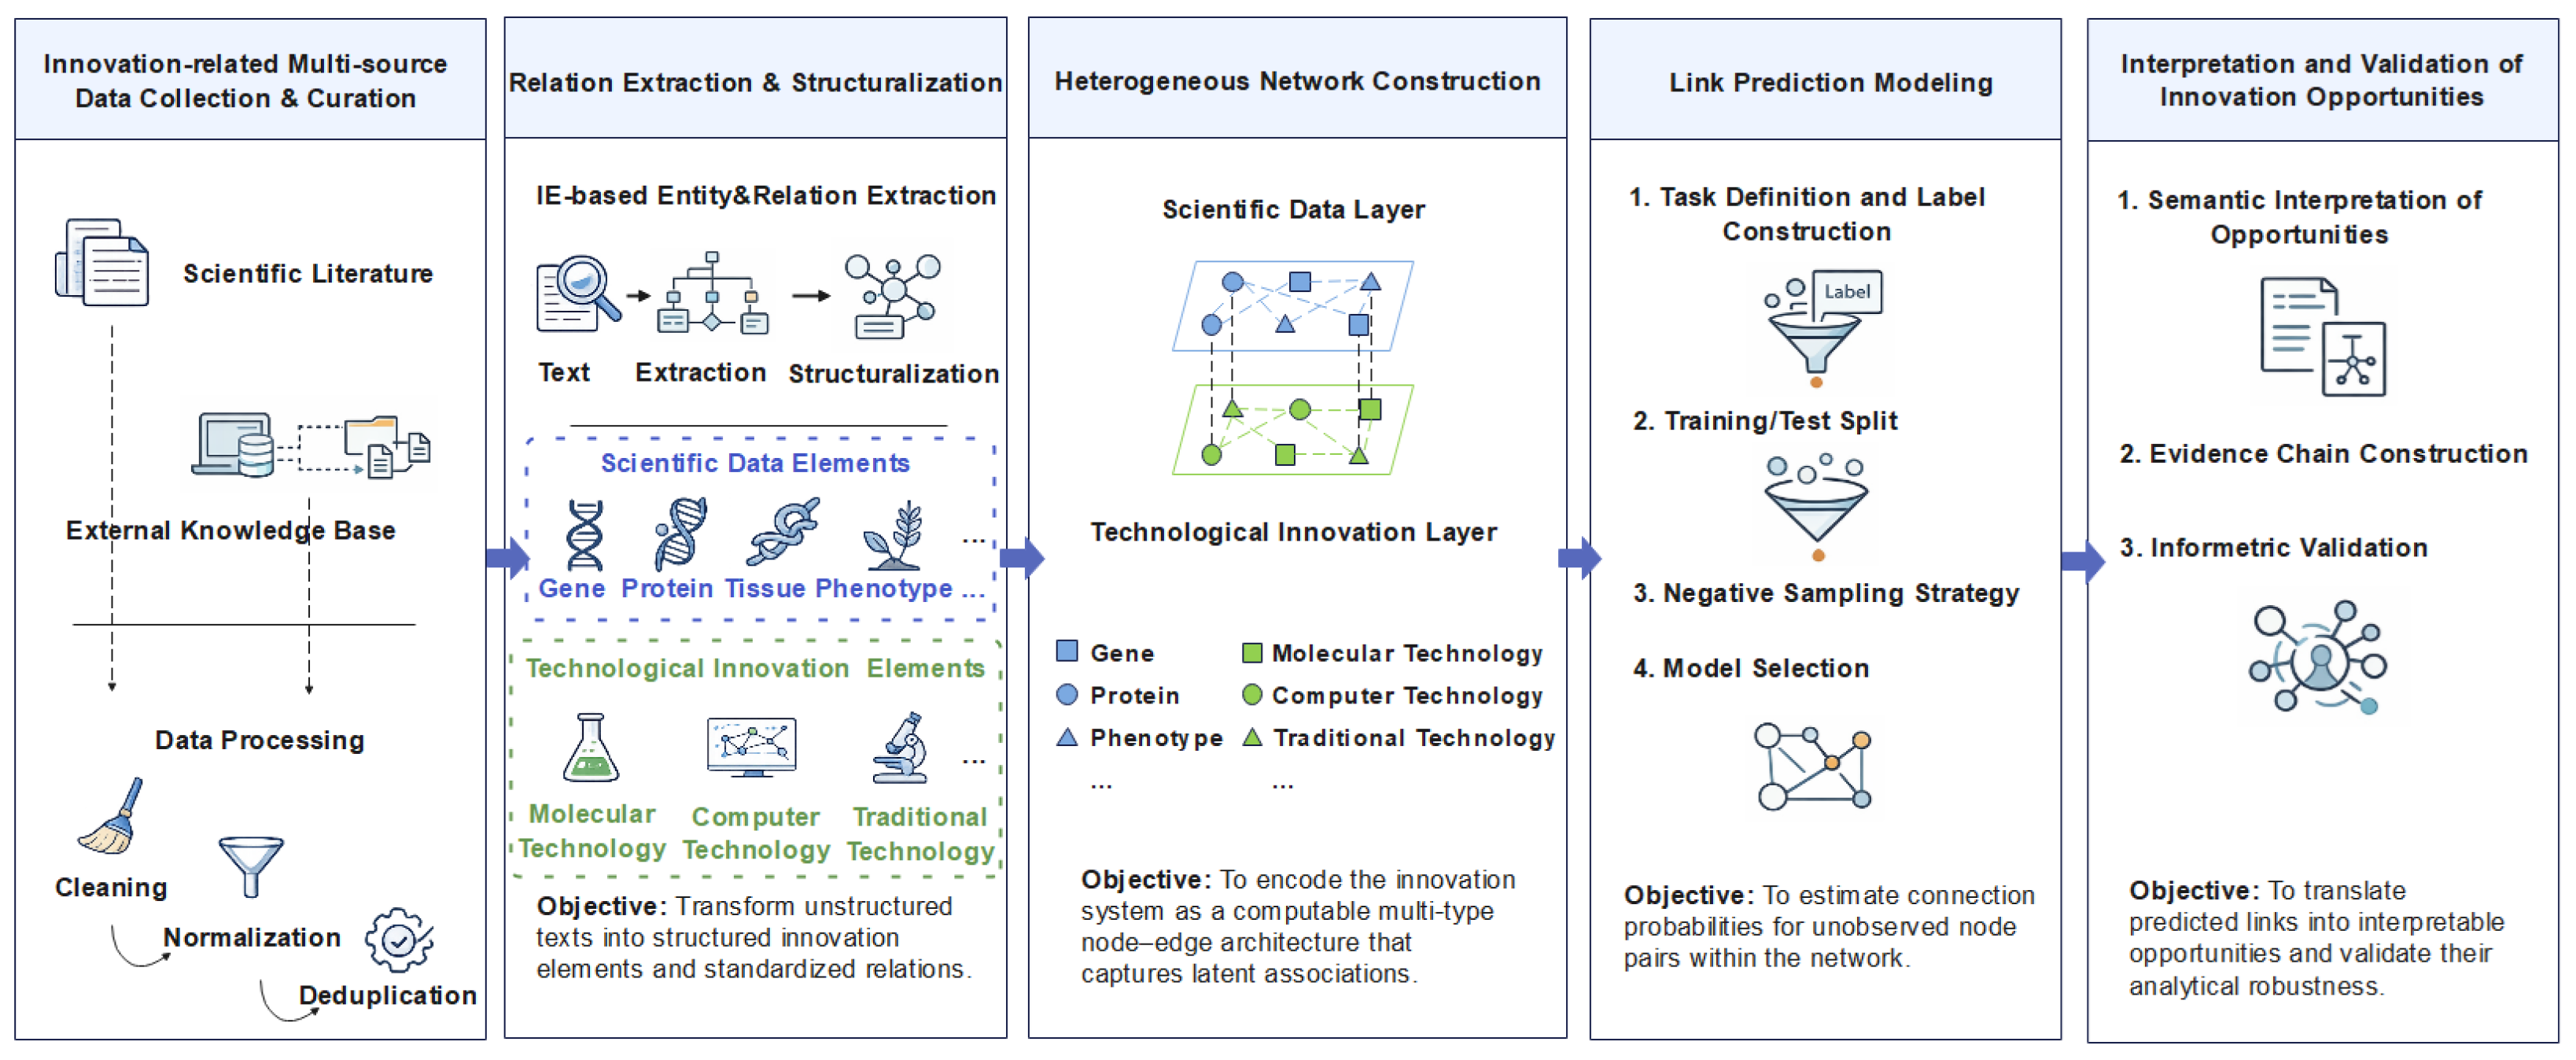
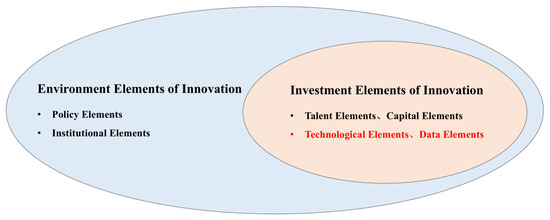
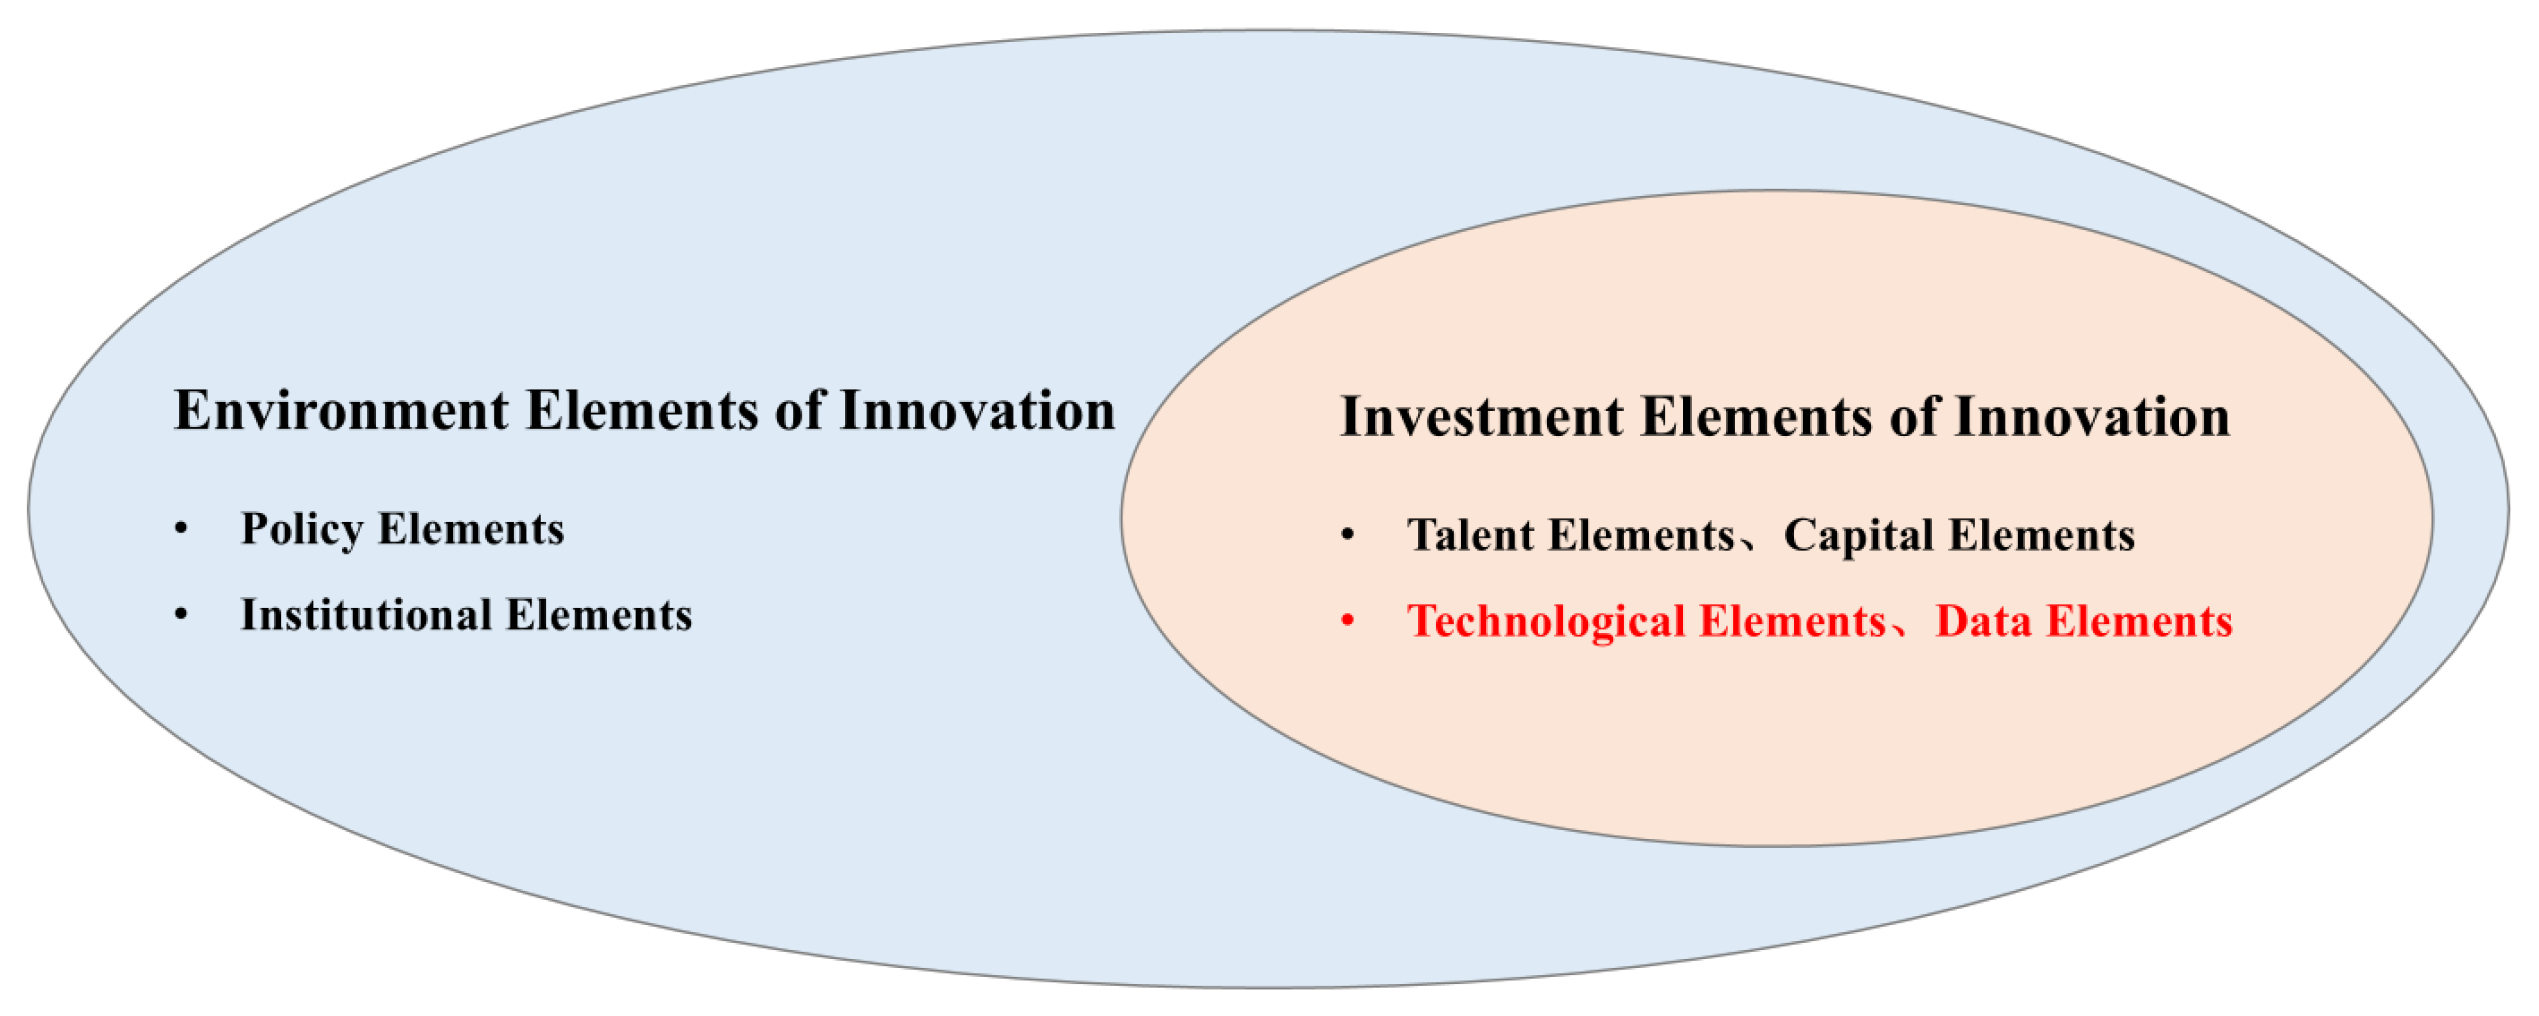
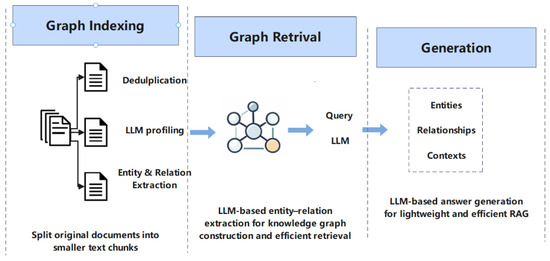
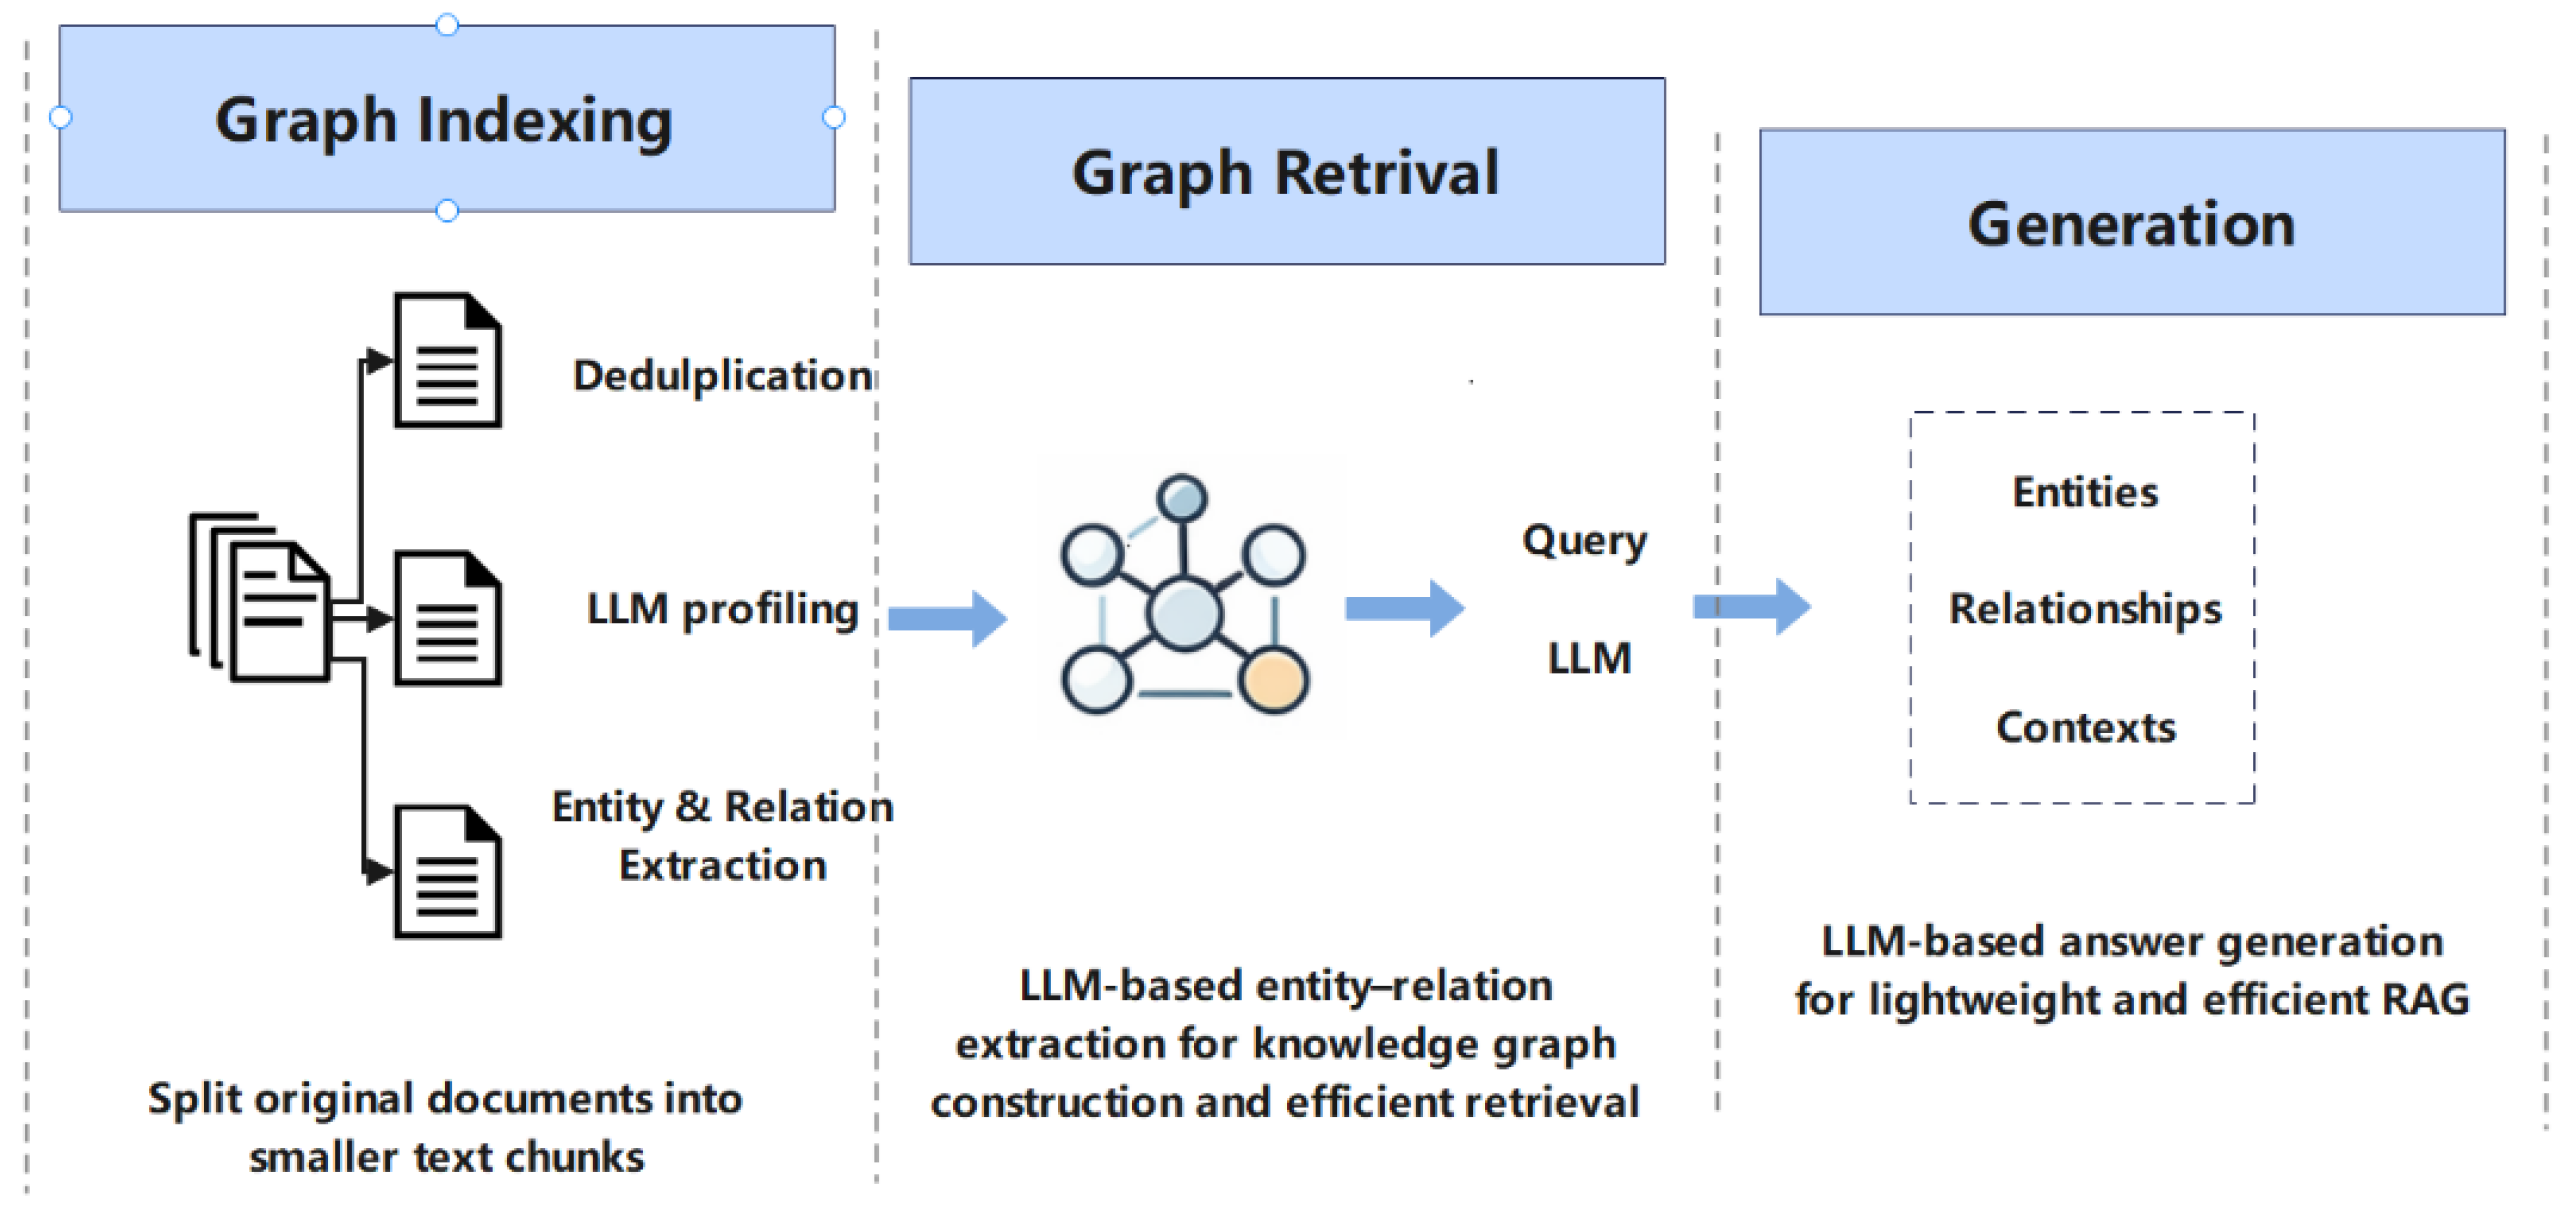
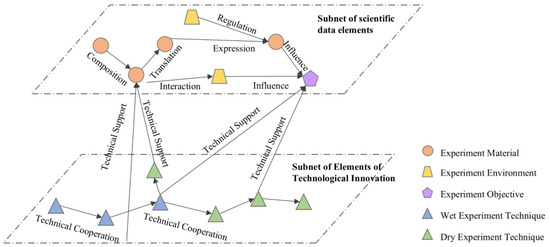
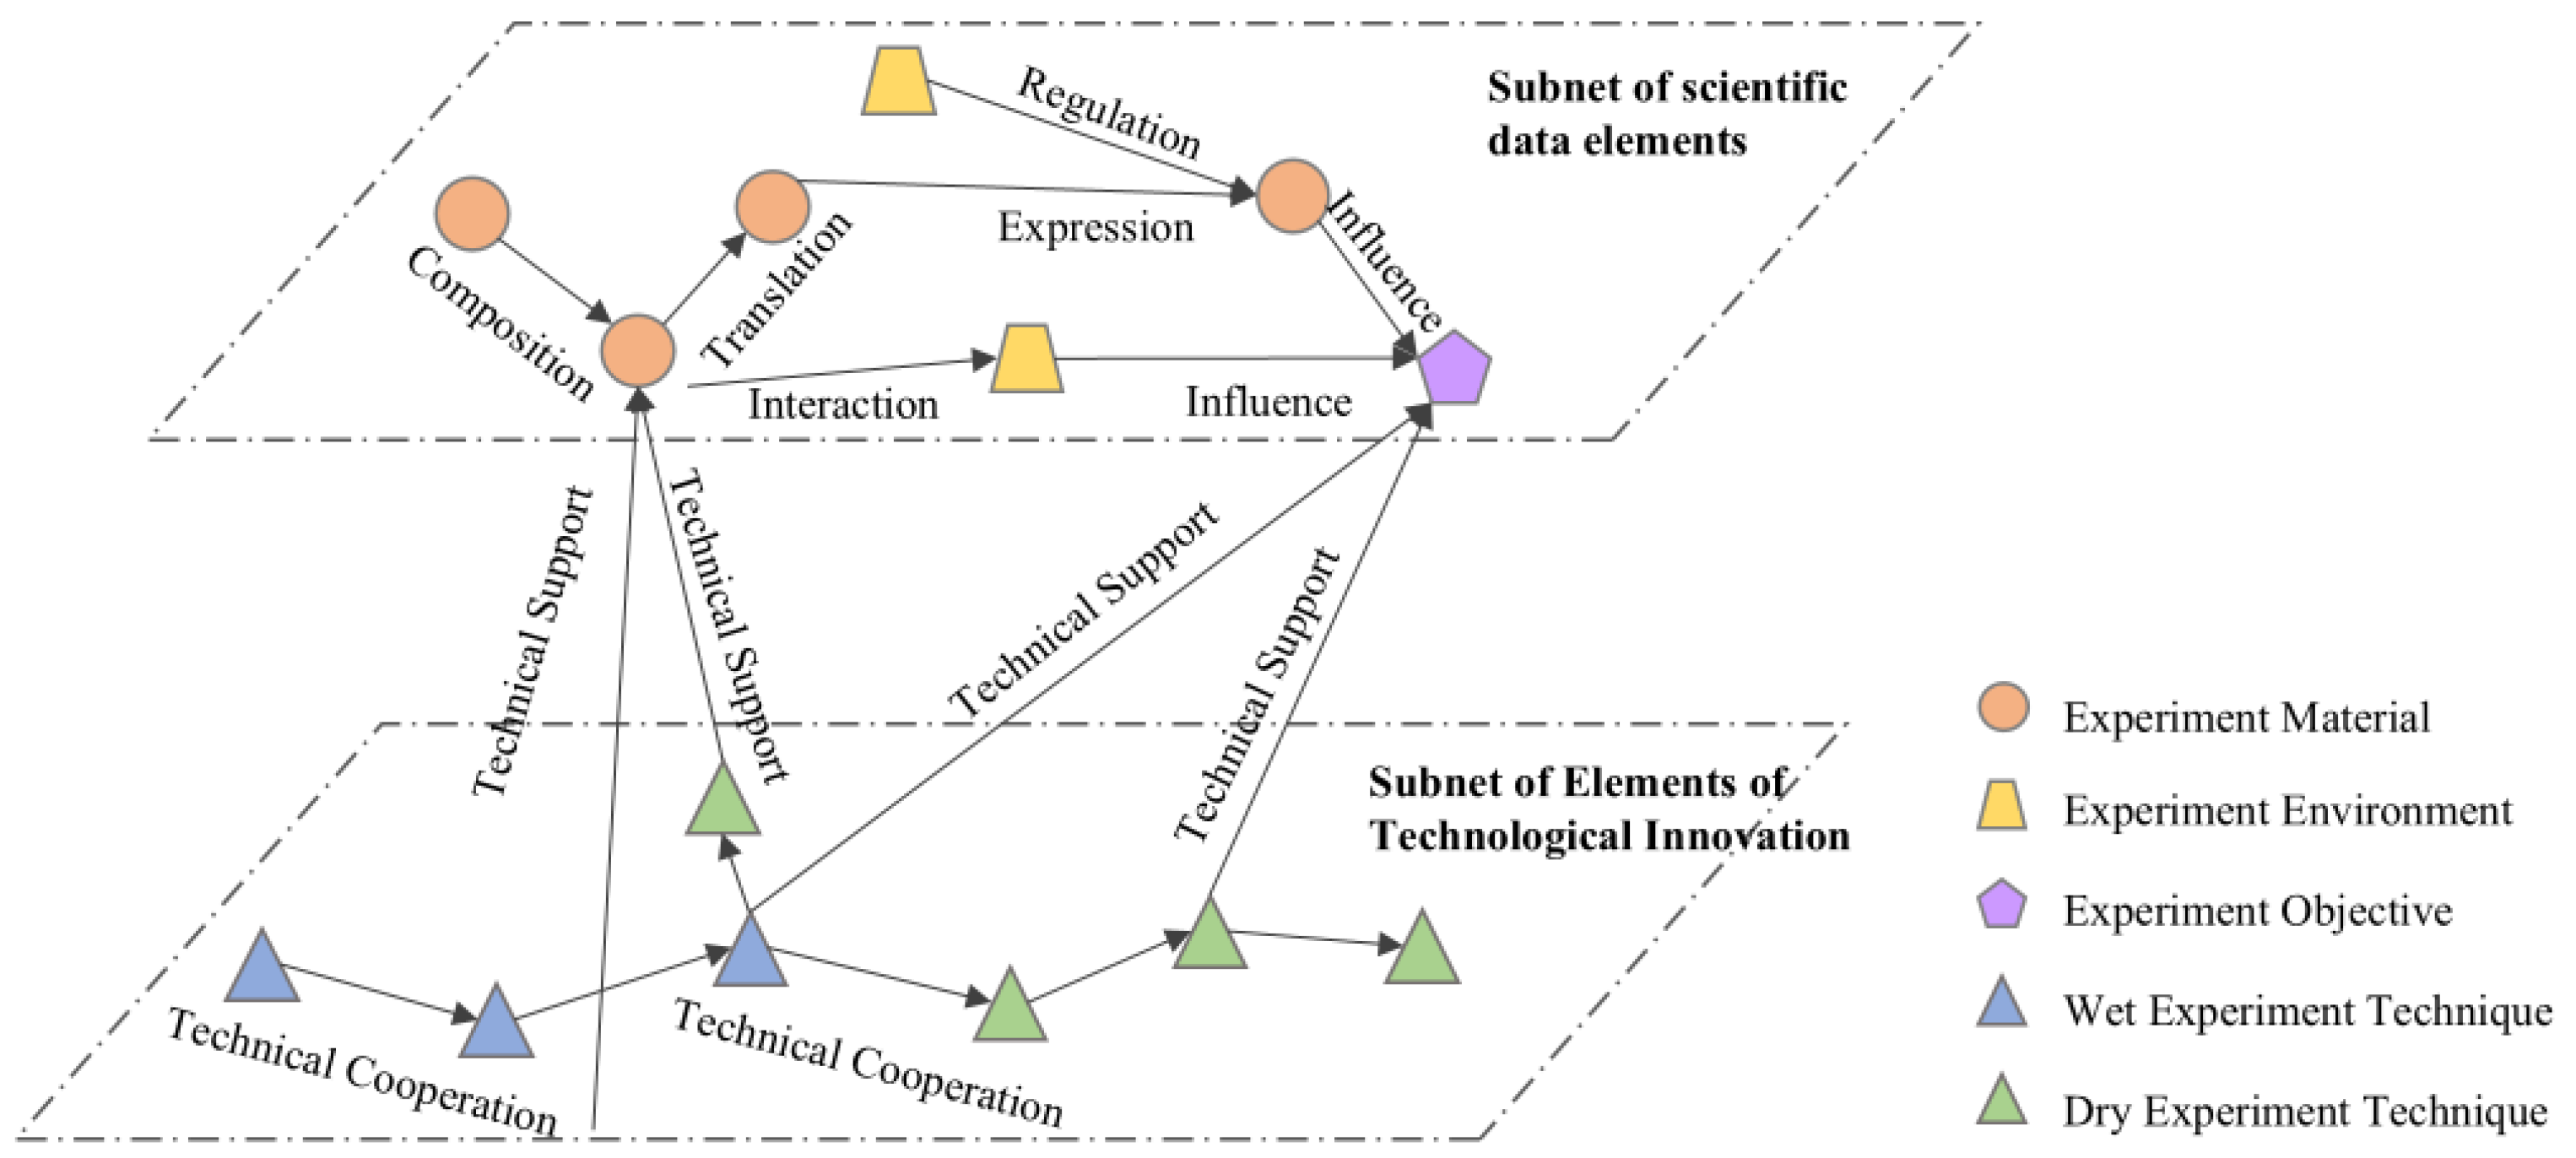
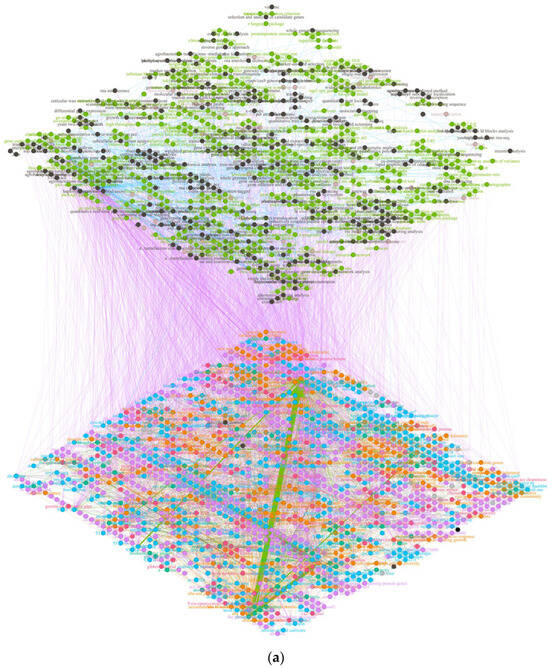
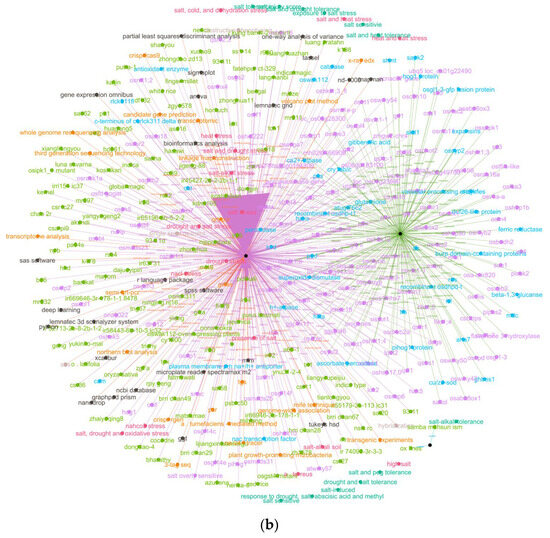
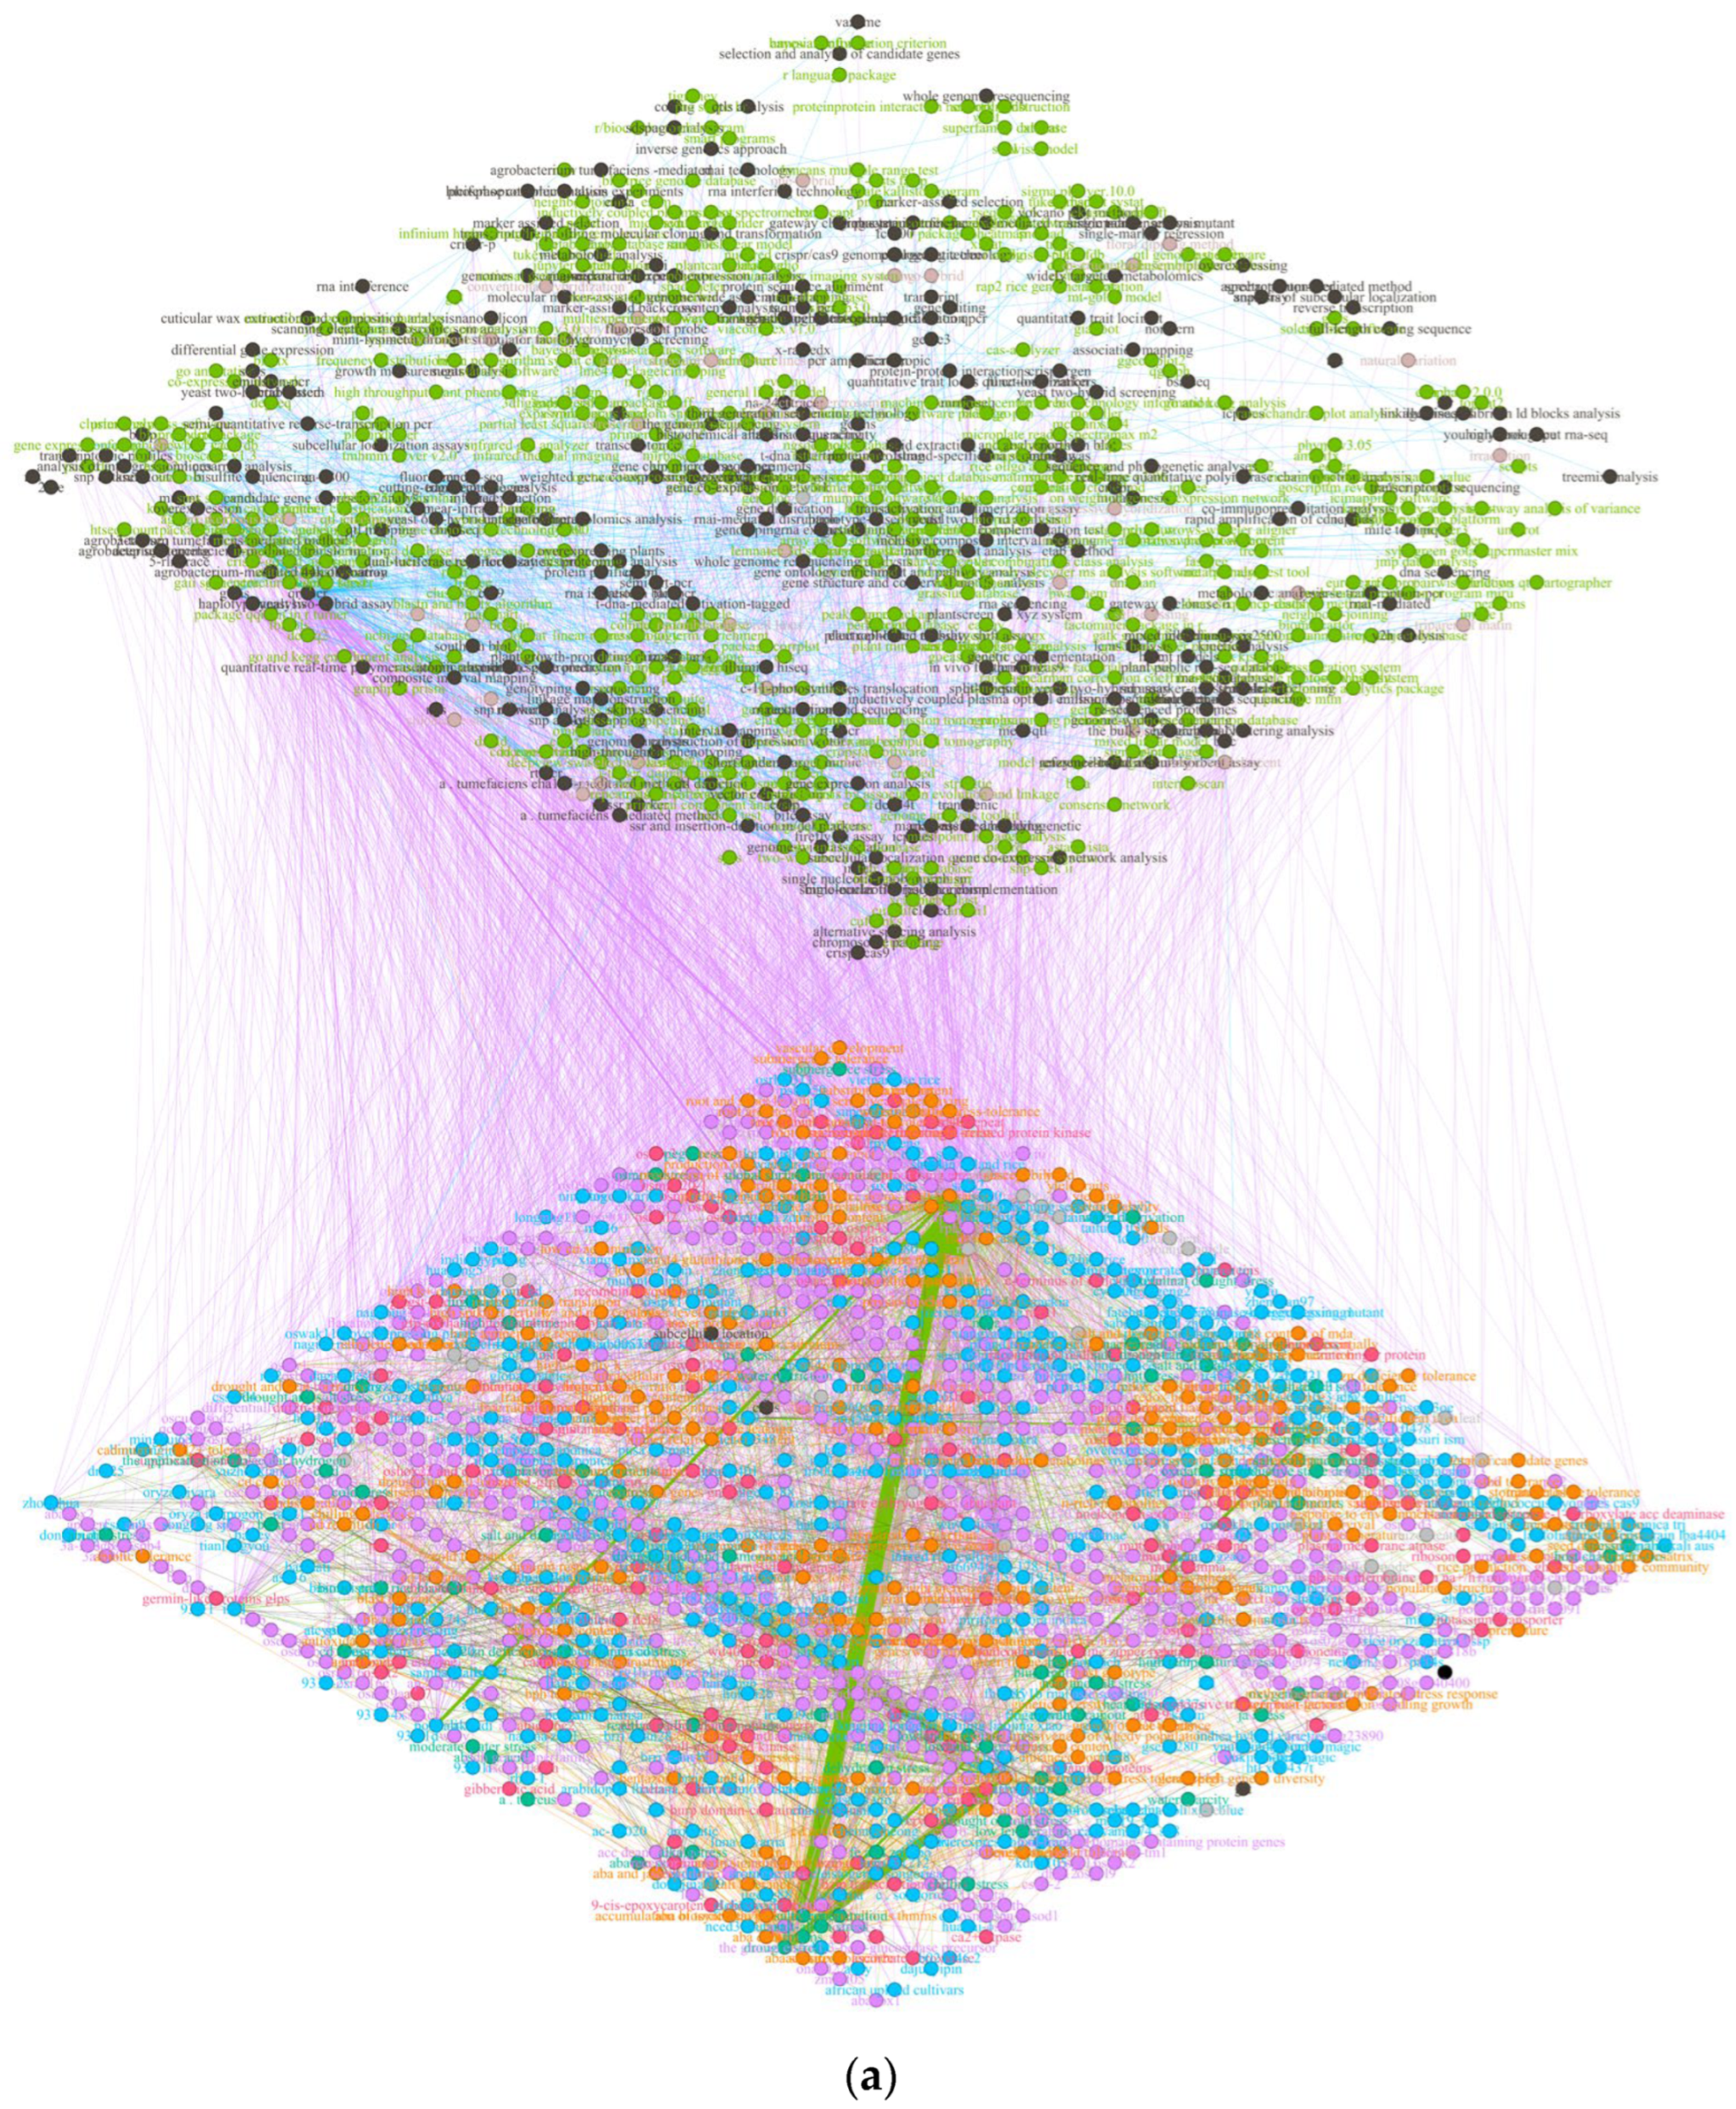
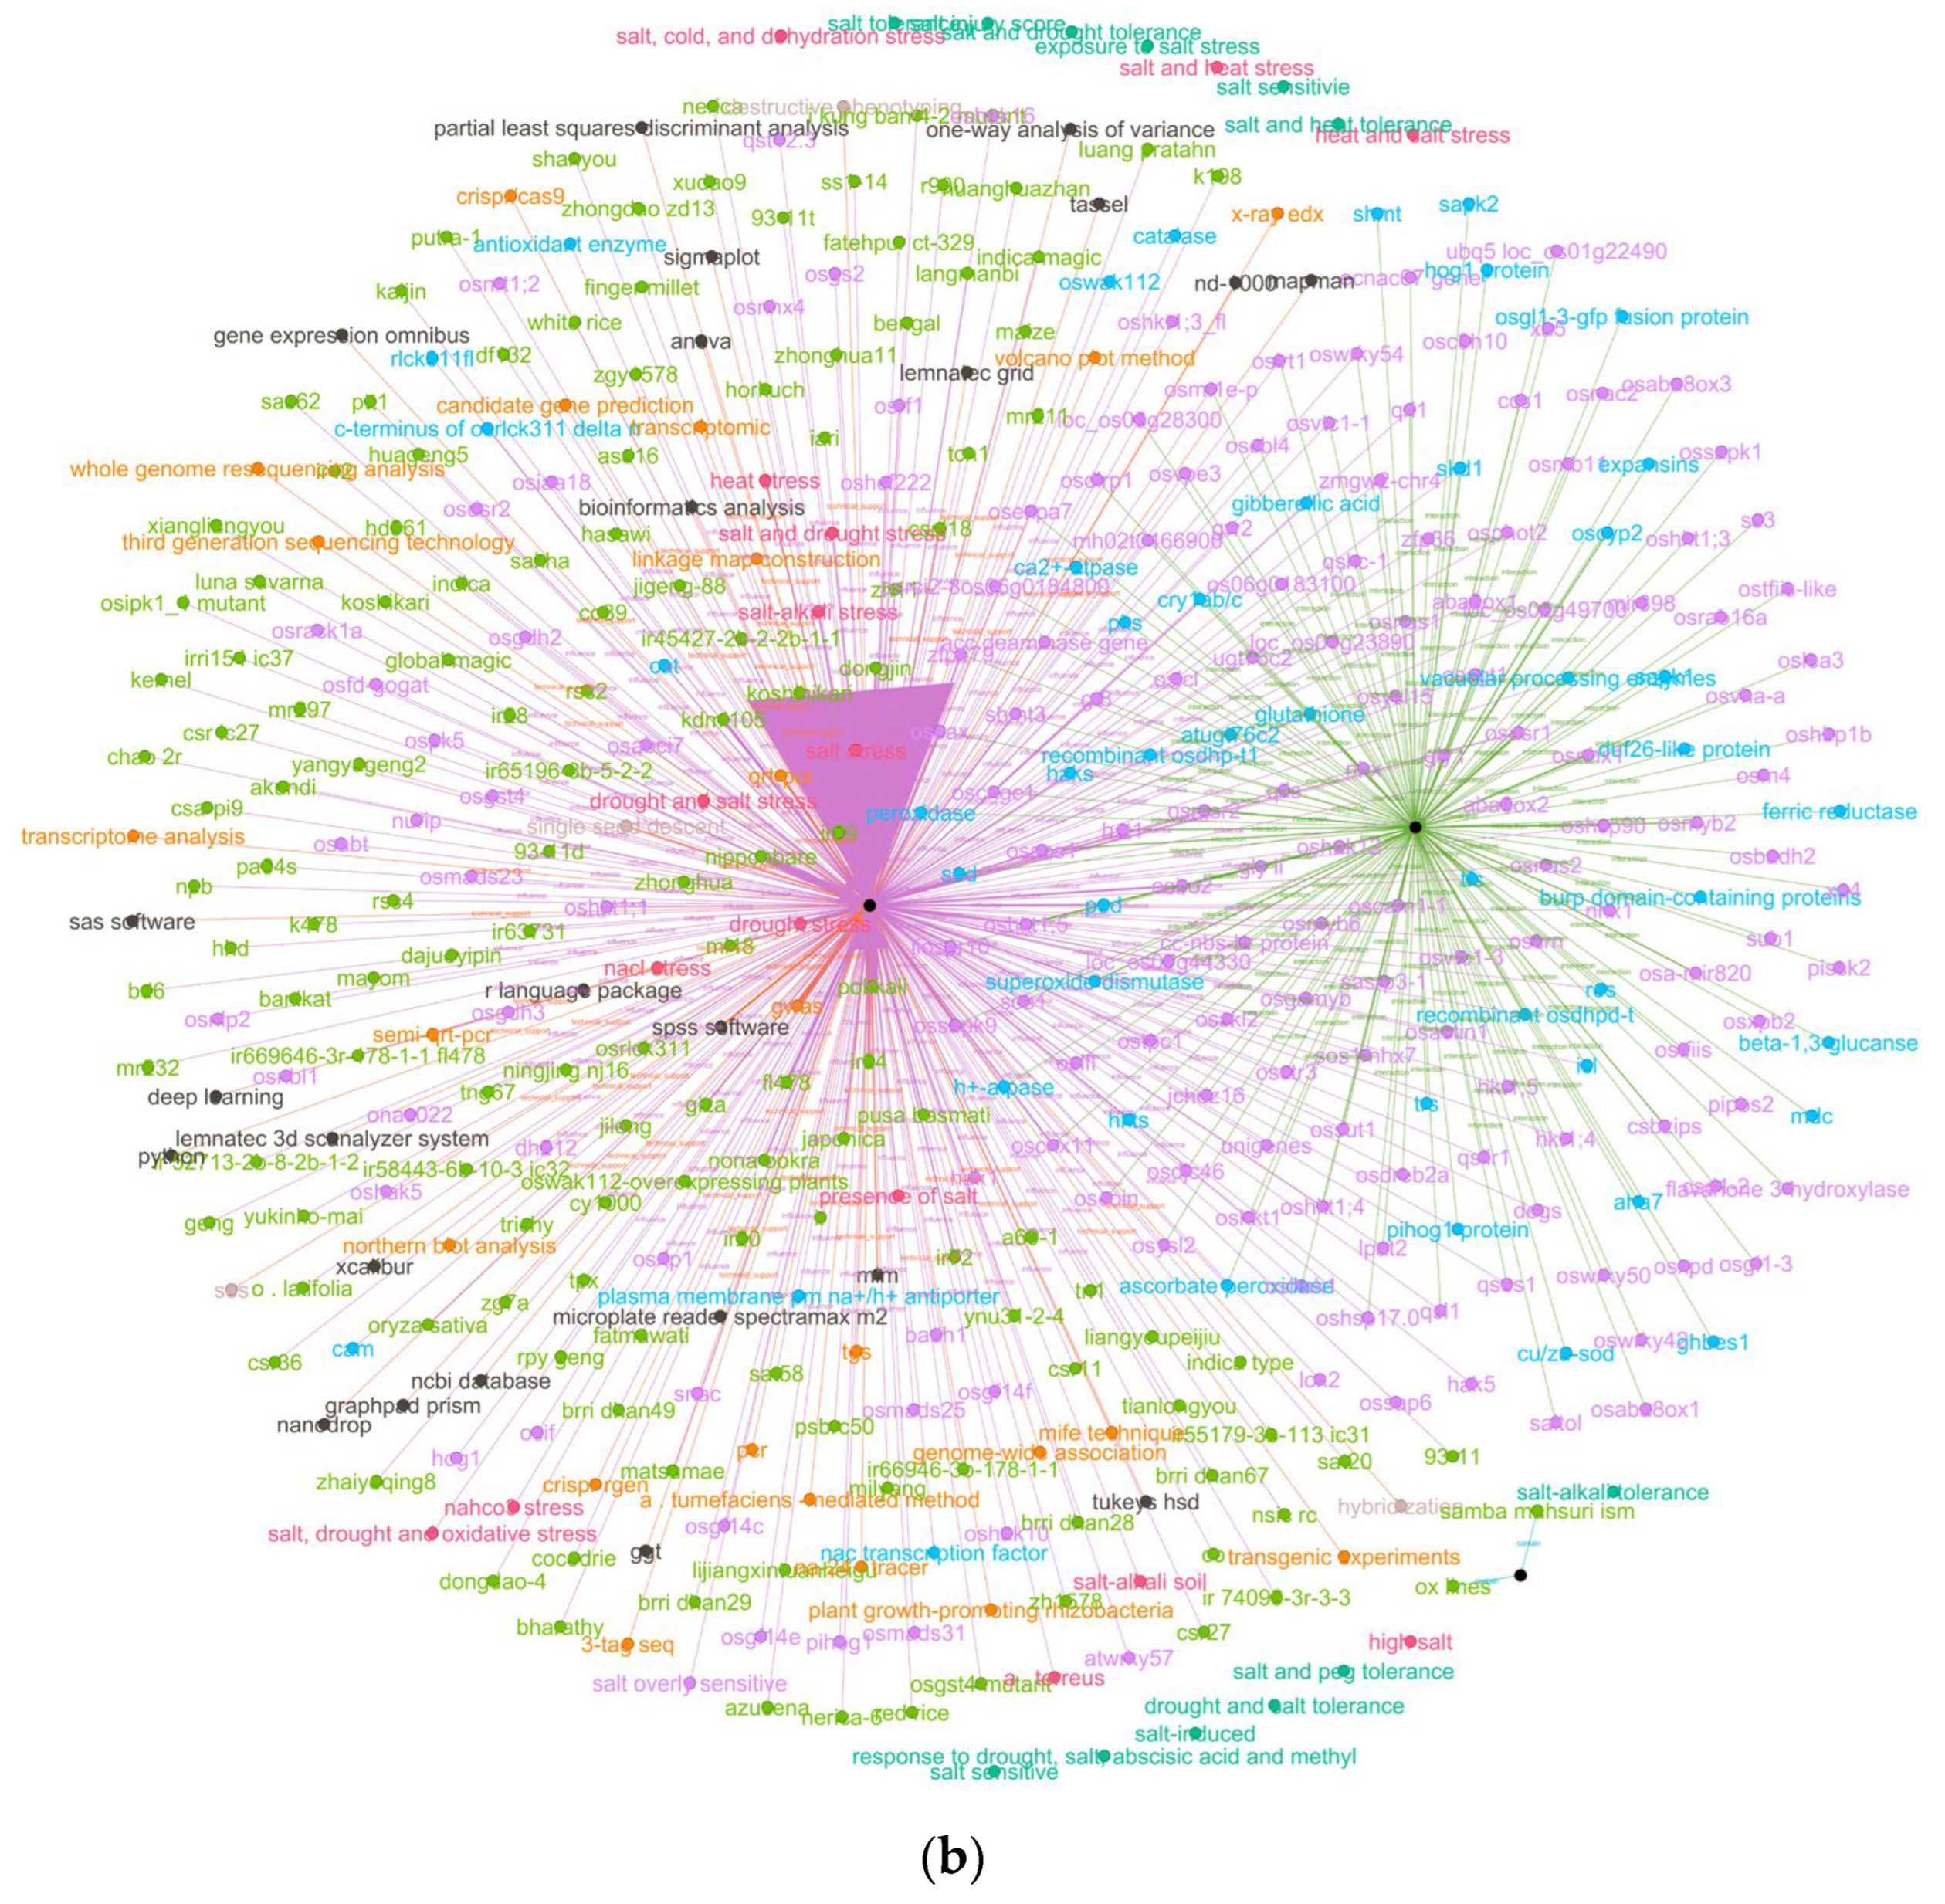

Disclaimer/Publisher’s Note: The statements, opinions and data contained in all publications are solely those of the individual author(s) and contributor(s) and not of MDPI and/or the editor(s). MDPI and/or the editor(s) disclaim responsibility for any injury to people or property resulting from any ideas, methods, instructions or products referred to in the content. |
© 2026 by the authors. Licensee MDPI, Basel, Switzerland. This article is an open access article distributed under the terms and conditions of the Creative Commons Attribution (CC BY) license.