


Highlights
Please indicate how your work links to systems science via your contributions to systems practice, theory, and/or methodology.
- A recursive simulation model formalizes feedback, governance delay, and trajectory-level diagnostic risk in financial reporting oversight.
- Auditable state-update rules trace oversight signals across reporting, audit, board oversight, regulation, and market feedback.
What are the main findings and/or the implications of the main findings?
- High-transparency coordination generally ranks highest, while weak governance remains lowest across uncertainty analyses.
- Within the model, audit improvement lowers audit risk; system-wide governance improvement depends on connected oversight channels.
Abstract
Financial reporting oversight evolves through repeated feedback among managerial incentives, audit detection, board oversight, regulatory intervention, and market trust. I develop a transparent recursive simulation model to examine whether specified mechanism combinations can generate distinguishable governance trajectories within its rules. Monte Carlo simulations compare institutional scenarios, supported by analyses of uncertainty, alternative model designs, heterogeneous conditions, and a learning-agent extension. Within the simulations, high-transparency coordination generally produces the strongest governance outcomes, whereas weak governance remains consistently least favorable across the uncertainty analyses. In the model, governance improvement depends on interactions among disclosure, audit, regulation, and market feedback. In the learning-agent extension, learned policies yield less favorable governance and reporting outcomes than the fixed-policy benchmark. Chinese A-share evidence is broadly consistent with the main simulated patterns in direction, risk location, and broad ordering. These findings provide mechanism-sufficiency evidence within the declared rule family and explain how oversight signals become institutional outcomes and subsequent feedback.
1. Introduction
Accounting and corporate governance research treats corporate disclosure and financial accounting information as central information mechanisms for reducing information asymmetry, supporting oversight, and enabling contracting [1]. In listed companies’ financial reporting system, periodic reports institutionalize the presentation of operating results, accounting judgments, and external assurance to investors, auditors, boards, regulators, and other outside parties. Financial reporting oversight therefore follows the process through which reported numbers are produced. Managers make judgments about revenue recognition, expense timing, and disclosure under performance pressure and capital market evaluation. CFOs consider operating pressure, accounting standards, professional responsibility, and audit communication when preparing financial reports. External auditors then assess misstatement risk from procedures, evidence, and professional judgment. Accountability from boards and audit committees, enforcement by regulators, and price and reputation responses from capital markets change the pressure, information conditions, and expected costs that firms face in the next reporting cycle.
For this reason, financial reporting oversight is difficult to explain with one governance variable. Agency theory treats the firm as a nexus of contracts and explains how conflicts of interest and information asymmetry among managers, shareholders, and other stakeholders create agency costs [2,3]. Transaction cost economics further shows why governance arrangements are needed to constrain opportunism in contractual relations [4]. In accounting, disclosure transmits information to the market. Under information asymmetry, it also triggers repeated adjustments among managers, auditors, regulators, and investors [1,5]. Earnings management, disclosure quality, audit risk, and regulatory response are states formed through reporting discretion, external detection, and subsequent feedback; their changes reflect repeated interactions among multiple actors.
Existing corporate governance and financial reporting research has developed systematic evidence on several key questions. Empirical studies identify relations between governance variables and corporate behavior; event studies examine regulatory shocks; and dynamic panels, structural models, and textual-disclosure studies handle different forms of data and identification. Building on these approaches, the present study focuses on a question that is difficult to unfold in conventional empirical designs: when managerial reporting, audit judgment, regulatory response, and market trust are mutually connected, how do governance states develop across consecutive disclosure windows? If the analysis remains at the level of average relations among observable variables, the transmission of audit findings, the delay in regulatory response, and the feedback from market trust to reporting behavior can be compressed into correlations among outcomes.
A recursive simulation model is useful for this complementary task. The effect of higher audit quality on governance outcomes depends on whether audit findings reach the board, trigger regulatory attention, and affect market trust. Regulatory intensity works in a similar way. Higher expected penalties change the cost of violation, but weak disclosure or a long delay between risk recognition and enforcement can weaken this effect. In this paper, the recursive model organizes mechanisms and generates paths: it places these intertemporal relations in one transparent set of rules and tests whether a given mechanism combination can produce theoretically interpretable path differences.
Research on complex systems and governance simulation provides a methodological reference for this treatment. Wu et al. study financial fraud and audit supervision by specifying listed companies, accounting firms, and audit regulators as three parties, setting out actors, strategies, and parameters, and then conducting numerical simulation through an evolutionary game model [6]. Studies on dynamic regulation and collaborative governance often follow a similar path: they define a governance problem, specify participants and parameters, construct a model, and use model analysis to discuss governance implications [7,8]. This paper follows the move from a governance problem to a computational model. Its public recursive equations test whether disclosure quality, audit risk, regulatory intervention, and market trust can move together in an interpretable way.
This paper asks how governance roles, institutional constraints, and information feedback can be translated into auditable recursive state-update rules. It then asks how those rules can compare governance paths under different institutional combinations. The model brings management pressure, CFO prudence, audit detection, board oversight, regulatory intervention, and market feedback into one computational framework. It examines how information observability, feedback speed, detection capacity, and market trust jointly enter opportunistic reporting, risk recognition, and tail-risk exposure. Each output remains traceable to prior states and institutional parameters. The design tests, within the specified rule family, whether theoretical mechanisms can generate interpretable path differences and tail-risk patterns.
I address two research questions:
RQ1: How can financial reporting oversight be formalized as a recursive state-update model in which reporting states, regulatory feedback, market trust, and governance quality can be traced in one framework?
RQ2: Under different institutional combinations, how do audit quality, regulatory intensity, information transparency, governance delay, and market feedback change governance paths, outcome-only governance indices, and tail-risk patterns?
To assess the design dependence of the model findings, I examine simultaneous parameter uncertainty, structural variants covering update schedules, nonlinear response, and boundary treatment, a heterogeneity stress test across firm, audit, and regulatory conditions, and the learning-agent extension. I then use independent Chinese A-share evidence for an external pattern-consistency assessment of the principal directions and broad orderings.
I contribute to systems modeling research on financial reporting oversight. I develop an integrated framework that connects reporting discretion, internal monitoring, audit detection, regulatory response, market trust, and governance delay in a recursive oversight chain. The framework brings mechanisms operating at different analytical levels into a common intertemporal structure, traces related state changes across reporting windows, and compares how institutional combinations alter governance paths, governance indices, and tail risk.
The rest of this paper follows this logic. Section 2 reviews the literature, and Section 3 presents the model. Section 4 and Section 5 describe the simulation experiment design and primary results, respectively. Section 6 reports the robustness analysis and external pattern-consistency assessment. Section 7 discusses the findings, and Section 8 concludes.
2. Literature Review
Financial reporting oversight develops through agency conflict, disclosure, audit judgment, regulatory feedback, and market trust. This section first reviews governance and accounting research on information asymmetry, managerial discretion, and external feedback. It then reviews computational and system-dynamics research on multi-actor interaction, delay, nonlinear paths, and transparent reporting.
2.1. Agency Conflict, Reporting Oversight, and Feedback Mechanisms
Agency theory provides a core foundation for corporate governance research. It argues that when principals and agents have divergent objectives and agent behavior is not fully observable, monitoring costs, bonding costs, and residual loss jointly form agency costs [2]. Eisenhardt further emphasizes that goal conflict, outcome uncertainty, risk preference differences, and information system quality affect whether organizations choose behavior-oriented or outcome-oriented control mechanisms [3]. From this perspective, corporate governance involves multiple actors. Managers, shareholders, auditors, and regulators differ in objectives, information, and monitoring costs. Managers may be more sensitive to short-term performance, reputation, or compensation evaluation. Shareholders focus more on firm value and investment returns. Auditors and regulators emphasize risk identification, compliance boundaries, and public responsibility.
Corporate governance mechanisms turn the agency problem into concrete institutional and organizational arrangements. Shleifer and Vishny define the governance problem as the question of how investors can ensure that managers return the profits on their investment, and they emphasize legal protection, ownership concentration, board monitoring, and incentive contracts as mechanisms that restrict managerial discretion [9]. Williamson explains from a transaction cost perspective that internal power allocation, asset control, and contractual arrangements affect incentives and coordination among actors [4]. This line of work identifies legal protection, board monitoring, contractual incentives, and internal power allocation as connected oversight mechanisms. Together, they shape managerial discretion, monitoring intensity, and coordination costs among governance actors.
Information asymmetry links corporate governance to financial reporting oversight. Healy and Palepu show that corporate disclosure is shaped by capital market transactions, control contests, stock-based incentives, litigation costs, managerial talent signaling, and proprietary costs [1]. Armstrong et al. explain that different contracting parties have systematically different information needs, and that financial reporting supports board monitoring, shareholder evaluation, and debt contracting [5]. Disclosure is a published output. It also serves as an information channel connecting managers, boards, shareholders, creditors, auditors, and regulators. Disclosure quality changes what outside actors can observe and affects later monitoring, pricing, and compliance pressure.
Earnings quality research connects reporting quality, audit risk, and regulatory attention. Dechow et al. argue that earnings quality is affected by fundamentals, managerial incentives, accounting standards, internal control, and external monitoring, and that its consequences appear in capital market pricing, audit judgment, and regulatory attention [10]. Earnings management, disclosure quality, audit risk, regulatory inquiries, and market responses belong to the same oversight chain. Managerial reporting incentives may affect earnings quality, audit procedures and board oversight shape risk detection, and regulatory intervention and market trust may influence later disclosure choices. The links among disclosure, audit, regulation, and market response are intertemporal and operate through a sequence of reporting outcomes and oversight steps.
2.2. Computational Simulation, Recursive Feedback, and Transparent Modeling
These intertemporal links place financial-reporting oversight in a dynamic system setting. Static associations alone have difficulty capturing the relevant feedback and delay. Computational simulation offers a methodological basis for studying multi-actor interaction and feedback in complex organizations. Agent-based modeling represents a system as a set of agents with heterogeneous attributes, local information, and autonomous decision rules, and then observes system-level emergent outcomes through repeated interactions among agents [11]. Simulation modeling in organization and management research emphasizes that when a research object is composed of multiple interdependent processes with feedback, nonlinearity, and relations that are difficult to solve analytically, computational simulation can complement deductive modeling and empirical induction [12]. This literature places organizational behavior within repeated interaction and rule-based generation, making it possible to analyze system-level outcomes when multiple actors, feedback, and nonlinearity operate together.
Multi-agent organization design and institutional agency research further show that roles, rules, and institutional effects can be formalized for analysis. Multi-agent organization design research indicates that explicitly modeling organizational roles, capabilities, goal decomposition, and social strategies helps capture runtime coordination while retaining agent autonomy [13]. Institutional agency research also shows that the institutional consequences of an action depend on how rules classify behavior as effective, compliant, or noncompliant [14]. Role differentiation, rule constraints, and compliance judgments therefore structure the modeled institutional environment.
Economic and financial ABM research also uses computational models for mechanism generation and comparison of institutional scenarios. Axtell and Farmer summarize applications of ABM in markets, macroeconomics, finance, and policy design, emphasizing the value of heterogeneous agents and bottom-up modeling for explaining complex systems [15]. Dawid and Neugart view ABM as a tool for economic policy design, arguing that simulation models can compare short-term and long-term effects under alternative institutional settings [16]. Such work provides methodological guidance for comparing institutional combinations, feedback mechanisms, and dynamic paths, while keeping simulation results distinct from direct empirical causal estimates.
Recursive feedback and delay are closely related to the system dynamics tradition. Sterman argues that many counterintuitive outcomes in complex systems come from feedback loops, delays, nonlinearities, and accumulation processes [17]. In financial reporting oversight, earnings management, disclosure quality, audit risk, regulatory attention, and market trust may also change through intertemporal feedback. Threshold models and social dynamics models further show that individual-level behavior can generate system-level diffusion, turning points, or lock-in under specific threshold conditions [18,19]. These studies motivate trajectory analysis. In the present model, common-initial-state diagnostics separate initialization effects from changes generated by recursive updating.
Computational models also require transparent reporting and reproducibility. The ODD protocol stresses that agent-based models should state the model purpose, entities, state variables, process overview, scheduling, initialization, input data, and submodels [20]. Railsback and Grimm also emphasize that simulation models should allow readers to understand what the model does, why it is specified that way, and how it can be rerun [21]. Henderson et al. show in deep reinforcement learning experiments that random seeds, environment implementations, hyperparameters, and reporting standards can materially affect conclusions [22]. The credibility of computational evidence depends on model assumptions and on whether the model purpose, state variables, scheduling, initialization, randomness, implementation environment, and reporting standards are reviewable.
Algorithmic governance and generative-agent research extend the modeling frontier while raising transparency and calibration concerns. Algorithmic control can embed restriction, recommendation, recording, rating, replacement, and reward into organizational processes [23]. Machine-learning opacity may arise from organizational secrecy, technical barriers to understanding, and high-dimensional optimization [24], while algorithmic deployment can produce disparate impacts through data, proxies, and application contexts [25]. LLM-enabled ABM and LLM-based multi-agent systems can expand the representation of organizational interaction [26,27]. Surveys of autonomous agents and generative-agent studies further show how language, memory, planning, and reflection may enter simulation settings [28,29], but these richer representations still face role stability, prompt dependence, drift across simulation rounds, and empirical calibration problems.
Research on model credibility treats calibration, verification, validation, and uncertainty analysis as related but distinct tasks [30,31,32]. Calibration uses observed data to estimate or constrain model parameters; verification checks whether a model is implemented as intended; validation evaluates its correspondence with a target system; and uncertainty analysis examines how inputs and assumptions affect model outputs. Global sensitivity analysis links output variation to declared inputs and assumptions [33]. Latin hypercube sampling (LHS) provides a multidimensional sampling design, while convergence can be assessed across sample sizes [34]; the partial rank correlation coefficient (PRCC) summarizes nonlinear but monotonic input–output relations [35]. Logistic response functions provide smooth, monotonic transition mappings [36]. Taken together, this literature indicates that credibility assessment should distinguish implementation accuracy, correspondence with the target system, and design dependence; functional forms also require explicit justification.
Taken together, financial reporting oversight includes reporting, audit, and accountability links in the accounting–governance chain, together with recursive feedback, delay, and path-generation features. Research on financial accounting information and the reporting environment explains how reporting information mediates corporate governance and capital-market feedback [37,38]. Studies of earnings management, audit committees, and audit quality define the roles of opportunistic reporting, internal monitoring, and external assurance [39,40,41], while reviews of audit quality and archival auditing evidence clarify the evidentiary boundary of audit oversight [42,43]. Related systems and digital research further extends this governance setting through information-systems quality, financial reporting, artificial intelligence, digital transformation, audit pricing, dual agency problems, and industry-specialist audits [44,45,46]. These studies place disclosure quality, earnings management, audit quality, regulatory attention, and market response at distinct analytical levels. The literature remains relatively limited in placing managerial reporting incentives, audit detection, regulatory feedback, market trust, and feedback delay within a single transparent, recursively updated rule set that traces how governance paths emerge and how institutional combinations alter them. The framework developed here is therefore an ABM-inspired recursive simulation model for organizing mechanism relations, generating interpretable paths, and comparing institutional combinations. It provides stylized mechanism-sufficiency evidence within the specified rule set; empirical estimation of real firms, audit opinions, and regulatory policy effects lies outside the present design.
3. Model and Methods: Recursive Simulation Model Specification
This section specifies the recursive simulation model and provides the modeling basis for the institutional comparisons. Section 3.1 maps governance actors to model channels and defines the model scope. Section 3.2 states the rule assumptions and mechanism directions; Section 3.3 defines variables, parameters, and initialization; and Section 3.4 presents the recursive state-update equations and reporting-window adjustments.
3.1. Governance Actors and Model Scope
The model translates real governance roles into computable rule terms. Managers, CFOs, external auditors, boards or audit committees, regulators, and capital markets provide reporting pressure, prudence, detection capability, internal monitoring, external intervention, and feedback signals. These roles anchor the institutional parameters, state variables, and recursive rules in the responsibilities, constraints, and feedback relations of financial reporting oversight. Table 1 makes this correspondence explicit by linking each governance role to its model representation, main parameter or state, and feedback path.
Table 1.
Governance-role mapping and feedback paths in the recursive simulation model.
The recursive simulation model comprises five linked components: governance-role mapping, institutional-background parameterization, governance pathways, recursive state updating, and comparable outputs. Governance-role mapping defines the actors and channels, institutional-background parameterization sets the rule conditions, and governance pathways and recursive state updating generate sequences of states. Comparable outputs report GQ, OOG, tail risk, and path stability. Scenario rankings compare institutional combinations, and the governance chain provides the basis for interpreting differences in model outputs.
Institutional constraints enter through formal rule settings and governance feedback. Laws, accounting standards, and mandatory disclosure requirements define the financial reporting oversight setting and are represented by scenario parameters, reporting-window weights, and state clipping. Board accountability, reputational pressure, prudence requirements, and market evaluation shape expected costs and feedback strength in the state updates. Governance delay, denoted by , represents the composite lag in information acquisition, information processing, and institutional enforcement. DQ, RI, MT, and PR represent the dynamic information structure: disclosure quality changes externally observable information, regulatory intervention changes expectations about institutional response, market trust reflects capital-market feedback, and perceived risk records accumulated cross-period feedback from audit and regulatory pressure.
Figure 1 summarizes the feedback relations represented by the recursive equations in Section 3.4. Role pressures and institutional constraints enter reporting states such as EM, DQ, and AR; these states then affect regulatory intervention, perceived risk, and market trust. Regulatory intervention, market trust, and the perceived-risk updating score feed back into later opportunistic reporting. In the figure, EM denotes earnings management, DQ disclosure quality, AR audit risk, RI regulatory intervention, PR perceived risk, MT market trust, GQ the embedded governance quality index, OOG the outcome-only governance index, and governance delay. The arrows represent the information, audit, regulatory, and market-feedback directions specified in the model rules.
Figure 1.
Feedback loop in the recursive governance model. Colored boxes distinguish the model components, solid arrows indicate the directions of model-rule information and feedback flows, and white labels identify the corresponding flows.
3.2. Model Assumptions and Mechanism Specification
The model uses five rule assumptions. First, baseline scenario parameters and state variables are standardized to the interval from 0 to 1; governance delay is an integer lag, while reporting-window intensity weights may exceed 1 and are converted into effective parameters in Section 3.4. Second, management pressure and lower market trust increase earnings-management tendency, whereas audit detection, regulatory intensity, board oversight, information transparency, and perceived risk restrain it. Third, disclosure quality rises with information transparency, CFO prudence, board oversight, and regulatory intervention, and falls with earnings management. Fourth, earnings management and low disclosure quality increase audit risk, while audit quality, audit detection, and board oversight reduce it. Fifth, regulatory intervention and market trust serve as feedback variables: regulatory intervention responds to risk and governance delay, and market trust responds to disclosure quality, audit risk, and earnings management.
The rules encode role relations, institutional constraints, and feedback directions in traceable computational form, allowing governance states to be compared across parameter combinations.
3.3. Variables, Parameters, and Initialization
Table 2 lists the state variables, derived indices, and institutional parameters used in the recursive system. This subsection then specifies the clipping function and initial-state generation rule, which provide the basis for the state-update equations in Section 3.4 and the scenario design in Section 4.1.
Table 2.
State variables, governance indices, and institutional parameters.
All state updates use the clipping function:
This function keeps standardized state variables between 0 and 1. Each Monte Carlo run first generates an initial state:
The model records simulation outputs from period 1. The initial state is determined by scenario parameters, with independent Gaussian disturbances entering EM, DQ, AR, and RI. For each initial-state variable , denotes the intercept, denotes the signed coefficient on input , and denotes the disturbance standard deviation. Bold symbols in Supplementary Table S1 collect the corresponding coefficients in equation order.
The disturbances are distributed as follows:
The choice of initialization may affect the early simulated trajectory and its interpretation because defines the starting point for all subsequent state updates. Differences in may affect early-window state levels, whether an event is already present at , whether a new event occurs after recursive updating begins, and first-event timing. In the equations above, scenario parameters enter before the first recursive update; independent Gaussian disturbances introduce variation in across Monte Carlo replications. Early-window contrasts may therefore reflect both initial-state differences and differences generated by the recursive scenario rules.
To assess the sensitivity of simulated outcomes to initialization, the numerical experiment compares three initialization regimes. First, scenario-conditioned initialization uses the equations above and the parameters assigned to each scenario to generate a run-specific , preserving the model’s scenario-specific starting states. Second, common-moderate initialization draws one from the moderate-baseline initialization rule for each paired replication and assigns it to all seven scenarios, providing the primary initialization-controlled comparison. Third, fixed-midpoint initialization assigns to all seven scenarios and provides the robustness bound. Section 5.3 specifies the paired-replication procedure, shared environmental-shock streams, and recorded measures. Empirical estimation of initial states requires mappings between model constructs and observable measures together with firm–period data [30,31].
3.4. Recursive State-Update Equations
For periods , the model uses delayed audit risk and delayed earnings management to represent governance feedback delay. Let and denote the available delayed values. When history is long enough, the model uses and ; otherwise, it uses the earliest available value or the initial state. A larger denotes slower governance feedback.
Within each period, states are updated in the order , , , , , and then . To incorporate reporting-window heterogeneity, the disclosure, audit, regulation, and market-feedback weights are first converted into effective parameters:
Here, , , , and are the disclosure, audit, regulation, and market-feedback intensity weights for reporting window . Effective parameters are clipped before entering the current-period update rules; the reporting-window mapping and baseline scenario parameters are introduced below.
The model then computes audit detection pressure, institutional pressure, market feedback strength, a perceived-risk updating score, and opportunistic reporting tendency. The remaining equations use a common parameter notation: denotes the weight on input in composite term ; and denote the intercept and signed input coefficients for state equation ; denotes the prior-state share, with as the target share; and denotes the recursive disturbance standard deviation. Bold symbols in Supplementary Table S1 collect these parameters in equation order.
The target and actual update of earnings management are:
The disturbance is distributed as:
Management pressure, insufficient prudence, and low market trust increase opportunistic tendency, while institutional pressure and the perceived-risk updating score restrain earnings management.
The target and actual update of disclosure quality are:
The disturbance is distributed as:
Information transparency, CFO prudence, board oversight, and regulatory intervention improve disclosure quality, whereas current earnings management reduces it.
The target and actual update of audit risk are:
The disturbance is distributed as:
Earnings management and low disclosure quality increase audit risk, whereas audit detection pressure and board oversight reduce it.
Regulatory intervention uses a nonlinear risk-response function, defined as:
In the regulatory-response rule, denotes the audit-risk response center, denotes response steepness, and denotes the earnings-management activation threshold. Let , where and . This term scales governance delay from zero to one. The target and actual updates are:
The disturbance is distributed as:
The nonlinear term strengthens regulatory intervention as audit risk increases. Governance delay slows the transmission of risk information through the feedback chain and lowers the current-period regulatory response target.
Smooth-transition research supports the logistic distribution as a common smooth S-shaped transition function and uses a semiparametric alternative to examine functional-form uncertainty [36]. Supplementary Table S1 reports the main-specification response center, response slope, and earnings-management activation threshold.
The target and actual update of market trust are:
The disturbance is distributed as:
Market trust increases with disclosure quality, transparency, and board oversight, and decreases with audit risk and earnings management.
Embedded governance quality and perceived risk are updated as:
Because contains both outcome states and institutional parameters, it is defined as an embedded mechanism index. To distinguish institutional settings from purely outcome-based readings, this paper also reports an outcome-only governance index:
Let , , and denote the earnings-management, audit-risk, and disclosure-quality thresholds for the diagnostic joint event, respectively. The binary indicator is:
The thresholds , , and define the diagnostic joint event in simulated trajectories: high earnings management and high audit risk coincide with low disclosure quality. Supplementary Table S1 reports the three threshold values used to classify model-generated states.
Research on accrual-based earnings-management proxies shows that observed accrual signals may arise from prudent business decisions or manipulation [47]. Accounting-fraud detection research shows that enforcement labels and observable predictors can support empirical classification [48]. Empirical identification of EM and AR requires observable proxies and validated classification labels. The model classifies the simulated joint event using its state variables and prespecified cutoffs.
To measure adverse-state intensity continuously, the model also reports the adverse-state index:
lies in , with higher values denoting a more adverse joint reporting state within the model. I report early-window and full-trajectory summaries, together with the maximum and terminal values. ASI uses no cutoff and summarizes the severity of model-generated states through the continuous combination of EM, AR, and DQ.
The equations form a behavior–information–institution feedback chain. Management pressure and market trust shape earnings management, which then affects disclosure quality and audit risk. The regulatory-intervention rule incorporates audit risk and transparency. Regulatory intervention, market trust, and perceived risk subsequently enter the next reporting decision.
Table 3 summarizes the model specifications and bases for seven parameter classes. Audit research supports the assurance and audit-quality mechanisms [42,43]. Audit-firm research links transparency disclosures to audit quality [49]. Disclosure studies support the public-information and market-feedback channels [1,37,38]. Research finds that expanded auditor reporting conveys firm-specific information and is associated with capital-market consequences [50]. I set the direction of each relation using the mechanisms identified in these studies and the actor responsibilities defined by the regulatory framework, and I select the functional forms from the corresponding literature. The regulatory framework also defines the reporting timing and institutional contrasts represented in the model. Independent studies provide benchmarks for the direction, risk location, and broad ordering of model outcomes. Section 7.3 specifies the construct mappings, A-share firm–period panel, and held-out evaluation required for empirical calibration [30,31].
Table 3.
Model specifications and their bases by parameter class.
I set all numerical point values using three criteria: bounded state updates, relative weights consistent with the modeled mechanisms, and interpretable trajectories over the 32 reporting windows. Within the composite terms, the weights sum to one; the coefficients act as scaling parameters in the recursive equation. Normalization applies to prior-state/target adjustment shares and to composite weights explicitly defined as shares. Table 3 groups the model specifications by parameter class, Supplementary Table S1 reports their notation, ordering, baseline values, and source classification, and Section 5.3, Section 5.4, and Section 6 assess dependence on these numerical choices [33,34,35].
Table 4 reports the disclosure, audit, regulation, and market-feedback weights for the three reporting-window types. The 32 recursive windows cycle through first-quarter, semiannual, third-quarter, and annual reports, representing eight reporting years. Windows 20 and 32 are the annual-report windows for Years 5 and 8, respectively. Quarterly reports update information over short intervals, semiannual reports provide broader interim disclosure, and annual reports provide the most complete periodic disclosure and face the strongest audit requirements. The mapping follows relevant Chinese regulatory provisions [51,52,53,54,55,56], and disclosure research supports the information and market-feedback channels [1,37,38,50]. I set the cross-window intensity pattern and multipliers.
Table 4.
Reporting-window mapping and mechanism-intensity weights.
4. Simulation Experiment Design
This section describes the primary computational experiment. Scenario design defines the institutional combinations, while the Monte Carlo implementation generates traceable path distributions under the maintained specification.
4.1. Scenario Design
I use seven scenarios. The moderate baseline provides the interior computational reference. Weak governance represents a joint-failure stress case. Strong audit and strong regulation provide assurance-channel and external-response-channel contrasts, respectively. High-transparency coordination represents coordinated oversight. Reduced governance delay provides a controlled timing contrast. Audit upgrade with weak regulatory penalty represents an assurance–enforcement mismatch. Together, these scenarios examine how different configurations of financial reporting oversight shape four groups of model outcomes: accounting states (earnings management, disclosure quality, and audit risk); governance feedback states (regulatory intervention, perceived risk, and market trust); changes between the Year 5 and Year 8 annual-report windows; and full-path risk measures (tail risk, run-level event rates, and boundary diagnostics). Table 5 summarizes the design: Table 5A presents each scenario’s purpose and institutional and empirical basis, and Table 5B,C report the settings of all nine parameters.
The scenario design draws on Chinese disclosure and governance rules, the disclosure-evaluation and inquiry practices of Chinese stock exchanges, A-share cases, and empirical studies. I use disclosure and periodic-report rules, the corporate-governance code, audit requirements, and disclosure-evaluation guidance to interpret CP, AD, AQ, BO, and IT as CFO reporting prudence, audit detection, audit quality, board oversight, and information transparency, respectively [51,52,53,54,55,56]. The interpretation and direction of RG follow the 2024 capital-market policy on regulatory intensity [57]. Studies of accounting-firm gatekeeping, regulatory inspections, exchange comment letters, corporate governance, capital-market liberalization, and disclosure evaluation describe the corresponding observable phenomena in the A-share market and their expected directions [58,59,60,61,62,63,64,65]. The Kangmei case records reporting failure, audit-gatekeeping failure, and regulatory sanctions within one oversight chain [66,67]. Exchange inquiry and correction rules define the inquiry–response–correction sequence, while studies of comment-letter reply delays document variation in its timing; I therefore interpret as governance-feedback delay [55,68].
Table 5.
Scenario design and parameter settings. (Panel A) Scenario purposes, observable phenomena, and institutional and empirical bases. (Panel B) Firm-reporting, internal-oversight, and assurance parameters. (Panel C) Regulatory intensity, information transparency, governance delay, and market-feedback parameters.
I set the nine parameters for each scenario based on the observable phenomena, institutional rules, and empirical evidence described above. Relative to the moderate baseline, weak governance raises MP and and lowers the other seven parameters. Strong audit retains the baseline values of MP and , raises CP, AD, AQ, BO, and IT, and lowers RG and MF. Strong regulation lowers MP and and raises the other seven parameters, with the largest increase in RG. High-transparency coordination follows the direction of strong regulation, with larger increases in CP, AD, AQ, BO, IT, and MF. Reduced governance delay changes only . Audit upgrade with weak regulatory penalty raises CP, AD, and AQ, lowers RG and MF, and keeps MP, BO, IT, and at or near their baseline levels. The model structure remains fixed across scenarios, and the parameter settings define controlled contrasts.
4.2. Simulation Procedure
At the start of each replication, I assign a random seed using 2026 as the base seed:
Here, denotes the zero-based scenario index, and denotes the replication index. This rule assigns a unique and reproducible seed to each scenario-replication pair. The seed fixes the random stream used to generate the initial state from the Table 5 parameters and all subsequent disturbances. Each replication then spans 32 reporting windows. Quarterly, semiannual, and annual-report intensity weights enter the state-update equations in each reporting window. The model reads lagged risk, computes institutional pressure, market-feedback strength, the perceived-risk updating score, and opportunistic tendency, and updates EM, DQ, AR, RI, MT, GQ, and PR.
I apply this procedure to the seven scenarios in Table 5 (), with 200 replications per scenario (). The resulting trajectories are aggregated into summaries by reporting window and scenario.
5. Numerical Simulation Results
This section reports the primary numerical results generated by the seven scenarios and Monte Carlo procedure described in Section 4. Section 5.1 shows how the recursive framework produces the traceable numerical paths required by RQ1 and reports the governance-path dimension of RQ2 across all 32 reporting windows. Section 5.2, Section 5.3 and Section 5.4 address the remaining dimensions of RQ2 by reporting scenario governance outcomes and index rankings, tail-risk patterns across initialization regimes, and an analysis of institutional mechanisms, respectively.
5.1. Recursive Governance Paths
Using scenario-conditioned initialization, Figure 2 traces the GQ and OOG paths generated by recursive state updating for the seven scenarios over all 32 reporting windows. Figure 2a presents embedded governance quality (GQ), and Figure 2b presents the outcome-only governance index (OOG); both panels use reporting windows on the horizontal axis and index values on the vertical axis, with each line showing one scenario’s mean path across 200 runs, shaded bands showing the corresponding 95% Monte Carlo intervals, and vertical guides marking annual-report windows 4, 8, 12, 16, 20, 24, 28, and 32. Across all reporting windows, high-transparency coordination has the highest mean GQ and OOG, and weak governance has the lowest. Within-year fluctuations correspond to the reporting-window weights used in recursive updating. For GQ, three distinct scenario orderings first appear at windows 1, 8, and 17; the moderate baseline and audit upgrade with weak regulatory penalty exchange positions in several later windows. For OOG, three distinct scenario orderings first appear at windows 1, 2, and 3; the ordering observed at window 5 remains unchanged thereafter.
Figure 2.
Governance-index paths across 32 reporting windows.
5.2. Scenario Governance Outcomes and Index Rankings
After presenting the recursive governance paths, Table 6 and Table 7 report the Year 5 and Year 8 annual-report checkpoints, respectively. The two tables address the scenario-outcome and governance-index dimensions of RQ2.
Table 6.
Scenario governance outcomes at the Year 5 annual-report window. (Panel A) Governance-index means and Monte Carlo intervals. (Panel B) State-variable means.
Table 7.
Governance-index levels and rankings at the Year 8 annual-report window.
Table 6A reports GQ and OOG means and their 95% Monte Carlo intervals for the seven scenarios at the Year 5 annual-report window, based on 200 runs per scenario. High-transparency coordination ranks first on both indices (GQ = 0.8721, OOG = 0.9367), followed by strong regulation (GQ = 0.6793, OOG = 0.7691) and strong audit (GQ = 0.5081, OOG = 0.7570); weak governance ranks last (GQ = 0.1017, OOG = 0.3676). The reported intervals are narrow relative to the gaps among the three leading scenarios and between these scenarios and weak governance. The middle scenarios differ across the two indices: reduced governance delay ranks fourth on GQ (0.5004) and fifth on OOG (0.6511), compared with fifth on GQ (0.4584) and sixth on OOG (0.6495) for the moderate baseline, while audit upgrade with weak regulatory penalty ranks fourth on OOG (0.7147) but sixth on GQ (0.4536). The middle-scenario rankings vary with index composition: GQ incorporates institutional parameters and governance delay, whereas OOG aggregates DQ, MT, EM, and AR.
Table 6B reports the mean EM, DQ, AR, and MT values. High-transparency coordination combines the lowest EM (0.0197) and AR (0.0150) with the highest DQ (0.9301) and MT (0.8516), whereas weak governance exhibits the reverse profile (EM = 0.5267, AR = 0.5629, DQ = 0.3485, MT = 0.2117). Strong audit has lower AR than strong regulation (0.0800 vs. 0.1588), while strong regulation has lower EM (0.1265 vs. 0.1662), higher DQ (0.7251 vs. 0.6680), and higher MT (0.6366 vs. 0.6061). The state-variable means for the middle scenarios further explain their GQ and OOG rankings. Reduced governance delay remains close to the moderate baseline in EM (0.2519 vs. 0.2539), AR (0.2717 vs. 0.2691), and MT (0.5103 vs. 0.5110), with a modestly higher DQ (0.6179 vs. 0.6100); its larger difference from the baseline on GQ mainly reflects the governance-delay term embedded in GQ. Audit upgrade with weak regulatory penalty has lower EM and AR and higher DQ and MT than the moderate baseline. Its GQ remains slightly lower because the more favorable outcome states are offset by the lower BO and RG terms in the index; IT and governance delay remain at the baseline levels.
Table 6 shows that high-transparency coordination combines the most favorable four-state profile with the highest GQ and OOG. Strong audit has a comparatively low AR, while the two middle scenarios occupy different positions under GQ and OOG: reduced governance delay differs from the moderate baseline mainly on GQ, and audit upgrade with weak regulatory penalty has a higher OOG but a lower GQ than the baseline. At the directional level, the simulation results parallel findings from governance studies of Chinese listed firms. Corporate-governance-code reform, CSRC random inspections, and capital-market liberalization are associated with lower earnings management or higher accounting quality [59,60,64], while comment-letter studies link regulatory scrutiny to more conservative auditor reporting, better disclosure quality, and corrective responses [61,62,63].
Table 7 reports GQ and OOG levels and rankings at the Year 8 annual-report window. High-transparency coordination ranks first on both indices (GQ = 0.8732, OOG = 0.9385), followed by strong regulation (GQ = 0.6822, OOG = 0.7734) and strong audit (GQ = 0.5106, OOG = 0.7608); weak governance ranks last on both indices (GQ = 0.1025, OOG = 0.3682). The three middle scenarios occupy different positions across the two indices: reduced governance delay ranks fourth on GQ (0.5023) and fifth on OOG (0.6544), the moderate baseline ranks fifth on GQ (0.4592) and sixth on OOG (0.6512), and audit upgrade with weak regulatory penalty ranks sixth on GQ (0.4549) but fourth on OOG (0.7166). This difference follows the index definitions: GQ incorporates institutional parameters and governance delay; OOG aggregates DQ, MT, EM, and AR. The index composition explains why reduced governance delay ranks higher on GQ than on OOG and audit upgrade with weak regulatory penalty ranks higher on OOG than on GQ.
5.3. Analysis of Tail-Risk Patterns Across Initialization Regimes
Table 8 reports the analysis of the tail-risk patterns in RQ2 across the three initialization regimes defined in Section 3.3. Each regime contains 1000 paired replications covering all seven scenarios. Within each paired replication, the seven scenarios share the same environmental-shock stream; under common-moderate initialization and fixed-midpoint initialization, they also share the same initial state. This design distinguishes events present at from new events after recursive updating begins. Table 8A compares weak-governance results across the three initialization regimes, with fixed-midpoint initialization providing a robustness check; first-event timing is conditional on at least one event during windows 1–32. Table 8B reports paired weak-governance-minus-moderate-baseline differences under common-moderate initialization as the primary initialization-controlled comparison; all paired intervals are based on 10,000 replicate-clustered paired bootstrap draws.
Table 8.
Tail-risk patterns across initialization regimes. (Panel A) Weak-governance tail-risk diagnostics across initialization regimes. (Panel B) Weak governance minus the moderate baseline under common-moderate initialization.
Under weak governance, the /windows 1–32 any-event incidences are 0.429/0.325 under scenario-conditioned initialization, 0.009/0.111 under common-moderate initialization, and 0.000/0.075 under fixed-midpoint initialization. The corresponding new-event incidences after are 0.109, 0.106, and 0.075, and the mean ASI values for windows 1–32 are 0.585777, 0.578147, and 0.572889. Among replications with at least one event during windows 1–32, the mean/median first-event windows are 4.495/1, 14.288/15, and 20.293/20. Under common-moderate initialization, the paired weak-governance-minus-moderate-baseline differences are +0.111 [0.092, 0.131] for any-event incidence, +0.106 [0.087, 0.125] for a new event after , +0.241572 [0.241559, 0.241586] for mean ASI, −0.358136 [−0.358159, −0.358113] for terminal GQ, and −0.284217 [−0.284248, −0.284186] for terminal OOG. The results show that scenario-conditioned initialization concentrates weak-governance events in the earliest reporting windows. Replacing scenario-specific starting states with a common initial state lowers event incidence and delays first events. Under common-moderate initialization, weak governance retains higher any-event incidence and mean ASI, together with lower terminal GQ and OOG, than the moderate baseline. Table S2 reports the complete seven-scenario event results, mean ASI, terminal GQ, and terminal OOG.
5.4. Analysis of Institutional Mechanisms
Section 5.4 examines the mechanism-combination dimension of RQ2 through one-at-a-time mechanism sensitivity analysis, two-mechanism interaction analysis, and mechanism-contribution decomposition for high-transparency coordination.
5.4.1. One-at-a-Time Mechanism Sensitivity Analysis
Table 9 reports a one-at-a-time sensitivity analysis around the moderate baseline, with 160 runs for each setting. Table 9A presents GQ and OOG, and Table 9B presents EM, DQ, and AR; the analysis varies audit detection, regulatory intensity, information transparency, and governance delay individually. Information transparency has the widest observed GQ and OOG ranges: as IT rises from 0.35 to 0.85, GQ increases from 0.3978 to 0.5978 and OOG from 0.6055 to 0.7534; DQ increases from 0.5486 to 0.7579, while EM and AR decline from 0.2809 to 0.1926 and from 0.2948 to 0.2089. Increasing regulatory intensity from 0.35 to 0.85 raises GQ from 0.3992 to 0.5500 and OOG from 0.6236 to 0.6921, with EM and AR declining to 0.1968 and 0.2288. Higher audit detection produces the lowest reported AR value, 0.2006. Shortening governance delay from 4 to 1 raises GQ from 0.4369 to 0.5051 and OOG from 0.6480 to 0.6596. Within these local settings, information transparency and regulatory intensity produce the larger movements across both governance indices, whereas shorter governance delay is reflected mainly in GQ.
Table 9.
One-at-a-time sensitivity analysis of governance indices and state variables. (Panel A) Governance-index results. (Panel B) State-variable results.
5.4.2. Two-Mechanism Interaction Analysis
Table 10 reports extreme-corner cross-differences for two mechanism grids. Under common-moderate initialization, each grid cell contains 1000 paired replicates. The extreme-corner cross-difference subtracts the sum of the two mixed corners from the sum of the high–high and low–low corners. Table 10A shows cross-differences of −0.001490 [−0.001493, −0.001487] for GQ and −0.001938 [−0.001942, −0.001934] for OOG. Table 10B shows corresponding estimates of −0.001635 [−0.001639, −0.001631] and −0.002122 [−0.002127, −0.002117]. The absolute GQ and OOG cross-differences in Table 10B are slightly larger than those in Table 10A. All four estimates are negative, and their paired 95% intervals exclude zero, indicating slight sub-additivity in both grids. Table S3 reports the results under fixed-midpoint initialization, all adjacent-rectangle contrasts, standardized values, and shares of total corner change.
Table 10.
Two-mechanism interaction contrasts under common-moderate initialization. (Panel A) Audit quality × regulatory intensity grid. (Panel B) Regulatory intensity × information transparency grid.
5.4.3. Mechanism-Contribution Decomposition for High-Transparency Coordination
Table 11 uses exact Shapley values to decompose the terminal GQ and OOG differences between high-transparency coordination and the moderate baseline across five mechanism blocks: information transparency; audit detection and audit quality; regulatory intensity and governance delay; board oversight and CFO reporting prudence; and market feedback and management pressure. All 32 mechanism-block combinations are evaluated under common-moderate initialization with 1000 paired replicates per combination. Exact Shapley values average each block’s marginal contribution across the mechanism-block combinations and are reconstructed from all 120 addition orders. Table 11A presents terminal GQ, and Table 11B presents terminal OOG; first-rank frequency records how often each block has the largest replicate-level contribution. A block is classified as leading when its paired dominance contrasts against all alternatives exclude zero in the same direction. Table 11A shows that transparency has the largest terminal-GQ contribution, 0.129033 [0.128945, 0.129120], and ranks first in every replicate. Table 11B shows a contribution of 0.088282 [0.088064, 0.088499] for internal monitoring and CFO reporting prudence, compared with 0.087905 [0.087778, 0.088031] for transparency. The paired difference is 0.000376 [0.000282, 0.000469], and the corresponding first-rank frequencies are 62.0% and 38.0%. The leading mechanism block therefore differs between terminal GQ and terminal OOG. Table S4 reports the fixed-midpoint results, complete two-regime decomposition, context-specific marginal ranges, and efficiency and reconstruction audits.
Table 11.
Mechanism-block Shapley contributions under common-moderate initialization. (Panel A) Terminal GQ. (Panel B) Terminal OOG.
Taken together, the three analyses show that information transparency corresponds to the widest local ranges in both governance indices, both mechanism grids exhibit slight sub-additivity, and the leading mechanism block identified by the Shapley decomposition varies by outcome: transparency leads for terminal GQ, whereas internal monitoring and CFO reporting prudence lead for terminal OOG.
6. Robustness Analyses, Model Extensions, and External Pattern-Consistency Assessment
Section 6 evaluates the design dependence and external pattern consistency of the principal findings in four stages. Section 6.1 examines local parameter choices, simultaneous parameter uncertainty, update schedules, response forms, and boundary treatments. Section 6.2 reports the heterogeneity stress test across firm, audit, and regulatory conditions. Section 6.3 specifies the firm–auditor–regulator learning extension and reports its held-out and sensitivity results. Section 6.4 compares six pre-specified patterns with independent Chinese A-share evidence.
6.1. Robustness of Results to Changes in Parameters and Model Structure
This subsection examines whether the main results remain stable when parameter values, sampling designs, or model structure change. Section 6.1.1 changes selected parameters and design choices separately, Section 6.1.2 varies multiple parameters simultaneously, and Section 6.1.3 changes update schedules, response forms, and boundary treatments.
6.1.1. Robustness to Changes in Key Parameters and Design Choices
The local robustness checks change one group of parameters or design choices while leaving the remaining setup unchanged. They cover the center and slope of the regulatory-intervention response, reporting-window patterns, tail-risk thresholds, mechanism weights, simulation noise, Monte Carlo run size, and boundary contact. These checks identify which results persist under nearby alternative specifications and which vary with a particular design choice.
Table 12 summarizes the results of these checks. All nine response-shape settings preserve the complete GQ and OOG orders. Alternative reporting-window patterns preserve the full OOG order and the leading three and last GQ positions; flat weights exchange two middle GQ positions. Tail-risk incidence changes materially across threshold triples, while ASI remains continuous across all scenarios. The leading, second, and last positions also persist across the reported mechanism-weight, noise, and run-size settings. Boundary contact is concentrated in EM, AR, and DQ, whereas GQ and OOG remain inside their bounds. The main ordering is therefore stable at the top and bottom, while selected middle positions and tail-risk incidence are more sensitive to design choices.
Table 12.
Robustness under changes in key parameters and design choices.
6.1.2. Robustness Under Simultaneous Parameter Variation
When multiple parameters vary simultaneously, the GQ and OOG scenario rankings may change, and the relative strengths of factor–output associations may also shift. I use two Latin hypercube sampling (LHS) designs to assess ranking stability and identify the factors most strongly associated with output variation under simultaneous parameter uncertainty.
The common-factor design varies the scenario parameters, equation and adjustment blocks, noise scale, reporting-window channels, and tail-risk thresholds together across their specified ranges. Table S12 reports the factor families and range rules. The final design contains 4000 samples and seven scenarios, with four common-random-number replications for each sample–scenario combination.
The scenario-specific design includes shared factors and scenario-local factors for each scenario. For each scenario, I calculate the partial rank correlation coefficient (PRCC) for each included factor while controlling for the other shared and scenario-local factors in that scenario’s factor set. The design uses 4000 samples and four replications for each sample–scenario combination. Each PRCC describes the direction and strength of a conditional monotonic association within the declared uncertainty ranges and sampling design [33,34,35].
Table 13 compares each sampled scenario ranking with the reference ranking in Table 7. Mean Spearman ρ and mean Kendall τ measure rank similarity; values closer to one indicate greater agreement. Exact seven-scenario order retention requires every scenario to remain in its reference position, whereas first- and last-place retention evaluate the two endpoints separately. In both LHS designs, high-transparency coordination remains first and weak governance remains last in every GQ and OOG draw. Exact-order retention ranges from 17.1% to 92.0%, with lower rates under scenario-specific uncertainty. These results locate the greater sensitivity in the middle of the ranking. The convergence analysis supports using the 4000-sample common-factor design as the PRCC reference; Table S13 reports the complete results and comparison rules.
Table 13.
Stability of GQ and OOG scenario rankings under simultaneous parameter variation.
Table 14 summarizes five selected scenario–output pairs from the common-factor PRCC analysis: GQ, OOG, EM, and AR under the moderate baseline, and the tail-risk observation rate under weak governance. For each pair, the table reports the five factors with the largest absolute PRCCs. The first four pairs cover the two governance indices and two adverse reporting states in the reference scenario; the fifth represents tail-risk variation, which is concentrated under weak governance in the common-factor design. In the moderate baseline, higher opportunism and management pressure are associated with higher EM and AR and lower GQ and OOG. Higher information transparency and regulatory intensity are associated with higher GQ; the institutional-pressure coefficient scale and information transparency are associated with higher OOG. The institutional-pressure coefficient scale, regulatory intensity, and CFO reporting prudence are associated with lower EM, while the institutional-pressure coefficient scale, reporting-window audit-weight scale, and audit quality are associated with lower AR. Under weak governance, the five factors most strongly associated with the tail-risk observation rate are the opportunism coefficient scale, management pressure, the EM tail-risk threshold, the simulation-noise scale, and the institutional-pressure coefficient scale, in descending order of absolute PRCC. In addition, to examine sensitivity patterns after incorporating scenario-local factors, I report the leading scenario-specific PRCCs for GQ and OOG across different scenarios in Table S14.
Table 14.
Leading sensitivities for selected scenario–output pairs in the common-factor PRCC analysis.
6.1.3. Robustness Under Changes in Model Structure
Changes in update scheduling or response form may alter the GQ and OOG scenario rankings. Replacing hard clipping with a soft boundary or removing state clipping may also move simulated states outside their admissible range. I use a structure-only design and a joint structure–parameter design to assess scenario-order stability and the resulting state ranges.
The structure-only design compares multiple structural variants, with 200 runs per scenario for each variant. The baseline combines sequential updating, linear targets except for the specified regulatory-intervention logistic term, and hard clipping. The alternatives comprise synchronous updating, an audit/enforcement-first schedule, a fixed-seed random schedule, nonlinear logistic targets, a soft logistic boundary, and a no-state-clipping diagnostic. Table 15 compares each variant with the reference order in Table 7 using Spearman ρ and Kendall τ. Exact-order retention requires all scenario positions to match the reference. The alternative update schedules and the no-state-clipping diagnostic preserve the complete GQ and OOG orders. Nonlinear logistic targets alter some middle GQ positions, while the soft logistic boundary alters some middle positions for both indices. All variants retain high-transparency coordination first and weak governance last.
Table 15.
Scenario-order stability across structure-only variants.
In the joint structure–parameter design, I cross 1000 samples from the scenario-specific LHS with the baseline structure and the response-form and boundary-treatment variants. Each sample–structure–scenario combination uses four common-random-number replications. I use the mean terminal values across the four replications to form the GQ and OOG scenario rankings for each sample–structure combination. Table 16 compares these rankings with the reference order in Table 7 and reports, for each structure, the mean Spearman ρ, mean Kendall τ, and exact-order retention across the 1000 samples. Exact-order retention ranges from 1.2% to 18.7%, and the last-place scenario is retained in 100.0% of samples in every case. Under the soft logistic boundary, strong regulation ranks first in two of the 1000 GQ rankings, giving high-transparency coordination a 99.8% first-place retention rate; first-place retention is 100.0% in all other cases. The ranking changes are concentrated in the middle positions. In addition, the no-state-clipping diagnostic retains the first- and last-place scenarios in both the structure-only and joint designs and produces standardized state values outside the admissible [0, 1] range, supporting hard clipping in the baseline structure.
Table 16.
Scenario-order stability under joint structure–parameter uncertainty.
6.2. Heterogeneity Stress Test Across Firm, Audit, and Regulatory Conditions
To examine how governance indices and risk outcomes vary across firm, audit, and regulatory conditions and how these conditions interact, I conduct a heterogeneity stress test. The test uses a balanced 3 × 2 × 2 heterogeneity design that crosses three firm types, two audit environments, and two regulatory environments, yielding 12 cells with 200 runs per cell. Weak, baseline, and strong firms use high/median/low management pressure and low/median/high CFO reporting prudence, board oversight, information transparency, and market feedback, respectively; these levels are drawn from the seven scenarios. The audit environments set both audit detection and audit quality at low or high levels. The regulatory environments use weak regulation/long delay or strong regulation/short delay. Continuous outcomes use 95% intervals from 10,000 stratified nonparametric bootstrap draws. Tail-risk level rates use Wilson intervals, and tail-risk differences use the stratified bootstrap. These intervals characterize Monte Carlo variation in the balanced heterogeneity design.
Table 17 reports adjacent-level contrasts in governance indices and risk outcomes across the balanced heterogeneity design; Table S15 reports the complete factor-level means. The factor-level means show that strong firms have higher GQ, OOG, DQ, and MT and lower EM and AR than weak firms. AR is lower in high-audit than low-audit environments (0.1120 versus 0.3464); compared with weak-regulation/long-delay environments, strong-regulation/short-delay environments have higher GQ and lower EM and AR. Across the four adjacent-level contrasts, GQ and OOG increase and AR decreases, with 95% intervals for all three continuous outcomes excluding zero. The any-tail-risk rate decreases from weak to baseline firms, from low to high audit environments, and from weak-regulation/long-delay to strong-regulation/short-delay environments; the baseline-to-strong firm contrast is zero.
Table 17.
Adjacent-level contrasts in governance indices and risk outcomes. (Panel A) Governance indices. (Panel B) Risk outcomes.
Table 18 reports the firm × audit, firm × regulation, and audit × regulation two-way interaction contrasts, together with the firm × audit × regulation three-way contrast at the extreme levels. The three two-way contrasts examine whether the firm contrast changes across audit environments, whether the firm contrast changes across regulatory environments, and whether the audit contrast changes across regulatory environments, respectively; the three-way contrast examines whether a two-way interaction changes with the third condition. Across the three two-way contrasts, GQ and OOG are negative, indicating smaller governance improvements when the other condition is already at its stronger level; AR and the any-tail-risk rate are positive. At the extreme levels, the three-way contrast is negative for GQ and OOG, positive for AR, and negative for the any-tail-risk rate.
Table 18.
Interaction contrasts among firm, audit, and regulatory conditions. (Panel A) Governance indices. (Panel B) Risk outcomes.
6.3. Firm–Auditor–Regulator Learning Extension
To examine how role-specific adaptation changes the recursive oversight process, I introduce one firm/CFO agent, one auditor agent, and one regulator agent into each firm–audit–regulation cell and retain the recursive environment defined in Section 3. At the start of each reporting window, the agents observe the pre-decision state and choose actions simultaneously. Their actions adjust CFO reporting prudence, audit detection, and regulatory intensity for the current window. The recursive equations then update the model states and generate rewards, and each agent uses its reward and next observation to update the action values for the following decision.
Each agent receives three binary signals, yielding eight observation states. The firm observes high EM, high RI, and low MT; the auditor observes low DQ, high AR, and annual-report status; and the regulator observes high delayed EM, high delayed AR, and low current DQ. The firm chooses aggressive or integrity-oriented reporting, the auditor chooses low or high audit effort, and the regulator chooses low or high enforcement intensity. The higher action increases the corresponding current-window input, and the lower action decreases it within the standardized range. Fixed role-specific multipliers introduce stable within-cell variation across training and evaluation.
Each role uses a separate finite-state tabular Q-learning rule [69]. Held-out frozen-policy evaluation fixes the learned action values during evaluation. Role-specific rewards connect the agents’ objectives to the recursive states: the firm reward assigns positive weights to EM and MT and negative weights to RI and AR; the auditor reward emphasizes lower AR and higher DQ; and the regulator reward combines OOG with a tail-risk penalty. Each higher action carries an effort cost. I set the observation cutoffs, action scale, trait distribution, and reward weights to represent these incentives. The complete observation encoding and cutoffs, action mappings, Q-learning update and parameters, and reward functions are reported in the learning model specification in the Supplementary Materials.
The experiment retains the same 12 cells, with 200 replications per cell. Each replication compares the fixed baseline, random policy, and learned greedy policy under shared initial states and environmental shocks; training precedes held-out frozen-policy evaluation. Learning robustness is assessed through an LHS over the registered learning factors and alternative training lengths. The factors cover role-specific learning rates, discounting, exploration, action amplitude, effort cost, stable-trait variation, and reward weights; the complete experimental settings and declared ranges are reported with Table S16 in the Supplementary Materials.
Table 19 reports fixed-baseline outcome levels in Table 19A and paired differences between the learned greedy policy and the fixed baseline in Table 19B. Under the fixed baseline, mean GQ, OOG, EM, AR, and the any-tail-risk rate are 0.5075, 0.6876, 0.2258, 0.2292, and 0.0329, respectively. Relative to this baseline, the paired differences for the learned greedy policy are −0.0326 for GQ, −0.0292 for OOG, +0.0293 for EM, +0.0277 for AR, and +0.0179 for the any-tail-risk rate. These paired contrasts show that the simulation model can represent the joint effects of role adaptation on governance indices and risk within the recursive oversight process. Moreover, sensitivity analysis shows that the negative GQ and OOG contrasts persist in more than 96% of LHS draws and across all training lengths, whereas the contrast in the any-tail-risk rate is more sensitive to learning specifications, indicating that the model’s GQ and OOG result directions are robust under the tested settings (Table S17).
Table 19.
Fixed-baseline outcomes and paired policy contrasts in the firm–auditor–regulator learning experiment. (Panel A) Fixed-baseline outcomes. (Panel B) Learned greedy policy minus fixed baseline.
6.4. External Pattern-Consistency Assessment
The preceding analyses examine the robustness of the main results to parameter and model-structure changes and extend the analysis to heterogeneity across firm, audit, and regulatory conditions and to firm–auditor–regulator learning. To assess external relevance, I conduct a structured assessment of the principal model patterns using multi-source evidence. The regulatory framework [51,52,53,54,55,56,57,58] provides institutional anchoring by defining institutional roles and observable proxies; the empirical literature [59,60,61,62,63,64] provides patterns for comparison. I specified the comparison patterns before examining the extension results. The assessment covers cross-scenario or mechanism-level relations at three levels: direction, adverse-state location, and broad ordering. Institutional scenarios define model inputs and experimental contrasts; the moderate baseline serves as the comparator, and stronger regulation and shorter governance delay are grouped under the “Stronger/faster regulation” pattern. For each comparison pattern, I identify the corresponding simulation result and supporting table, compare the result with the empirical pattern reported in the literature, and classify the correspondence as matched, partially matched, not matched, or evidence insufficient. The assessment uses qualitative and ordinal comparison based on the cited regulatory and empirical evidence.
Table 20 reports the external pattern-consistency assessment results. Coordinated mechanisms match at the broad-ordering level; stronger audit, stronger or faster regulation, and transparency/observability match directionally; and weak-setting risk concentration matches at the adverse-state-location level. The “Audit upgrade with weak penalty” pattern is partially matched because the empirical literature supports the auditor-response direction, while the exact separation between OOG and GQ remains unidentified. The regulatory framework provides institutional anchoring for the model constructs, and the literature comparison indicates varying degrees of external consistency in direction, adverse-state location, and broad ordering. These results strengthen the external relevance and credibility of the simulation model developed in this study for the governance patterns examined here.
Table 20.
External pattern-consistency assessment results.
7. Discussion
7.1. Theoretical Implications
Financial reporting research often examines managerial reporting incentives, audit detection, board oversight, enforcement, disclosure, and market response through distinct analytical lenses. The present model places these mechanisms in one intertemporal structure and treats governance quality as an emergent property of their connections. Reporting incentives shape EM; audit and board oversight influence detection; regulation and disclosure convert detected risk into correction and visible consequences; and market trust enters subsequent reporting incentives. The theoretical contribution lies in specifying how these channels form a feedback system whose behavior depends on their alignment.
The GQ, OOG, and initialization analyses jointly show that financial reporting oversight depends on the institutional conversion of detected risk and the path of state evolution, while fine-grained rankings remain sensitive to measurement design. OOG summarizes outcome states, whereas GQ also incorporates the institutional channels that generate them. Audit upgrade with weak regulatory penalty improves AR and OOG without a parallel GQ-rank improvement, indicating that detection produces a broader governance change after effective institutional conversion. The broad top and bottom positions persist across parameter and structural analyses, while middle ranks remain more sensitive to index construction and boundary treatment (Table 7, Table 13, Table 14, Table 15 and Table 16). Initialization analysis sharpens the temporal interpretation: scenario-conditioned states explain much of the early weak-governance risk, while common states and shocks preserve a later adverse difference (Table 8). The model therefore distinguishes inherited starting conditions from differences generated through recursive updating.
Mechanism effects vary across mechanism combinations, outcome measures, and governance settings. The two-mechanism cross-differences show slight sub-additivity, linking joint improvement to diminishing incremental gains within the specified design (Table 10). Exact Shapley values identify transparency as the leading contribution to terminal GQ and the internal-monitoring-and-CFO-prudence block as the leading contribution to terminal OOG (Table 11). The heterogeneity design extends this conditional account across constructed firm, audit, and regulatory environments: audit and regulatory improvements are larger in weaker settings and smaller where firm governance is already strong (Table 17 and Table 18). This pattern aligns with documented variation across information, ownership, misstatement-risk, and agency-cost settings [59,60,63,64]. Together, the results position oversight effects within the surrounding institutional configuration.
The learning-agent extension shows that role-specific adaptation under local diagnostic rewards can produce adverse system-level outcomes. When the firm/CFO, auditor, and regulator adjust role-specific actions in response to their own diagnostic rewards, the learned policy yields less favorable governance and disclosure outcomes and greater reporting and audit risks than the fixed policy (Table 19). The adverse GQ and OOG direction is broadly retained across sensitivity settings, with greater variation in magnitude and tail-risk contrasts. I interpret this pattern as a possible role–reward externality within the fixed three-role architecture: locally reinforced actions can weaken the connected oversight system. This result extends the theoretical argument from institutional configuration to adaptive behavior. Effective oversight depends on feedback structures that align role-specific incentives with system-level reporting and accountability outcomes.
7.2. Practical Implications
The practical implication is to trace oversight signals and identify coordination breakdowns along the institutional chain. Boards and audit committees determine whether audit findings enter timely review and disclosure correction. Auditors provide detection capacity; regulatory authorities and exchanges shape the timing, visibility, and consequences of detected risk; investors receive the resulting disclosures and feed information into market trust and later reporting incentives. Examining these links together can locate a breakdown between detection, internal response, regulatory conversion, market communication, and subsequent behavior. The sequence also directs attention to coordination: strong performance at one link has limited system value when the next institution receives the signal late, converts it weakly, or returns little feedback to later reporting decisions.
The simulation supports diagnosis of signal visibility, institutional response, market feedback, and behavioral adaptation. It organizes four questions: whether risk signals become detectable and visible; whether responsible institutions translate them into timely correction or expected cost; whether disclosure activates market feedback; and whether repeated outcomes alter later conduct. Boards, auditors, regulators, exchanges, and investors can use this sequence to examine visibility, timing, linkage, and reward alignment under specified governance arrangements. The learning-agent extension adds a dynamic check on whether repeated feedback moves role choices in a direction consistent with the connected oversight process. Real-firm observations remain necessary for estimating institutional effects and developing numerical recommendations. The framework therefore supports structured diagnosis and comparison under declared assumptions.
7.3. Limitations and Future Research Directions
Empirical calibration and held-out evaluation can be further developed. This study has completed an external pattern-consistency assessment of selected governance patterns. Computational verification and dependence diagnostics provide model-internal evidence, and the external assessment covers directions, adverse-state locations, and broad top/bottom ordering (Table 20). Parameter settings can be further refined using linked firm–period observations. Future research should construct a linked A-share firm–period panel, refine the existing construct mappings for EM, DQ, AR, RI, and MT, and expand data-quality audits. The panel should integrate disclosure evaluations and corrections, restatements and enforcement outcomes, audit and governance attributes, inquiry-response timing, and market information.
Fine-grained model comparisons remain sensitive to initialization, constructed measures, and boundary rules. This study has compared alternative starting states and boundary treatments and combined GQ and OOG with the diagnostic joint-event indicator and adverse-state index. Early events and some middle rankings show some sensitivity to starting states, boundary functions, and threshold settings, leaving fine-grained comparisons open to further evaluation with observed data. Future estimation should prespecify target moments and a chronological calibration–validation–final-test split, estimate parameters through a constrained simulated method of moments or approximate Bayesian computation, and compare held-out distributions and rankings with observed outcomes and simple benchmarks. The estimation protocol should state parameter constraints, weights, tolerances, priors, and stopping rules.
The fixed three-role architecture simplifies behavioral heterogeneity and interaction across agents. This study has implemented a learning-agent extension that examines role-specific adaptation under the declared rewards. The current design captures one adaptation path, with scope for richer agent heterogeneity, interaction networks, and empirically estimated behavioral parameters. Future research should develop population-based, empirically constrained multi-agent models using observed type distributions and behavioral parameters. These models can test whether the role–reward externality persists across heterogeneous positions while preserving transparent specifications and reproducible benchmarks.
8. Conclusions
This study models financial reporting oversight as a recursive feedback system. The architecture links reporting incentives, audit detection and board oversight, regulatory response, disclosure, and market feedback, while the learning-agent extension examines how bounded role adaptation alters their interaction. Its contribution is a transparent and auditable environment for comparing institutional configurations, tracing feedback sequences, and examining dynamic adaptation within a common system under declared rules.
The results reveal stable governance patterns, conditional mechanism effects, and a role–reward externality. Coordinated governance configurations retain the strongest broad performance, whereas weak governance remains concentrated in adverse states across the main comparisons. Differences between GQ and OOG show that detected risk changes system outcomes when monitoring, consequences, and disclosure complete institutional conversion. Cross-difference, Shapley, and heterogeneity analyses show that mechanism effects vary across combinations, outcome measures, and surrounding firm, audit, and regulatory conditions. Under the declared diagnostic rewards, role-specific adaptation weakens the connected system, indicating that locally rewarded choices can generate adverse system-level effects.
These findings explain how oversight signals become institutional outcomes and subsequent feedback. Risk detection, institutional conversion, and feedback timing jointly determine whether a governance problem prompts correction and changes later conduct. The framework supports diagnosis of signal visibility, institutional response, credible consequences, and the entry of disclosure into market and behavioral feedback across the connected oversight chain. Computational verification and dependence diagnostics establish model-internal behavior, and the completed external pattern-consistency assessment supports selected directions, adverse-state locations, and broad ordering; initialization and measurement choices still shape fine-grained comparisons that can be further evaluated through empirical calibration and real-firm observations.
Future research can strengthen empirical calibration, cross-institutional evaluation, and multi-agent modeling. A linked A-share firm–period panel can refine construct mappings, estimate model components, and support chronological calibration, validation, and held-out evaluation. Cross-institutional applications can remap institutional roles, reporting and enforcement timing, disclosure measures, and audit-market structures; population-based multi-agent models can add observed heterogeneity, interaction networks, and entry or exit. These extensions can develop the transparent mechanism framework into a basis for observed-data testing across governance settings.
Supplementary Materials
The following supporting information can be downloaded at: https://www.mdpi.com/article/10.3390/systems14081022/s1, Table S1: Parameter-source categories, evidence scope, equation notation, and baseline values; Table S2: Scenario results across initialization regimes; Table S3: Additive-interaction contrasts across mechanism grids and initialization regimes; Table S4: Complete Shapley decomposition and computational checks across initialization regimes; Table S5: Regulatory-intervention response-shape diagnostic; Table S6: Reporting-window pattern diagnostic; Table S7: Threshold-grid event incidence and adverse-state index summaries; Table S8: Governance-index results under common mechanism-weight multipliers; Table S9: Governance-index results under simulation-noise multipliers; Table S10: Governance-index results by Monte Carlo run size; Table S11: Scenario-specific state-clipping contacts; Table S12: Common-factor LHS design: factor families and uncertainty ranges; Table S13: PRCC convergence by LHS sample size; Table S14: Leading scenario-specific PRCCs for GQ and OOG; Table S15: Factor-level means in the balanced 3 × 2 × 2 heterogeneity design; Table S16: Learning-factor families and uncertainty ranges; Table S17: Held-out learning-policy outcomes and sensitivity diagnostics.
Funding
This work was supported in part by the Youth Program of the National Natural Science Foundation of China under Grant 72002234 and the Ministry of Education Humanities and Social Sciences Research Project under Grant 19YJC790072.
Institutional Review Board Statement
Not applicable.
Informed Consent Statement
Not applicable.
Data Availability Statement
The data supporting the findings of this study are available from the corresponding author upon reasonable request.
Acknowledgments
During the preparation of this manuscript, the author used OpenAI ChatGPT/Codex (GPT-5) for language polishing and consistency checking. The author reviewed and edited the output and takes full responsibility for the content of this publication.
Conflicts of Interest
The author declares no conflicts of interest.
References
- Healy, P.M.; Palepu, K.G. Information Asymmetry, Corporate Disclosure, and the Capital Markets: A Review of the Empirical Disclosure Literature. J. Account. Econ. 2001, 31, 405–440. [Google Scholar] [CrossRef] [Scilit]
- Jensen, M.C.; Meckling, W.H. Theory of the Firm: Managerial Behavior, Agency Costs and Ownership Structure. J. Financ. Econ. 1976, 3, 305–360. [Google Scholar] [CrossRef] [Scilit]
- Eisenhardt, K.M. Agency Theory: An Assessment and Review. Acad. Manag. Rev. 1989, 14, 57–74. [Google Scholar] [CrossRef] [Scilit]
- Williamson, O.E. Transaction-Cost Economics: The Governance of Contractual Relations. J. Law Econ. 1979, 22, 233–261. [Google Scholar] [CrossRef] [Scilit]
- Armstrong, C.S.; Guay, W.R.; Weber, J.P. The Role of Information and Financial Reporting in Corporate Governance and Debt Contracting. J. Account. Econ. 2010, 50, 179–234. [Google Scholar] [CrossRef] [Scilit]
- Wu, B.; Yang, J.; Fu, G.; Zhang, M. The Strategy Selection in Financial Fraud and Audit Supervision: A Study Based on a Three-Party Evolutionary Game Model. Systems 2022, 10, 173. [Google Scholar] [CrossRef] [Scilit]
- Jiang, L.; Wang, X.; Zhang, J. The Systemic Impact of Dynamic Regulations on Green Technology Innovation: An Evolutionary Game Incorporating Consumer Preferences. Systems 2026, 14, 603. [Google Scholar] [CrossRef] [Scilit]
- Huang, X.; Zhan, W.; Qi, T.; Guo, Y.; Bai, R.; Hong, T. Research on Regional Collaborative Governance Between Central and Local Governments Under the Background of Green Innovation. Systems 2025, 13, 153. [Google Scholar] [CrossRef] [Scilit]
- Shleifer, A.; Vishny, R.W. A Survey of Corporate Governance. J. Financ. 1997, 52, 737–783. [Google Scholar] [CrossRef]
- Dechow, P.; Ge, W.; Schrand, C. Understanding Earnings Quality: A Review of the Proxies, Their Determinants and Their Consequences. J. Account. Econ. 2010, 50, 344–401. [Google Scholar] [CrossRef] [Scilit]
- Bonabeau, E. Agent-Based Modeling: Methods and Techniques for Simulating Human Systems. Proc. Natl. Acad. Sci. USA 2002, 99, 7280–7287. [Google Scholar] [CrossRef] [Scilit] [PubMed]
- Harrison, J.R.; Lin, Z.; Carroll, G.R.; Carley, K.M. Simulation Modeling in Organizational and Management Research. Acad. Manag. Rev. 2007, 32, 1229–1245. [Google Scholar] [CrossRef] [Scilit]
- Keogh, K.; Sonenberg, L. Designing Multi-Agent System Organisations for Flexible Runtime Behaviour. Appl. Sci. 2020, 10, 5335. [Google Scholar] [CrossRef] [Scilit]
- Governatori, G.; Rotolo, A. A Computational Framework for Institutional Agency. Artif. Intell. Law 2008, 16, 25–52. [Google Scholar] [CrossRef] [Scilit]
- Axtell, R.L.; Farmer, J.D. Agent-Based Modeling in Economics and Finance: Past, Present, and Future. J. Econ. Lit. 2025, 63, 197–287. [Google Scholar] [CrossRef] [Scilit]
- Dawid, H.; Neugart, M. Agent-Based Models for Economic Policy Design. East. Econ. J. 2011, 37, 44–50. [Google Scholar] [CrossRef] [Scilit]
- Sterman, J.D. Business Dynamics: Systems Thinking and Modeling for a Complex World; Irwin/McGraw-Hill: Boston, MA, USA, 2000. [Google Scholar]
- Castellano, C.; Fortunato, S.; Loreto, V. Statistical Physics of Social Dynamics. Rev. Mod. Phys. 2009, 81, 591–646. [Google Scholar] [CrossRef] [Scilit]
- Granovetter, M. Threshold Models of Collective Behavior. Am. J. Sociol. 1978, 83, 1420–1443. [Google Scholar] [CrossRef] [Scilit]
- Grimm, V.; Berger, U.; DeAngelis, D.L.; Polhill, J.G.; Giske, J.; Railsback, S.F. The ODD Protocol: A Review and First Update. Ecol. Model. 2010, 221, 2760–2768. [Google Scholar] [CrossRef] [Scilit]
- Railsback, S.F.; Grimm, V. Agent-Based and Individual-Based Modeling: A Practical Introduction, 2nd ed.; Princeton University Press: Princeton, NJ, USA, 2019. [Google Scholar]
- Henderson, P.; Islam, R.; Bachman, P.; Pineau, J.; Precup, D.; Meger, D. Deep Reinforcement Learning That Matters. In Proceedings of the Thirty-Second AAAI Conference on Artificial Intelligence (AAAI-18), New Orleans, LA, USA, 2–7 February 2018; pp. 3207–3214. [Google Scholar] [CrossRef] [Scilit]
- Kellogg, K.C.; Valentine, M.A.; Christin, A. Algorithms at Work: The New Contested Terrain of Control. Acad. Manag. Ann. 2020, 14, 366–410. [Google Scholar] [CrossRef] [Scilit]
- Burrell, J. How the Machine “Thinks”: Understanding Opacity in Machine Learning Algorithms. Big Data Soc. 2016, 3, 2053951715622512. [Google Scholar] [CrossRef] [Scilit]
- Barocas, S.; Selbst, A.D. Big Data’s Disparate Impact. Calif. Law. Rev. 2016, 104, 671–732. [Google Scholar] [CrossRef] [Scilit]
- Gao, C.; Lan, X.; Li, N.; Yuan, Y.; Ding, J.; Zhou, Z.; Xu, F.; Li, Y. Large Language Models Empowered Agent-Based Modeling and Simulation: A Survey and Perspectives. Humanit. Soc. Sci. Commun. 2024, 11, 1259. [Google Scholar] [CrossRef] [Scilit]
- Guo, T.; Chen, X.; Wang, Y.; Chang, R.; Pei, S.; Chawla, N.V.; Wiest, O.; Zhang, X. Large Language Model Based Multi-Agents: A Survey of Progress and Challenges. arXiv 2024, arXiv:2402.01680. [Google Scholar] [CrossRef] [Scilit]
- Wang, L.; Ma, C.; Feng, X.; Zhang, Z.; Yang, H.; Zhang, J.; Chen, Z.; Tang, J.; Chen, X.; Lin, Y.; et al. A Survey on Large Language Model Based Autonomous Agents. Front. Comput. Sci. 2024, 18, 186345. [Google Scholar] [CrossRef] [Scilit]
- Park, J.S.; O’Brien, J.; Cai, C.J.; Morris, M.R.; Liang, P.; Bernstein, M.S. Generative Agents: Interactive Simulacra of Human Behavior. In Proceedings of the 36th Annual ACM Symposium on User Interface Software and Technology (UIST ’23), San Francisco, CA, USA, 29 October–1 November 2023; pp. 1–22. [Google Scholar] [CrossRef] [Scilit]
- Whiting, N.W.; Roy, C.J.; Duque, E.; Lawrence, S.; Oberkampf, W.L. Assessment of Model Validation, Calibration, and Prediction Approaches in the Presence of Uncertainty. J. Verif. Verif. Uncertain. Quantif. 2023, 8, 011001. [Google Scholar] [CrossRef] [Scilit]
- Riedmaier, S.; Danquah, B.; Schick, B.; Diermeyer, F. Unified Framework and Survey for Model Verification, Validation and Uncertainty Quantification. Arch. Comput. Methods Eng. 2021, 28, 2655–2688. [Google Scholar] [CrossRef] [Scilit]
- Braakman, S.; Pathmanathan, P.; Moore, H. Evaluation Framework for Systems Models. CPT Pharmacomet. Syst. Pharmacol. 2022, 11, 264–289. [Google Scholar] [CrossRef] [Scilit] [PubMed]
- Razavi, S.; Jakeman, A.; Saltelli, A.; Prieur, C.; Iooss, B.; Borgonovo, E.; Plischke, E.; Lo Piano, S.; Iwanaga, T.; Becker, W.; et al. The Future of Sensitivity Analysis: An Essential Discipline for Systems Modeling and Policy Support. Environ. Model. Softw. 2021, 137, 104954. [Google Scholar] [CrossRef] [Scilit]
- Saxton, H.; Xu, X.; Schenkel, T.; Clayton, R.H.; Halliday, I. Convergence, Sampling and Total Order Estimator Effects on Parameter Orthogonality in Global Sensitivity Analysis. PLoS Comput. Biol. 2024, 20, e1011946. [Google Scholar] [CrossRef] [Scilit] [PubMed]
- Marino, S.; Hogue, I.B.; Ray, C.J.; Kirschner, D.E. A Methodology for Performing Global Uncertainty and Sensitivity Analysis in Systems Biology. J. Theor. Biol. 2008, 254, 178–196. [Google Scholar] [CrossRef] [Scilit] [PubMed]
- Čížek, P.; Koo, C.H. Semiparametric Transition Models. Econom. Rev. 2022, 41, 400–415. [Google Scholar] [CrossRef] [Scilit]
- Bushman, R.M.; Smith, A.J. Financial Accounting Information and Corporate Governance. J. Account. Econ. 2001, 32, 237–333. [Google Scholar] [CrossRef] [Scilit]
- Beyer, A.; Cohen, D.A.; Lys, T.Z.; Walther, B.R. The Financial Reporting Environment: Review of the Recent Literature. J. Account. Econ. 2010, 50, 296–343. [Google Scholar] [CrossRef] [Scilit]
- Leuz, C.; Nanda, D.; Wysocki, P.D. Earnings Management and Investor Protection: An International Comparison. J. Financ. Econ. 2003, 69, 505–527. [Google Scholar] [CrossRef] [Scilit]
- Roychowdhury, S. Earnings Management Through Real Activities Manipulation. J. Account. Econ. 2006, 42, 335–370. [Google Scholar] [CrossRef] [Scilit]
- Klein, A. Audit Committee, Board of Director Characteristics, and Earnings Management. J. Account. Econ. 2002, 33, 375–400. [Google Scholar] [CrossRef] [Scilit]
- Francis, J.R. A Framework for Understanding and Researching Audit Quality. Audit. A J. Pr. Theory 2011, 30, 125–152. [Google Scholar] [CrossRef] [Scilit]
- DeFond, M.; Zhang, J. A Review of Archival Auditing Research. J. Account. Econ. 2014, 58, 275–326. [Google Scholar] [CrossRef] [Scilit]
- Neiroukh, N.; Çağlar, D. Information Systems Quality and Corporate Sustainability: Unpacking the Interplay of Financial Reporting, Artificial Intelligence, and Green Corporate Governance. Systems 2025, 13, 537. [Google Scholar] [CrossRef] [Scilit]
- Pascaru, A.G.; Hategan, C.D.; Pitorac, R.I. Digital Transformation and Audit Pricing: The Learning Curve Effect. Systems 2026, 14, 590. [Google Scholar] [CrossRef] [Scilit]
- Tang, Z.; Lyu, C. The Extent of Digital Transformation, Dual Agency Problems, and the Choice of Industry Specialist Audits in Family Businesses: Evidence from China. Systems 2026, 14, 108. [Google Scholar] [CrossRef] [Scilit]
- Christensen, T.E.; Huffman, A.; Lewis-Western, M.F.; Scott, R. Accruals Earnings Management Proxies: Prudent Business Decisions or Earnings Manipulation? J. Bus. Financ. Account. 2022, 49, 536–587. [Google Scholar] [CrossRef] [Scilit]
- Schneider, M.; Brühl, R. Disentangling the Black Box around CEO and Financial Information-Based Accounting Fraud Detection: Machine Learning-Based Evidence from Publicly Listed U.S. Firms. J. Bus. Econ. 2023, 93, 1591–1628. [Google Scholar] [CrossRef] [Scilit]
- Johl, S.K.; Muttakin, M.B.; Mihret, D.G.; Cheung, S.; Gioffre, N. Audit Firm Transparency Disclosures and Audit Quality. Int. J. Audit. 2021, 25, 508–533. [Google Scholar] [CrossRef] [Scilit]
- Elsayed, M.; Elshandidy, T.; Ahmed, Y. Is Expanded Auditor Reporting Meaningful? UK Evidence. J. Int. Account. Audit. Tax. 2023, 53, 100582. [Google Scholar] [CrossRef] [Scilit]
- China Securities Regulatory Commission. Standards for the Contents and Formats of Information Disclosure by Companies Offering Securities to the Public No. 2—Annual Report Contents and Formats (CSRC Announcement [2025] No. 3; Effective 1 July 2025). Available online: https://www.csrc.gov.cn/csrc/c101954/c7547588/content.shtml (accessed on 9 August 2026).
- China Securities Regulatory Commission. Standards for the Contents and Formats of Information Disclosure by Companies Offering Securities to the Public No. 3—Semiannual Report Contents and Formats (CSRC Announcement [2025] No. 4; Effective 1 July 2025). Available online: https://www.csrc.gov.cn/csrc/c101954/c7547590/content.shtml (accessed on 9 August 2026).
- China Securities Regulatory Commission. Measures for the Administration of Information Disclosure of Listed Companies (CSRC Order No. 226; Effective 1 July 2025). Available online: https://www.csrc.gov.cn/csrc/c101953/c7547359/content.shtml (accessed on 9 August 2026).
- China Securities Regulatory Commission. Code of Corporate Governance for Listed Companies (CSRC Announcement [2025] No. 18; Effective 1 January 2026). Available online: https://www.csrc.gov.cn/csrc/c101954/c7589726/content.shtml (accessed on 9 August 2026).
- Shanghai Stock Exchange. Shanghai Stock Exchange Stock Listing Rules (April 2026 Revision). Available online: https://www.sse.com.cn/lawandrules/sselawsrules2025/stocks/mainipo/c/c_20260424_10816589.shtml (accessed on 9 August 2026).
- Shanghai Stock Exchange. Self-Regulatory Guideline No. 9—Evaluation of Information Disclosure Work (March 2025 Revision; SSE Document [2025] No. 26). Available online: https://www.sse.com.cn/lawandrules/sselawsrules2025/stocks/mainipo/c/c_20250516_10779136.shtml (accessed on 9 August 2026).
- State Council of the People’s Republic of China. Opinions on Strengthening Regulation, Preventing Risks, and Promoting High-Quality Development of the Capital Market (State Council Document [2024] No. 10). Available online: https://www.csrc.gov.cn/csrc/c100028/c7473562/content.shtml (accessed on 9 August 2026).
- China Securities Regulatory Commission. Response on Strengthening Oversight of Listed-Company Financial Fraud and the Gatekeeper Role of Accounting Firms. Available online: https://www.csrc.gov.cn/csrc/c101800/cc5665d31da2f4c1696310c9e7b1bb811/content.shtml (accessed on 9 August 2026).
- Chen, J.J.; Zhang, H. The Impact of the Corporate Governance Code on Earnings Management—Evidence from Chinese Listed Companies. Eur. Financ. Manag. 2014, 20, 596–632. [Google Scholar] [CrossRef] [Scilit]
- Chen, H.; Zhuang, W.; Wang, Z.; Zhou, A. Administrative Audit Regulation and the Quality of Accounting Information: Evidence from China Securities Regulatory Commission’s Random Inspection System. Res. Int. Bus. Financ. 2024, 71, 102502. [Google Scholar] [CrossRef] [Scilit]
- Hu, N.; Xu, J.; Xue, S. Regulatory Risk and Auditors’ Reporting Conservatism: Evidence from Chinese Comment Letters. J. Account. Public Policy 2022, 41, 106997. [Google Scholar] [CrossRef] [Scilit]
- Huo, D.; Huang, W.; Huang, Y.; Ke, Y.; Shen, Z. Stock Exchange Comment Letters and MD&A Tone Management. Res. Int. Bus. Financ. 2024, 70, 102407. [Google Scholar] [CrossRef] [Scilit]
- Hao, X.; Wang, Y. Does Preventive Regulation Reduce Stock Price Synchronicity? Evidence from Chinese Annual Report Comment Letters. China J. Account. Res. 2021, 14, 100203. [Google Scholar] [CrossRef] [Scilit]
- Zhang, Y. Capital Market Liberalization and Accounting Quality: Evidence from China. Financ. Res. Lett. 2024, 64, 105459. [Google Scholar] [CrossRef] [Scilit]
- Shanghai Stock Exchange. Results of the 2023–2024 Information Disclosure Evaluation of SSE-Listed Companies. 9 October 2024. Available online: https://www.sse.com.cn/regulation/supervision/dynamic/c/c_20241009_10762586.shtml (accessed on 9 August 2026).
- China Securities Regulatory Commission. CSRC Announces Proposed Penalties and Market Bans for Kangmei Pharmaceutical and Related Parties. 2019. Available online: https://www.csrc.gov.cn/csrc/c100028/c1000927/content.shtml (accessed on 9 August 2026).
- China Securities Regulatory Commission. Administrative Penalty Decision: Guangdong Zhengzhong Zhujiang Certified Public Accountants, Yang Wenwei, Zhang Jingli, Liu Qing, and Su Chuangsheng (Decision [2021] No. 11). Available online: https://www.csrc.gov.cn/csrc/c101928/c9a654df415374f6aa6a1a5e46e4e8221/content.shtml (accessed on 9 August 2026).
- Han, M.; Ying, Q.; Huang, L. Firms’ Delayed Replies and Investor Confidence: Evidence from M&A Comment Letters in China. Financ. Res. Lett. 2023, 56, 104125. [Google Scholar] [CrossRef] [Scilit]
- Watkins, C.J.C.H.; Dayan, P. Q-Learning. Mach. Learn. 1992, 8, 279–292. [Google Scholar] [CrossRef] [Scilit]
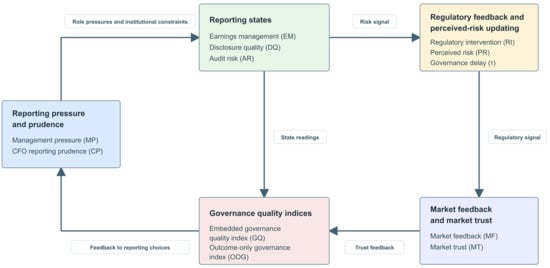
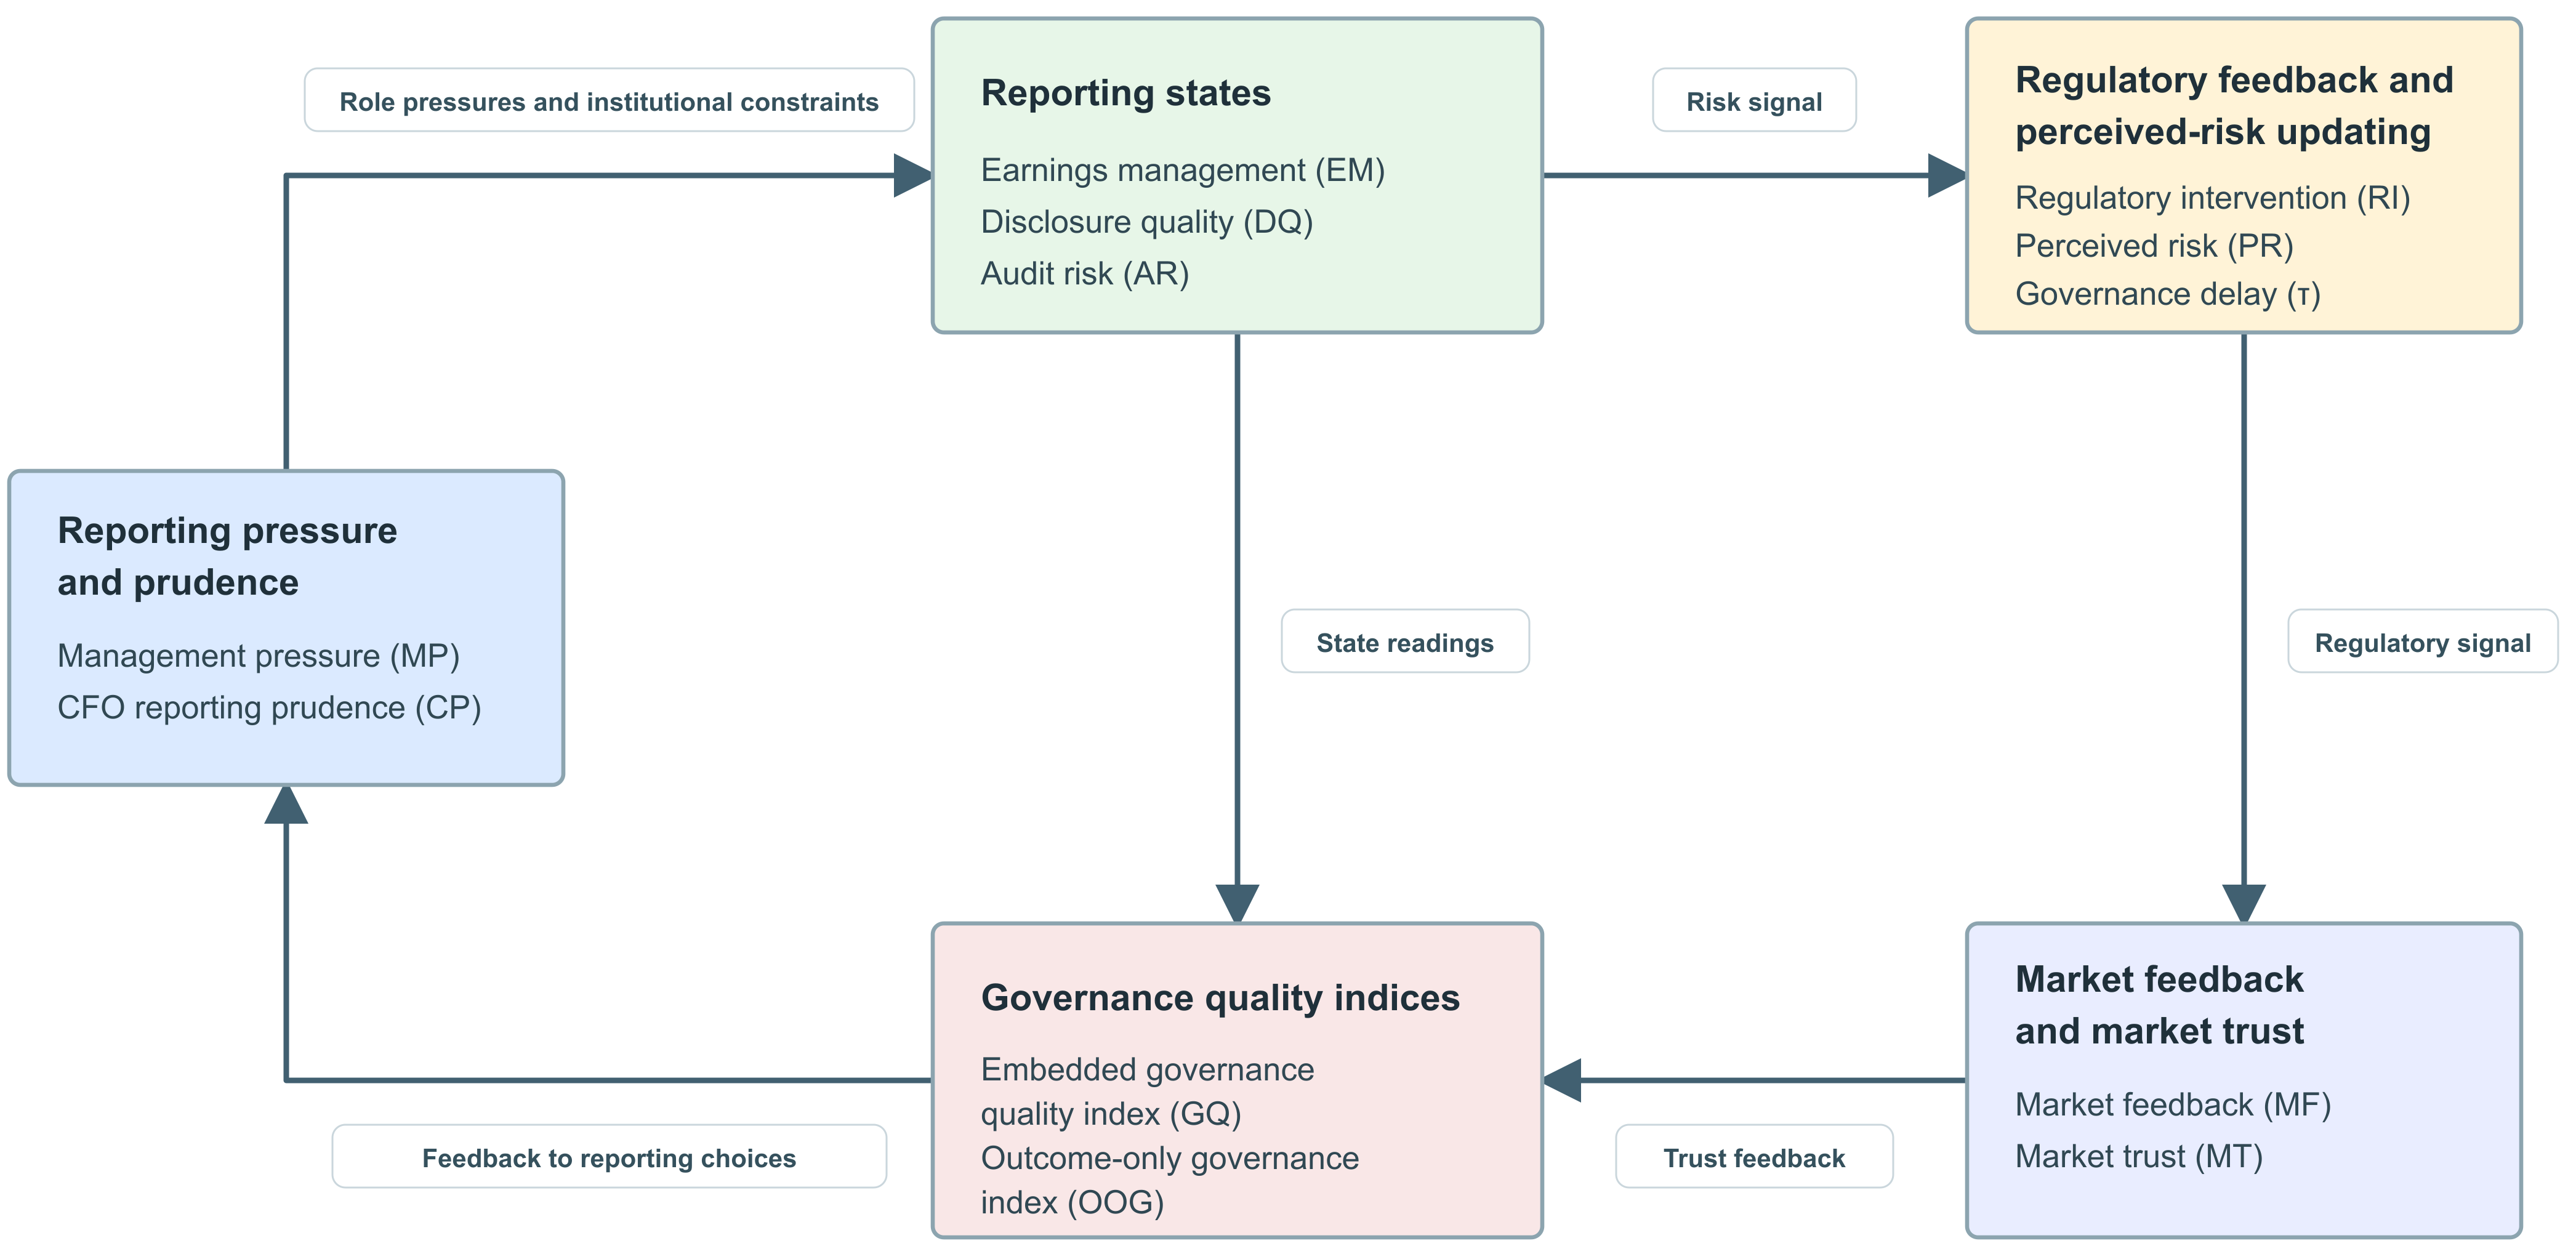
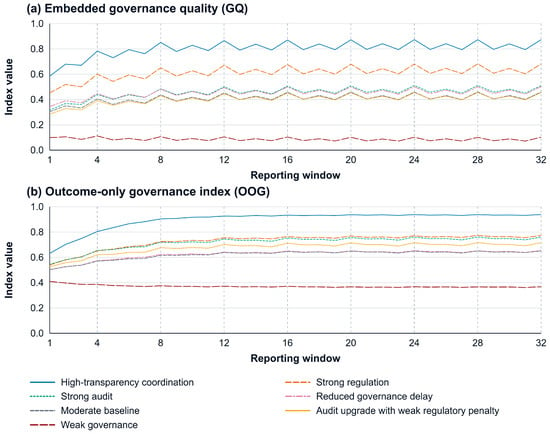
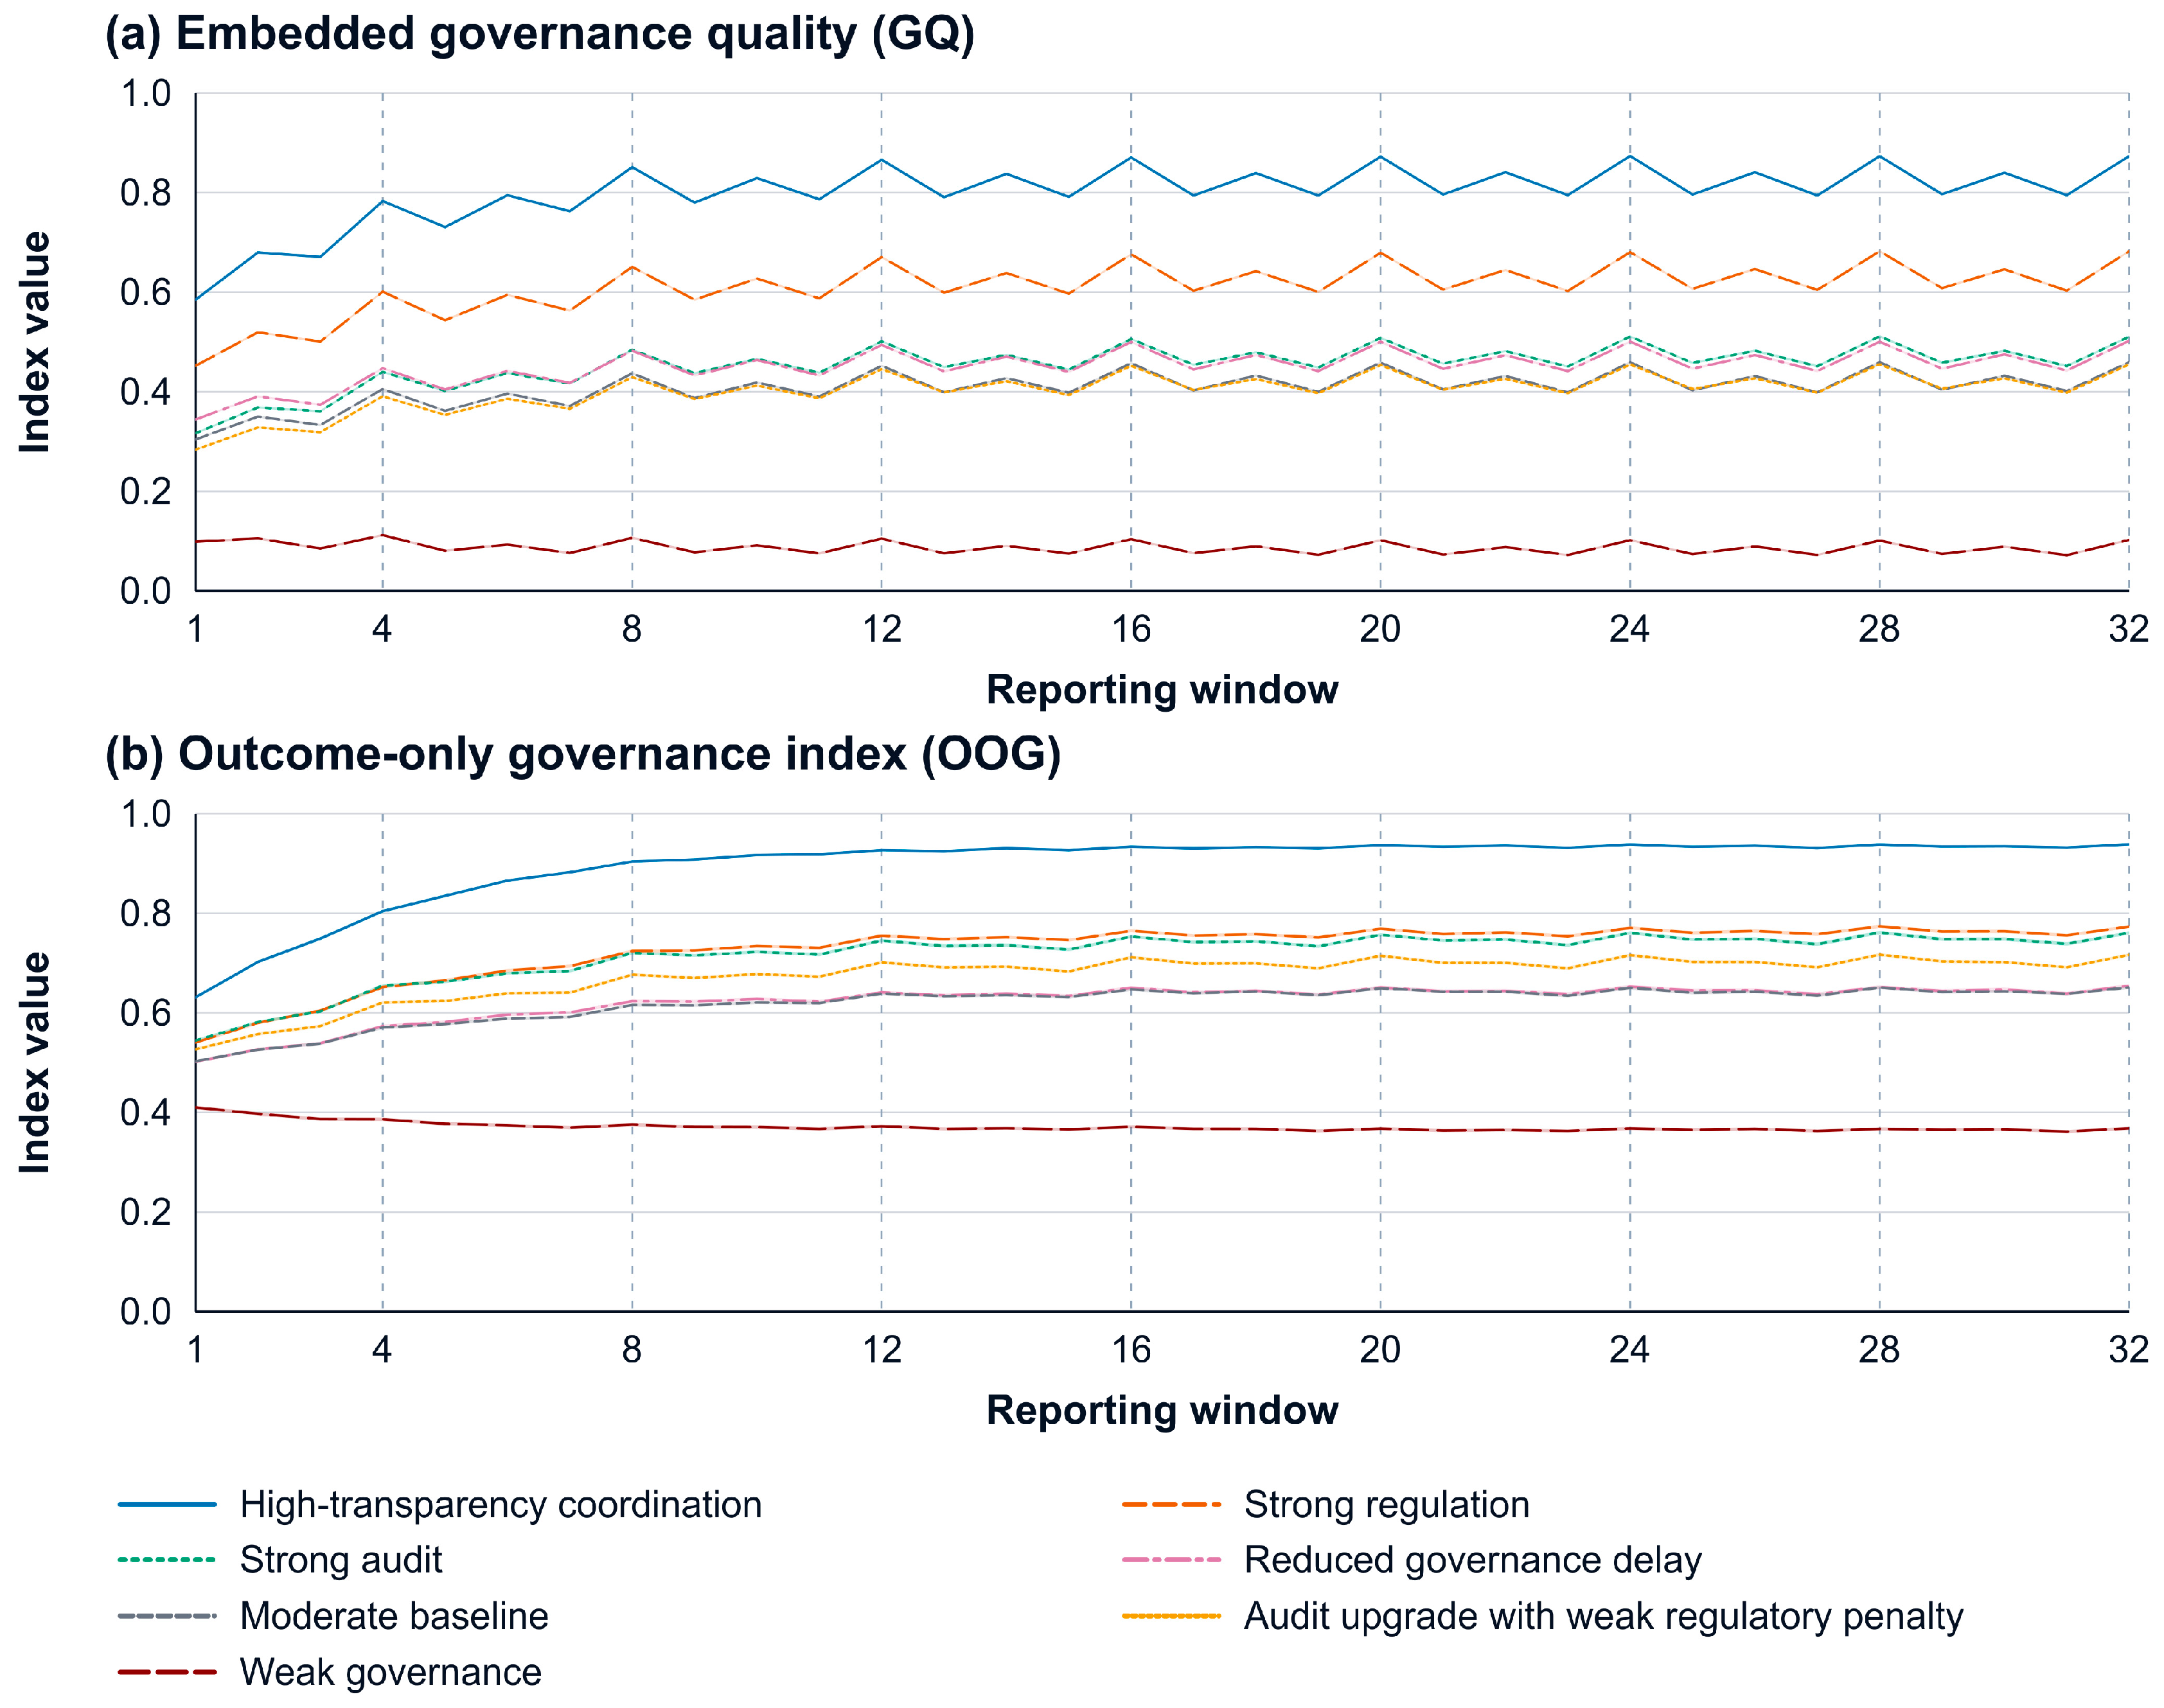

Disclaimer/Publisher’s Note: The statements, opinions and data contained in all publications are solely those of the individual author(s) and contributor(s) and not of MDPI and/or the editor(s). MDPI and/or the editor(s) disclaim responsibility for any injury to people or property resulting from any ideas, methods, instructions or products referred to in the content. |
© 2026 by the author. Licensee MDPI, Basel, Switzerland. This article is an open access article distributed under the terms and conditions of the Creative Commons Attribution (CC BY) license.