


Highlights
Please indicate how your work links to systems science via your contributions to systems practice, theory, and/or methodology.
- Integrating fairness concerns and green financing into a unified low-carbon supply chain framework reveals how micro-level interactions shape macro-level sustainability of the systems.
- A new cost structure modeling approach, per-unit licensing fee, captures real-world technology adoption patterns and enhances the realism of operational decisions in complex systems.
What are the main findings and/or the implications of the main findings?
- Retailer fairness concerns reduce wholesale prices and improve profit allocation without distorting optimal carbon emission reduction levels under the per-unit licensing fee approach for technology adoption.
- Supply chain coordination in low-carbon operations can emerge endogenously when retailer fairness concerns are high.
Abstract
Low-carbon transformation requires substantial investments, challenging capital-constrained manufacturers to adopt carbon emission reduction (CER) technologies. While external financing alleviates capital shortages, it cannot address potential profit imbalances that trigger fairness concerns. We investigate a low-carbon supply chain where a capital-constrained manufacturer adopts CER technologies via a preferential bank loan and sells to a capital-abundant retailer. Unlike prior studies treating CER investments as one-time costs, we model CER technology as a quadratic per-unit royalty licensing fee. We find that, given consumers’ willingness to pay for low-carbon products, financing encourages CER upgrades but creates profit disparities unfavorable to the retailer. Incorporating the retailer’s fairness concerns, results show that compared to the non-fairness scenario, the manufacturer sets a lower wholesale price and cannot earn more. Conversely, the retailer strategically maintains or increases its order quantity, attaining higher profits. Furthermore, the optimal CER level remains invariant regardless of fairness preferences. Finally, supply chain coordination is achievable under specific conditions, yielding a win–win outcome where the manufacturer adopts CER technologies and the retailer’s fairness concerns are accommodated. The quadratic per-unit technology licensing fee we investigated maintains the manufacturer’s motivation and ensures the retailer’s fairness, contributing to the stable and sustainable evolution of low-carbon supply chains.
1. Introduction
Global climate change has precipitated increasingly severe environmental challenges, including damaged marine ecosystems and extreme weather events such as heatwaves, heavy precipitation, droughts, and tropical cyclones (https://www.ipcc.ch/report/ar6/syr/downloads/report/IPCC_AR6_SYR_SPM.pdf, accessed on 5 August 2026). The primary driver of these crises is excessive carbon emissions. As emphasized in the 2023 synthesis report by the Intergovernmental Panel on Climate Change (IPCC), achieving net-zero emissions is essential to mitigate global climate change. Thus, carbon emission reduction (CER) has emerged as a critical global imperative. In pursuit of this imperative, governments worldwide are proactively formulating stringent regulatory frameworks. Notably, these policies focus not only on domestic direct emissions but also on the indirect carbon footprints of imported goods, as exemplified by the European Union’s Carbon Border Adjustment Mechanism (CBAM) (https://taxation-customs.ec.europa.eu/carbon-border-adjustment-mechanism_en, accessed on 5 August 2026). Carbon management can no longer be confined to the operational scope of manufacturers. Instead, it demands a holistic, full-supply-chain perspective. As a result, downstream retailers increasingly prioritize partnerships with manufacturers that have successfully transitioned to low-carbon operations to reduce potential costs. A report by Standard Chartered Bank indicates that some retailers are actively phasing out slow-to-transition manufacturers (https://standardcharteredbank.turtl.co/story/carbon-dated/page/3/1, accessed on 5 August 2026). Moreover, consumers increasingly prefer low-carbon products, with some even exhibiting a willingness to pay a premium for carbon reductions [1]. Driven by these factors, manufacturers are compelled to upgrade their green technologies [2,3]. However, implementing CER technologies requires substantial capital [4]. Manufacturers lacking CER proficiency often acquire technologies from firms possessing higher CER capabilities, which involves the sharing of CER technologies and associated equipment [5]. When acquiring technologies via royalty licenses, manufacturers are obligated to remit a per-unit licensing fee to the patent holder for each unit of product [6], which exacerbates financial pressures and leaves manufacturers facing a dual challenge of high technological demands and severe capital constraints.
To alleviate these financial pressures, external support mechanisms such as green financing have emerged [7]. Numerous banks have initiated such green financial programs, a form of service dedicated to supporting investments in sustainable development projects and initiatives. This financial backing directly influences manufacturers’ CER investment and production decisions [8], thereby significantly impacting overall supply chain performance [3].
Beyond external financing, internal supply chain coordination is also crucial for strategic CER investment [9]. While external financing alleviates short-term capital shortages, it fails to resolve the inherent profit conflicts between supply chain members. Under decentralized decision-making, the manufacturer typically bears the substantial burden of CER technology investments, whereas the resulting economic benefits are shared across the entire supply chain. This asymmetry often leads to a free-rider problem for the retailer and diminishes the manufacturer’s incentive to invest, ultimately hindering the supply chain’s long-term low-carbon transition [10,11]. Furthermore, effective supply chain coordination can mitigate the double marginalization effect caused by misaligned objectives among internal members, ultimately achieving superior CER levels [12,13,14]. More importantly, it is imperative that profits generated through supply chain coordination be distributed fairly. Any unfair distribution may trigger resentment among supply chain members, leading to irrational decisions. Yet, traditional models that assume decision-makers are perfectly rational fail to capture their behavioral responses driven by fairness concerns [15]. Ignoring these behavioral factors often leads to a deviation between theoretical predictions and practical outcomes, particularly regarding coordination under constant wholesale price contracts. In reality, perceived unfairness can severely undermine cooperation. For instance, unauthorized price reductions by the retailer Gome led to a complete breakdown in its partnership with the manufacturer Gree [16]. Therefore, considering internal coordination mechanisms that integrate behavioral fairness concerns is imperative for accurately evaluating CER technology investments and managing sustainable supply chains.
Based on these insights, green financing has become essential to support the capital-intensive CER technology investments required for low-carbon transformation. However, implementing such upgrades inevitably alters profit distribution, triggering fairness concerns that threaten supply chain cooperation. Therefore, this paper examines the impacts of green-financed CER upgrades on supply chain performance and coordination, both without and with the consideration of fairness concerns. We focus on three primary questions:
- (1)
- Supported by green financing, does the manufacturer opt to upgrade CER technology?
- (2)
- How does the manufacturer adjust its CER decisions in response to the retailer’s fairness concerns?
- (3)
- To what extent will fairness concerns influence supply chain coordination?
To address these questions, we model a two-tier supply chain comprising a capital-constrained manufacturer (leader) and a capital-abundant retailer (follower). We progressively analyze a benchmark model without CER, a model with CER upgrades under green financing, and an extended model incorporating the retailer’s fairness concerns. Notably, we model the CER technology investment as a royalty-based licensing agreement, wherein the manufacturer incurs a per-unit fee during production. In this setting, We find that favorable bank loans incentivize the manufacturer to upgrade CER technology. While this benefits both parties, it creates profit inequity that triggers the retailer’s dissatisfaction. When fairness concerns are incorporated, the manufacturer sets a lower wholesale price without increasing its own profit, while the retailer either maintains or increases its order quantity but achieves higher profitability. Notably, the manufacturer’s optimal CER level remains constant regardless of the retailer’s fairness concerns, and supply chain coordination becomes achievable under specific conditions.
This research contributes both theoretically and practically in three main aspects:
- (1)
- First, we incorporate green financing and capital constraints into a low-carbon supply chain framework to investigate the operational impacts of CER technology upgrades, particularly from the perspective of the retailer’s fairness concerns. Compared to [12], which solely considers disadvantageous inequality, and [17], which assumes symmetric coefficients for both types of inequality to simplify the model, we posit that any profit discrepancy between the retailer and the manufacturer induces negative utility. Recognizing that retailers are naturally less averse to advantageous inequality, we assign it a smaller fairness coefficient. This asymmetric setting accurately captures varying sensitivities to inequity, offering a more comprehensive and generalized extension to the existing literature.
- (2)
- The existing literature mostly explores how CER technology shapes low-carbon product pricing decisions [1,7]. Differing from these studies that focus on pricing outcomes, our study shifts the research focus to consider the influence of CER levels and the behavioral preferences of supply chain members on the retailer’s order quantity strategy. This broadened perspective adds nuance to the understanding of the interplay between CER technology adoption and supply chain coordination.
- (3)
- As most of the research regarding low-carbon supply chain treats CER technologies as a one-time cost that follows a quadratic function of the CER level [4,14], we consider the CER technologies as a type of proprietary right; thus, other parties need to pay a royalty licensing fee for a unit product in production process for using the technologies. This setting enriches the research in low-carbon supply chain with a different application scenario and can provide prospects for the manufacturing industry in the adoption of CER technologies.
The remainder of this paper is organized as follows. Section 2 reviews the pertinent literature. Section 3 presents the benchmark and CER-incorporated models. Section 4 introduces the retailer’s fairness concerns and conducts the comparative analyses. Section 5 compares our results with those of closely related studies, elucidating the reasons for divergent results and validating the robustness of our findings. Section 6 concludes the paper and outlines key managerial implications.
2. Literature Review
Our research is closely related to three streams of literature: CER investments, supply chain financing, and fairness concerns.
2.1. CER Investments
Extensive scholarly attention has been devoted to supply chain operations incorporating CER investments. The operational decisions regarding CER investments are primarily driven by market incentives, investment risk management, and strategic interactions. On the demand side, ref. [18] demonstrated that consumers’ low-carbon preferences significantly promote the enhancement of CER levels. Considering that the environmental information of products should be communicated to consumers, ref. [19] highlighted that leveraging digital technologies (e.g., blockchain) to improve green information transparency mitigates information asymmetry and further elevates the overall CER level. To meet these market demands, firms must strategically invest in CER technologies. Ref. [20] investigated an investment planning problem for a manufacturer in a cap-and-trade market, revealing that firms are more inclined to invest in CER technologies when investment efficiency is higher. However, CER implementation is inherently stochastic, often yielding emission reductions below initial targets because of the failure of research and experimental development (R&D), production time variation, ambiguity of emission rates, and operational inefficiency in the green production process. To manage this operational risk, ref. [14] proposed a carbon emission hedging strategy (e.g., investing in the reliability of green technology) to mitigate uncertainty. Notably, this hedging not only safeguards emission targets and stimulates green inputs but also achieves coordination-like effects and boosts market demand without complex cost-sharing contracts. Furthermore, CER investment decisions are profoundly shaped by policy interventions and intra-supply chain power dynamics. Ref. [21] characterized CER technology adoption as an evolutionary process: initial stages require substantial government subsidies and joint R&D among supply chain members to alleviate financial burdens, whereas development and maturity stages allow for subsidy phase-outs but need to safeguard against free-riding. Internally, power structures dictate operational outcomes. Counterintuitively, ref. [18] revealed that supply chain leadership is not a prerequisite for profit maximization. Instead, a Nash competition structure induces both higher CER levels and individual profits.
Additionally, firms’ operational decisions involving CER investments are heavily contingent on carbon emission policies. Ref. [22] evaluated supply chain performance under carbon trading and tax policies and demonstrated that cap-and-trade mechanisms generally outperform carbon taxes in balancing emissions, supply chain costs, and service levels. Within cap-and-trade systems, quota allocation rules critically shape firms’ operations. Ref. [23] compared emission reduction strategies under three scenarios: the absence of cap-and-trade regulation, cap-and-trade regulation based on grandfathering mechanisms, and cap-and-trade regulation based on benchmarking mechanisms. Their results suggested that grandfathering mechanisms are more beneficial for low-carbon enterprises, whereas benchmarking mechanisms are more suitable for high-carbon emission enterprises. Building on this, ref. [6] analyzed how quota allocation influences low-carbon technology investments in the electricity market. They concluded that benchmarking allocation effectively stimulates investments and improves overall emission management, particularly under higher carbon quotas or prices. Ref. [24] combined different power structures and green technology investment efficiencies to design the optimal carbon tax. Notably, ref. [25] presented a surprising finding that carbon taxes may actually fail to incentivize technology investments in electricity supply chains operating under complex mechanisms like peak–valley pricing. Finally, to address global regulatory inconsistencies and cross-regional emission leakage, ref. [26] suggested that implementing a carbon border tax can serve as an effective stimulus for technology investment to reduce total emissions regardless of whether the carbon emission policy is a carbon tax or cap-and-trade.
2.2. Supply Chain Financing
Supply chain financing integrates financial and operational decisions, serving as a crucial mechanism for enterprises facing capital constraints. Traditionally, this domain focuses on the strategic interplay between external bank loans and internal trade credits [27,28]. The optimal selection between these financing options is intricately affected by both upstream and downstream members’ characteristics. Ref. [29] affirmed that retailers prefer advance payment over bank financing when manufacturers have low production costs. Ref. [30] identified a supplier credit rating threshold determining whether retailers rely solely on trade credit or combine it with bank loans. Specifically, if the supplier’s credit rating is higher than the threshold, the retailer relies exclusively on trade credits at a zero interest rate. Otherwise, the supplier offers trade credits with a positive interest rate and the retailer needs to combine trade credits and bank loans. Ref. [31] classified retailers according to available cash and found that when retailers face capital constraints and suppliers incur bad debt disposal costs, retailers do not rely solely on trade credit at equilibrium but instead combine it with bank loans to form a mixed financing structure. Furthermore, ref. [32] argued that retailers’ choice of financing method depends on their level of risk aversion. Their results indicated that when suppliers’ risk aversion is extremely high or extremely low, bank loans are the only equilibrium strategy. Otherwise, trade credit is the equilibrium strategy.
As environmental imperatives intensify, supply chain financing has expanded to promote low-carbon transitions, providing critical financial support to capital-constrained members who undertake CER investments. Ref. [12] investigated a one-manufacturer-one-retailer supply chain where the retailer is capital-constrained and the manufacturer provides two credit strategies: manufacturer finance and manufacturer investment. They suggested that manufacturers should refrain from extracting excessive wholesale prices or interest rates to promote CER. Ref. [33] considered three strategies, including free low-carbon technology sharing, royalty fee licensing, and a portfolio of royalty and fixed-fee licensing, and found that the first strategy achieves a higher level of CER investments than the other strategies. Moreover, ref. [34] highlighted online peer-to-peer lending as a bank credit supplement that enhances social welfare and promotes CER levels. Ref. [35] summarized how carbon permit prices impact green technology financing models. Specifically, manufacturers should opt for platform financing under low prices, and bank financing otherwise. Ref. [36] addressed the dual challenges of capital constraints and bankruptcy risks through two innovative carbon asset financing schemes. Specifically, pledge financing is preferred for risk containment when carbon prices are volatile or rising. In contrast, sell–buyback financing maximizes upside revenue only during price downturns, enabling asset repurchases at lower costs. Using empirical data from climate-laggard economies, ref. [37] underscored that the efficacy of green finance and technological innovation strictly depends on a stable policy environment. Particularly in high-emission sectors, targeted subsidies are essential to mitigate investors’ “risk-off” behavior under uncertainty and catalyze decarbonization.
2.3. Fairness Concerns
Many scholars recognize the inadequacy of the “economic man” hypothesis, incorporating fairness concerns into operational models for more realistic insights [14,38]. This growing body of literature on supply chain fairness has been comprehensively reviewed by [38]. Specifically, individuals derive disutility from both disadvantageous (jealousy) [17] and advantageous (sympathy) inequity [39]. They are often willing to sacrifice their monetary payoffs to achieve fairness [15]. Motivated by the inherent profit conflicts and asymmetric payoff distributions between upstream and downstream members, ref. [40] incorporated fairness behaviors into analytical models to demonstrate their coordinating role within supply chains. Subsequent studies built upon this foundation and revealed that fairness concerns act as a double-edged sword. On the one hand, fairness concerns can facilitate coordination. Ref. [41] investigates a dynamic forward supply chain with goodwill accumulation, while ref. [42] focuses on closed-loop supply chains involving product recycling and remanufacturing. Despite their distinct research contexts and modeling frameworks, both studies verify that retailers’ fairness concerns can boost channel performance and achieve supply chain coordination under certain conditions. On the other hand, fairness concerns can paradoxically backfire. Ref. [43] examined third-party sellers’ fairness concerns in unequal platform relationships and clarified that they do not significantly impact system efficiency. Nevertheless, under balanced power structures, such concerns can inadvertently reduce total supply chain efficiency. Moreover, ref. [44] found that fairness concerns may have negative consequences, as dominant players’ strong concerns can exacerbate the double marginalization effect.
Recently, this behavioral perspective has been increasingly integrated into green and low-carbon supply chains. Ref. [45] analyzed green e-commerce decision-making and coordination, considering product greenness, platform services, and fairness concerns. They found that when manufacturers are driven by fairness concerns to adjust their decisions, both product greenness and system efficiency deteriorate. Utilizing the Nash bargaining solution as the fairness reference point, ref. [46] investigated a two-echelon sustainable supply chain comprising a green-product manufacturer and a retailer. They underscored that the pursuit of fairness by channel members may unexpectedly prove deleterious, ultimately yielding systemic damage to both environmental benefits and overall chain profitability. Furthermore, ref. [47] revealed that fairness concerns can overturn conventional wisdom regarding green investments. Specifically, the traditional premise that a manufacturer’s green investment strictly dominates a retailer’s is no longer absolute. The equilibrium highly depends upon investment efficiency and the intensity of fairness concerns. Ref. [14] noted that while followers frequently exhibit fairness concerns, such behavioral tendencies are not consistently beneficial to themselves. Yet, they cautioned that if the leader ignores the followers’ fairness preferences, the leader will inevitably suffer profit losses.
2.4. Summary and Contributions
Our study contributes to the literature on low-carbon supply chains by integrating CER technology investments, supply chain financing, and the supply chain member’s fairness concerns. Table 1 intuitively summarize the core differences between our study and related existing studies.
Table 1.
Comparisons of our model and existing studies.
First, prior works have extensively explored various factors influencing CER investments from diverse perspectives. For instance, ref. [1] focused on the impact of consumers’ willingness-to-pay and indicated its positive effect on CER investments. Ref. [4] examined how financing modes and government subsidies affect CER decisions and pointed out the counterintuitive phenomenon that government subsidies may not encourage CER investments. Additionally, ref. [7] investigated the effects of different subsidy schemes (unit vs. investment subsidies) on investment levels and showed that when operation and maintenance costs are high, investment subsidies are more effective to promote CER investments. Despite their distinct focuses, these studies all formulate the investment cost as a one-time cost that follows a quadratic function of the CER level. Under this framework, the manufacturer autonomously decides the investment amount to achieve a target low-carbon level. However, it overlooks practical constraints. In reality, capital-constrained manufacturers often lack the resources for internal R&D, which frequently suffers from diminishing returns and fails to meet expected emission targets [14]. Consequently, driven by stringent global carbon regulations, manufacturers increasingly shift toward external technology licensing [33], which is prevalent in high-tech and fiercely competitive sectors. Moreover, as supply chain carbon emissions become a critical compliance metric, downstream retailers proactively seek to partner with manufacturers demonstrating superior carbon reduction efficiency. This intensifies upstream competition and pushes manufacturers to adopt accessible, high-performance external low-carbon technologies, typically incurring a per-unit licensing fee rather than a one-time upfront cost. Different from the exogenous and fixed unit licensing fee adopted in [33], our paper formulates a quadratic unit licensing fee that varies endogenously with the level of CER technology. This formulation distinguishes the licensing costs associated with different technologies and reflects the practical observation that more advanced CER technologies generally entail higher per-unit royalties. Second, we reveal the strategic interplay among the retailer’s quantity-setting decisions, the intensity of its fairness concerns, and the manufacturer’s production and licensing costs. While most existing studies examine fairness concerns within price-setting frameworks under one-time investments, our model focuses on the retailer’s order quantity autonomy. We demonstrate that the retailer can utilize order quantity as a strategic weapon, engaging in “strategic quantity withholding or expansion” to penalize or reward the manufacturer. This provides a novel perspective on how downstream ordering behaviors fundamentally constrain and shape upstream green technology investments. Third, within the context of supply chain finance and low-carbon technology licensing, we further demonstrate that the retailer’s fairness concerns can act as an endogenous coordinator. Specifically, under certain conditions, this behavioral preference alone can coordinate the supply chain without the need for exogenous mechanisms, such as cost-sharing contracts. This finding further complements and enriches the existing literature.
3. Models
We consider a two-tier supply chain comprising a capital-constrained manufacturer and a capital-abundant retailer, engaged in a manufacturer-led Stackelberg game.
3.1. Model Description
The manufacturer produces low-carbon products with a CER level denoted as h, incurring a unit cost c, and sells them to the retailer at a wholesale price w. Subsequently, the retailer markets the products to consumers at a retail price p (). Carbon emissions include greenhouse gases generated during the production, transportation, usage, and recycling of products, with the CER level representing the reduction in carbon emissions [39]. Driven by growing environmental consciousness, consumers prefer lower-emission products, indicating that adopting CER technologies stimulates market demand. For convenience, we employ an additive inverse demand function, where the retail price p depends on the order quantity q and CER level h, given by
where denotes the maximum market potential price; and represent the sensitivity coefficients of the ordering quantity and CER level, respectively.
Before the selling season, the manufacturer decides whether to adopt CER technologies and, if so, the associated adoption level h. This adoption incurs a quadratic royalty licensing fee per unit product, where k is the CER cost coefficient. This formulation is strongly supported by real-world technology licensing practices, such as the widely adopted Arm licensing model in the semiconductor industry. Customers pay a royalty on each manufactured chip. Furthermore, the per-unit fee increases significantly with the technology’s advancement. For instance, the per-unit royalty for Arm’s latest architecture (Armv9) is approximately double that of its previous generation (Armv8) because of its more advanced Compute Subsystems (CSS) (https://group.softbank/en/ir/financials/annual_reports/2025/message/arm, accessed on 5 August 2026). This quadratic structure captures the increasing difficulty and increasing marginal cost of achieving higher emission reductions [48]. Given its capital constraints, we assume the manufacturer relies on bank financing to cover upfront production costs and prepay CER royalty fees based on production quantities. This financing pressure is particularly acute for manufacturers with limited low-carbon innovation capabilities, as licensing and production costs must be paid before sales revenues are realized. As low-carbon regulations tighten, adopting external technologies becomes a strategic necessity for these manufacturers to maintain market competitiveness and avoid elimination, despite the financial strain. Recognizing this widespread industry hurdle, technology providers have introduced supportive measures. For example, Arm launched the “Flexible Access Program” to alleviate the initial financial burden on technology adopters, successfully supporting over 100 companies in launching more than 400 chip products worldwide. This highlights that upfront licensing fees constitute a critical operational constraint. Alleviating this constraint through financial support can accelerate the green transformation of the supply chain. Under government preferential policies, adopting CER technologies qualifies the manufacturer for a prime loan rate . Otherwise, the manufacturer faces a standard commercial rate (). This aligns with real-world practices, such as in the electric vehicle industry, where governments offer fiscal subsidies (https://www.gov.cn/zhengce/zhengceku/2020-04/23/content_5505502.htm, accessed on 5 August 2026) to accelerate CER technology adoption. Figure 1 illustrates the interaction between supply chain members.
Figure 1.
The interaction between the manufacturer and the retailer. (a) Without CER adoption. (b) With CER adoption.
Furthermore, we assume both supply chain members are risk-neutral and information is symmetric. To ensure the economic validity of the model, we establish the following conditions:
These conditions ensure the equilibrium decisions and profits remain non-negative and unique. Notably, condition (3) guarantees the economic feasibility of the low-carbon technology investment, laying the foundation for the subsequent analysis. Otherwise, if this condition is violated, adopting CER technologies would become unprofitable, and the manufacturer would not implement the technology investment strategy.
3.2. Benchmark Model: Supply Chain Without CER Technology
CER technologies offer environmental and competitive benefits but impose high costs and royalty fees, posing an adoption dilemma for capital-constrained manufacturers. To analyze the impact of CER technologies, we first develop a benchmark model without CER adoption. We then derive and compare the optimal decisions within both centralized and decentralized supply chain models.
In the centralized model (BC), the manufacturer and the retailer collaborate to maximize the overall system profit of the supply chain. The system profit is expressed as
Maximizing the system profit yields the optimal ordering quantity and the maximum system profit as follows:
In the decentralized model (BD), the manufacturer and the retailer operate as distinct economic entities, striving to maximize their individual profits. As the Stackelberg leader, the manufacturer first determines the wholesale price (denoted by ). Subsequently, the retailer, acting as the follower, determines the order quantity (denoted by ). The profit functions for the manufacturer and the retailer are formulated as follows:
Applying backward induction, the optimal wholesale price for the manufacturer and the optimal ordering quantity for the retailer are
The optimal profits for the manufacturer and the retailer are
3.3. Supply Chain with CER Technology
When the manufacturer decides to implement CER technologies, it becomes eligible for a bank loan at a preferential prime rate (denoted by ) to fund both production and the associated royalty licensing fees. In comparison to the benchmark model, the government’s preferential policies allow the manufacturer to secure loans at a reduced rate, thereby incentivizing the adoption of CER technologies and mitigating the repayment risk. In this section, we examine the optimal decisions and profits under both centralized and decentralized structures with CER technology adoption.
In the centralized model (TC), the profit function of the supply chain is formulated as
Solving the first-order conditions yields the optimal decisions and the maximum profit of the supply chain, as presented in Lemma 1.
Lemma 1.
The equilibrium solutions in the centralized model with the introduction of CER technologies are as follows:
The maximum profit of the supply chain is given by
Proof of Lemma 1.
Similarly, in the decentralized model (TD), the manufacturer first determines the wholesale price and the CER level , followed by the retailer deciding the order quantity . The profit functions for the manufacturer and retailer are
Backward induction is employed to analyze the game, and Lemma 2 summarizes the equilibrium solutions.
Lemma 2.
The equilibrium solutions in the decentralized model with CER technologies are
The equilibrium profits of the manufacturer and retailer are given, respectively, by
Proof of Lemma 2.
We solve the Stackelberg game using backward induction. First, taking the first-order and second-order derivatives of (18) with respect to q, we have
Based on (24) and (25), the retailer’s best response function is . Substituting into (17) yields
By simultaneously solving the first-order conditions of (26) with respect to w and h and verifying its joint concavity via the Hessian matrix, we have (19) and (20). Finally, substituting these decisions back directly yields (21)–(23). □
Based on the equilibrium solutions derived in Lemmas 1 and 2, we compare the optimal decisions and supply chain profits between the centralized and decentralized models. The findings are summarized in Proposition 1.
Proposition 1.
(1) The ordering quantity in the decentralized scenario is only half of the quantity in the centralized scenario, i.e., (2) In the decentralized scenario, the equilibrium profit of the retailer is only half of the manufacturer’s, i.e., (3) The equilibrium profit of the supply chain in the decentralized scenario is three-quarters of the supply chain profit in the centralized scenario, i.e.,
Proof of Proposition 1.
Proposition 1 reveals that despite bearing the CER investment costs, the manufacturer’s profit significantly exceeds that of the retailer due to the manufacturer’s leadership advantage. In response to this inequity, the retailer curtails its order quantity, which degrades overall supply chain performance and threatens cooperation. Consequently, to mitigate this conflict, the manufacturer must strategically incorporate the retailer’s fairness concerns into its decision-making. We explicitly model this fairness-concerned scenario in Section 4.
Let denote the interest deduction provided by the government for CER technologies. We next compare the optimal outcomes with and without CER technologies to derive Proposition 2.
Proposition 2.
(1) In a decentralized scenario, compared to the model without CER technology, the manufacturer reduces the wholesale price only when ; otherwise, it raises the wholesale price. (2) The retailer increases the order quantity if the manufacturer introduces CER technologies in both centralized and decentralized scenarios, i.e., , .
Proof of Proposition 2.
Proposition 2(1) demonstrates that the strength of the interest deduction critically shapes the wholesale price. Specifically, a small interest deduction forces the manufacturer to raise the wholesale price to offset its CER cost burden. Conversely, a substantial interest deduction (i.e., a significantly lower loan rate) alleviates the manufacturer’s financial pressure, enabling it to lower the wholesale price to stimulate downstream orders. Figure 2 numerically illustrates these dynamics. Furthermore, increasing (which is mathematically equivalent to decreasing c or k) drives up the wholesale price, as these variations necessitate more stringent loan rate concessions. Managerially, the government can effectively utilize the prime loan rate as a lever to regulate market prices. Proposition 2(2) underscores that the introduction of CER technologies induces the retailer to ordermore products. This behavior can be attributed to the rise in market prices resulting from CER technologies. When the retailer observes increased consumer preference for low-carbon products, it adjusts its orders to align with consumer preferences, even in cases where the manufacturer raises the wholesale price.
Figure 2.
The impact of loan rate on the wholesale price ().
From a macro perspective, Proposition 3 highlights the overall benefits of CER adoption for the supply chain.
Proposition 3.
The introduction of CER technologies consistently benefits the entire supply chain, including both members.
Proof of Proposition 3.
Proposition 3 demonstrates that CER adoption yields a Pareto improvement for the supply chain. The manufacturer benefits from the increased order quantity and reduced financing costs via the interest deduction. Meanwhile, the retailer benefits from selling green products to meet green market demand without bearing the CER investment burden. However, despite this absolute profit growth, the relative profit distribution remains highly skewed in the manufacturer’s favor, creating severe inequity. In practice, a fairness-concerned retailer may penalize such inequitable outcomes, potentially jeopardizing supply chain stability. Therefore, Section 4 explicitly incorporates the retailer’s fairness concerns to investigate optimal decision-making and explore potential supply chain coordination mechanisms.
4. Low-Carbon Supply Chain with Fairness Concerns
In this section, we introduce the retailer’s fairness concerns into the low-carbon supply chain. Although retailers typically act as followers in the supply chain, extensive behavioral and empirical studies in operations management indicate that they also emphasize the fairness of profit distribution. As demonstrated by Proposition 1 in Section 3, under decentralized decision-making, the manufacturer’s investment in CER technology leads to a pronounced profit imbalance, leaving the retailer with only half of the manufacturer’s profit. In practice, when retailers perceive such an inequitable profit distribution, they often exert pressure on manufacturers by adjusting order quantities or even threatening to terminate cooperation for fairness. Furthermore, ref. [14] confirmed that manufacturers who ignore retailers’ fairness concerns often suffer profit losses. Thus, fully considering the retailer’s fairness concerns is both reasonable and practically necessary.
Beyond mitigating profit conflicts, integrating fairness concerns may offer a potential pathway for supply chain coordination. Specifically, ref. [40] demonstrated that introducing fairness concerns can effectively overcome the classic coordination dilemma in which a traditional wholesale price contract fails to coordinate a supply chain with purely profit-maximizing members [49]. Motivated by this, this section aims to investigate whether the retailer’s fairness concerns can successfully coordinate the low-carbon supply chain under our specific model settings. Successful coordination inherently maximizes the total supply chain profit. Coupling this coordination with a fair profit allocation aligns individual incentives, thereby driving the long-term stability of the low-carbon supply chain. Figure 3 illustrates the interaction between the manufacturer and the retailer with fairness concerns.
Figure 3.
The interaction between the manufacturer and the retailer with fairness concerns.
4.1. Retailer’s Decision
When the retailer is concerned about fairness, it not only prioritizes its own monetary profit but also places importance on the equitable distribution of profits between both supply chain members. Drawing on the inequity aversion concept introduced by [15] and the fairness model developed by [40], we further posit that the retailer seeks to maximize a utility function, denoted as U, which encompasses both monetary profitability and fairness concerns. The utility function is
In this formulation, the parameters and quantify the retailer’s aversion to inequitable profit distributions, reflecting its emphasis on fairness within the supply chain.
From the retailer’s perspective, when the manufacturer’s profit surpasses its own, an unfavorable inequality arises, leading to a reduction in utility by per unit of difference between the two profits. Conversely, when the retailer’s profit exceeds the manufacturer’s profit, a favorable inequality occurs, and the retailer’s utility diminishes by per unit of difference. Here, and represent the coefficients of disadvantageous and advantageous inequalities, respectively, with the condition . The existence of inequity aversion implies that the retailer will strive to mitigate the disutility stemming from inequality, even if it entails a reduction in its monetary profit. Notably, the retailer exhibits a lower tolerance for disadvantageous inequality compared to advantageous inequality. Rewriting the utility function in the form of a piecewise function, we have
When the manufacturer’s profit is higher, and the retailer experiences disadvantageous inequality, i.e., or equivalently , the decision model for the retailer is formulated as follows:
In this scenario, the optimal order quantity is determined by
where . Consequently, the retailer’s maximum utility is
When the retailer enjoys better profitability, resulting in advantageous inequality ( or ), its decision model is formulated as
Similarly, we can derive the optimal order quantity and maximum utility:
where , and
Whether the manufacturer’s profit is higher or lower than the retailer’s, disadvantageous or advantageous inequality occurs, prompting the retailer to make decisions that maximize its utility. Since the retailer’s optimal decisions under these two types of inequality differ, a comparison of the retailer’s utility under both scenarios, i.e., in (36) and in (39), is necessary. It is noted that always holds. Therefore, the retailer’s optimal utility can be expressed as
The optimal order quantity for any given w and h is given by
Equation (41) reveals how fairness concerns behaviorally distort the retailer’s ordering decisions compared to those in the profit-maximizing benchmark ( for any given wholesale price and CER level). Specifically, when the manufacturer sets a high wholesale price (), disadvantageous inequality triggers a penalty effect: the retailer orders strictly less than , willingly sacrificing its own profit to penalize the manufacturer’s pricing and restore equity. Conversely, a sufficiently low wholesale price () induces advantageous inequality, prompting a reward effect where the retailer orders more than , again trading profit for fairness. However, an intermediate wholesale price () naturally achieves profit parity (). In this equitable regime, the retailer’s fairness concerns become inactive, allowing the retailer to focus on profit maximization. An equitable outcome will be achieved.
4.2. Manufacturer’s Decision
Since the manufacturer is assumed not to be concerned about fairness, it sets the wholesale price to maximize its profit by anticipating the retailer’s optimal order quantity decision, as given in (41). In this subsection, we aim to explore the manufacturer’s optimal decisions when faced with a retailer with fairness concerns and analyze how such fairness concerns affect the decisions of both members and the overall dynamics of the low-carbon supply chain.
The analysis of the manufacturer’s optimal decisions mirrors that of the retailer. Based on the three order quantity ranges outlined in (41), we investigate the optimal wholesale price and CER level within each of these ranges. Subsequently, we derive the globally optimal decisions by comparing the results across the three scenarios.
Case 1: If the manufacturer sets its wholesale price within the range , then its decision model is given by
Since and , it is obvious that is concave when , convex when , and monotonically increasing when . By setting , we can obtain a critical value
If , since is concave and , the optimal wholesale price equals . If , since is convex and , the optimal wholesale price still equals . If , is monotonically increasing, and the optimal wholesale price also equals . Substituting into , we can derive from the first-order condition. Thus, in this scenario, the optimal wholesale price and the manufacturer’s maximum profit are
Case 2: If the manufacturer sets its wholesale price within the range , then its decision model is given by
Since and , we can infer that is concave in w. By solving , we obtain
Comparing with and , we have
If , i.e., , the optimal wholesale price is . If , i.e., , the optimal wholesale price is . Substituting the respective optimal wholesale prices into the profit function yields the optimal CER level . Consequently, the optimal wholesale price and the manufacturer’s maximum profit are given by
Case 3: If the manufacturer sets its wholesale price within the range , then its decision model is given by
Since and , it is evident that is strictly concave in w. By solving , we obtain
Considering that , we need to discuss the range of that influences the value of .
If , i.e., , the optimal wholesale price is . If , i.e., , the optimal wholesale price is . Substituting the respective optimal wholesale prices into , it can be determined that the optimal CER level also equals , which is independent of the value of . Therefore, the optimal wholesale price and manufacturer’s maximum profit are given by
By comparing all possible results in cases 1–3, the manufacturer can determine the globally optimal decision. The globally optimal wholesale price and manufacturer’s profit are summarized in (56):
where , , .
Figure 4 depicts the manufacturer’s profit under various combinations of parameters and , illustrating the results in (56). Moreover, Table 2 systematically summarizes all equilibrium decisions and corresponding profits under the four distinct conditions for the following analysis.
Figure 4.
Manufacturer’s profit under different combinations of and (). Note: On the right side, some curves overlap, which may cause a visual effect that appears as a color not included in the legend.
Table 2.
Equilibrium results under the decentralized decision-making framework considering retailer’s fairness concerns.
4.3. Analysis of Results
To visually illustrate the equilibrium results presented in (56), we show the equilibrium states of the retailer’s fairness concerns through a graphical representation with four distinct regions, as depicted in Figure 5. The thresholds , , and serve as demarcations, partitioning the parameter space into five distinct regions, excluding the infeasible region R0. Regions R1, R2, and R3 correspond to the first, second, and third cases in (56), respectively, while the fourth case is represented by region R4, denoted by the distinctive red solid line.
Figure 5.
The regions of retailer’s fairness states in equilibrium.
We proceed to deliberate upon the optimal decisions and maximal profit attainable by the members of the supply chain under the retailer’s fairness concerns. These results are benchmarked against scenarios TC and TD, where fairness concerns are absent. Let , , , , and denote the equilibrium results when the retailer’s fairness state falls within region (). The following propositions summarize our analytical findings.
Proposition 4.
In the scenario where the retailer’s fairness state falls in region R1:
- (1)
- With an increase in β, decreases, while , , , and increase. remains unaffected by variations in β.
- (2)
- In comparison to the low-carbon decentralized supply chain without fairness concerns, the manufacturer reduces the wholesale price, resulting in lower profit; the retailer simultaneously elevates the order quantity, yielding higher profit; the system profit is increased. Specifically, , , , , and .
- (3)
- While the manufacturer’s profit consistently equals the retailer’s profit, achieving coordination remains unattainable in this particular scenario.
Proof of Proposition 4.
(1) Taking the first-order derivatives of , , , , with respect to , we have
(2) Comparing the equilibrium results when the retailer’s fairness state falls in R1 with those under the TD scenario, we have
(3) Comparing with (16), we have
Thus, the supply chain cannot achieve coordination in this scenario. □
Proposition 4 analyzes the equilibrium in region R1, and Figure 6 provides a more intuitive illustration of the corresponding results. Proposition 4 elucidates that when the manufacturer opts for a relatively low wholesale price, the retailer, driven by advantageous inequity aversion, chooses to reward the manufacturer by ordering more products, as shown in Figure 6a. Despite the resultant decrease in the retail price, which potentially impacts the retailer’s individual profit, the equilibrium demonstrates that the retailer’s gain from a lower wholesale price outweighs the potential loss associated with the increased order quantity. Conversely, the effect on the manufacturer is inverse. Consequently, the retailer attains a higher profit, while the manufacturer incurs lower profit, resulting in a more equitable profit distribution. This finding is shown in Figure 6b. Furthermore, due to the retailer’s inclination to accommodate the manufacturer’s profit, the supply chain ultimately achieves a superior state compared to the decentralized scenario devoid of fairness concerns, which is depicted in Figure 6c. However, owing to the relatively moderate influence of advantageous inequality, the wholesale price contract under this condition still falls short of coordinating the supply chain, aligning with the findings of [50]. Specifically, as illustrated in Figure 6c, the attainable efficiency of the supply chain varies across different values of . Ultimately, whether the supply chain can achieve perfect coordination, where the aggregate profit under the decentralized decision-making framework equals the total system profit under the centralized decision-making framework, depends on the retailer’s value.
Figure 6.
The impact of the coefficient of advantageous inequality in region R1 (). (a) Equilibrium decisions. (b) Equilibrium profits. (c) Supply chain efficiency.
For the manufacturer, when confronted with the retailer exhibiting a relatively low level of aversion to advantageous inequality, the optimal strategy is to establish a comparatively low wholesale price. This choice aims to elicit the retailer’s generosity, encouraging a higher-order quantity. Considering that the optimal order quantity and the maximum profits of both parties are positively correlated with the advantageous inequality coefficient , the manufacturer’s decisions, when fully accounting for the retailer’s advantageous inequity aversion, lead to an improved outcome for both the upstream and downstream members.
Proposition 5.
In the scenario where the retailer’s fairness state falls in region R2:
- (1)
- With an increase in α, and decrease, while increases. , , and are independent of α.
- (2)
- In comparison to the low-carbon decentralized supply chain without fairness concerns, the manufacturer reduces the wholesale price, resulting in lower profit; the retailer maintains the order quantity, achieving higher profit; the system profit remains unchanged. Specifically, , , , , and .
- (3)
- The manufacturer’s profit surpasses the retailer’s profit, and supply chain coordination remains unattainable.
Proof of Proposition 5.
(1) Taking the first-order derivatives of , , and with respect to , we have
(2) Comparing the equilibrium results when the retailer’s fairness state falls in R2 with the equilibrium results under TD scenario, we have
(3) According to (75) and , we conclude that the supply chain cannot achieve coordination when the retailer’s fairness state falls in region R2. □
Proposition 5 and Figure 7 provide mutually reinforcing insights into the equilibrium analysis for region R2. Proposition 5 elucidates that when the manufacturer contemplates proposing a relatively high wholesale price, the retailer’s concern for disadvantageous inequality prompts the retailer to maintain the order quantity at a steady level. As the retailer reacts moderately to disadvantageous inequality (referred to as “mild fairness concern” by [50]), the retailer chooses to keep the baseline order quantity unchanged, which is shown in Figure 7a. Consequently, this leads to a decrease in the manufacturer’s profit and an increase in the retailer’s profit. However, the goal of achieving perfect fairness is not fulfilled due to the insufficient level of fairness concern, which is revealed in Figure 7b. Similarly, supply chain coordination is not achieved. Despite the retailer’s preference for mitigating disadvantageous inequality, the overall efficiency of the supply chain fails to improve, which is substantiated by the trends depicted in Figure 7c.
Figure 7.
The The curves represent different variables (as specified in the legend), impact of the coefficient of disadvantageous inequality in region R2 (). (a) Equilibrium decisions. (b) Equilibrium profits. (c) Supply chain efficiency.
Furthermore, in region R2, both the wholesale price and the manufacturer’s profit exhibit a decreasing trend with , while the retailer’s profit follows the opposite trajectory. This phenomenon arises because the manufacturer opts to reduce the wholesale price to accommodate the retailer’s moderate level of aversion to disadvantageous inequality, while the retailer maintains the order quantity. Despite this, the total profit of the supply chain does not witness improvement compared to the TD scenario. This implies that a mere transference of profit occurs, with the manufacturer earning less from the retailer’s orders, and the retailer benefiting from the wholesale price discount without concerns about the impact on the retail price. For the manufacturer, facing the retailer with a low level of aversion to disadvantageous inequality results in a scenario worse than the TD scenario, with no potential enhancement in supply chain performance regardless of adjustments to decision variables.
Proposition 6.
In the scenario where the retailer’s fairness state falls in region R3 or R4:
- (1)
- In comparison to the low-carbon decentralized supply chain without fairness concerns, the manufacturer reduces the wholesale price and attains an equal profit; the retailer increases the order quantity, achieving higher profit; and the system profit is higher. Specifically, , , , , and ;
- (2)
- The manufacturer’s profit equals the retailer’s profit, resulting in supply chain coordination in this scenario.
Proof of Proposition 6.
(1) Comparing the equilibrium results when the retailer’s fairness state falls in R3 with the equilibrium results under TD scenario, we have
When the retailer’s fairness state falls in region R4, the equilibrium results are identical to the results in R3.
(2) Since , the supply chain can achieve coordination when the retailer’s fairness state falls in region R3 or R4. □
Proposition 6 illustrates that when the retailer has a high level of fairness concern, the manufacturer’s optimal choice is to reduce the wholesale price, encouraging the retailer to increase the order quantity. In this case, the manufacturer’s maximum profit matches that in the TD scenario, which outperforms the outcomes in regions R1 and R2. Moreover, the manufacturer’s optimal decisions effectively maximize the supply chain’s total profit while achieving perfect fairness. This implies that the wholesale price set by the manufacturer successfully aligns all members’ objectives with the overall performance of the supply chain, effectively eliminating the issue of double marginalization. This result contrasts with the conclusion of [43] in electronic supply chains, which posits that fairness and efficiency cannot coexist.
The underlying mechanism hinges on strategically managing the retailer’s inequity aversion. While disadvantageous inequality exacerbates double marginalization through the retailer’s penalty behavior (a lose–lose outcome), strong advantageous inequality (e.g., ) allows the manufacturer to leverage the retailer’s reciprocal goodwill. By offering a generous wholesale markdown, the manufacturer induces the retailer to willingly increase the order quantity, effectively trading a margin premium for channel volume.
Synthesizing the aforementioned propositions, we conclude that the retailer’s fairness concerns systematically erode the manufacturer’s dominance. To preempt the retailer’s defensive penalty actions, the manufacturer is forced to make persistent pricing concessions. Consequently, the manufacturer’s equilibrium profit never exceeds the TD benchmark (only achieving equal profit in regions R3 or R4), whereas the retailer consistently secures a strictly higher profit than in the TD setting.
Consequently, in situations where the retailer is concerned about fairness, a retailer with a high level of fairness concern is preferable from the manufacturer’s perspective. However, this preference does not imply the acceptance of unfavorable outcomes. Notably, the supply chain’s profit is not lower than that of the TD scenario, and the manufacturer can pursue additional profit by designing a contract with the retailer to manage the profit distribution effectively in response to the retailer’s fairness concern.
In addition to examining the optimal decisions and performances within each specific case, we conduct a cross-regional comparison of these outcomes, leading to intriguing findings as presented in the following propositions.
Proposition 7.
The wholesale price exhibits an initial decrease followed by an increase with the rise in prime loan rate. Specifically:
- (1)
- It decreases when and increases when in R1;
- (2)
- It decreases when and increases when in R2;
- (3)
- It decreases when and increases when in R3 and R4.
Proof of Proposition 7.
Taking the first-order derivative of with respect to , we have
Taking (81) as an example, it is easy to obtain the critical threshold such that . Since is strictly increasing in , it is evident that only when and only when . This analytical procedure applies equally to (82)–(84). Therefore, further derivations are omitted for brevity. □
Proposition 7 illuminates the manufacturer’s wholesale price adjustments based on the prime loan rate when the adoption of CER technologies is determined. In the context of the retailer’s fairness concern, the wholesale price initially decreases and subsequently increases with the prime loan rate, and these changes are contingent on the fairness concern coefficients and . This proposition, similar to Proposition 2(1), provides more detailed insights. The convexity of the wholesale price in implies that the concessions made by the manufacturer are bounded. With an extremely low prime loan rate, the manufacturer raises the wholesale price to maximize marginal profit. Furthermore, since supply chain coordination is contingent on the wholesale price falling within a specific range, the prime loan rate becomes a crucial consideration for both the manufacturer and the retailer. Figure 8 illustrates the results through numerical experiments. Specifically, Figure 8 highlights the significant impact of the prime loan rate on the wholesale price. For instance, in Figure 8b, when , the wholesale price displays a clear non-monotonic trend as increases, thereby supporting our theoretical findings. It should be noted that Proposition 7 comprehensively accounts for the joint influence of the parameter set , yet Figure 8 serves as a visual representation under a specific parameter configuration.
Figure 8.
The impact of the prime loan rate on the wholesale price (). (a) In region R1. (b) In region R2. (c) In regions R3 and R4.
Furthermore, the level of technology investment constitutes another pivotal decision variable for the manufacturer. It is jointly determined with the wholesale price and shapes the supply chain performance. Synthesizing the insights from the preceding propositions yields the following result.
Proposition 8.
Regardless of the retailer’s fairness orientation and the level of fairness concern, the manufacturer’s optimal CER level always equals .
Proof of Proposition 8.
According to (15), (20), and Table 2, Proposition 8 is immediately evident. □
Proposition 8 demonstrates that although the optimal price exhibits a piecewise structure comprising three curves, the optimal CER level remains unique. In previous studies, it is often concluded that the manufacturer will adopt CER technologies only under certain conditions [20], while in our setting, the manufacturer will always adopt CER technologies, which highlights the advantage of our proposed mechanism in promoting sustainable production. The optimal CER level is independent of the retailer’s fairness concern and is only influenced by the prime loan rate , the sensitivity coefficient of the CER level , and the cost coefficient k of CER technologies. Notably, a lower prime loan rate offered by the bank enables the manufacturer to adopt a higher CER level in low-carbon production. Therefore, policymakers should take this into account when formulating policies because it implies that government-provided preferential policies can effectively induce the manufacturer to upgrade its CER technologies and reduce carbon emissions, aligning with the government’s objective.
5. Discussion
In this section, we compare our findings with those in closely related studies to analyze the underlying causes of the differences in results and identify robust managerial implications.
A key insight is that the structure of green technology investment fundamentally reshapes how behavioral factors influence strategic decisions, particularly regarding CER levels and supply chain members’ profits. Prior studies often modeled green investment as a one-time cost [18,25]. Although this total cost is incurred upfront by the manufacturer, its impact on profitability is realized only through future sales volume. Specifically, a larger sales volume reduces the per-unit burden of the investment, while a smaller order increases it. As a result, the feasibility and profitability of the investment highly depend on downstream members’ decisions. When the retailer exhibits fairness concerns, it may respond strategically by adjusting its decision to reduce the expected return on the manufacturer’s irreversible investment. Anticipating such behavior, the manufacturer rationally reduces its investment in green technology [47]. Therefore, in existing studies, fairness concerns often lead to lower product greenness and reduced environmental performance [12]. In contrast, our model departs from this conventional setup by treating CER technology as a per-unit royalty licensing fee, which transforms the nature of investment from a one-time burden into a variable marginal cost. This structure reflects real-world practices in high-tech industries, which is also suitable for CER technology. This shift leads to a different result that the optimal CER level remains the same regardless of the retailer’s fairness preferences. The underlying reason is that the manufacturer internalizes the investment cost of low-carbon technologies as an explicit product cost. When the manufacturer sets the wholesale price, it has already fully considered the per-unit cost of technological inputs. As long as the retailer’s marginal willingness to pay for low-carbon products exceeds the wholesale price, CER technology adoption remains economical. Thus, our model reveals that when green technologies are accessed through licensing mechanisms, sustainability investments become more resilient to behavioral frictions within the supply chain.
Despite these differences, our work also identifies a robust conclusion. Regardless of the type of CER technology investment, the manufacturer consistently responds to retailer fairness concerns by lowering the wholesale price [12,14]. This pricing concession serves as an approach to cope with the retailer’s fairness concerns, which mitigates the double marginalization effect under the wholesale contract [40]. However, the ultimate consequences for the supply chain diverge because of the change of CER level. In traditional models, the decline in product greenness dampens market demand, which harms both parties in the supply chain. This means that the retailer’s fairness concerns do not necessarily work in its favor. Conversely, in our model, because the green level remains constant and the wholesale price decreases, the retailer always benefits from its fairness concerns. For the manufacturer, traditional studies suggest that fairness concerns erode upstream profits. Yet, our results show that such profit loss occurs only when the retailer’s fairness preference is not relatively high. When the retailer exhibits sufficiently strong fairness concerns, the manufacturer can maintain its profit, and the entire supply chain achieves coordination without any additional contracting mechanisms. This result is consistent with [42], who obtained the same result in a closed loop supply chain. Although the manufacturer can prevent profit erosion under specific conditions, our findings broadly indicate that it remains difficult for the manufacturer to gain additional profit from the retailer’s fairness concerns. This phenomenon may stem from the manufacturer’s first-mover advantage in a manufacturer-led supply chain, which inherently positions it to capture a larger share of the profit. Nevertheless, the manufacturer is forced to account for the irrational decisions triggered by the retailer’s fairness-seeking behavior. Consequently, making concessions, such as lowering the wholesale price, becomes a strategic necessity for the manufacturer to minimize its own profit loss. This conclusion is consistent with the findings in the existing literature [12,14].
6. Conclusions
Considering that many countries have introduced policies to facilitate low-carbon transformation of native manufacturing industry and offer financial support for manufacturers incentivized to transform but are constrained by heavy investments in CER technologies, we accordingly design a two-tier supply chain with capital constraints in the realm of green financing. We delve into the dynamics of a low-carbon supply chain comprising a capital-abundant retailer and a capital-constrained manufacturer. The manufacturer, facing constraints, seeks a loan from the bank to facilitate production and implement CER technologies. Under a constant wholesale price contract, the manufacturer sets the wholesale price, and the retailer, in response, determines the order quantity for consumer transactions. Through the construction of three models, we conduct comparative analyses and summarize significant managerial insights and practical implications for supply chain practitioners and policymakers.
First, for capital-constrained manufacturers, provided that consumers exhibit a sufficient willingness to pay a premium for low-carbon products, adopting CER technologies under green financing can be highly beneficial. This is because the per-unit licensing cost is fully internalized into the production cost when setting the wholesale price, allowing the manufacturer to secure a positive margin on each unit sold. However, managers must be acutely aware that the resulting profit disparities can trigger fairness concerns from downstream retailers. To prevent retailers from penalizing the manufacturer by reducing order quantities, manufacturers should proactively make concessions in wholesale pricing. Our results demonstrate that offering a strategically lower wholesale price can appease the retailer, maintain or stimulate higher order volumes, and effectively mitigate the double marginalization effect to some extent, which, under specific conditions, can ultimately lead to supply chain coordination and a win–win outcome.
Second, retailers should recognize that their fairness concerns are not just psychological reactions but effective strategic levers in supply chain negotiations. We reveal that a high level of fairness concern from the retailer forces the manufacturer to lower the wholesale price, leading to a more equitable profit distribution. By appropriately signaling their fairness preferences, retailers can safeguard their own profitability while simultaneously driving the whole supply chain towards a more efficient and coordinated state.
Third, our findings indicate that, under the per-unit licensing framework for CER technology adoption, the optimal level of a manufacturer’s CER technology investment is independent of the retailer’s behavioral preferences. This implies that, when consumers are willing to pay for low-carbon products, the green transition has become a key trend for future development. Furthermore, this optimal investment level in our model is significantly influenced by the green loan rate. Consequently, policymakers and financial institutions can directly shape a manufacturer’s technology investment decisions within this specific framework by adjusting green financing rates. Favorable loan rates function as a potent policy instrument to promote manufacturers’ low-carbon investments, thereby aligning corporate operations with broader national and global sustainability targets.
While our study provides valuable insights into the fairness-concerned low-carbon supply chain, several limitations should be acknowledged, which also pave the way for future research. First, our analytical framework is built upon a supply chain consisting of a single capital-constrained manufacturer and a single capital-abundant retailer. Although this setting highlights the core mechanism, it cannot fully capture the complex competitive and collaborative dynamics present in real markets. Future studies could extend this model (e.g., multiple manufacturers with multiple competing retailers) to investigate the impact of horizontal competition. Second, we focus exclusively on the retailer’s fairness concern. In practice, manufacturers may also possess fairness preferences, especially when bearing the financial risks of CER investments. Exploring bilateral fairness concerns would be an interesting avenue to see how they reshape pricing and technology-investment decisions. Third, our model relies on a deterministic environment, assuming deterministic demand, perfect information transparency, and a 100% success rate for CER investments. However, low-carbon operations are fraught with uncertainties in the real world. Market demand is often stochastic, supply chain members may hold private information, and green technology investments inherently carry failure risks. Therefore, relaxing these deterministic assumptions, such as incorporating stochastic demand, applying Bayesian games for information asymmetry, or modeling CER investment risks, represents a crucial and promising direction for future research to further validate and extend our findings.
Author Contributions
Conceptualization, H.C., Y.-W.L., G.-H.L. and X.Z.; methodology, H.C., Y.-W.L., G.-H.L. and X.Z.; software, H.C.; validation, H.C. and Y.-W.L.; formal analysis, H.C.; resources, Y.-W.L., G.-H.L. and X.Z.; writing—original draft, H.C.; writing—review and editing, Y.-W.L., G.-H.L. and X.Z.; supervision, Y.-W.L., G.-H.L. and X.Z.; project administration, Y.-W.L., G.-H.L. and X.Z.; funding acquisition, Y.-W.L. and G.-H.L. All authors have read and agreed to the published version of the manuscript.
Funding
This work was funded by the National Natural Science Foundation of China under Grants [12571324, 72501169], the China Postdoctoral Science Foundation under Grant [2024M761920], and the Postdoctoral Fellowship Program of CPSF under Grant [GZC20250524].
Data Availability Statement
The original contributions presented in this study are included in the article. Further inquiries can be directed to the corresponding authors.
Acknowledgments
The authors would like to thank Academic Editor and three anonymous referees for their constructive comments that have helped in improving this article substantially.
Conflicts of Interest
The authors declare no conflicts of interest.
References
- Xia, S.; Ling, Y.; De Main, L.; Lim, M.K.; Li, G.; Zhang, P.; Cao, M. Creating a low carbon economy through green supply chain management: Investigation of willingness-to-pay for green products from a consumer’s perspective. Int. J. Logist-Res. App. 2024, 27, 1154–1184. [Google Scholar] [CrossRef] [Scilit]
- Bao, B.; Ma, J.; Goh, M. Short-and long-term repeated game behaviours of two parallel supply chains based on government subsidy in the vehicle market. Int. J. Prod. Res. 2020, 58, 7507–7530. [Google Scholar] [CrossRef] [Scilit]
- Kang, K.; Zhao, Y.; Zhang, J.; Qiang, C. Evolutionary game theoretic analysis on low-carbon strategy for supply chain enterprises. J. Clean. Prod. 2019, 230, 981–994. [Google Scholar] [CrossRef] [Scilit]
- Liang, Y.; Zhang, Q. ESG equity or green credit: Financing strategies for green transformation in the supply chain under consumption subsidies. Int. J. Prod. Econ. 2025, 280, 109491. [Google Scholar] [CrossRef] [Scilit]
- Ma, J.; Si, F.; Zhang, Q.; Huijiang. Evolution delayed decision game based on carbon emission and capacity sharing in the Chinese market. Int. J. Prod. Res. 2023, 61, 6675–6690. [Google Scholar] [CrossRef] [Scilit]
- Chen, W.; Ma, Y.; Bai, C. The impact of carbon emission quota allocation regulations on the investment of low-carbon technology in electric power industry under peak-valley price policy. IEEE Trans. Eng. Manag. 2021, 71, 374–391. [Google Scholar] [CrossRef] [Scilit]
- Chen, J.; Lin, X.; Ye, J.; Wang, S.; Liu, J. Decarbonising the maritime supply chain: Per-unit subsidies or investment support? Int. J. Logist-Res. App. 2025, 29, 955–978. [Google Scholar] [CrossRef] [Scilit]
- Cong, J.; Pang, T.; Peng, H. Optimal strategies for capital constrained low-carbon supply chains under yield uncertainty. J. Clean. Prod. 2020, 256, 120339. [Google Scholar] [CrossRef] [Scilit]
- Xia, T.; Wang, Y.; Lv, L.; Shen, L.; Cheng, T. Financing decisions of low-carbon supply chain under chain-to-chain competition. Int. J. Prod. Res. 2023, 61, 6153–6176. [Google Scholar] [CrossRef] [Scilit]
- Liang, N.; Zhang, Q. A differential game of ingredient branding supply chain with Nash bargaining fairness concern. Omega-Int. J. Manag. Sci. 2026, 141, 103489. [Google Scholar] [CrossRef] [Scilit]
- Kang, K.; Tan, B.Q. Carbon emission reduction investment in sustainable supply chains under cap-and-trade regulation: An evolutionary game-theoretical perspective. Expert Syst. Appl. 2023, 227, 120335. [Google Scholar] [CrossRef] [Scilit]
- Tang, R.; Yang, L.; Ji, J. Impacts of fairness concerns on financing equilibrium in a low-carbon supply chain. Transp. Res. Part E Logist. Transp. Rev. 2023, 180, 103328. [Google Scholar] [CrossRef] [Scilit]
- Ma, S.; He, Y.; Gu, R.; Li, S. Sustainable supply chain management considering technology investments and government intervention. Transp. Res. Part E Logist. Transp. Rev. 2021, 149, 102290. [Google Scholar] [CrossRef] [Scilit]
- Zhai, Y.; Deng, H.; Xu, S.; Huang, G.Q.; Cheng, T.C.E. Carbon emissions hedging and green marketing. Eur. J. Oper. Res. 2026, 328, 797–814. [Google Scholar] [CrossRef] [Scilit]
- Fehr, E.; Schmidt, K.M. A theory of fairness, competition, and cooperation. Q. J. Econ. 1999, 114, 817–868. [Google Scholar] [CrossRef] [Scilit]
- Tao, J.; Shao, L.; Guan, Z.; Ho, W.; Talluri, S. Incorporating risk aversion and fairness considerations into procurement and distribution decisions in a supply chain. Int. J. Prod. Res. 2020, 58, 1950–1967. [Google Scholar] [CrossRef] [Scilit]
- Ji, Y.; Qiu, R.; Ji, S.; Sun, M.; Fan, Z. E-retailer’s secondhand product market entry and manufacturer’s rebate decisions considering fairness concerns. Eur. J. Oper. Res. 2025, 329, 219–238. [Google Scholar] [CrossRef] [Scilit]
- Cai, J.; Jiang, F. Decision models of pricing and carbon emission reduction for low-carbon supply chain under cap-and-trade regulation. Int. J. Prod. Econ. 2023, 264, 108964. [Google Scholar] [CrossRef] [Scilit]
- Kang, Y.W.; Dong, P.W.; Ju, Y.B.; Zhang, T.Y. Differential game theoretic analysis of the blockchain technology investment and carbon reduction strategy in digital supply chain with government intervention. Comput. Ind. Eng. 2024, 189, 109953. [Google Scholar] [CrossRef] [Scilit]
- Yang, M.; Chen, X. Green technology investment strategies under cap-and-trade policy. IEEE Trans. Eng. Manag. 2024, 71, 3867–3880. [Google Scholar] [CrossRef] [Scilit]
- Liu, W.H.; Qiu, J.C.; Cao, Y.N.; Dong, J.X. Government subsidy mechanism design for supply chain enterprises adopting carbon reduction technology: A model examination with tripartite evolutionary game. Ann. Oper. Res. 2026. [Google Scholar] [CrossRef] [Scilit]
- Zakeri, A.; Dehghanian, F.; Fahimnia, B.; Sarkis, J. Carbon pricing versus emissions trading: A supply chain planning perspective. Int. J. Prod. Econ. 2015, 164, 197–205. [Google Scholar] [CrossRef] [Scilit]
- Ji, J.; Zhang, Z.; Yang, L. Comparisons of initial carbon allowance allocation rules in an O2O retail supply chain with the cap-and-trade regulation. Int. J. Prod. Econ. 2017, 187, 68–84. [Google Scholar] [CrossRef] [Scilit]
- Chen, X.; Yang, H.; Wang, X.J.; Choi, T.M. Optimal carbon tax design for achieving low carbon supply chains. Ann. Oper. Res. 2025, 349, 821–848. [Google Scholar] [CrossRef] [Scilit]
- Chen, W.; Zhu, R.N.; Chen, J.; Ma, Y.K. Impacts of carbon tax policies on low-carbon technology investment in the electricity supply chain under peak–valley pricing. IEEE Trans. Eng. Manag. 2025, 72, 3151–3165. [Google Scholar] [CrossRef] [Scilit]
- Hua, J.W.; Wang, K.; Lin, J.; Qian, Y.J. Carbon tax vs. carbon cap-and-trade: Implementation of carbon border tax in cross-regional production. Int. J. Prod. Econ. 2024, 274, 109317. [Google Scholar] [CrossRef] [Scilit]
- Buzacott, J.A.; Zhang, R.Q. Inventory management with asset-based financing. Manag. Sci. 2004, 50, 1274–1292. [Google Scholar] [CrossRef] [Scilit]
- Tang, R.; Yang, L. Impacts of financing mechanism and power structure on supply chains under cap-and-trade regulation. Transp. Res. Part E Logist. Transp. Rev. 2020, 139, 101957. [Google Scholar] [CrossRef] [Scilit]
- Chen, X.; Lu, Q.; Cai, G. Buyer financing in pull supply chains: Zero-interest early payment or in-house factoring? Prod. Oper. Manag. 2020, 29, 2307–2325. [Google Scholar] [CrossRef] [Scilit]
- Kouvelis, P.; Zhao, W. Who should finance the supply chain? Impact of credit ratings on supply chain decisions. M&SOM-Manuf. Serv. Oper. Manag. 2018, 20, 19–35. [Google Scholar] [CrossRef] [Scilit]
- Yang, S.A.; Birge, J.R. Trade credit, risk sharing, and inventory financing portfolios. Manag. Sci. 2018, 64, 3667–3689. [Google Scholar] [CrossRef] [Scilit]
- Yang, H.; Zhen, Z.; Wan, H. Optimal portfolio financing selection in a capital-constrained supply chain with risk-averse members. Appl. Econ. 2021, 53, 4713–4733. [Google Scholar] [CrossRef] [Scilit]
- Lai, Z.; Lou, G.; Chung, S.-H.; Fan, T.; Ma, H.; Yu, M. The bright side of low-carbon technology sharing in a capital-constrained supply chain. Transp. Res. Part E Logist. Transp. Rev. 2025, 193, 103827. [Google Scholar] [CrossRef] [Scilit]
- Gao, G.X.; Li, X.; Bai, Z.; Wang, J.; Jiang, H. Financing a low-carbon supply chain through online peer-to-peer lending. IEEE Trans. Eng. Manag. 2022, 71, 5044–5056. [Google Scholar] [CrossRef] [Scilit]
- Xu, X.; Chen, X.; Choi, T.M.; Cheng, T. Platform financing versus bank financing:“When to choose which” for green production systems. Eur. J. Oper. Res. 2024, 317, 515–532. [Google Scholar] [CrossRef] [Scilit]
- Li, J.; Xu, X.; Huang, S.; Wang, W. Low-carbon supply chain management: Manufacturer capital constraints and bankruptcy risk. Manag. Decis. 2026. epub ahead of printing. [Google Scholar] [CrossRef] [Scilit]
- Yuan, T.; Bukhari, W.A.A.; Bukhari, A.A.A.; Troise, C.; Bresciani, S. Managing carbon emissions: Green finance and technological innovation. Manag. Decis. 2026. epub ahead of printing. [Google Scholar] [CrossRef] [Scilit]
- Zhang, Q.; Liang, N. A review of analytic models for fairness concerns in supply chain management. Int. J. Prod. Res. 2025, 63, 8781–8815. [Google Scholar] [CrossRef] [Scilit]
- Wang, Y.; Yu, Z.; Jin, M.; Mao, J. Decisions and coordination of retailer-led low-carbon supply chain under altruistic preference. Eur. J. Oper. Res. 2021, 293, 910–925. [Google Scholar] [CrossRef] [Scilit]
- Cui, T.; Raju, J.S.; Zhang, Z.J. Fairness and channel coordination. Manag. Sci. 2007, 53, 1303–1314. [Google Scholar] [CrossRef] [Scilit]
- Guan, Z.; Ye, T.; Yin, R. Channel coordination under Nash bargaining fairness concerns in differential games of goodwill accumulation. Eur. J. Oper. Res. 2020, 285, 916–930. [Google Scholar] [CrossRef] [Scilit]
- Sarkar, S.; Bhala, S. Coordinating a closed loop supply chain with fairness concern by a constant wholesale price contract. Eur. J. Oper. Res. 2021, 295, 140–156. [Google Scholar] [CrossRef] [Scilit]
- Zhou, C.; Li, X.; Ren, Y.; Yu, J. How do fairness concern and power structure affect competition between e-platforms and third-party sellers? IEEE Trans. Eng. Manag. 2023, 71, 7479–7495. [Google Scholar] [CrossRef] [Scilit]
- Han, B.; Chi, T.; Hu, F.; Wang, M. Pricing decisions and fairness concerns: Supply chain power structures. Manag. Decis. 2025, 63, 2105–2124. [Google Scholar] [CrossRef] [Scilit]
- Wang, Y.; Fan, R.; Shen, L.; Jin, M. Decisions and coordination of green e-commerce supply chain considering green manufacturer’s fairness concerns. Int. J. Prod. Res. 2020, 58, 7471–7489. [Google Scholar] [CrossRef] [Scilit]
- Shi, P.; Han, K.; Hou, R. Modeling and analysis of a sustainable supply chain with fairness concerns and green-sensitive consumer demand. Manag. Decis. 2023, 61, 1298–1319. [Google Scholar] [CrossRef] [Scilit]
- Chen, L.; Shen, H.; Liu, Q.; Rao, C.; Li, J.; Goh, M. Joint optimization on green investment and contract design for sustainable supply chains with fairness concern. Ann. Oper. Res. 2026, 359, 243–281. [Google Scholar] [CrossRef] [Scilit]
- Walley, N.; Whitehead, B. It’s Not Easy Being Green. Harv. Bus. Rev. 1994, 72, 36–44. [Google Scholar]
- Jeuland, A.P.; Shugan, S.M. Managing channel profits. Mark. Sci. 1983, 2, 239–272. [Google Scholar] [CrossRef] [Scilit]
- Katok, E.; Pavlov, V. Fairness in supply chain contracts: A laboratory study. J. Oper. Manag. 2013, 31, 129–137. [Google Scholar] [CrossRef] [Scilit]
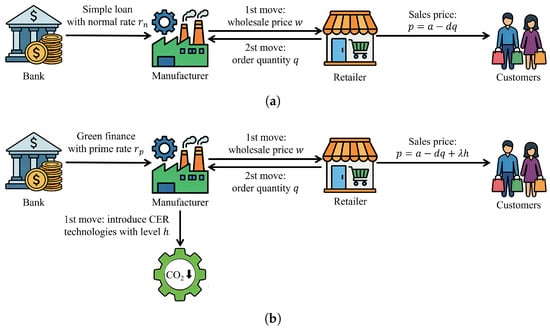
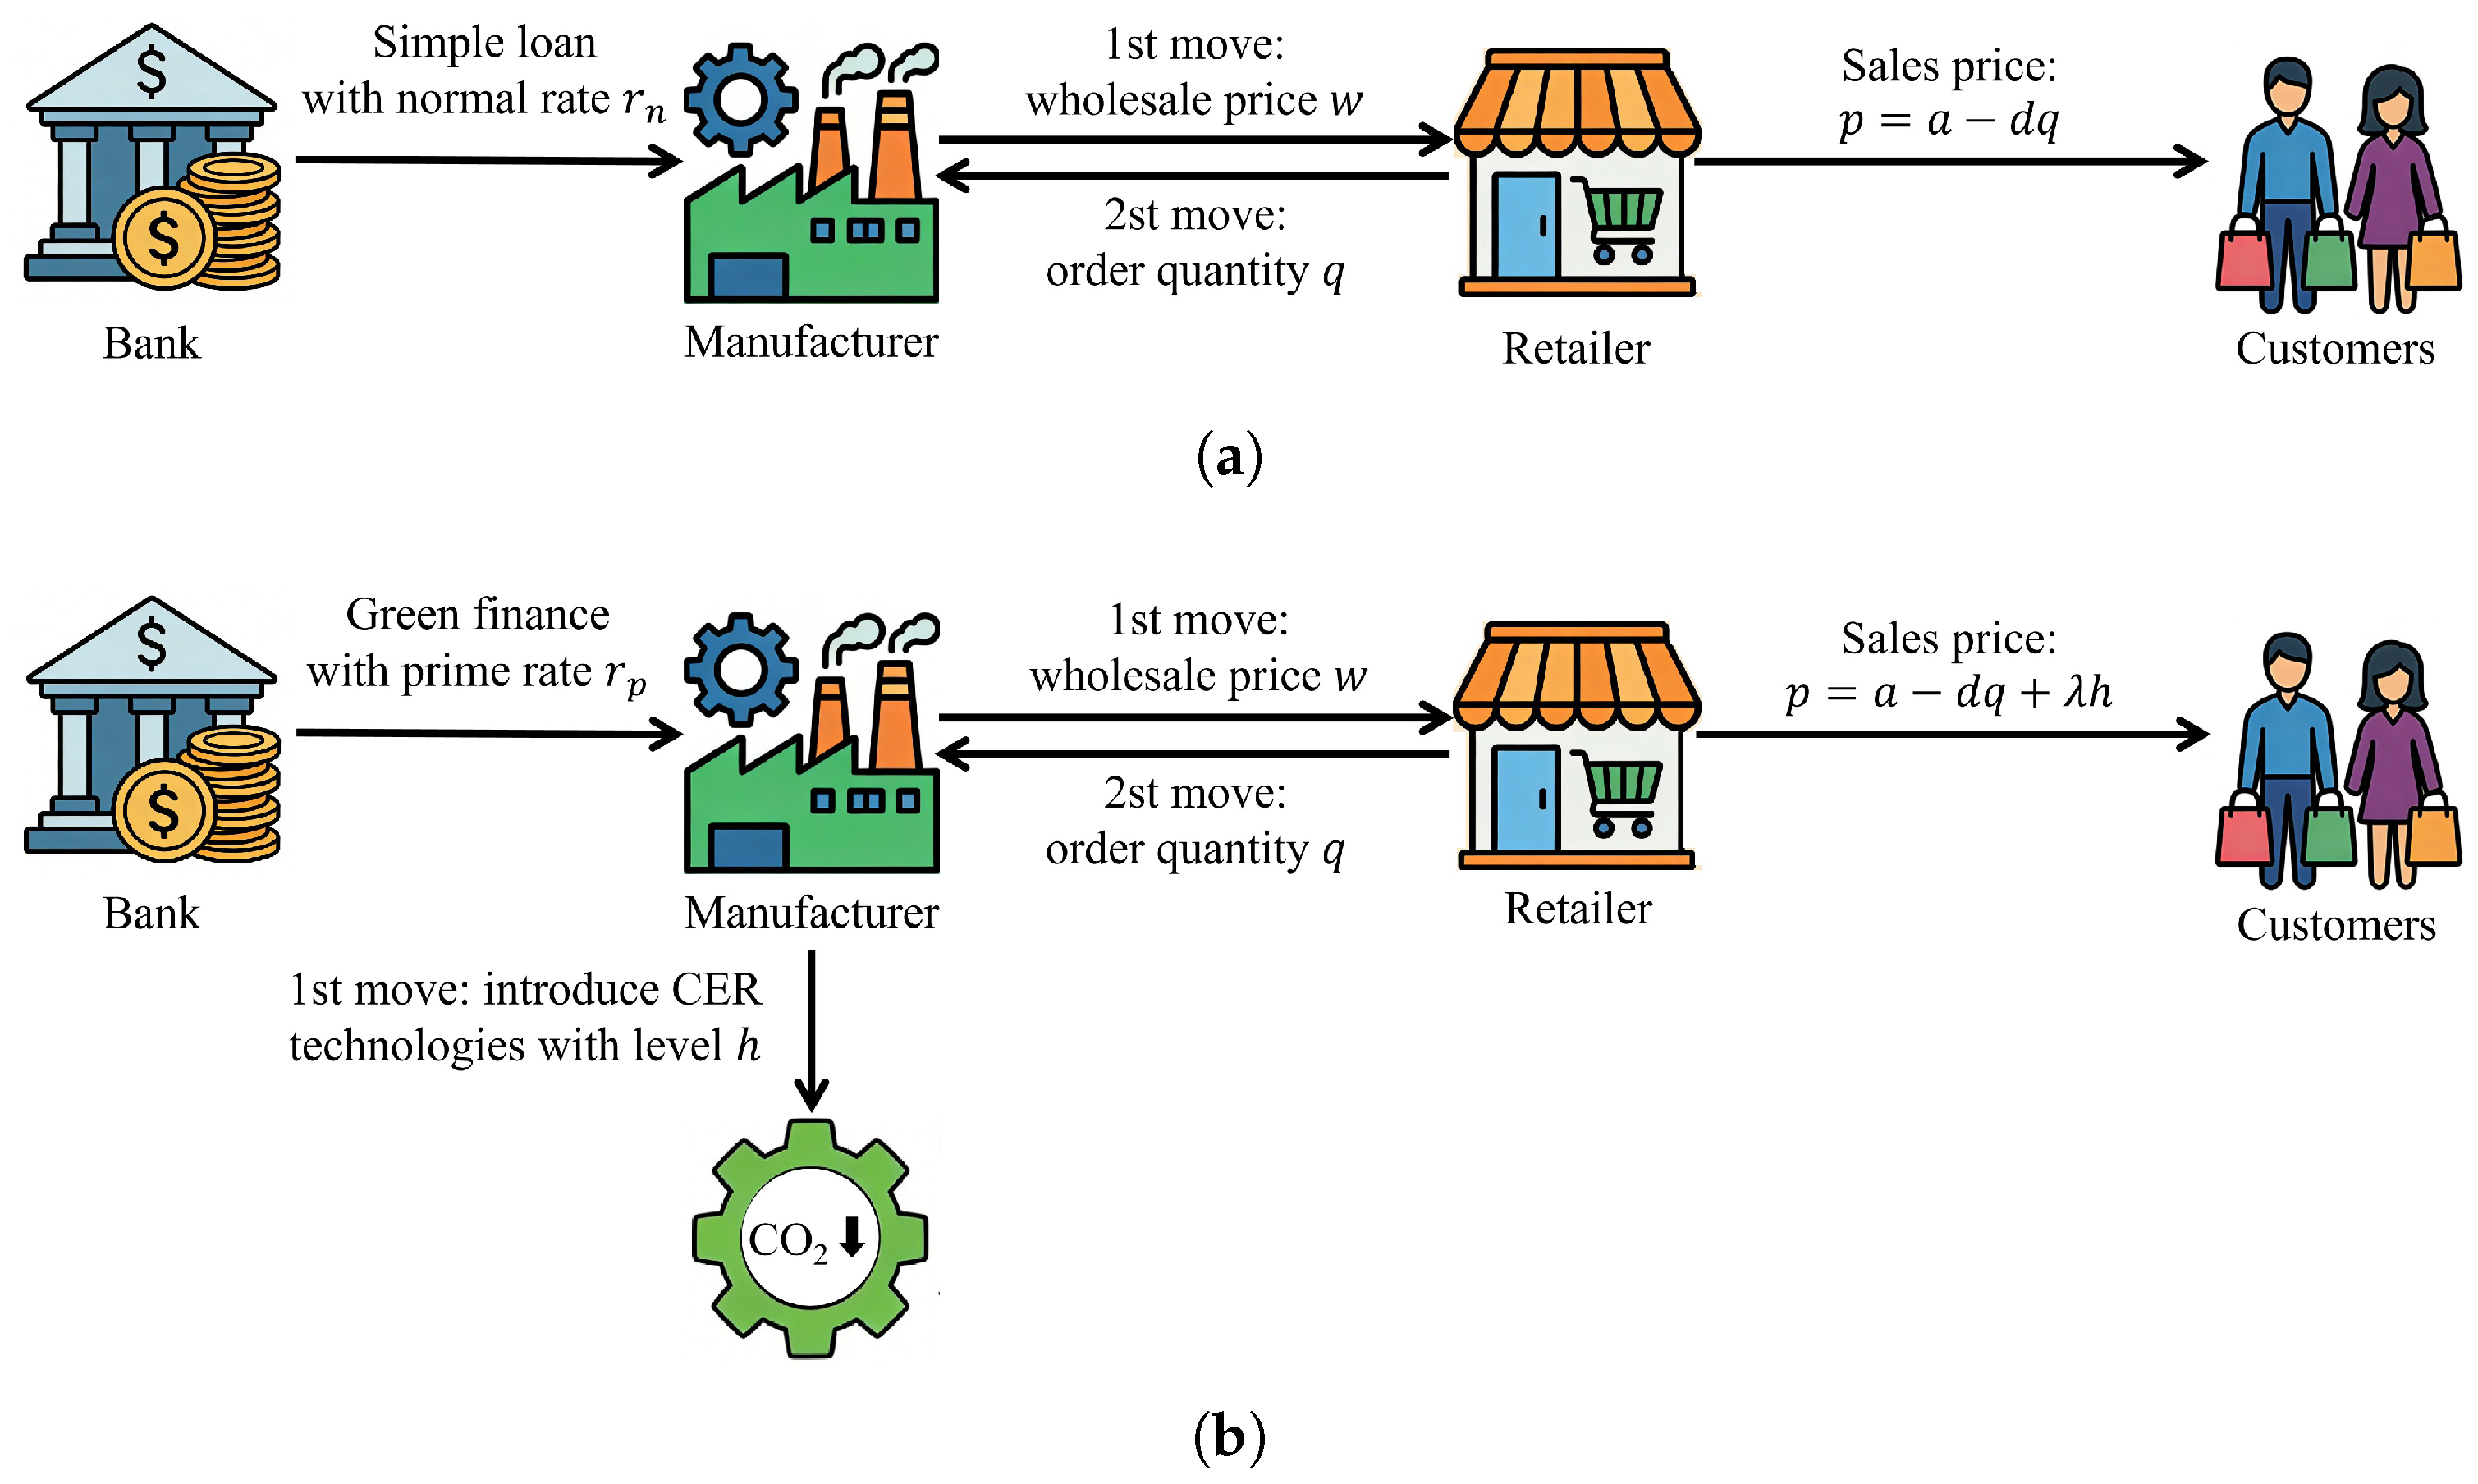
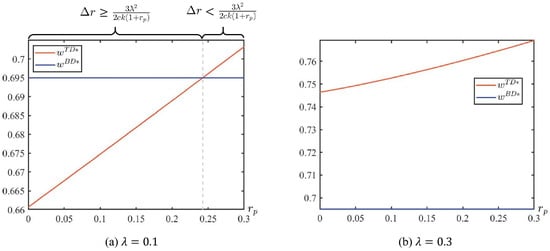
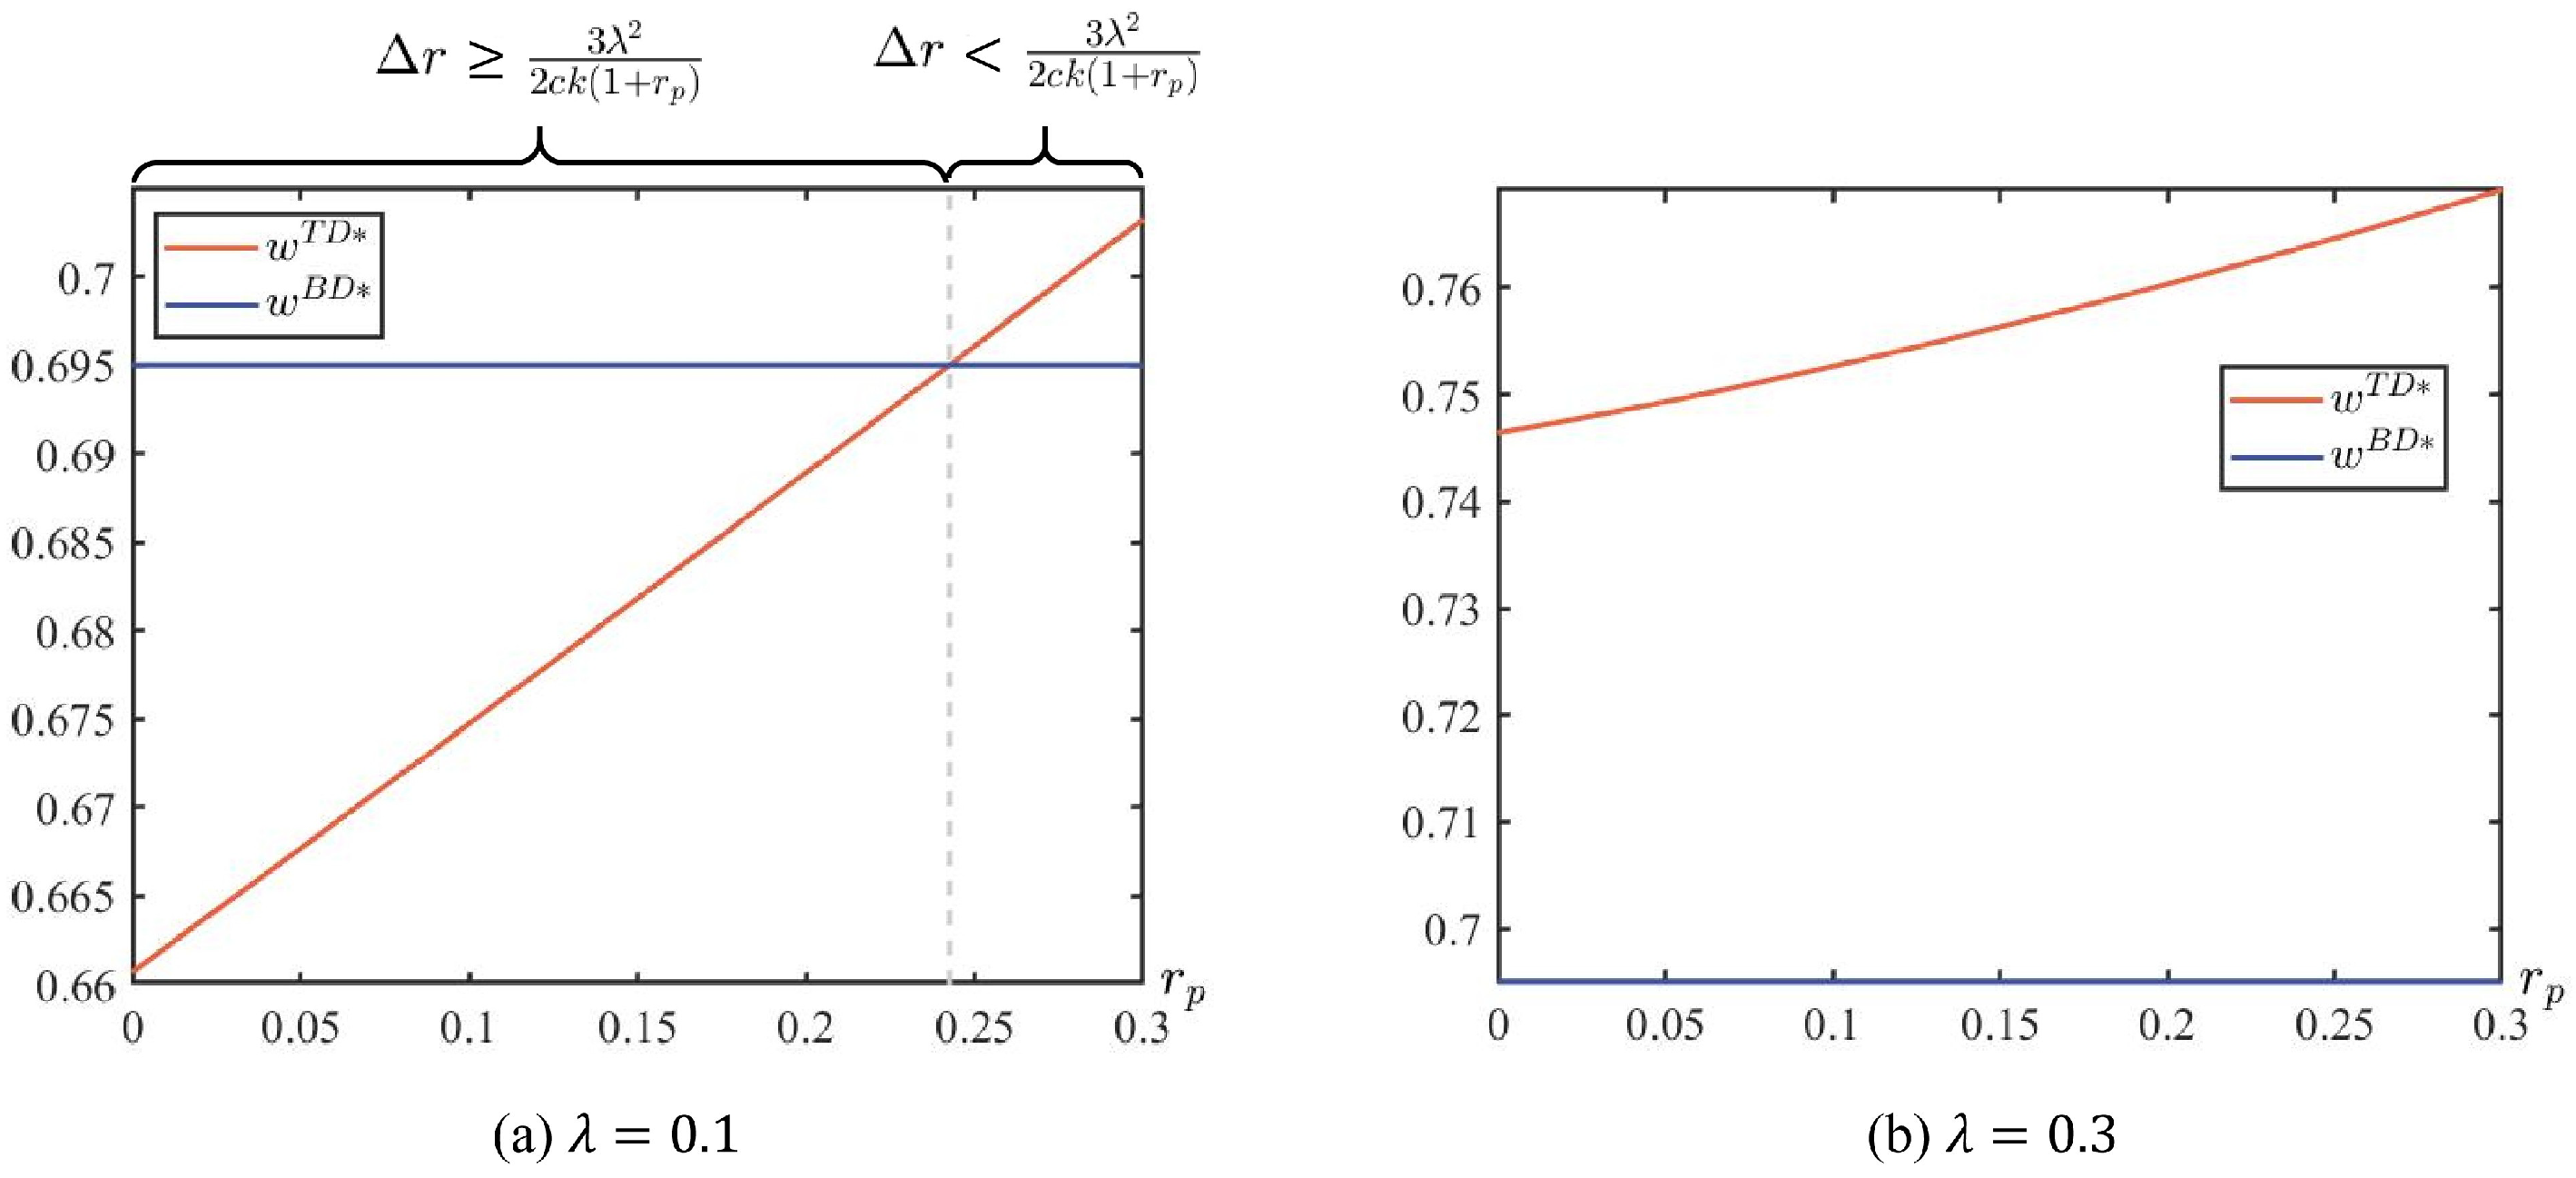
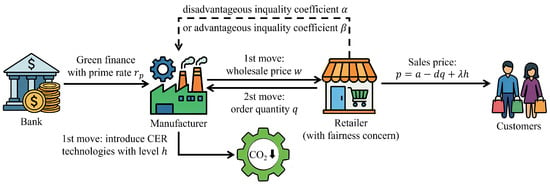
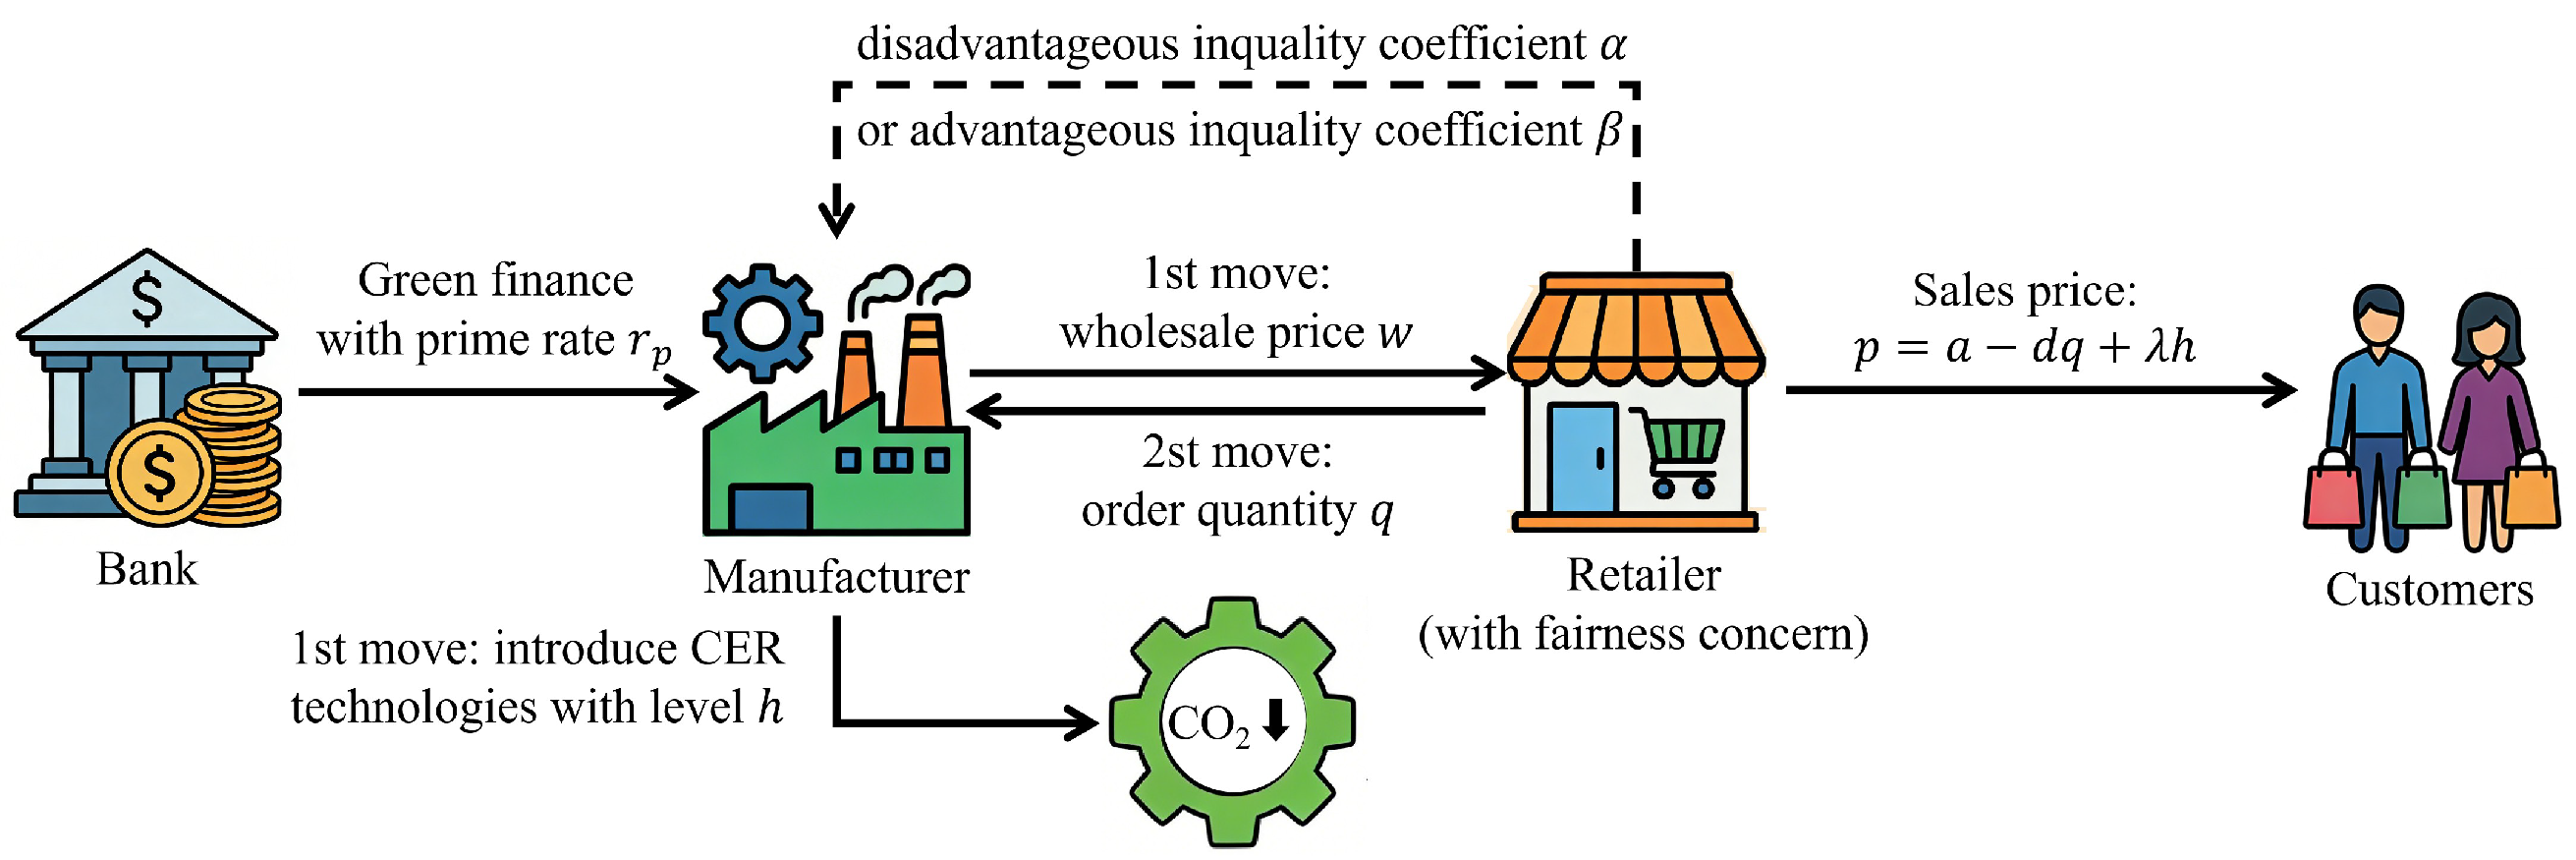
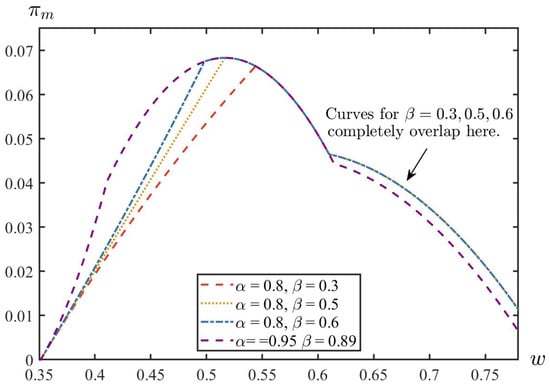
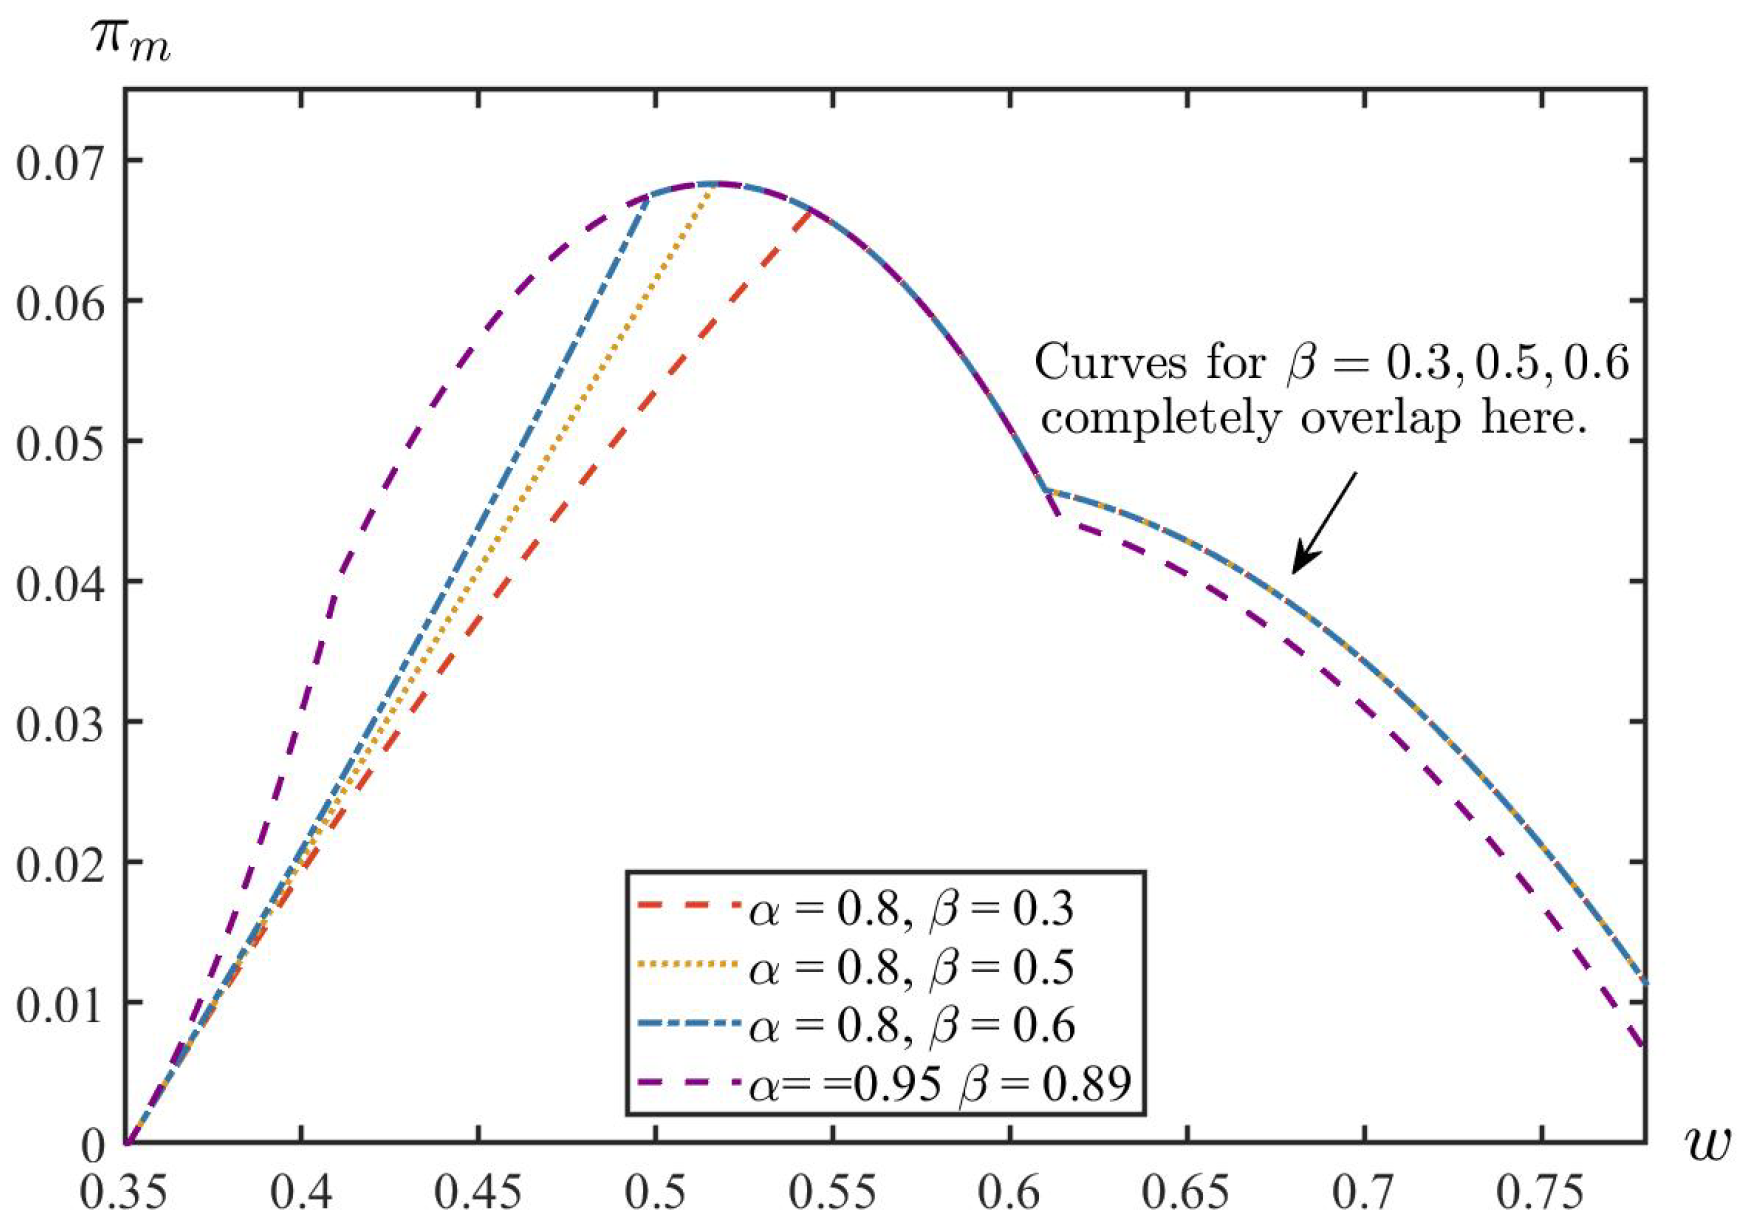
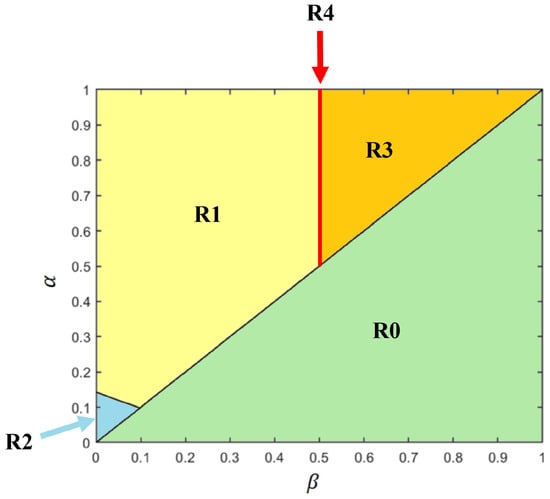
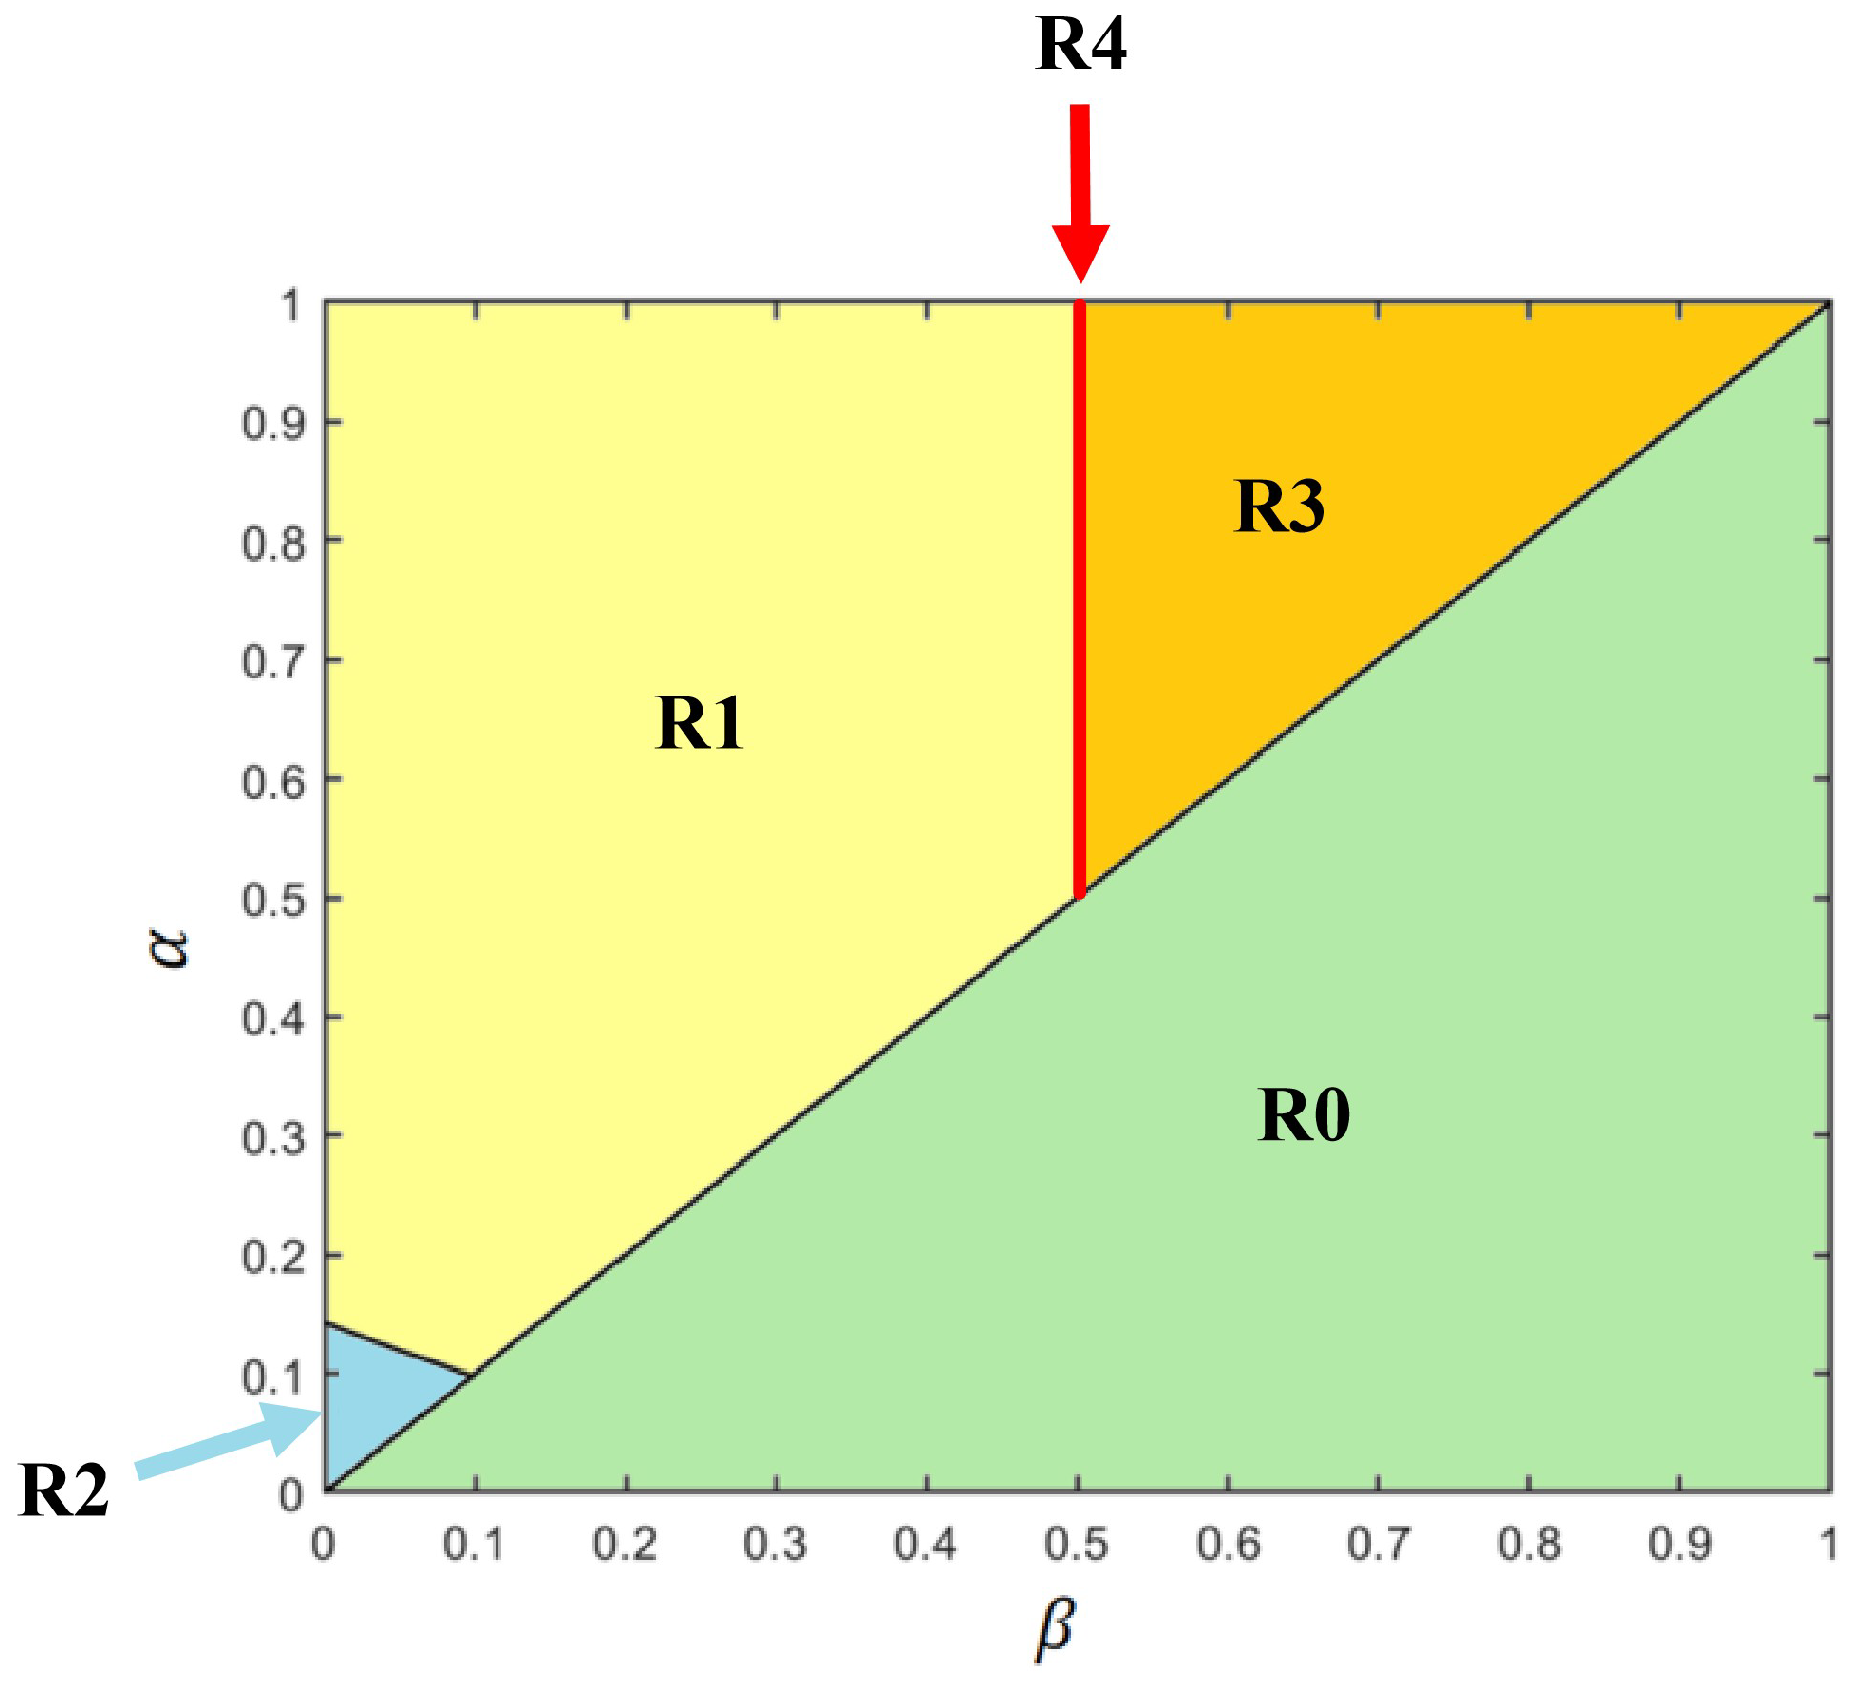
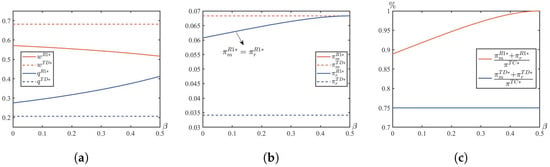
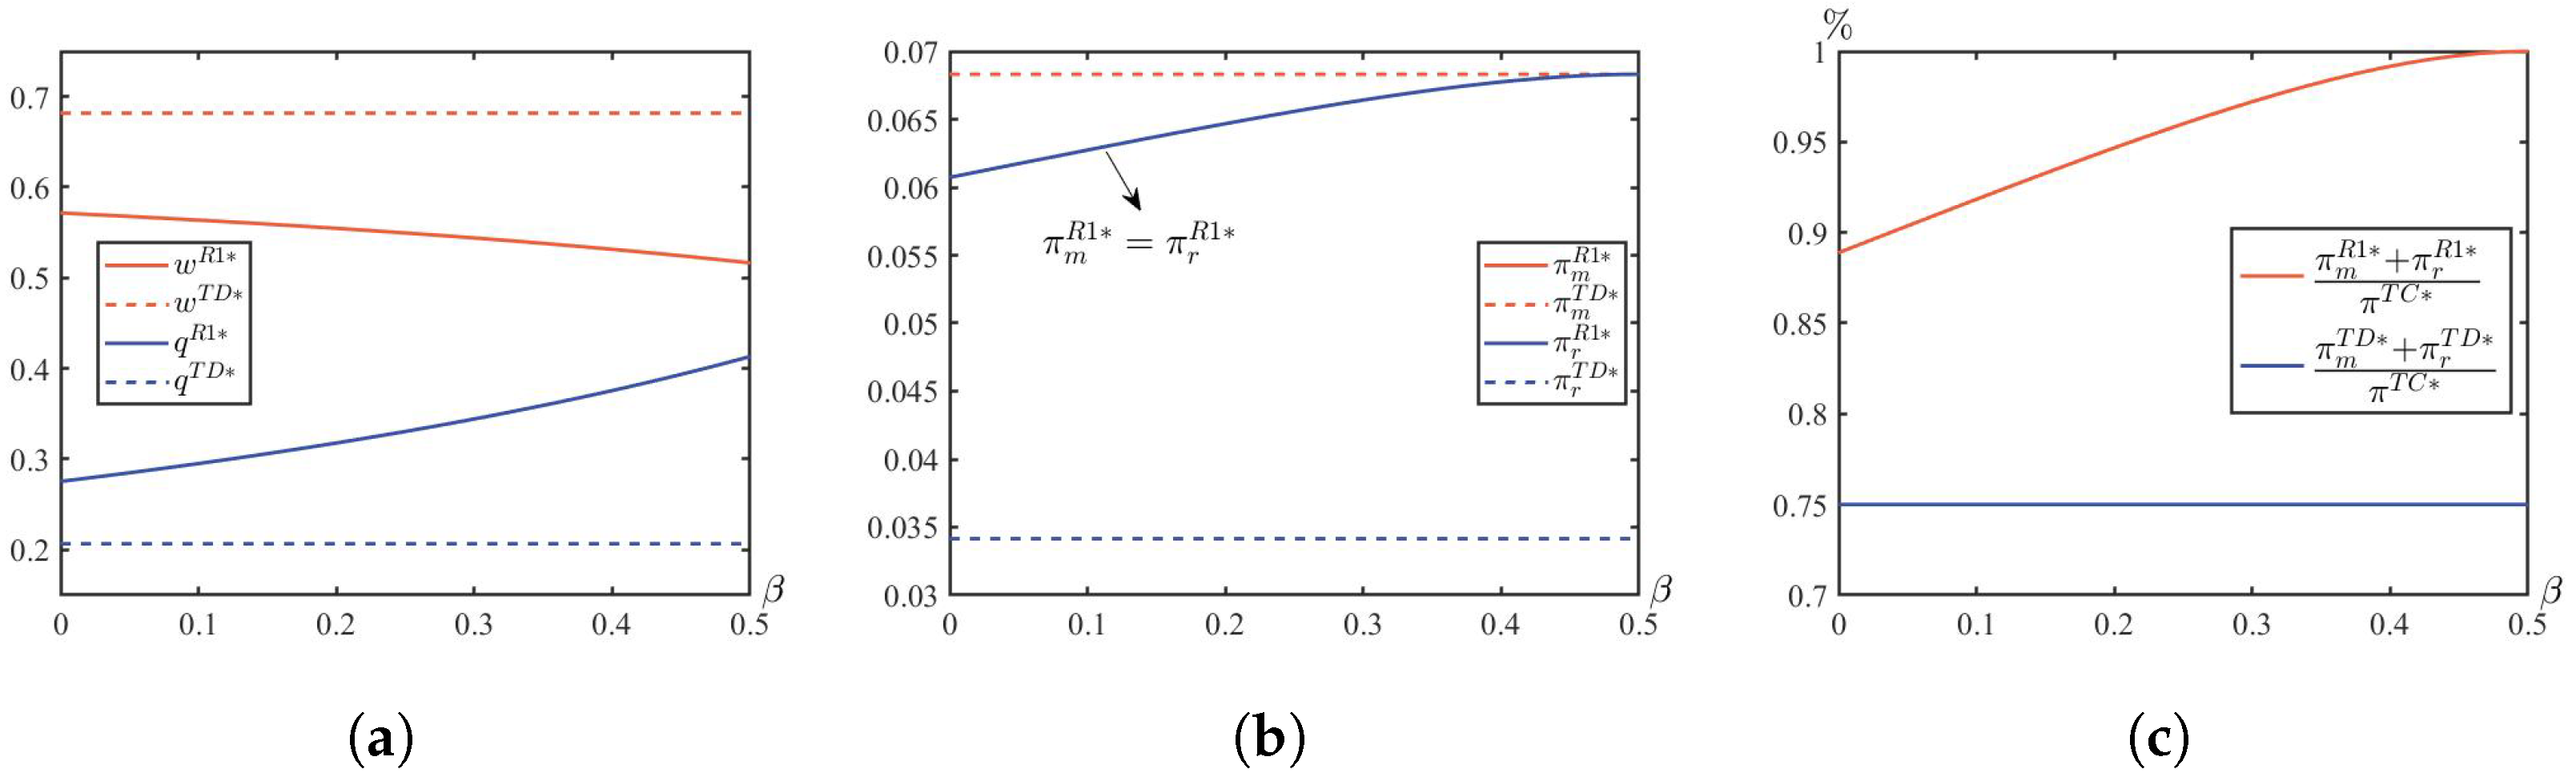
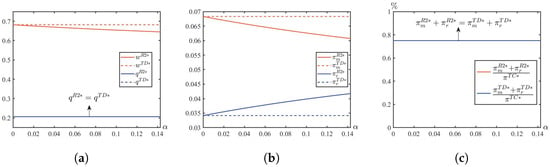
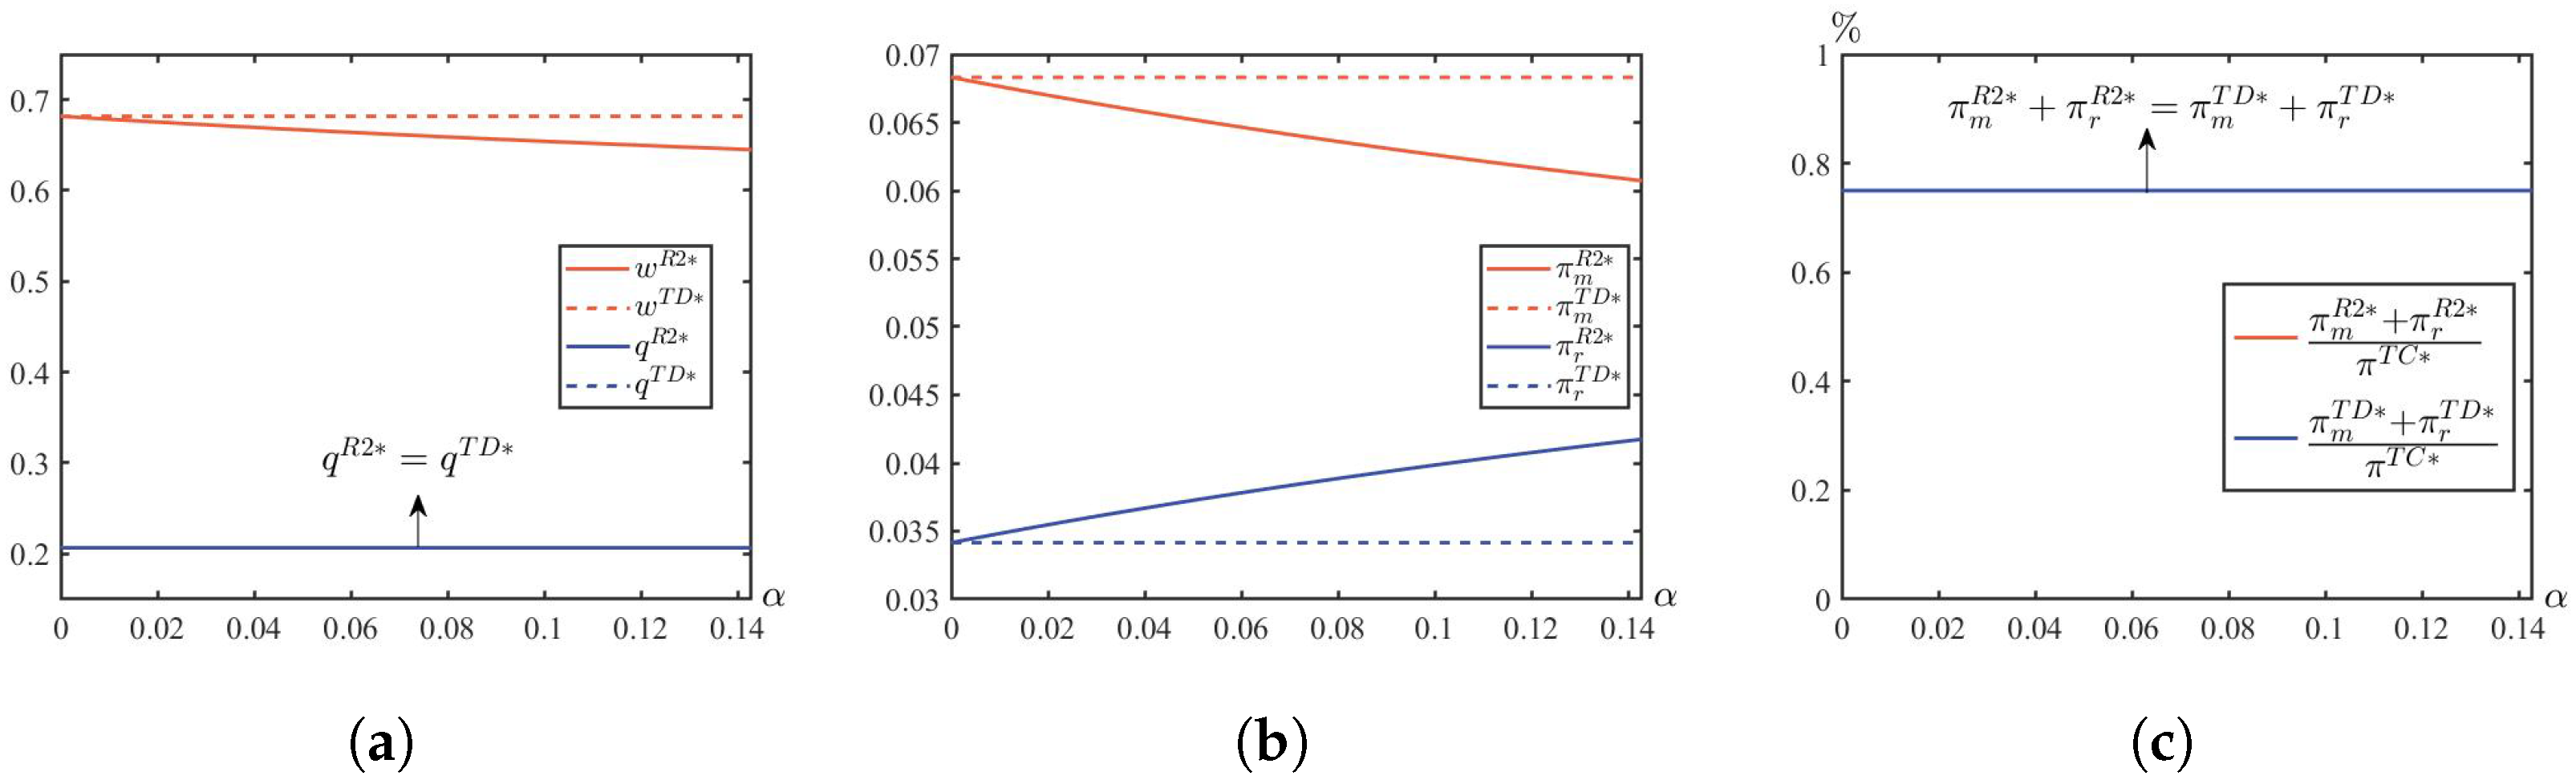
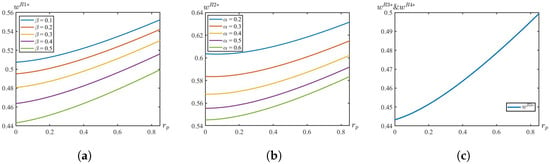
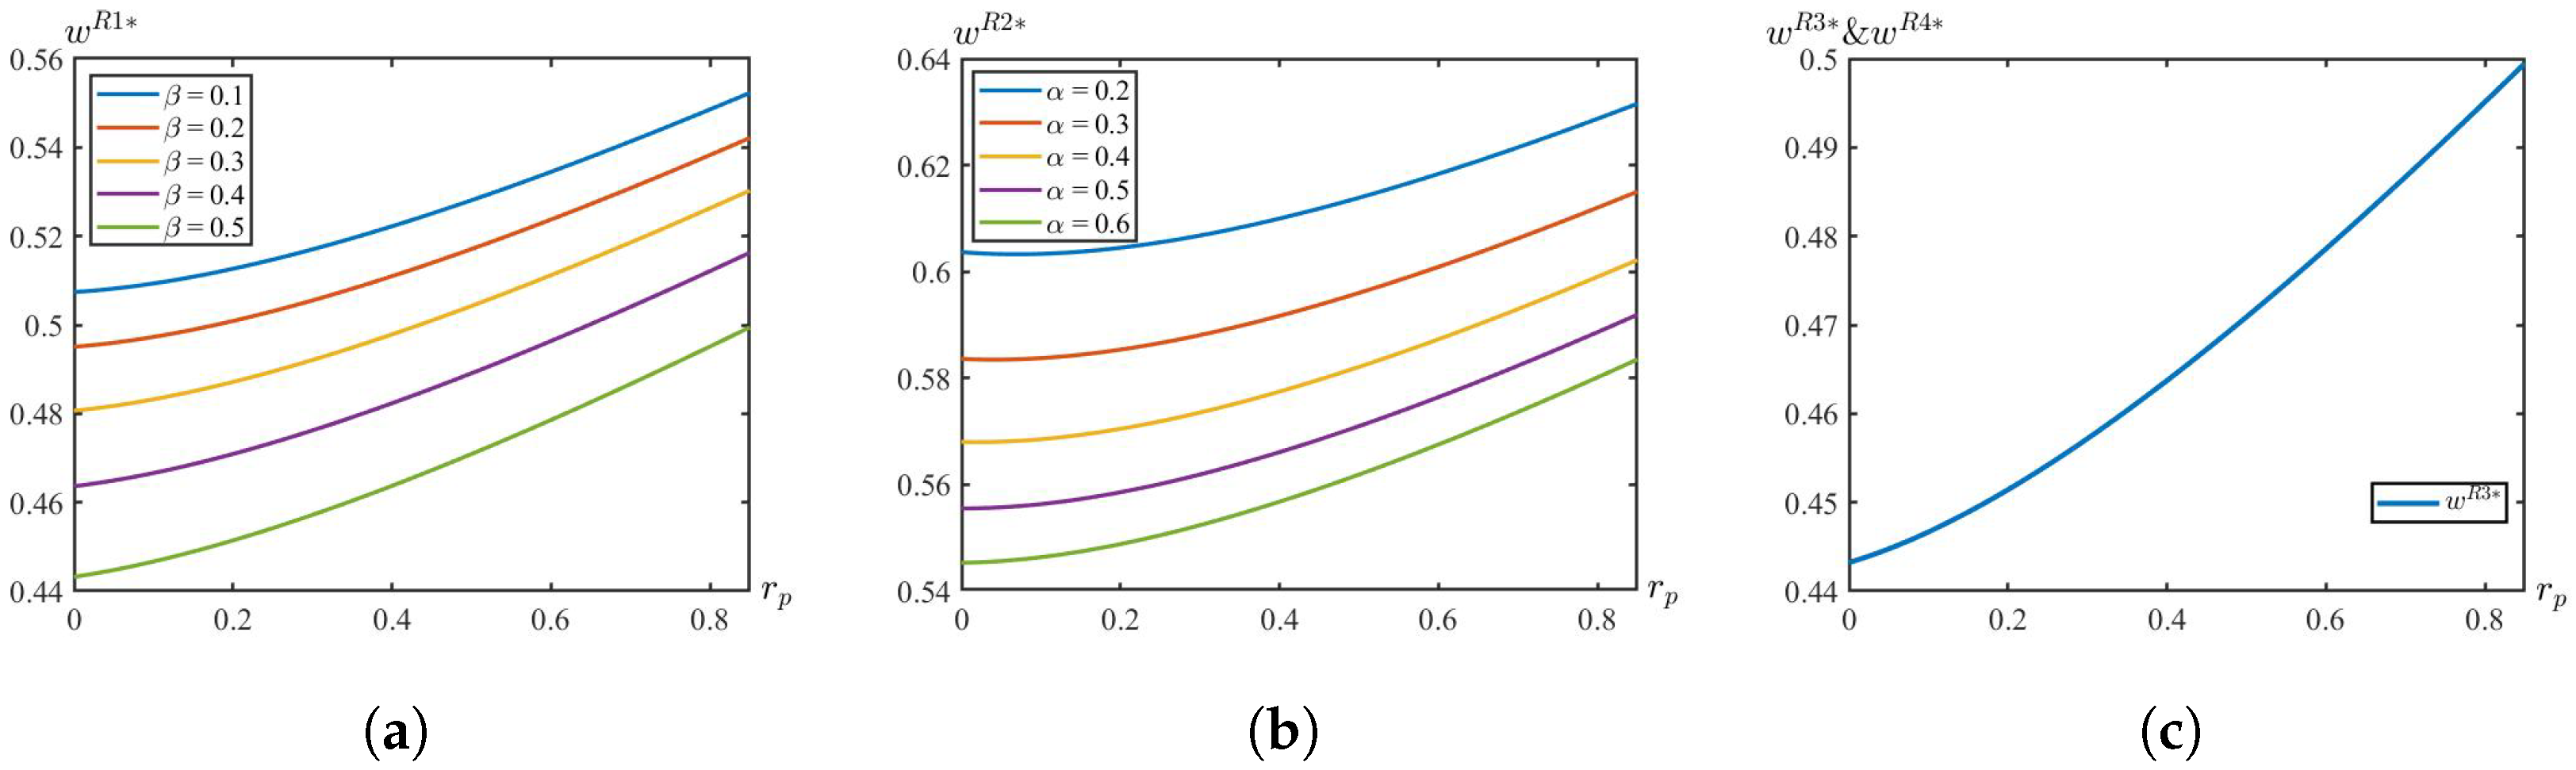

Disclaimer/Publisher’s Note: The statements, opinions and data contained in all publications are solely those of the individual author(s) and contributor(s) and not of MDPI and/or the editor(s). MDPI and/or the editor(s) disclaim responsibility for any injury to people or property resulting from any ideas, methods, instructions or products referred to in the content. |
© 2026 by the authors. Licensee MDPI, Basel, Switzerland. This article is an open access article distributed under the terms and conditions of the Creative Commons Attribution (CC BY) license.