


Highlights
Please indicate how your work links to systems science via your contributions to systems practice, theory, and/or methodology.
- This study combines complexity theory, systems thinking, chaos engineering, and cyber security practises to build a new cyber resilience framework.
What are the main findings and/or the implications of the main findings?
- The Stress-Induced Self-Organised Resilience (SISOR) methodology built resilience in C-CPSS.
- This study’s findings open up a new focal area for cyber security, where the features of complexity such as emergence can be leveraged to build resilience, rather than be fought against.
Abstract
Modern systems-of-systems, such as national infrastructure networks, defence information environments, and financial platforms, must continue to operate even when components fail or are compromised by cyber-attacks. Traditional approaches to resilience focus on identifying and reinforcing critical nodes; however, these methods rely on complete network visibility, incur significant analytical overhead, and are vulnerable to structural changes. This paper introduces Stress-Induced Self-Organised Resilience (SISOR), a proactive approach to building resilience that leverages the natural adaptive behaviour of complex systems. SISOR works by intentionally applying minor, rolling disruptions across nodes in a system, prompting the formation of alternative pathways and service redundancies through self-organisation and feedback loops. Rather than preventing stress, SISOR utilises stress as a tool for resilience development. The approach is visibility-agnostic, computationally lightweight, and scales naturally with the system size. We formalise SISOR through a model that relates the optimal stress frequency to mission assurance priorities and the likelihood of a cyber-crisis. The result is a resilience strategy that strengthens systems before a disruption occurs, reducing the reliance on emergency adaptation during crises and improving survivability in high-consequence operational environments.
1. Introduction
Contemporary cyber-physical and socio-technical environments are increasingly composed of interconnected and interdependent systems that evolve continuously over time. Many of these systems are multi-modal and are referred to as complex cyber-physical–social systems (C-CPSS). National energy networks, military command systems, global financial infrastructures, transportation logistics chains, and large-scale cloud service environments all operate as complex systems-of-systems. Their performance and stability depend not only on the reliability of individual components but also on the behaviour of the relationships between them. As these systems grow in complexity, the challenge of maintaining continuity of service under conditions of disruption has become a central concern for both national security and organisational service resilience [1,2]. Outages, attacks, and failures in the cyber domain in recent years have highlighted how cyber disruptions can have cascading real-world effects across the physical and social domains. The 2024 CrowdStrike outage exemplified this, with a single coding error stopping critical services such as transport and finance across the world [3,4,5].
Traditional approaches to resilience focus on anticipating failures by identifying critical nodes or vulnerabilities, modelling dependency structures, and reinforcing areas worthy of protection. Such methods are grounded in system visibility and analytic foresight: one must know which components are most critical, how they interact, and where a failure is likely to propagate. However, these assumptions are increasingly challenging to maintain in the modern context. Real systems change rapidly; components are added, removed, repurposed, or interconnected with little global oversight. Adversaries exploit this dynamism by targeting assumptions embedded in static resilience planning. As a result, resilience strategies that rely on planned fortification can themselves become fragile when the structure that they are designed to protect no longer behaves as expected.
The significance of this challenge lies in the growing mismatch between the complexity of the systems that we depend on and the tools traditionally used to protect them. In many cases, the system has more knowledge of its own operational dependencies than any external observer or analytical model can capture. The capacity for adaptation already exists within these systems, yet resilience practices rarely seek to harness it directly. Instead, resilience is typically conceived as something designed and imposed from outside, rather than something that can emerge from within.
Stress-Induced Self-Organised Resilience (SISOR) refers to the process of building survivability in complex systems-of-systems through the implementation of rolling random operational pressures across nodes in a complex network. It directly harnesses the features of complex adaptive systems, being self-organisation and feedback loops, where nodes may realign themselves based on their relationships and adapt their structure based on inputs and environmental variables.
SISOR takes an alternate approach to traditional analytical resilience methods. Instead of centrally and functionally decomposing the macro system to build resilience, SISOR encourages the decentralised synthesis of resilience at the micro node-based level. In this approach, a node is not limited to the scope of an “asset”, such as a singular computer, and instead can represent subsystems and components within such assets, such as software, hardware, and services. Therefore, while a node outage may appear as an entire host turning off, it may also appear as a critical vulnerability being exploited, a startup service changing, or a system process stopping.
The benefits of SISOR when compared to these traditional deliberate approaches are multifaceted. Firstly, it is network visibility-agnostic, meaning that all nodes in the wider system-of-systems do not need to be identified or their relationships understood for this method to be effective. Many existing node resilience approaches rely on mapping and understanding the entirety of the system in order to conduct analysis, which is challenging in large or cross-domain networks [6]. Extending upon this, SISOR is system-adaptable, where changes to nodes or subsystems in the wider systems-of-systems do not require a fresh “re-analysis” of the network. Using this process, adaptation is built into the methodology. SISOR may reduce the need for comprehensive network mapping, while careful coordination and monitoring help to manage the service impacts of controlled disruptions.The network size does not exponentially complicate or impact the application of the methodology, making it significantly more efficient than traditional computational models that have a direct computational complexity relationship with the network size [6].
The SISOR approach is proactive at the pre-cyber-crisis stage, meaning that it builds cyber-system resilience before an attack or outage occurs. This reduces the reliance on incident response-driven adaptions that occur in crises alone. This makes SISOR a preemptive measure that gives organisations agency against emergent events prior to their occurrence—something that cannot be fully achieved through node fortification only. SISOR uses controlled, random node or service outages to represent a possible consequence of an unforeseen attack or failure. SISOR then examines whether the simulated network adapts and forms alternative pathways. Conventional vulnerability assessments primarily identify and evaluate weaknesses, not how a network reorganises after an unexpected loss of service.
Stress-Induced Self-Organised Resilience (SISOR) responds to the current research gap by approaching resilience as an emergent property rather than an engineered artefact. Rather than preventing stress, SISOR introduces controlled, small-scale disruptions to system nodes during normal operations. These disruptions serve as stimuli that encourage systems to reorganise, redistribute functions, and reduce hidden dependencies. Over time, the system learns to operate through multiple pathways, thereby decreasing its reliance on any single node or structure. The result is resilience that develops prior to a crisis, rather than improvised adaptation only once a disruption has occurred. SISOR therefore reframes resilience as a dynamic and lived process of continuous evolution. It leverages the natural behaviours of complex adaptive systems’ self-organisation, feedback, redundancy formation, and local decision-making to build survivability in advance of conflict. This proactive orientation is particularly suited to mission assurance contexts, where the continuation of essential services is prioritised above efficiency or cost minimisation.
This work has the following novel contributions:
- Introducing SISOR, a fundamentally novel approach to building cyber-resiliency;
- The preliminary validation of the SISOR formula, using simulated random Boolean networks (RBN) and information theory;
- Mapping relationships between different self-organising system behaviours and resiliency outcomes;
- Providing a thorough analysis of SISOR’s impact on the cyber-security industry, defence, and innovative future research applications.
The remainder of this work is structured to support these contributions. Firstly, the background and previous studies will be described, outlining the research need. Next, the SISOR framework will be introduced and explained. The experimental methodology will then be described, including the applied RBN model and information theory calculations. The next section will display the findings of the work, followed by a discussion of the outcomes. The study will be closed with conclusions and recommendations for future work.
2. Background and Previous Studies
The study of resilience in complex systems has long recognised that stability does not arise solely from the prevention of failure but from the capacity to absorb, reorganise, and continue functioning under stress. Early work on complex adaptive systems emphasised the roles of distributed agency, local decision-making, and emergent order in shaping system behaviour. In such systems, resilience is an intrinsic property that evolves from interaction patterns rather than being imposed through centralised design. Research in ecology, organisational theory, and network science has shown that when components interact through feedback loops, systems can reconfigure dynamically in response to perturbations, often generating novel structures capable of sustaining operations under changing conditions.
Within engineered environments, however, resilience has traditionally been approached as a design problem [7,8,9]. Cyber-security and infrastructure protection frameworks generally rely on modelling system interdependencies to identify critical nodes or components, using techniques such as graph-theoretic algorithms [10,11,12,13]. Once identified, these nodes are reinforced through security reconfigurations, redundancy, isolation and boundary hardening, trust assignment, failover pathways, and enhanced monitoring [14,15,16,17]. This approach has been influential in resilience engineering, network hardening, and the development of security standards. Yet it presumes that system architectures are sufficiently stable and transparent for criticality to be meaningfully extracted and periodically re-evaluated. As systems become increasingly interconnected and adversaries become more adaptive, this assumption becomes increasingly tenuous. The very tools used to map critical dependencies can become outdated faster than they can be recalculated, which can already be impacted by extreme time complexities [18,19].
Recent studies have begun to challenge this static concept of resilience. Work in socio-technical systems and organisational resilience argues that robustness derived solely from pre-planned redundancy can produce fragility when confronted with novel or poorly understood failure modes [20]. Research into “anti-fragility” suggests that some systems do not merely survive stress but improve when exposed to it [20]. While it is a compelling concept, anti-fragility as a practical methodology has remained limited by its lack of operational mechanisms for inducing structured, controlled stress in real-world systems. Vulnerability analysis to assist in building cyber-resiliency is another method explored in the literature. One study particularly noted several sub-categories of resilience that organisations needed to consider as part of their efforts, namely resilience against topological change, cascading failures, input corruption, and function loss [21]. The study highlighted that building resilience comes at a tradeoff with other organisational needs, including those of resources, functions, and services, emphasising the requirement to consider cyber-resilience requirements within the wider organisational context [21].
Mission assurance frameworks provide a complementary perspective, particularly in military and critical infrastructure contexts. In mission assurance, the priority is not preventing compromise or reducing financial risk; rather, it is ensuring the continuity of essential functions under adverse conditions [22]. This shifts the emphasis from protecting assets to preserving capabilities. Resilience in mission assurance is therefore inherently dynamic and outcome-oriented. However, even within mission assurance doctrine, resilience is commonly approached through risk assessments, contingency planning, simulated training environments, pre-designated fallback modes, and hardened redundancies—again assuming that the system structure can be fully anticipated before a disruption occurs [23,24,25]. Across these domains, a recurring challenge persists: resilience strategies often presume that the system can be fully understood and prepared in advance. They rely on prediction, foreknowledge, and controlled design, even though complex systems routinely defy linear forecasting. The system’s internal capacity to reorganise in response to stress remains conceptually acknowledged but operationally underutilised.
Outside cyber-security research, studies into resilience, anti-fragility, robustness, and redundancy are present across other systems and scientific disciplines [26]. The literature identifies that there are sometimes contradictions between definitions and measures of resilience, robustness, and redundancy [26,27]. Redundancy is defined as the additional capacity of a system to maintain system performance despite partial failure; however, the specification of this capacity as simply “duplicate assets” compared to “supplementary assets” changes this definition [27]. One leading text in the field defines resilience as “the ability of a system to absorb disturbances and still retain its basic function and structure” [28,29]. In ecology, resilient systems are able to “absorb and withstand shocks” [30,31]. This notion is sometimes used interchangeably with the term “stability” [32,33]. In some literature, there is a strong distinction between the concepts and definitions of “resilience” and “resistance”, where the former relates to the ability to return to a safe performance state after an event, while the latter refers to the ability of a system to endue certain demands or loadings [34]. It is closely linked to the concept of “robustness”, which refers to an engineered system’s ability to respond to failures not considered within its original design [34]. Resilience engineering is a branch of practice that specialises in building systems that “anticipate and adapt to the potential for surprise and failure” [31,35]. Engineering resilience is sometimes termed “elasticity” because it involves a system returning to “preexisting conditions after a disturbance” [32,36,37,38]. From a psychological perspective, resilience refers to “the developable capacity to rebound from adversity” [37,39]. The National Academy of Sciences prescribes to the combined approach, where resilience includes the ability to “prepare and plan for, absorb, recover from, and more successfully adapt to adverse events” [31,40]. Interestingly, some definitions of resilience engineering also include absorbance as part of their definition in addition to adaption, as shown in one definition by Hollnagel, where resilience is stated as “the ability to sense, recognise, adapt and absorb variations, changes, disturbances, disruptions and surprises” [35,37]. From a systems perspective, resilience can be described as “the ability of the system to withstand a major disruption within acceptable degradation parameters and to recover within an acceptable time and composite costs and risks” [41,42]. One paper uniquely takes a mission-centric approach to defining resilience, defining it as “a system that is able to successfully complete its planned mission(s) in the face of disruption(s) (environmental or adversarial), and has capabilities allowing it to successfully complete future missions with evolving threats” [43]. This definition implies a combined stress absorption and adaptive approach to resilience, with a crossover with the field of mission assurance, where the delivery of mission objectives is the main system priority [44].
In biological systems, the term “degeneracy” refers to the ability of structurally different elements to perform the same function or achieve the same outcome [45,46,47]. Degeneracy increases the robustness of a system and is most commonly used in complexity contexts [27]. In cyber-security, this parallels the concept of “distributed redundancy” [48]. From a systems perspective, a system that is degenerate will be more resilient to node outages or disruptions due to these alternative pathways [49]. Studies into distributed redundancy in complex adaptive digital systems have informed techniques to improve the robustness of computer systems using techniques derived from biological and natural systems [48,50]. Harnessing features such as emergent self-organisation allows for the initial design of system topologies to remain “open-ended”, enabling the evolutionary development of robustness over time [48]. Further applications of these biological evolutionary principles to engineering science are explored through a nine-principle framework including concepts such as distributed being, bottom-up control, increasing returns, growth by chunking, maximising interfaces, honouring errors, and pursuance of no optima [51].
Using terms such as “degeneracy” and “redundancy” as defined within biological sciences provides the opportunity to utilise quantified equations for measuring these elements of a system, which have broader applications outside biology. Leaning on concepts in information theory, such as entropy and mutual information, means that systems can be analysed in terms of their complexity, redundancy, and degeneracy, which in turn inform their overall resilience [47,52,53]. One key study in the field used information theory calculations, including mutual information and degeneracy, in its assessment of discrete gene-regulatory networks and their ability to recover functionality under disruption [46]. Leveraging these methods gives the opportunity to compare systemic change over time and under conditional modification, providing valuable insights into potential causal resilience factors.
Stress-Induced Self-Organised Resilience (SISOR) seeks to address this need by offering a practical mechanism for activating the adaptive potential of complex systems. Rather than relying on external analysis to pre-determine critical nodes, SISOR uses controlled, randomised stress events to encourage the system to reveal and reconfigure its own dependencies. This moves resilience development away from static planning and toward continuous, endogenous adaptation. SISOR aligns with the theoretical insights of complex adaptive systems and anti-fragility research yet provides a concrete method for implementing resilience-building stress cycles in real operational environments. Existing research into cyber-resilience methodologies has been assessed, with strategies heavily focused on risk management, governance, and culture [54,55,56]. This research seeks to propose an alternative resilience perspective—one that is decentralised and not reliant on these analytical foundations.
3. Stress-Induced Self-Organised Resilience
Stress-Induced Self-Organised Resilience (SISOR) is a decentralised approach to developing complex system-of-systems resilience. It involves the random outage or degradation of system nodes as a stress-forcing function to build service redundancy. Nodal criticality within the adaptive system context will determine the nature of the redundancy built, if any. Feedback loops between the cyber, physical, and social components within the system enable self-organisation to overcome critical outages if required. This lessens the reliance on essential nodes and builds overall system resilience.
A node is not confined to representing a single asset, such as an individual computer. Instead, it can denote subsystems or components within such assets. Therefore, in SISOR, outages are not limited to “system shutdowns” but can include a wide range of hardware, software, configuration, and service changes to a system. For example, a server may host a DNS service, and this DNS service may be the element whose outage is tested during a SISOR event, not the whole server turning off itself. This is an essential consideration within C-CPSS, because of the nature of systems-of-systems and the adaptive disposition of these environments. Testing SISOR below the asset level also discourages “duplicate asset redundancy” instead of resilience, where replacement or backup hosts are used as the only mitigating method for SISOR outages. Below-asset-level outages provide an opportunity for testing partial degradation across a multitude of systems, which cannot be remediated with redundancy measures. This encourages more comprehensive resilience response development.
The SISOR approach is service-oriented, which naturally aligns its implementation alongside mission assurance approaches. Mission assurance involves ensuring the continued function and resilience of assets required to achieve mission outcomes [44]. use cases that are best suited to mission assurance approaches to cyber-security are those where the continuation of service delivery is the superior priority for the organisation. These include operational military applications, disaster and recovery scenarios, financial institutions, and national critical infrastructure, including power and water. Traditional cyber-security investment can be viewed as a mitigating factor in the cost–benefit analysis of a cyber-attack risk assessment, often expressed in monetary terms. In mission assurance approaches, the cost of a cyber-attack is often not viewed financially but in terms of service delivery. This warrants a different approach to mitigating the risk of an attack.
The SISOR approach results in short-term service degradation to achieve long-term mission assurance. There is therefore a cost-worthiness assessment that needs to be conducted to determine the appropriate level of SISOR frequency for an organisation. At too high a frequency, service outages overwhelm everyday operations, degrading the system instead of building resilience. Conversely, if the frequency is too low and not enough nodes are tested before an emergent event, such as a cyber-attack, the system is not resilient enough to cope. In essence, building resilience through SISOR is a statistical game, balancing the maximum frequency of feasible outages in cyber-peacetime to meet the estimated resilience needs of systems in a cyber-crisis.
There is a relationship between the likelihood of a cyber-crisis and the per-node SISOR event selection probability. A cyber-crisis may manifest in a variety of ways. It may emerge through an intentional adversary attack, the exploitation of a zero day, or the use of a new CVE. It may also stem from an outage or internal system error, such as a loss of hardware, software, or contracted services. The likelihood of a cyber-crisis can be determined by an assessment of the threat environment—both external to the organisation, such as from APTs, and internal to the organisation, such as from cyber-security culture [3]. The closer a potential cyber-crisis is, the more imperative the need for resilience—hence the requirement for a greater SISOR frequency and the greater cost–benefit ratio in enduring such outages in order to enhance resilience. There is a point, however, in which the risk of a crisis becomes so great that no system degradation is tolerable, in which the SISOR frequency rapidly decreases. In order to calculate the optimum SISOR frequency for a system, a piecewise function is used that considers the specific variables relating to an organisation’s mission assurance priorities. These variables are explained in Table 1.
Table 1.
SISOR formula variables.
For the parameter range used in this study (, , and ), the following expression describes the effective SISOR event selection probability in the released simulator:
For , Equation (1) gives
Thus, the implemented function does not pass through the origin and has a downward discontinuity at C. The value at and above C describes the effective behaviour of the released simulator, not a tested continuous transition. The reported simulation settings use , so the results do not assess behaviour at or above the decision point.
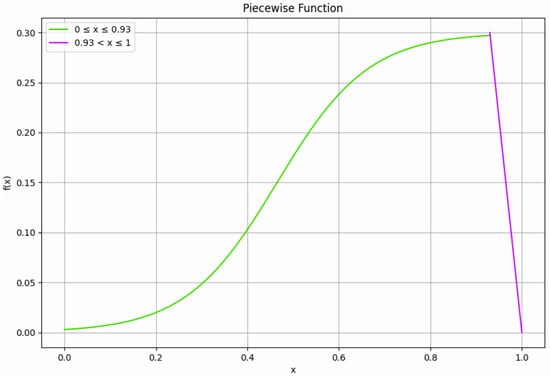
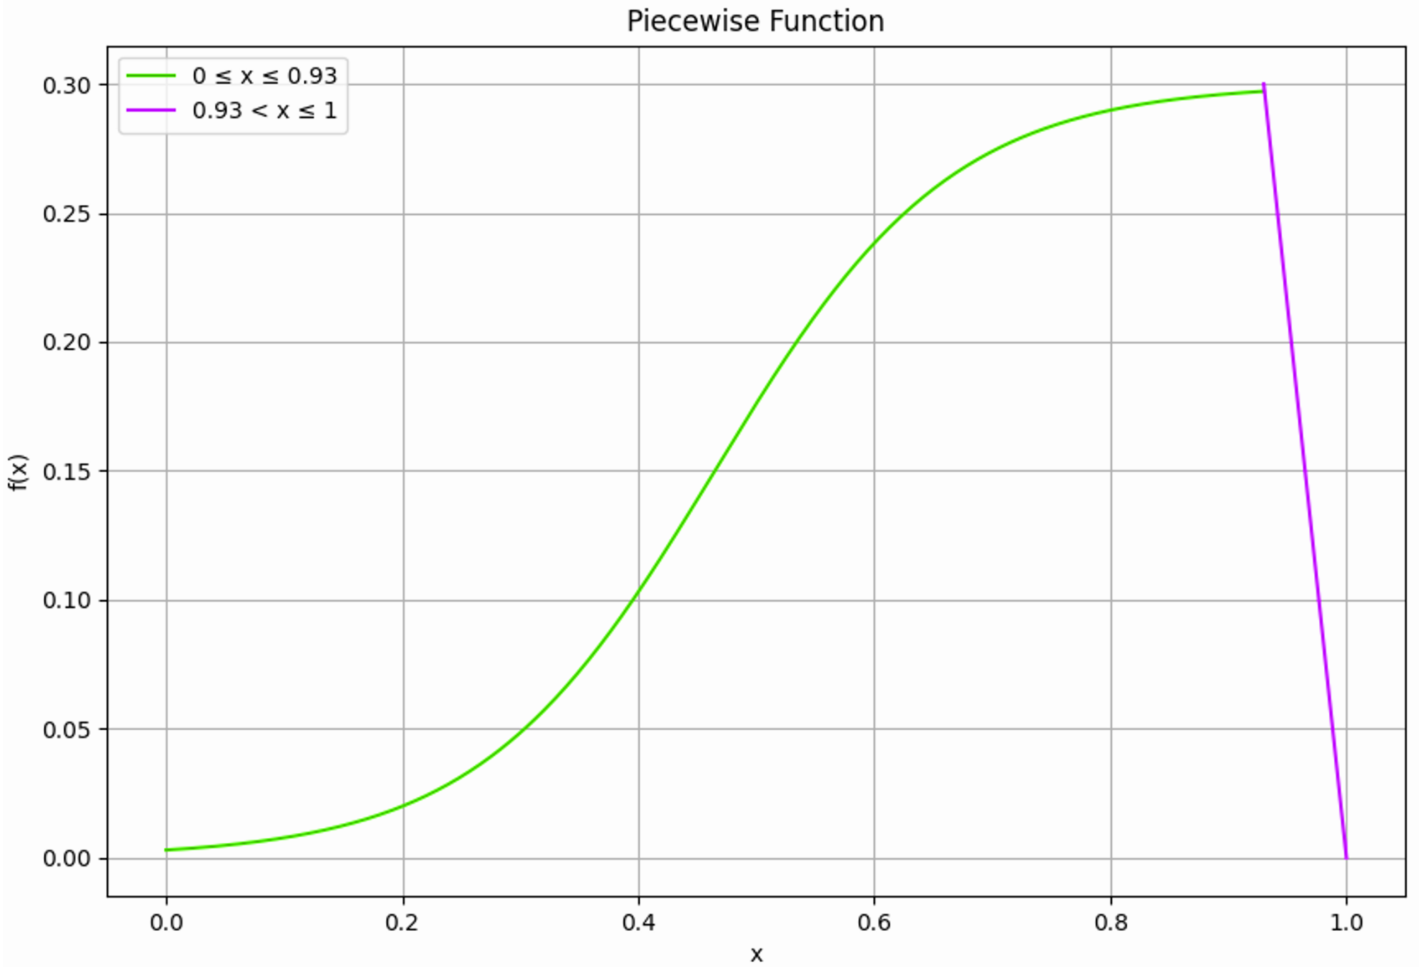
Using this applied example, the frequency of SISOR outages required increases as a cyber-crisis becomes closer. Using this graph, when there is a 50 percent chance of a crisis, the SISOR frequency for a given system is 17.5985 percent. This means that, cumulatively, nodal outages should be occurring randomly over approximately 29.6 h of the week. Conversely, when there is an 85 percent chance of a crisis, the SISOR frequency increases to 29.3749 percent, or approximately 49.3 h per week. This increase is reflective of the increased imperative to have systems ready and resilient in preparation for a potential sustained intrusion in crisis.
With , , and , the effective event selection rule is
For illustration, the probability that an eligible node is flagged for a SISOR event in a simulation timestep is approximately and .
An applied example of this formula, with a Maximum Degradation of 0.3, a Crisis Decision Point of 0.93, and a Sensitivity of 10, yields the results shown in Figure 1, with the corresponding equation shown in Equation (2).
Figure 1.
Applied SISOR graph where M = 0.3, C = 0.93, k = 10.
4. Method
4.1. Empirical Design
In this study, the SISOR theory will be tested and evaluated using quantitative metrics of degeneracy within simulated random Boolean networks (RBNs). In this context, degeneracy specifically refers to the ability of structurally different elements to perform the same function or achieve the same outcome [45,46,47]. Systems that exhibit degeneracy under states of perturbation, noise, and errors are more resilient to these events and able to compensate for compromises and losses through network dynamics [46].
Large complex cyber-physical–social (C-CPSS) networks, ranging from military mission systems to intelligent transportation systems and national critical infrastructures, are systems-of-systems. They can be represented as nodes within a network, where each node receives a range of inputs from other nodes. This encourages complex behaviours such as feedback loops, self-organisation, and emergence. This study relies on the fundamental assumption that, when faced with conditions that meet a threshold, people will react to such conditions. This is the driver of self-organising behaviour among human agents.
In this study, C-CPSS will be simulated via a testbed as nodes in a random Boolean network, with the underlying network dynamics built to accommodate this structure. The original random network structure, at timestep zero, will be the control variable to which all other timestep calculations can be compared.
Over a set number of timesteps, the network will then undergo a simulation of SISOR outages and experience network reorganisation events based on the responses to these outages. The degeneracy value of the network will be calculated at each timestep. Through this process, the impact of SISOR-related network adaptations to degeneracy can be annotated.
4.2. Applied RBN Model
This model will not be built as a classical model where n nodes each have exactly k inputs but will instead follow a homogeneous random topology. The scale-free foundation for this setup is adapted from Aldana [59].
A network is built that consists of nodes. Each node () is assigned a domain name (cyber, physical, or social) and a Boolean state representing the node’s status (1 or 0).
Each node is controlled by other nodes in the network. is chosen from a probability distribution as per the equation in Equation (3). A Poissonian distribution is used to determine input connections with a mean value of K. Nodes in are chosen randomly.
Each node is assigned a function f to represent the calculation of its next state. The function takes the inputs of . The probability of the next state of being 1 is represented as p and the probability of the next state of being 0 as . For each node , a lookup output table is generated. It contains every combination of Boolean states for each element in at time t and what the corresponding output table state for will be at time . The generation of these output states will be random. An example of how these lookup output tables function is shown in Table 2.
Table 2.
Example lookup output table.
Standard symbols are found in Appendix A. The network will originally be generated with all nodes set to 1. However, all nodes will have an inherent bit flip probability per timestep of 0.05 to align with previous degeneracy RBN experimentations [46]. As much of the existing literature in this field relates to gene expression, this inherent bit flip is a manifestation of cellular noise [60,61]. Within the context of this study, this noise bitflip can be considered as the risk of a nodal random system error or outage that is not related to the SISOR outage. With these parameters, the network can be realised.
This network distribution is known as and is the start state for the experiment. Two copies of are created, with ControlNetwork representing the control variable network for the study. SisorNetwork represents the network in which the variables will be changed to validate the SISOR methodology. Changes to the network per timestep are updated according to Equation (4) [59].
The configuration of the entire system at time t is represented as . The set of Boolean functions at configuration is represented by F. Consequently, the complete dynamical equation per timestep can be summarised as in Equation (5).
Measuring the degeneracy within a system requires the injection of perturbations into the system and the calculation of the mutual information (MI). This quantifies how much information about a random variable can be derived from the state of another variable [62].
In this example, the whole system will be analysed as a single set. The entire system is represented as X. The output status is represented as O. Entropy, as defined in information theory, is the measure of uncertainty or “expected surprise” and is represented as H [47,63]. The mutual information (MI) between the system and its output table is given by Equation (6).
Here, refers to the entropy of all elements in X system, refers to the entropy of the output sheet, and refers to the joint entropy between all elements and the output sheet. Variable j refers to the numbered subset of a set being measured, and u refers to the size of the subset. Perturbations must be injected into the system as uncorrelated random noise to each subset N, which is set to 0.25.
In addition to perturbation, the lesioning of random nodes in the network is also required to enable degeneracy calculations. This enables topological change within the network to be tested, as a system that is highly degenerate will be able to recover function by structurally different components raking over the function of lesioned nodes [46].
The marginal entropy is calculated using Equations (7) and (8). From this, the joint entropy is calculated using Equation (9).
Degeneracy is calculated by comparing mutual information (MI) calculations across the system. Every potential subset of X of a size up to and including the total number of nodes N of this equation is summed together to produce the result. The equation used to calculate degeneracy is shown in Equation (10).
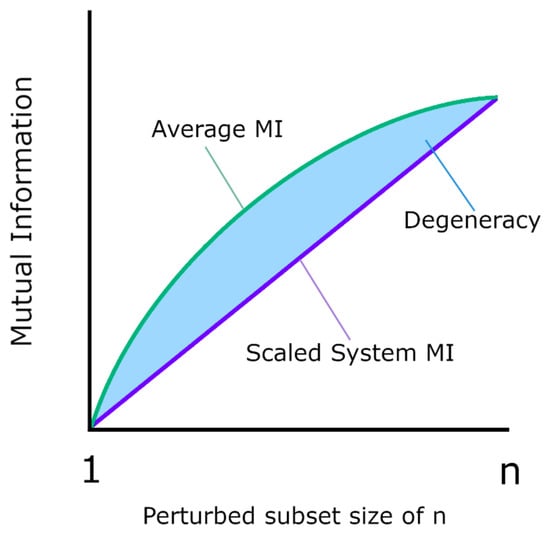
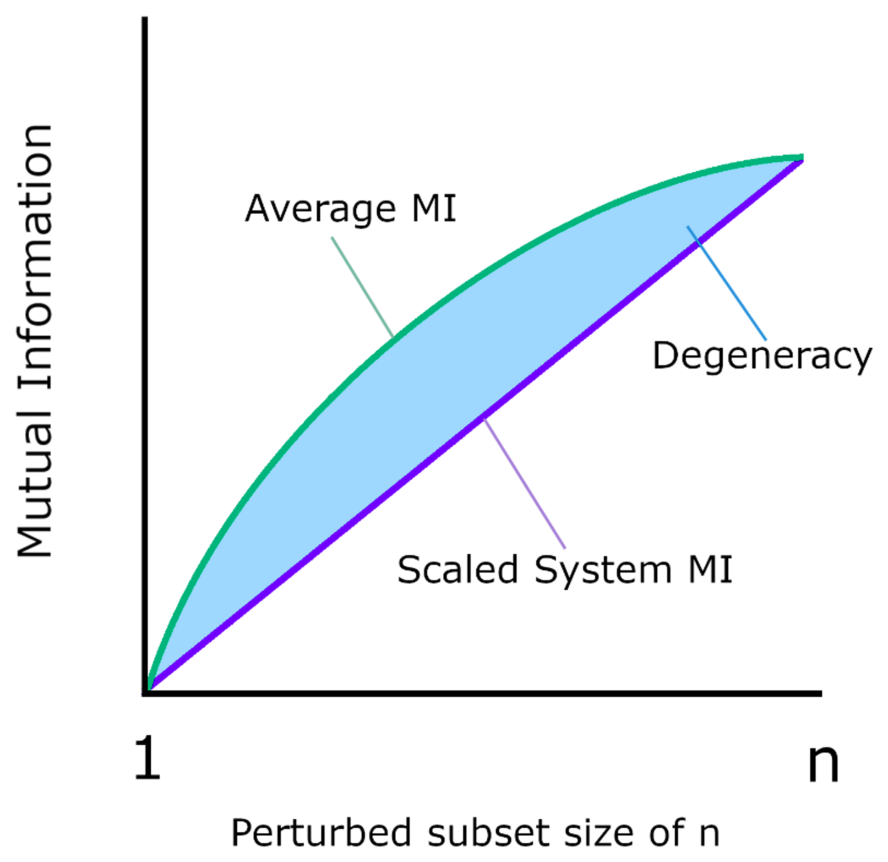
This can be graphed, showing the increase in the subset size u value on the x axis and the average mutual information (MI) from the network subsets. Two lines are plotted on the graph, one being a scaled mutual information subset and the other being the actual average mutual information over each subset. The shaded area between the lines on the graph shows the degeneracy. The larger this area, the higher the degeneracy, which suggests that subsets are outputting more MI than comparative proportional scaling would expect. This is illustrated in Figure 2.
Figure 2.
Graphical representation of degeneracy calculated from mutual information (MI), as adapted from Tononi et al. [47].
4.3. Programmatic Application
4.3.1. Python Model
The model used to simulate the random Boolean network (RBN) for this study was developed in Python 3.14 and imports from the existing libraries of networkx, matplotlib, numpy, and scipy. The model takes a set of inputs as determined by static variables, which alter the model design and simulation behaviour. These variables are drawn from the previous equations and are shown in Table 3. This table also contains the variables’ default or typical range values for the study.
Table 3.
Programmatic model setup variables.
The simulations used independently generated random values across multiple runs rather than a single fixed seed. Consequently, individual outputs may vary between executions. All simulation parameters are reported in Table 3, and the complete source code is publicly available to support independent replication under equivalent configurations.
Based on these parameters, the program developed the network ControlNetwork as the original start state. This network was then copied into a duplicate called SisorNetwork. It is to the SisorNetwork that the SISOR methodology is applied. The programmatic model has ten functions. These are described in Table 4.
Table 4.
Programmatic model functions.
4.3.2. Calculating Degeneracy
The programmatic model applies the equations described earlier in this paper. The model specifically relies on the degeneracy equation specified in Equation (10) to deliver its results, which inherently relies on the calculations in Equations (6)–(9).
The model applies perturbations in the form of injected bit flips throughout the nodes based on a perturbation probability [46,64]. This is done to introduce randomness and changes in variance within the system and its corresponding inputs and outputs [47]. Perturbation is required to gain knowledge of the joint probability distribution of all elements within the system [47]. Exclusive of these perturbations, nodes have a small inherent bit flip risk. The model also randomly lesions nodes from the network based on the lesion variable, updating the affected lookup tables appropriately, to test how topological change affects degeneracy.
4.3.3. Simulating SISOR-Driven Self-Organised Adaptability
As this is a simulation of a C-CPSS and not an applied real-world case study, the impacts of each SISOR outage had to be replicated in the environment. Dynamics that would usually be driven organically by the C-CPSS were represented programmatically. This was referred to as the SISOR Consequence Algorithm. The purpose of this algorithm was to in-simulation mimic the system responses that would occur in the event of a SISOR outage in a real-world network. This algorithm ran on the assumption that people would respond to disruptions if a disruption affected them beyond a threshold of impact.
Within the SISOR Consequence Algorithm, for each timestep, nodes within the system were flagged for a SISOR outage with a status of TRUE or FALSE based on the frequency probability calculated by the SISOR frequency formula in Equation (1). The status of the network was then updated as per the equation in Equation (4).
Each node in the network was iterated, named the target node. Individual node criticality was determined via a normal distribution, which changed per node per timestep to simulate nonlinear complex environments. To determine whether a node underwent a SISOR consequence, a random number was generated and, if this number fell within the criticality assigned to the node, then the responsive adaption in the SISOR Consequence Algorithm proceeded.
The SISOR Consequence Algorithm built adaptivity via the generation of new network connections or the creation of new network nodes. The probability of a new node being created was determined by the sisorNewNodeProb variable in Table 3, with the alternative probability being that of a new connection.
If a new node was to be generated, its input node was determined via random selection from the target node’s input node list. The new node’s outward connection was then set to a random node that had the target node as part of its input node list. All lookup tables were then updated.
If a new connection was generated, its start node was determined via random selection from the target node’s input node list. The outward connection was to a random node that had the target node as part of its input node list. All lookup tables were then updated.
Essentially, each SISOR consequence iteration that triggered a network adaptation theoretically increased the average K value of the system and/or the N value of the system.
5. Results
For the experiment, a combination of k, n, and sisorNewNodeProbability (p values) were applied to the testbed to see how the simulation reacted under different conditions.
5.1. New Node Probability Sensitivity
The sisorNewNodeProbability p values were iterated by 0.1, with the k and n values set to 1 and 10, respectively, to determine the general sensitivity of the results to this changing variable. Lesioning was set to 0.2 and perturbation to 0.25. For each p value, ten simulations were run over eight SISOR timesteps. Each simulation had 100 calculations per average degeneracy result (variable numCalcForAve).
The random seeds for the original simulations were not retained, so individual network realisations cannot be replayed exactly. However, the results for each p value draw on repeated simulations rather than a single random outcome. This supports the interpretation of the aggregate trends, while allowing for the fact that new runs may produce different numerical values.
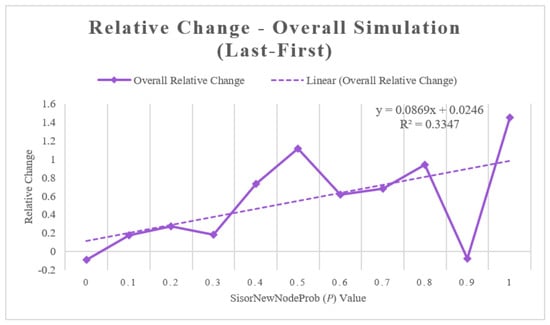
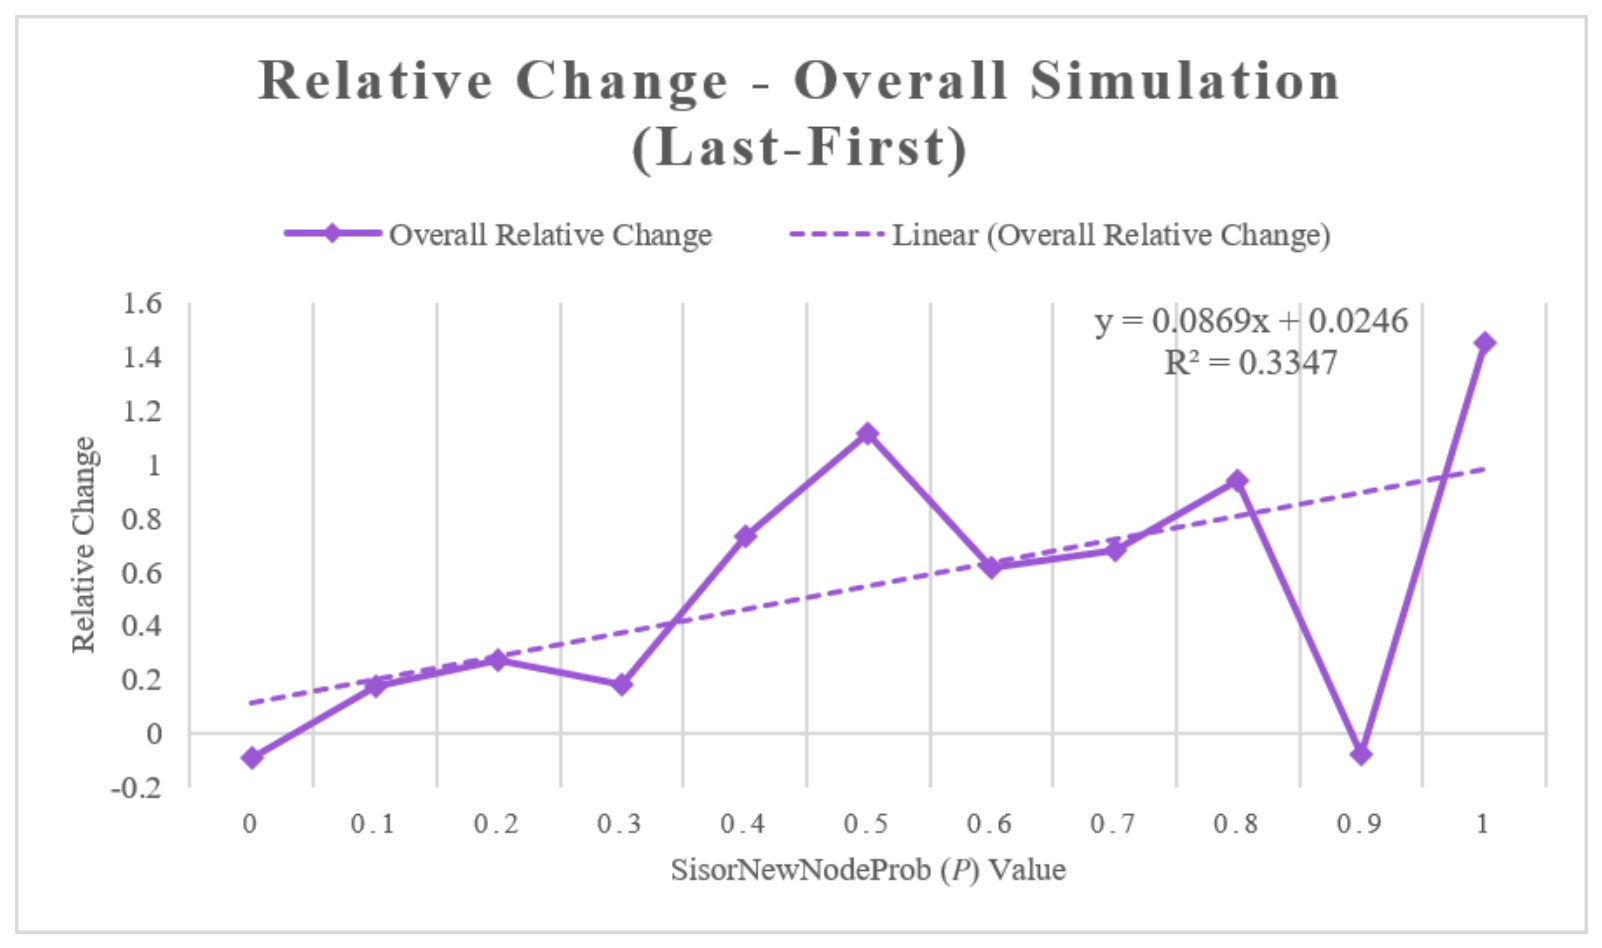
Note that a single outlier was removed from the p = 0.9 data due to extreme skew. Subsequently, the average overall relative change for this p value was calculated over nine series instead of 10. Figure 3 shows the relative change in the degeneracy value of the network after the final SISOR timestep compared against the original network degeneracy, averaged across the ten network simulations at that p value. It shows a general positive trendline above 0, with the relative change value increases approximately correlated with increases in the p value. The implications of this are discussed in the next section.
Figure 3.
Relative change from last timestep to original network.
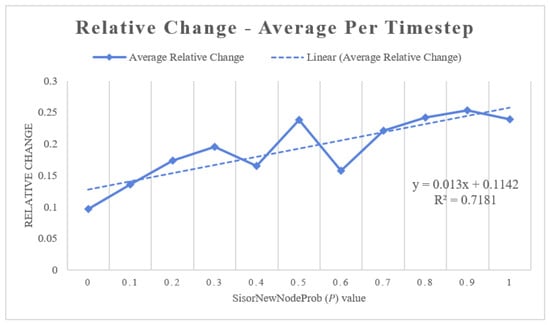
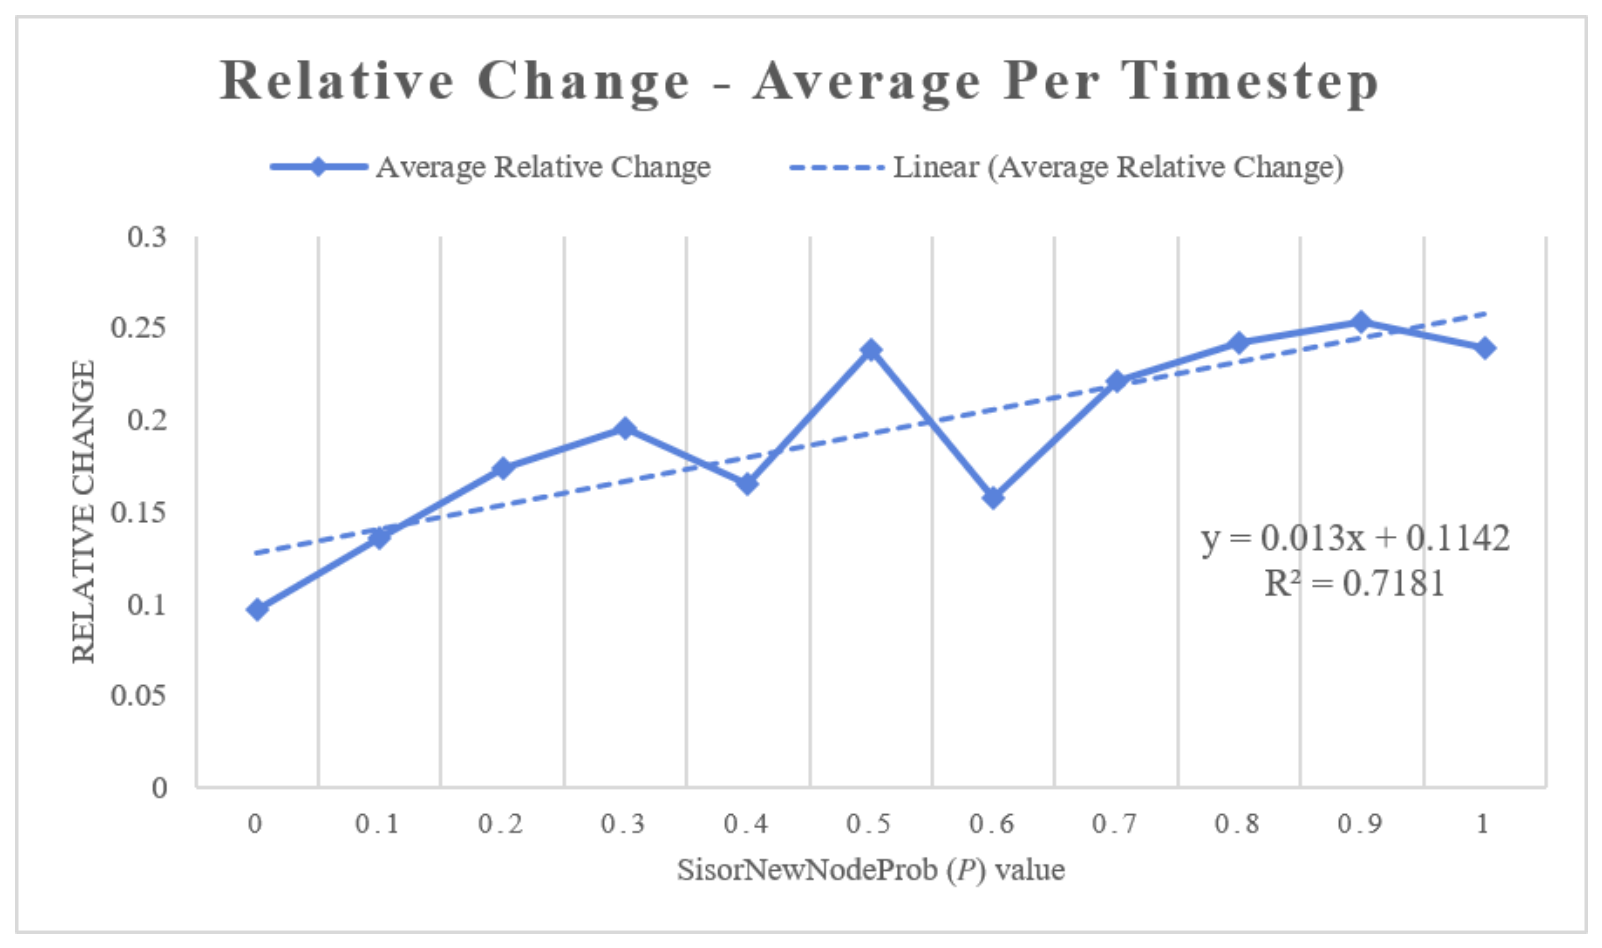
Figure 4 averages the relative change values between the eight SISOR timesteps and then averages this value across the ten network simulations for each p value. The results show a consistent relative change value above 0, with a positive correlation between increases in the p value and the relative change value.
Figure 4.
Relative change averaged over timesteps.
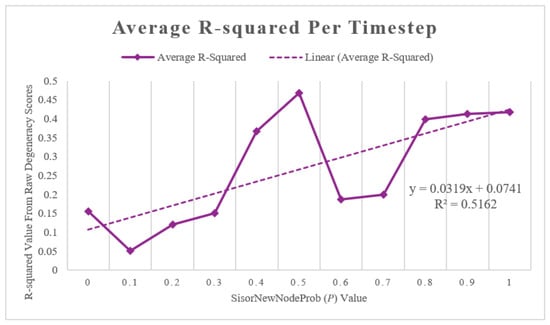
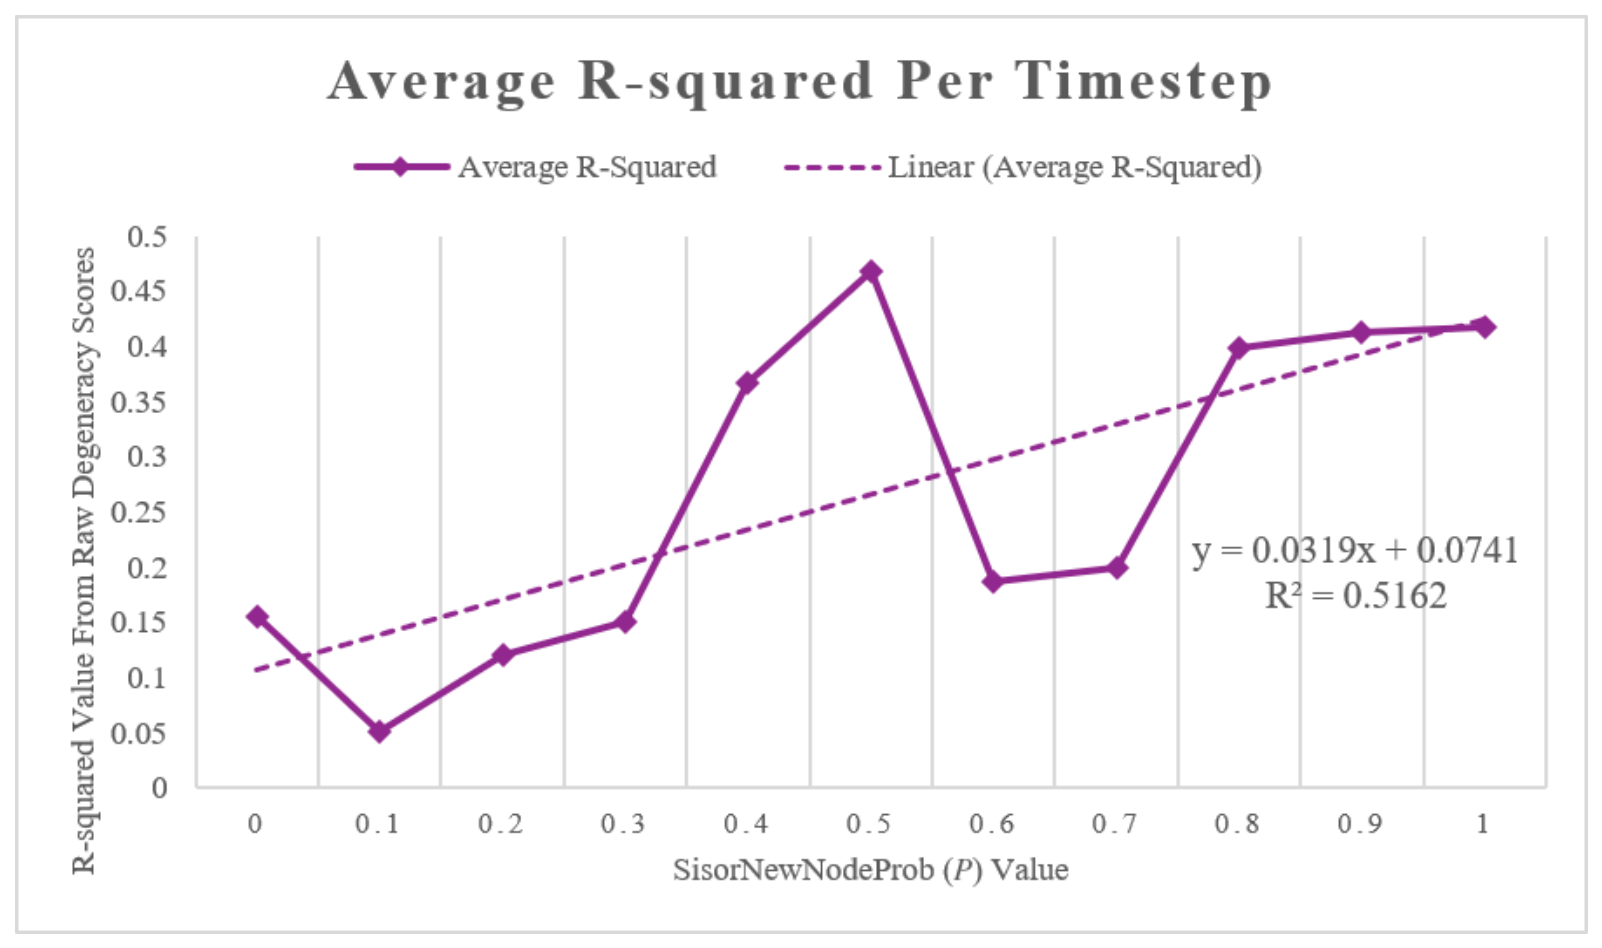
Figure 5 shows the average value for each set of degeneracy scores. Higher p values were associated with higher average values, indicating a stronger linear fit between SISOR timesteps and degeneracy within the simulations. However, alone does not fully characterise statistical reliability or variability, and this relationship should therefore be interpreted as descriptive and specific to the experimental conditions examined.
Figure 5.
R-squared averaged over timesteps.
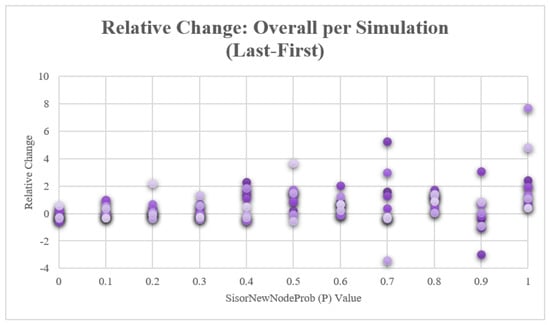
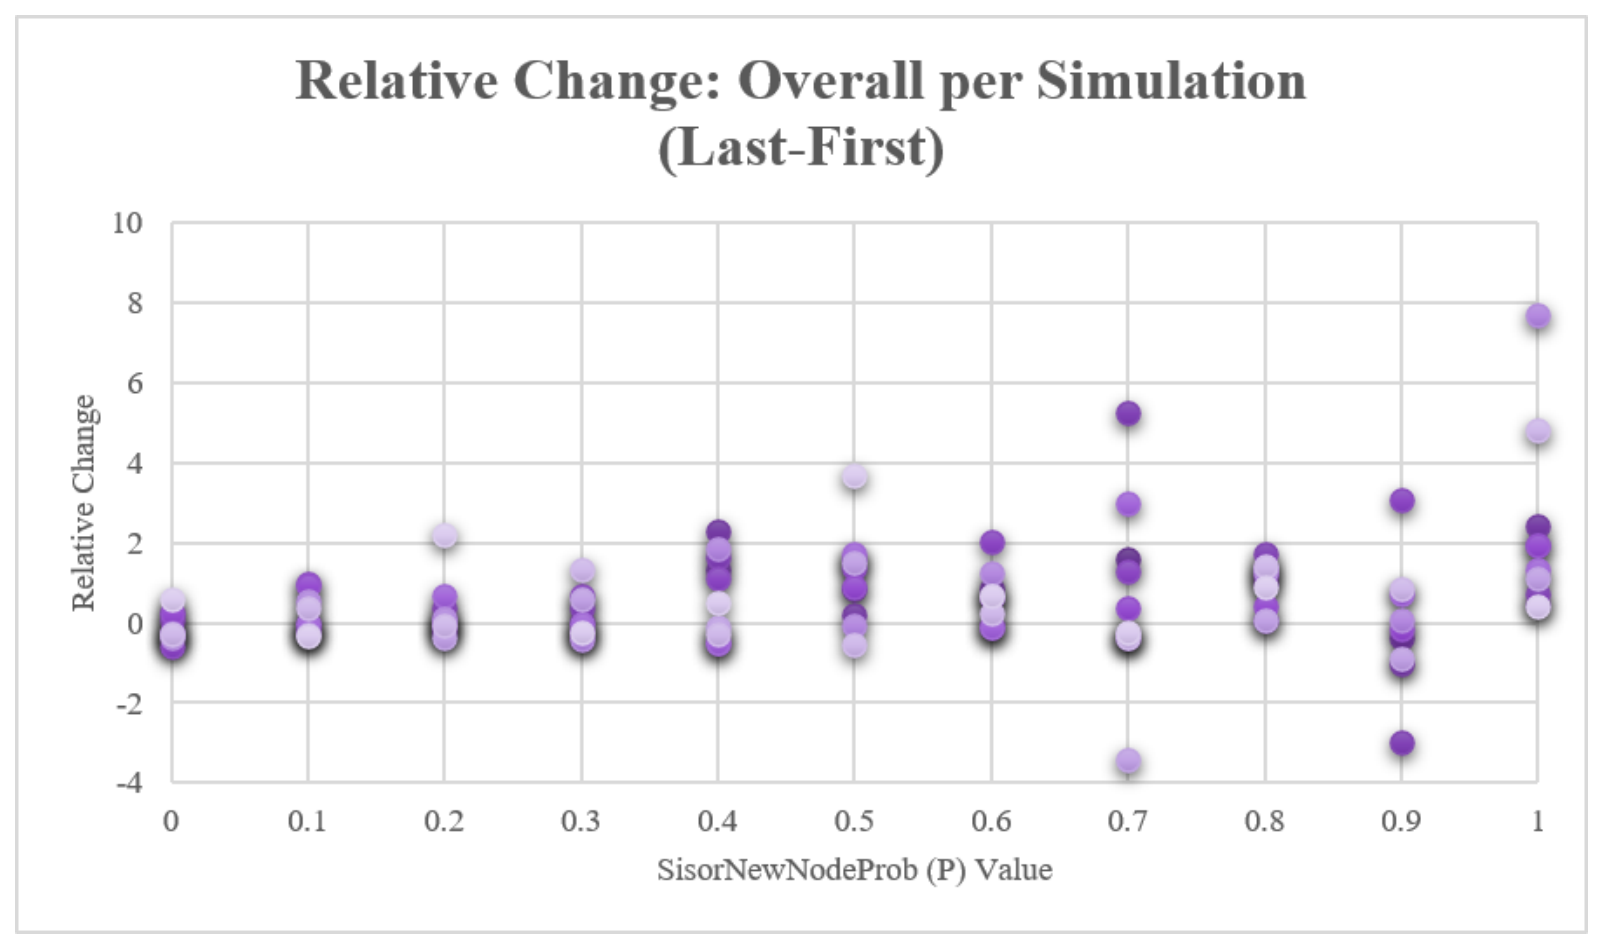
The data points for each network simulation were also visualised. Figure 6 shows, for each simulation, the relative change between the original system degeneracy score and the degeneracy score after the last SISOR timestep.
Figure 6.
Data points for relative change from last timestep to original system state.
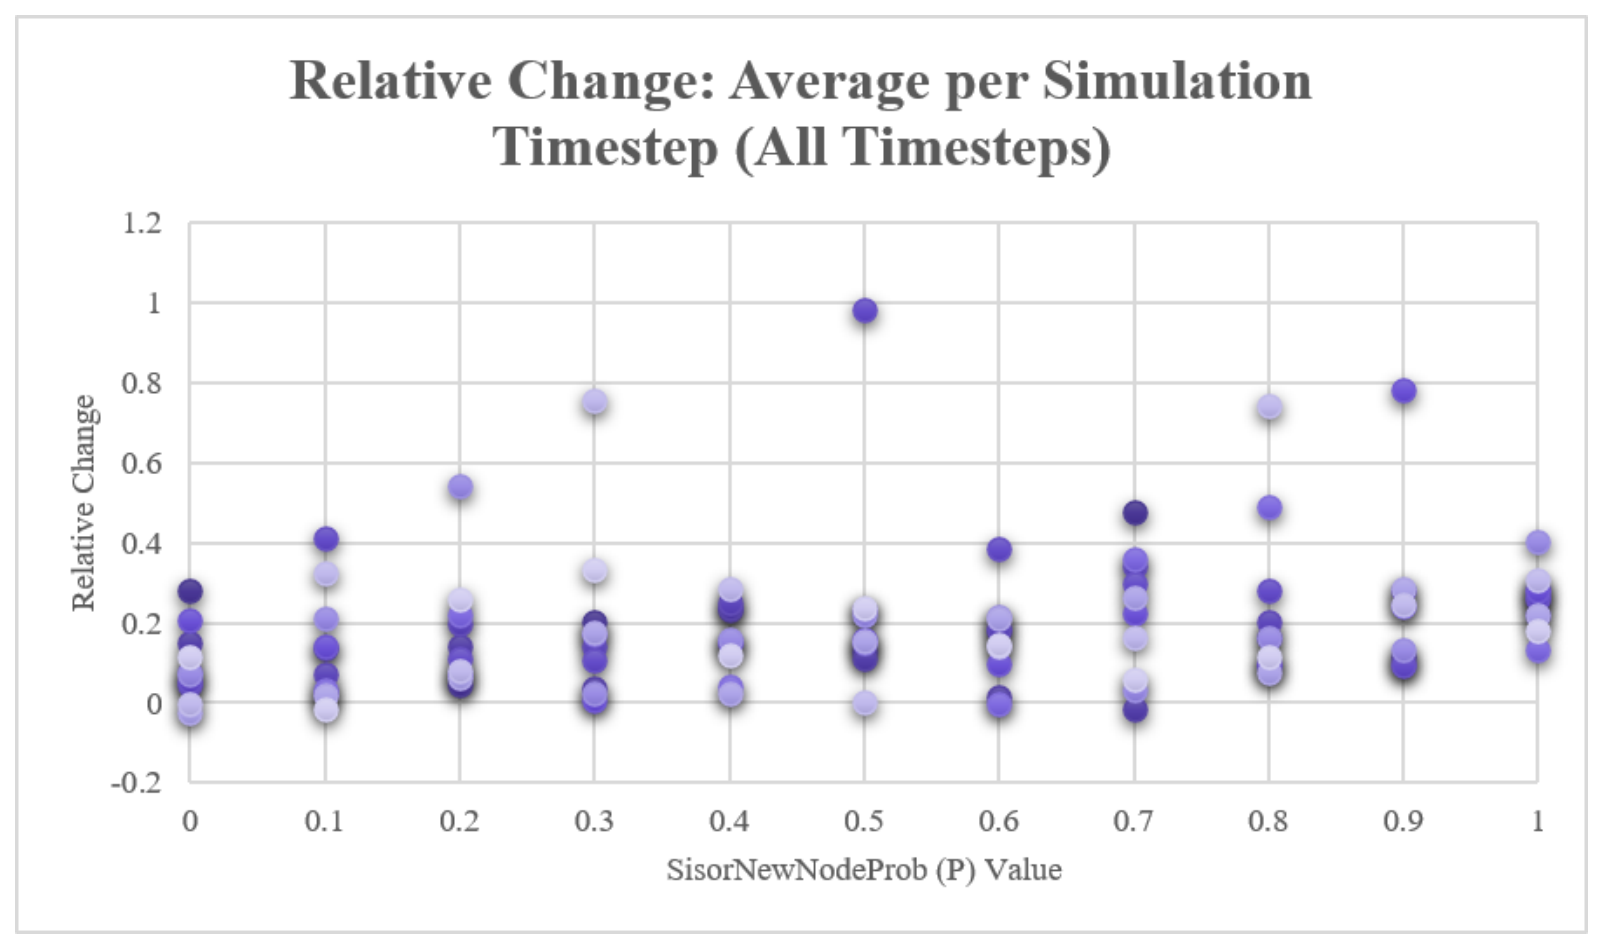
Figure 7 shows the average relative change per SISOR timestep for each network simulation. These graphs illustrate how the majority of the simulations outputted degeneracy scores after SISOR treatments of greater than zero, with minimal outliers below this value.
Figure 7.
Data points for relative change averaged over timesteps.
5.2. Validation for More Connected Networks
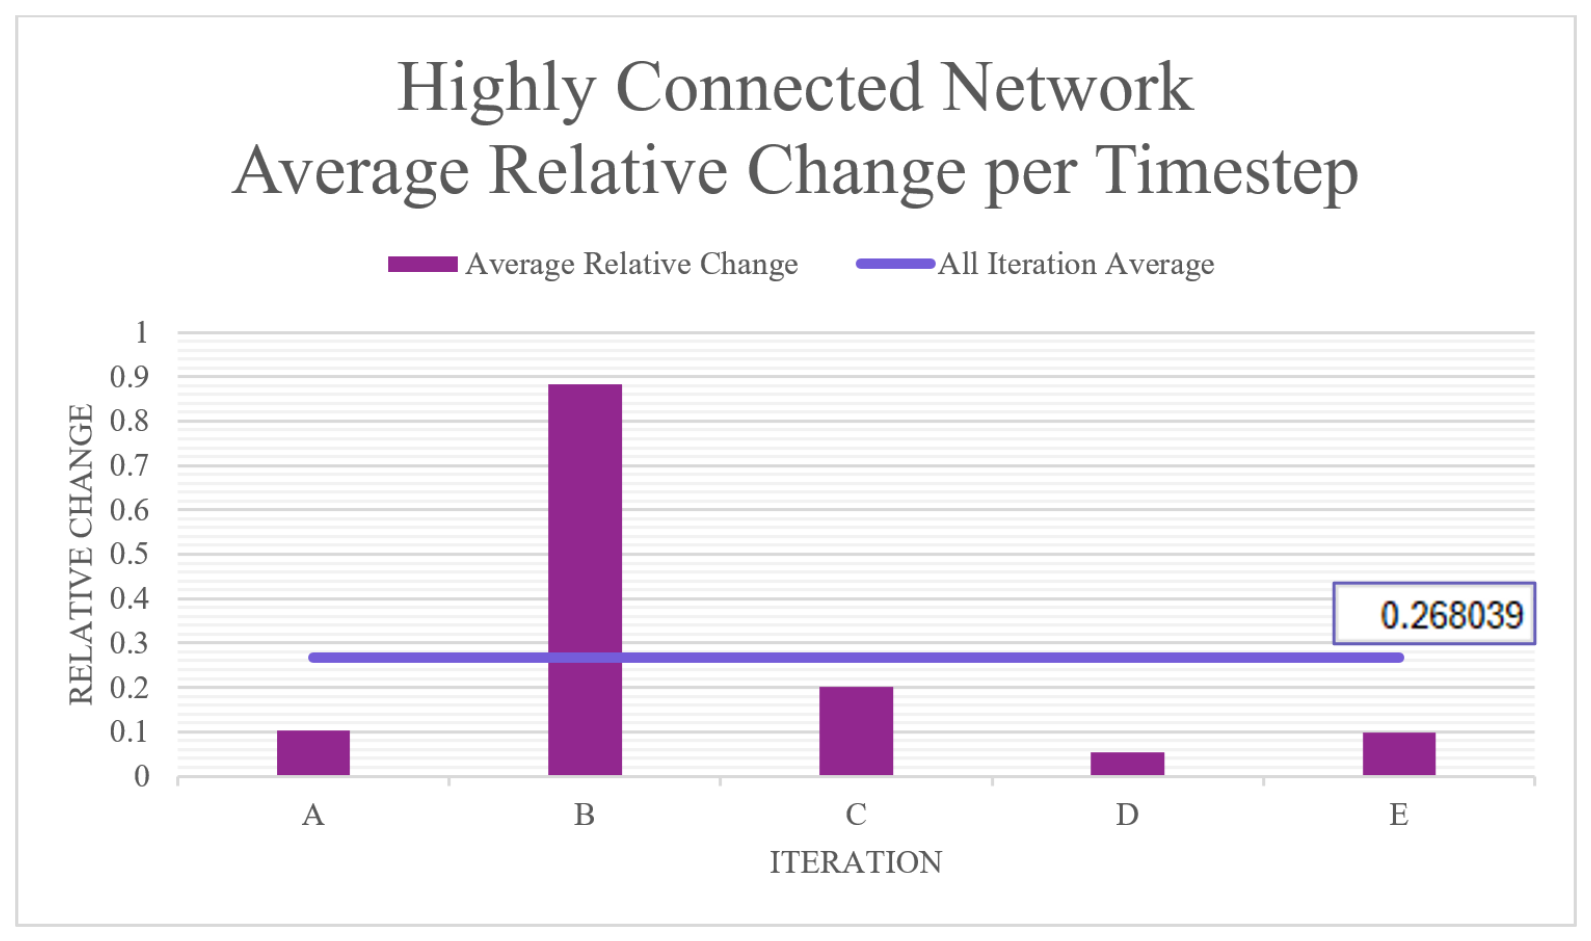
In another experiment, the average inter-connectivity (K value) of each node in the network was increased from one to two. The network consisted of ten nodes, with lesioning set to 0.2 and a p value of 0.5, and was run for five SISOR timesteps. For this network, the number of repeated calculations performed for each average degeneracy calculation was 50. As shown in Figure 8, all iterations of this experiment averaged an increase in network degeneracy per SISOR timestep, with an overall average relative change per timestep across all iterations of 0.27. This demonstrates the methodology’s applicability to more interconnected networks.
Figure 8.
Highly connected network average relative change per timestep.
6. Discussion and Future Work
6.1. Positive Relative Change
The results from this work provide preliminary evidence that applying a SISOR approach to RBNs over time increases their overall degeneracy and therefore their resiliency. The nodes within these RBNs experienced fluctuating criticality values, replicating real-world adaptive complex cyber-physical–social systems. In order for SISOR to be assessed as effective, the relative change values for the degeneracy scores needed to be greater than 0, indicating that the degeneracy of the network was increasing. Figure 3 shows that, when considering a system’s start and end state, this is the case 80 percent of the time, barring two outliers. When averaged into a linear trendline, all relative change values sit above 0, validating the SISOR methodology. Figure 4 shows that, each time a SISOR timestep occurred, it consistently improved the relative change in the network on average, with all results being above 0, further validating the SISOR methodology.
6.2. p Values and Degeneracy
Increasing the p value, which was the probability of a new node being created by the SISOR algorithm as opposed to a new connection, had a positive correlative effect on the relative change in the degeneracy of the network. This is seen in the trendline in Figure 3 and the results in Figure 4. These outcomes indicate that adding nodes—and, by extension, increasing network connectivity through their integration into the network—is more impactful in improving network degeneracy than simply increasing network connectivity alone.
Figure 5 shows the average R-squared value for each set of degeneracy scores. It shows that there is a positive correlation between a higher p value and R-squared value, indicating that the higher the p values are, the more likely there is a relationship between the number of SISOR timesteps and degeneracy.
6.3. Computational Complexity
Computational limitations in memory and processing power were experienced that limited the sizes of the RBNs that could be generated and tested in this study. Processes such as calculating the possible probability distributions of node binary states increased exponentially per input added to the lookup table of a node. This meant that increasing the average K value over the network had significant consequences, with many simulations experiencing memory crashes, program crashes, and manual resets due to errors caused by this computational complexity. Python, by default, only uses one CPU core due to the Global Interpreter Lock (GIL), which restricted the amount of processing that could be achieved when running the simulations. Future expansions of the work should consider options for multiprocessing. Additionally, an accessible memory size of at least 128 GB is recommended for the current experimental setup, with larger datasets requiring more RAM to reduce the risk of memory-related errors during binary combination processing.
The experimental findings provide preliminary support for SISOR within the 15-node network examined. They should not be interpreted as empirical validation of scalability to substantially larger networks, which remains to be evaluated in future work.
6.4. Negative Degeneracy Scores
Negative degeneracy scores were sometimes outputted as part of the RBN simulations, which is a consequence of the small N and K values used in this experiment. Smaller networks that are less connected render noise higher in samples and increase the risk of fluctuations to cause a negative degeneracy score. Larger networks with denser wiring are more likely to have varied, distinct configurations, leading to statistical overlaps in the degeneracy calculations that can absorb random fluctuations [46].
There are several aspects of this work that are yet to be explored. In the future, increasing the RBN graph N and K values through enhanced hardware infrastructure should reduce the number of negative degeneracy scores calculated and assist in smoothing the result trends. This may also overall reduce the need for such a significant average number of simulations to be run, as 50–100 degeneracy calculations per timestep in the current model are used in an attempt to balance out any negative scores caused by fluctuations. Subsequently, while the computational complexity of the graphs may increase through these changes, the number of repetitions required may lessen and the consistency and reliability of the results may improve.
6.5. Variance Across Graph Trends
Figure 4 shows a general positive linear trend as the p value increased. However, each value was individually unpredictable and did not perfectly fit the trendline. The results derived in these graphs were limited to networks of ten nodes in size due to computational limitations. Their small size made them susceptible to volatility in changing conditions. The more averages that were combined together, the smoother the trendlines generally were. This can be seen in the comparison of Figure 3 and Figure 4, where the relative change values for Figure 4 were calculated using an average of eight values, whereas the relative change value for Figure 3 was calculated using only one. This likely also explains why there are some significant outliers in Figure 3, but these are not replicated in Figure 4, because they were absorbed out over the averages across the larger calculations.
6.6. Limitations of Simulated Consequences
This study validates the SISOR method through measures of degeneracy in RBNs. As this was the first step to validate SISOR as a theoretical simulated study, the true complex cyber-physical–social dynamics of real-world interactive nodes were not measured. The SISOR formula was able to be successfully tested and applied to the network. The SISOR Consequences Algorithm serves as a programmatic stand-in for the real-world self-organising dynamics that would be seen in C-CPSSs in the event of an outage. Such behaviours include the creation of redundant nodes, the creation of new nodes, or the rewiring of existing nodes [15,65,66], based on the temporal importance of the system to the overall system-of-systems. There are limitations in using the SISOR Consequences Algorithm to simulate the effects of implementing SISOR instead of measuring them in an applied context.
Firstly, the algorithm is limited to only two options to adapt the network, namely to add a new node or add a new connection. In a real-world C-CPSS scenario, nodes surrounding an outage may respond with a myriad of options. These may include those detailed in the algorithm but may also relate to other self-organising methods, such as the restructuring of existing network connections or the replication of existing nodes.
Secondly, the SISOR Consequences Algorithm is not regulated by the complex adaptive system of the C-CPSS, as it would be in a real-world application, which means that SISOR adaptations may occur indefinitely over timesteps. Conversely, in an applied scenario, the nature of these adaptations would not be a deterministic algorithm but rather a reflection of the system’s state and criticality. For example, in the RBN, the algorithm uses statistics to determine how to respond to a SISOR outage. In a C-CPSS, human, computer, and physical elements would all contribute to the formulation of a response to an outage based on their own parameters and objectives.
The network behaviour generated by the SISOR Consequences Algorithm should therefore be interpreted as constrained self-organisation. Although the resulting global network topology is not specified directly, local adaptations are governed by predefined probabilities: the sisorNewNodeProb parameter controls the probability of adding a new node, while its complement controls the probability of adding a new connection. The observed changes in degeneracy therefore reflect the interaction between these probabilistic assumptions and the evolving network state, rather than self-organisation occurring independently of the model’s parameterisation.
Subsequently, now that the value of the SISOR approach has been validated theoretically, future research should involve the application of the method within an applied C-CPSS scenario, where the cyber, physical, and social complexity dynamics can be measured. This will inform evaluations of systemic self-organisation against emergent events and overall resiliency against lesioning or perturbations with insight into real-world nodal responses at all domain levels.
7. Conclusions
Stress-Induced Self-Organised Resilience (SISOR) offers a novel approach to resilience that leverages controlled stress to activate self-organisation within complex cyber-physical–social systems. Rather than attempting to predict and fortify critical nodes, SISOR encourages systems to reveal and restructure their own dependency patterns under manageable conditions. The resulting resilience is intended to be emergent and adaptive, creating controlled stress at the node level without requiring a prior global ranking of node criticality. Further experimentation is needed to validate this. The resulting resilience is inherently adaptive.
This research has used random Boolean networks and information theory calculations to provide evidence that network adaptations triggered by SISOR applications quantitively improve metrics of degeneracy. This degeneracy informs a measurable assessment of resilience within these C-CPSSs. This study presents SISOR as a complexity-informed, distributed approach to cyber-resilience. It is designed to address the limitations associated with traditional resilience methods, particularly their reliance on complete network visibility and the prior identification of critical nodes. The results provide preliminary support for the concept; however, its comparative benefits and applicability across operational environments require further empirical validation.
By integrating SISOR with mission assurance frameworks, organisations can develop survivability in advance of disruption, rather than relying on reactive adaptation during crises. The approach reduces the reliance on centralised analysis, enabling resilience to be built in dynamic environments where system states and interdependencies cannot be fully mapped. Future work will involve operational deployment within live infrastructure settings, validation through digital twin simulation environments, and the development of automated SISOR frequency calibration models. In this context, SISOR has the potential to form the foundation of a new class of adaptive cyber-resilience practices. Such practices recognise that survivability is not engineered once but continuously cultivated.
Author Contributions
Conceptualisation, T.S. and B.T.; methodology, T.S.; software, T.S.; validation, T.S.; formal analysis, T.S.; investigation, T.S.; resources, B.T.; data curation, T.S.; writing—original draft preparation, T.S.; writing—review and editing, T.S., B.T., and N.M.; visualisation, T.S.; supervision, B.T. and N.M.; project administration, B.T. and N.M.; funding acquisition, B.T. and N.M. All authors have read and agreed to the published version of the manuscript.
Funding
This research received no external funding.
Institutional Review Board Statement
Not applicable.
Informed Consent Statement
Not applicable.
Data Availability Statement
The original RBN SISOR simulator presented in the study is openly available in a Python library on GitHub at https://github.com/tmay22/Boolean_Network_SISOR_Degeneracy_Simulator (accessed on 16 July 2026).
Acknowledgments
The authors acknowledge the Royal Australian Air Force and the Air and Space Power Centre for supporting this research.
Conflicts of Interest
The authors declare no conflicts of interest.
Abbreviations
The following abbreviations are used in this manuscript:
| SISOR | Stress-Induced Self-Organised Resilience |
| C-CPSS | Complex Cyber-Physical–Social System |
| CPSS | Cyber-Physical–Social System |
| CPS | Cyber-Physical System |
| MI | Mutual Information |
| RBN | Random Boolean Network |
| DN | Degeneracy |
Appendix A
Table A1.
Symbols.
References
- Fjäder, C. Navigating Complexity: Resilience Strategies for Safeguarding Information in the Context of National Security and Preparedness. In Information Resilience and Comprehensive Security: Challenges and Complexities in Wicked Environments; Springer: Berlin/Heidelberg, Germany, 2024; pp. 57–73. [Google Scholar]
- Iftikhar, A.; Purvis, L.; Giannoccaro, I.; Wang, Y. The impact of supply chain complexities on supply chain resilience: The mediating effect of big data analytics. Prod. Plan. Control 2023, 34, 1562–1582. [Google Scholar] [CrossRef] [Scilit]
- Sobb, T.; Turnbull, B. CrowdStrike: Lessons in Mission Assurance to Build Resilience for Complex Cyber–Physical–Social Systems. IEEE Access 2025, 13, 205324–205337. [Google Scholar] [CrossRef] [Scilit]
- George, A.S. When trust fails: Examining systemic risk in the digital economy from the 2024 CrowdStrike outage. Partn. Univers. Multidiscip. Res. J. 2024, 1, 134–152. [Google Scholar]
- Kollewe, J.; Lay, K.; Topham, G.; Goodley, S. From trains to retail, how CrowdStrike outage caused havoc across industries. The Guardian, 19 July 2024. Available online: https://www.theguardian.com/technology/article/2024/jul/19/from-trains-to-retail-how-crowdstrike-outage-caused-havoc-across-industries (accessed on 7 September 2026).
- Chen, D.; Chen, J.; Zhang, X.; Jia, Q.; Liu, X.; Sun, Y.; Lv, L.; Yu, W. Critical nodes identification in complex networks: A survey. arXiv 2025, arXiv:2507.06164. [Google Scholar]
- Kim, S.; Park, K.J.; Lu, C. A survey on network security for cyber–physical systems: From threats to resilient design. IEEE Commun. Surv. Tutor. 2022, 24, 1534–1573. [Google Scholar] [CrossRef] [Scilit]
- Bodeau, D.; Graubart, R. Cyber Resiliency Design Principles; The MITRE Corporation: Bedford, MA, USA, 2017. [Google Scholar]
- Ross, R.; Pillitteri, V.; Graubart, R.; Bodeau, D.J.; McQuaid, R.M. Nist Special Publication 800-160, Volume 2 Revision 1: Developing Cyber-Resilient Systems: A Systems Security Engineering Approach; National Institute of Standards and Technology (US): Gaithersburg, MD, USA, 2021.
- Adamos, K.; Stergiopoulos, G.; Karamousadakis, M.; Gritzalis, D. Enhancing attack resilience of cyber-physical systems through state dependency graph models. Int. J. Inf. Secur. 2024, 23, 187–198. [Google Scholar] [CrossRef] [Scilit]
- Hamouda, E.; ElHafsi, M.; Son, J. Securing network resilience: Leveraging node centrality for cyberattack mitigation and robustness enhancement. Inf. Syst. Front. 2024. [Google Scholar] [CrossRef] [Scilit]
- Srivastava, A.K.; Ernster, T.A.; Liu, R.; Krishnan, V.G. Graph-theoretic algorithms for cyber-physical vulnerability analysis of power grid with incomplete information. J. Mod. Power Syst. Clean Energy 2018, 6, 887–899. [Google Scholar] [CrossRef] [Scilit]
- Canzani, E. Dynamic Interdependency Models for Cybersecurity of Critical Infrastructures. Ph.D. Thesis, Faculty of Computer Science, Munich, Germany, 2017. [Google Scholar]
- Syrmakesis, A.D.; Alcaraz, C.; Hatziargyriou, N.D. Classifying resilience approaches for protecting smart grids against cyber threats. Int. J. Inf. Secur. 2022, 21, 1189–1210. [Google Scholar] [CrossRef] [Scilit]
- Abbas, W.; Laszka, A.; Koutsoukos, X. Improving network connectivity and robustness using trusted nodes with application to resilient consensus. IEEE Trans. Control Netw. Syst. 2017, 5, 2036–2048. [Google Scholar] [CrossRef] [Scilit]
- Chernikova, A.; Gozzi, N.; Boboila, S.; Angadi, P.; Loughner, J.; Wilden, M.; Perra, N.; Eliassi-Rad, T.; Oprea, A. Cyber network resilience against self-propagating malware attacks. In Proceedings of the European Symposium on Research in Computer Security; Springer: Berlin/Heidelberg, Germany, 2022; pp. 531–550. [Google Scholar]
- Segovia-Ferreira, M.; Rubio-Hernan, J.; Cavalli, A.; Garcia-Alfaro, J. A survey on cyber-resilience approaches for cyber-physical systems. ACM Comput. Surv. 2024, 56, 1–37. [Google Scholar] [CrossRef] [Scilit]
- Bhatti, U.A.; Tang, H.; Wu, G.; Marjan, S.; Hussain, A. Deep learning with graph convolutional networks: An overview and latest applications in computational intelligence. Int. J. Intell. Syst. 2023, 2023, 8342104. [Google Scholar] [CrossRef] [Scilit]
- Santoro, A.; Battiston, F.; Petri, G.; Amico, E. Higher-order organization of multivariate time series. Nat. Phys. 2023, 19, 221–229. [Google Scholar] [CrossRef] [Scilit]
- Holton, N.; Cottin, M.; Wright, A.; Mannino, M.; Antonio, D.S.; Bigliassi, M. Antifragility and Growth Through Adversity: A Scoping Review. Psychol. Rep. 2026, 00332941261416041. [Google Scholar] [CrossRef] [Scilit] [PubMed]
- Kott, A.; Abdelzaher, T. Resiliency and robustness of complex, multi-genre networks. arXiv 2016, arXiv:1601.06731. [Google Scholar]
- Jabbour, K.; Muccio, S. The science of mission assurance. J. Strateg. Secur. 2011, 4, 61–74. [Google Scholar] [CrossRef] [Scilit]
- Richards, J.; Bruhl, J.; Richards, J.; Long, S. Improving Mission assurance assessments for resilience of military installations. Nat. Hazards Rev. 2021, 22, 04021036. [Google Scholar] [CrossRef] [Scilit]
- Trias, C.E.D. Modeling and Simulation in Mission Assurance; SAGE Publications Sage UK: London, UK, 2023; Volume 20, pp. 109–110. [Google Scholar]
- Williams, C.; Ibbotson, J.; Lockerbie, J.; Attwood, K. Mission assurance through requirements traceability. In Proceedings of the 2014 IEEE Military Communications Conference; IEEE: Piscataway, NJ, USA, 2014; pp. 1645–1650. [Google Scholar]
- Schwarze, A.C.; Jiang, J.; Wray, J.; Porter, M.A. Structural robustness and vulnerability of networks. arXiv 2024, arXiv:2409.07498. [Google Scholar]
- Chen, C.C.; Crilly, N. Modularity, redundancy and degeneracy: Cross-domain perspectives on key design principles. In Proceedings of the 2014 IEEE International Systems Conference Proceedings; IEEE: Piscataway, NJ, USA, 2014; pp. 546–553. [Google Scholar]
- Walker, B.; Salt, D.; Reid, W.V. Resilience Thinking: Sustaining Ecosystems and People in a Changing World; Island Press: Washington, DC, USA, 2006. [Google Scholar]
- Pisano, U. Resilience and Sustainable Development: Theory of resilience, systems thinking. Eur. Sustain. Dev. Netw. (ESDN) 2012, 26, 50. [Google Scholar]
- Holling, C. Engineering resileince versus ecological resilience. In National Academy of Engineering: Engineering Within Ecological Constraints; Schulze, P.C., Ed.; National Academy Press: Washington, DC, USA, 1996. [Google Scholar]
- Connelly, E.B.; Allen, C.R.; Hatfield, K.; Palma-Oliveira, J.M.; Woods, D.D.; Linkov, I. Features of resilience. Environ. Syst. Decis. 2017, 37, 46–50. [Google Scholar] [CrossRef] [Scilit]
- Grimm, V.; Calabrese, J.M. What is resilience? A short introduction. In Viability and Resilience of Complex Systems: Concepts, Methods and Case Studies from Ecology and Society; Springer: Berlin/Heidelberg, Germany, 2011; pp. 3–13. [Google Scholar]
- Holling, C.S. Resilience and Stability of Ecological Systems; International Institute for Applied Systems Analysis: Laxenburg, Austria, 1973. [Google Scholar]
- Rosowsky, D.V. Defining resilience. Sustain. Resilient Infrastruct. 2020, 5, 125–130. [Google Scholar] [CrossRef] [Scilit]
- Hollnagel, E.; Woods, D.D.; Leveson, N. Resilience Engineering: Concepts and Precepts; Ashgate Publishing, Ltd.: London, UK, 2006. [Google Scholar]
- Holling, C.S.; Gunderson, L.H. Resilience and Adaptive Cycles; Island Press: Washington, DC, USA, 2002. [Google Scholar]
- Bhamra, R.; Dani, S.; Burnard, K. Resilience: The concept, a literature review and future directions. Int. J. Prod. Res. 2011, 49, 5375–5393. [Google Scholar] [CrossRef] [Scilit]
- Bodin, P.; Wiman, B. Resilience and other stability concepts in ecology: Notes on their origin, validity, and usefulness. ESS Bull. 2004, 2, 33–43. [Google Scholar]
- Luthans, F.; Vogelgesang, G.R.; Lester, P.B. Developing the psychological capital of resiliency. Hum. Resour. Dev. Rev. 2006, 5, 25–44. [Google Scholar] [CrossRef] [Scilit]
- Council, N.R. Disaster Resilience: A National Imperative; The National Academies Press: Washington, DC, USA, 2012. [Google Scholar]
- Haimes, Y.Y. On the definition of resilience in systems. Risk Anal. Int. J. 2009, 29, 498–501. [Google Scholar] [CrossRef] [Scilit] [PubMed]
- Haimes, Y.Y.; Crowther, K.; Horowitz, B.M. Homeland security preparedness: Balancing protection with resilience in emergent systems. Syst. Eng. 2008, 11, 287–308. [Google Scholar] [CrossRef] [Scilit]
- Cottam, B.J.; Specking, E.A.; Small, C.A.; Pohl, E.; Parnell, G.S.; Buchanan, R.K. Defining Resilience for Engineered Systems; Canadian Center of Science and Education: Toronto, ON, Canada, 2019; Volume 8. [Google Scholar]
- U.S. Air Force. AFPD 10-24; Operations: Mission Assurance. U.S. Air Force. 2019. Available online: https://static.e-publishing.af.mil/production/1/af_a3/publication/afpd10-24/afpd10-24.pdf (accessed on 7 September 2026).
- Edelman, G.M.; Gally, J.A. Degeneracy and complexity in biological systems. Proc. Natl. Acad. Sci. USA 2001, 98, 13763–13768. [Google Scholar] [CrossRef] [Scilit] [PubMed]
- Kocaoglu, B.; Alexander, W.H. Degeneracy measures in biologically plausible random Boolean networks. BMC Bioinform. 2022, 23, 71. [Google Scholar] [CrossRef] [Scilit] [PubMed]
- Tononi, G.; Sporns, O.; Edelman, G.M. Measures of degeneracy and redundancy in biological networks. Proc. Natl. Acad. Sci. USA 1999, 96, 3257–3262. [Google Scholar] [CrossRef] [Scilit] [PubMed]
- Randles, M.; Lamb, D.; Odat, E.; Taleb-Bendiab, A. Distributed redundancy and robustness in complex systems. J. Comput. Syst. Sci. 2011, 77, 293–304. [Google Scholar] [CrossRef] [Scilit]
- Whitacre, J.M. Degeneracy: A link between evolvability, robustness and complexity in biological systems. Theor. Biol. Med. Model. 2010, 7, 6. [Google Scholar] [CrossRef] [Scilit] [PubMed]
- Robertson, L.; Bond, A. Technological and Biological Systems’ Resilience: Observations and Learnings. Environ. Manag. 2025, 75, 1642–1655. [Google Scholar] [CrossRef] [Scilit] [PubMed]
- Urken, A.B.; Schuck, T.M. Designing evolvable systems in a framework of robust, resilient and sustainable engineering analysis. Adv. Eng. Inform. 2012, 26, 553–562. [Google Scholar] [CrossRef] [Scilit]
- Artime, O.; Grassia, M.; De Domenico, M.; Gleeson, J.P.; Makse, H.A.; Mangioni, G.; Perc, M.; Radicchi, F. Robustness and resilience of complex networks. Nat. Rev. Phys. 2024, 6, 114–131. [Google Scholar] [CrossRef] [Scilit]
- Li, Y.; Yi, Y. Systematic measures of biological networks II: Degeneracy, complexity, and robustness. Commun. Pure Appl. Math. 2016, 69, 1952–1983. [Google Scholar] [CrossRef] [Scilit]
- Bagheri, S.; Ridley, G.; Williams, B. Organisational cyber resilience: Management perspectives. Australas. J. Inf. Syst. 2023, 27. [Google Scholar] [CrossRef] [Scilit]
- Cassottana, B.; Roomi, M.M.; Mashima, D.; Sansavini, G. Resilience analysis of cyber-physical systems: A review of models and methods. Risk Anal. 2023, 43, 2359–2379. [Google Scholar] [CrossRef] [Scilit] [PubMed]
- Shypovskyi, V. Enhancing the factor analysis of information risk methodology for assessing cyberresilience in critical infrastructure information systems. Political Sci. Secur. Stud. J. 2023, 4, 25–33. [Google Scholar]
- Lawrence, C.A. The 40% Rule. The Dupuy Institute (Blog), 26 March 2024. Available online: https://dupuyinstitute.org/2024/03/26/the-40-rule/ (accessed on 7 September 2026).
- Kent, S. Words of Estimative Probability; CIA Center for the Study of Intelligence: Langley, VA, USA, 1964.
- Aldana, M. Boolean dynamics of networks with scale-free topology. Phys. D Nonlinear Phenom. 2003, 185, 45–66. [Google Scholar] [CrossRef] [Scilit]
- Vasic, B.; Ravanmehr, V.; Krishnan, A.R. An information theoretic approach to constructing robust Boolean gene regulatory networks. IEEE/ACM Trans. Comput. Biol. Bioinform. 2011, 9, 52–65. [Google Scholar] [CrossRef] [Scilit] [PubMed]
- Peixoto, T.P.; Drossel, B. Noise in random boolean networks. Phys. Rev. E—Stat. Nonlinear Soft Matter Phys. 2009, 79, 036108. [Google Scholar] [CrossRef] [Scilit] [PubMed]
- Sinaga, M.A. On study of mutual information and its estimation methods. arXiv 2021, arXiv:2106.14646. [Google Scholar]
- Varley, T.F. Information theory for complex systems scientists: What, why, and how. Phys. Rep. 2025, 1148, 1–55. [Google Scholar] [CrossRef] [Scilit]
- Trairatphisan, P.; Mizera, A.; Pang, J.; Tantar, A.A.; Schneider, J.; Sauter, T. Recent development and biomedical applications of probabilistic Boolean networks. Cell Commun. Signal. 2013, 11, 46. [Google Scholar] [CrossRef] [Scilit] [PubMed]
- Rouse, W.B.; Henneman, R.L. Human Problem Solving in Complex Dynamic Environments; ARI Research Note 87-84; Center for Man-Machine Systems Research, Georgia Institute of Technology: Atlanta, GA, USA, 1987. [Google Scholar]
- Ippolito, N.; Cats, O. Multi-modal and multi-layer robustness analysis of the European rail and air networks. Sci. Rep. 2024, 14, 26950. [Google Scholar] [CrossRef] [Scilit] [PubMed]

Disclaimer/Publisher’s Note: The statements, opinions and data contained in all publications are solely those of the individual author(s) and contributor(s) and not of MDPI and/or the editor(s). MDPI and/or the editor(s) disclaim responsibility for any injury to people or property resulting from any ideas, methods, instructions or products referred to in the content. |
© 2026 by the authors. Licensee MDPI, Basel, Switzerland. This article is an open access article distributed under the terms and conditions of the Creative Commons Attribution (CC BY) license.