


Highlights
Please indicate how your work links to systems science via your contributions to systems practice, theory, and/or methodology.
- •
- It models student innovation capability as a feedback system involving students, resources, policy, and project outcomes.
- •
- It integrates system dynamics, AUC measurement, and Pareto analysis for multi-objective policy evaluation.
What are the main findings and/or the implications of the main findings?
- •
- Strong incentives or rapid project expansion may yield only short-term gains under resource and capacity constraints.
- •
- Eight configurations are non-dominated, highlighting the need to balance output, motivation, and campus resources.
Abstract
Universities increasingly seek to develop students’ innovation capability, but growth in student participation and project activity can outpace the mentoring, facilities, funding, and incubation capacity required to sustain it. This study examines the dynamic alignment between capability-related student conditions and institutional support capacity. A four-subsystem system dynamics model represents Student Motivation, Student Self-Efficacy, Innovation Skills, project flows, Campus Resources, Mentor Pool, Policy Support, and Innovation Output. The model is used to trace feedback, accumulation, capacity constraints, and implementation delays and to conduct counterfactual policy experiments over 240 months. Policy configurations are evaluated from the complete simulated trajectories by calculating the area under the curve (AUC) for Innovation Output, Student Motivation, and Campus Resources and applying Pareto dominance. The simulations show that strong incentives or rapid project expansion can generate short-term gains while increasing congestion, resource pressure, and burnout when institutional capacity adjusts too slowly. Eight configurations are non-dominated, indicating that no single policy simultaneously maximizes cumulative output, preserves motivation, and protects the resource base. The results are conditional on the stated model structure, parameterization, and single-institution calibration; they are intended to support policy deliberation rather than establish causal effects or make point predictions.
1. Introduction
Universities increasingly expect students not only to generate original ideas but also to turn those ideas into workable responses to technological, organizational, and social problems [1,2,3]. This expectation reflects the growing importance of cognitive flexibility, interdisciplinary knowledge, creative problem solving, and adaptive judgment in graduate employment and social development [4,5].
In this study, student innovation capability refers to students’ developable capacity to recognize problems and opportunities, generate and evaluate novel and useful ideas, integrate and apply relevant knowledge, collaborate with others, mobilize resources, implement and refine solutions, and learn from the results [6,7,8]. The term is used as an integrative, action-oriented concept rather than as a new psychological construct. Creativity is an essential component of this capability, particularly in producing novel and useful ideas [9], but innovation capability also includes the practical, social, and organizational processes through which ideas are tested, adapted, and converted into implementable outcomes [10,11].
Research has not neglected these issues. Studies of individual innovation competence have identified the knowledge, skills, attitudes, personal attributes, and collaborative abilities associated with participation in innovation processes [11]. Measurement research has operationalized innovation competence through dimensions such as creative problem solving, systems thinking, goal orientation, teamwork, and networking [12]. Other studies have examined how active learning, multidisciplinary education, industry engagement, innovation-oriented learning environments, and design thinking influence these competences [13,14,15].
Evidence from university ecosystem research further indicates that institutional resources and campus experiences shape students’ innovation capacities [16]. Longitudinal research shows that these capacities can follow different developmental trajectories during university education and that sustained connections between curricular and extracurricular experiences are associated with stronger development [17]. Innovation capability is therefore neither fixed nor determined solely by individual characteristics; it develops through repeated interaction between students and their educational environment.
A practical challenge arises when universities seek to expand innovation activity. Measures that strengthen motivation, provide incentives, or increase the number of projects also increase demand for mentors, funding, laboratories, project supervision, and incubation services [18,19,20,21]. When participation and project initiation grow faster than these resources can be expanded, congestion can reduce practice quality, delay project progression, and lower the probability of success. Repeated delays or unsuccessful experiences may then weaken student self-efficacy and motivation [22,23,24]. The opposite imbalance is also possible: investment in laboratories, incubation platforms, or mentoring programs may produce limited benefits when participation and project demand remain low.
We describe this challenge as capability–capacity alignment. Student capability concerns the motivation, self-efficacy, knowledge, skills, and experience required for innovative action. Institutional support capacity is the university’s ability to support that action through mentors, funding, facilities, project management, incubation services, and effective policy implementation. Sustainable development depends not on maximizing either side independently, but on whether both sides develop at compatible rates.
This alignment problem is dynamic. Participation, motivation, skills, resources, and project outcomes accumulate and change through feedback; facilities and mentoring impose capacity constraints; and policy investment takes time to become usable support. Consequently, an intervention that appears beneficial initially may become self-limiting as workload and congestion increase, whereas capacity-building measures may incur early costs before generating later benefits. The research aim is to explain these interactions over time and compare policy configurations that balance cumulative innovation performance, sustained student engagement, and preservation of the institutional resource base.
2. Literature Review
2.1. Student Innovation Capability: Concept and Development
Student innovation capability sits at the intersection of established research on creativity, innovation competence, entrepreneurial competence, experiential learning, and higher education. Creativity is commonly defined in terms of producing ideas that are both original and useful [9]. Innovation competence extends beyond ideation to include the individual and collaborative capacities needed to evaluate, implement, adapt, and communicate solutions [10,11]. Instruments developed for authentic higher-education environments accordingly include creative problem solving, systems thinking, goal orientation, teamwork, and networking [12].
Learning environments can strengthen these capacities through authentic tasks, multidisciplinary collaboration, reflection, industry engagement, and repeated opportunities to apply knowledge [13,14]. Design-thinking interventions provide a related pathway by organizing problem framing, idea generation, prototyping, testing, and revision [15]. These studies establish that student innovation capability is developable and multidimensional. They also caution against equating capability with a single outcome such as entrepreneurial intention, patent counts, competition awards, or the number of ideas generated.
2.2. University Innovation Environments and Institutional Support Capacity
Capability develops within an institutional environment. University ecosystem research shows that curricular and extracurricular experiences, access to networks, organizational climate, and institutional resources shape undergraduate innovation capacities [16]. Four-year longitudinal evidence likewise indicates that students follow different developmental trajectories and that sustained institutional engagement matters [17]. These findings support treating student development and institutional conditions as interdependent rather than independent explanations.
The institutional side includes both immediately available resources and the processes that convert support into usable capacity. Mentors, laboratories, funding, project-management arrangements, incubation platforms, and university–industry connections can enable project learning and implementation. In this study, Policy Support refers to the accumulated effective strength of government- and university-level measures that provide project funding and participation incentives, invest in mentoring and innovation facilities, support incubation platforms, and facilitate university–industry collaboration. It denotes implemented support rather than the number of policy documents or a generally favorable policy climate.
Policy Support can affect the system through two routes. A direct incentive route stimulates participation and project initiation through funding, recognition, and project-related incentives. A capacity-building route converts support, after an implementation delay, into resources that expand mentoring, facilities, and incubation capacity. The distinction matters because activity may respond faster than capacity: a policy can increase project demand immediately while the infrastructure required to support it remains unchanged.
2.3. System Dynamics in Educational Research and Policy Evaluation
System dynamics has been used to study educational systems containing multiple interacting actors, resources, capacities, and outcomes. Chung et al. [25], for example, model the expansion of early childhood education through relationships among the educator workforce, organizational trust, pre-K seat capacity, access, and service quality. Keith et al. [26] examine educational underperformance, teacher burnout, parental dissatisfaction, enrollment decline, and reform implementation. These studies demonstrate that educational system dynamics is not confined to a single construct or objective; its value lies in explaining how feedback and capacity constraints can generate unintended policy effects.
Other research has addressed processes related to student development, including digital innovation capability, learning-oriented motivation, entrepreneurial intention, and interdisciplinary competence [27,28,29,30]. Multi-objective optimization has also been combined with system dynamics in non-educational policy settings [31,32]. These streams establish the usefulness of configurational, dynamic, and non-dominated policy analysis, but they differ in system boundary and purpose.
Good simulation research also requires a transparent correspondence among the research question, model boundary, equations, parameters, experiments, and reported results. Following reporting and reproducibility guidance [33,34,35], the revised manuscript distinguishes explanatory causal-loop views from the complete executable stock–flow model, uses descriptive variable names, documents equations and units, identifies empirical and judgment-based inputs, and states the limits of calibration and inference.
2.4. Research Gap, Problem Statement, Aim, and Research Questions
The literature provides substantial knowledge about student-level competences and university environments, and prior educational system dynamics studies already model multiple system components [36,37,38,39]. The remaining gap addressed here is therefore narrower than a general lack of research. Among the studies reviewed, limited attention has been paid to the dynamic alignment between the development and expression of university students’ innovation capability and the institutional capacity required to support it. Less attention has also been paid in this context to comparing policies from their complete simulated trajectories across several institutional objectives.
The problem addressed by this study is that policies intended to increase student innovation activity may stimulate participation and project initiation faster than mentors, campus resources, and incubation capacity can adjust. The resulting mismatch can produce congestion, resource depletion, reduced success, and motivational decline, while capacity investment without sufficient participation can leave resources underused. The research aim is to explain how this capability–capacity mismatch develops and to identify policy configurations that manage its competing outcomes over time.
The study addresses the following research questions:
RQ1. How do student-level capability-related conditions and institutional support capacity interact through feedback processes and time delays?
RQ2. Under what conditions does growth in student participation and project activity produce sustained innovation outcomes, and when does it instead create congestion, resource pressure, or declining motivation?
RQ3. Which policy configurations remain non-dominated when cumulative Innovation Output, Student Motivation, and Campus Resources are considered jointly?
To answer these questions, the study develops a four-subsystem system dynamics model, conducts counterfactual simulations, and evaluates each policy configuration with the AUC of Innovation Output, Student Motivation, and Campus Resources followed by Pareto-dominance analysis. The model addresses RQ1 by representing stocks, flows, feedback loops, capacity constraints, and delays; it addresses RQ2 by tracing behavior under baseline, single-policy, and combined-policy experiments; and it addresses RQ3 by comparing whole-trajectory cumulative outcomes without assigning fixed weights to the three objectives. Section 3 explains why this method is appropriate, defines the model boundary and subsystem mechanisms, and documents the model for replication.
3. Methodology and Model Development
3.1. Methodological Rationale and Research Design
System dynamics is appropriate because the identified problem is generated by endogenous feedback, accumulation, nonlinear capacity constraints, and delays rather than by a single contemporaneous association [40,41]. Student Motivation, Student Self-Efficacy, Innovation Skills, Campus Resources, Policy Support, Projects, and Innovation Output are state-dependent quantities that evolve through inflows and outflows. Project activity consumes resources; outcomes feed back to confidence and institutional support; and policy investment becomes usable capacity only after implementation. These mechanisms can cause the direction and magnitude of an intervention’s effect to change over time.
The research design proceeds in four linked stages. First, theory, prior empirical research, institutional records, and expert judgment define the model boundary and hypothesized feedback structure. Second, the relationships are formalized as stock–flow equations with explicit units, nonlinear response functions, bounds, and delays. Third, historical fit, dimensional and structural checks, extreme-condition tests, and sensitivity analyses evaluate whether the model is adequate for comparative experimentation. Fourth, baseline, single-policy, and combined-policy simulations are compared over 240 months, and their complete trajectories are summarized through AUC and Pareto dominance.
This design addresses RQ1 by making the feedback links between student conditions and institutional capacity explicit. It addresses RQ2 through counterfactual experiments that vary incentive, resource, policy-conversion, and project-screening conditions while retaining the same model structure. It addresses RQ3 by treating cumulative Innovation Output, Student Motivation, and Campus Resources as distinct objectives and identifying configurations for which no objective can be improved without worsening at least one other objective. The analysis is explanatory and comparative: it does not estimate causal treatment effects or predict a particular university’s future with certainty.
Self-determination theory, the resource-based view, and institutional theory guide variable selection and causal direction [42,43,44]. Self-determination theory informs the representation of motivation and self-efficacy; the resource-based view motivates the treatment of mentoring, facilities, funding, and incubation capacity as constrained institutional resources; and institutional theory informs the accumulation, decay, and allocation of effective policy support. These theories specify mechanisms, while the stock–flow formulation tests whether their combined assumptions can reproduce plausible dynamic behavior.
3.2. Model Boundary and Overall Architecture
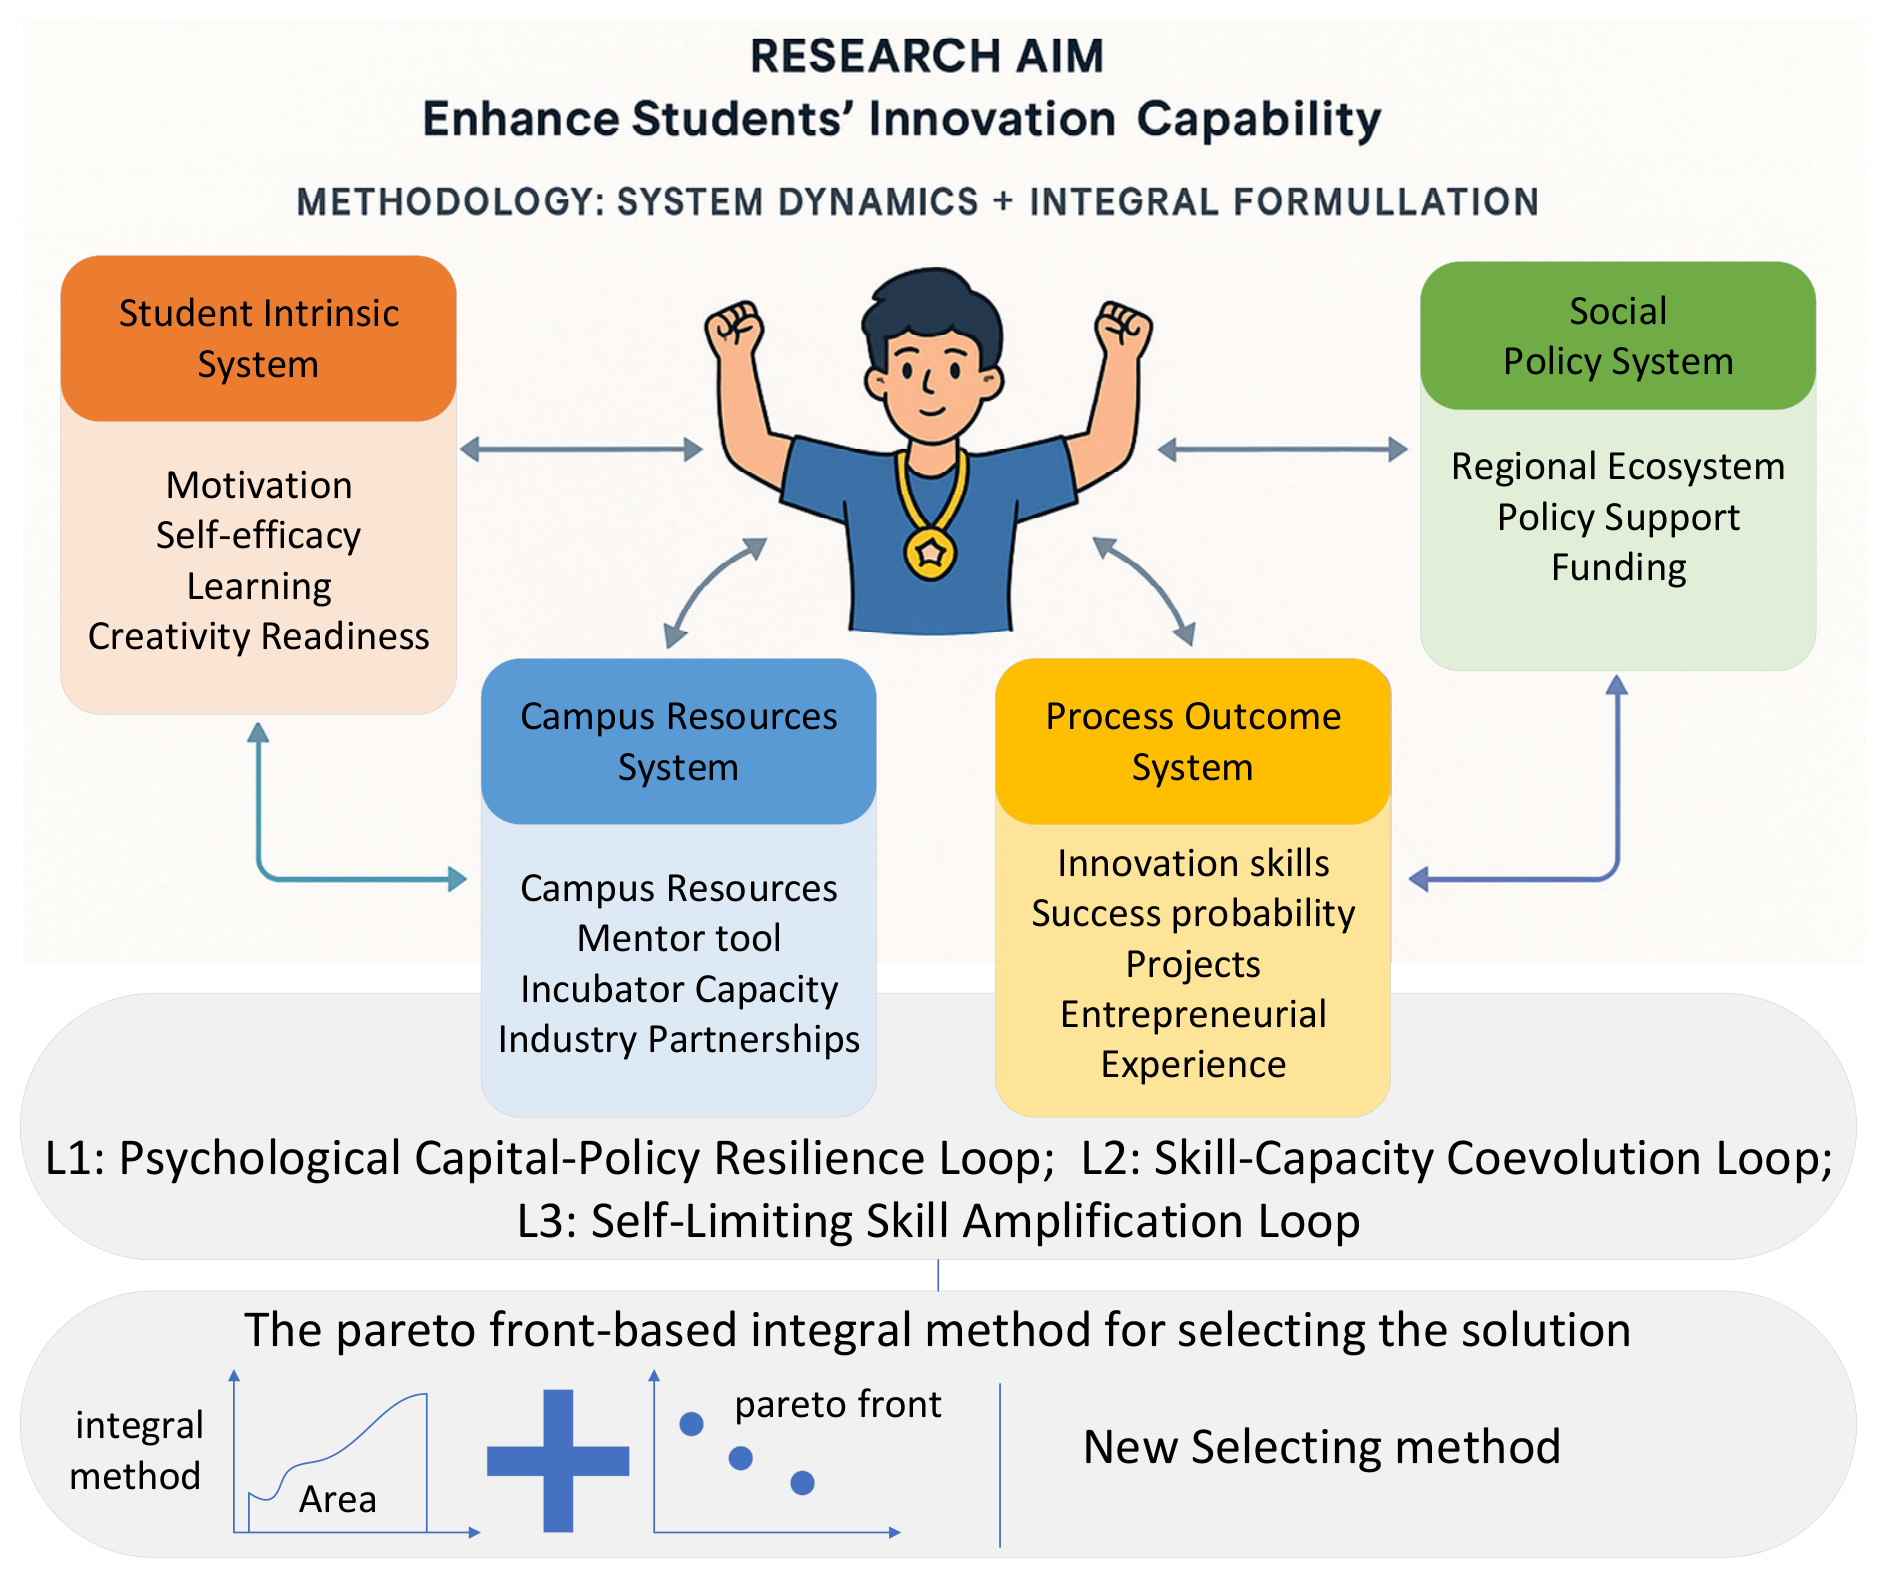
The model boundary contains four interdependent subsystems: Student Intrinsic, Campus Resources, Social Policy, and Process Outcomes. Endogenous variables include the principal student conditions, active projects, project success and failure flows, institutional resources, policy support, and innovation output. Course Innovation, Monetary Awards, Recognition Index, Industry Partnerships, Market Demand, and selected parameter values are treated as exogenous scenario inputs or constants. Student innovation capability is not represented as a single directly observed stock; it is an emergent construct reflected in the development and application of motivation, self-efficacy, skills, creativity readiness, and experience under enabling or constraining institutional conditions.
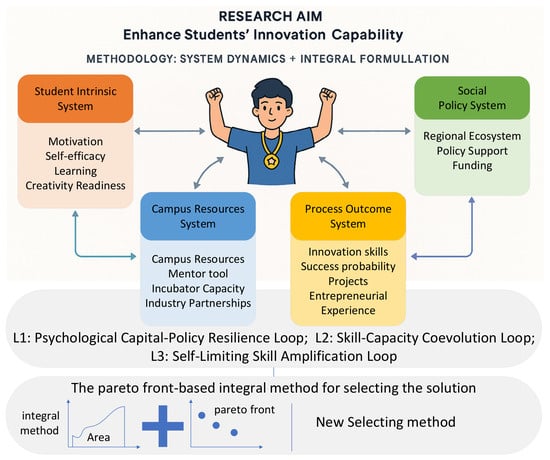
Figure 1 presents the study architecture at the level needed to connect the research questions to the analysis. The four-subsystem model generates time trajectories under baseline and policy experiments. RQ1 and RQ2 are answered from the feedback structure and simulated behavioral patterns, whereas RQ3 is answered by converting the three focal trajectories into AUC measures and applying Pareto dominance. The variables are shown in Table 1. Detailed equations, parameter sources, and variable units are reported in Table 1 and Supplementary Tables S1 and S2.
Figure 1.
Research design linking the four-subsystem model, policy experiments, simulated trajectories, and AUC–Pareto evaluation.
Table 1.
Selected equations and specifications used in the system dynamics model.
3.3. Student Intrinsic System
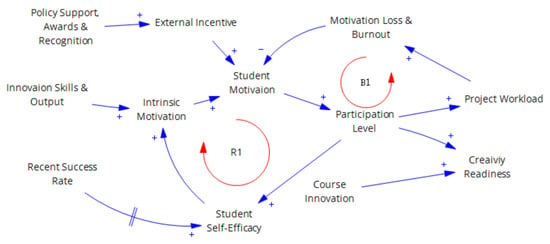
The Student Intrinsic System represents the psychological and capability-related conditions that sustain innovation activity. Its principal stocks are Student Motivation, Student Self-Efficacy, and Creativity Readiness. Participation, recent project success, practice quality, learning by doing, workload, and short-term incentive use change these states through reinforcing and balancing processes. Inputs from Policy Support enter as external incentives, while project outcomes return as delayed success information. This subsystem operationalizes the student side of the capability–capacity alignment problem without treating innovation capability as one directly measured stock.
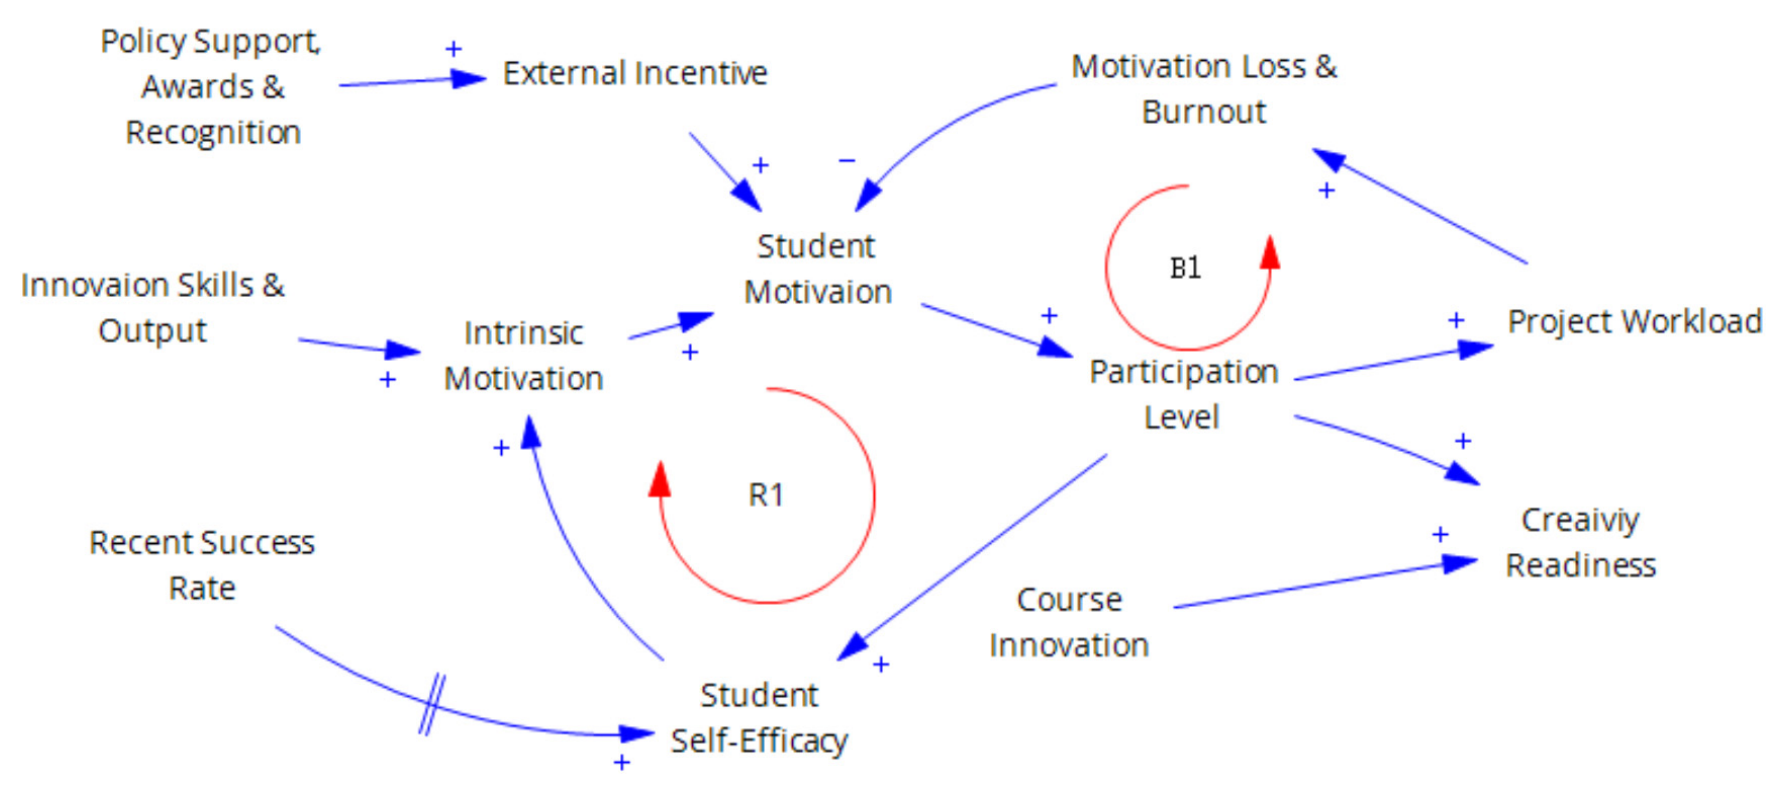
The central reinforcing loop (R1) is Student Motivation → Participation Level → Self-Efficacy Gain → Student Self-Efficacy → Intrinsic Gain → Student Motivation. Participation and successful experience can therefore strengthen continued engagement. Two balancing influences limit this growth: workload raises Motivation Loss, and reliance on short-term incentives increases Short-Term Burnout. Figure 2 is an explanatory causal-loop view; the complete executable stock–flow specification is documented separately in the supplementary model diagrams and equation tables.
Figure 2.
Explanatory feedback structure of the Student Intrinsic System.
3.4. Campus Resources System
The Campus Resources System represents the institutional capacity available to support student innovation. Its principal stocks are Campus Resources and Mentor Pool. Resource Investment, Mentor Recruitment, external grants, and partner-provided mentors add capacity; Resource Consumption, Resource Depreciation, and Mentor Attrition reduce it. Incubator Capacity and Practice Quality depend on available resources and mentors. As Projects approach or exceed Incubator Capacity, the Capacity-Adjusted Resource-Use Factor reduces effective resource use per project, but total resource demand can still rise because more projects consume resources. This creates a balancing capacity–pressure mechanism. The mechanism is hown in Figure 3.
Figure 3.
Explanatory capacity–pressure structure of the Campus Resources System.
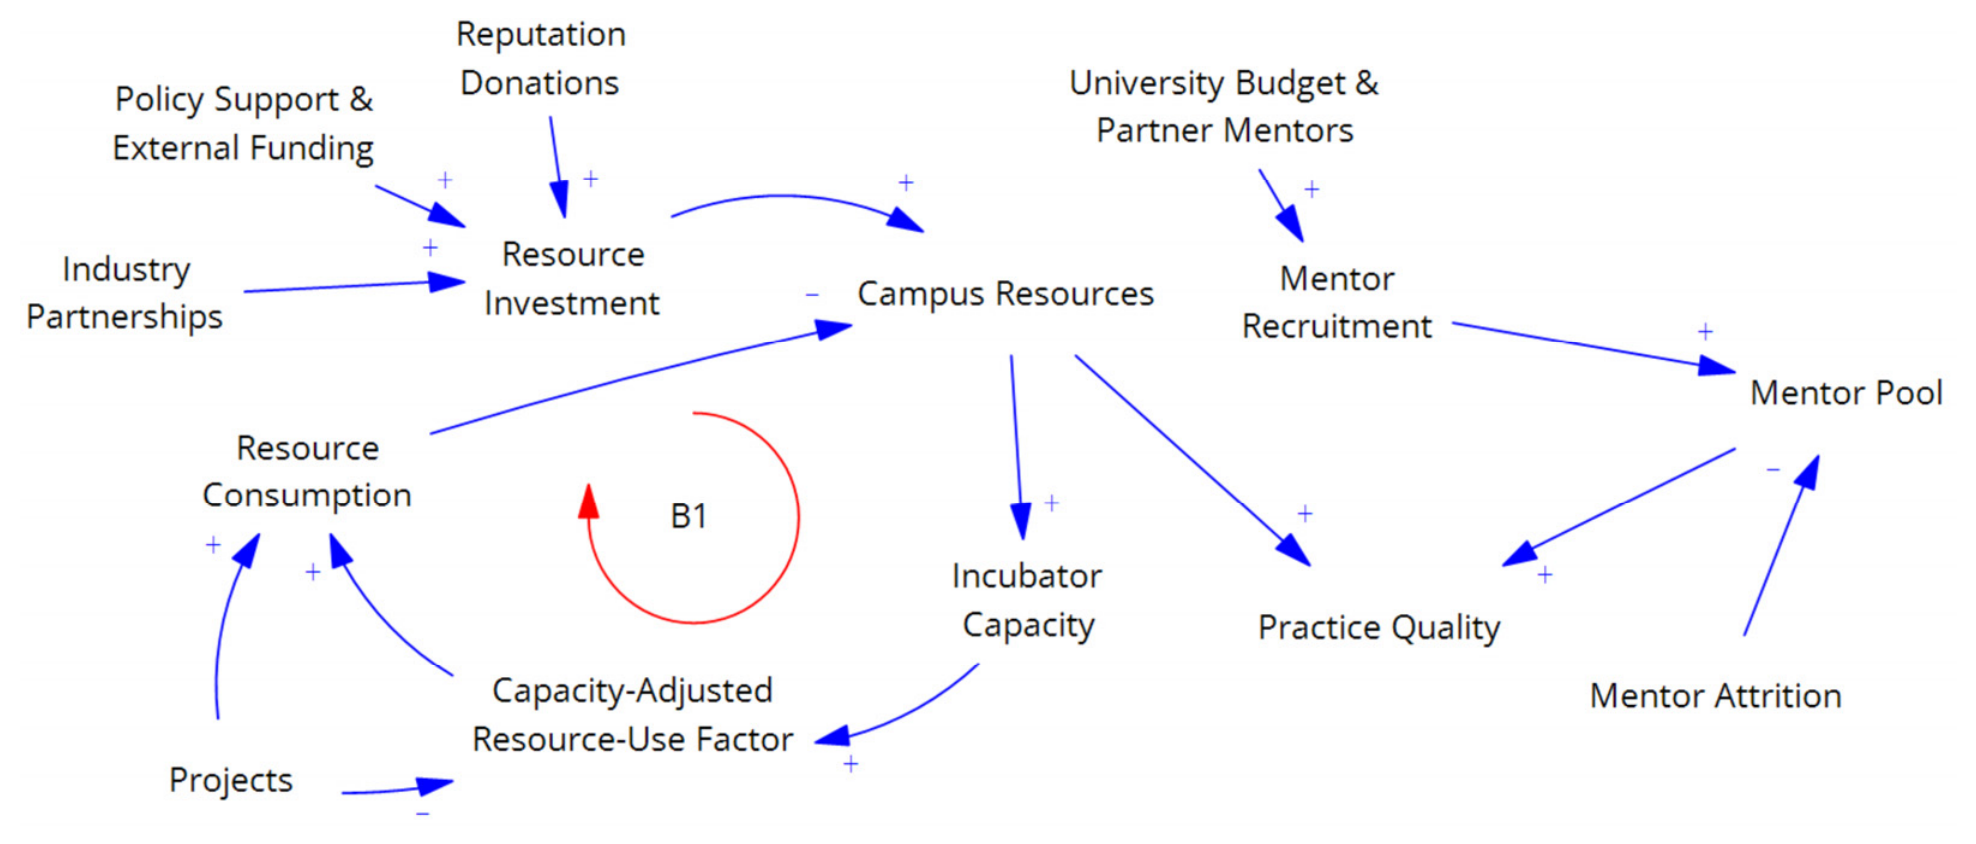
The principal capacity–pressure loop (B1) is Campus Resources (+) → Incubator Capacity (+) → Capacity-Adjusted Resource-Use Factor (+) → Resource Consumption (−) → Campus Resources. More projects directly increase Resource Consumption and also reduce the Capacity-Adjusted Resource-Use Factor as congestion rises. Resource Investment replenishes Campus Resources, but policy-to-resource conversion and recruitment delays can cause capacity to lag behind project demand.
3.5. Social Policy System
The Social Policy System represents the accumulation, allocation, and gradual decline of effective public and university support for student innovation. Policy Support is a normalized stock index, not a monetary amount or a count of policy documents. It captures implemented measures such as project funding and subsidies, participation incentives, investment in mentors and innovation facilities, support for incubation platforms, and programs facilitating university–industry collaboration. Policy Investment increases the stock, whereas Policy Decay represents policy expiration, reduced implementation intensity, or declining effectiveness. The system is shown in Figure 4.
Figure 4.
Explanatory policy-accumulation and allocation structure.
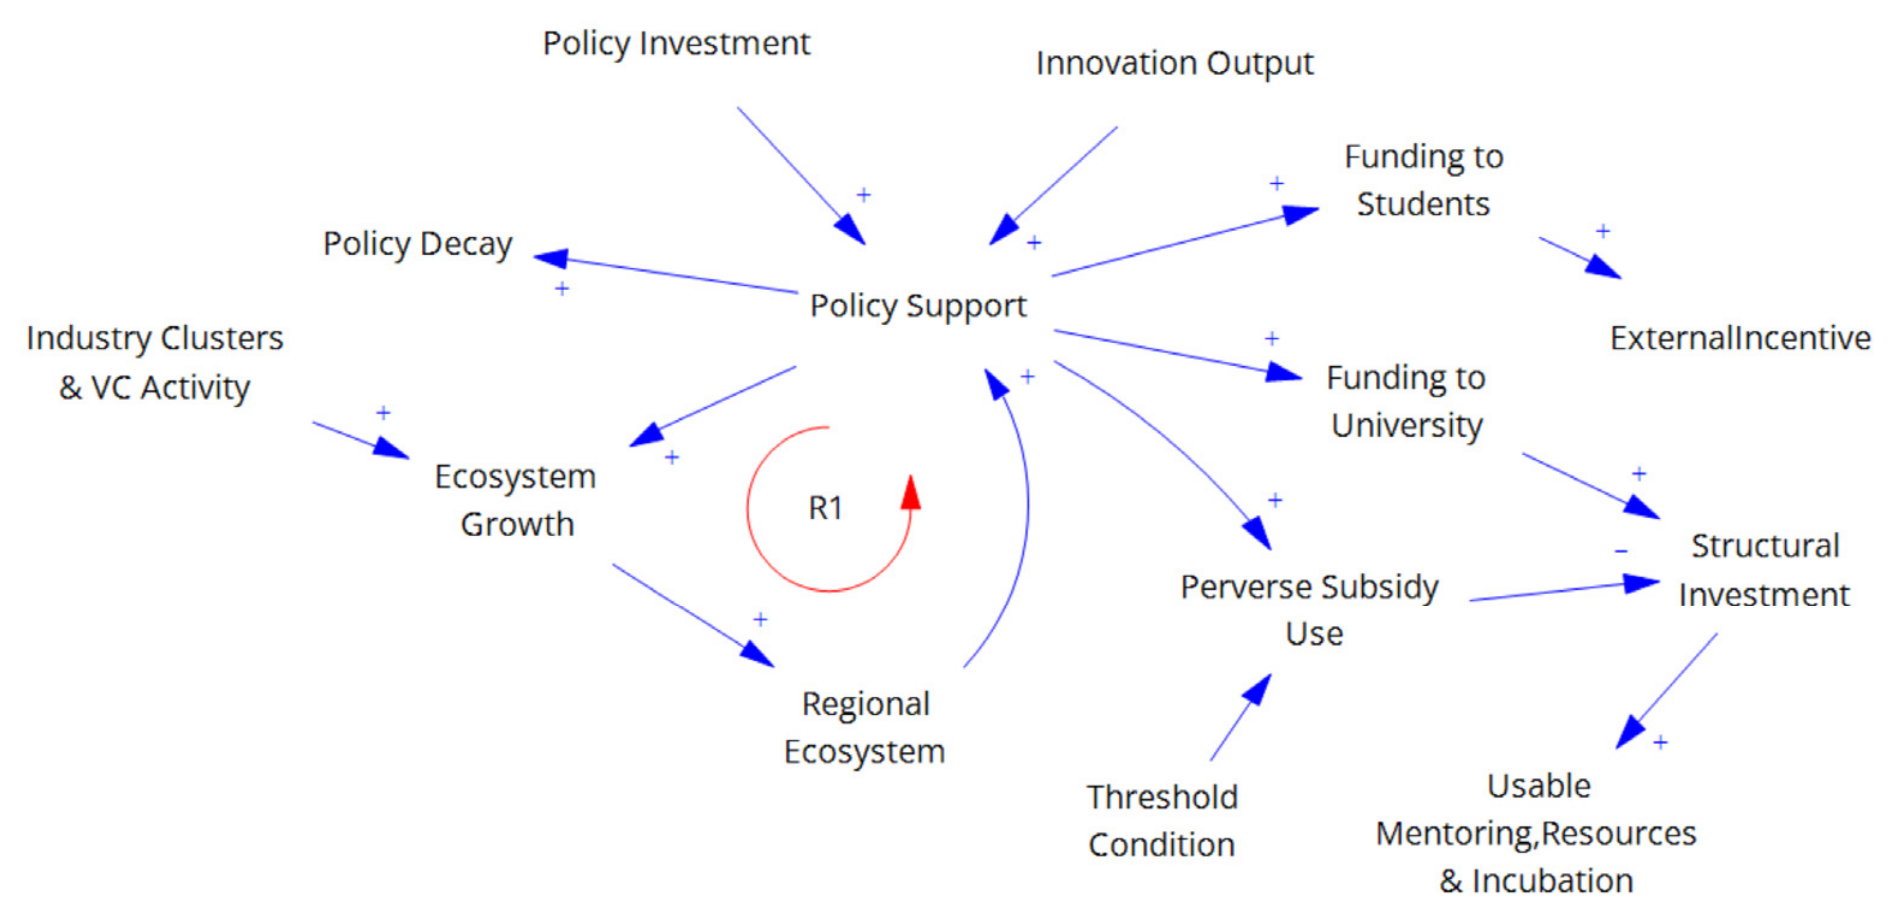
Policy Support increases through Policy Investment and decreases through Policy Decay. Innovation Output and the Regional Ecosystem can strengthen the conditions for further investment, creating a reinforcing policy–ecosystem process. Allocation then separates a direct student-incentive route from a delayed university capacity-building route. Industry Partnerships are treated as a complementary external source of resources and mentors rather than as an automatic consequence of Policy Support.
3.6. Process Outcomes System
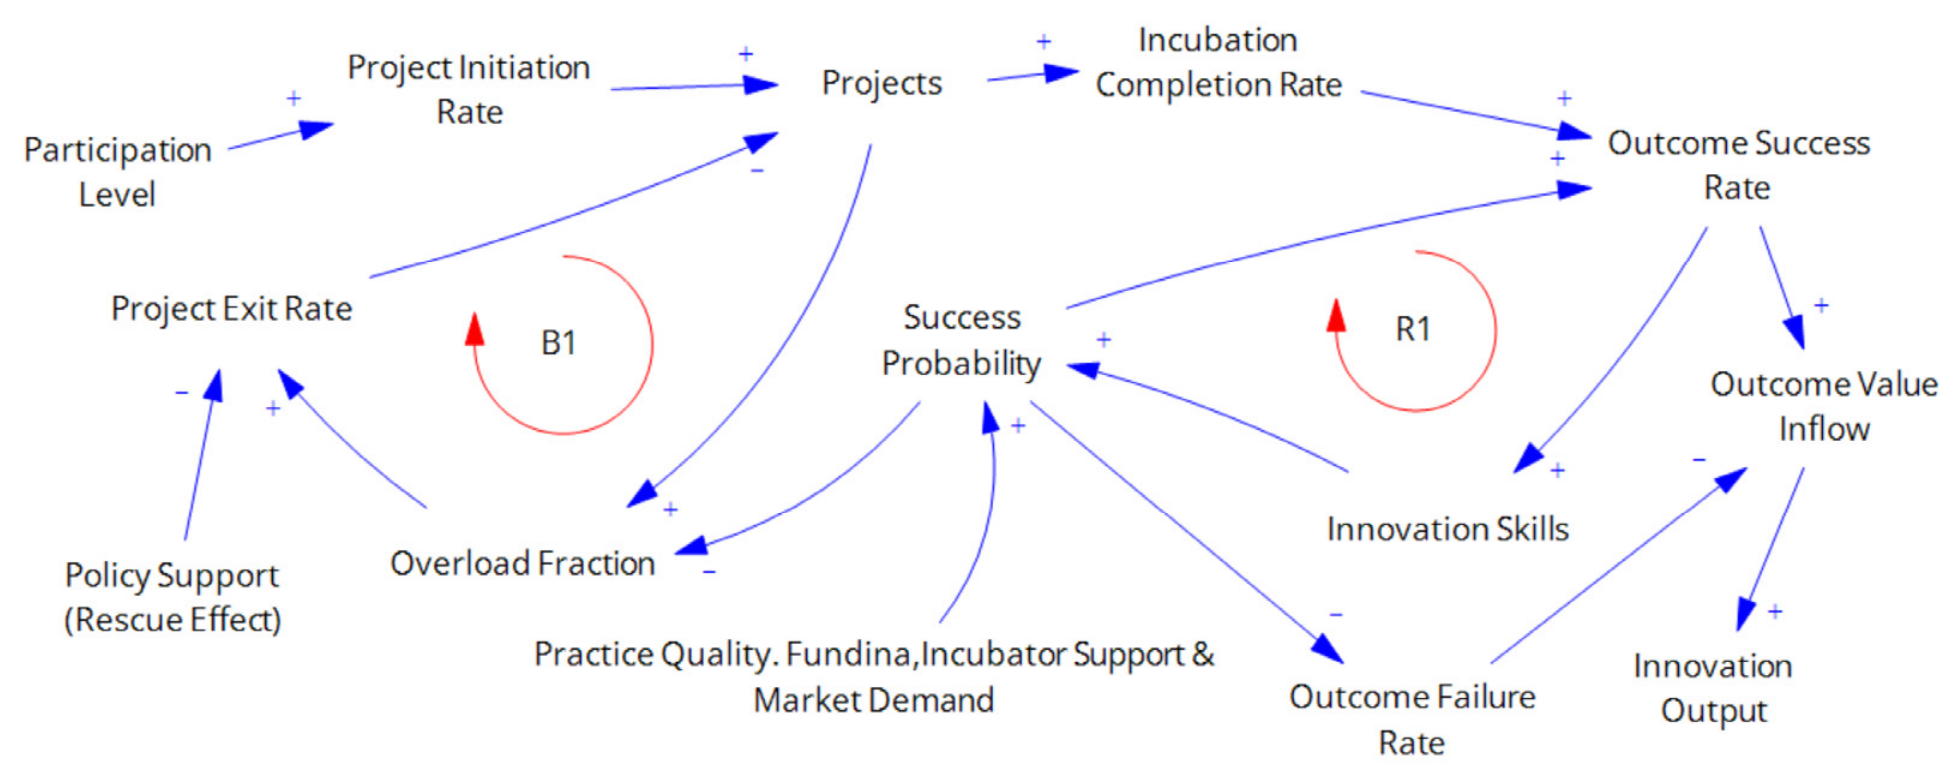
The Process Outcomes System converts participation and institutional support into project progression and innovation outcomes. Project Initiation adds to the stock of active Projects, while baseline and overload-induced exits reduce it. Projects enter the incubation pipeline subject to Incubator Capacity, and completed projects generate success or failure flows according to Success Probability. Successful and failed experience changes Innovation Skills and Entrepreneurial Experience, while net outcome value accumulates in Innovation Output. Feedback from outcomes to motivation, self-efficacy, and policy support links this subsystem to the other three.The system is shown in Figure 5.
Figure 5.
Explanatory project-flow and outcome-feedback structure.
3.7. Unified System and Feedback Loops
The unified model connects the four subsystems through three cross-system mechanisms. The signs below indicate the direction of change, and R and B identify reinforcing and balancing feedback. These textual definitions provide an auditable interpretation of the model; the revised explanatory figures should show the same structure graphically.
R1—Participation and self-efficacy: Student Motivation (+) → Participation Level (+) → Self-Efficacy Gain (+) → Student Self-Efficacy (+) → Intrinsic Gain (+) → Student Motivation. This loop describes how participation and mastery experience can reinforce continued engagement.
R2—Learning, outcomes, and support: Participation Level (+) → Skill Gain (+) → Innovation Skills (+) → Success Probability (+) → Outcome Success Rate (+) → Innovation Output (+) → Policy Investment (+) → Policy Support (+) → External Incentive (+) → Student Motivation (+) → Participation Level. This reinforcing process links student learning to outcomes and implemented support.
B1—Capacity pressure: Projects (+) → Resource Consumption (−) → Campus Resources (+) → Incubator Capacity (−) → Overload Fraction (+) → Overload-Induced Exit (−) → Projects. As activity approaches institutional capacity, resource use and overload restrain further project accumulation. The exact signs are interpreted along each causal link; the overall loop is balancing.
B2—Workload and burnout: Participation Level (+) → Workload (+) → Motivation Loss (−) → Student Motivation (+) → Participation Level. Short-Term Incentive Use also increases Short-Term Burnout, which reduces Student Motivation. These balancing effects explain why strong participation incentives may yield temporary rather than sustained gains.
The behavior of the full system depends on the relative strength and timing of these mechanisms. Reinforcing processes can build motivation, skills, output, and support, but capacity constraints and implementation delays can shift dominance toward balancing processes. This transition is central to RQ1 and RQ2 and motivates the policy experiments reported in Section 4.
The selected equations and notation are listed in Table 1; the complete variable dictionary, units, values, and estimation procedures are provided in Supplementary Tables S1 and S2.
3.8. Model Documentation and Reproducibility
Model documentation follows the principles that readers should be able to identify the model boundary, reproduce the equations and experiments, distinguish empirical inputs from assumptions, and connect reported results to the executable structure [33,34,35]. Supplementary Table S1 lists key parameters and initial stock values with definitions, units, values, sources, and estimation procedures; Supplementary Table S2 provides the complete variable dictionary and dimensional role.
The main-text figures serve an explanatory purpose and therefore show only the feedback structure required for the corresponding argument. They should not be interpreted as complete executable-model maps.
All simulations use months as the basic time unit. Count variables are measured in projects or mentors, normalized constructs use index points, and stock-changing flows use the corresponding stock unit per month. Dimensionless ratios and probabilities are explicitly bounded where appropriate. Fixed delays represent implementation or information lags rather than additional empirical observations. Model boundary choices, empirical coverage, and unresolved parameter uncertainty are reported so that replication does not imply unwarranted certainty.
Table 2 gives the basis for the main model components and parameter groups. Observable quantities are drawn from institutional records for 2023–2025. Theory and stock–flow logic determine the structural relationships. Unobserved coefficients, thresholds, and delays are constrained to plausible ranges and examined through calibration, sensitivity analysis, structural checks, and extreme-condition tests.
Table 2.
Basis for model components and parameter specification.
3.9. Model Calibration and Validation
Calibration and evaluation used institutional records collected between 2023 and 2025.
The records cover a defined cohort of innovation and entrepreneurship training projects administered by one college at a single university. After removing duplicates, entries without key identifiers, and records with inconsistent status or outcome information, the dataset comprised approximately 380 participating students and 100 eligible projects.
Projects are the primary record unit and are linked to participating students. The available fields include anonymized project and student identifiers, project category, approval and completion dates, team membership, completion status, and recorded outcomes. Approximately 70 projects from 2023–2024 were used for calibration, while about 30 projects from 2025 were reserved for validation. The dataset is shown in Table 3.
Monthly aggregation of the project records produced 24 calibration observations and 12 validation observations. Projects is the active project stock in a given month, and observed Success Probability is the proportion of assessed projects that met the stated success criterion. Student records inform participation-related indicators but are not treated as independent time-series observations. Because demographic subgroup data were unavailable, the model does not estimate differences by gender, major, or year of study. The 36-month empirical window is separate from the 240-month counterfactual simulation horizon.
Table 3.
Structure and analytical role of the empirical dataset.
Calibration and validation draw on different periods from the same institutional data system. Parameters were initialized from the literature, observed records, and institutionally plausible ranges, then adjusted against the 2023–2024 series to reproduce the main behavior of Projects and Success Probability. The 2025 observations were withheld for evaluation. Fitting emphasized trajectory shape and magnitude rather than the minimization of every pointwise error. The validaion is hon in Table 4.
Table 4.
Pointwise relative errors between observed and simulated values.
Pointwise errors offer an initial check but do not describe fit across the complete series. We also report root mean square error (RMSE), mean absolute percentage error (MAPE), and Theil’s inequality coefficient in Table 5.
Table 5.
Historical-fit validation results.
All three statistics show close agreement for Projects. MAPE is higher for Success Probability, but RMSE and Theil’s coefficient remain small because the variable is a ratio.
Quantitative fit is assessed only for Projects and Success Probability, the two variables with consistent longitudinal records. RMSE, MAPE, and Theil’s coefficient therefore cannot validate every stock, flow, auxiliary variable, or internal mechanism. Variables without longitudinal observations were assessed through structural verification, dimensional checks, extreme-condition tests, sensitivity analysis, and comparison with theoretically expected behavior. These procedures examine internal consistency and behavioral plausibility but cannot replace variable-level empirical validation.
Structural checks examined causal signs, stock–flow consistency, dimensional logic, bounds, capacity constraints, and delays. Extreme-condition tests assessed whether the model stayed bounded and moved in theoretically plausible directions near the limits of its operating range. The results is show in Table 6.
Table 6.
Extreme-condition validation tests.
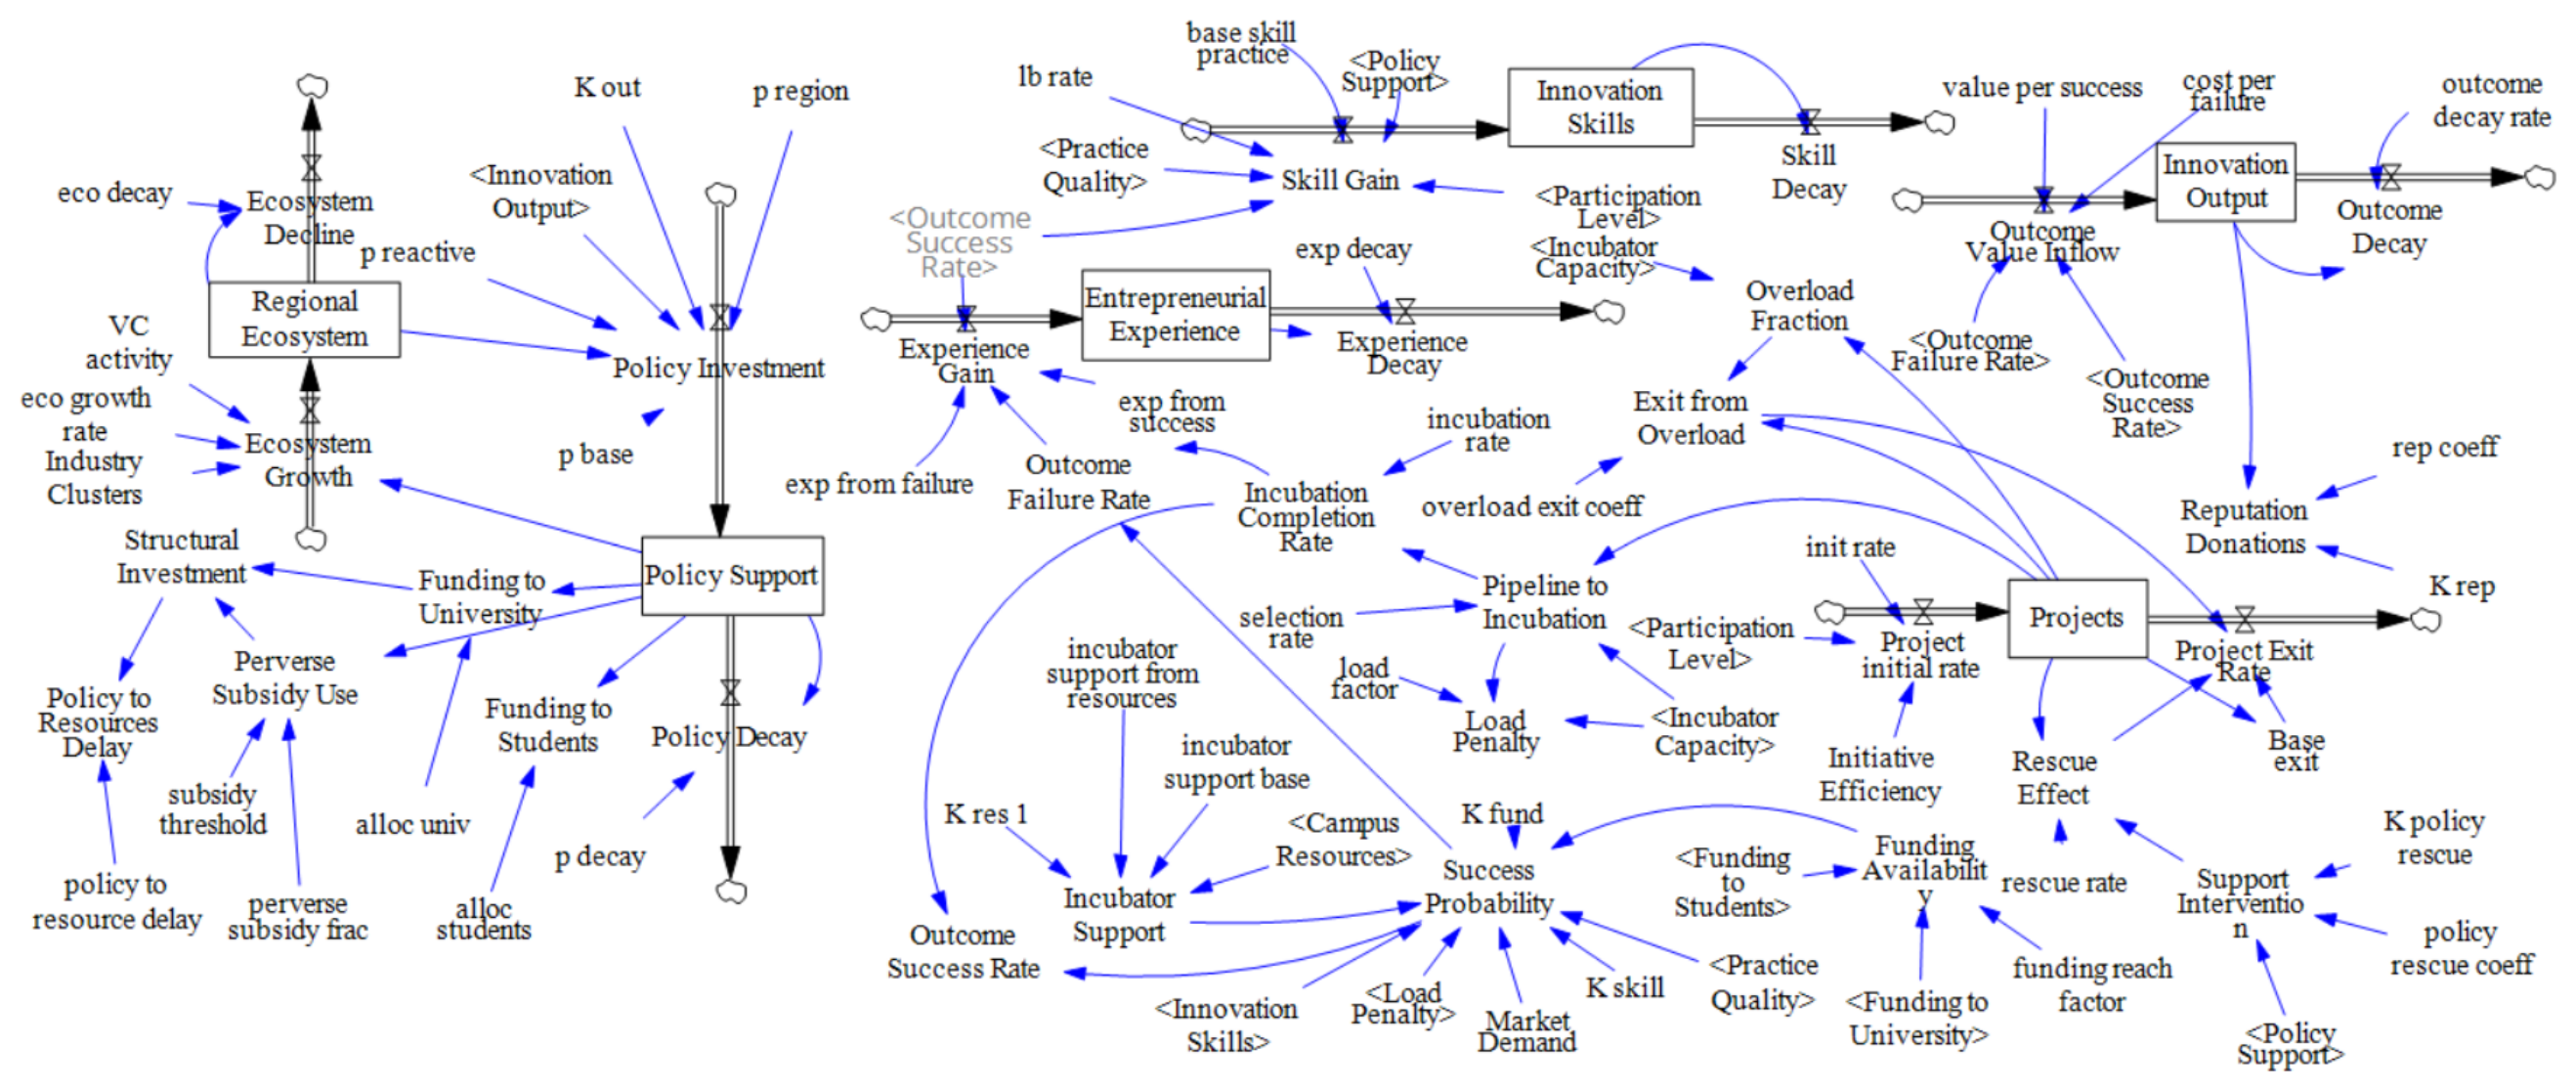
The model remained bounded in every test and responded in the expected direction. Its historical fit, structural consistency, extreme-condition behavior, and the sensitivity results in Section 5.1.1 provide the basis for comparative scenario experiments. The model is shown in Figure 6 and Figure 7.
Figure 6.
Unified system dynamics model: Part I.
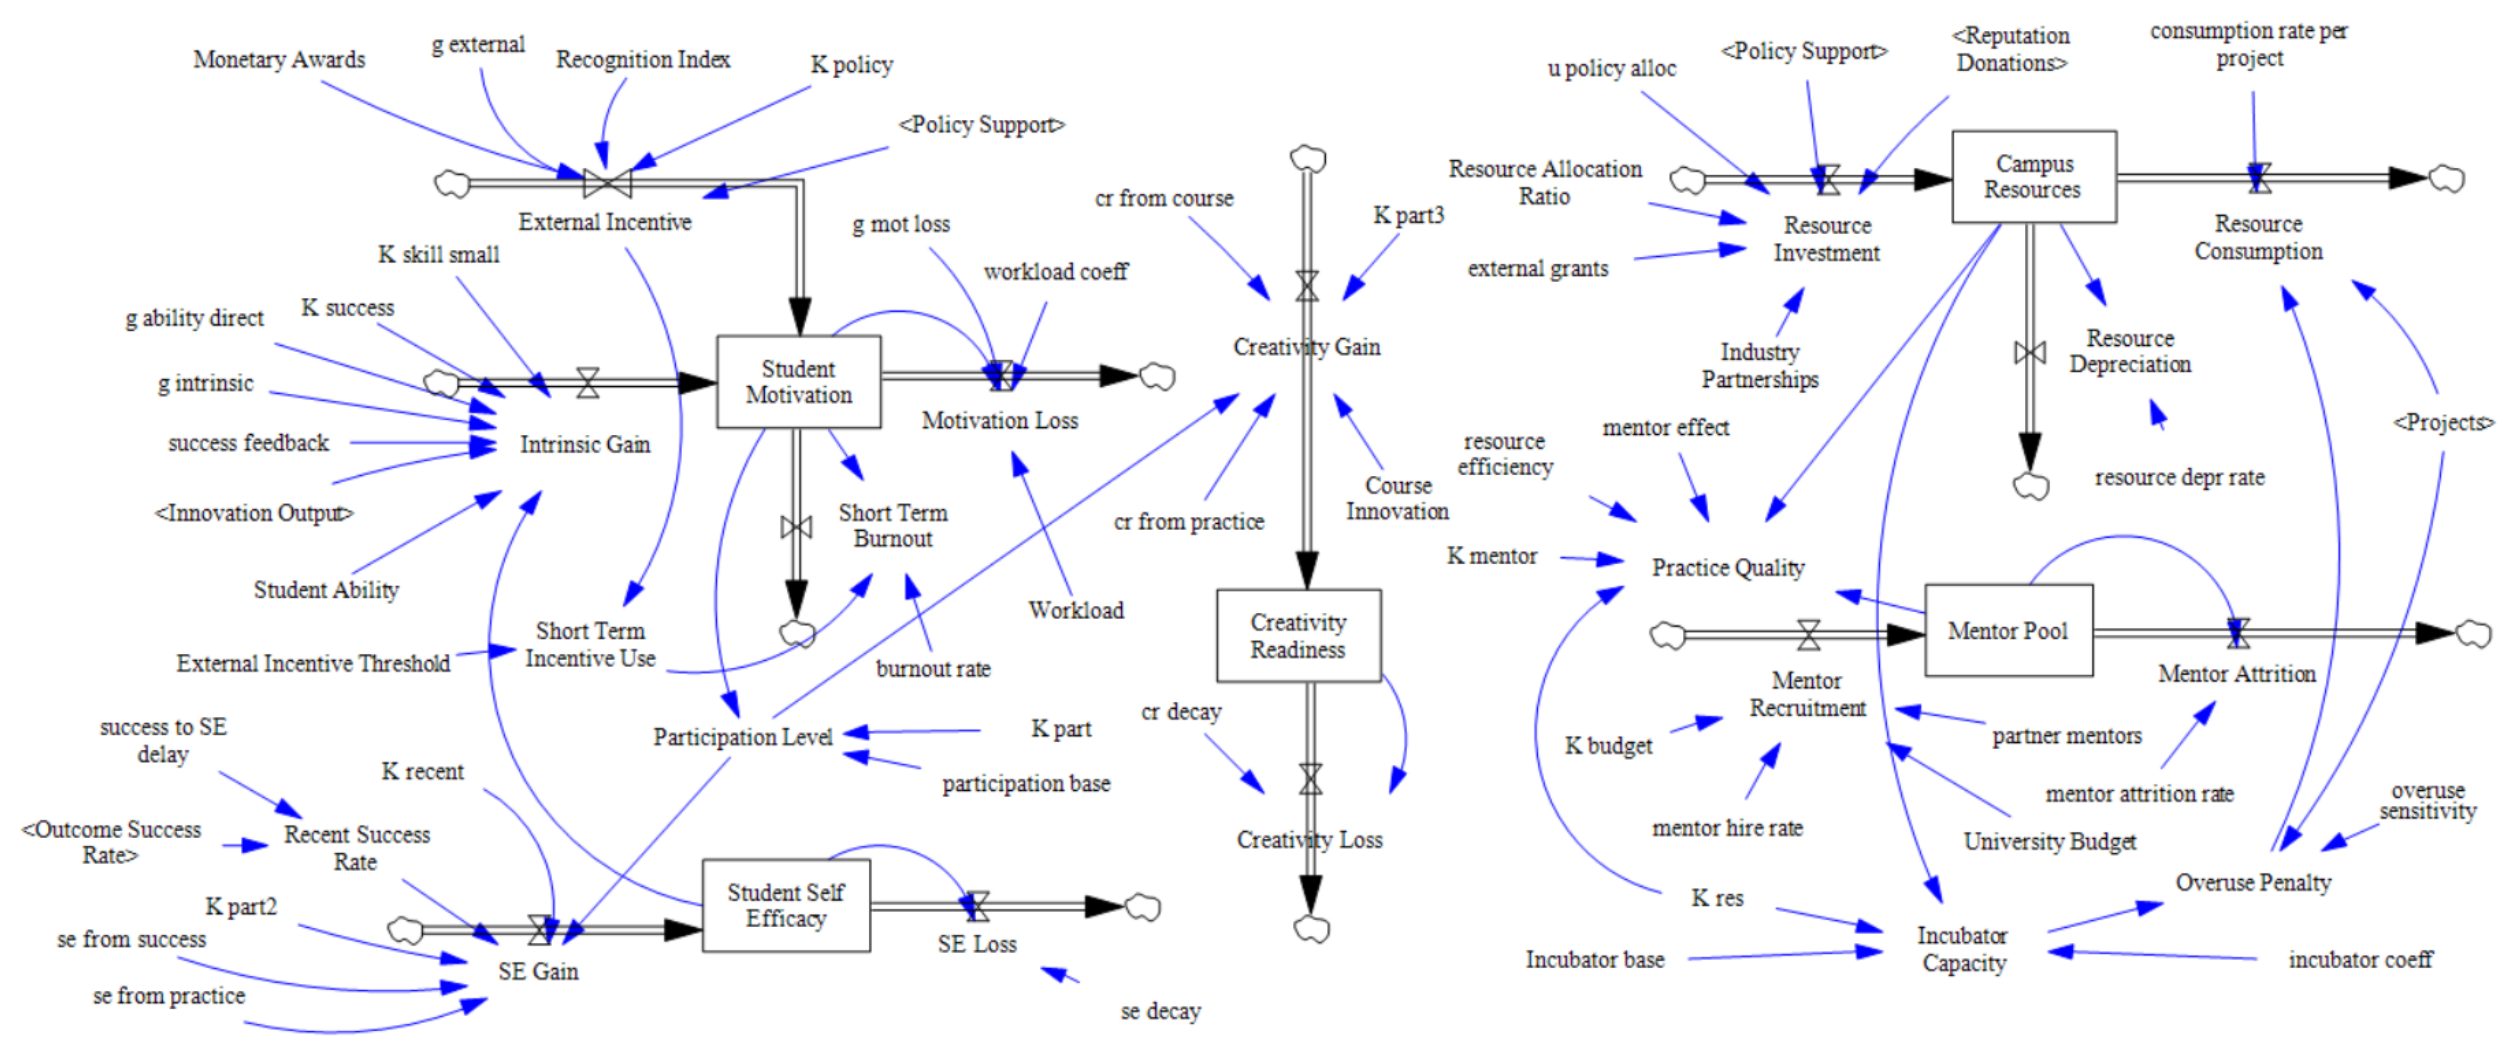
Figure 7.
Unified system dynamics model: Part II.
4. Simulation Design and Results
4.1. Baseline Simulation Results
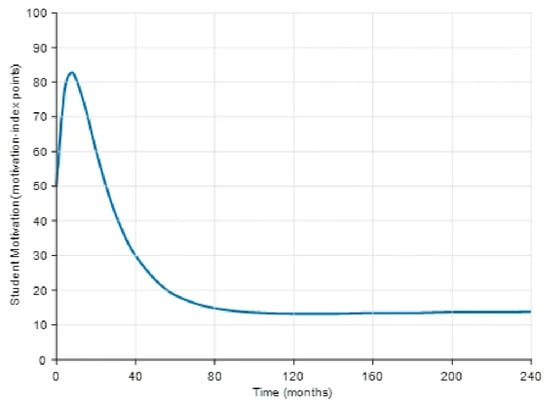
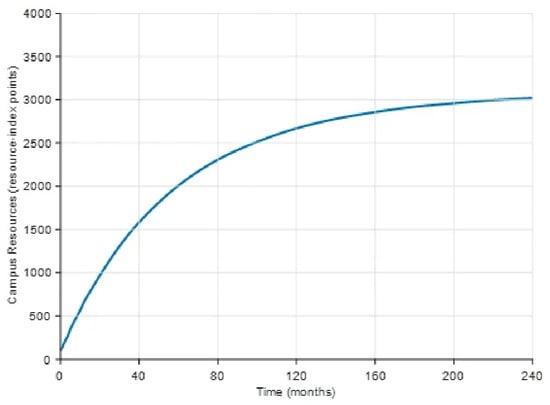
The baseline is simulated for 240 months at a 0.5-month time step. Figure 8, Figure 9, Figure 10, Figure 11, Figure 12 and Figure 13 show the main state and outcome trajectories.
Figure 8.
Baseline trajectory of Student Motivation.
Figure 9.
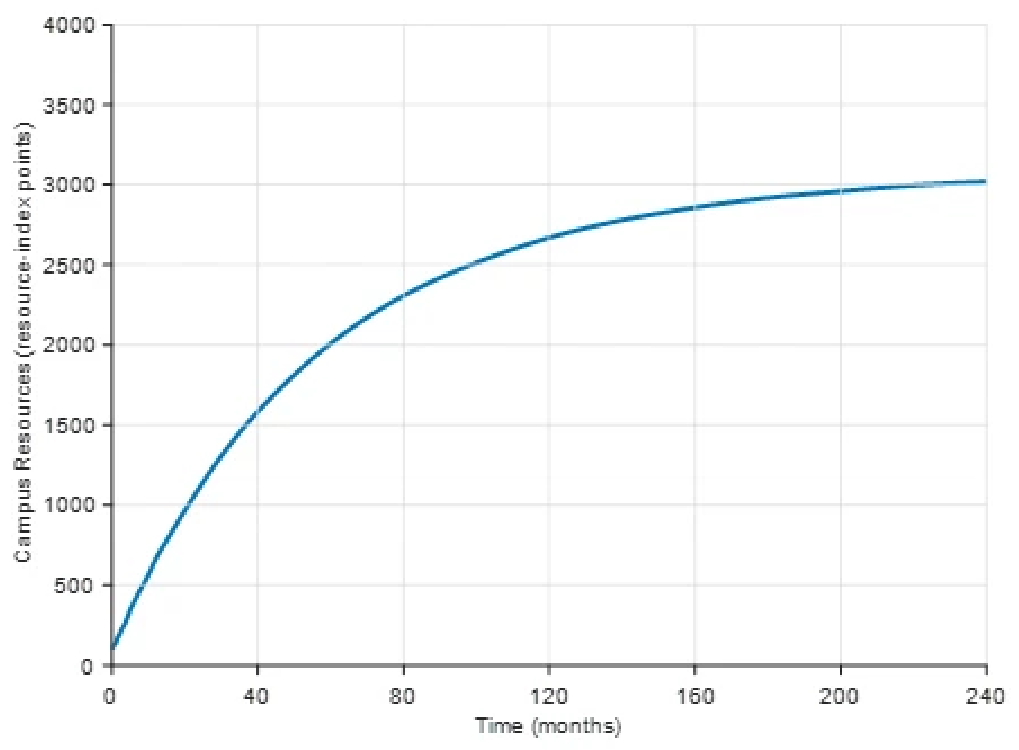
Baseline trajectory of Campus Resources.
Figure 10.
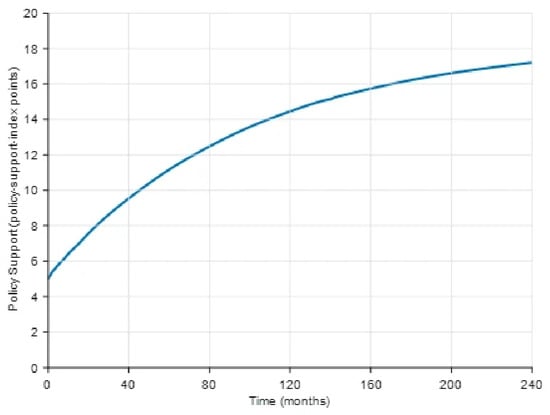
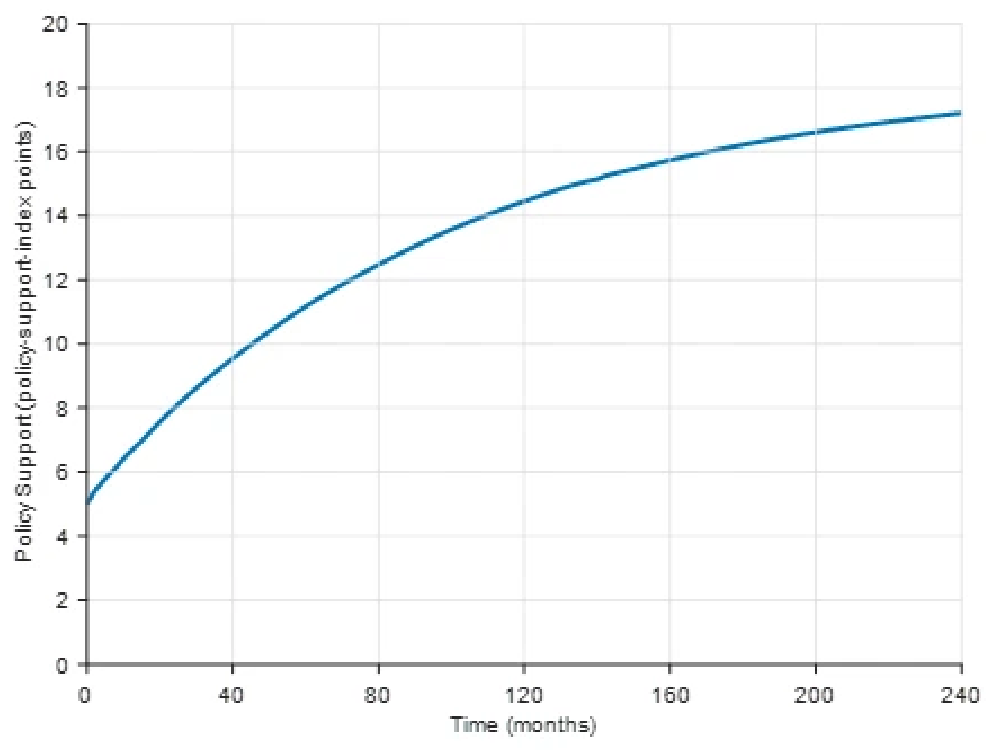
Baseline trajectory of Policy Support.
Figure 11.
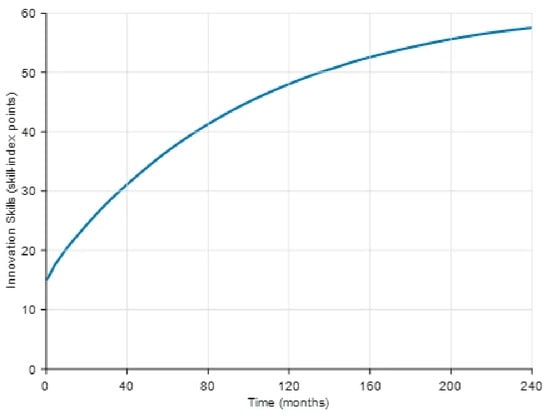
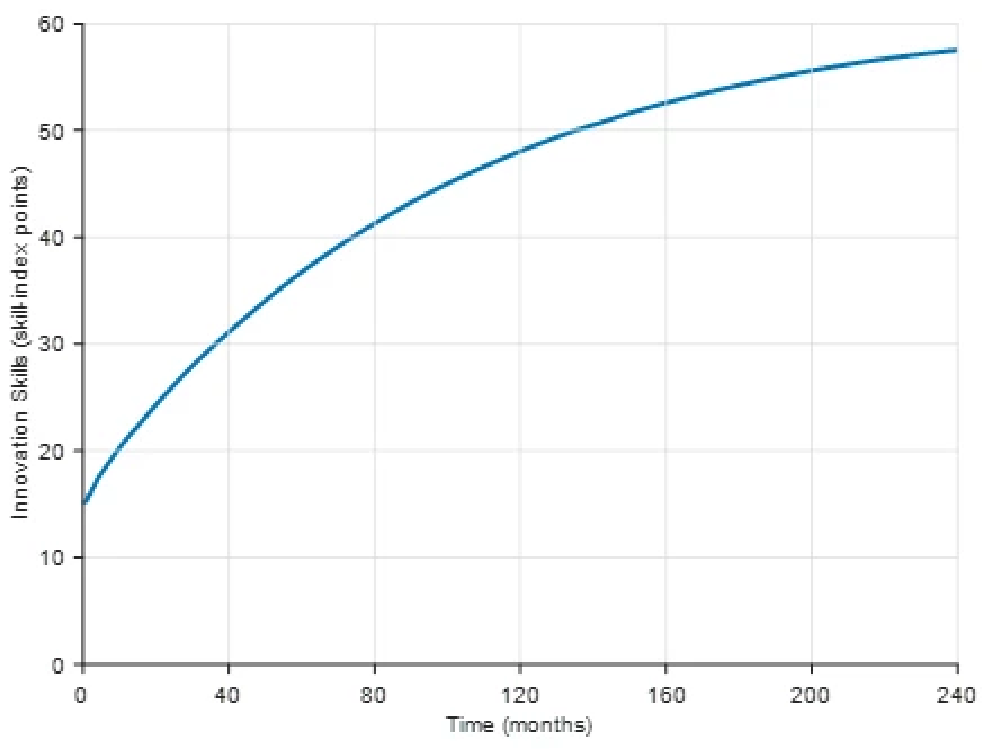
Baseline trajectory of Innovation Skills.
Figure 12.
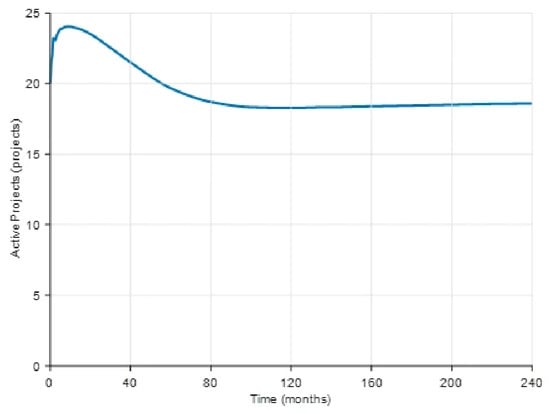
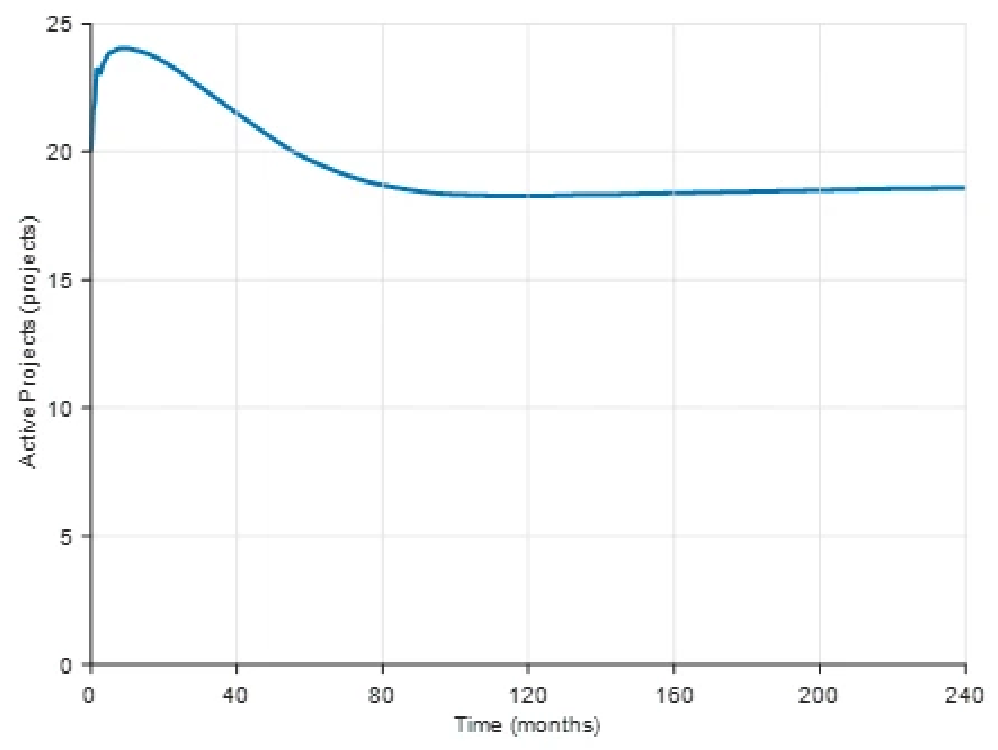
Baseline trajectory of Projects.
Figure 13.
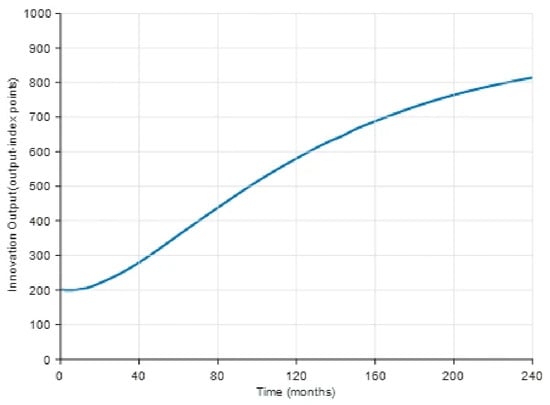
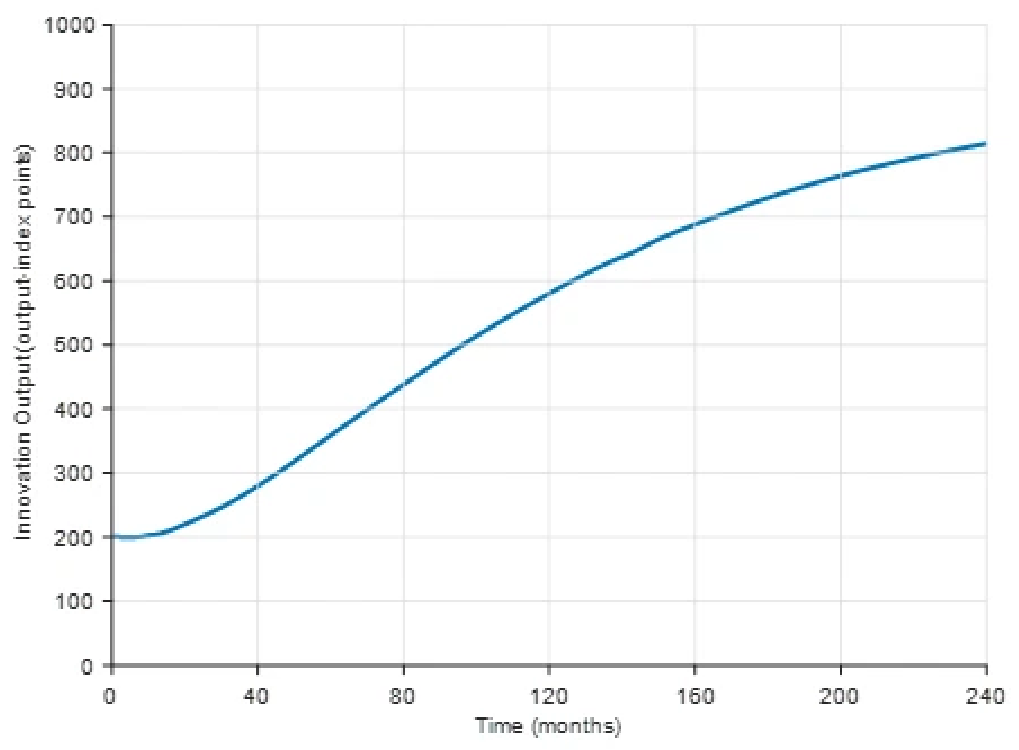
Baseline trajectory of Innovation Output.
Student Motivation increases quickly, reaches an early peak, and later settles below its initial level (Figure 8). Incentives, recognition, expected benefits, and early success drive the initial rise. As participation expands, workload, burnout, resource pressure, and weaker project experiences activate balancing feedback. Since motivation is an aggregate stock, the curve may also reflect a ceiling effect or a shift in the balance between intrinsic and extrinsic motivation. Incentives may therefore need to be combined with workload management and support for competence and intrinsic engagement.
Campus Resources grow throughout the simulation, although accumulation gradually slows (Figure 9). Investment initially exceeds consumption and depreciation. As both the resource stock and project volume increase, outflows rise and the net inflow narrows. The plateau represents the baseline equilibrium rather than a fixed maximum. Maintenance, allocation efficiency, mentor supply, and congestion control are as relevant as additional expenditure.
Policy Support increases rapidly before approaching equilibrium (Figure 10). Innovation Output and the Regional Ecosystem stimulate reactive investment, while decay and weaker performance signals restrain further growth. What matters in practice is not the level of support alone but its conversion into mentoring, infrastructure, incubation, and project opportunities.
Innovation Skills increase at a diminishing rate (Figure 11). Practice, successful outcomes, and learning by doing raise Skill Gain, while diminishing marginal gains and Skill Decay move the stock toward equilibrium. Continued participation may therefore need to be supported by updated knowledge, mentoring, interdisciplinary work, and increasingly demanding tasks.
Projects show a modest overshoot followed by damped adjustment (Figure 12). Motivation and participation initially increase project entry faster than exits. Resource use and incubation load subsequently rise, reducing effective throughput and increasing exits. The final level reflects the carrying capacity generated by the baseline combination of resources, mentoring, and policy support.
Innovation Output responds after a delay (Figure 13). Growth is initially limited while skills, experience, practice quality, and resources accumulate. Output then accelerates as these conditions raise success, before congestion, depreciation, and motivational pressure slow the increase. The trajectory points to an early emphasis on capability building, followed by capacity expansion and later attention to quality and efficiency.
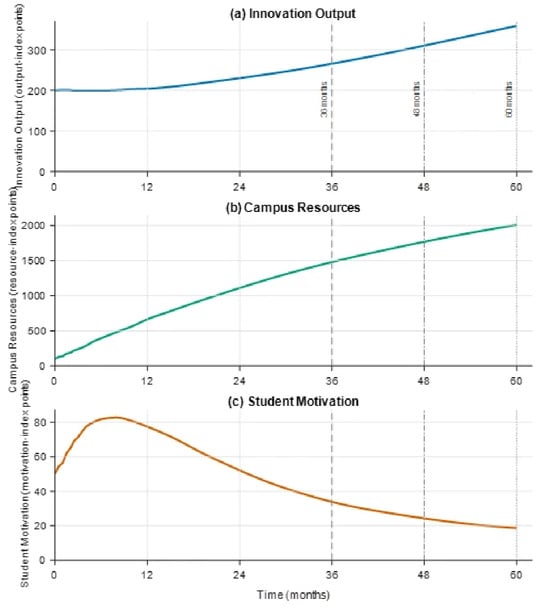
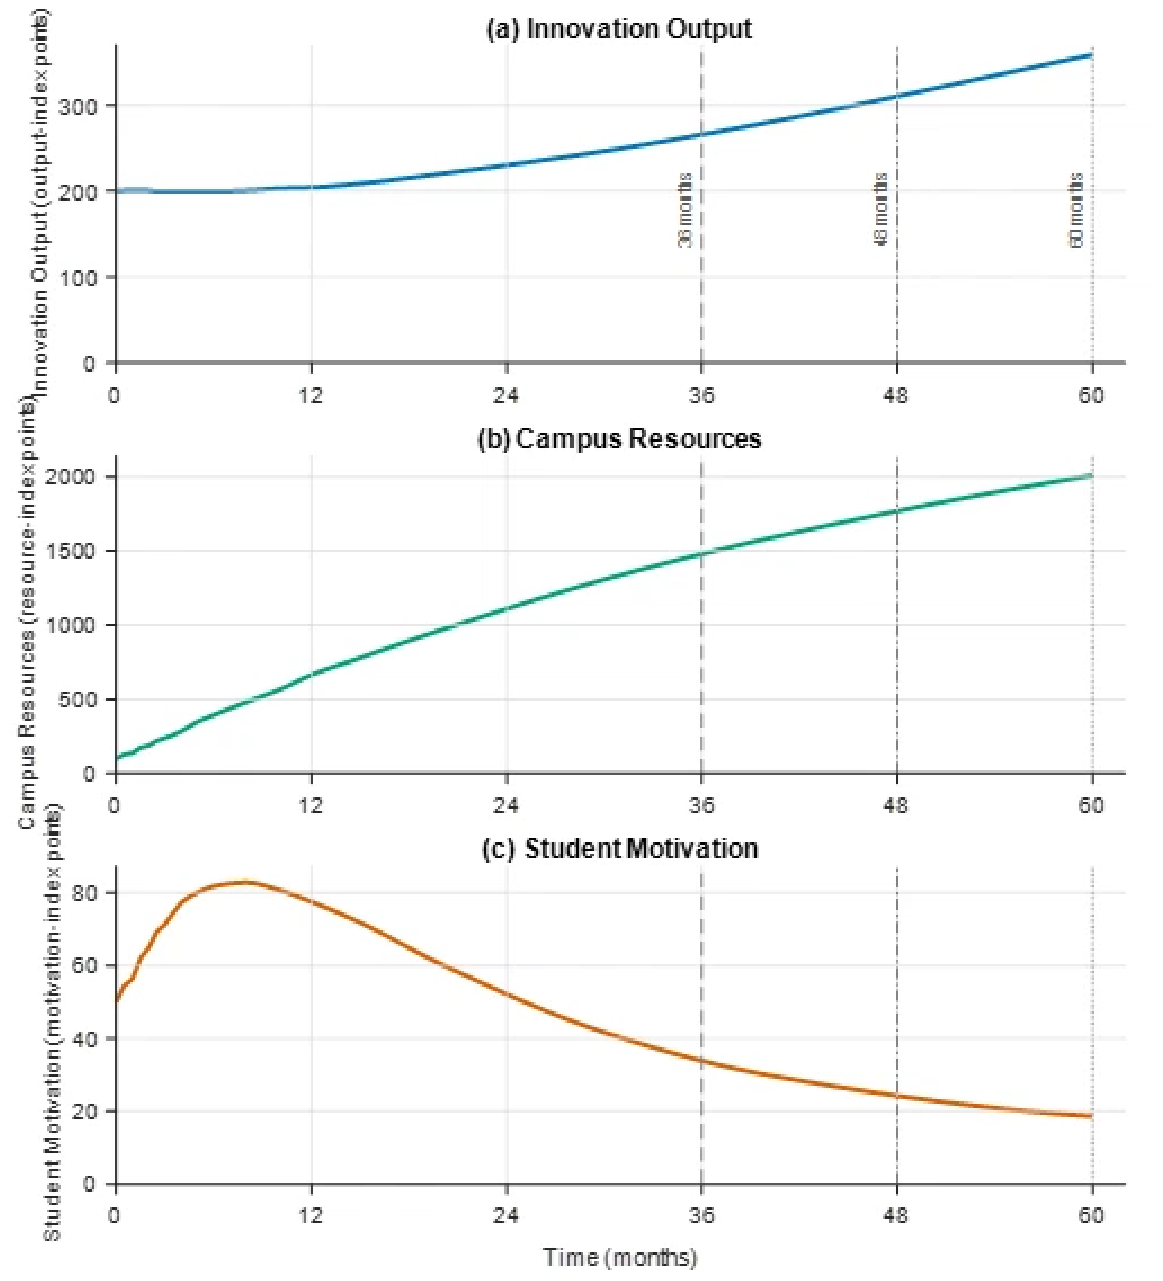
The 240-month horizon captures accumulated stocks and delayed feedback, but it represents a long-term counterfactual rather than a twenty-year forecast. Because university planning normally follows shorter cycles, Figure 14 also marks months 36, 48, and 60, corresponding to three-, four-, and five-year evaluation windows.
Figure 14.
Baseline trajectories during the first 60 months.
Innovation Output increases from approximately 266.1 at month 36 to 310.3 at month 48 and 358.4 at month 60. Campus Resources rise from about 1471.1 to 1768.8 and 2005.7. After its early peak, Student Motivation moves in the opposite direction, falling to roughly 34.0, 23.9, and 18.6 at the same points. Extending the short-cycle window captures more accumulated output and resources but also reveals a growing motivation problem.
AUC values are comparable only when calculated over the same horizon because raw AUC increases with window length. For operational planning, a university should recalculate the three objectives over its own 36-, 48-, or 60-month cycle and reconstruct the Pareto front. A scenario that is non-dominated over 240 months may not remain so within a shorter administrative cycle.
4.2. Scenario Analysis and Policy Basis
Scenarios S1–S4 are counterfactual policy experiments rather than estimates of implemented interventions. Each changes a set of levers that a university could plausibly adjust while other baseline conditions remain fixed. Table 7 relates these settings to their policy interpretation and analytical purpose.
Table 7.
Policy basis and interpretation of scenarios S1–S4.
The scenarios compare mechanisms, timing, and trade-offs. Their results are not causal effect estimates and may differ across institutions.
4.2.1. Sustaining Participation with Moderate Incentives and Burnout Controls
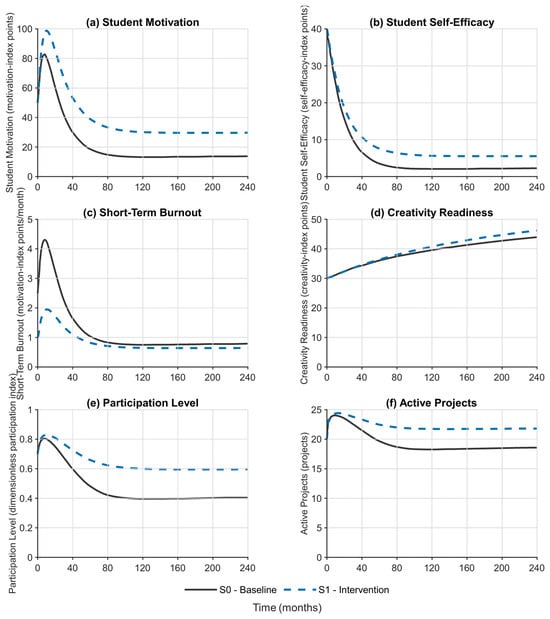
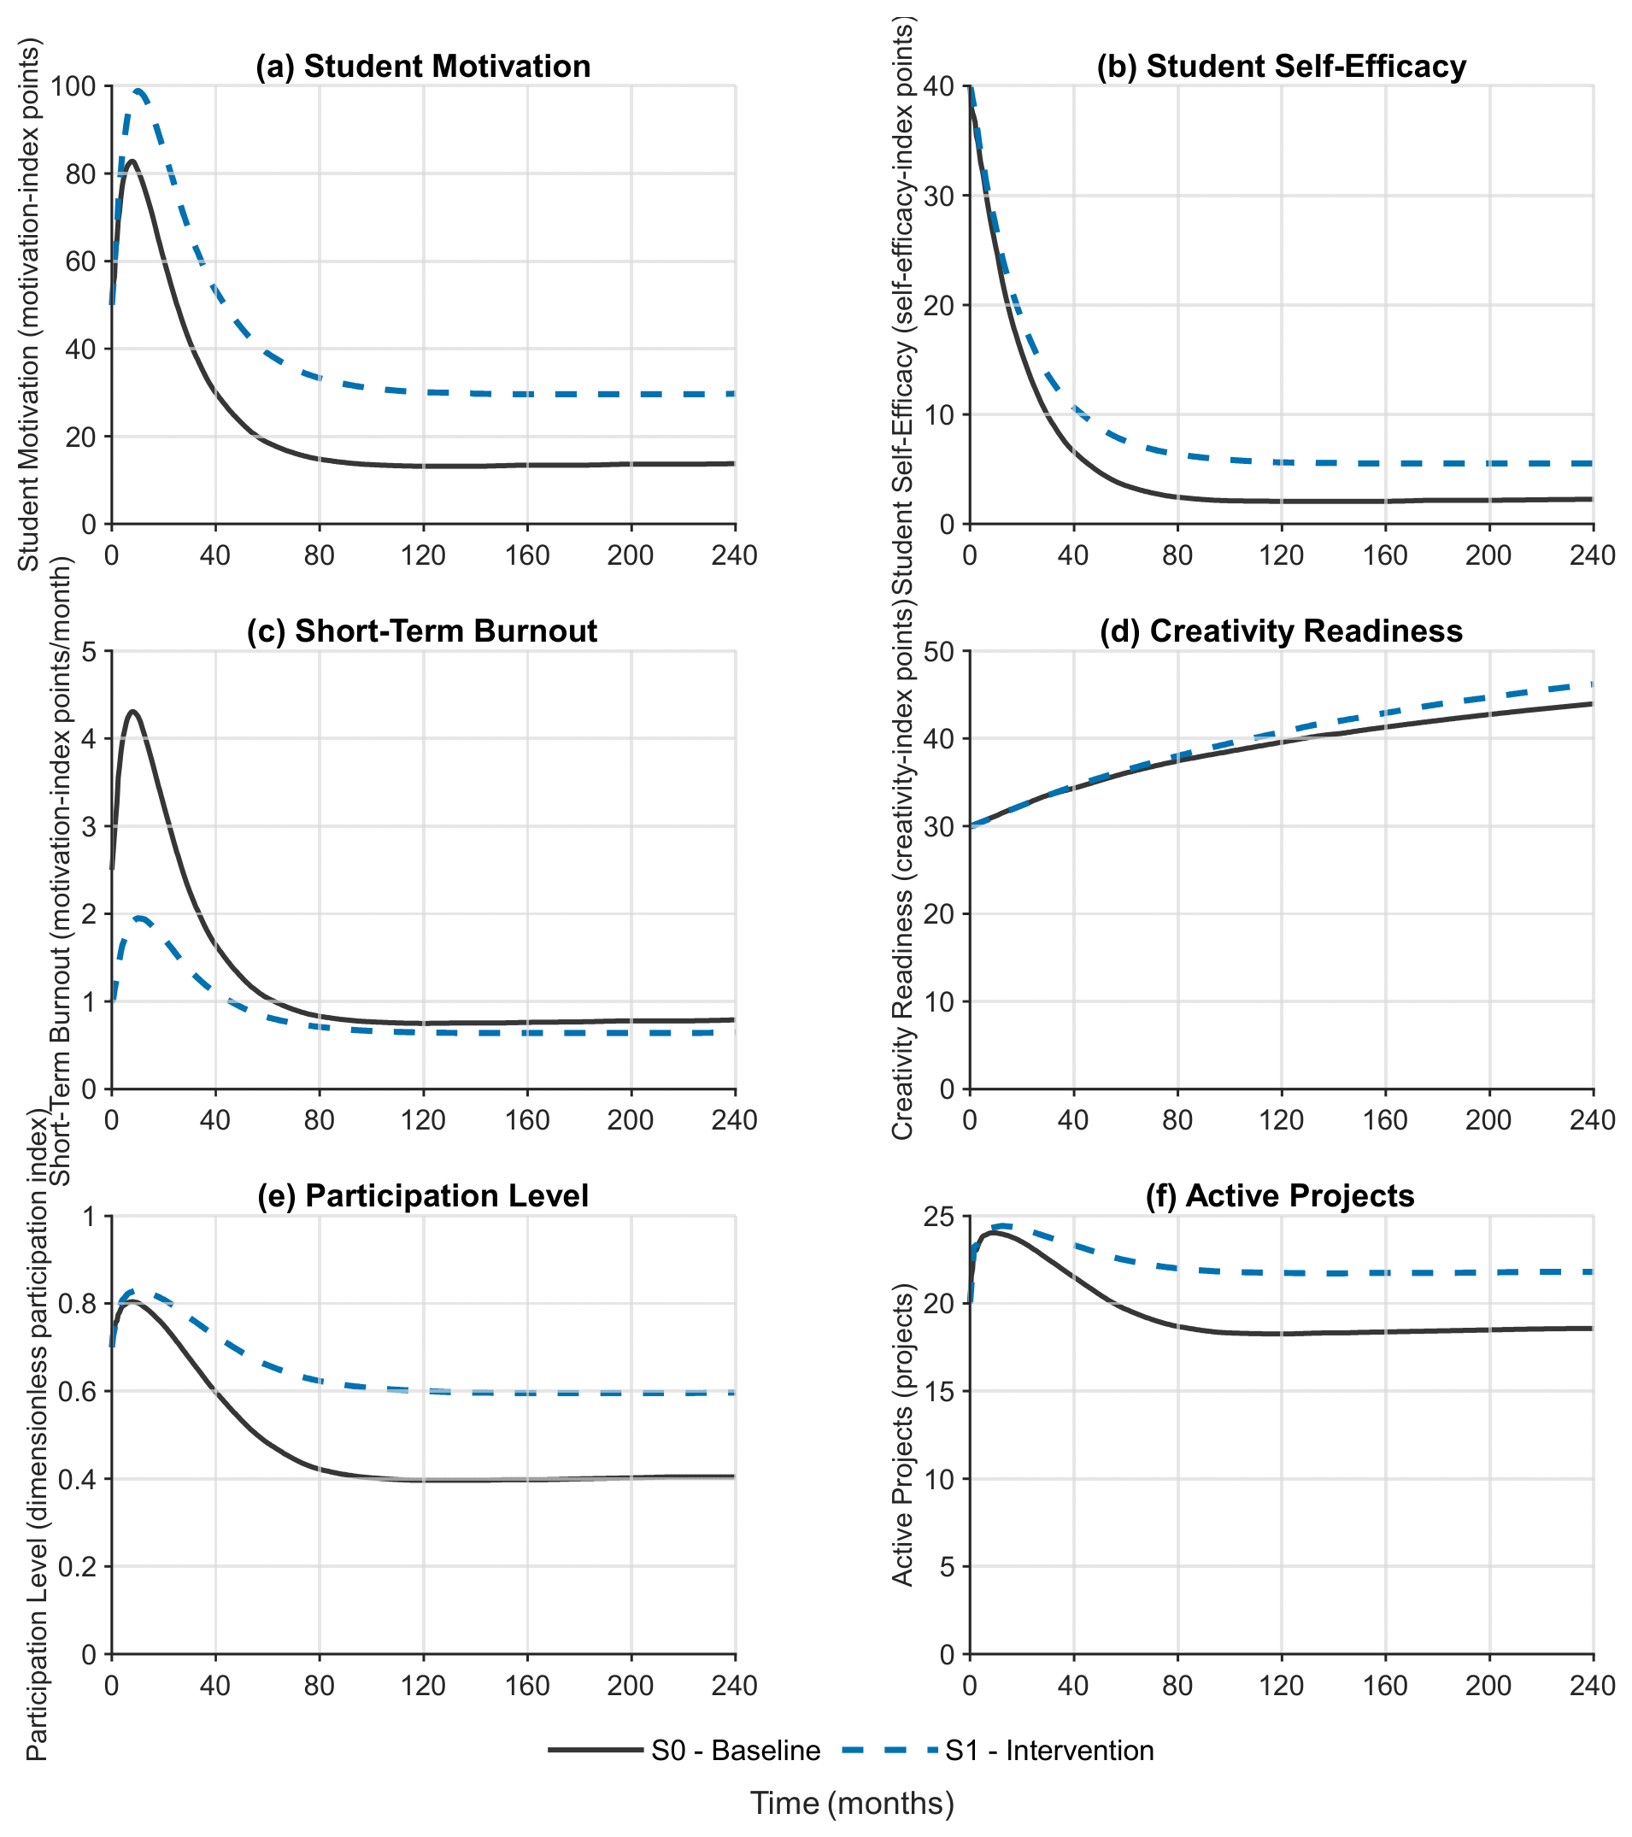
S1 examines whether moderate incentives combined with burnout control sustain participation more effectively than an intensive reward strategy. The external incentive coefficient is 0.18, the incentive threshold is 3, and the burnout rate is 0.07; all other parameters remain at baseline. Over 240 months, these settings are expected to lower the early burnout peak and support motivation, self-efficacy, participation, and projects before substantially affecting downstream outcomes. Figure 15 compares six indicators with S0.
Figure 15.
Comparison of Scenario S1 and the baseline scenario S0.
Under S1, the long-run levels of Student Motivation, Student Self-Efficacy, Creativity Readiness, Participation Level, and Projects are higher, and the early burnout peak is lower (Figure 15). Persistence matters more than the initial response: lower pressure preserves the feedback from participation and success to perceived competence. Project volume changes less than motivation because resource and capacity constraints remain binding. S1 thus acts mainly on upstream sustainability rather than project expansion.
The results favor staged rewards, workload limits, mentoring, and early burnout monitoring over intensive short-term rewards. Participation should be interpreted alongside motivation and self-efficacy because higher headcounts can mask declining engagement.
4.2.2. Building Capacity: Raising the Resource Floor and Long-Run Output
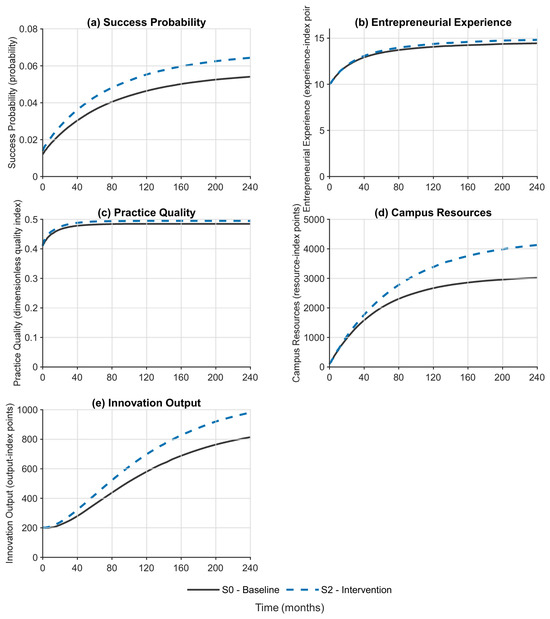
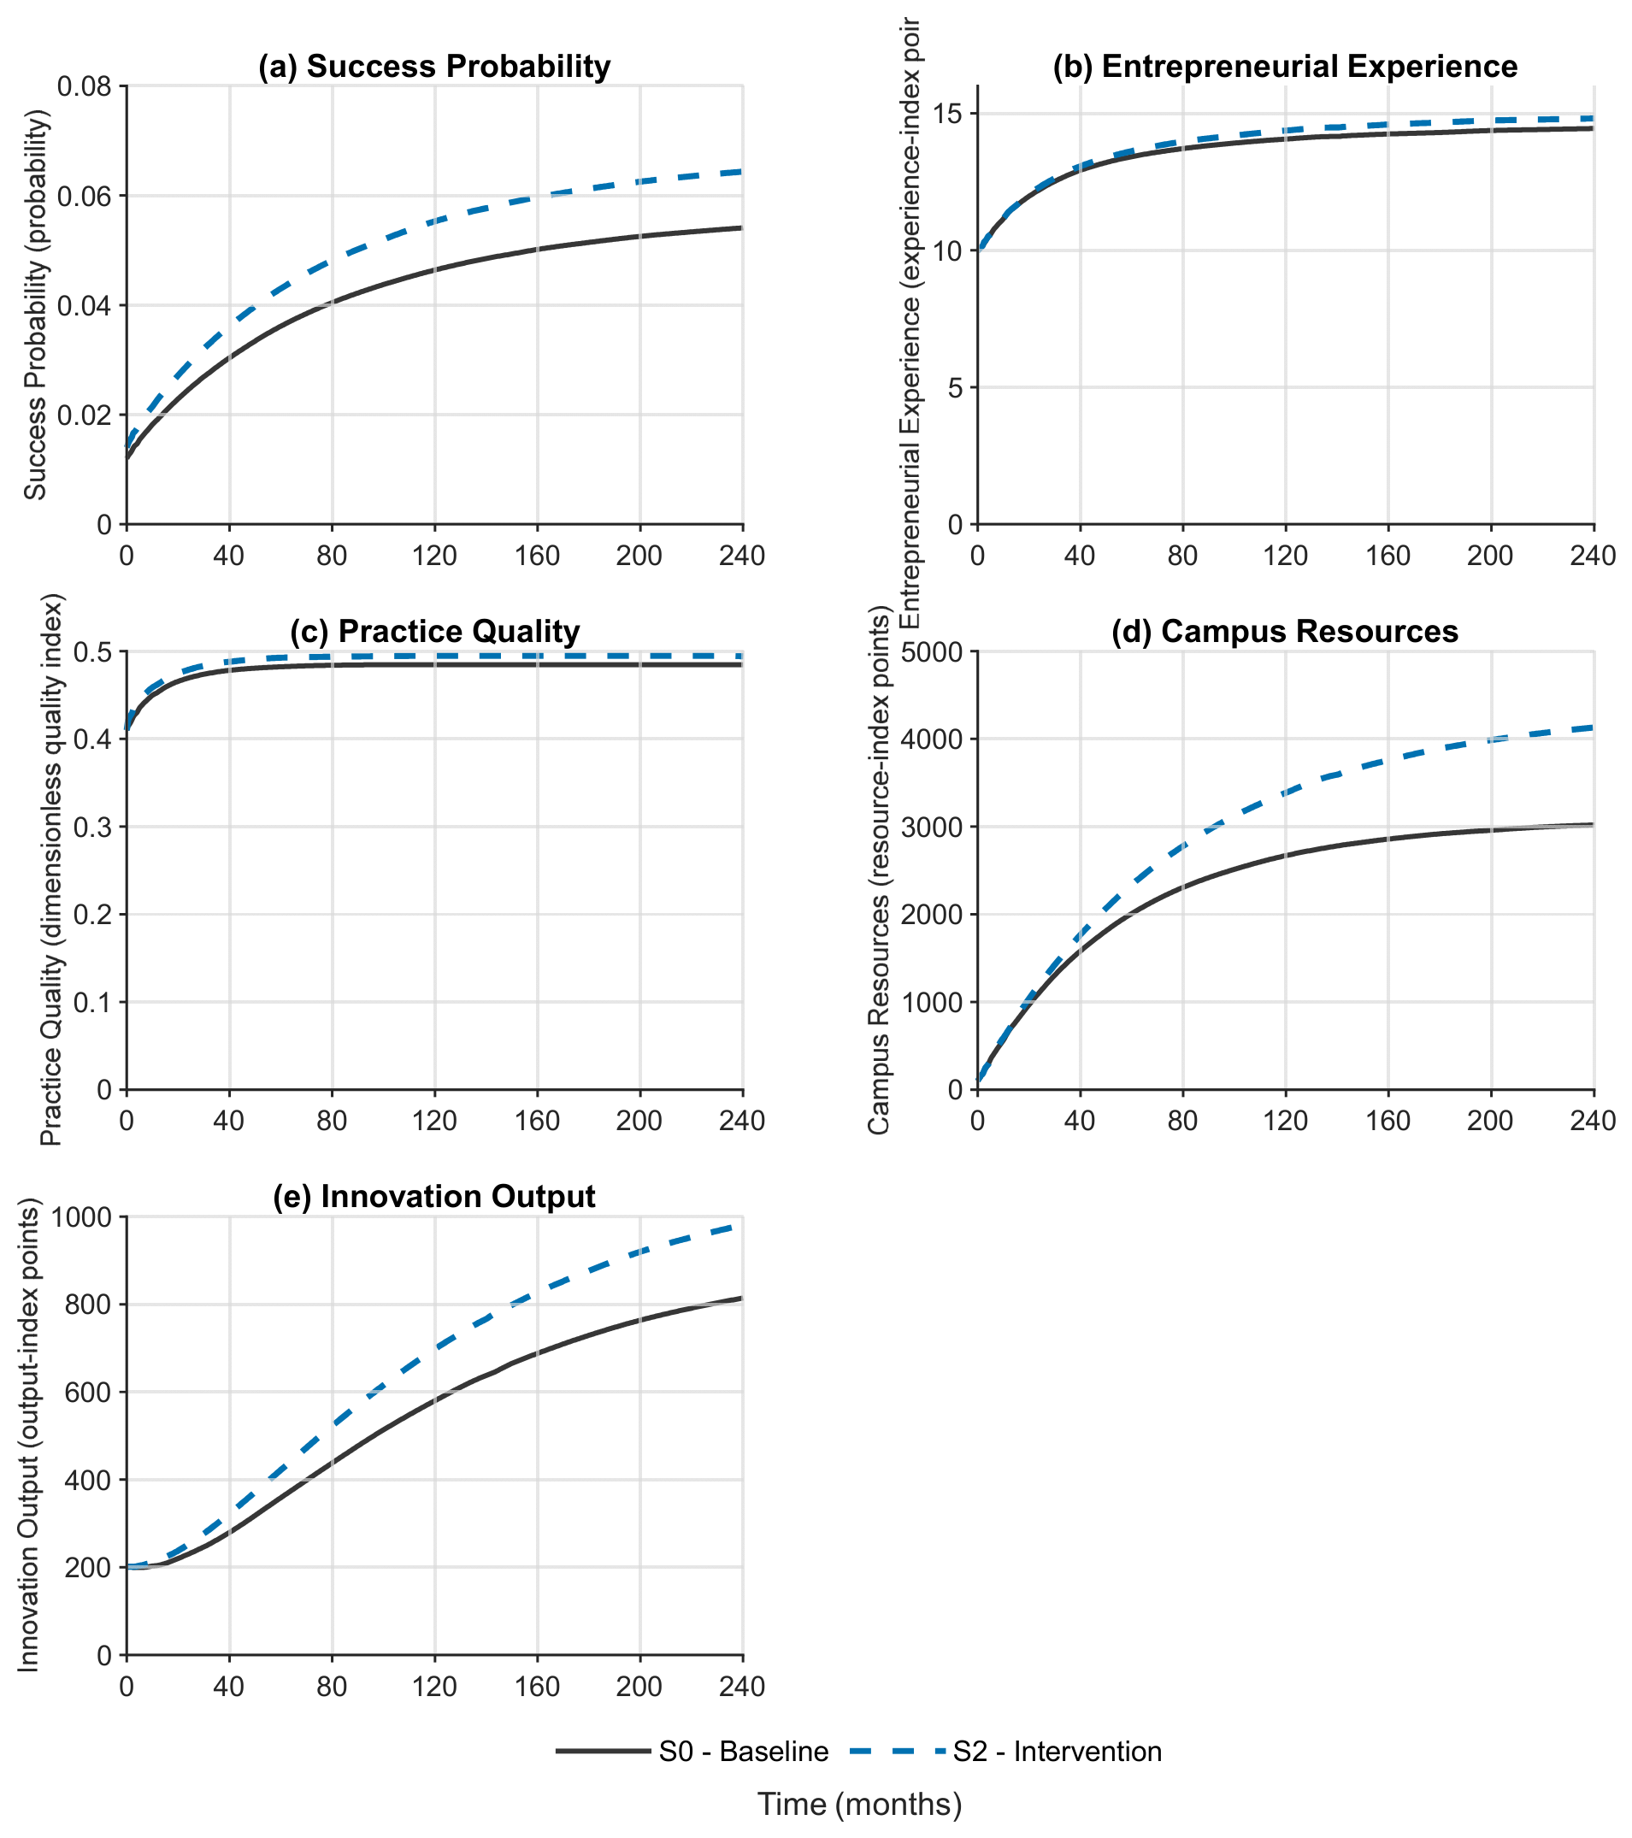
S2 increases structural capacity. The Resource Allocation Ratio is raised to 0.80 and the Resource-to-Practice Quality Coefficient to 0.030, while consumption per project falls to 0.40 and depreciation to 0.015. Although the parameters governing student behavior are unchanged, these settings are expected to raise the resource floor, improve conditions for practice and success, and gradually move Innovation Output to a higher trajectory. Figure 16 reports the comparison with S0.
Figure 16.
Comparison of Scenario S2 and the baseline scenario S0.
The most direct effect of S2 is on Campus Resources; Practice Quality, Success Probability, Entrepreneurial Experience, and Innovation Output respond later (Figure 16). Practice Quality changes little because it is already near its upper bound. Even so, the larger resource stock eases congestion and maintains better conditions for success, which accumulate into higher output. This pattern supports investment in binding constraints rather than across-the-board expansion.
Capacity investment also requires sharing rules, maintenance, scheduling, and standards for project use. Its value depends on converting resources into successful activity, not simply enlarging the resource stock.
4.2.3. Converting Responsive Policy into Durable Capacity
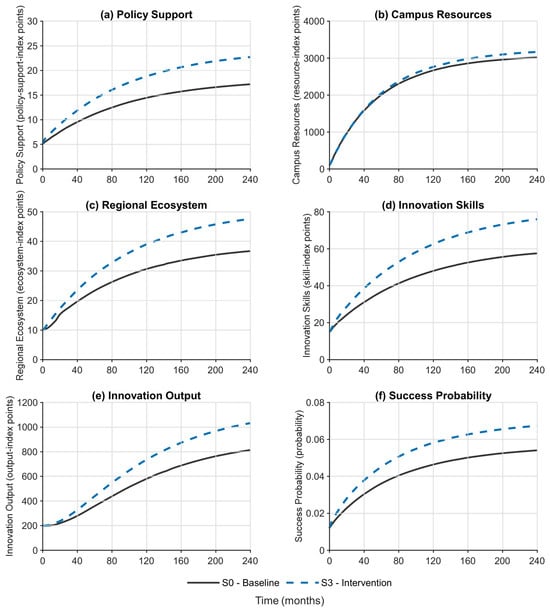
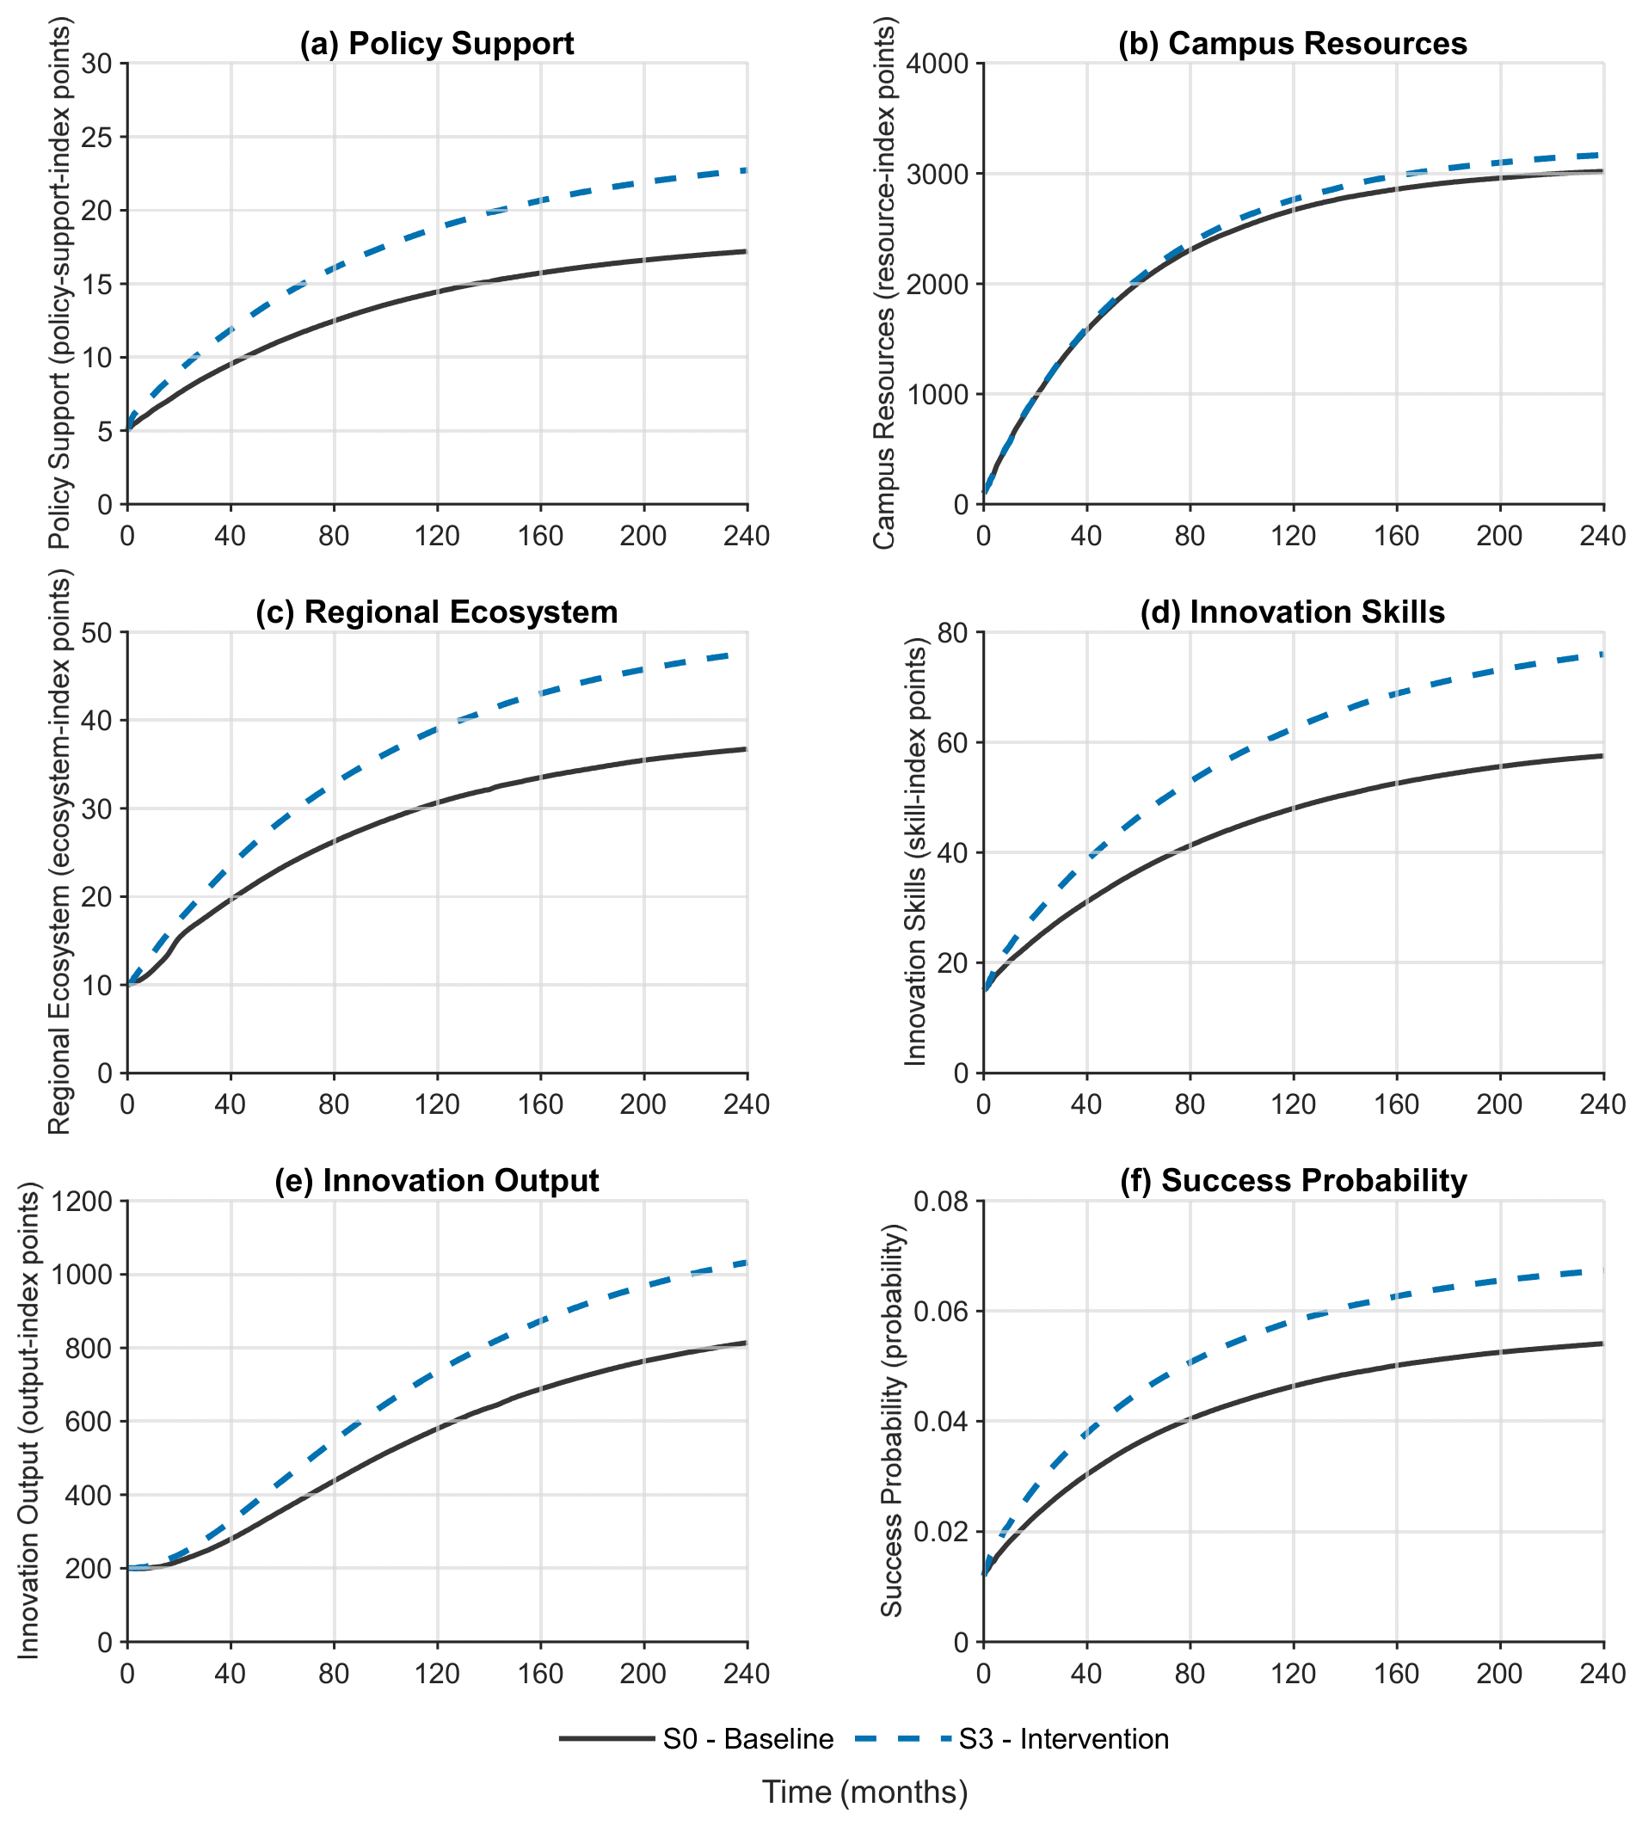
S3 raises policy responsiveness, retains a moderate policy-to-resource delay, and shifts allocation from direct subsidies toward infrastructure and long-term capacity. It tests whether responsive support can improve Campus Resources, the Regional Ecosystem, Innovation Skills, Success Probability, and Innovation Output without producing sharp oscillation. Figure 17 compares the resulting trajectories with S0.
Figure 17.
Comparison of Scenario S3 and the baseline scenario S0.
S3 produces a delayed transmission chain (Figure 17). Policy Support and the Regional Ecosystem respond first. Campus Resources diverge later because approval, deployment, mentor development, and infrastructure require time. Innovation Skills, Success Probability, and Innovation Output improve more clearly after support has been converted into usable capacity. The moderate delay smooths adjustment, indicating that allocation and conversion matter more than nominal support alone.
Performance-responsive funding may therefore require multi-period budgets, clear implementation channels, and monitoring of the conversion from policy support to resources. A faster response is useful only if it creates durable educational capacity.
4.2.4. Expanding Capacity and Screening Projects: Higher Throughput, an Early Output Cost
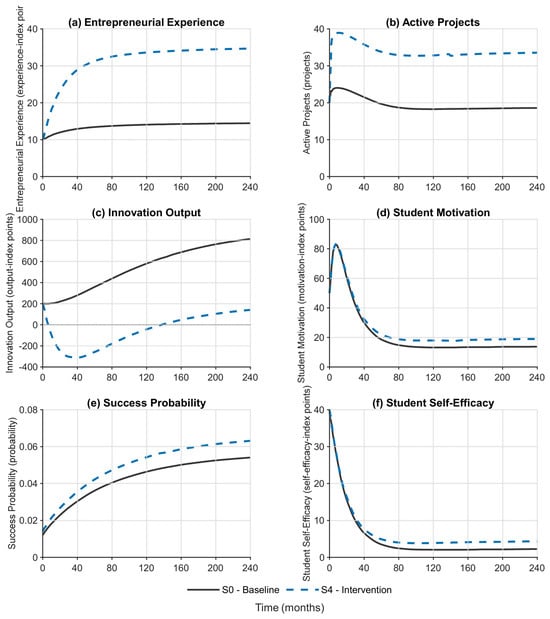
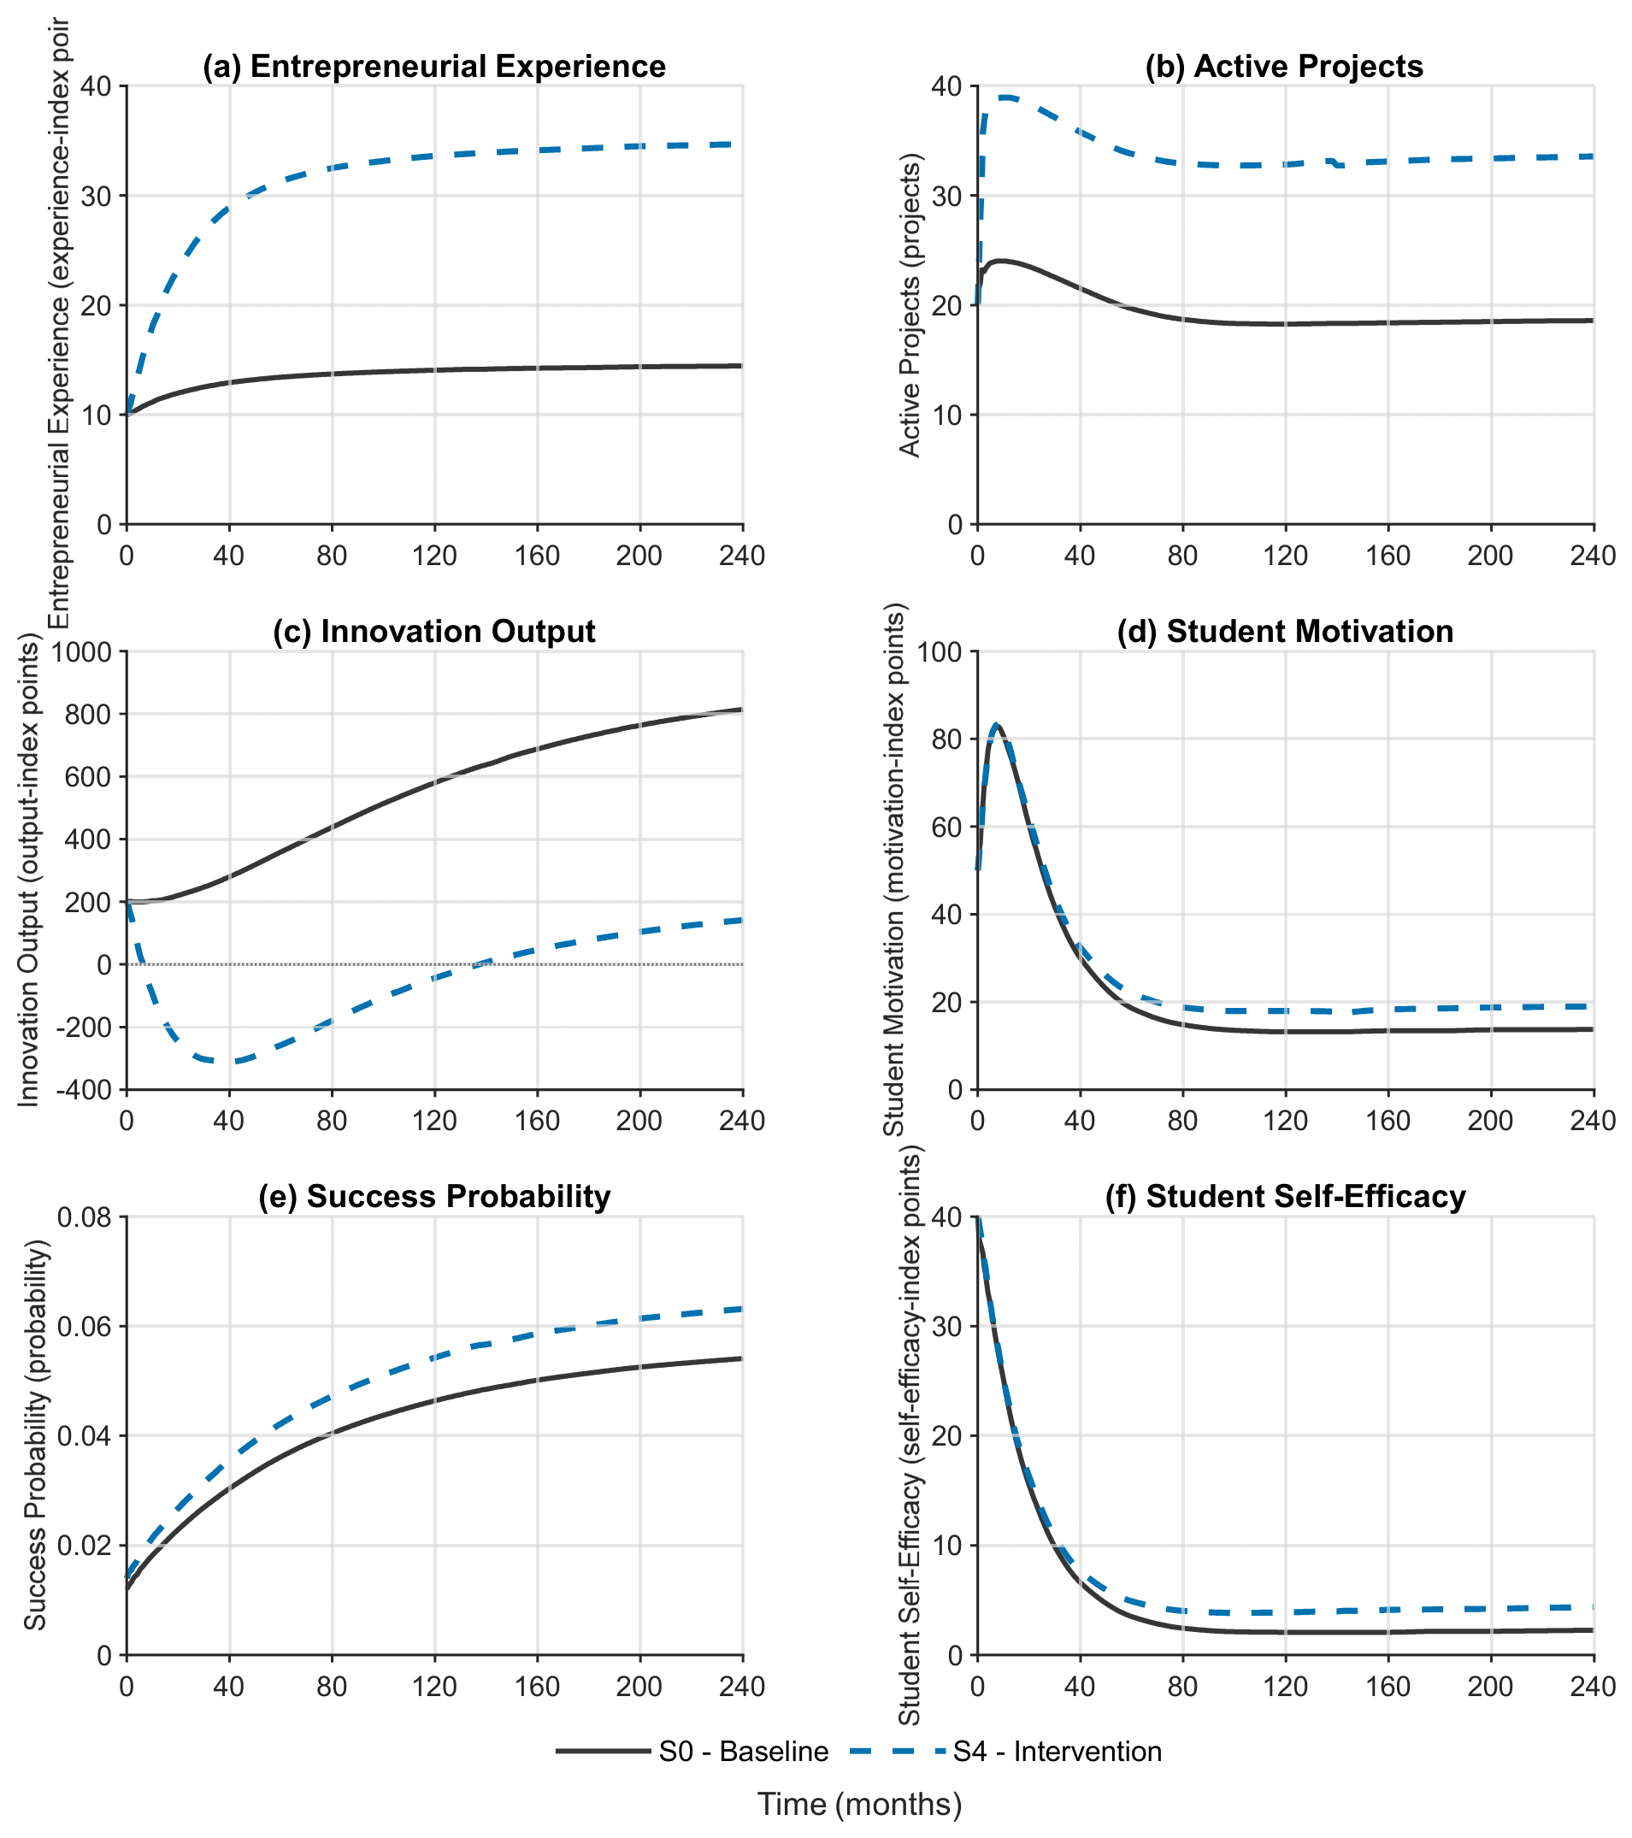
S4 combines a higher Incubator Base (12), a capacity coefficient of 0.30, a Selection Rate of 0.55, a lower Base Exit Rate (0.04), and a Load Factor of 2.00. The experiment tests whether additional capacity and stricter screening can improve projects, experience, success, motivation, and self-efficacy enough to offset the cost of a larger pipeline. Figure 18 compares S4 with S0 over 240 months.
Figure 18.
Comparison of Scenario S4 and the baseline scenario S0.
S4 entails a marked trade-off (Figure 18). Projects, Entrepreneurial Experience, Success Probability, Student Motivation, and Student Self-Efficacy improve, whereas Innovation Output falls sharply before recovering. The expanded pipeline generates both more successful projects and more failures. Early failure costs and resource pressure initially exceed the benefit of added capacity.
The later recovery is consistent with learning from project experience, but the model does not assume that failure is inherently beneficial. AUC records both the early loss and subsequent gain, so a deep trough remains costly unless the recovery is sufficiently large and persistent. The S4 trajectory supports phased expansion, control of failure costs, and gradual scaling.
5. AUC-Based Pareto Evaluation and Policy Choice
We next combine whole-path AUC evaluation with Pareto dominance. Integrating each 240-month trajectory places early losses, delayed gains, and sustained performance in the same comparison. Pareto dominance then retains trade-offs without imposing predetermined weights.
5.1. Selection of Evaluation Objectives and Experimental Factors
The objectives are Innovation Output, Student Motivation, and Campus Resources, representing cumulative performance, behavioral sustainability, and institutional capacity. Success Probability, Participation Level, Practice Quality, Innovation Skills, and Entrepreneurial Experience remain important transmission variables. Treating all of them as objectives, however, would effectively count related mechanisms more than once.
A different decision problem may call for different objectives. Short-Term Burnout could represent student welfare, resource consumption or overload could represent efficiency, and trajectory volatility could represent stability. We retain the present three measures because they capture distinct dimensions that university administrators can interpret directly.
5.1.1. Sensitivity Analysis of the Three Evaluation Indicators
Equation (1) defines parameter sensitivity. The elasticity measures show the relative response of each objective to the specified parameter perturbation.
Sensitivity results for Innovation Output, Student Motivation, and Campus Resources appear in Table 8, Table 9 and Table 10.
Table 8.
Sensitivity analysis results for Innovation Output.
Table 9.
Sensitivity analysis results for Student Motivation.
Table 10.
Sensitivity analysis results for Campus Resources.
Table 8 contains net dynamic elasticities rather than isolated partial effects. Value per success, for example, enters Outcome Value Inflow with a positive direct sign. Raising this value initially increases Innovation Output, which strengthens Policy Investment and participation. The subsequent expansion of projects increases resource use and incubation congestion. Under the calibrated baseline, this delayed capacity effect exceeds the initial gain over 240 months, yielding a negative total elasticity.
Market Demand and mentor effect operate through the same output–policy–expansion–congestion pathway. Both directly improve conditions for success, but the initial gain accelerates project growth before resources and incubation capacity adjust. A higher cost per failure has a negative direct effect on output but also restrains early expansion and may reduce later congestion. Near the baseline, this indirect stabilizing effect yields a positive total elasticity.
These sign reversals depend on the model structure, operating point, and 240-month horizon. They do not mean that successful outcomes, mentoring, or market demand are harmful, nor do they justify increasing failure costs. We use elasticity magnitude only to identify leverage; the direction of policy is evaluated from complete trajectories and the AUC–Pareto results.
Parameters are screened by absolute elasticity because the aim is to identify strong responses, not the desirable direction of intervention. Large values arise from cumulative transmission through stocks, thresholds, capacity constraints, and delays over 240 months; they are simulation responses, not regression coefficients. Rankings were also checked under alternative perturbation sizes. Seven parameters remained highly responsive—cost per failure, value per success, mentor effect, intrinsic gain, motivation loss, external grants, and industry partnerships—and were retained in the scenario design.
5.1.2. L18 Orthogonal Scenario Design
A full factorial design with seven factors at three levels would require 2187 simulations. We instead use an L18 orthogonal array to screen 18 interpretable configurations. The factors are experimental levers rather than theoretically independent determinants. Their joint nonlinear effects remain in the simulation, but the L18 array cannot isolate every interaction; that task would require factorial, response-surface, or global sensitivity analysis.
Table 11 gives the factor levels relative to the calibrated baseline.
Table 11.
Factor levels used in the orthogonal experimental design.
The L18 design is reported in Table 12.
Table 12.
L18 orthogonal experimental design.
5.2. AUC-Based Pareto-Front Analysis
Student Motivation peaks early and declines in all candidates, although the peak and long-run level vary (). Motivation AUC rewards sustained engagement rather than a brief increase followed by rapid erosion.
The three AUC values are reported in Table 13.
Table 13.
AUC values of the three evaluation indicators under scenarios C1–C18.
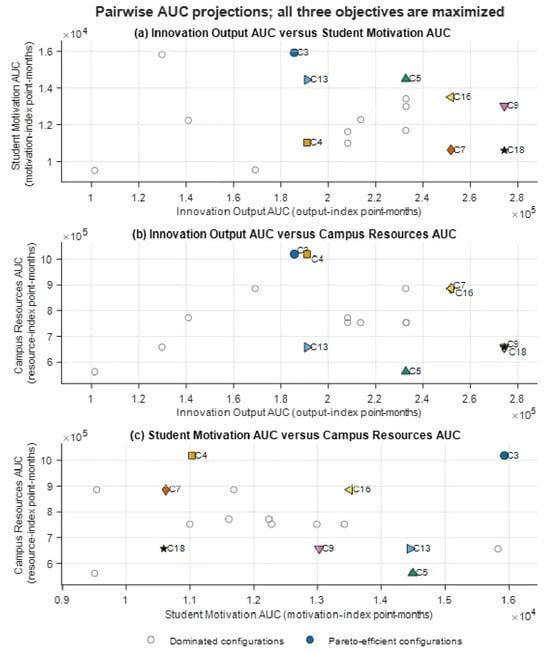
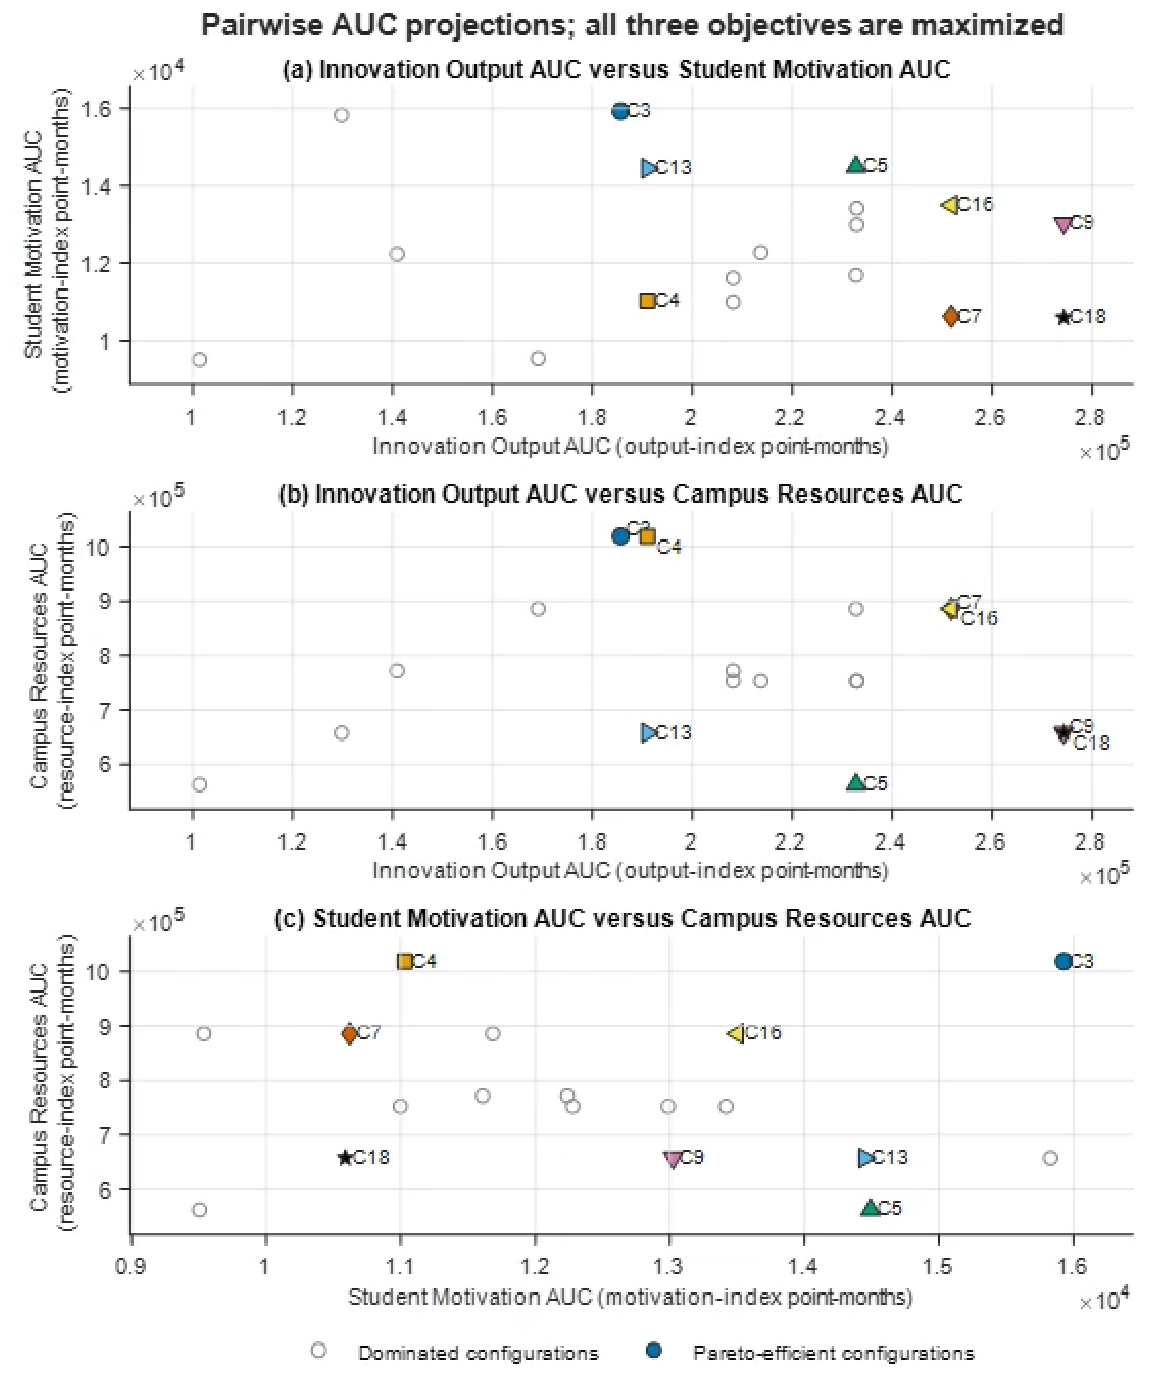
Applying Pareto dominance to the three AUC measures yields the front in Figure 19.
Figure 19.
Pareto front of candidate scenarios C1–C18.
The Pareto front contains eight candidates: C3, C4, C5, C7, C9, C13, C16, and C18 (Figure 19). Their position on the front does not constitute a ranking. C9 and C18 emphasize output; C3 and C4 retain a larger resource base; C5 and C13 favor motivation at different output levels; C7 combines output with structural support; and C16 is comparatively balanced. The front thus presents alternative trade-off profiles.
All eight non-dominated trajectories remain bounded and show no persistent oscillation, divergence, or abrupt instability. They differ in timing, magnitude, and cumulative performance.
We recalculated the front after removing each objective in turn. Innovation Output with Student Motivation retains C3, C5, C9, C16, and C18; Innovation Output with Campus Resources retains C4, C7, C16, and C18; Student Motivation with Campus Resources retains C3 and C4. C3, C4, C16, and C18 form a relatively robust core. The inclusion of C5, C7, C9, and especially C13 depends more strongly on institutional priorities.
5.3. Contextual Selection Among Non-Dominated Scenarios
Scenario choice should start with the university’s planning horizon and non-negotiable constraints, not the largest value on a single axis. A practical sequence is to set minimum acceptable levels for motivation and resources, select the relevant 36-, 48-, 60-, or 240-month window, remove candidates that breach those thresholds, and compare the remaining trade-offs. C3, C4, C16, and C18 provide a robust starting set. Preference-dependent scenarios are appropriate only when a specific institutional priority warrants them. The results are shown in Table 14.
Table 14.
Contextual guide for selecting among the Pareto scenarios.
5.4. Practical Implications and Boundaries of Model Use
The model represents hypothesized feedback informed by theory; it neither establishes causality nor forecasts outcomes. Its Pareto front contains non-dominated configurations from the experimental design rather than a policy prescription for every university. The results are best used to structure comparison and deliberation alongside local evidence and professional judgment.
The simulations indicate that immediate output should not be the only evaluation criterion. Participation, motivation, project progression, mentor availability, and resource use may reveal adjustment costs before outcomes become visible. Interventions also need to account for constraints elsewhere in the system: increasing funding or project intake without sufficient mentoring and incubation capacity may raise workload and congestion without a proportional increase in successful outcomes.
Universities should identify the binding subsystem, coordinate interventions across related constraints, and distinguish short-cycle implementation monitoring from long-term capability assessment. Before use in another institution, the model needs local recalibration, followed by staged or pilot testing of the selected configuration.
6. Conclusions, Limitations, and Future Research
This study combines a four-subsystem system dynamics model with an AUC–Pareto procedure to compare university innovation policies. The simulations trace how incentives, resources, policy conversion, incubation, and project flow may generate gains, delays, and capacity pressure. Eight of the 18 experimental configurations are non-dominated, each with a different trade-off profile rather than a common rank. The findings support structured comparison under stated assumptions but do not provide causal explanations or precise predictions.
The interpretation is subject to several limitations. The model aggregates complex educational processes and includes only the dominant feedback processes. Student Motivation does not distinguish intrinsic from extrinsic components, and the structure omits peer influence, disciplinary culture, detailed teacher–student interaction, student heterogeneity, and some direct cross-subsystem pathways. It is therefore a mechanism-oriented abstraction rather than a complete account of educational reality.
Empirical validation is limited to part of the model. Historical-fit statistics are available only for Projects and Success Probability, so acceptable fit for these variables does not establish the accuracy of every internal trajectory. Parameter equifinality may also allow different combinations of unobserved parameters to reproduce similar observations while generating different internal dynamics. The scenario results are therefore comparative and exploratory rather than predictive. Longer, multi-institutional series are needed for out-of-sample tests of both outcomes and subsystem behavior.
Generalizability is constrained by the single institutional setting and the 2023–2025 observation window. Although the stock–flow structure and evaluation workflow are transferable, coefficients, thresholds, delays, and scenario settings must be recalibrated for institutions with different missions, student populations, resources, and policy environments. In addition, the L18 design cannot isolate every interaction effect.
The policy implications are derived from counterfactual simulations and have not been evaluated through implementation. They should be treated as hypotheses for institutional deliberation. Further work could combine longer multi-university series with out-of-sample validation, comparative cases, and pilot or quasi-experimental evaluation. Targeted interaction analysis and more efficient policy-search methods would provide additional tests of the framework.
Supplementary Materials
The following supporting information can be downloaded at: https://www.mdpi.com/article/10.3390/systems14111370/s1. Table S1: Key model parameters and initial stock values. Table S2: Units of stock, flow/rate, auxiliary variables, and constants. Table S3: Interview participants and methodological role.
Funding
This work was supported by the Basic Science (Natural Science) Research Project of Higher Education Institutions of Jiangsu Province (23KJB62006), the Humanities and Social Sciences Program of the Ministry of Education (23YJCZH201), the Jiangsu Social Science Foundation (23GLC015), the National Natural Science Foundation of China (72401128), and the Natural Science Foundation of Jiangsu Province (BK20240537).
Institutional Review Board Statement
The study was conducted according to the guidelines of the Declaration of Helsinki, and approved by the ethics committee of Nanjing Tech University (CEM) (protocol code 2025726712100003 and date of approval 10 December 2025).
Informed Consent Statement
Informed consent was obtained from all subjects involved in the study.
Data Availability Statement
The original contributions presented in this study are included in the article/Supplementary Material. Further inquiries can be directed to the corresponding author.
Acknowledgments
The author thanks Liu and Wang for assistance.
Conflicts of Interest
The author declares no conflict of interest.
References
- Li, N. Research on the Cultivation of College Students’ Innovation Ability. Adv. Educ. Technol. Psychol. 2023, 7, 92–97. [Google Scholar] [CrossRef] [Scilit]
- Lanford, M.; Tierney, W.G. Creating a Culture of Mindful Innovation in Higher Education; State University of New York Press: Albany, NY, USA, 2022. [Google Scholar]
- Aithal, P.S.; Maiya, A.K. Innovations in Higher Education Industry–Shaping the Future. Int. J. Case Stud. Bus. IT Educ. (IJCSBE) 2023, 7, 283–311. [Google Scholar]
- Wu, N.; Liu, Z. Higher Education Development, Technological Innovation and Industrial Structure Upgrade. Technol. Forecast. Soc. Change 2021, 162, 120400. [Google Scholar] [CrossRef] [Scilit]
- Okolie, U.C.; Igwe, P.A.; Mong, I.K.; Nwosu, H.E.; Kanu, C.; Ojemuyide, C.C. Enhancing Students’ Critical Thinking Skills through Engagement with Innovative Pedagogical Practices in Global South. High. Educ. Res. Dev. 2022, 41, 1184–1198. [Google Scholar] [CrossRef] [Scilit]
- Geng, B.; Huang, T.; Jiang, X.; Lin, N.; Gao, G.; Fan, L. The Analysis of the Innovation Consciousness of College Student Entrepreneurs Under the Teaching Concept of Chinese Excellent Traditional Culture. Front. Psychol. 2021, 12, 717336. [Google Scholar] [CrossRef] [Scilit]
- Zhang, F.; Xi, L. An Evaluation Model for the Innovation and Entrepreneurship Thinking Ability of College Students Based on Neural Network. Int. J. Emerg. Technol. Learn. (iJET) 2021, 16, 188–204. [Google Scholar] [CrossRef] [Scilit]
- Xu, L.; Zhong, H. Identification of High- and New-Technology Enterprises, Supplier Relationship and Technological Innovation: Evidence from China. Int. Rev. Econ. Finance 2024, 94, 103343. [Google Scholar] [CrossRef] [Scilit]
- Runco, M.A.; Jaeger, G.J. The Standard Definition of Creativity. Creat. Res. J. 2012, 24, 92–96. [Google Scholar] [CrossRef] [Scilit]
- Edwards-Schachter, M.; García-Granero, A.; Sánchez-Barrioluengo, M.; Quesada-Pineda, H.; Amara, N. Disentangling Competences: Interrelationships on Creativity, Innovation and Entrepreneurship. Think. Ski. Creat. 2015, 16, 27–39. [Google Scholar] [CrossRef] [Scilit]
- Hero, L.-M.; Lindfors, E.; Taatila, V. Individual Innovation Competence: A Systematic Review and Future Research Agenda. Int. J. High. Educ. 2017, 6, 103–121. [Google Scholar] [CrossRef] [Scilit]
- Keinänen, M.; Ursin, J.; Nissinen, K. How to Measure Students’ Innovation Competences in Higher Education: Evaluation of an Assessment Tool in Authentic Learning Environments. Stud. Educ. Eval. 2018, 58, 30–36. [Google Scholar] [CrossRef] [Scilit]
- Keinänen, M.; Kairisto-Mertanen, L. Researching Learning Environments and Students’ Innovation Competences. Educ. Train. 2019, 61, 17–30. [Google Scholar] [CrossRef] [Scilit]
- Ovbiagbonhia, A.R.; Kollöffel, B.; den Brok, P. Educating for Innovation: Students’ Perceptions of the Learning Environment and of Their Own Innovation Competence. Learn. Environ. Res. 2019, 22, 387–407. [Google Scholar] [CrossRef] [Scilit]
- Guaman-Quintanilla, S.; Everaert, P.; Chiluiza, K.; Valcke, M. Impact of Design Thinking in Higher Education: A Multi-Actor Perspective on Problem Solving and Creativity. Int. J. Technol. Des. Educ. 2023, 33, 217–240. [Google Scholar] [CrossRef] [Scilit]
- Bock, C.; Dilmetz, D.; Selznick, B.S.; Zhang, L.; Mayhew, M.J. How the University Ecosystem Shapes the Innovation Capacities of Undergraduate Students—Evidence from Germany. Ind. Innov. 2021, 28, 307–342. [Google Scholar] [CrossRef] [Scilit]
- Selznick, B.S.; Mayhew, M.J.; Winkler, C.E.; McChesney, E.T. Developing Innovators: A Longitudinal Analysis Over Four College Years. Front. Educ. 2022, 7, 854436. [Google Scholar] [CrossRef] [Scilit]
- Chen, L.; Li, X.; Liu, W.; Kang, X.; Zhao, Y.; Wang, M. System Dynamics-Multiple the Objective Optimization Model for the Coordinated Development of Urban Economy-Energy-Carbon System. Appl. Energy 2024, 371, 123710. [Google Scholar] [CrossRef] [Scilit]
- Hashemizadeh, A.; Ju, Y.; Abadi, F.Z.B. Policy Design for Renewable Energy Development Based on Government Support: A System Dynamics Model. Appl. Energy 2024, 376, 124331. [Google Scholar] [CrossRef] [Scilit]
- Wang, G.; Xiao, C.; Qi, Z.; Meng, F.; Liang, X. Development Tendency Analysis for the Water Resource Carrying Capacity Based on System Dynamics Model and the Improved Fuzzy Comprehensive Evaluation Method in the Changchun City, China. Ecol. Indic. 2021, 122, 107232. [Google Scholar] [CrossRef] [Scilit]
- Ma, H.; Wu, Z.; Chang, P. Social Impacts on Hazard Perception of Construction Workers: A System Dynamics Model Analysis. Saf. Sci. 2021, 138, 105240. [Google Scholar] [CrossRef] [Scilit]
- Raman, R.; Mandal, S.; Das, P.; Kaur, T.; JP, S.; Nedungadi, P. University Students as Early Adopters of ChatGPT: Innovation Diffusion Study. Preprint 2023. [Google Scholar] [CrossRef] [Scilit]
- Yu, H. Reflection on Whether Chat GPT Should Be Banned by Academia from the Perspective of Education and Teaching. Front. Psychol. 2023, 14, 1181712. [Google Scholar] [CrossRef] [Scilit]
- Vedrenne-Gutiérrez, F.; del Carmen López-Suero, C.; De Hoyos-Bermea, A.; Mora-Flores, L.P.; Monroy-Fraustro, D.; Orozco-Castillo, M.F.; Martínez-Velasco, J.F.; Altamirano-Bustamante, M.M. The Axiological Foundations of Innovation in STEM Education–A Systematic Review and Ethical Meta-Analysis. Heliyon 2024, 10, e32381. [Google Scholar] [CrossRef] [Scilit]
- Chung, S.; Matsumoto, R.; Liem, W.; Chalise, N. Expanding Early Childhood Education: The Side-Effects of Well-Meaning Policies and Interventions. Int. J. Complex. Educ. 2024, 5, 1–38. [Google Scholar] [CrossRef]
- Keith, D.R.; Yadama, A.; O’Neill, E.; Chung, S. Anticipating the Side Effects of Educational Reform Using System Dynamics Modeling. Rev. Res. Educ. 2024, 48, 1–27. [Google Scholar] [CrossRef] [Scilit]
- Huang, Y.; Zhang, J.; Xu, Y.; Bu, Y. How Can Digital Innovation Capabilities of Chinese College Students Be Cultivated? Int. J. Manag. Educ. 2024, 22, 101085. [Google Scholar] [CrossRef] [Scilit]
- Vergaño-Salazar, J.G.; Del Valle, M.; Muñoz, C.; Miranda, J.; Precht, A.; Valenzuela, J. Modeling Learning-Oriented Motivation in Health Students: A System Dynamics Approach. BMC Psychol. 2024, 12, 512. [Google Scholar] [CrossRef] [Scilit]
- Vatsa, R.; Bhatnagar, P.; Bhushan, S. Predicting Entrepreneurial Intentions among MBA Students in an Indian Higher Education Institution Using System Dynamics Modeling. J. Innov. Entrep. 2025, 14, 109. [Google Scholar] [CrossRef] [Scilit]
- Eichentopf, I.M.; Kasperidus, H.D. Integrating Technology Assessment, Systems Thinking, and System Dynamics in Sustainability Education: The Need for an Interdisciplinary Framework. Int. J. Educ. Res. Open 2025, 9, 100535. [Google Scholar] [CrossRef] [Scilit]
- Petchrompo, S.; Coit, D.W.; Brintrup, A.; Wannakrairot, A.; Parlikad, A.K. A Review of Pareto Pruning Methods for Multi-Objective Optimization. Comput. Ind. Eng. 2022, 167, 108022. [Google Scholar] [CrossRef] [Scilit]
- Sohrabinejad, A.; Fathi Hafshejani, K.; Movahedi Sobhani, F. Leveraging Genetic Algorithms and System Dynamics for Effective Multi-Objective Policy Optimization: A Case Study on the Broadcasting Industry. Simulation 2025, 101, 453–476. [Google Scholar] [CrossRef] [Scilit]
- Rahmandad, H.; Sterman, J.D. Reporting Guidelines for Simulation-Based Research in Social Sciences. Syst. Dyn. Rev. 2012, 28, 396–411. [Google Scholar] [CrossRef] [Scilit]
- Jalali, M.S.; DiGennaro, C.; Guitar, A.; Lew, K.; Rahmandad, H. Evolution and Reproducibility of Simulation Modeling in Epidemiology and Health Policy Over Half a Century. Epidemiol. Rev. 2021, 43, 166–175. [Google Scholar] [CrossRef] [Scilit]
- Naugle, A.; Manickam, I.; Steinmetz, S.; Schutte, P.; Sweitzer, M.; Washburne, A. Trusted Simulation: Considering Model Quality in the Context of User Trust. Syst. Dyn. Rev. 2025, 41, e70011. [Google Scholar] [CrossRef] [Scilit]
- Lin, H.; Chen, Q. Artificial Intelligence (AI) -Integrated Educational Applications and College Students’ Creativity and Academic Emotions: Students and Teachers’ Perceptions and Attitudes. BMC Psychol. 2024, 12, 487. [Google Scholar] [CrossRef] [Scilit]
- Lv, Y.; Chen, Y.; Sha, Y.; Wang, J.; An, L.; Chen, T.; Huang, X.; Huang, Y.; Huang, L. How Entrepreneurship Education at Universities Influences Entrepreneurial Intention: Mediating Effect Based on Entrepreneurial Competence. Front. Psychol. 2021, 12, 655868. [Google Scholar] [CrossRef] [Scilit]
- Zhang, R.; Li, Z.; Xiong, N.N.; Zhang, S.; Liu, A. TDTA: A Truth Detection Based Task Assignment Scheme for Mobile Crowdsourced Industrial Internet of Things. Inf. Sci. 2022, 610, 246–265. [Google Scholar] [CrossRef] [Scilit]
- Howlett, M.A.; McWilliams, M.A.; Rademacher, K.; O’Neill, J.C.; Maitland, T.L.; Abels, K.; Demetriou, C.; Panter, A.T. Investigating the Effects of Academic Coaching on College Students’ Metacognition. Innov. High. Educ. 2021, 46, 189–204. [Google Scholar] [CrossRef] [Scilit]
- Forrester, J.W. Lessons from System Dynamics Modeling. Syst. Dyn. Rev. 1987, 3, 136–149. [Google Scholar] [CrossRef] [Scilit]
- Forrester, J.W. The Beginning of System Dynamics. McKinsey Q. 1995, 989, 4–17. [Google Scholar]
- Deci, E.L.; Ryan, R.M. The “What” and “Why” of Goal Pursuits: Human Needs and the Self-Determination of Behavior. Psychol. Inq. 2000, 11, 227–268. [Google Scholar] [CrossRef] [Scilit]
- Barney, J. Firm Resources and Sustained Competitive Advantage. J. Manag. 1991, 17, 99–120. [Google Scholar] [CrossRef] [Scilit]
- Scott, W.R. Institutions and Organizations: Ideas, Interests, and Identities, 4th ed.; Sage: Thousand Oaks, CA, USA, 2014. [Google Scholar]

Disclaimer/Publisher’s Note: The statements, opinions and data contained in all publications are solely those of the individual author(s) and contributor(s) and not of MDPI and/or the editor(s). MDPI and/or the editor(s) disclaim responsibility for any injury to people or property resulting from any ideas, methods, instructions or products referred to in the content. |
© 2026 by the author. Licensee MDPI, Basel, Switzerland. This article is an open access article distributed under the terms and conditions of the Creative Commons Attribution (CC BY) license.