


Highlights
Please indicate how your work links to systems science via your contributions to systems practice, theory, and/or methodology.
- A government–consumer evolutionary game captures adaptive feedback between fiscal policies and NEV adoption.
- Static and dynamic tax–subsidy mechanisms are compared through stability, equilibrium, and sensitivity analyses.
What are the main findings and/or the implications of the main findings?
- Dynamic policy mechanisms promote system convergence, with static tax and dynamic subsidy showing relatively favorable performance.
- Coordinating tax stability with adaptive trade-in subsidies can support the transition toward demand-driven NEV adoption.
Abstract
Purchase tax exemption and vehicle trade-in subsidies are important demand-side policy instruments for promoting new energy vehicle (NEV) adoption in China. This study examines how static and dynamically adjusted tax and subsidy mechanisms affect the strategic evolution of the government and consumers. Based on the assumption of bounded rationality, this study develops a government–consumer evolutionary game model and derives replicator dynamics to analyze equilibrium stability under different policy mechanisms, followed by numerical simulations and sensitivity analyses. The results show that: (1) the static tax and subsidy mechanism does not converge asymptotically, whereas dynamic mechanisms enable the strategies of both the government and consumers to converge toward an interior equilibrium, with the static-tax and dynamic-subsidy combination showing relatively more favorable performance; (2) a moderate increase in the NEV purchase tax during the phase-out period raises the equilibrium probabilities of policy implementation and NEV adoption, but slows convergence and increases market fluctuations, with consumers more sensitive to changes in the NEV purchase tax than to changes in the fuel-vehicle purchase tax; (3) higher trade-in subsidies granted when an old vehicle is replaced with an NEV increase fiscal pressure and weaken the government’s implementation incentive, whereas higher subsidies for replacement with a conventional fuel vehicle strengthen the government’s implementation incentive but reduce consumers’ probability of choosing NEVs; and (4) policy management costs affect consumers’ strategic choices, while improvements in the baseline utility of NEVs can reduce reliance on policy intervention. These findings provide theoretical insights for coordinating purchase-tax and trade-in-subsidy adjustments and supporting a gradual transition toward demand-driven NEV adoption.
1. Introduction
Promoting green and low-carbon transformation in transportation is a shared global objective for combating climate change and advancing sustainable development [1]. Data from the International Energy Agency indicate that the transport sector accounts for approximately 24% of global energy-related CO2 emissions, with road vehicles contributing about 70% of direct transport emissions [2,3]. Against this backdrop, new energy vehicles (NEVs) have become a central pillar in the electrification and low-carbon transition of the automotive industry, playing a critical role in restructuring energy use and curbing transport-related carbon emissions. China’s New Energy Vehicle Industry Development Plan (2021–2035) identifies NEVs as a vital route to green economic growth. The NEV industry not only lessens fossil fuel dependency and enhances air quality, but also drives upstream and downstream sectors—including raw materials, components, vehicle assembly, and after-sales services. In this way, it holds strategic significance for cultivating new quality productive forces, expanding domestic demand, and stabilizing economic growth [4].
Policy support from central and local governments has been instrumental in the industry’s rapid ascent. On the tax side, the purchase tax exemption for NEVs, in place since 2014, has undergone repeated extensions and refinements, culminating in a phased phase-out: full exemption for 2024–2025, followed by a 50% reduction for 2026–2027. On the subsidy side, China first introduced trade-in subsidies for automobiles in 2009, with related trade-in incentive schemes subsequently expanded and strengthened [5]. In 2024, the State Council issued the Action Plan for Promoting Large-Scale Equipment Renewals and Consumer Goods Trade-Ins, designating vehicle trade-ins as a core strategy for boosting domestic demand and stimulating consumption upgrades [6]; in 2026, the subsidy shifted from a fixed-amount to a proportional model. Together, these two policy instruments have fueled sustained and rapid expansion of the NEV market. According to the China Association of Automobile Manufacturers, NEV sales reached 16.49 million units in 2025, a year-on-year increase of 28.2%, with the market penetration rate reaching 47.9%—signaling that China’s automotive market is continuing its transition toward a new energy-dominated phase [7]. Currently, the purchase tax exemption is being gradually phased out, and the trade-in subsidy also needs dynamic adjustment as market penetration rises. The combined effect of subsidy and tax policy changes on NEV consumption has become a core research focus in this field. Optimizing the tax and subsidy policies for NEVs not only offers practical guidance for the sustainable development of the industry but also provides insights into the cultivation and upgrading of strategic emerging industries in China.
Tax and subsidy policies are important instruments for influencing NEV demand and can affect both producers and consumers [4]. On the supply side, manufacturers’ production decisions, technological innovation, product attributes, and pricing strategies shape the availability and attractiveness of NEVs, while consumer adoption is also influenced by price sensitivity and the price elasticity of vehicle demand [8,9]. The effects of demand-side policies therefore depend not only on policy incentives but also on firms’ supply responses and the resulting price and utility conditions faced by consumers [10,11]. This study focuses specifically on the demand-side intervention mechanism, examining consumers’ choices between NEVs and conventional fuel vehicles under different purchase tax and trade-in subsidy schemes. In recent years, the purchase tax exemption has entered a gradual phase-out, while the trade-in subsidy has shifted from a fixed-amount to a proportional model, making the dynamic nature of the policy mix increasingly salient. Accordingly, this study develops an analytical framework incorporating dynamic tax and subsidy mechanisms to examine how these two policy instruments jointly affect consumer purchase behavior. Specifically, this study seeks to address the following questions: Which combination of tax and subsidy policies shows relatively better performance in promoting NEV adoption in terms of the equilibrium adoption probability, local stability properties, and convergence speed? Do dynamically adjusted policies outperform static ones in guiding consumer behavior? How do different policy mixes influence consumers’ strategic choices? How do changes in government policy management costs affect the evolutionary process? And how should the government optimize the combination of purchase tax exemption and trade-in subsidy to achieve stable and sustained guidance for consumer behavior?
To answer these questions, this study develops an evolutionary game model involving the government and consumers. This model characterizes the evolutionary dynamics of government promotion strategies and consumer purchase strategies under the joint influence of purchase tax exemption and trade-in subsidies. It systematically analyzes the local dynamical stability of equilibrium points under both static and dynamic policy scenarios, compares the evolutionary performance of different policy combinations, and examines how tax and subsidy interventions affect consumer strategy evolution. On the one hand, this study broadens the research perspective on NEV tax and subsidy policies, shifting the analytical focus from the traditional single-subsidy approach to a composite framework of “tax exemption plus trade-in subsidy.” On the other hand, in the post-subsidy era—where purchase subsidies have been fully withdrawn and policy focus has turned to demand-side targeted incentives—this study provides theoretical foundations and decision-making references for governments to optimize industrial policies and achieve dynamic policy adaptation.
The remainder of this study is organized as follows: Section 2 provides a literature review; Section 3 constructs the evolutionary game model under different tax and subsidy mechanisms and conducts stability analysis; Section 4 performs numerical simulations using Matlab R2023b, analyzes the evolutionary trajectories and equilibrium outcomes under various policy combinations, and carries out sensitivity analysis on key parameters; and Section 5 presents the conclusions and discussion.
2. Literature Review
This study constructs an evolutionary game model between the government and consumers to examine the joint effects of purchase tax exemption and trade-in subsidy policies on NEV promotion and to compare the evolutionary outcomes and stability properties under static and dynamic policy scenarios. Consequently, the literature review is organized into the following parts: implementation forms of NEV tax and subsidy policies, implementation effects of NEV tax and subsidy policies, and dynamic tax and subsidy mechanisms in the evolutionary game.
2.1. Implementation Forms of NEV Tax and Subsidy Policies
Tax and subsidy policies for NEVs have undergone continual adjustments in their implementation. Currently, on the tax side, the purchase tax exemption follows a gradual phase-out schedule; on the subsidy side, the trade-in program has evolved from a pilot phase and fixed-amount subsidies to a proportional model [5,12]. Together, the purchase tax exemption and the trade-in subsidy serve as the core demand-side policy instruments for stimulating NEV consumption. Recent studies indicate that China’s NEV policy framework has gradually evolved toward a more diversified, differentiated, and coordinated combination of policy instruments. Liu et al. [13] classified China’s EV incentive policies into monetary incentives, privilege incentives, demonstration incentives, and charging incentives, highlighting the increasingly combined use of different policy tools. Zhao et al. [14] further examined EV policy mixes in Chinese cities and emphasized the transition from broad purchase subsidies toward more differentiated and cost-effective combinations of incentives as the market matures. In the post-subsidy era, Du et al. [15] discussed alternative policy arrangements, including vehicle scrappage, carbon trading, and other complementary instruments, stressing the importance of coordination among different policy tools. With respect to tax incentives, Lu et al. [16] compared alternative continuation and phase-out schedules for the NEV purchase tax exemption, indicating that the timing and intensity of tax withdrawal have become important dimensions of policy implementation. More recently, Wang et al. [17], based on an analysis of 950 provincial NEV policy documents, identified a shift from single-instrument dominance toward synergistic and regionally differentiated policy mixes. Overall, the implementation of China’s NEV tax and subsidy policies has evolved from relatively uniform and direct financial support toward a more diversified, differentiated, coordinated, and progressively phased-out policy framework.
2.2. Implementation Effects of NEV Tax and Subsidy Policies
The ongoing implementation of tax and subsidy policies for NEVs has attracted growing scholarly attention. Researchers have examined the relationship between fiscal and tax policies and NEV industry development from various angles, yielding a range of perspectives.
Numerous studies have examined the effects of tax policies on NEV industry development. For example, Yao et al. [18], using provincial energy and economic data from 2016 to 2021 in China, constructed an empirical model and found that green taxes significantly promote NEV industry growth. Jreige et al. [19] showed through policy simulations that doubling fuel taxes increases the potential market share of NEVs. Zeng et al. [20], employing a two-way fixed-effects model, reported that tax incentives significantly improve NEV firm performance, with stronger effects observed in eastern regions. On the subsidy side, related studies have also identified significant policy effects. Wang and Wang [21] developed a game-theoretic model to analyze pricing and trade-in strategies among competing manufacturers. Their findings indicate that these strategies are shaped not only by government subsidies but also by consumer range anxiety and preferences for substitute products. Zhang et al. [22] reported that trade-in subsidies significantly boosted consumer participation. Wang et al. [23] constructed a network evolutionary game model to evaluate alternative subsidy policies, concluding that adaptive subsidies are more cost-effective than uniform ones and recommended flexible subsidy design. Liu et al. [24] built a tripartite evolutionary game model to examine charging infrastructure subsidy strategies that account for consumer low-carbon preferences. They found that consumer low-carbon preferences, government subsidy levels, and fuel vehicle prices exert the greatest influence on the strategies of both manufacturers and consumers. Nevertheless, some researchers have pointed out problems with subsidy policies. For instance, Ren [25] noted that certain manufacturers obtain government subsidies through fraudulent means, thereby increasing local fiscal pressure. Nie et al. [26] found that subsidies for consumer NEV purchases are less effective than those directed at charging infrastructure, such as charging stations and piles.
Empirical studies based on China’s automobile market provide further evidence on the actual effects of fiscal incentives. Using the vehicle purchase tax exemption policy as a quasi-natural experiment, Liu [27] employed a difference-in-differences approach and found that the policy significantly increased electric vehicle sales. Using the 2022 vehicle purchase tax reduction as a quasi-natural experiment, Mao and Zhang [28] similarly found that the policy significantly increased automobile sales. Based on survey data from participants in China’s 2024 vehicle trade-in program, Dua [12] found that the subsidy induced additional vehicle replacements and accelerated vehicle turnover, with stronger responses among lower-income consumers. Using panel data from 275 Chinese cities, Zhao et al. [14] further found that the effectiveness of EV incentive policies varies across policy combinations and market conditions; in particular, multiple incentives do not necessarily generate stronger effects, and some policy combinations may exhibit crowding-out effects. Taken together, these empirical findings confirm that purchase tax incentives and trade-in subsidies can stimulate vehicle demand and replacement, while also showing that their effectiveness depends on policy design, policy interactions, and market conditions.
In addition to direct fiscal incentives, consumer utility is an important determinant of NEV adoption. Existing studies indicate that consumers’ vehicle choices are shaped not only by purchase costs and government subsidies, but also by factors such as range anxiety, preferences for alternative vehicle types, low-carbon preferences, and the availability of charging infrastructure [21,24,26]. Shi and Cheng [29] further incorporated consumers’ low-carbon preference into a tripartite evolutionary game involving the government, NEV manufacturers, and consumers, showing that government subsidies and consumer preferences jointly shape participants’ strategic choices and NEV diffusion. These factors influence the utility consumers derive from NEVs relative to conventional fuel vehicles and, consequently, their vehicle choices. This literature provides a basis for incorporating baseline consumer utility alongside tax and subsidy incentives into the present government–consumer evolutionary-game framework.
Beyond single-policy instruments, some scholars have further examined the combined effects and comparative analysis of tax and subsidy policies. For example, Yu et al. [30] developed a tripartite evolutionary game model and found that a combination of differentiated carbon taxes and subsidies effectively curbs manufacturer free-riding and incentivizes low-carbon transitions. Chakraborty et al. [31], in both monopoly and duopoly market contexts, found that combining subsidies with green taxes generates higher social welfare than either policy in isolation. Zhou et al. [32] constructed a system-dynamics-based evolutionary game model to assess the influence of price subsidies and tax incentives on electric vehicle industry development. Their results reveal that dynamic incentive policies lead to a stable equilibrium, and that tax incentives outperform direct subsidies in stimulating EV production.
2.3. Dynamic Tax and Subsidy Mechanisms in the Evolutionary Game
Most of the aforementioned studies adopt static policy frameworks. In practice, however, tax and subsidy policies are often adjusted dynamically in response to evolving market conditions. Static policy settings may be less responsive to changes in agents’ strategic behavior, whereas dynamic mechanisms allow policy incentives to adjust with evolving system conditions [33]. Evolutionary game theory provides a useful framework for analyzing adaptive strategic interactions under bounded rationality [34]. Recent research has further examined perceptual rationality in evolutionary games, emphasizing that decision-making may also be shaped by agents’ perceptions of their environment [35]. Scholars have applied evolutionary game models to investigate the effects of dynamic tax or subsidy policies on agent behavior across various domains, including green buildings [36], sustainable aviation fuel promotion [37], port shore power promotion [38], and low-carbon innovation systems [33]. These studies generally indicate that dynamic feedback mechanisms can improve system convergence and alter evolutionary stability relative to static policy settings under certain conditions.
In the NEV sector, evolutionary game models have also been widely used to examine the effects of tax and subsidy policies on the strategic behavior of different participants. For example, Liu et al. [39] constructed a government–manufacturer evolutionary game and compared static and dynamic tax–subsidy scenarios, showing that dynamic taxation or subsidy mechanisms can improve system convergence relative to static policy settings. Zhou et al. [32] assessed the influence of price subsidies and tax incentives on electric vehicle industry development. Chen and Hu [34] examined manufacturers’ behavioral responses to different carbon tax and subsidy mixes. Liu et al. [40] analyzed the evolutionarily stable strategies of local governments and automakers under various subsidy-carbon tax combinations. Sun et al. [41] further examined dynamic subsidy adjustment in a tripartite game involving governments, NEV firms, and consumers. More closely related to the present study, Li et al. [4] constructed a two-party evolutionary game between the government and consumers and compared the evolutionary outcomes under different static and dynamic tax-subsidy mechanisms.
These studies demonstrate that dynamic fiscal-policy mechanisms can influence the evolutionary trajectories of governments, firms, and consumers in the NEV market. However, relatively limited attention has been paid to the joint effects of the two major demand-side policy instruments considered in this study—purchase tax exemption and vehicle trade-in subsidies—particularly their differentiated impacts on government policy implementation and consumers’ vehicle choices.
2.4. Brief Review
The existing literature provides an important foundation for understanding the role of fiscal and tax policies in NEV promotion. Previous studies have examined the effects of taxes, subsidies, and their dynamic adjustment on the evolutionary behavior of governments, manufacturers, and consumers, and have shown that feedback-based policy mechanisms can alter system stability and evolutionary trajectories. Building on this literature, the present study focuses on the joint effects of purchase tax exemption and vehicle trade-in subsidies within a government–consumer evolutionary-game framework.
Relative to previous studies, this paper makes two specific contributions. First, it integrates the purchase tax exemption and vehicle trade-in subsidy into a unified government–consumer evolutionary-game framework, thereby extending the analysis of dynamic fiscal incentives to a more specific demand-side policy combination. Second, by comparing the effects of different tax and subsidy parameters on the evolutionary strategies of the two participants, the study further identifies the differentiated behavioral responses associated with the two policy instruments. In particular, the simulation results show that consumers are more responsive to changes in the NEV purchase tax than to changes in the tax burden on conventional fuel vehicles, and are more sensitive to NEV trade-in subsidies than to trade-in subsidies associated with conventional fuel vehicles.
3. Evolutionary Game Model Construction
3.1. Problem Description
The strategic choices made by the government and consumers jointly influence the promotion effectiveness of NEVs. Based on the assumption of bounded rationality, consumers choose vehicle types with the goal of maximizing their own utility, while the government formulates promotion policies aimed at expanding NEV consumption and advancing the low-carbon transition in transportation. This paper first constructs an evolutionary game model under a static tax-and-subsidy mechanism, assuming that both the purchase tax exemption and the trade-in subsidy are exogenous fixed values that do not vary with consumers’ strategic choices. Subsequently, we introduce a dynamic adjustment mechanism, whereby policy intensities evolve in proportion to the share of consumers choosing NEVs. We also design multiple policy combination scenarios for comparative analysis, in order to reveal the strategic evolution patterns of game participants and the conditions for system stability under different mechanisms.
3.2. Model Assumptions
Based on existing studies [4,12,21] and the actual policy characteristics of the purchase tax exemption and trade-in subsidy for NEVs, the following basic assumptions are proposed.
Assumption 1.
Game participants and strategy choices. The two participants in the evolutionary game are the government and consumers, both of whom are boundedly rational agents and continuously adjust their strategies through long-term interactions. The government’s strategy set is {implement promotion policies, do not implement promotion policies}, where “implement promotion policies” refers to the government promoting NEV development via purchase tax exemptions and trade-in subsidies, and “do not implement policies” indicates that neither incentive measure is adopted. Let denote the probability that the government chooses to implement promotion policies, and the probability of not implementing. The consumers’ strategy set is (choose NEVs, choose conventional fuel vehicles), with the corresponding probabilities denoted as and , respectively.
To focus on the core strategic interaction between government policy implementation and consumer vehicle choice, this study adopts a binary strategy space for both players. Specifically, the government chooses between implementing and not implementing the promotion policy, while consumers choose between NEVs and conventional fuel vehicles. This binary setting is a theoretical simplification intended to isolate the feedback mechanism between policy intervention and consumer adoption within a tractable evolutionary-game framework, rather than to represent the full range of decisions available in the actual vehicle market.
Assumption 2.
Government Payoffs. When the government implements promotion policies, it incurs a management cost M. In this case, if consumers purchase NEVs, the government provides incentives through purchase tax exemptions and trade-in subsidies ; if consumers purchase conventional fuel vehicles, the government levies a fuel vehicle purchase tax and provides trade-in subsidies , while also bearing environmental governance costs arising from fuel vehicle use. When the government does not implement promotion policies, trade-in subsidies are absent; the purchase tax on fuel vehicles remains , and the purchase tax on NEVs is (with being the full rate, and ; given the 50% reduction in NEV purchase tax during 2026–2027, we set ). Additionally, the government bears a public credibility loss due to inaction, as well as environmental governance costs from fuel vehicle use. Here, represents the loss of public credibility associated with the government’s non-implementation of NEV promotion policies, reflecting reduced confidence in policy continuity and government commitment [4]. The environmental governance costs and represent the aggregate environmental management and mitigation burdens associated with fuel-vehicle use when the policy is implemented and not implemented, respectively. Because policy implementation is assumed to promote NEV adoption and reduce reliance on conventional fuel vehicles, the environmental governance burden is expected to be lower under policy implementation than under non-implementation, i.e., . These costs are modeled as exogenous parameters to capture the aggregate economic consequences of environmental externalities without introducing additional environmental-output equations.
Assumption 3.
Consumer Payoffs. Consumers derive a baseline utility from purchasing NEVs and from purchasing conventional fuel vehicles. When the government implements promotion policies, consumers who purchase NEVs benefit from purchase tax exemptions and trade-in subsidies ; those who purchase fuel vehicles pay the full purchase tax and receive trade-in subsidies (with , consistent with actual policy settings). When the government does not implement promotion policies, consumers who purchase NEVs pay the full purchase tax , while the purchase tax for fuel vehicles remains .
The parameters and their definitions mentioned in the above assumptions are summarized in Table 1.
Table 1.
Main parameters and their explanations.
3.3. Model Construction and Stability Analysis Under Static Tax and Subsidy Mechanisms
3.3.1. Model Construction
Based on the above assumptions, four strategy combinations of the government and consumers can be derived, and the game payoff matrix is shown in Table 2.
Table 2.
Payoff matrix of the government–consumer game.
According to evolutionary game theory and the payoff matrix, the expected payoff of the government when implementing the policy, denoted as , is given by:
The expected payoff when not implementing the policy is:
The average expected payoff of the government is:
Therefore, the replicator dynamics equation of the government is:
Similarly, the expected payoffs for consumers choosing NEVs and conventional fuel vehicles are respectively:
The average expected payoff of consumers is:
The replicator dynamics equation of consumers is:
3.3.2. Stability Analysis
Let and , there always exist four local equilibrium points, namely .
When , there exists a fifth equilibrium point .
Here, .
Proposition 1.
(Existence condition of the interior equilibrium point) For the interior equilibrium point , if the following two conditions hold simultaneously:
- (i)
- ;
- (ii)
- .
and the denominators satisfy and , then the interior equilibrium point satisfies and , i.e., the interior equilibrium point exists.
Proof.
Decompose the expression of into the form , where , , , then . Since the denominator is positive, is equivalent to , which is equivalent to . The condition is equivalent to , rearranged as , which is condition (i). Similarly, decompose into , where , , . Since the denominator is positive, is equivalent to , which is equivalent to , i.e., , which is condition (ii). This completes the proof. □
Condition (i) indicates that when the policy is implemented, the total benefit for consumers purchasing NEVs exceeds that for conventional fuel vehicles, implying that the tax and subsidy policies effectively enhance the relative advantage of NEVs. This serves both as a prerequisite for policy effectiveness and as a necessary condition for the existence of a mixed-strategy equilibrium. Condition (ii) indicates that when consumers choose NEVs, the government’s payoff from not implementing the policy is higher than that from implementing it, implying that the government has a “free-rider” incentive—that is, the market has spontaneously shifted toward a green transition, and the government tends to save fiscal expenditure. Together, these two conditions constitute the necessary and sufficient conditions for the existence of the interior equilibrium point .
Following the stability analysis method of Friedman [42], the local dynamical stability of the equilibrium points is first examined using the Jacobian matrix of the replicator system. Because the present model is an asymmetric two-population evolutionary game between the government and consumers, this study distinguishes the local asymptotic stability of a rest point of the replicator dynamics from the stricter game-theoretic concept of an evolutionarily stable strategy (ESS). Accordingly, the Jacobian analysis below is used primarily to characterize the local dynamical stability of the equilibrium points. The Jacobian matrix derived from the replicator dynamic equations is as follows:
For a two-dimensional continuous dynamical system, a hyperbolic equilibrium point is locally asymptotically stable when Det J > 0 and Tr J < 0. When Tr J = 0 and Det J > 0, however, the corresponding eigenvalues are purely imaginary, and the linearization alone is insufficient to determine the nonlinear stability of the equilibrium. Therefore, an additional nonlinear analysis is required for the interior equilibrium of the static-policy system. The determinant Det J and trace Tr J are given respectively as follows:
The relationship between and is first discussed. If , according to the payoff matrix, consumers will always choose to purchase NEVs regardless of the government’s strategy; the game then degenerates into a single-agent decision problem, losing the analytical value of the evolutionary game model. Therefore, this study assumes . This assumption is also consistent with reality: the conventional fuel vehicle industry is relatively mature, while some consumers still have concerns about NEVs in terms of range, safety, and charging convenience, resulting in a lower basic utility than that of fuel vehicles.
Based on the Jacobian matrix, the signs of the determinant and trace corresponding to each equilibrium point are determined. Under the conditions , and , the stability analysis is performed, and the stability results for the five equilibrium points are presented in Table 3.
Table 3.
Stability analysis of the system under static tax and subsidy mechanism.
As shown in Table 3, under the parameter regime considered above, the four boundary equilibrium points , and are not locally asymptotically stable, whereas the interior equilibrium satisfies Det J > 0 and Tr J = 0. Therefore, the Jacobian matrix at has a pair of purely imaginary eigenvalues. Importantly, purely imaginary eigenvalues alone do not establish the nonlinear stability of the interior equilibrium, because the linearization is inconclusive in this case. Therefore, the nonlinear properties of the static system are examined further.
For notational simplicity, define
Equations (4) and (8) can then be rewritten as
For any interior trajectory with , dividing the two differential equations and separating variables gives
Integrating both sides yields the following first integral:
Direct differentiation verifies that
along every interior trajectory of the static-policy system. Hence, each interior trajectory remains on a level set of . The interior equilibrium satisfies
Under the denominator restrictions imposed in Proposition 1,
and
which imply , and hence . At the interior equilibrium, the second derivatives of the first integral are
while the cross derivative is zero. Therefore, has a strict local maximum at . The nearby level sets of H are consequently closed curves surrounding the interior equilibrium. Thus, is a nonlinear center: it is stable in the Lyapunov sense but not asymptotically stable. A trajectory starting away from the equilibrium remains on a closed periodic orbit around ; it neither converges to nor asymptotically approaches the equilibrium.
Proposition 2.
(Stability properties of the system under the static tax and subsidy mechanism) Under the parameter regime in which the interior equilibrium exists and satisfies the conditions summarized in Table 3, the interior equilibrium is a center rather than an asymptotically stable equilibrium. Accordingly, interior trajectories starting away from exhibit persistent periodic oscillations and do not converge asymptotically. The following boundary equilibria may be locally asymptotically stable under the corresponding payoff conditions:
- (i)
- When , the equilibrium (0, 0) is locally asymptotically stable.
- (ii)
- When and , the equilibrium (1, 0) is locally asymptotically stable.
- (ii)
- When and , the equilibrium (1, 1) is locally asymptotically stable.
Proposition 2(i) implies that when the government’s payoff from implementing the policy is lower than that from not implementing it, (0, 0) becomes a locally asymptotically stable equilibrium, regardless of the effectiveness of the tax and subsidy policies. This situation may occur in the early stage of NEV development, when fiscal pressure is high or policy incentives have not yet taken effect, and the cost of implementation exceeds the benefits; consumer acceptance is also low, leading both parties to converge to a state of non-implementation and non-purchase of NEVs.
Proposition 2(ii) implies that when the government’s payoff from implementing the policy is higher than that from not implementing it, and the tax and subsidy policies are ineffective, (1, 0) becomes a locally asymptotically stable equilibrium. This situation may arise when policy implementation is inadequate or supporting facilities such as charging infrastructure are underdeveloped, resulting in persistently low consumer acceptance. Although the government is willing to implement the policy, consumers still prefer conventional fuel vehicles.
Proposition 2(iii) implies that when the government’s payoff from implementing the policy is higher than that from not implementing it, and the tax and subsidy policies are effective (i.e., the total benefit for consumers purchasing NEVs exceeds that for conventional fuel vehicles), (1, 1) becomes a locally asymptotically stable equilibrium. This situation may occur in the growth or maturity stage of NEV development, representing an equilibrium where policy incentives align with market demand.
Overall, the stability outcome of the static tax and subsidy system depends on the underlying payoff conditions. Under the interior-equilibrium parameter regime considered in Table 3, the interior equilibrium is a center and the system exhibits persistent periodic oscillations rather than asymptotic convergence. Under alternative payoff conditions specified in Proposition 2(i)–(iii), however, the corresponding boundary equilibrium can be locally asymptotically stable.
3.4. Model Construction and Stability Analysis Under Dynamic Tax and Subsidy Mechanisms
The above analysis assumes that tax and subsidy levels are static and fixed. In practice, however, NEV fiscal incentives are increasingly adjusted in response to changes in market development. In China, the purchase tax exemption has entered a gradual phase-out, while the trade-in subsidy has shifted from a fixed-amount scheme toward proportional and dynamically adjusted arrangements. Meanwhile, existing studies have commonly introduced state-dependent linear functions to characterize the adaptive adjustment of policy instruments in response to changes in market participation or strategy proportions [4,32,33,34,43]. Drawing on these studies and the actual adjustment direction of China’s NEV policies, this study specifies tax and subsidy intensities as functions of the probability y that consumers choose NEVs. Specifically, the dynamic tax is set as , and the dynamic subsidies are set as and .
This specification implies: (1) as the probability of consumers choosing NEVs increases, the purchase tax exemption for NEVs gradually decreases (i.e., is monotonically increasing), while the trade-in subsidies and decrease monotonically; (2) at , the purchase tax exemption and trade-in subsidies reach their maximum levels; (3) at , the purchase tax reaches its maximum level, while the trade-in subsidies decline to zero. This dynamic design is consistent with the current policy logic of the gradual phase-out of the purchase tax exemption and the dynamic adjustment of trade-in subsidies, reflecting the government’s progressive withdrawal of intervention as market penetration rises, which facilitates the transition to a spontaneous market equilibrium [4].
Next, the modeling and stability analysis of three dynamic policy scenarios are conducted to explore the evolutionary trajectories of the system and the stable equilibrium outcomes of the agents under different strategy combinations.
3.4.1. Dynamic Tax and Static Subsidy
Assume that the government implements dynamic tax and static subsidy, i.e., the purchase tax is positively correlated with , with the tax function given by . and remain unchanged, and the subsidies are still and . The dynamic tax function indicates that the higher the proportion of consumers purchasing NEVs, the higher the tax .
The replicator dynamics equation for the government is:
Let , we obtain:
The replicator dynamics equation for consumers is:
Let , we obtain:
Under dynamic tax and static subsidy, the system always possesses four local equilibrium points: . When and , there exists a fifth equilibrium point . Following Friedman’s stability analysis method [42], the local asymptotic stability of the equilibrium points is assessed using the Jacobian matrix of the system. The Jacobian matrix derived from the replicator dynamics equations is as follows:
The stability analysis results for the system under dynamic tax and static subsidy are presented in Table 4.
Table 4.
Stability analysis of the system under dynamic tax and static subsidy.
Analysis shows that is a locally asymptotically stable equilibrium of the system, and the evolutionary trajectory of the differential equation system spirally converges to the point .
Proposition 3.
Under the scenario of dynamic tax and static subsidy, the partial derivative analysis of the probabilities for the government and consumers yields the following relationships:
- (i)
- ;
- (ii)
- .
Proposition 3(i) indicates that the probability of the government implementing the promotion policy is positively correlated with , , and , and negatively correlated with , , and . An increase in directly raises tax revenue, alleviates fiscal pressure, and thereby strengthens the government’s willingness to implement the policy. Although is a subsidy expenditure, under the constraint , the environmental governance cost would be higher if the policy were not implemented; therefore, the government tends to adopt incentive policies to steer consumer behavior. An increase in implies a stronger consumer preference for fuel vehicles, prompting the government to intensify intervention. Conversely, a higher suppresses fuel vehicle demand and indirectly encourages NEV purchases, reducing the necessity of government intervention. Excessively high increases fiscal burdens and weakens the government’s implementation incentive. An increase in drives consumers to spontaneously shift toward NEVs, diminishing the government’s intervention motivation. This proposition reveals that, under a mixed policy framework with dynamic tax and static subsidy, government behavior is jointly influenced by fiscal revenue, environmental governance costs, and baseline market preferences.
Proposition 3(ii) indicates that the probability of consumers choosing NEVs is positively correlated with , and negatively correlated with , , and . Although an increase in directly raises the tax cost for consumers, under the dynamic tax mechanism, is linked to the purchase behavior . The increase in boosts government fiscal revenue, prompting more proactive policy implementation, which in turn strengthens consumers’ expectations of market stability and enhances their purchase intentions. An increase in will affect policy implementation efficiency and stability, thereby influencing consumer decisions. Although is intended to incentivize demand, excessively high subsidies under a static framework lack dynamic adjustment capability, increasing fiscal pressure and adversely affecting consumer expectations. An increase in directly enhances the relative attractiveness of fuel vehicles, inducing consumers to switch back to them. This proposition reflects that, under the combination of dynamic tax and static subsidy, consumer behavior is shaped not only by direct price incentives but also by expectations of policy stability and fiscal sustainability.
3.4.2. Static Tax and Dynamic Subsidy
Assume that the government implements static tax and dynamic subsidy for consumers, i.e., the trade-in subsidies are negatively correlated with the probability that consumers choose NEVs, set as and , while the taxes remain fixed. The dynamic subsidy function indicates that the higher the proportion of consumers purchasing NEVs, the lower the subsidies and .
The replicator dynamics equation for the government is:
Let , we obtain:
The replicator dynamics equation for consumers is:
Let , we obtain:
Under static tax and dynamic subsidy, the system always possesses four local equilibrium points: . When and , there exists a fifth equilibrium point . Based on Friedman’s stability analysis method [42], the local asymptotic stability of the equilibrium points is assessed using the Jacobian matrix of the system. The Jacobian matrix is as follows:
The stability analysis results for the system under static tax and dynamic subsidy are presented in Table 5.
Table 5.
Stability analysis of the system under static tax and dynamic subsidy.
Similarly, is a locally asymptotically stable equilibrium of the system, and the evolutionary trajectory of the differential equation system spirally converges to the point .
Proposition 4.
Under the scenario of static tax and dynamic subsidy, the partial derivative analysis of the probabilities for the government and consumers yields the following relationships:
- (i)
- ;
- (ii)
- .
Proposition 4(i) indicates that the probability of the government implementing the policy is positively correlated with , , and , and negatively correlated with , , and . Proposition 4(ii) indicates that the probability of consumers choosing NEVs is positively correlated with , and negatively correlated with , , and .
3.4.3. Dynamic Tax and Dynamic Subsidy
Assume that the government implements dynamic tax and dynamic subsidy, i.e., the tax is set as , the subsidies as and , while and remain unchanged. The replicator dynamics equation for the government is:
Let , we obtain:
The replicator dynamics equation for consumers is:
Let , we obtain:
Under dynamic tax and dynamic subsidy, the system always possesses four local equilibrium points: . When and , there exists a fifth equilibrium point . Based on Friedman’s stability analysis method [42], the local asymptotic stability of the equilibrium points is assessed using the Jacobian matrix of the system. The Jacobian matrix is as follows:
The stability analysis results for the system under dynamic tax and dynamic subsidy are presented in Table 6.
Table 6.
Stability analysis of the system under dynamic tax and dynamic subsidy.
Similarly, is a locally asymptotically stable equilibrium of the system, and the evolutionary trajectory of the differential equation system spirally converges to the point .
Proposition 5.
Under the scenario of dynamic tax and dynamic subsidy, the partial derivative analysis of the probabilities for the government and consumers yields the following relationships:
- (i)
- ;
- (ii)
- .
Proposition 5(i) indicates that the probability of the government implementing the policy is positively correlated with , , and , and negatively correlated with , , and . Proposition 5(ii) indicates that the probability of consumers choosing NEVs is positively correlated with , and negatively correlated with , , and .
3.4.4. Comparative Analysis
Comparing the three dynamic policy scenarios, based on the replicator dynamics equations and the stability analysis results in Table 4, Table 5 and Table 6, the following findings are obtained:
(1) In all three scenarios, there exist five equilibrium points, including four local equilibrium points and one interior equilibrium point .
(2) The stability of the pure-strategy equilibrium points requires further analysis under specific parameter conditions. In contrast, the interior equilibrium point is locally asymptotically stable in all three dynamic scenarios, with the evolutionary trajectory of the differential equation system spirally converging to . This indicates the existence of a locally asymptotically stable interior equilibrium in all three dynamic policy scenarios.
In this evolutionary-game framework, the mixed-strategy equilibrium represents strategy proportions at the population level, rather than repeated randomization by individual agents. Specifically, and denote the long-run strategy frequencies of government policy implementation and consumer NEV adoption, respectively. Thus, convergence to the interior equilibrium indicates that these aggregate strategy frequencies stabilize over time, rather than that individual agents repeatedly switch randomly between alternative strategies.
(3) The directional effects of key policy parameters on are consistent across the three dynamic scenarios: an increase in raises both and ; an increase in lowers ; an increase in reduces both and ; and an increase in raises but reduces .
Overall, the introduction of dynamic tax and subsidy mechanisms effectively addresses the limitation of static policies, under which the system fails to converge to an evolutionary equilibrium. All three dynamic scenarios exhibit spiral convergence to a locally asymptotically stable interior equilibrium, with consistent directional effects of key parameters. To further elucidate the specific features of the system’s evolutionary trajectories under different policy combinations and to assess the impact of key parameters on evolutionary outcomes, the next section conducts numerical simulations to compare the evolutionary paths across scenarios, along with sensitivity analyses of parameters such as taxes and subsidies.
4. Numerical Simulation
4.1. Data Sources and Parameter Settings
This study employs MATLAB R2023b to conduct numerical simulations, analyzing the evolutionary paths and equilibrium states of government and consumer strategies under different policy scenarios, along with parameter sensitivity analyses. The initial parameter settings are based on the following two aspects: (1) Reference to existing studies and actual policy data. This study adopts the typical parameter setting methods from the literature [4,32,43] and combines them with official data released by Chinese government agencies. According to the Ministry of Finance data for 2025, the national vehicle purchase tax revenue was 197.2 billion yuan. Based on data from the State Council and the Ministry of Commerce, the number of vehicle trade-ins exceeded 11.5 million units in 2025, of which NEVs accounted for approximately 57.2%. This yields an estimated 6.58 million NEVs and 4.92 million conventional fuel vehicles. Considering the differing subsidy standards for scrappage and replacement trade-ins, this study takes the average value for calculation. The initial values of the relevant tax and subsidy parameters are as follows: . (2) Satisfaction of the prerequisite assumptions for model stability analysis. To ensure the model’s realism and research relevance, two conditions must be met: first, the baseline utility of consumers purchasing NEVs is lower than that of purchasing fuel vehicles, i.e., , reflecting the lingering concerns of some consumers regarding NEV range, safety, and charging convenience; second, when the government implements purchase tax exemptions and trade-in subsidies, the total benefit for consumers purchasing NEVs should exceed that for fuel vehicles, i.e., , which is a prerequisite for policy effectiveness. Under these parameter constraints and considering the cost–benefit structures of both the government and consumers under different strategies, the remaining parameters are set as follows: .
The simulation parameters are expressed on a normalized, dimensionless numerical scale, with tax- and subsidy-related values parameterized with reference to actual policy settings and publicly available data. The simulations are therefore used to characterize the qualitative directions and evolutionary mechanisms of policy effects rather than to generate quantitative predictions of real-world market outcomes.
4.2. System Evolution Analysis Under Different Tax and Subsidy Mechanisms
Figure 1a shows that under the benchmark parameter regime considered in the numerical simulation, the evolutionary trajectories of the government and consumers form closed elliptic orbits around the interior equilibrium point, consistent with the center dynamics established in Section 3.3.2. Rather than converging asymptotically to the interior equilibrium, the system exhibits persistent periodic oscillations. Figure 1b further shows that the strategies of both parties remain on periodic trajectories around the interior equilibrium without converging to or asymptotically approaching it. This numerical result corroborates the nonlinear stability analysis in Section 3.3.2. Consequently, under this interior-equilibrium parameter regime, the introduction of dynamic tax and subsidy mechanisms may improve the convergence properties of the system.
Figure 1.
Evolutionary paths under the static tax and subsidy mechanism. (a) Static tax and subsidy scenario; (b) evolutionary paths of strategy probabilities.
Figure 2, Figure 3 and Figure 4 depict the evolutionary trajectories under three distinct dynamic tax and subsidy mechanisms, respectively. In each case, the evolutionary trajectories of both the government and consumers display a spiraling convergence toward an interior equilibrium point—thereby corroborating the stability analysis in Section 3.4. This finding is consistent with existing studies [32,33,34], which also find non-convergence under static policy mechanisms and convergence toward equilibrium under dynamic policy mechanisms. To compare the relative performance of the three dynamic mechanisms, this study focuses on three dimensions commonly considered in evolutionary-game analyses: local stability properties, the equilibrium outcome, particularly the equilibrium probability of consumers choosing NEVs, and convergence speed [4,32,34,43]. The evolutionary paths under the three dynamic policy mixes are compared in Figure 5. Under the benchmark parameter setting, the static tax and dynamic subsidy mechanism exhibits relatively more favorable performance in terms of these criteria, followed by the dynamic tax and dynamic subsidy, whereas the dynamic tax and static subsidy mechanism performs relatively less favorably.
Figure 2.
Evolutionary paths under the dynamic tax and static subsidy mechanism. (a) Dynamic tax and static subsidy scenario; (b) evolutionary paths of strategy probabilities.
Figure 3.
Evolutionary paths under the static tax and dynamic subsidy mechanism. (a) Static tax and dynamic subsidy scenario; (b) evolutionary paths of strategy probabilities.
Figure 4.
Evolutionary paths under the dynamic tax and dynamic subsidy mechanism. (a) Dynamic tax and dynamic subsidy scenario; (b) evolutionary paths of strategy probabilities.
Figure 5.
Comparison of evolutionary paths under three dynamic tax and subsidy mechanisms.
4.3. Sensitivity Analysis of Key Parameters
4.3.1. Effects of Tax Variations on System Evolutionary Trajectories
Under the static tax and dynamic subsidy mechanism, the effects of taxes and on the strategic evolution of the government and consumers are further analyzed. The initial probabilities are set as x = 0.1 and y = 0.1, with other parameters held constant. Settings of and are sequentially applied, and the simulation results are presented in Figure 6 and Figure 7.
Figure 6.
Impact of on the evolutionary paths of the government and consumers. (a) Government; (b) consumers.
Figure 7.
Impact of on the evolutionary paths of the government and consumers. (a) Government; (b) consumers.
Figure 6a shows that as increases, the probability of the government implementing the policy rises, which is consistent with the conclusion in Section 3.4 that is positively correlated with . Figure 6b shows that as increases, the probability of consumers purchasing NEVs also rises, confirming the analytical result that is positively correlated with . As fiscal revenue, can alleviate fiscal pressure and enhance policy sustainability. Although an increase in slightly reduces the net utility of consumers purchasing NEVs (), as long as (i.e., the NEV purchase tax under the policy is lower than that without the policy), NEVs still maintain a relative price advantage over conventional fuel vehicles. Furthermore, both Figure 6a,b show that an increase in prolongs the time required for the system to converge toward the stable equilibrium, indicating that higher taxes slow system convergence. Therefore, the adjustment of involves a trade-off between the equilibrium outcomes and convergence speed.
Figure 7a shows that the fuel vehicle purchase tax affects the government’s strategic choices: a higher leads to a lower probability of the government implementing the policy, which is consistent with the negative correlation between and established in Section 3.4. Figure 7b indicates that, in the short term, an increase in within a certain range amplifies fluctuations in consumers’ strategic evolution; however, the long-term values of converge to a similar level, suggesting that a modest increase in does not alter consumers’ ultimate choices. Nevertheless, when exceeds a certain threshold, the government tends to opt for non-implementation of the policy, while 90% of consumers choose to purchase NEVs. This may be attributed to the fact that a higher fuel vehicle purchase tax significantly raises the acquisition and usage costs of fuel vehicles, prompting consumers, driven by economic rationality, to switch to NEVs. Once consumers have made this large-scale shift, the government’s need to incentivize such behavior through tax reductions diminishes accordingly. This also implies that, in the future, if a substantial environmental tax is imposed on high-emission fuel vehicles, consumers are likely to spontaneously turn to NEVs, allowing the government to phase out purchase tax subsidies while the market maintains a high penetration rate.
Figure 8 illustrates the effects of the purchase taxes and on the proportion of consumers purchasing NEVs. The simulation results indicate that exerts a positive effect on , while the influence of is relatively weak. Specifically, with held constant, raising from 4 to 6 increases from approximately 0.47–0.48 to 0.81–0.83, an increase of over 70%. By contrast, when is fixed, increasing from 9 to 11 has only a marginal effect on . This suggests that consumers are more responsive to changes in than to those in . Therefore, NEV promotion policies should prioritize purchase tax exemptions, with a carefully calibrated phase-out gradient that balances fiscal sustainability and incentive effectiveness.
Figure 8.
Impact of and on consumers’ evolutionary paths.
4.3.2. Effects of Subsidy Variations on System Evolutionary Trajectories
Under the static tax and dynamic subsidy mechanism, the effects of subsidies and on the strategic evolution of the government and consumers are further analyzed. The initial probabilities are set as x = 0.1 and y = 0.1, with other parameters held constant. Values of and are sequentially applied, and the simulation results are shown in Figure 9 and Figure 10.
Figure 9.
Impact of on the evolutionary paths of the government and consumers. (a) Government; (b) consumers.
Figure 10.
Impact of on the evolutionary paths of the government and consumers. (a) Government; (b) consumers.
Figure 9a,b show that, as increases, both the probability of the government implementing the policy and the probability of consumers purchasing NEVs decline. This is consistent with the negative correlation between , , and established in Section 3.4. The rationale is that a higher raises fiscal expenditure, thereby weakening the government’s policy implementation incentive and consequently suppressing . Moreover, an increase in accelerates convergence of both players to the stable point, indicating that excessively low subsidies slow convergence and increase market volatility, whereas a moderate increase facilitates faster stabilization. In designing trade-in subsidy policies, policymakers should balance convergence speed and policy effectiveness. A comparison of Figure 9a,b reveals that, under an equivalent change in , the magnitude of adjustment in consumer strategy exceeds that in government strategy, suggesting that consumers are more responsive to variations in .
Figure 10a shows that as increases, the probability of the government implementing the policy rises, consistent with the positive correlation between and established in Section 3.4. Figure 10b shows that as increases, the probability of consumers purchasing NEVs declines, aligning with the negative correlation between and . Furthermore, an increase in prolongs the convergence time of both players to the stable point, suggesting that excessively high subsidies slow convergence and amplify market volatility. A comparison of Figure 10a,b reveals that, under identical changes in , consumer strategy adjusts more substantially than government strategy, indicating that consumers are more responsive to variations in . Overall, neither nor should be set too high: raising reduces both and , whereas raising not only lowers but also intensifies volatility and extends convergence time.
Figure 11 examines the effects of and on . Simulation results show that increases in both subsidies reduce . Specifically, with fixed, raising from 4.5 to 7 lowers from 0.70–0.74 to 0.53–0.63, a reduction of 14–24%. With fixed, increasing from 1 to 3.5 reduces from 0.63–0.74 to 0.53–0.70, a decrease of 5–15%. This suggests that consumers are more sensitive to changes in than to those in . Overly generous subsidies may foster consumer dependency on subsidies while diverting attention from the technical performance and long-term usage costs of the products themselves. Therefore, the government should design a phase-out mechanism for trade-in subsidies that is calibrated to market maturity, gradually reducing subsidy intensity to foster the healthy development of the NEV industry.
Figure 11.
Impact of and on consumers’ evolutionary paths.
4.3.3. Effects of Government Management Costs on System Evolutionary Trajectories
Under the static tax and dynamic subsidy mechanism, the effect of government management cost on the strategic evolution of both the government and consumers is further analyzed. The initial probabilities are set as x = 0.1 and y = 0.1, with other parameters held constant. Simulations are sequentially performed with M = 1.5, 2, and 6, and the simulation results are presented in Figure 12.
Figure 12.
Impact of M on the evolutionary paths of the government and consumers. (a) Government; (b) consumers.
Figure 12a shows that an increase in within a certain range dampens short-term fluctuations in the government’s strategic evolution, while the long-term values of tend to converge—implying that a modest rise in does not affect the government’s ultimate strategy. However, once exceeds a threshold, the government tends to choose not to implement the policy. Figure 12b shows that a higher reduces the probability of consumers purchasing NEVs, corroborating the negative correlation between and established in Section 3.4. In the payoff structure, a higher directly increases the cost of policy implementation and reduces its relative payoff, thereby weakening the government’s incentive to implement the promotion policy and indirectly affecting consumers’ evolutionary choices. Therefore, controlling policy management costs is important for maintaining the effectiveness of policy implementation.
4.3.4. Effects of Consumer Purchase Utility on System Evolutionary Trajectories
Under the static tax and dynamic subsidy mechanism, the effects of consumer utilities and on the strategic evolution of both the government and consumers are further analyzed. The initial probabilities are set as x = 0.1 and y = 0.1, with other parameters held constant. Values of and are sequentially applied, and the simulation results are shown in Figure 13 and Figure 14.
Figure 13.
Impact of on the evolutionary paths of the government and consumers. (a) Government; (b) consumers.
Figure 14.
Impact of on the evolutionary paths of the government and consumers. (a) Government; (b) consumers.
Figure 13a shows that a higher reduces the probability of government policy implementation, consistent with the negative correlation between and established in Section 3.4. This occurs because an increase in diminishes the need for policy intervention, shifting the market from a policy-driven to a demand-driven mode. Figure 13b indicates that, in the short term, an increase in amplifies fluctuations in consumers’ strategic evolution, while the long-run value of remains unchanged. When , the government opts not to implement the policy, and nearly 90% of consumers are willing to purchase NEVs. Figure 14a shows that an increase in raises , consistent with the positive correlation between and . Figure 14b similarly indicates that variations in within a certain range do not affect the equilibrium point. However, when , the government opts not to implement the policy, and nearly 90% of consumers are willing to purchase NEVs.
In summary, for consumers, has little effect on their choices before reaching , but its impact becomes significant once equals . For the government, enhancing through improved charging infrastructure, extended driving range, and better vehicle performance can reduce the need for policy intervention while sustaining strong market demand.
5. Conclusions and Discussion
5.1. Main Conclusions
To investigate the mechanisms through which purchase tax exemption and trade-in subsidy policy function, this study constructs a two-party evolutionary game model involving the government and consumers. It compares the local stability properties and equilibrium outcomes under the static tax and subsidy mechanism with those under three dynamic mechanisms, and analyzes the effects of key parameters—including taxes, subsidies, policy management costs, and consumer utilities—on the evolutionary paths. The main conclusions are as follows:
- (1)
- Under the static tax and subsidy policy, the system does not converge asymptotically; instead, the evolutionary trajectories remain on closed periodic orbits around the interior equilibrium. This implies that, under this parameter regime, fixed policies cannot provide sustained and stable guidance toward a convergent state.
- (2)
- Among the three dynamic mechanisms—dynamic tax with static subsidy, static tax with dynamic subsidy, and dynamic tax with dynamic subsidy—all enable the evolutionary trajectories of the government and consumers to converge toward a locally asymptotically stable interior equilibrium. Their relative performance is evaluated based on the equilibrium outcomes, local stability properties, and convergence speed. Based on these criteria, the static tax and dynamic subsidy mechanism shows relatively more favorable performance, followed by the dynamic tax and dynamic subsidy mechanism, while the dynamic tax and static subsidy mechanism performs relatively less favorably.
- (3)
- The NEV purchase tax affects the evolutionary strategies of both parties, and consumers are more sensitive to changes in than to changes in the fuel vehicle purchase tax . An increase in raises both the probability of government policy implementation and the probability of consumers choosing NEVs, but prolongs the convergence time. Compared with , changes in exert a greater influence on consumers’ vehicle choices.
- (4)
- The trade-in subsidies and have different effects on the strategies of both parties. An increase in intensifies fiscal pressure, reducing both the government’s implementation probability and consumers’ probability of choosing NEVs. An increase in strengthens the government’s policy implementation incentive but reduces consumers’ probability of choosing NEVs, while also prolonging convergence time and exacerbating market volatility. Consumers respond more strongly than the government to changes in both subsidies and are more sensitive to than to .
- (5)
- The government’s management cost and the baseline utility of NEVs jointly affect the evolutionary strategies of the government and consumers. An increase in reduces the relative payoff of policy implementation and lowers the probability of consumers choosing NEVs. By contrast, an increase in reduces the government’s reliance on policy intervention. When approaches or exceeds the baseline utility of conventional fuel vehicles , a high level of NEV adoption can be sustained with a lower probability of government policy implementation.
5.2. Policy Recommendations
Based on the above conclusions, the following policy recommendations are proposed:
- (1)
- Maintain relative stability in the purchase-tax policy while dynamically adjusting trade-in subsidies in response to changes in NEV market penetration. The static-tax and dynamic-subsidy mechanism exhibits relatively favorable evolutionary performance in terms of stability, equilibrium outcomes, and convergence speed. Accordingly, the purchase-tax schedule should remain relatively stable within each policy stage, while trade-in subsidies can be gradually reduced as NEV market penetration increases. If market penetration declines substantially, subsidy intensity can be adjusted upward within the existing trade-in policy framework.
- (2)
- Carefully calibrate the pace and magnitude of purchase-tax and trade-in-subsidy adjustments to balance equilibrium outcomes and convergence speed. A higher increases the probabilities of government policy implementation and consumer NEV adoption, but slows system convergence. Excessively high increases the fiscal burden and reduces both probabilities, whereas a higher —the trade-in subsidy granted when an old vehicle is replaced with a conventional fuel vehicle—reduces the probability of NEV adoption and prolongs convergence. Therefore, abrupt changes in tax and subsidy intensity should be avoided, and both and should be maintained within moderate ranges. In particular, should remain at a restrained level to preserve the relative incentive for consumers to choose NEVs.
- (3)
- Control policy management costs and enhance the baseline utility of NEVs to facilitate the transition toward a more demand-driven market. Higher management costs weaken the incentive for policy implementation and reduce consumers’ probability of choosing NEVs, whereas a higher baseline utility reduces the need for continued policy intervention. Policy implementation should therefore avoid unnecessarily high administrative costs, while fiscal incentives can be gradually reduced as the baseline utility and market competitiveness of NEVs improve.
5.3. Limitations and Future Research
This study has several limitations. The model adopts a binary strategy space for the government and consumers and therefore does not represent intermediate behavioral options such as vehicle retention, delayed purchase, or postponed trade-in. Consumers are modeled as an aggregate population without explicitly considering heterogeneity in income, charging-infrastructure availability, or responses to continuing improvements in NEV technology and product performance.
These factors may influence consumers’ baseline utility and sensitivity to tax and subsidy incentives. On the government side, subsidy fraud and binding fiscal-budget constraints are not explicitly incorporated. The conclusions thus mainly characterize qualitative evolutionary mechanisms and directional policy effects within the model setting, while their quantitative magnitude may vary across market segments and implementation environments.
The comparison among dynamic policy mechanisms is based on local stability properties, equilibrium outcomes, and convergence speed. Fiscal expenditure, social welfare, and system volatility are not incorporated into a unified evaluation framework, and the relative performance of the policy mechanisms is therefore specific to the criteria considered in this study. In addition, the conclusions regarding dynamic policies are derived under the adopted linear feedback functions, and their robustness to alternative functional forms remains to be examined. Future research can extend the model by introducing heterogeneous consumers, infrastructure and technological constraints, fiscal-budget constraints, richer strategy sets, and alternative dynamic feedback functions. Incorporating automobile manufacturers and broader fiscal and welfare indicators would also enable a more comprehensive assessment of alternative tax-subsidy mechanisms.
Author Contributions
Conceptualization, Z.Z. and G.T.; methodology, Z.Z. and G.T.; software, Z.Z.; validation, Z.Z., G.T. and X.W.; formal analysis, Z.Z.; investigation, X.W.; resources, G.T.; data curation, Z.Z. and X.W.; writing—original draft preparation, Z.Z.; writing—review and editing, G.T.; visualization, Z.Z. and X.W.; supervision, G.T.; project administration, G.T.; funding acquisition, G.T. All authors have read and agreed to the published version of the manuscript.
Funding
This research was funded by the National Natural Science Foundation of China (Grant No. 72264023).
Institutional Review Board Statement
Not applicable.
Informed Consent Statement
Not applicable.
Data Availability Statement
Data is contained within the article.
Conflicts of Interest
The authors declare no conflicts of interest.
Abbreviation
The following abbreviations are used in this manuscript:
| NEVs | New energy vehicles |
References
- Behera, B.; Sahoo, M.; Sethi, L.; Das, A.; Sethi, N.; Ahmad, M. Fuelling the low-carbon transportation sector in emerging economies: Role of institutional quality, environmental tax, green technology innovation and biofuel. Transp. Policy 2025, 166, 124–134. [Google Scholar] [CrossRef] [Scilit]
- Solaymani, S.; Botero, J. Reducing carbon emissions from transport sector: Experience and policy design considerations. Sustainability 2025, 17, 3762. [Google Scholar] [CrossRef] [Scilit]
- Gomez, A.P.; Bonilla, D.; Banister, D. Decoupling transport-CO2 emissions: Mexico, Spain and The USA: A trend analysis. Transp. Res. Part D Transp. Environ. 2024, 137, 104510. [Google Scholar] [CrossRef] [Scilit]
- Li, Y.; Wang, T.; Wang, D.; Chen, Y. Dynamic analysis of dynamic tax subsidy policy on the promotion of new energy vehicles—Two-party evolutionary game model based on government and consumer. South China J. Econ. 2024, 12, 44–68. (In Chinese) [Google Scholar] [CrossRef]
- Wei, X. Effects of double subsidies and consumers’ acceptability of remanufactured products on a closed-loop supply chain with trade-in programs. J. Clean. Prod. 2024, 447, 141565. [Google Scholar] [CrossRef] [Scilit]
- Fu, X.; Kang, W.; Wang, H.; Han, X. Eliciting consumer preferences for used vehicle e-commerce platforms: A discrete choice experiment approach. Res. Transp. Econ. 2025, 113, 101641. [Google Scholar] [CrossRef] [Scilit]
- Zhao, S.; Notteboom, T.; Kuang, H.; Jia, P.; Wan, M. Demand forecasting for strategic capacity planning in the NEV market: A hybrid Prophet-SRC framework with evidence from China. Res. Transp. Bus. Manag. 2026, 68, 101765. [Google Scholar] [CrossRef] [Scilit]
- Feng, X.; Li, Y.; Huang, B. Research on manufacturer’s investment strategy and green credit policy for new energy vehicles based on consumers’ preferences and technology adoption. Technol. Forecast. Soc. Change 2023, 191, 122476. [Google Scholar] [CrossRef] [Scilit]
- He, W.; Hao, X. Competition and welfare effects of introducing new products into the new energy vehicle market: Empirical evidence from Tesla’s entry into the Chinese market. Transp. Res. Part A Policy Pract. 2023, 174, 103730. [Google Scholar] [CrossRef] [Scilit]
- Hu, Y.; Yin, H.; Zhao, L. Subsidy phase-out and consumer demand dynamics: Evidence from the battery electric vehicle market in China. Rev. Econ. Stat. 2025, 107, 458–475. [Google Scholar] [CrossRef] [Scilit]
- Liu, Y.; Hu, Y.; Zheng, X. Effectiveness and efficiency of incentivizing policies for new energy vehicles: From the perspective of powertrain type. Transp. Res. Part A Policy Pract. 2025, 199, 104530. [Google Scholar] [CrossRef] [Scilit]
- Dua, R. China’s vehicle trade-in subsidy: Impact, cost-effectiveness, and barriers to electric vehicle purchase. Energy Sustain. Dev. 2026, 93, 102021. [Google Scholar] [CrossRef] [Scilit]
- Liu, Y.; Zhao, X.; Lu, D.; Li, X. Impact of policy incentives on the adoption of electric vehicle in China. Transp. Res. Part A Policy Pract. 2023, 176, 103801. [Google Scholar] [CrossRef] [Scilit]
- Zhao, X.; Li, X.; Jiao, D.; Mao, Y.; Sun, J.; Liu, G. Policy incentives and electric vehicle adoption in China: From a perspective of policy mixes. Transp. Res. Part A Policy Pract. 2024, 190, 104235. [Google Scholar] [CrossRef] [Scilit]
- Du, Y.; Guo, Z.; Bao, H. Smooth sailing ahead? Policy options for China’s new energy vehicle industry in the post-subsidy era. Energy Res. Soc. Sci. 2024, 107, 103359. [Google Scholar] [CrossRef] [Scilit]
- Lu, Y.; Peng, T.; Wang, L.; Ou, X.; Pan, X.; Zheng, Y.; Chen, Z. Tax incentives for new energy vehicles challenge road infrastructure break-even. Energy Econ. 2025, 146, 108521. [Google Scholar] [CrossRef] [Scilit]
- Wang, C.; Yin, Y.; Cai, J.; Hu, H. Regional heterogeneity and policy evolution of China’s new energy vehicle development: A multi-dimensional analysis based on dynamic time warping clustering and dual policy frameworks. Energy Policy 2026, 210, 115072. [Google Scholar] [CrossRef] [Scilit]
- Yao, B.; Li, C.; Huang, R. Study on the dynamic analysis of the evolutionary game and influence effect of green taxation in promoting the development of new energy industry. J. Compr. Bus. Adm. Res. 2026, 3, 19–27. [Google Scholar]
- Jreige, M.; Abou-Zeid, M.; Kaysi, I. Consumer preferences for hybrid and electric vehicles and deployment of the charging infrastructure: A case study of Lebanon. Case Stud. Transp. Policy 2021, 9, 466–476. [Google Scholar] [CrossRef] [Scilit]
- Zeng, S.; Ji, M.; Huang, X. An empirical study on the impact of tax incentives on the development of new energy vehicles: Case of China. Energy Policy 2025, 198, 114452. [Google Scholar] [CrossRef] [Scilit]
- Wang, F.; Wang, R. Government subsidies for sustainable vehicle replacement: Who moves first in NEV–GV manufacturers’ pricing and trade-in strategies? Sustainability 2026, 18, 5681. [Google Scholar] [CrossRef] [Scilit]
- Zhang, X.; Yuan, X.; Chen, J.; Gui, Y. Research on the trade-in pricing strategy for the electric vehicle manufacturer. J. Syst. Sci. Syst. Eng. 2025, 1–23. [Google Scholar] [CrossRef] [Scilit]
- Wang, Y.; Fan, R.; Lin, J.; Chen, F.; Qian, R. The effective subsidy policies for new energy vehicles considering both supply and demand sides and their influence mechanisms: An analytical perspective from the network-based evolutionary game. J. Environ. Manag. 2023, 325, 116483. [Google Scholar] [CrossRef] [Scilit]
- Liu, S.; Li, T.; Chen, Y.; Lyu, C.; Zhai, F. Government subsidy strategies for new energy vehicle charging infrastructure considering consumers’ low-carbon preference: A tripartite evolutionary game model. Energy Policy 2025, 205, 114688. [Google Scholar] [CrossRef] [Scilit]
- Ren, J. New energy vehicle in China for sustainable development: Analysis of success factors and strategic implications. Transp. Res. Part D Transp. Environ. 2018, 59, 268–288. [Google Scholar] [CrossRef] [Scilit]
- Nie, Y.; Ghamami, M.; Zockaie, A.; Xiao, F. Optimization of incentive polices for plug-in electric vehicles. Transp. Res. Part B Methodol. 2016, 84, 103–123. [Google Scholar] [CrossRef] [Scilit]
- Liu, Z. Impact of vehicle purchase tax exemption on electric vehicle sales: Evidence from China’s automotive industry. Energy Strategy Rev. 2023, 49, 101148. [Google Scholar] [CrossRef] [Scilit]
- Mao, H.; Zhang, Z. How can tax reduction policies improve quality and efficiency? empirical evidence from vehicle purchase tax reduction. Collect. Ess. Financ Econ. 2023, 39, 14–24. (In Chinese) [Google Scholar] [CrossRef]
- Shi, Z.; Cheng, J. How do government subsidies and consumers’ low-carbon preference promote new energy vehicle diffusion? Heliyon 2023, 9, e14327. [Google Scholar] [CrossRef] [Scilit]
- Yu, L.; Xu, H.; Zhang, Z. Tripartite evolutionary game analysis of supply chain low-carbon transformation considering the coupling of carbon tax and subsidy regulations. Manag. Decis. Econ. 2024, 45, 702–725. [Google Scholar] [CrossRef] [Scilit]
- Chakraborty, A.; Kumar, R.; Bhaskar, K. A game-theoretic approach for electric vehicle adoption and policy decisions under different market structures. J. Oper. Res. Soc. 2021, 72, 594–611. [Google Scholar] [CrossRef] [Scilit]
- Zhou, X.; Zhao, R.; Cheng, L.; Min, X. Impact of policy incentives on electric vehicles development: A system dynamics-based evolutionary game theoretical analysis. Clean Technol. Environ. Policy 2019, 21, 1039–1055. [Google Scholar] [CrossRef] [Scilit]
- Liu, D.; Feng, M.; Liu, Y.; Wang, L.; Hu, J. A tripartite evolutionary game study of low-carbon innovation system from the perspective of dynamic subsidies and taxes. J. Environ. Manag. 2024, 356, 120651. [Google Scholar] [CrossRef] [Scilit]
- Chen, W.; Hu, Z. Using evolutionary game theory to study governments and manufacturers’ behavioral strategies under various carbon taxes and subsidies. J. Clean. Prod. 2018, 201, 123–141. [Google Scholar] [CrossRef] [Scilit]
- Salahshour, M. Perceptual rationality: An evolutionary game theory of perceptually rational decision-making. R. Soc. Open Sci. 2025, 12, 251125. [Google Scholar] [CrossRef] [Scilit]
- Lu, X.; Yang, C.; Ma, W.; Yang, H. Evolutionary game analysis on governments and developers’ behavioral strategies: Impact of dynamic incentives for green building. Energy Build. 2025, 336, 115631. [Google Scholar] [CrossRef] [Scilit]
- Zhang, W.; Li, C.; Jia, T.; Wang, S.; Hao, Q.; Yang, J. Evolutionary game analysis of sustainable aviation fuel promotion. Energy 2025, 322, 135723. [Google Scholar] [CrossRef] [Scilit]
- Zhang, T.; Hong, C.; Kramberger, T.; Wang, Y. Integrating carbon tax and subsidies: An evolutionary game theory-based shore power promotional strategy analysis. Systems 2025, 13, 239. [Google Scholar] [CrossRef] [Scilit]
- Liu, C.; Huang, W.; Yang, C. The evolutionary dynamics of China’s electric vehicle industry—Taxes vs. subsidies. Comput. Ind. Eng. 2017, 113, 103–122. [Google Scholar] [CrossRef] [Scilit]
- Liu, C.; Liu, Z.; Li, W.; Xu, M. A time-delayed evolutionary game analysis of new energy vehicles development considering subsidy and carbon tax. Heliyon 2024, 10, e25667. [Google Scholar] [CrossRef] [Scilit]
- Sun, H.; Wan, Y.; Lv, H. System dynamics model for the evolutionary behaviour of government enterprises and consumers in China’s new energy vehicle market. Sustainability 2020, 12, 1578. [Google Scholar] [CrossRef] [Scilit]
- Friedman, D. On economic applications of evolutionary game theory. J. Evol. Econ. 1998, 8, 15–43. [Google Scholar] [CrossRef] [Scilit]
- Wang, H.; Yan, X.; Zhao, D.; Ge, L. Research on production-decision of automakers considering consumer’s low-carbon preference under the government reward-penalty mechanism. Syst. Eng.-Theory Pract. 2023, 43, 2669–2684. (In Chinese) [Google Scholar] [CrossRef]
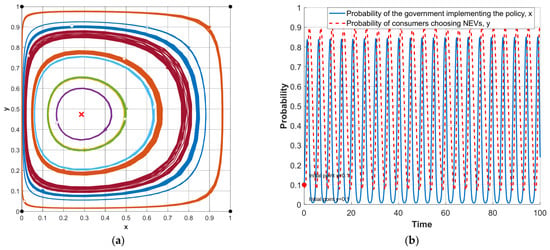
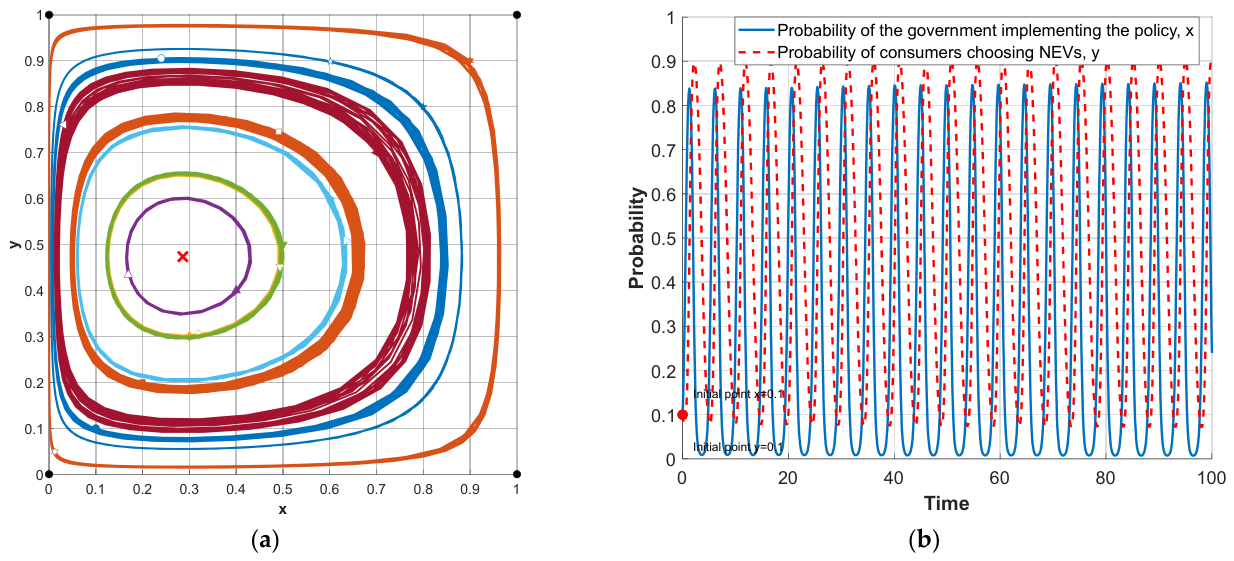
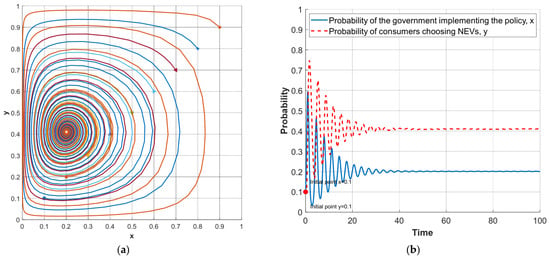
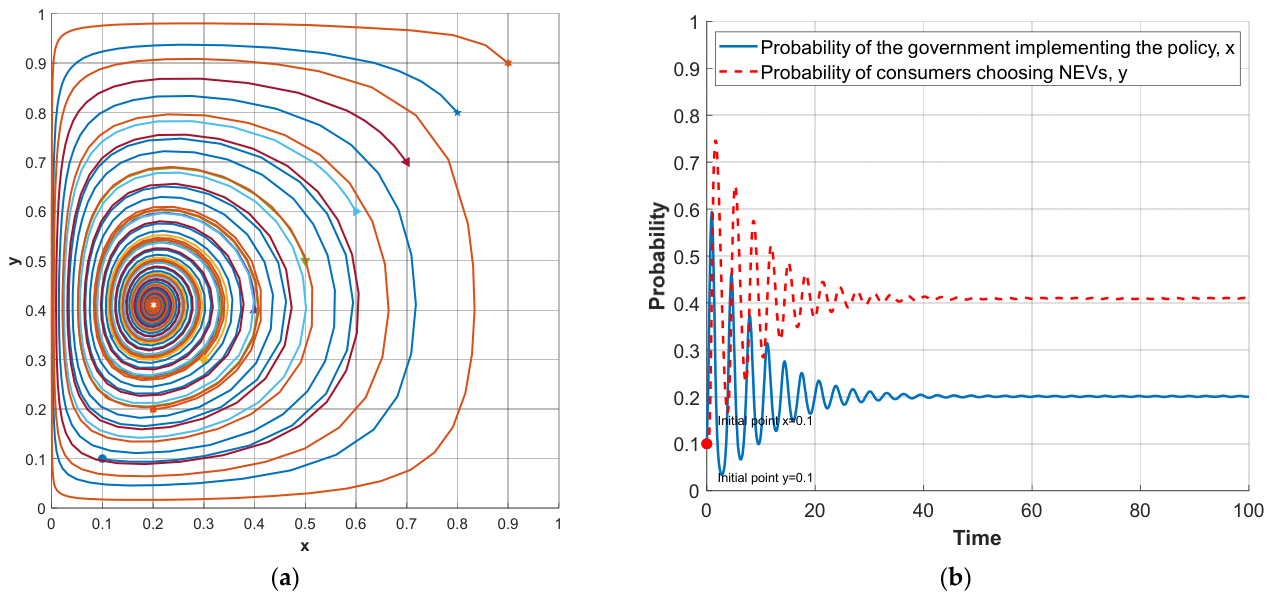
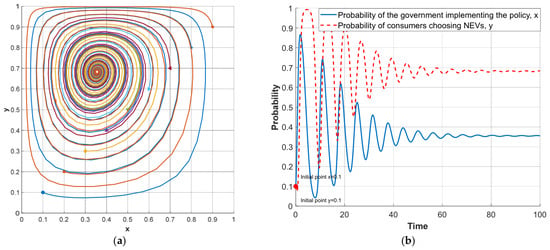
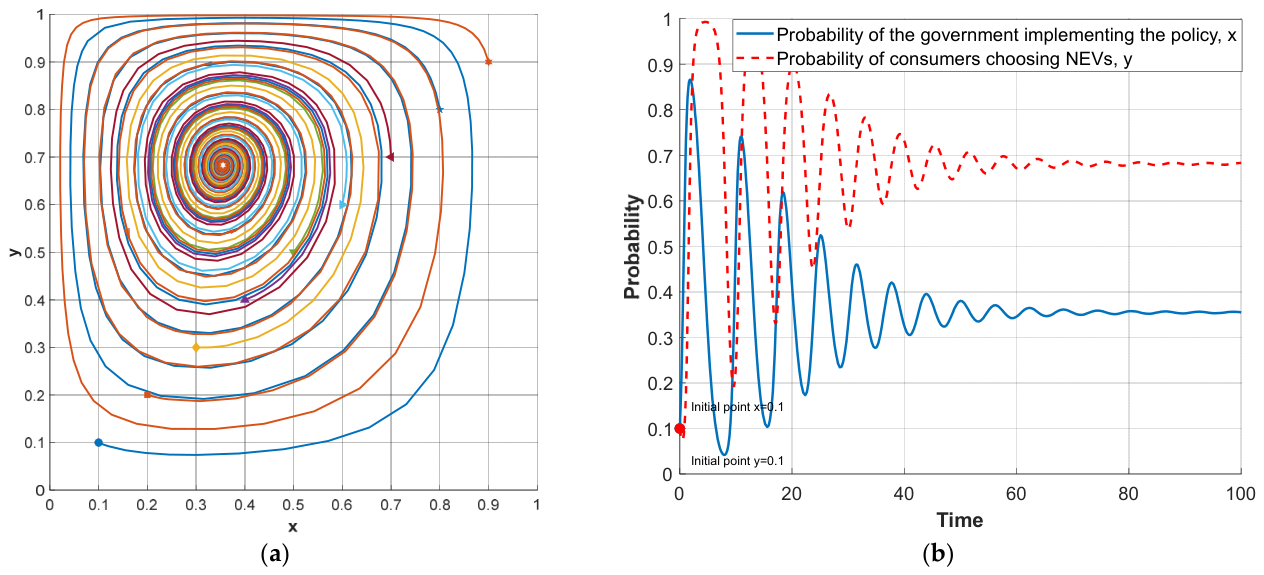
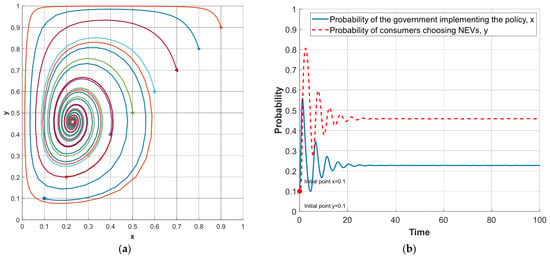
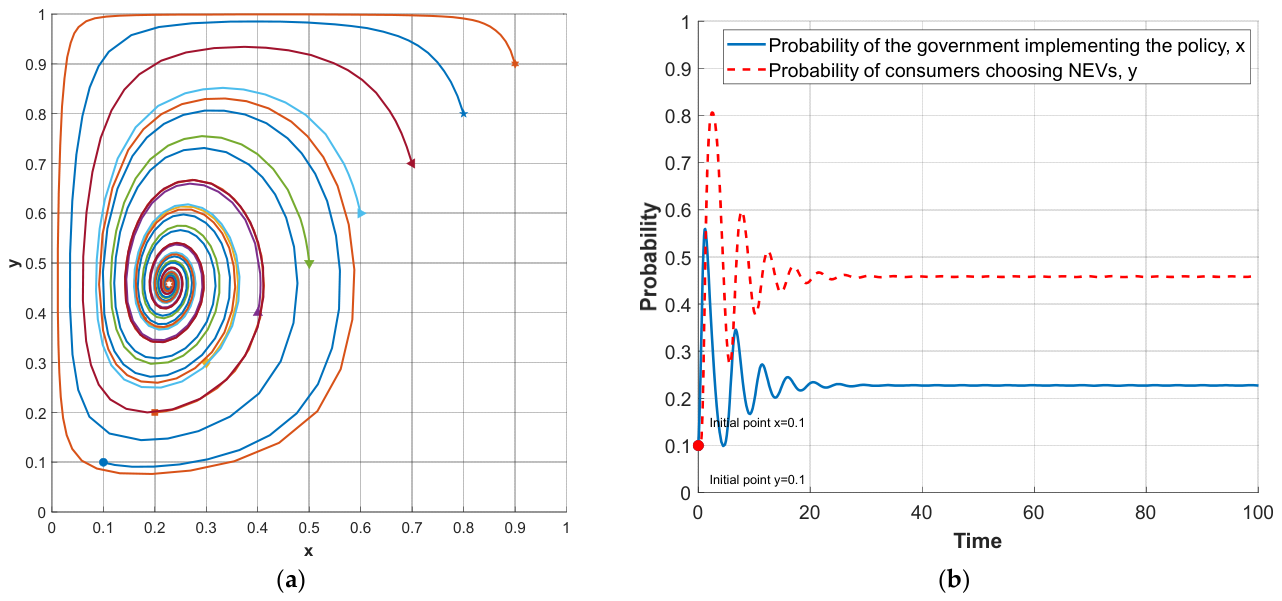
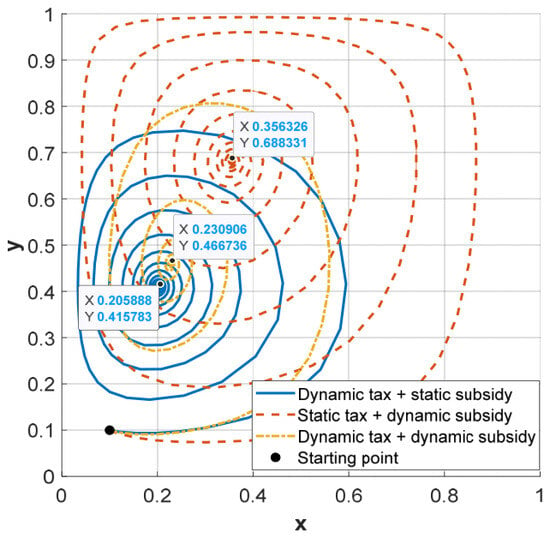
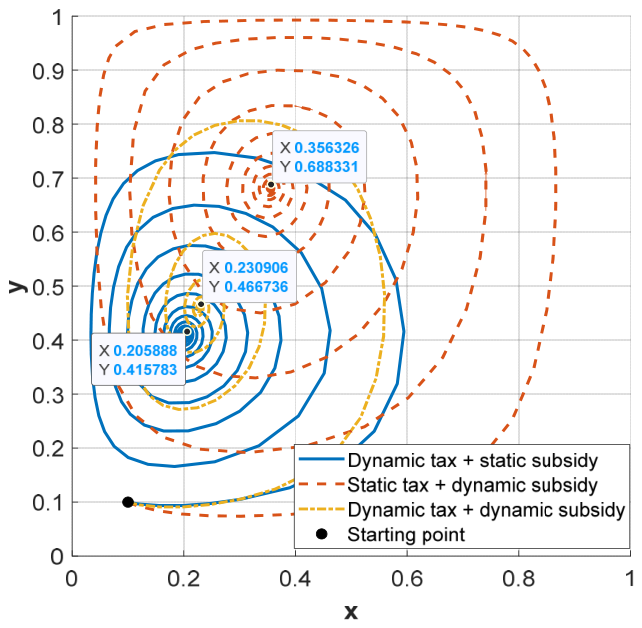
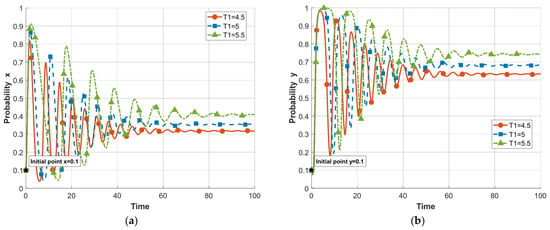
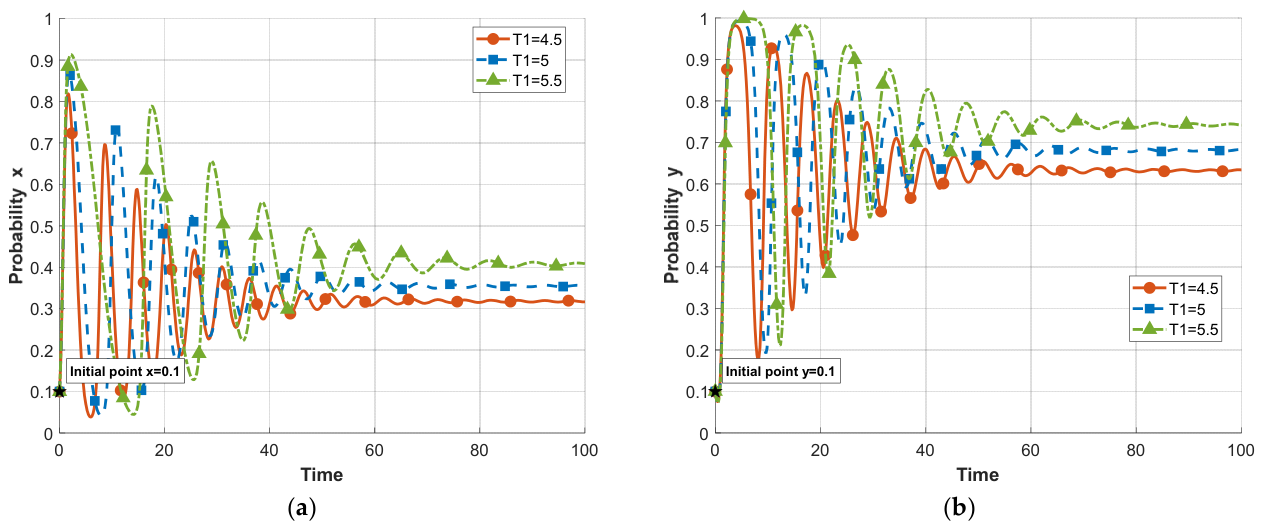
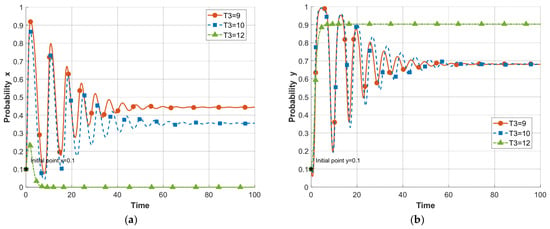
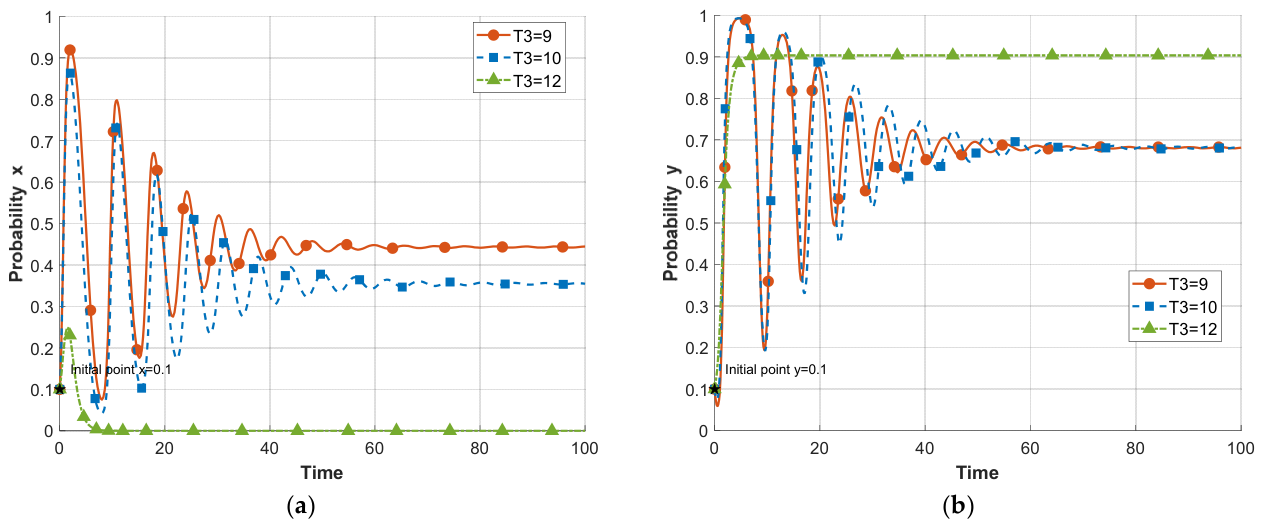
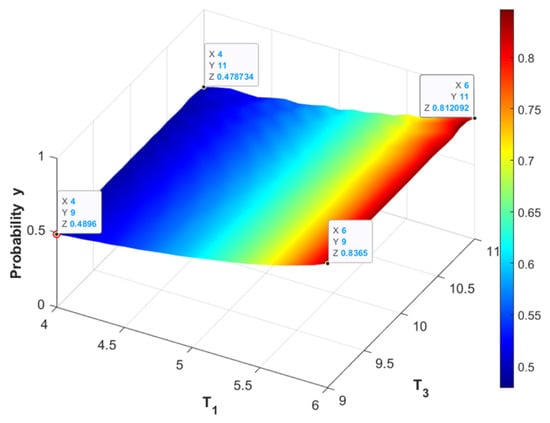
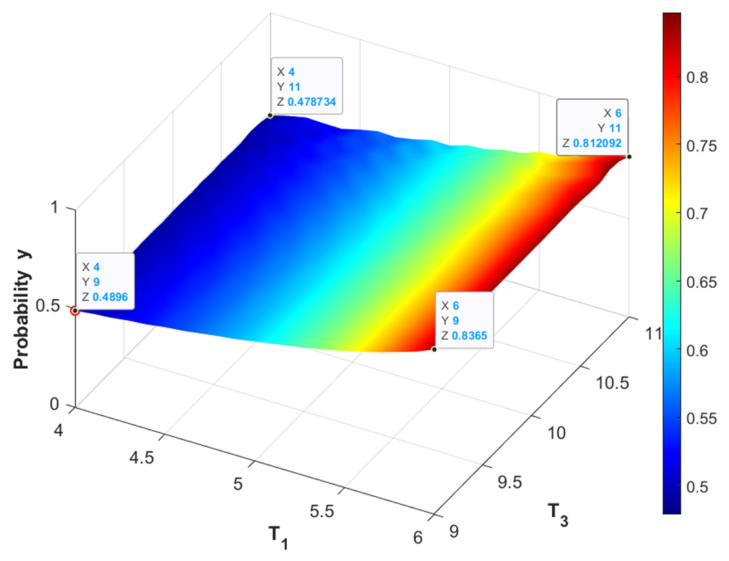
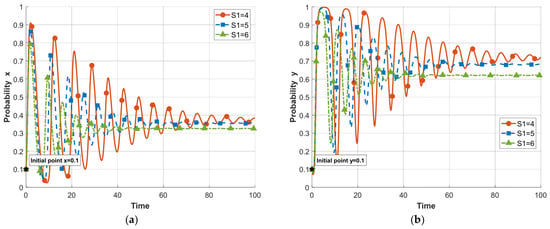
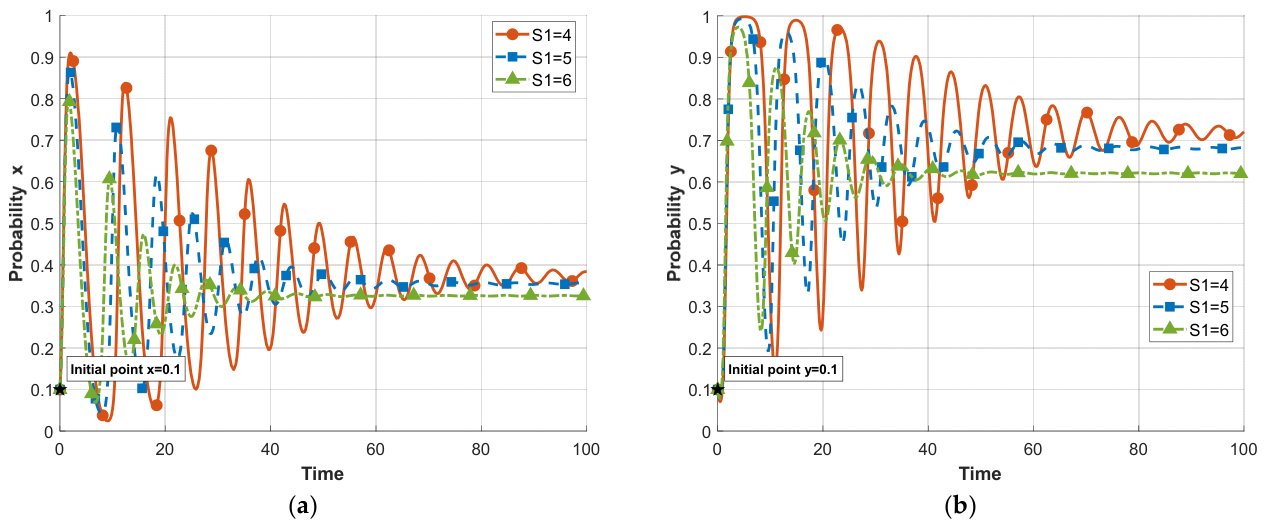
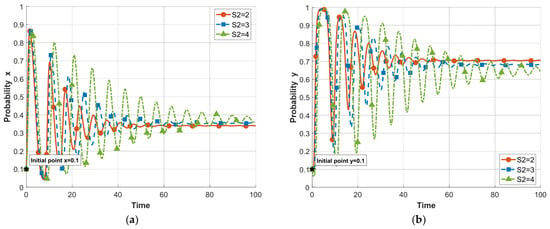
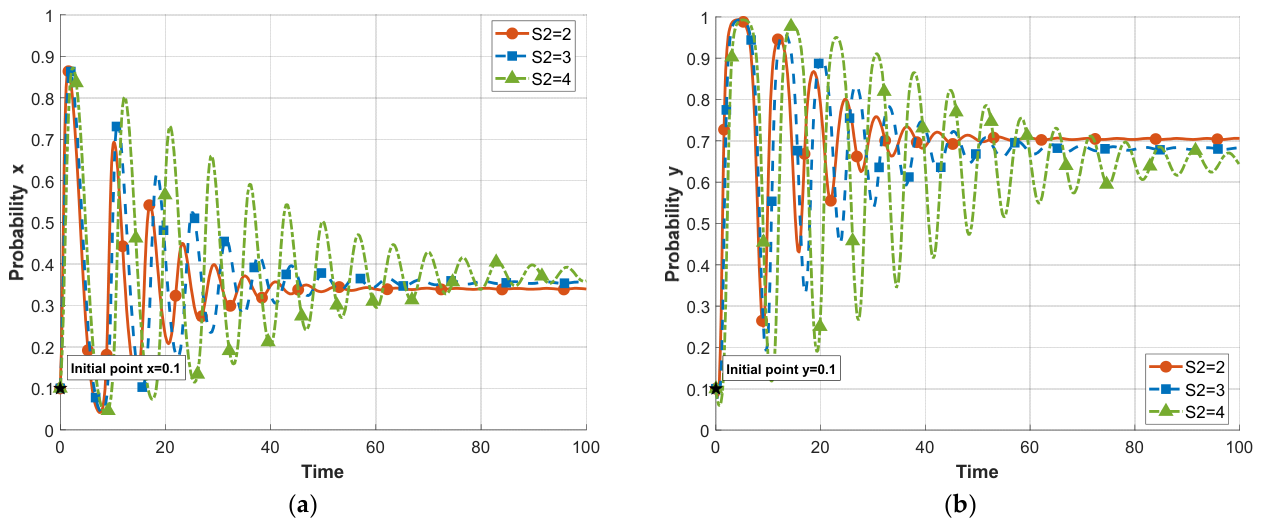
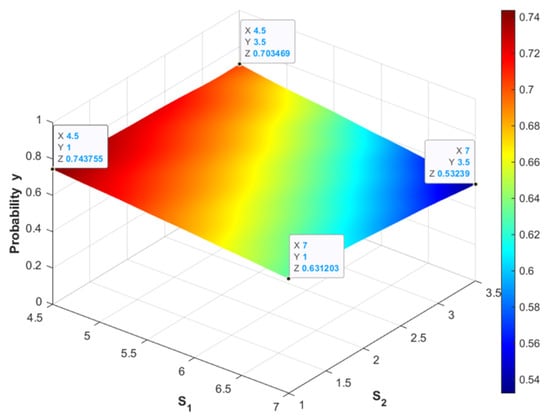
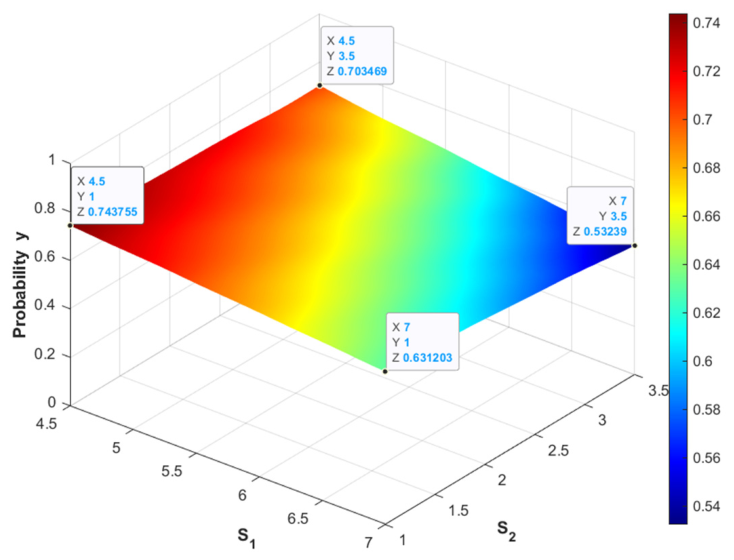
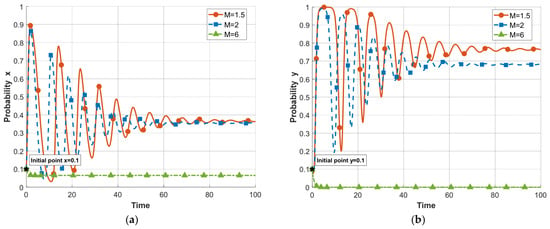
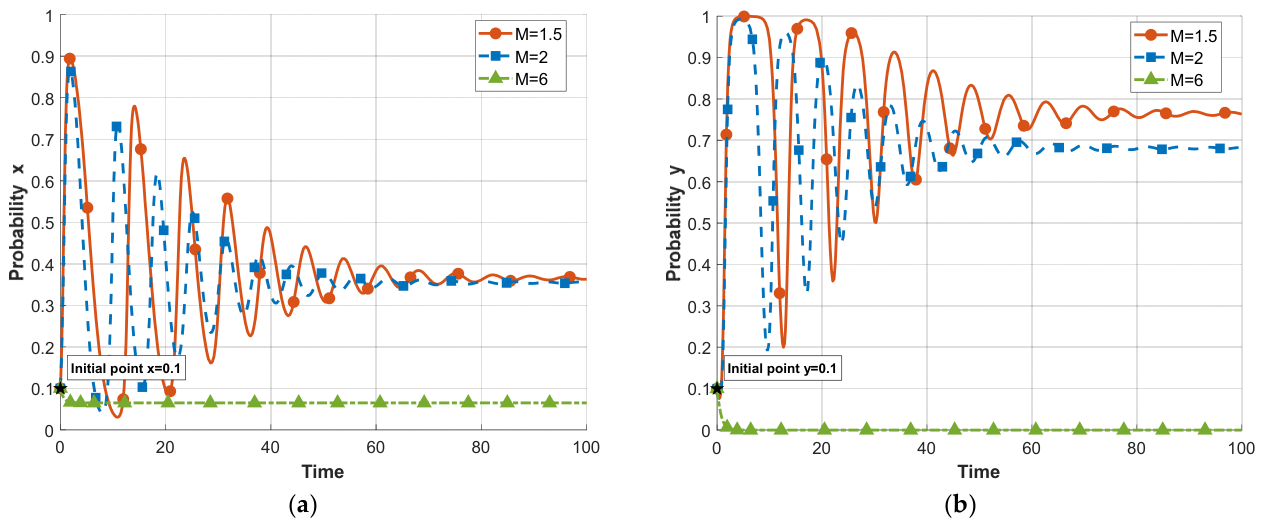
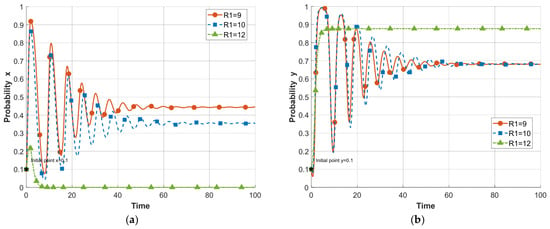
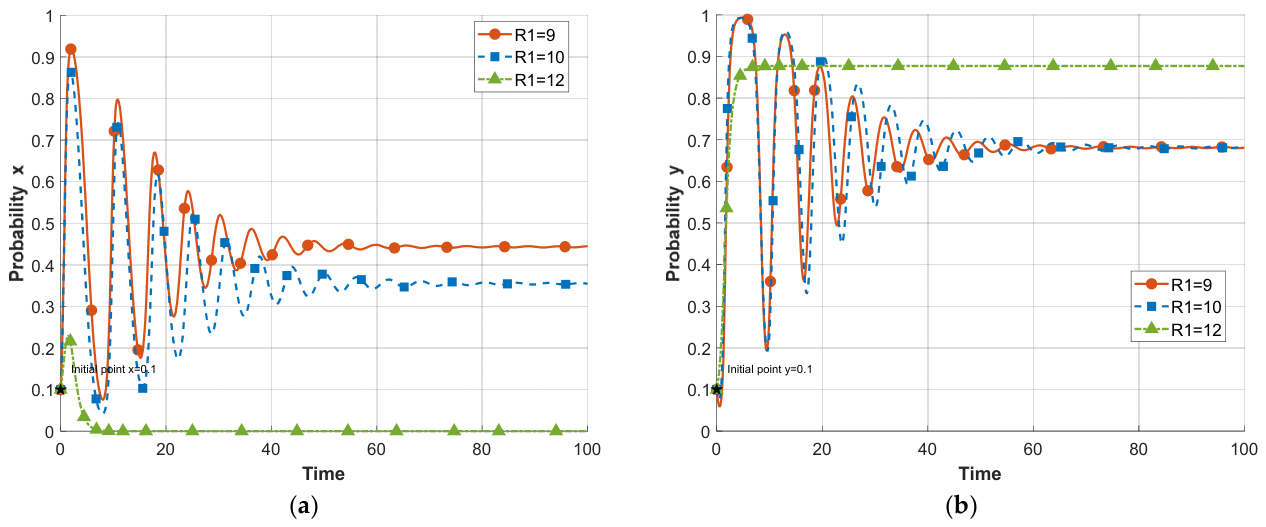
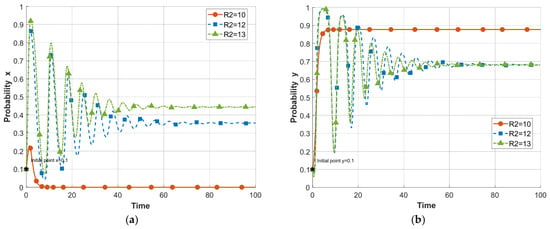
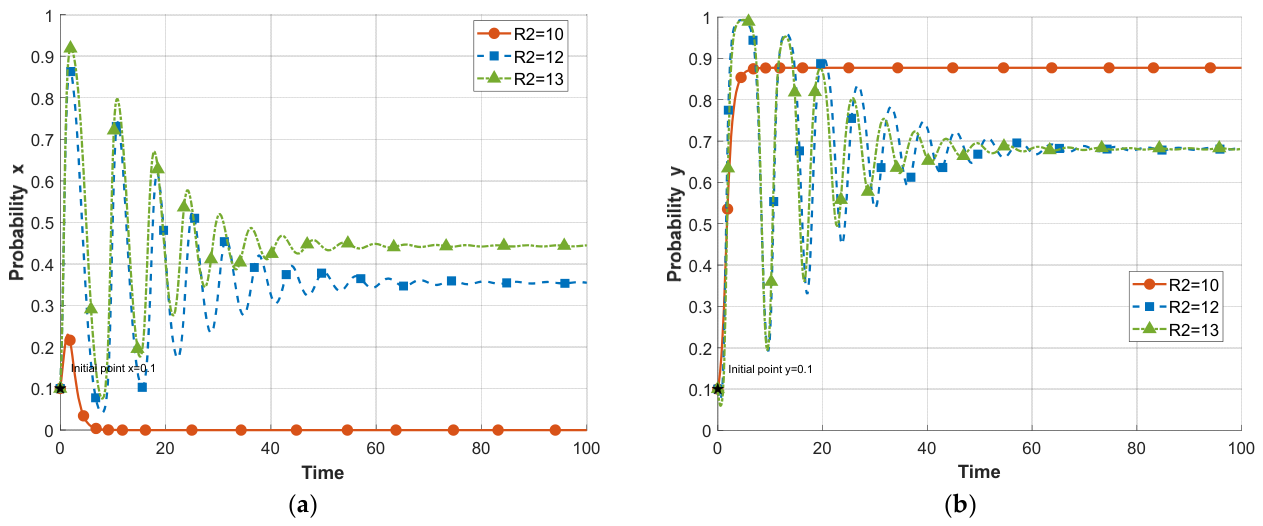

Disclaimer/Publisher’s Note: The statements, opinions and data contained in all publications are solely those of the individual author(s) and contributor(s) and not of MDPI and/or the editor(s). MDPI and/or the editor(s) disclaim responsibility for any injury to people or property resulting from any ideas, methods, instructions or products referred to in the content. |
© 2026 by the authors. Licensee MDPI, Basel, Switzerland. This article is an open access article distributed under the terms and conditions of the Creative Commons Attribution (CC BY) license.