


Highlights
Please indicate how your work links to systems science via your contributions to systems practice, theory, and/or methodology.
- The study builds a sociotechnical evaluation framework for service systems. The framework models the service quality of digital human guiding at heritage sites and measures it with six dimensions and 24 indicators.
- For systems practice, the study proposes a two-stage SEM and IPA pathway that moves from structural measurement to improvement diagnosis and identifies the subsystems and indicators that constrain overall service quality. With validation in other contexts, the approach may inform the evaluation of robotic reception, intelligent customer service, and similar systems.
What are the main findings and/or the implications of the main findings?
- Anthropomorphic performance (β = 0.294) and personalized service (β = 0.245) have the strongest structural paths to overall service quality, and all eight indicators under these two dimensions fall into the “high-importance, low-performance” quadrant. Lip-sync and voice matching and interest recognition are improvement priorities under every threshold and weighting scheme tested.
- Credibility assurance and system reliability are basic factors: overall service quality is rated significantly lower when they fail but not noticeably higher when they excel. Anthropomorphic performance and personalized service, in contrast, carry large penalties and rewards. The binding constraints of the system therefore lie in its least mature, expressive-adaptive layer.
Abstract
Existing evaluation tools do not fully capture the service characteristics of digital human guide systems at cultural heritage sites. Treating digital human guiding as a sociotechnical service system, this study develops a six-dimensional, 24-indicator service quality framework based on SERVQUAL, AI service quality scales, and interview data and validates it with survey data from 628 users at six cultural heritage sites in China. The two-stage analysis combines structural equation modeling (SEM) with importance-performance analysis (IPA), first examining the structural paths from each service quality dimension to overall service quality and then using the results to estimate indicator importance and identify improvement priorities. Anthropomorphic performance and personalized service have the strongest structural paths to overall service quality, with coefficients of 0.294 and 0.245, and all eight indicators within these two dimensions fall into the “high-importance, low-performance” quadrant. Credibility assurance and system reliability are basic factors: overall service quality is rated significantly lower when they fail but not noticeably higher when they excel. The dimensions were coupled across subsystems, and the binding constraints lie in the expressive-adaptive layer formed by anthropomorphic performance and personalized service. The framework offers a basis for evaluating digital human guide systems at cultural heritage sites in China and, subject to cross-context validation, other sociotechnical service systems.
1. Introduction
Digital humans combine computer graphics, natural language processing, and speech technologies to offer anthropomorphic appearance, two-way interaction, and personalized interpretation, and they are deployed at cultural heritage sites, museums, and historic districts [1,2]. Compared with human-guided tours and audio guides, they enable more flexible and interactive interpretation [3] and have performed well in cultural venues [4,5]. Because digital humans increasingly mediate the encounter between visitors and cultural heritage, their service quality bears on both visitor experience and the communication of heritage values, so smart heritage sites need a systematic way to evaluate it [6,7].
Digital human guiding is a multi-actor collaborative service. Under fluctuating visitor flows and complex on-site spatial conditions, visitors interact with digital humans through fixed devices or portable terminals. Site managers review content, deploy the system, and implement service standards; technology providers maintain avatar animation, voice interaction, and system operation; and curators and content teams build the knowledge base. Visitors are both users of the service and sources of feedback. Problems such as homogenized content, superficial interpretation of heritage values, semantic errors, response delays, and stiff avatar expression occur frequently [3,8], and neither isolated technical indicators nor conventional service evaluation can fully explain the actual performance of such services.
Accordingly, this study adopts a sociotechnical systems perspective. This perspective holds that the performance of a work system rests on the joint optimization of its social and technical components [9] and treats service systems as configurations of people, technology, organizations, and shared information [10]. Unlike a simple classification of quality dimensions, this perspective looks at how subsystems relate to one another and how multiple actors interact, and it treats service quality as an emergent outcome of the whole system. Digital human guiding is a typical sociotechnical service system in which people and intelligent technologies jointly deliver public cultural services, yet existing research has not established an evaluation framework suited to this type of system.
This study develops and validates a service quality evaluation framework for digital human guiding through an exploratory sequential mixed-methods design [11]. The study first collects first-hand data through interviews with visitors and site staff and codes the transcripts against SERVQUAL, the AI service quality scale AICSQ, and virtual digital human evaluation standards, which yields six core dimensions and 24 indicators: content quality, interaction responsiveness, anthropomorphic performance, credibility assurance, personalized service, and system reliability. A questionnaire survey then tests the framework with structural equation modeling (SEM), and importance–performance analysis (IPA) [12] converts the structural results into improvement priorities. We also test whether the designed subsystems hold up in visitors’ perceptions and whether poor and good performance affect overall ratings asymmetrically.
The study makes four contributions. Theoretically, it proposes a service quality evaluation framework suited to heritage sites, which extends service quality research from interpersonal services and online chatbots to embodied, on-site intelligent services. For systems research, it finds evidence for two mechanisms: the dimensions are coupled across the designed subsystem boundaries in visitors’ perceptions, and subsystem effects are asymmetric. Drawing on the theory of constraints [13], it locates the current constraints of the digital human guide system in the expressive-adaptive layer formed by anthropomorphic performance and personalized service. Methodologically, the study links scale validation to improvement diagnosis through SEM and IPA and shows which priorities are robust to alternative thresholds and weighting schemes. Practically, as disruptive technologies enter heritage tourism [14], it offers heritage site managers a measurement tool for selecting and optimizing digital human guide systems.
The remainder of the paper proceeds as follows. Section 2 reviews the literature and analyzes previous studies, Section 3 develops the evaluation framework and its sociotechnical system model, Section 4 describes the evaluation method, Section 5 reports the results, and Section 6 discusses the findings and concludes.
2. Literature Review
2.1. Service Quality Models and Their Extension to Intelligent Agents
Service quality research has developed a body of theoretical models and measurement instruments since the 1980s. Grönroos conceptualized perceived service quality as the comparison of expectations with perceptions and distinguished technical from functional quality [15]. Parasuraman et al. proposed the gap model and the SERVQUAL scale with five dimensions: tangibles, reliability, responsiveness, assurance, and empathy [16,17]. SERVPERF measures performance directly [18], and HISTOQUAL adapted service quality measurement to historic houses [19]. These studies established the paradigm of identifying service quality dimensions and revising instruments for specific contexts, but their analyses presuppose human service providers.
As artificial intelligence entered service settings, scholars began to examine the service quality of intelligent agents. Chen et al. developed AICSQ for frontline AI chatbots, covering semantic understanding, human–AI collaboration, anthropomorphism, continuous improvement, personalization, cultural adaptation, and efficiency [20]. Research on robotic services proposed robot service quality scales and SERVBOT [21,22] and examined how anthropomorphism and emotional expression shape perceived service quality [23,24]. Studies in tourism, hospitality, and digital commerce extended this work to digital humans, focusing on avatar design, appearance realism, communication style, authenticity, and attachment [25,26,27,28,29,30,31,32], and on AI disclosure, emotional design, service recovery, and human–AI relationships [33,34,35,36,37]. Across this literature, anthropomorphism shapes user responses, but most studies treat it as an inherent attribute of the agent rather than measuring it as a performance indicator of embodied service [38,39].
2.2. Intelligent Tour Guiding and Sociotechnical Service Systems
Research on intelligent tour guiding relates most directly to this study. It has examined how LLM-based chatbots and avatar guides influence engagement, experience, and learning in virtual museums [40], compared robot guides with mobile audio guides [41], and analyzed the culturally similar design [42] and language strategies [3] of virtual and AI guides. Industry standards for virtual digital humans add technical criteria for appearance, speech, motion, and interaction processing, but these criteria are not linked to visitor-perceived service quality.
Sociotechnical systems theory originated in a series of classic studies [43] and was later introduced into information systems research, where system failures are attributed to imbalances between technical and social subsystems [44]. Service science extends this idea and views service systems as configurations of people, technology, organizations, and shared information [10]. Recent work further defines AI systems as sociotechnical systems whose behavior emerges from interactions among technical artifacts, human actors, and institutional rules [45,46]. In service settings, AI and human actors have become interdependent resources in value co-creation [47].
2.3. Analysis of Previous Studies
Table 1 compares representative studies by context, design, and focus. The comparison reveals four limitations for evaluating digital human guiding at heritage sites.
Table 1.
Representative previous studies and their limitations for evaluating digital human guiding.
First, existing scales do not fit the context of digital human guiding at heritage sites. SERVQUAL and HISTOQUAL presuppose human service employees, and AICSQ targets text-based chatbots [48,49]. Second, most studies of intelligent guiding examine only how single factors, such as guide format or degree of anthropomorphism, relate to user experience and behavior [1,50], and technical specifications are not linked to visitors’ subjective perceptions. Third, the distinctive features of digital human guiding, anthropomorphic performance and heritage interpretation are usually subsumed under broad constructs such as tangibles or system quality [38,39], so it remains unclear how to measure them and how they relate to overall service quality. Fourth, none of these studies analyzes digital human guiding as a sociotechnical system, so the possible interdependence of its components goes unexamined.
3. Development of the Service Quality Evaluation System
The evaluation framework was developed in five steps: (1) deriving an initial framework on the theoretical basis of SERVQUAL, AICSQ, and virtual digital human evaluation standards (Section 3.1); (2) interviewing visitors and staff and coding the transcripts (Section 3.2); (3) mapping the resulting categories onto the initial framework and generating, screening, and validating indicators (Section 3.3); (4) finalizing the indicator system (Section 3.4); (5) integrating the dimensions into a sociotechnical system model for the empirical tests (Section 3.5).
3.1. Theoretical Foundation and Initial Framework
SERVQUAL provides a basic analytical framework for the complete service encounter. Tangibles correspond to the visual presentation of the digital human and its terminals, reliability to system stability and information accuracy, responsiveness to interaction efficiency, and assurance to the credibility of information [16,17]. AICSQ adds attributes specific to intelligent agents, mainly semantic understanding, personalization, anthropomorphism, and operating efficiency [20].
Neither scale fits digital human guiding directly. Digital humans deployed on site are embodied, and visitors judge their visual naturalness, lip synchronization, and movement [1,51]. Outdoor sites and dense crowds place additional demands on system stability. Heritage guiding further requires accurate knowledge, scene reconstruction, and cultural interpretation [8].
We therefore integrate three sources to build the framework. SERVQUAL supplies the dimensions that remain meaningful for a machine service agent (reliability, responsiveness, assurance, and tangibles); AICSQ supplies the capabilities of intelligent agents (semantic understanding, personalization, anthropomorphism, and efficiency); and the sociotechnical perspective specifies how the dimensions are organized and how they may be related. On this basis, we derive six candidate dimensions: content quality, interaction responsiveness, anthropomorphic performance, credibility assurance, personalized service, and system reliability.
3.2. Extracting User Needs from Visitor Interviews
We conducted semi-structured interviews with users of digital human guide systems at six cultural heritage sites: the Luoyang historic district, the Quanzhou historic district, the Archaeological Ruins of Liangzhu City, the Yungang Grottoes, the Summer Palace, and Gulangyu. The sites were selected purposively to cover three heritage types (historic building complex, archaeological site, and historic district) and three deployment modes (fixed large-screen, mobile portable, and hybrid). At every site, the digital human guide system had been in operation for at least ten months before fieldwork began. The systems at Liangzhu and Quanzhou were the earliest, launched in October 2023, and the system at the Summer Palace was the most recent, launched in May 2025.
3.2.1. Interview Design and Sample Composition
The six sites differed in heritage type, location, and deployment mode. Through maximum variation sampling, we interviewed 48 visitors who had completed a full digital human-guided experience, covering different visit frequencies, digital technology experience, travel modes, and heritage settings. We also interviewed 12 staff members responsible for the digital human guide systems, who supplemented the visitor accounts from the supply side. No demographic or personally identifiable information was collected from any participant.
Interviews were conducted on site and online between March and June 2026, lasted 40 to 60 min, and covered participants’ experience of the guide, sources of satisfaction and dissatisfaction, and expectations for improvement. Participants gave informed consent after being told the purpose of the study, the voluntary nature of participation, their right to withdraw, and the anonymization procedures, and they consented explicitly to audio recording. The transcripts contained about 520,000 Chinese characters. Table 2 summarizes the participants.
Table 2.
Profile of interview participants (N = 60).
3.2.2. Three-Level Coding and Extraction of Need Themes
We coded the transcripts in NVivo through open, axial, and selective coding. Before formal coding, 8 of the 60 transcripts were withheld for the saturation test. Two members of the research team coded the remaining transcripts independently.
In open coding, the two coders independently assigned initial concepts to every meaningful statement in the 52 analytic transcripts, retaining in vivo codes where possible, which produced 312 initial concepts. Concepts with overlapping meanings were merged, and concepts mentioned fewer than twice or expressed idiosyncratically were removed, which yielded 67 initial categories. Inter-coder agreement on the assignment of statements was Cohen’s κ = 0.83, and all disagreements were resolved by jointly rechecking the original transcripts.
In axial coding, the initial categories were related through the paradigm of conditions, actions, and consequences and integrated into 26 sub-categories, each corresponding to an evaluable service attribute.
In selective coding, “perceived service quality of digital human guiding at cultural heritage sites” was established as the core category, around which six main categories were formed. Figure 1 shows the complete data structure, and Appendix A lists all categories (Table A1) and coding examples (Table A2).
Figure 1.
Coding data structure.
Saturation was tested on the 8 withheld transcripts, which the two coders coded independently. All statements fit the existing 67 initial categories, 26 sub-categories, and 6 main categories, and no new concept, category, relationship, or boundary revision emerged.
3.3. Mapping Categories to Established Scales and Generating Indicators
3.3.1. Mapping Main Categories onto the Initial Framework
The six main categories obtained from coding were matched one to one with the six dimensions of the initial framework (Table A1). Interpretation content corresponded to content quality and added heritage knowledge accuracy and historical scene reconstruction, both of which shape visitors’ willingness to support cultural transmission [7,8]. The interaction process corresponded to interaction responsiveness and matched AICSQ’s semantic understanding and efficiency [20,51]. Because visitors paid attention to visual naturalness, lip synchronization, facial expression, and body movement, digital human image presentation became an independent dimension, anthropomorphic performance, whose indicators were refined with the appearance and movement criteria of evaluation standards [1,38,49,52,53]. Information credibility corresponded to credibility assurance and added consistency between the interpretation and the site’s official narrative [48]. Personalization fit corresponded to personalized service and added audience-specific interpretation levels and multilingual service [6]. System operation became system reliability, and we added adaptability to strong light, ambient noise, peak visitor flows, and other complex on-site conditions [4].
3.3.2. Generation, Screening and Expert Validation of Second-Level Indicators
Matching the 26 sub-categories against the items of SERVQUAL and AICSQ and the technical criteria of digital human evaluation standards produced 29 candidate indicators. Some sub-categories contained several distinct attributes and therefore yielded more than one indicator; for example, semantic understanding was split into recognition accuracy and dialect coverage. After screening, five candidates were removed, which produced the final evaluation system. The two supply-side candidates raised only by staff (maintenance responsiveness and knowledge-base updating) were folded into the outcome indicators that visitors experience directly (B1, B2, B21, and B23), because visitors cannot perceive or evaluate these back-office processes. Dialect coverage was merged into recognition of accents (B5) and dialect interpretation (B19) during semantic de-duplication. Screen visibility under strong light and speech-recognition stability in noisy environments were likewise merged into outdoor environmental adaptability (B22). Although the two sources of interference differ, both reflect the capacity of the system to operate under complex outdoor conditions, and interviewees usually described them as the same kind of usage problem, so separate indicators would have duplicated measurement and lengthened the questionnaire.
Each dimension ultimately retained a balanced structure of four indicators, which follows from the interview data. Five main categories each corresponded to four visitor-perceivable sub-categories, and system operation also contained four once its two supply-side sub-categories were folded (Table A1). The balanced structure also kept the questionnaire short [54].
Six experts in service management and heritage digitization rated the content relevance of every indicator on a four-point scale (1 = not relevant, 4 = highly relevant). Following Polit et al. [55], the item-level content validity index (I-CVI) is the proportion of experts rating an indicator 3 or 4, and an I-CVI of at least 0.83 was required, meaning that at least five of the six experts judged the indicator relevant. Scale-level criteria were also used, and the S-CVI/Ave, the mean I-CVI across the 24 indicators, was judged against a criterion of 0.90. The S-CVI/UA is the proportion of indicators rated relevant by all experts. We also report the modified kappa, which adjusts the I-CVI for chance agreement [55].
The content validity results were good. The I-CVI values ranged from 0.83 to 1.00, the S-CVI/Ave was 0.96, and the S-CVI/UA was 0.75; all modified kappa values ranged from 0.82 to 1.00 and exceeded 0.74, the threshold for excellent agreement (Table 3; raw ratings in Appendix B, Table A3). Finally, after incorporating the experts’ suggestions on wording, we finalized the names and descriptions of all indicators.
Table 3.
Service quality evaluation system for digital human guide systems at cultural heritage sites, with theoretical basis and content validity.
3.4. The Final Evaluation Indicator System
As shown in Table 3, the final system comprises six first-order dimensions: content quality (A1), interaction responsiveness (A2), anthropomorphic performance (A3), credibility assurance (A4), personalized service (A5), and system reliability (A6), each measured by four second-order indicators.
3.5. A Sociotechnical System Model of Digital Human Guiding
We organize the six dimensions into three designed subsystems (Figure 2). The interpretive knowledge subsystem comprises content quality and credibility assurance and defines what the digital human says and how credible it is. Interaction responsiveness and anthropomorphic performance make up the human–computer interface subsystem, which concerns how the service is delivered and experienced. The service support subsystem comprises personalized service and system reliability and ensures that the service is available and adapted to the needs of different visitors. This partition follows the supply-side division of labor among content teams, technology providers, and site managers and is a design-side hypothesis.
Figure 2.
Sociotechnical system model of digital human guiding at cultural heritage sites.
4. Evaluation Method Design
Following an exploratory sequential mixed-methods design [11], the qualitative and quantitative phases are linked in three ways. First, the interview categories define the constructs, and the questionnaire items operationalize the indicators derived from the interviews (Table A1 and Appendix D). Second, the interviews generate the propositions tested, and the logic that service failures cannot offset one another motivates the tests of subsystem coupling and asymmetric effects [56]. Third, the quantitative results are interpreted against the interview evidence. The two phases use independent samples. The analysis tests the measurement and structural models, derives implicit importance weights, tests the subsystem structure and asymmetric effects, and determines improvement priorities with IPA.
4.1. Structural Testing and Implicit Importance Estimation via SEM
Indicator weights are estimated from the structural model rather than obtained from visitors’ subjective ratings [57,58]. Confirmatory factor analysis tests the six-dimension measurement model; the structural model then estimates the structural paths from the dimensions to overall service quality, and three types of weights are derived from them: local weights of indicators, composite weights of dimensions, and global weights of indicators.
Both ways of obtaining importance have known limitations: stated importance discriminates poorly, whereas derived importance depends on variance, is sensitive to collinearity, and does not capture the intrinsic value visitors attach to an attribute [56,57,59]. We therefore distinguish the relative structural effect, implicit importance, and managerial importance. Section 5.6.2 compares the resulting priorities with those under six alternative weighting schemes. Overall service quality is the endogenous latent variable, measured by three global items distinct from the 24 indicators. The six dimensions are exogenous latent variables, each measured by four indicators. Drawing on SERVQUAL and AICSQ, we hypothesize that each of the six dimensions has a positive structural relationship with overall service quality (H1 to H6). The six dimensions are allowed to correlate, reflecting their interdependence within one service system [16,20].
Dimensions that already perform well may have little room for improvement, so their path coefficients may be small. The IPA therefore combines path coefficients with performance, and penalty–reward contrast analysis [60] tests this explanation. The main model contains direct effects only; indirect effects are examined in an alternative specification. Measurement errors are specified as independent; modification indices were inspected, but no error covariances were added. Section 5.4 compares the main model with four alternatives: (A) a second-order service quality factor model; (B) three second-order factors following the designed subsystems; (C) exploratory second-order factors following the strongest couplings among the dimensions; and (D) a full-mediation model. The partial-mediation version of D is equivalent to the main model and decomposes the effects with percentile bootstrap confidence intervals (1000 resamples).
4.1.1. Model Fit and Reliability and Validity Testing
Model fit is evaluated with χ2/df between 1 and 3, RMSEA and SRMR below 0.08 [61], and CFI, TLI, IFI, and NFI of at least 0.90. Cronbach’s α and composite reliability (CR) should be at least 0.70 and average variance extracted (AVE) at least 0.50. Discriminant validity requires the square root of each AVE to exceed the dimension’s correlations with other dimensions [62] and HTMT ratios below 0.85 [63]. Multicollinearity is assessed with variance inflation factors (VIFs) computed from composite scores and from the latent correlation matrix, with 3.3 as the cutoff [64]. Common method bias is assessed with Harman’s single-factor test, a single-factor confirmatory model, an unmeasured latent method construct, and full collinearity VIFs [64,65]. To avoid conducting exploratory and confirmatory analyses on the same data, the sample is randomly split into a calibration half for EFA and a validation half for CFA; the full sample is then used for the structural models.
4.1.2. Local Weights of Second-Level Indicators
Standardized factor loadings are extracted from the fitted model and normalized to obtain the local weight of each second-level indicator within its first-order indicator:
where summation runs over all second-level indicators under the th first-order indicator ( in this system), and . Because the dimensions are reflective, a loading indicates how well an indicator represents its dimension rather than its causal importance. In this system, the local weights vary within a narrow range (0.18–0.30), so global importance mainly reflects the structural effect of each dimension.
4.1.3. Composite Weights of First-Order Indicators
Standardized path coefficients from each first-order indicator to overall service quality are extracted and normalized to obtain composite weights :
where summation runs over all first-order indicators (), and . Paths that do not reach statistical significance are retained at their estimated values in the weight calculation rather than being removed or set to zero, for three reasons. First, a non-significant estimate is not evidence of a zero effect; the point estimate remains the best available estimate, whereas fixing it at zero imposes a constraint that the data do not support. Second, the evaluation system is intended for repeated assessment, and removing a dimension would assign zero weight to indicators whose content validity was established in Section 3.3.2. Third, correlated dimensions share explained variance, so a weak unique path can coexist with a substantial total contribution; we check this with relative weight analysis, which partitions the explained variance among correlated predictors [66]. The influence of the retained path on the diagnosis is examined in Section 5.6.2 by fixing it at zero and by re-estimating the model without credibility assurance.
4.1.4. Global Implicit Importance of Second-Level Indicators
Composite weights of first-order indicators are multiplied by local weights of second-level indicators to obtain the global implicit importance of each second-level indicator:
This measure reflects both an indicator’s contribution to its dimension and that dimension’s effect on overall service quality, and serves as the vertical axis of the IPA plot.
4.2. Diagnosis of Improvement Priorities via IPA
4.2.1. Measuring Performance
Performance is measured by perceived scores. A five-point Likert scale is used (1 = very dissatisfied, 5 = very satisfied), and the performance of indicator is the mean score across all valid respondents:
where is the valid sample size and is the rating given by respondent to indicator . To remove the influence of unequal sample sizes across sites, site means are weighted by their share of the valid sample at the aggregate level. The performance of a first-order dimension is the weighted mean of its second-level indicator performances using local weights .
4.2.2. Constructing and Reading the Quadrants
The IPA plot places global implicit importance on the vertical axis and performance on the horizontal axis, with the grand means as crosshairs [12]. Quadrant I (“Keep Up the Good Work”) contains high-importance, high-performance strengths. Quadrant II (“Concentrate Here”) contains high-importance, low-performance priorities. Quadrant III (“Low Priority”) contains low-importance, low-performance indicators. Quadrant IV, labeled “Possible Overkill” in the original IPA, contains high-performance, low-importance indicators. Because these may be basic requirements rather than overprovided resources, we label it “Maintain Standards” and interpret it with the asymmetry results [67].
4.2.3. Robustness and Group Comparison
Robustness is assessed in two ways. First, quadrant assignments are compared under the mean, median, and scale-midpoint crosshair criteria [57]. Second, the SEM-based weights are compared with six alternative schemes, including fixing the non-significant path at zero, dimension weights from relative weight analysis [66], item-level correlations, item-level relative weights, item-level partial correlations [57,59], and re-estimation without credibility assurance, using Spearman rank correlations, quadrant stability, and membership of Quadrant II.
5. Results and Analysis
5.1. Questionnaire Design and Data Collection
The questionnaire data were collected independently of the interviews, from different participants and in a later period, so that indicator development and model validation rely on separate datasets [65].
The questionnaire (Appendix D) had three sections. The first recorded usage context: the site visited, the deployment mode, prior use of digital human guides, experience with intelligent voice-enabled products, annual heritage visits, and travel mode. The second contained 24 items corresponding to the 24 indicators, rated from 1 (very dissatisfied) to 5 (very satisfied). The third contained three global items measuring overall service quality. The questionnaire was anonymous and did not collect demographic information such as gender, age, or education, in order to minimize the collection of personal data in an on-site intercept survey.
Three faculty members specializing in service management, five interpretation managers at heritage sites, and 20 visitors pretested the questionnaire, and ambiguous wording was revised [54]. The five-point format is widely used in service quality research [16,18], limits respondent burden, and provides a theoretical midpoint for the IPA robustness analysis [12].
The survey was conducted from 23 July to 5 August 2026. On site, researchers invited visitors who had just finished using a digital human guide to scan a QR code and complete the questionnaire on Wenjuanxing, an online survey platform. Online, the questionnaire was distributed through the same platform, and respondents were retained only if they correctly identified the site they had visited and the deployment mode and named at least one guide function they had actually used. Each respondent who completed the questionnaire and passed verification received a cash incentive of CNY 3. The first page presented an informed consent statement, and respondents could proceed only after giving consent. Of 642 questionnaires received (379 on-site and 263 online), we removed 14 that were completed in less than 180 s, gave identical answers to all 24 items, or came from respondents who had not used a digital human guide, which left 628 valid questionnaires (377 on-site and 251 online; valid response rate 97.8%). Each site contributed 102 to 108 questionnaires (16.2% to 17.2%). On-site and online respondents did not differ significantly on any dimension (independent-samples t tests, all p > 0.05). The mean differences were at most 0.03: content quality 3.84 and 3.81, interaction responsiveness 3.56 and 3.55, anthropomorphic performance 3.09 and 3.06, credibility assurance 3.68 and 3.67, personalized service 3.03 and 3.00, and system reliability 3.50 and 3.48. The two groups were therefore pooled. Table 4 presents the usage-context profile.
Table 4.
Usage-context profile of the questionnaire sample (N = 628).
The sample covered visitors with both high and low technology-use experience; 57.8% were first-time users of digital human guides, and each heritage type and deployment mode had at least 158 respondents. Because the questionnaire was anonymous, visitor differences are characterized by these contextual variables.
5.2. Descriptive Statistics, Reliability and Validity
Appendix C (Table A4) reports the descriptive statistics for the 24 items. Mean perceived performance scores ranged from 2.87 to 4.21, with an overall mean of 3.44, and the mean of overall service quality was 3.69. Skewness (−1.27 to 0.00) and kurtosis (−0.90 to 1.91) meet the conventional requirements for maximum likelihood estimation, |skewness| < 2 and |kurtosis| < 7.
The highest-rated indicators were B1, B21, B2, and B6 (3.96–4.21), whereas the lowest-rated were B20, B10, B19, and B24 (2.87–3.02), which also showed the largest dispersion (SD = 1.16–1.19). At the dimensional level, content quality recorded the highest mean (3.83), followed by credibility assurance (3.68), interaction responsiveness (3.56), system reliability (3.49), anthropomorphic performance (3.08), and personalized service (3.02), a pattern consistent with the main issues identified in the interviews.
The reliability analysis produced a Cronbach’s α of 0.913 for the 24-item service quality scale and 0.906 for the three-item overall service quality scale, both above the threshold of 0.70. The Kaiser–Meyer–Olkin (KMO) measure was 0.917, and Bartlett’s test of sphericity was significant (p < 0.001), indicating that the data were suitable for factor analysis. In Harman’s single-factor test, the first unrotated factor explained 34.15% of the total variance, and a single-factor model fitted poorly, clearly worse than the seven-factor measurement model. Full collinearity VIFs for the six dimensions and overall service quality ranged from 1.47 to 2.34, below 3.3 [64], indicating no serious collinearity.
5.3. Validation of the Indicator System
5.3.1. Exploratory Factor Analysis on the Calibration Subsample
The sample was randomly split into a calibration half (n = 314) and a validation half (n = 314). In the calibration half (KMO = 0.911; Bartlett’s χ2 = 3854.2, p < 0.001), maximum likelihood EFA with oblimin rotation yielded six eigenvalues above one (8.35 to 1.13), and the six-factor solution reproduced the proposed structure: every indicator loaded most strongly on its intended factor (0.41 to 0.84; Appendix C, Table A6), and the largest cross-loading was 0.33 (B11 on personalized service). Parallel analysis based on principal components suggested three factors, and the three-factor solution grouped the dimensions exactly into the three layers examined in Section 5.5. We retained the six-factor solution because it matched the theoretical structure, met the eigenvalue criterion, was confirmed by CFA, and is needed for dimension-level diagnosis.
5.3.2. Confirmatory Factor Analysis
In the validation half, the measurement model fitted well (χ2 = 484.02, df = 303, χ2/df = 1.597, CFI = 0.961, TLI = 0.955, RMSEA = 0.044), with standardized loadings from 0.556 to 0.898, CR from 0.817 to 0.863, and AVE from 0.534 to 0.615. The full-sample measurement model also fitted well (χ2 = 634.24, df = 303, χ2/df = 2.093, CFI = 0.964, TLI = 0.958, NFI = 0.934, RMSEA = 0.042, SRMR = 0.044). Standardized factor loadings range from 0.525 to 0.896 and, apart from B16, all exceed 0.6, which is acceptable. Reliability and convergent validity by dimension are reported in Table 5.
Table 5.
Reliability, convergent validity, and discriminant validity of the measurement model.
Cronbach’s α (0.805 to 0.850) and CR (0.812 to 0.854) exceed 0.70, and AVE (0.527 to 0.598) exceeds 0.50 (Table 5). The square root of AVE (0.726 to 0.774) exceeds all inter-dimension correlations, satisfying the Fornell–Larcker criterion [62], and all HTMT ratios (0.303 to 0.674) are below 0.85 [63], so even the highest correlations, between anthropomorphic performance and personalized service (0.696), content quality and credibility assurance (0.684), and interaction responsiveness and system reliability (0.678), do not compromise discriminant validity. VIFs range from 1.44 to 1.89 based on composite scores and from 2.00 to 2.49 based on latent correlations, all below 3.3 [64].
5.4. Structural Model and Implicit Importance
The structural model specifies overall service quality, measured by the three global items, as the endogenous latent variable predicted by the six dimensions (Figure 3).
Figure 3.
Structural equation model at the latent level with standardized path coefficients.
Path estimates and hypothesis tests are reported in Table 6. The standardized coefficients are 0.294 for anthropomorphic performance, 0.245 for personalized service, 0.175 for interaction responsiveness, 0.156 for system reliability, 0.107 for content quality and 0.082 for credibility assurance. The first four are significant at the 0.01 level and content quality is significant at the 0.05 level, supporting H1, H2, H3, H5 and H6. Credibility assurance (z = 1.687, p = 0.092) does not reach significance at the 0.05 level, so H4 is not supported. The six dimensions jointly explain 67.1% of the variance in overall service quality (R2 = 0.671).
Table 6.
Standardized path coefficients and hypothesis testing.
Content quality had a significant but small path (0.107) and credibility assurance a non-significant one, although both had the highest performance scores (3.83 and 3.68; Table A4). Section 5.5 shows that diminishing returns explain this pattern for credibility assurance and system reliability but not for content quality. The two knowledge dimensions are also strongly correlated (0.684), so their unique paths understate their joint contribution.
Because all relations among the latent variables are included, the structural model is saturated at the latent level, and its fit is χ2 = 634.24, df = 303, χ2/df = 2.093, CFI = 0.964, TLI = 0.958, RMSEA = 0.042, and SRMR = 0.044 (Table 7). All six paths are positive and smaller than the latent correlations with overall service quality (0.469 to 0.685), so there is no evidence of suppression. The contribution of the knowledge dimensions was split differently in the two random halves: β = 0.028 for content quality and 0.149 for credibility assurance in the calibration half, and 0.200 and 0.015 in the validation half. Anthropomorphic performance (0.235 and 0.316) and personalized service (0.258 and 0.241) remained strong in both halves.
Table 7.
Fit of the structural model and alternative specifications (N = 628).
Table 7 compares the main model with the alternative specifications. The second-order service quality model (A) fitted worse (Δχ2 = 251.48, Δdf = 14, p < 0.001), so the dimensions cannot be reduced to a single general factor. The designed three-subsystem model (B) also fitted poorly (Δχ2 = 92.53, Δdf = 9, p < 0.001) and produced an inadmissible correlation of 1.19 between the interface and support subsystems. The empirical three-layer model (C) fitted almost as well as the main model (CFI = 0.963, RMSEA = 0.042, SRMR = 0.046; Δχ2 = 19.41, Δdf = 9, p = 0.022), with the effect of the expressive-adaptive layer (β = 0.566, p < 0.001) larger than those of the operational and knowledge layers. The full-mediation model (D) was rejected (Δχ2 = 60.93, Δdf = 4, p < 0.001), so the main model with six direct effects was retained.
The partial-mediation version of Model D, which is statistically equivalent to the main model, decomposes the effects of the knowledge and support dimensions into direct effects and indirect effects through the interface dimensions. Personalized service had a substantial indirect effect (0.240, 95% CI [0.174, 0.312]), mainly through anthropomorphic performance (path 0.626), and its total effect (0.485) was the largest of all dimensions. System reliability had a significant indirect effect (0.098, 95% CI [0.041, 0.164]), mainly through interaction responsiveness (path 0.451). Content quality had a small indirect effect (0.048, 95% CI [0.005, 0.099]). The indirect effect of credibility assurance was not significant (0.022, 95% CI [−0.024, 0.070]).
Following Equations (1)–(3), the path coefficients were normalized into dimension weights, the loadings into local weights, and their products into the global implicit importance of the 24 indicators. Table 8 reports these values with the loadings, performance scores, and IPA quadrants.
Table 8.
Loadings, weights, performance, and IPA quadrants of the 24 indicators.
Anthropomorphic performance (0.2776) and personalized service (0.2314) together received more than half of the total weight, whereas credibility assurance received the lowest (0.0774). B10 (0.0766), B11 (0.0741), and B9 (0.0689) had the highest global importance, and B16 (0.0142) the lowest.
5.5. Subsystem-Level Analysis
5.5.1. Coupling Among Subsystems
The designed subsystems are not modular in visitors’ perceptions. The designed three-subsystem model was rejected because of an inadmissible estimate, indicating that visitors do not distinguish the human–computer interface subsystem from the service support subsystem. The latent correlations show where the coupling lies: anthropomorphic performance correlates more strongly with personalized service than with interaction responsiveness, and interaction responsiveness correlates more strongly with system reliability than personalized service does. On this basis, we derive a three-layer structure of knowledge, operational, and expressive-adaptive layers, which fit almost as well as the six-dimension model and was supported by the exploratory factor analysis. The knowledge layer comprises content quality and credibility assurance and concerns whether the interpretation is accurate and credible; the operational layer comprises interaction responsiveness and system reliability and concerns whether the system responds promptly and stably; and the expressive-adaptive layer comprises anthropomorphic performance and personalized service and concerns whether the digital human presents itself in a human-like way and adapts to different visitors. The knowledge layer coincides with the original interpretive knowledge subsystem. The mediation analysis confirms the same coupling: the associations of personalized service and system reliability with overall service quality run largely through indirect paths via anthropomorphic performance and interaction responsiveness. Technical functions are perceived together with the underlying infrastructure, and the human-like image is perceived together with personalized adaptation.
5.5.2. Asymmetric Effects of Dimensions
Credibility assurance and system reliability showed the pattern of basic factors. Bottom-quartile visitors rated overall service quality significantly lower (penalties of −0.151, p = 0.029, and −0.366, p < 0.001), whereas top-quartile visitors did not rate it significantly higher (rewards of 0.065 and 0.029, n.s.; Table 9). System reliability also had a significant negative quadratic term (b = −0.103, p < 0.001).
Table 9.
Penalty–reward contrast analysis of the six dimensions.
Content quality showed the pattern of an excitement factor. Its reward (0.188, p = 0.005) was larger than its penalty (−0.133, p = 0.055), and there was no quadratic effect, so its small path cannot be attributed to saturation. Interaction responsiveness, anthropomorphic performance, and personalized service had significant penalties and rewards, the largest penalties being those of personalized service (−0.449) and anthropomorphic performance (−0.358). The classification was unchanged when groups were defined by composite scores below 3 and at or above 4.
Together with the coupling results, these findings suggest that the binding constraints of the system currently lie in the expressive-adaptive layer. In this layer, penalties and rewards are both large and performance is lowest. Credibility and reliability, in contrast, appear as thresholds that must be maintained but yield little additional return.
5.6. Diagnosis of Improvement Priorities
Performance values (Equation (4)) were paired with the global importance values in Table 8, and their grand means (3.442 and 0.0417) served as crosshairs (Figure 4).
Figure 4.
Importance–performance analysis of the 24 s-level indicators.
5.6.1. Quadrant Composition
Quadrant II (“Concentrate Here”) contains nine indicators, namely all four indicators of anthropomorphic performance (B9 to B12), all four indicators of personalized service (B17 to B20), and B7, multi-turn dialogue coherence, which lies close to the thresholds. Eight of the nine thus belong to the expressive-adaptive layer. B10, lip-sync and voice matching, combines the highest importance (0.0766) with a performance of only 2.94, and B20, interest recognition, has the lowest performance of all indicators (2.87). Quadrant I (“Keep Up the Good Work”) contains only B5, semantic understanding accuracy, whose importance and performance slightly exceed the thresholds. Quadrant III (“Low Priority”) contains B4, B8, B15, B22, and B24, which perform below average but have limited marginal effects, and B8 and B22 lie close to the importance threshold. Quadrant IV contains B1, B2, B3, B6, B13, B14, B16, B21, and B23. We label it “Maintain Standards” rather than “Possible Overkill” because the asymmetry results show that its credibility and reliability indicators (B13, B14, B16, B21, and B23) are basic requirements, for which strong performance adds little but failure is associated with substantially lower overall evaluations [48].
5.6.2. Robustness and Tiered Priorities
Under the median thresholds (0.0392 and 3.345), 20 of 24 indicators (83.3%) kept their quadrant. B8 and B22 moved from Quadrant III to II, B7 from II to I, and B4 from III to IV, all of them close to the thresholds [57,67]. Adding the scale midpoint of 3.0 as the performance threshold, only 13 indicators (54.2%) kept their quadrant under all three criteria, mainly because indicators scoring between 3.0 and 3.4 moved to the high-performance side. We use the mean-based partition as the primary basis because it reflects the relative position of indicators in the sample.
Appendix C (Table A7) compares the SEM-based importance with six alternative weighting schemes. Fixing the credibility path at zero left 22 of 24 indicators in the same quadrant (91.7%), with only B8 and B22 moving from Quadrant III to II. Re-estimating the model without credibility assurance changed the other paths only slightly (R2 = 0.668 against 0.671) and left 20 indicators unchanged (ρ = 0.949), adding B22 and B24 to Quadrant II. Dimension weights from relative weight analysis gave nearly identical priorities (ρ = 0.966). Under this scheme, credibility assurance accounted for 9.9% of the explained variance, slightly more than content quality (8.9%), which supports retaining its path.
These results distinguish three tiers of priority with different implications for resource allocation. Tier 1 comprises B10 and B20, which remain in Quadrant II under every threshold and weighting scheme; they warrant immediate investment. Tier 2 comprises B9, B11, B17, and B18, which remain in Quadrant II under the mean and median thresholds and all weighting schemes but not under the scale midpoint; they are the next priorities. Tier 3 comprises indicators whose classification depends on analytic choices: B19 (robust to thresholds but not to item-level weighting), B12 (robust to the mean and median thresholds but not to item-level weighting), B7 (robust to weighting but not to the median threshold), and B8, B22, and B24, which enter Quadrant II only under some specifications. For Tier 3 indicators, low-cost improvements, monitoring, and piloting are more appropriate than major investment.
5.7. Group Comparison
Subgroup models by heritage type and deployment mode are reported in Appendix C (Table A8). Anthropomorphic performance had one of the three largest path coefficients in every subgroup and the largest in three of the six. One-way ANOVA of indicator performance found few significant between-group differences: B3 across heritage types, B17 across deployment modes, and personalized service and B19 across levels of technology experience. This suggests that the main weaknesses may share common features across contexts [68].
5.8. Optimization Strategies
The optimization strategies follow the priority tiers in Section 5.6.2. Each strategy has two parts: the improvement priority, which follows from the results of this study, and the implementation measures, which draw on existing research and practice and were not tested in this study.
Anthropomorphic performance. B10 (Tier 1) and B9 and B11 (Tier 2) should be improved first, and lip-sync accuracy can be written into technical specifications for procurement and acceptance testing. Suggested measures include better phoneme alignment in speech-driven animation, richer facial expressions, and coordination of content, facial expression, intonation, and movement. Coordination among expressive cues matters more than visual realism alone, as it avoids the discomfort evoked by a realistic appearance with poorly coordinated motion [24,38,69,70]. These measures mainly involve software upgrades to the animation and speech modules and can be introduced at relatively low cost through procurement and acceptance requirements. Higher visual realism, in contrast, increases rendering load and may slow responses (B6); coordination should take precedence when budgets are limited.
Personalized service. B20 (Tier 1) should be addressed first, followed by B17 and B18 (Tier 2), and B19 is a Tier 3 priority. Possible measures include tiered knowledge bases, lightweight interest profiles, and tour recommendations that combine visitors’ interests with real-time visitor flow [6]. Because personalization uses visitor data, data minimization and clear notices are required to maintain privacy protection (B16) [48]. Letting visitors select their interests at the start of a tour is a low-cost alternative to inferring interests from their behavior and requires less personal data. Route recommendation (B18) requires integration with real-time visitor flow systems and is therefore more feasible at sites that already monitor visitor flow.
Interaction and boundary indicators. B5, the only Quadrant I indicator, requires continuous improvement, in which unrecognized queries are logged and used for retraining, closing the feedback loop among the actors. B7 and B8 are Tier 3 indicators. Low-cost measures include better context management, support for voice, touch, and gesture input, and simple guidance for first-time users [51].
Basic requirements. The credibility assurance and system reliability indicators in Quadrant IV should be kept free of visible failures. Knowledge bases should be reviewed regularly and updated after exhibition changes. Fallback responses should also signal uncertainty for unknown questions instead of fabricating interpretations (B15) [8,71]. Improving narrative quality may still yield positive returns, and three-dimensional scene reconstruction can be added (B4) [72,73]. Spending on these indicators should be kept at current levels so that additional resources can be directed to Tier 1 indicators.
6. Discussion and Conclusions
6.1. Discussion
Existing theory accounts for the two strongest effects. Social presence theory and the computers-as-social-actors paradigm can explain the prominence of anthropomorphic performance [74,75]. An on-site digital human continuously displays embodied cues such as a face and a voice, which can evoke visitors’ social and psychological responses. Lip-sync and voice matching (B10) carry a high weight but perform poorly, which fits the uncanny valley account [76]: mismatched audiovisual cues may evoke discomfort. Anthropomorphic performance is closely associated with whether the encounter is experienced as a social interaction, and its penalty for failure exceeds its reward for improvement [70]. Media richness theory can explain the high weight of personalized service [77]. Visitors expect a digital human to adapt to them, and when it can only deliver the same script, the richness of the medium is not realized, which is consistent with personalized service carrying the largest penalty.
The findings also refine existing AI service quality frameworks. Chatbot scales treat anthropomorphism as an ordinary attribute, but in the embodied, on-site context of heritage guiding, anthropomorphic performance shows one of the largest relative effects in the model and is coupled with personalization, which suggests that the importance of anthropomorphism may depend on how the agent is embodied. Two further patterns deserve interpretation. First, the direct effect of credibility assurance was not significant. Visitors assume that an official digital human guide is authoritative and reliable, so credible content merely meets expectations without raising evaluations, whereas errors can seriously damage the experience; this is the pattern of a typical basic factor [78], and it also reflects the overlap between credibility assurance and content quality. Second, semantic understanding (B5) is the only Quadrant I indicator, because recognizing questions is the basis of every interaction and is relatively mature in current systems. Content and reliability indicators matter mainly when failures occur and therefore fall into Quadrant IV. These patterns reflect the asymmetric roles of attributes rather than differences in maturity arising from system iteration.
The framework differs from existing instruments in what it evaluates. SERVQUAL and its derivatives evaluate interpersonal service encounters [16,17], whereas robotic service quality scales, SERVBOT [21,22], and AICSQ [20] evaluate the agent itself and treat anthropomorphism as a design attribute. The present framework instead treats anthropomorphic performance as a service outcome that can succeed or fail, adds indicators of knowledge authority (B13 to B15) and on-site operating conditions (B22 to B24), and takes the sociotechnical system as the unit of evaluation. Within this system, the expressive-adaptive layer is a system-level construct. It is not designed by any single subsystem but emerges in visitors’ perceptions from the coupling of anthropomorphic performance, which belongs to the human–computer interface subsystem, with personalized service, which belongs to the service support subsystem. Because no single supply-side actor owns this layer, improving it requires content teams, technology providers, and site managers to optimize jointly. This extends the sociotechnical principle of joint optimization [9,43] from the design of subsystems to the system boundaries that users perceive.
6.2. Conclusions
This study reached four conclusions about digital human guiding at cultural heritage sites.
First, a framework with six dimensions and 24 indicators was built from interviews with 48 visitors and 12 staff members and from SERVQUAL and AICSQ [16,20], with anthropomorphic performance as an independent dimension and additional heritage-specific indicators. Split-sample EFA and CFA on 628 questionnaires supported this structure.
Second, anthropomorphic performance (β = 0.294) and personalized service (β = 0.245) have strong and significant structural paths to overall service quality. Only the anthropomorphic performance path remained significant when a latent method construct was controlled, so it is the most robust of these effects. Content quality and credibility assurance perform well but have weak unique effects. Credibility assurance and system reliability are basic factors, and content quality shows a positive reward effect.
Third, the combined SEM and IPA analysis identifies lip-sync accuracy and interest recognition as the top improvement priorities, followed by image naturalness and emotional expression, whereas credibility assurance and system reliability need only be kept above their failure thresholds. The priority of lip-sync accuracy is robust; that of interest recognition depends on the personalized service path and should be interpreted with more caution.
Fourth, the designed three-subsystem partition was not supported, and the dimensions are coupled across subsystem boundaries in visitors’ perceptions, so optimizing a single component may yield limited gains. Once validated in more contexts, the two-stage procedure, rather than the specific indicators, may inform the evaluation of services such as robotic reception and intelligent customer service [79].
6.3. Limitations and Future Research
The study has several limitations. First, the findings are bound to the Chinese context, as the data come from six heritage sites in China and a non-probability sample. In addition, digital human adoption and visitor expectations differ across countries. The framework should therefore not be generalized beyond China without cross-national validation, including measurement invariance tests. Cultural and institutional settings may also change the results. The emphasis on consistency with the official narrative (B14) reflects the reviewed interpretation system at Chinese heritage sites, and acceptance of anthropomorphic agents and attitudes toward personalization and data use differ across cultures [42]. What can be transferred is the two-stage procedure and the subsystem logic rather than the specific indicators and weights. Second, interview accounts may reflect recall bias and differences in expressive ability. Third, the data are cross-sectional, so feedback and adaptation, diminishing returns, and the movement of constraints could not be observed directly. Fourth, importance was derived, so derived and stated importance could not be compared. Fifth, intercept and online respondents may be self-selected, and without demographic information we cannot examine whether visitors of different ages evaluate the service differently. Sixth, all data are self-reports collected from the respondents at a single time point. Procedural remedies, such as randomizing item order, avoiding suggestive wording, and standardizing survey instructions, were used to reduce bias, but the potential influence of common method variance cannot be fully ruled out given the survey format. When an unmeasured latent method construct was controlled, only anthropomorphic performance remained significant (Appendix C, Table A5). The priority of anthropomorphic performance is therefore the most robust finding, whereas the paths and weights of interaction responsiveness and personalized service should be interpreted with caution. Because performance ratings and overall service quality were reported by the same respondents at the same time, the structural paths indicate associations rather than causal effects. Seventh, the indicator weights and improvement priorities depend on the model specification and the IPA thresholds, and the subgroup comparisons were conducted without measurement invariance tests, so the results are partly context-dependent.
Future research can validate the framework in other countries and heritage traditions with measurement invariance tests and multi-group SEM, comparing weights and priorities across contexts and visitor groups. Longitudinal designs that combine visitor evaluations with system backend data could track novelty effects and shifts in the importance of dimensions as technologies mature. System dynamics models could represent the feedback loops among actors. The framework can also be extended to accessibility services, dialect support, and the governance of generated content [71], and to collaborative governance and cost trade-offs among site managers, technology providers, and content teams. Future studies should also combine visitor ratings with behavioral, observational, or system-generated data, such as interaction logs, fallback rates, and measured lip-sync error, and measure predictors and outcomes at different time points to strengthen causal inference.
As more digital humans run on generative AI and large language models, hallucination, disclosure of AI-generated content, explainability, and the governance of generated content also bear on service quality. Hallucination risks are partly captured by B1, B13, and B15, but AI disclosure and content governance were not measured separately in this study. Restricting answers to reviewed knowledge bases, retaining human review, citing sources, and labeling generated content can reduce these risks. Future research can add indicators of transparency and disclosure and examine the ethical risks of AI-mediated heritage interpretation, such as fabricated statements attributed to historical figures.
Author Contributions
Conceptualization, Y.L. and Y.C.; methodology, Y.L.; software, Y.L.; validation, Y.L.; formal analysis, Y.L.; investigation, Y.L.; resources, Y.C.; data curation, Y.L.; writing—original draft preparation, Y.L.; writing—review and editing, Y.C.; visualization, Y.L.; supervision, Y.C.; project administration, Y.C. All authors have read and agreed to the published version of the manuscript.
Funding
This research received no external funding.
Institutional Review Board Statement
Ethical review and approval were waived for this study. The exemption was confirmed in writing under Article 32 of the Measures for Ethical Review of Life-Science and Medical Research Involving Humans, which exempts research that causes no harm to participants, involves no sensitive personal information or commercial interests, and uses anonymized information. The study did not involve biological samples or vulnerable populations, did not collect personally identifiable information, and posed no more than minimal risk to participants.
Informed Consent Statement
Informed consent was obtained from all subjects involved in the study. All interviews were recorded and transcribed with the consent of the interviewees, and all questionnaire responses were collected anonymously.
Data Availability Statement
The data presented in this study are available on request from the corresponding author.
Conflicts of Interest
The authors declare no conflicts of interest.
Appendix A
Table A1.
Coding structure: main categories, sub-categories, and mapping to the six dimensions.
Table A2.
Examples of three-level coding of interview transcripts.
Appendix B
Table A3 reports the distribution of the six experts’ relevance ratings. I-CVI = number of experts rating 3 or 4 divided by 6; modified kappa , where , is the number of experts, and is the number rating 3 or 4 [55].
Table A3.
Distribution of expert relevance ratings and content validity indices.
Appendix C
Table A4.
Descriptive statistics of the measurement items (N = 628).
Table A5.
Structural paths with and without an unmeasured latent method construct.
Table A6.
Exploratory factor analysis on the calibration subsample (n = 314).
Table A7.
Sensitivity of IPA priorities to alternative weighting schemes.
Table A8.
Standardized path coefficients by subgroup.
Appendix D
The questionnaire was administered in Chinese; the English version is given below.
Section 1. Usage context. (1) Which heritage site did you visit? (2) Which digital human guide did you use? (fixed large-screen terminal/mobile portable digital human/both) (3) How many times have you used a digital human guide before? (first time/twice or more) (4) How often do you use intelligent voice-enabled products? (rarely/occasionally/frequently) (5) How many heritage sites do you visit per year? (1 or fewer/2–3/4 or more) (6) How are you traveling today? (independently/with family or children/in a group tour)
Section 2. Service quality. Please rate your satisfaction with each aspect of the digital human guide you used (1 = very dissatisfied, 2 = dissatisfied, 3 = neutral, 4 = satisfied, 5 = very satisfied).
Table A9.
Service quality items (Section 2 of the questionnaire).
Section 3. Overall service quality (1 = strongly disagree, 5 = strongly agree). OSQ1: Overall, the digital human guide provided high-quality service. OSQ2: The digital human guide met my needs for interpretation at this site. OSQ3: Compared with my expectations, the service of the digital human guide was excellent.
References
- Sylaiou, S.; Fidas, C. Virtual humans in museums and cultural heritage sites. Appl. Sci. 2022, 12, 9913. [Google Scholar] [CrossRef] [Scilit]
- Machidon, O.M.; Duguleana, M.; Carrozzino, M. Virtual humans in cultural heritage ICT applications: A review. J. Cult. Herit. 2018, 33, 249–260. [Google Scholar] [CrossRef] [Scilit]
- Xia, T.; Wu, Y.; Qiu, A.; Liu, Z.; Fan, M. The impact of AI guide language strategies on museum visitor experience: The mediating role of psychological distance in the arousal–topic fit effect. Behav. Sci. 2025, 15, 1569. [Google Scholar] [CrossRef] [Scilit] [PubMed]
- Rosa, S.; Randazzo, M.; Landini, E.; Bernagozzi, S.; Sacco, G.; Piccinino, M.; Natale, L. Tour guide robot: A 5G-enabled robot museum guide. Front. Robot. AI 2024, 10, 1323675. [Google Scholar] [CrossRef] [Scilit] [PubMed]
- Tombling, J.; Tadeja, S.K.; Bohné, T. Museum touring through an augmented reality-enhanced robotic assistant: Improving learnability and memory retention. IEEE Robot. Autom. Mag. 2026, 33, 104–111. [Google Scholar] [CrossRef] [Scilit]
- Balakrishnan, J.; Dwivedi, Y.K.; Malik, F.T.; Baabdullah, A.M. Role of smart tourism technology in heritage tourism development. J. Sustain. Tour. 2023, 31, 2506–2525. [Google Scholar] [CrossRef] [Scilit]
- Buonincontri, P.; Marasco, A. Enhancing cultural heritage experiences with smart technologies: An integrated experiential framework. Eur. J. Tour. Res. 2017, 17, 83–101. [Google Scholar] [CrossRef] [Scilit]
- Ruan, W.Q.; Wang, M.Y.; Zhang, S.N.; Li, Y.Q.; Su, X. Knowledge-based or affection-based? The influence mechanism of heritage tourism interpretation content on tourists’ willingness to inherit culture. Tour. Manag. 2024, 102, 104876. [Google Scholar] [CrossRef] [Scilit]
- Baxter, G.; Sommerville, I. Socio-technical systems: From design methods to systems engineering. Interact. Comput. 2011, 23, 4–17. [Google Scholar] [CrossRef] [Scilit]
- Maglio, P.P.; Spohrer, J. Fundamentals of service science. J. Acad. Mark. Sci. 2008, 36, 18–20. [Google Scholar] [CrossRef] [Scilit]
- Venkatesh, V.; Brown, S.A.; Bala, H. Bridging the qualitative–quantitative divide: Guidelines for conducting mixed methods research in information systems. MIS Q. 2013, 37, 21–54. [Google Scholar] [CrossRef] [Scilit]
- Martilla, J.A.; James, J.C. Importance-performance analysis. J. Mark. 1977, 41, 77–79. [Google Scholar] [CrossRef] [Scilit]
- Rahman, S. Theory of constraints: A review of the philosophy and its applications. Int. J. Oper. Prod. Manag. 1998, 18, 336–355. [Google Scholar] [CrossRef] [Scilit]
- Ma, C.; Somrak, T.; Manajit, S.; Gao, C. Exploring the potential synergy between disruptive technology and historical/cultural heritage in Thailand’s tourism industry for achieving sustainable development in the future. Int. J. Tour. Res. 2024, 26, e2759. [Google Scholar] [CrossRef] [Scilit]
- Grönroos, C. A service quality model and its marketing implications. Eur. J. Mark. 1984, 18, 36–44. [Google Scholar] [CrossRef] [Scilit]
- Parasuraman, A.; Zeithaml, V.A.; Berry, L.L. A conceptual model of service quality and its implications for future research. J. Mark. 1985, 49, 41–50. [Google Scholar] [CrossRef] [Scilit]
- Parasuraman, A.; Zeithaml, V.A.; Berry, L.L. Reassessment of expectations as a comparison standard in measuring service quality: Implications for further research. J. Mark. 1994, 58, 111–124. [Google Scholar] [CrossRef] [Scilit]
- Cronin, J.J., Jr.; Taylor, S.A. Measuring service quality: A reexamination and extension. J. Mark. 1992, 56, 55–68. [Google Scholar] [CrossRef] [Scilit]
- Frochot, I.; Hughes, H. HISTOQUAL: The development of a historic houses assessment scale. Tour. Manag. 2000, 21, 157–167. [Google Scholar] [CrossRef] [Scilit]
- Chen, Q.; Gong, Y.; Lu, Y.; Tang, J. Classifying and measuring the service quality of AI chatbot in frontline service. J. Bus. Res. 2022, 145, 552–568. [Google Scholar] [CrossRef] [Scilit]
- Prentice, C.; Nguyen, M. Robotic service quality—Scale development and validation. J. Retail. Consum. Serv. 2021, 62, 102661. [Google Scholar] [CrossRef] [Scilit]
- Kharub, I.; Lwin, M.; Khan, A.; Mubin, O. Perceived service quality in HRI: Applying the SERVBOT framework. Front. Robot. AI 2021, 8, 746674. [Google Scholar] [CrossRef] [Scilit] [PubMed]
- Chiang, A.H.; Trimi, S. Impacts of service robots on service quality. Serv. Bus. 2020, 14, 439–459. [Google Scholar] [CrossRef] [Scilit]
- Chiang, A.H.; Trimi, S.; Lo, Y.J. Emotion and service quality of anthropomorphic robots. Technol. Forecast. Soc. Change 2022, 177, 121550. [Google Scholar] [CrossRef] [Scilit]
- Ben Saad, S. The digital revolution in the tourism industry: Role of anthropomorphic virtual agent in digitalized hotel service. Int. J. Contemp. Hosp. Manag. 2024, 36, 3751–3773. [Google Scholar] [CrossRef] [Scilit]
- Qin, Z.; Wang, G.; Jiang, M. Working with a digital human avatar: Employee–AI symbiosis shapes the double-edged sword effects of artificial intelligence (AI) awareness in the hospitality industry. Int. J. Tour. Res. 2025, 27, e70106. [Google Scholar] [CrossRef] [Scilit]
- Song, M.; Wang, Y.; Guo, R. Can virtual humans truly substitute humans? The impact of virtual human appearance realism and social roles on tourists’ word-of-mouth intention. Int. J. Tour. Res. 2026, 28, e70218. [Google Scholar] [CrossRef] [Scilit]
- Yao, R.; Qi, G.; Wu, Z.; Sun, H.; Sheng, D. Digital human calls you dear: How do customers respond to virtual streamers’ social-oriented language in e-commerce livestreaming? A stereotyping perspective. J. Retail. Consum. Serv. 2024, 79, 103872. [Google Scholar] [CrossRef] [Scilit]
- Yan, X.; Tat, H.H.; Zhou, Y. Virtual vs. human streamers in live-streaming commerce: How attachment styles influence purchase intention. J. Consum. Behav. 2026, 25, 2263–2281. [Google Scholar] [CrossRef] [Scilit]
- Xie, Y.; Gao, L.; Cui, F.; Zhang, W. When virtual meets authenticity: How virtual streamers shape consumer decision-making confidence. Int. J. Consum. Stud. 2026, 50, e70152. [Google Scholar] [CrossRef] [Scilit]
- Koles, B.; Audrezet, A.; Moulard, J.G.; Ameen, N.; McKenna, B. The authentic virtual influencer: Authenticity manifestations in the metaverse. J. Bus. Res. 2024, 170, 114325. [Google Scholar] [CrossRef] [Scilit]
- Belanche, D.; Casaló, L.V.; Flavián, M. Human versus virtual influences, a comparative study. J. Bus. Res. 2024, 173, 114493. [Google Scholar] [CrossRef] [Scilit]
- Chen, H.; Wang, P.; Hao, S. AI in the spotlight: The impact of artificial intelligence disclosure on user engagement in short-form videos. Comput. Hum. Behav. 2025, 162, 108448. [Google Scholar] [CrossRef] [Scilit]
- Li, Y.; Chang, Y.; Li, Y. 1+1<2? Unveiling the impact of AI-assisted disclosure on service satisfaction in professional services. Int. J. Inf. Manag. 2025, 84, 102937. [Google Scholar] [CrossRef] [Scilit]
- Liu, D.; Lv, Y.; Huang, W. How do consumers react to chatbots’ humorous emojis in service failures. Technol. Soc. 2023, 73, 102244. [Google Scholar] [CrossRef] [Scilit]
- Deng, S.; Zhang, J.; Lin, Z.; Li, X. Service staff makes me nervous: Exploring the impact of insecure attachment on AI service preference. Technol. Forecast. Soc. Change 2024, 198, 122946. [Google Scholar] [CrossRef] [Scilit]
- Yang, Y.; Chi, M.; Bi, X.; Xu, Y. How does the anthropomorphism of service robots impact employees’ role service behavior in the workplace? Int. J. Hosp. Manag. 2024, 122, 103857. [Google Scholar] [CrossRef] [Scilit]
- Blut, M.; Wang, C.; Wünderlich, N.V.; Brock, C. Understanding anthropomorphism in service provision: A meta-analysis of physical robots, chatbots, and other AI. J. Acad. Mark. Sci. 2021, 49, 632–658. [Google Scholar] [CrossRef] [Scilit]
- Khan, F.M.; Anas, M.; Uddin, S.M.F. Anthropomorphism and consumer behaviour: A SPAR-4-SLR protocol compliant hybrid review. Int. J. Consum. Stud. 2024, 48, e12985. [Google Scholar] [CrossRef] [Scilit]
- Zhang, S.; Ma, M.; Li, Y.; Man, K.L.; Smith, J.; Yue, Y. The effects of LLM-empowered chatbots and avatar guides on the engagement, experience, and learning in virtual museums. Int. J. Hum.-Comput. Interact. 2025, 1–13. [Google Scholar] [CrossRef] [Scilit]
- Rhee, B.A.; Pianzola, F.; Seo, Y.E. An empirical study of visitors’ engagement with a museum robot guide and a mobile audio guide: A case study in South Korea. Mus. Manag. Curatorship 2025, 1–21. [Google Scholar] [CrossRef] [Scilit]
- Zhao, L.; Li, Z.; Chen, B.; Wang, Y. The culturally similar design of virtual guides matters for museum experience: Perceived compatibility as a mediator. Proc. Assoc. Inf. Sci. Technol. 2025, 62, 1179–1184. [Google Scholar] [CrossRef] [Scilit]
- Trist, E.L.; Bamforth, K.W. Some social and psychological consequences of the longwall method of coal-getting: An examination of the psychological situation and defences of a work group in relation to the social structure and technological content of the work system. Hum. Relat. 1951, 4, 3–38. [Google Scholar] [CrossRef] [Scilit]
- Bostrom, R.P.; Heinen, J.S. MIS problems and failures: A socio-technical perspective. Part I: The causes. MIS Q. 1977, 1, 17–32. [Google Scholar] [CrossRef] [Scilit] [PubMed]
- Kudina, O.; van de Poel, I. A sociotechnical system perspective on AI. Minds Mach. 2024, 34, 21. [Google Scholar] [CrossRef] [Scilit]
- Naikar, N.; Brady, A.; Moy, G.; Kwok, H.W. Designing human-AI systems for complex settings: Ideas from distributed, joint, and self-organising perspectives of sociotechnical systems and cognitive work analysis. Ergonomics 2023, 66, 1669–1694. [Google Scholar] [CrossRef] [Scilit] [PubMed]
- Kaartemo, V.; Helkkula, A. Human–AI resource relations in value cocreation in service ecosystems. J. Serv. Manag. 2025, 36, 291–306. [Google Scholar] [CrossRef] [Scilit]
- Cheng, X.; Zhang, X.; Cohen, J.; Mou, J. Human vs. AI: Understanding the impact of anthropomorphism on consumer response to chatbots from the perspective of trust and relationship norms. Inf. Process. Manag. 2022, 59, 102940. [Google Scholar] [CrossRef] [Scilit]
- Chen, H.; Shao, B.; Yang, X.; Kang, W.; Fan, W. Avatars in live streaming commerce: The influence of anthropomorphism on consumers’ willingness to accept virtual live streamers. Comput. Hum. Behav. 2024, 156, 108216. [Google Scholar] [CrossRef] [Scilit]
- Schaper, M.M.; Santos, M.; Malinverni, L.; Zerbini Berro, J.; Pares, N. Learning about the past through situatedness, embodied exploration and digital augmentation of cultural heritage sites. Int. J. Hum.-Comput. Stud. 2018, 114, 36–50. [Google Scholar] [CrossRef] [Scilit]
- Feine, J.; Gnewuch, U.; Morana, S.; Maedche, A. A taxonomy of social cues for conversational agents. Int. J. Hum.-Comput. Stud. 2019, 132, 138–161. [Google Scholar] [CrossRef] [Scilit]
- Hu, H.H.; Ma, F. Human-like bots are not humans: The weakness of sensory language for virtual streamers in livestream commerce. J. Retail. Consum. Serv. 2023, 75, 103541. [Google Scholar] [CrossRef] [Scilit]
- Ye, Q.; Li, Y.; Luo, Y.; Pang, Z. The impact of AI anchor anthropomorphism on users’ willingness to co-create value in tourism live-streaming contexts: The mediating role of social presence and the moderating role of perceived control. Front. Psychol. 2026, 16, 1724176. [Google Scholar] [CrossRef] [Scilit] [PubMed]
- Churchill, G.A., Jr. A paradigm for developing better measures of marketing constructs. J. Mark. Res. 1979, 16, 64–73. [Google Scholar] [CrossRef] [Scilit]
- Polit, D.F.; Beck, C.T.; Owen, S.V. Is the CVI an acceptable indicator of content validity? Appraisal and recommendations. Res. Nurs. Health 2007, 30, 459–467. [Google Scholar] [CrossRef] [Scilit] [PubMed]
- Matzler, K.; Bailom, F.; Hinterhuber, H.H.; Renzl, B.; Pichler, J. The asymmetric relationship between attribute-level performance and overall customer satisfaction: A reconsideration of the importance–performance analysis. Ind. Mark. Manag. 2004, 33, 271–277. [Google Scholar] [CrossRef] [Scilit]
- Oh, H. Revisiting importance-performance analysis. Tour. Manag. 2001, 22, 617–627. [Google Scholar] [CrossRef] [Scilit]
- Abalo, J.; Varela, J.; Manzano, V. Importance values for importance-performance analysis: A formula for spreading out values derived from preference rankings. J. Bus. Res. 2007, 60, 115–121. [Google Scholar] [CrossRef] [Scilit]
- Azzopardi, E.; Nash, R. A critical evaluation of importance–performance analysis. Tour. Manag. 2013, 35, 222–233. [Google Scholar] [CrossRef] [Scilit]
- Zhang, W.T.; Choi, I.Y.; Hyun, Y.J.; Kim, J.K. Hotel service analysis by penalty-reward contrast technique for online review data. Sustainability 2022, 14, 7340. [Google Scholar] [CrossRef] [Scilit]
- Hu, L.T.; Bentler, P.M. Cutoff criteria for fit indexes in covariance structure analysis: Conventional criteria versus new alternatives. Struct. Equ. Model. 1999, 6, 1–55. [Google Scholar] [CrossRef] [Scilit]
- Fornell, C.; Larcker, D.F. Evaluating structural equation models with unobservable variables and measurement error. J. Mark. Res. 1981, 18, 39–50. [Google Scholar] [CrossRef] [Scilit]
- Henseler, J.; Ringle, C.M.; Sarstedt, M. A new criterion for assessing discriminant validity in variance-based structural equation modeling. J. Acad. Mark. Sci. 2015, 43, 115–135. [Google Scholar] [CrossRef] [Scilit]
- Kock, N.; Lynn, G.S. Lateral collinearity and misleading results in variance-based SEM: An illustration and recommendations. J. Assoc. Inf. Syst. 2012, 13, 546–580. [Google Scholar] [CrossRef] [Scilit]
- Podsakoff, P.M.; MacKenzie, S.B.; Lee, J.Y.; Podsakoff, N.P. Common method biases in behavioral research: A critical review of the literature and recommended remedies. J. Appl. Psychol. 2003, 88, 879–903. [Google Scholar] [CrossRef] [Scilit] [PubMed]
- Johnson, J.W. A heuristic method for estimating the relative weight of predictor variables in multiple regression. Multivar. Behav. Res. 2000, 35, 1–19. [Google Scholar] [CrossRef] [Scilit] [PubMed]
- Caber, M.; Albayrak, T.; Matzler, K. Classification of the destination attributes in the content of competitiveness (by revised importance-performance analysis). J. Vacat. Mark. 2012, 18, 43–56. [Google Scholar] [CrossRef] [Scilit]
- Deng, W. Using a revised importance-performance analysis approach: The case of Taiwanese hot springs tourism. Tour. Manag. 2007, 28, 1274–1284. [Google Scholar] [CrossRef] [Scilit]
- Gong, X.; Sun, P. Can virtual streamers express emotions? Understanding the language style of virtual streamers in livestreaming e-commerce. J. Retail. Consum. Serv. 2025, 82, 104148. [Google Scholar] [CrossRef] [Scilit]
- Tang, X.; Wang, Z. Anthropomorphic design of virtual streamers in live streaming: A double-edged sword effect on consumers’ acceptance intention. J. Consum. Behav. 2026, 25, 2321–2341. [Google Scholar] [CrossRef] [Scilit]
- Bulchand-Gidumal, J.; Secin, E.W.; O’Connor, P.; Buhalis, D. Artificial intelligence’s impact on hospitality and tourism marketing: Exploring key themes and addressing challenges. Curr. Issues Tour. 2024, 27, 2345–2362. [Google Scholar] [CrossRef] [Scilit]
- Iacono, S.; Scaramuzzino, M.; Martini, L.; Panelli, C.; Zolezzi, D.; Perotti, M.; Traverso, A.; Vercelli, G.V. Virtual reality in cultural heritage: A setup for Balzi Rossi Museum. Appl. Sci. 2024, 14, 3562. [Google Scholar] [CrossRef] [Scilit]
- Allal-Chérif, O. Intelligent cathedrals: Using augmented reality, virtual reality, and artificial intelligence to provide an intense cultural, historical, and religious visitor experience. Technol. Forecast. Soc. Change 2022, 178, 121604. [Google Scholar] [CrossRef] [Scilit]
- Oh, C.S.; Bailenson, J.N.; Welch, G.F. A systematic review of social presence: Definition, antecedents, and implications. Front. Robot. AI 2018, 5, 114. [Google Scholar] [CrossRef] [Scilit] [PubMed]
- Nass, C.; Moon, Y. Machines and mindlessness: Social responses to computers. J. Soc. Issues 2000, 56, 81–103. [Google Scholar] [CrossRef] [Scilit]
- Mori, M.; MacDorman, K.F.; Kageki, N. The uncanny valley [from the field]. IEEE Robot. Autom. Mag. 2012, 19, 98–100. [Google Scholar] [CrossRef] [Scilit]
- Daft, R.L.; Lengel, R.H. Organizational information requirements, media richness and structural design. Manag. Sci. 1986, 32, 554–571. [Google Scholar] [CrossRef] [Scilit]
- Oliver, R.L. A cognitive model of the antecedents and consequences of satisfaction decisions. J. Mark. Res. 1980, 17, 460–469. [Google Scholar] [CrossRef] [Scilit]
- Cheng, C.F. Angel or devil? Revisiting antecedents and consequences of WOM toward service robots based on perspectives of consumer and employee. Int. J. Hosp. Manag. 2025, 124, 103991. [Google Scholar] [CrossRef] [Scilit]
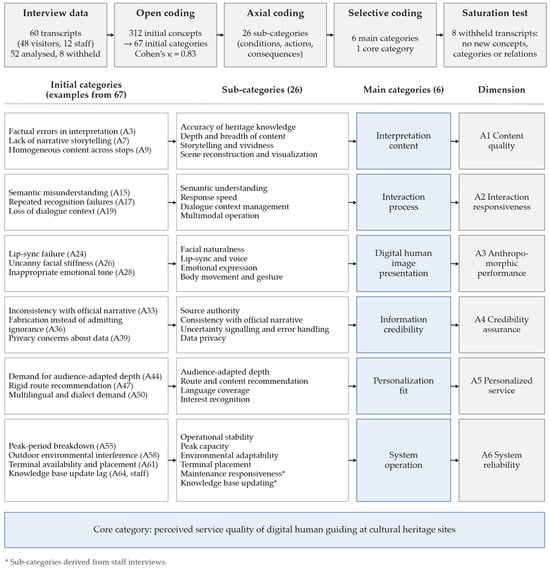
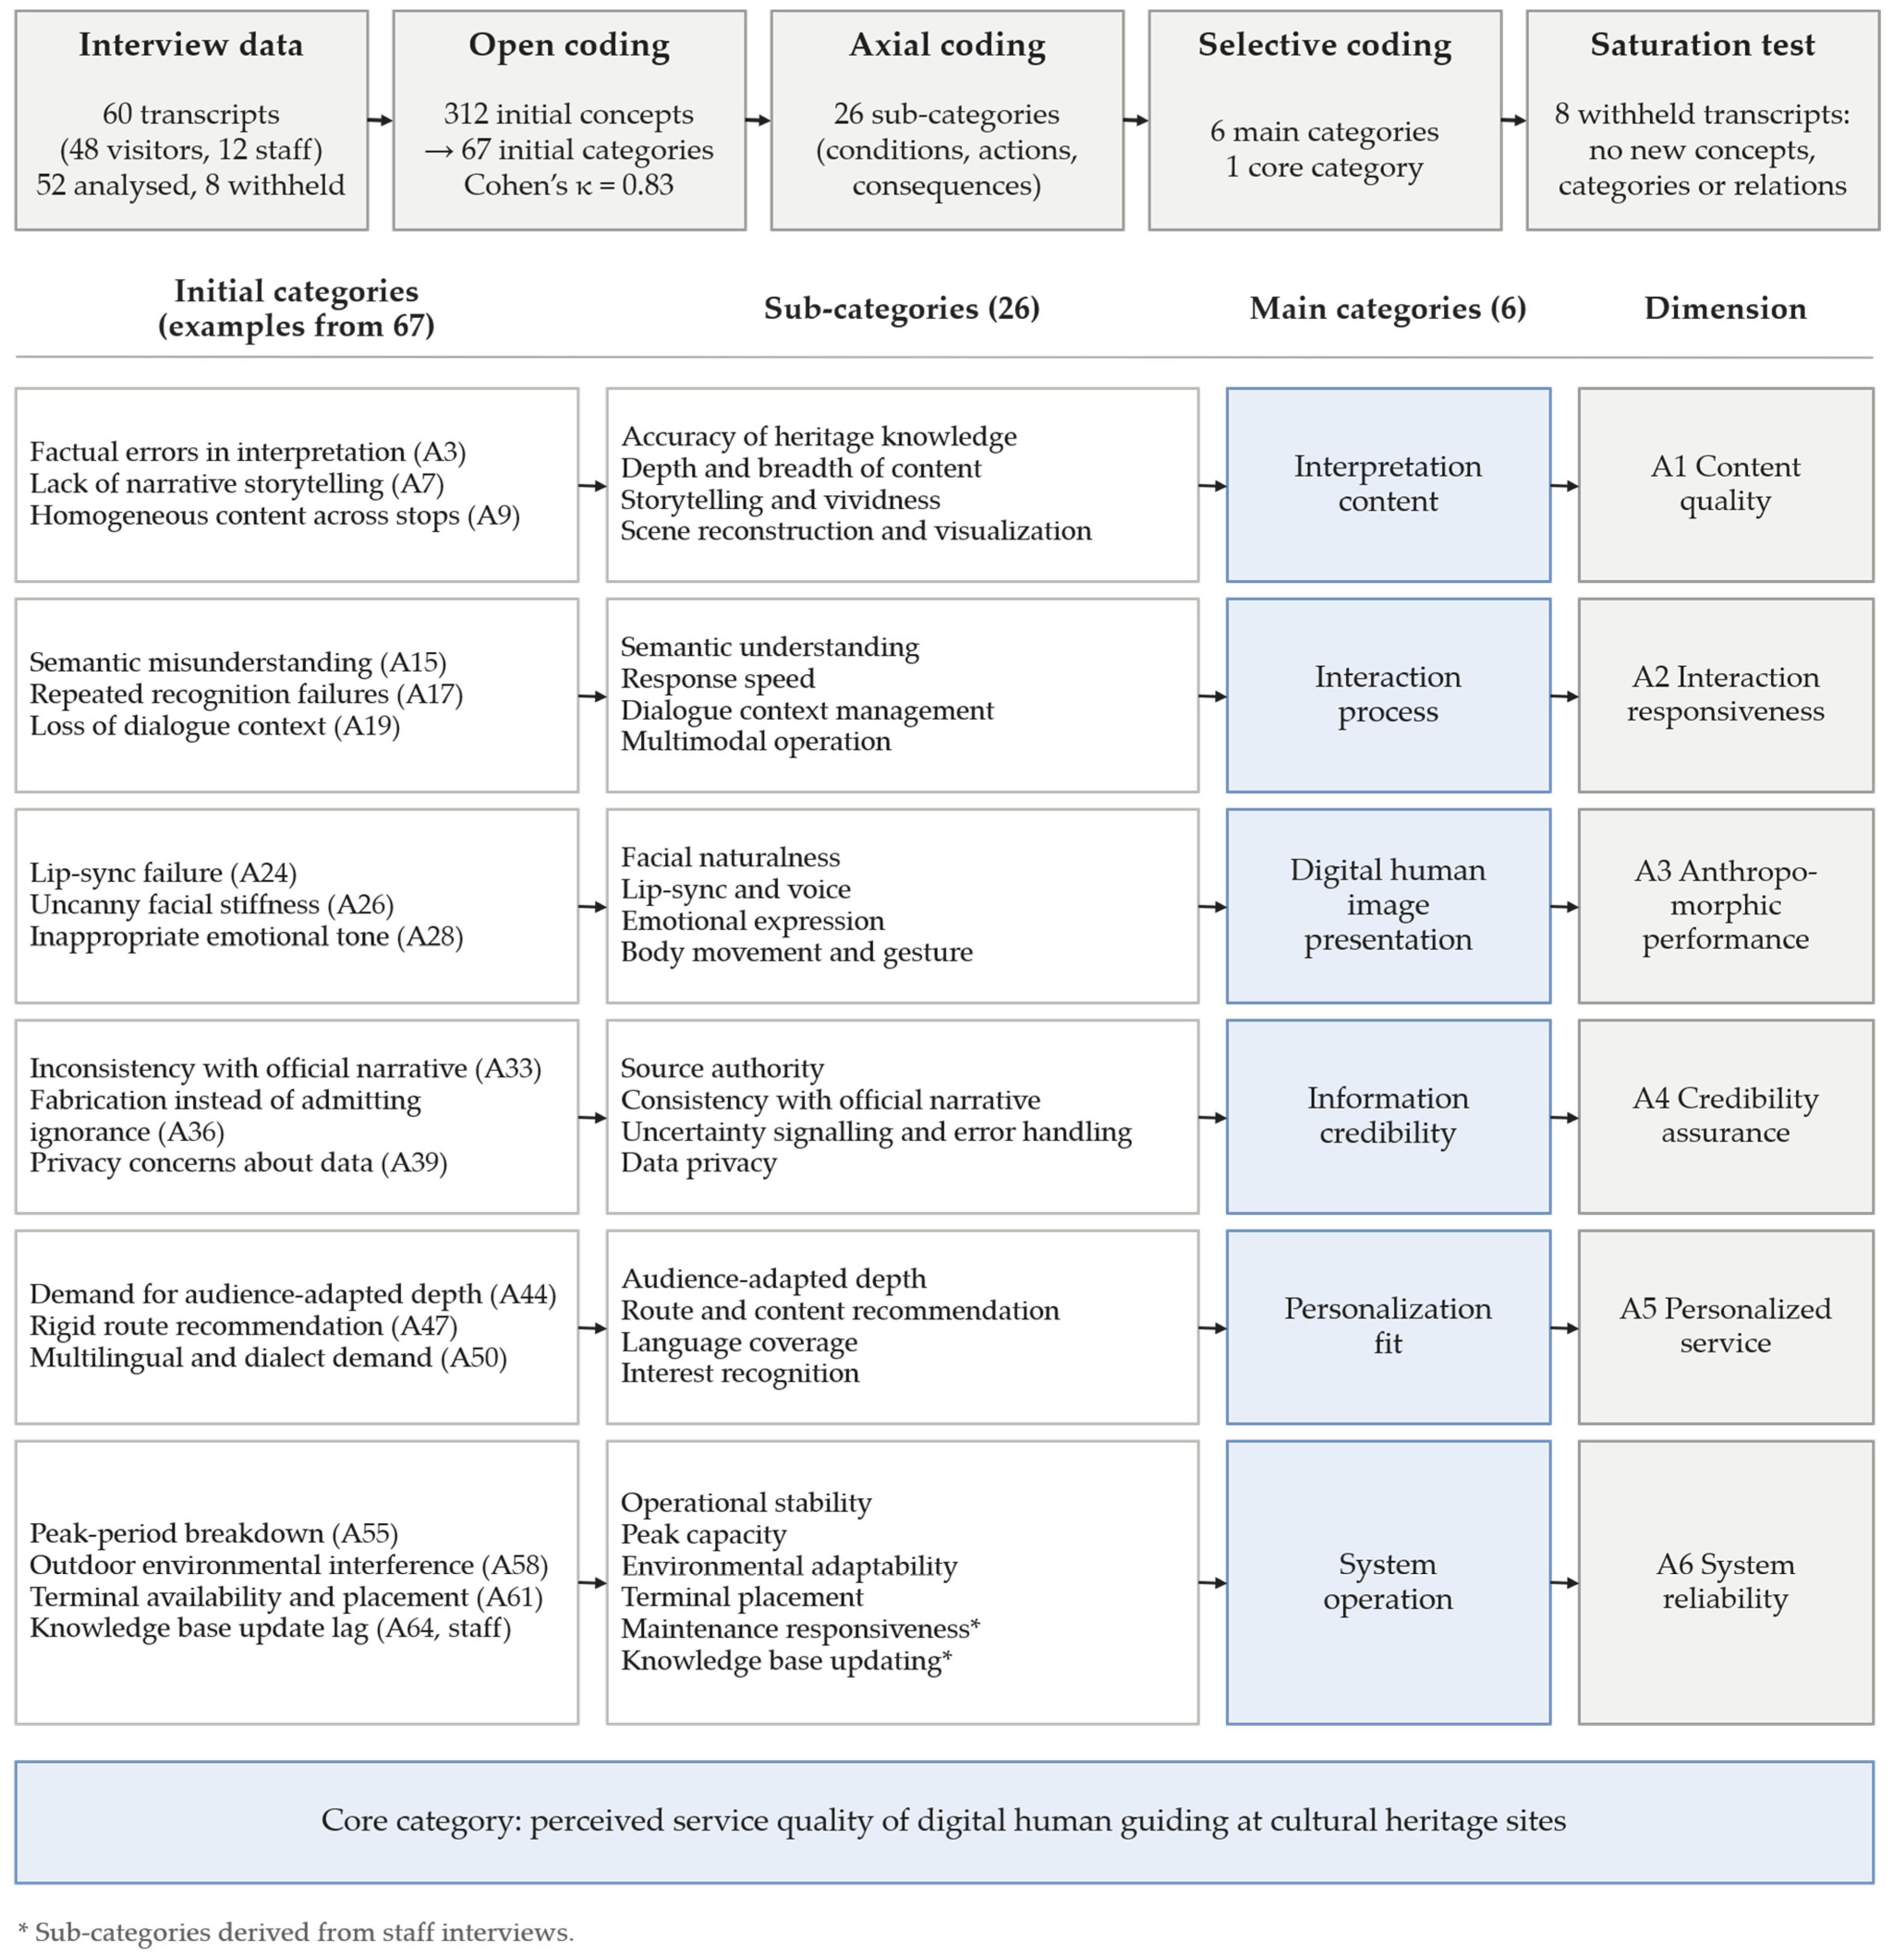
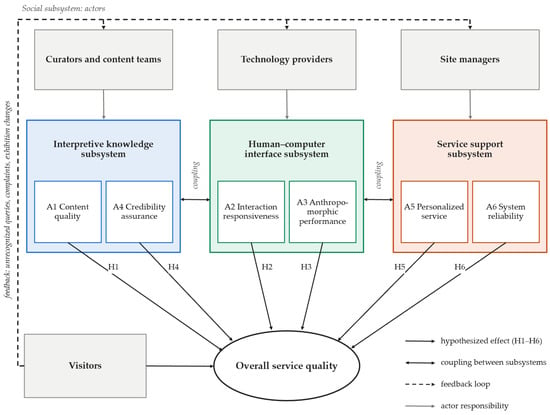
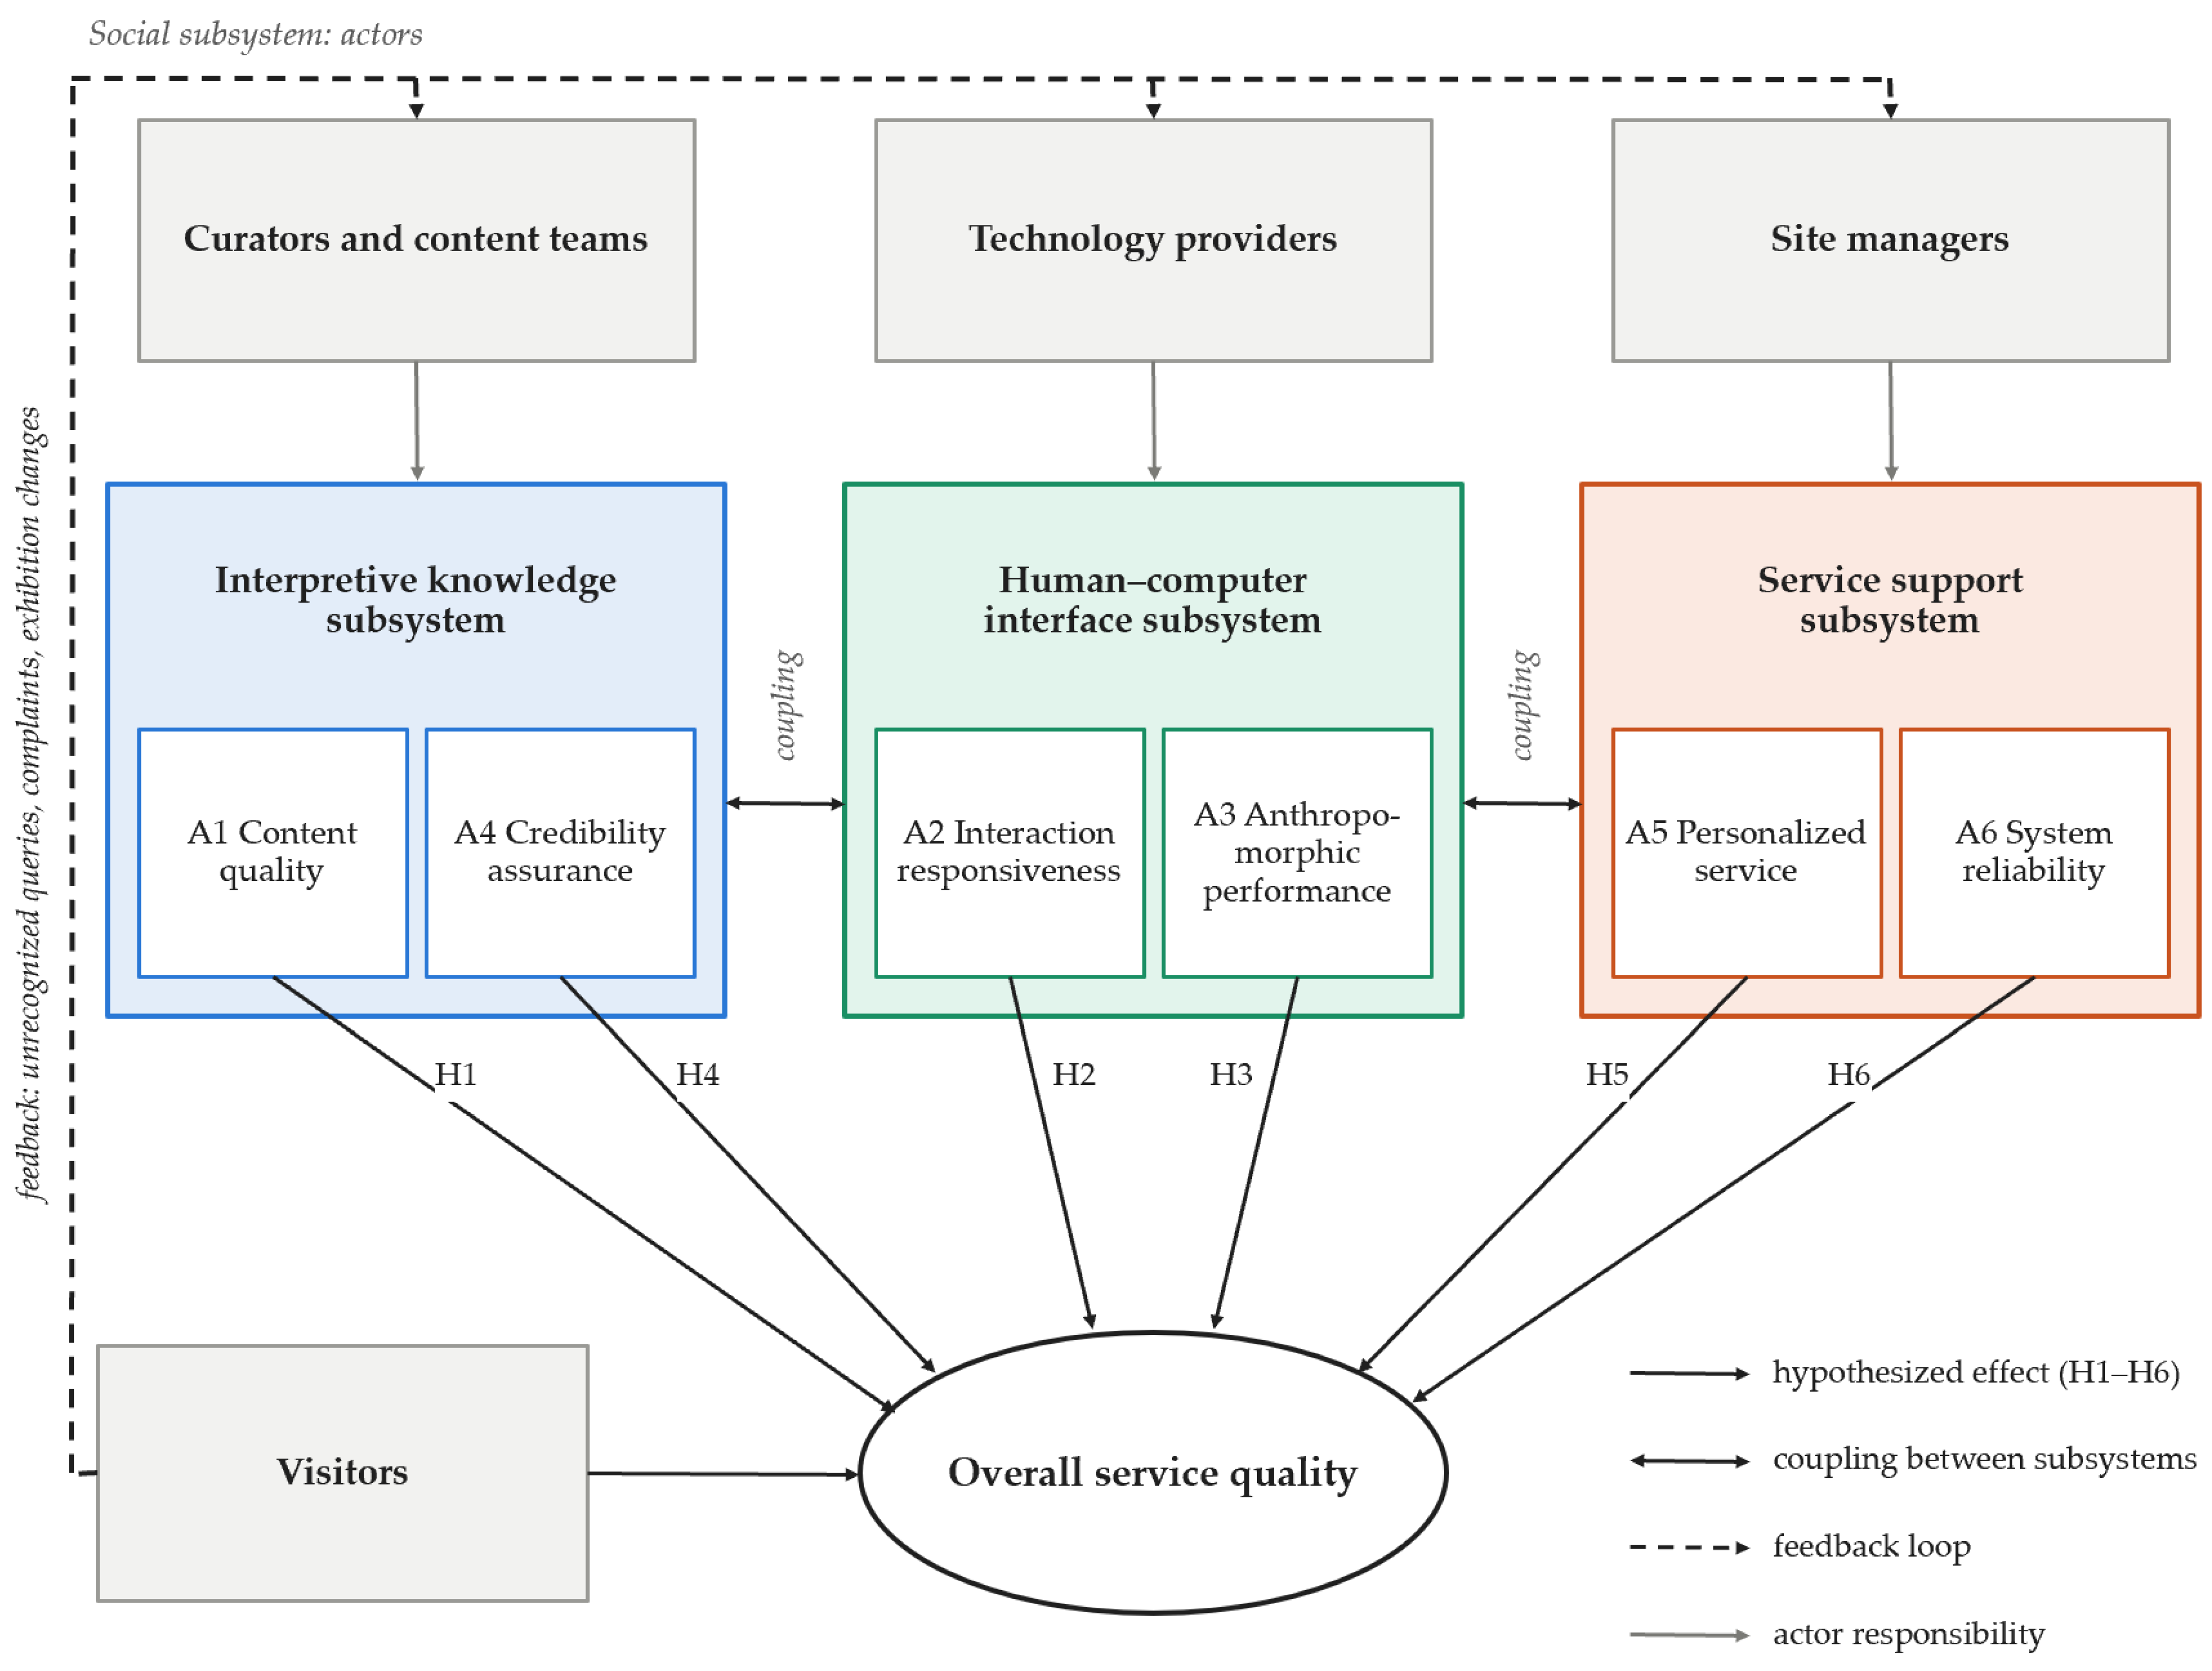
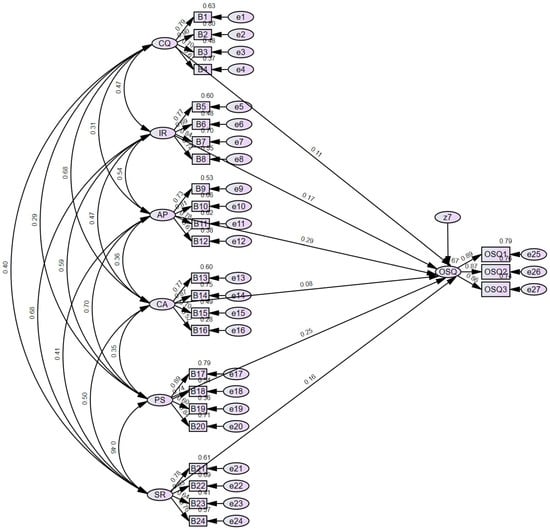
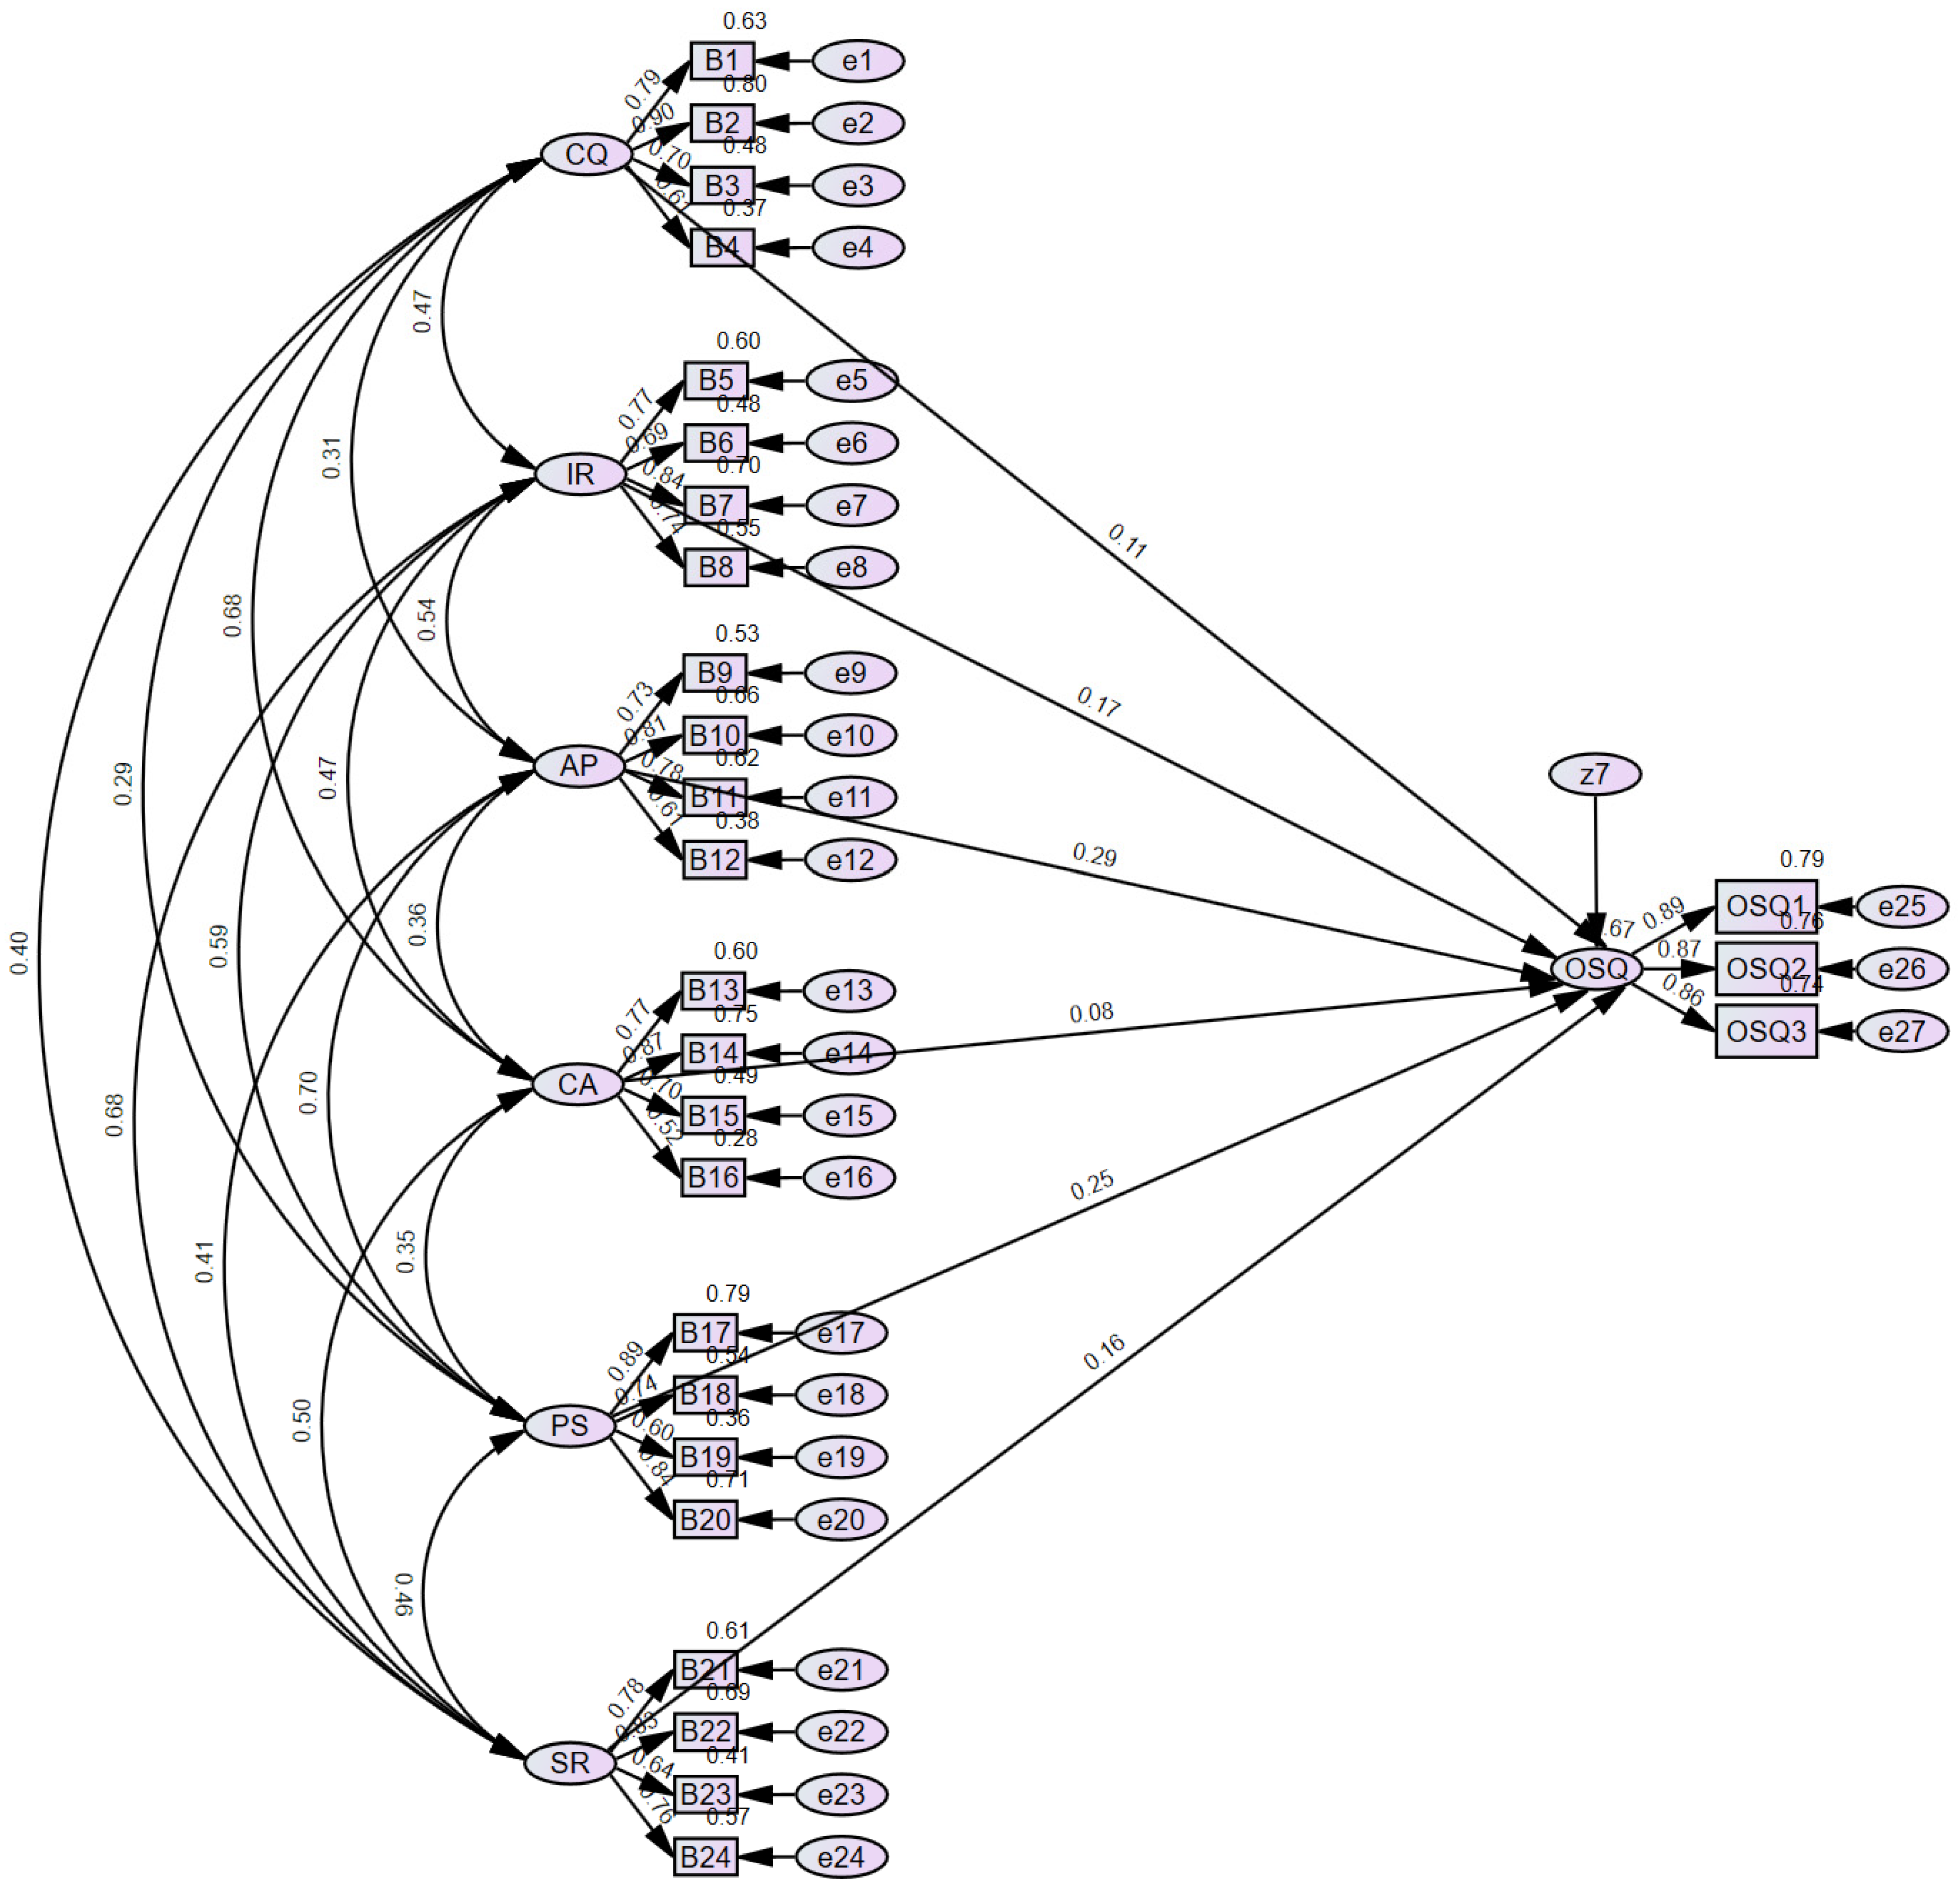
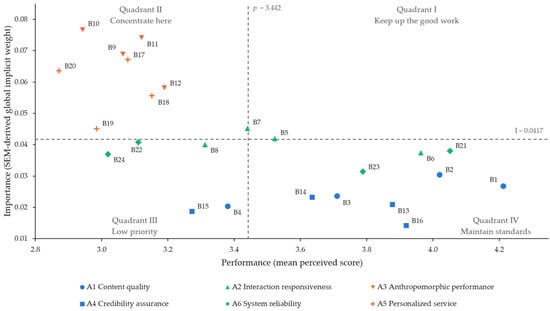
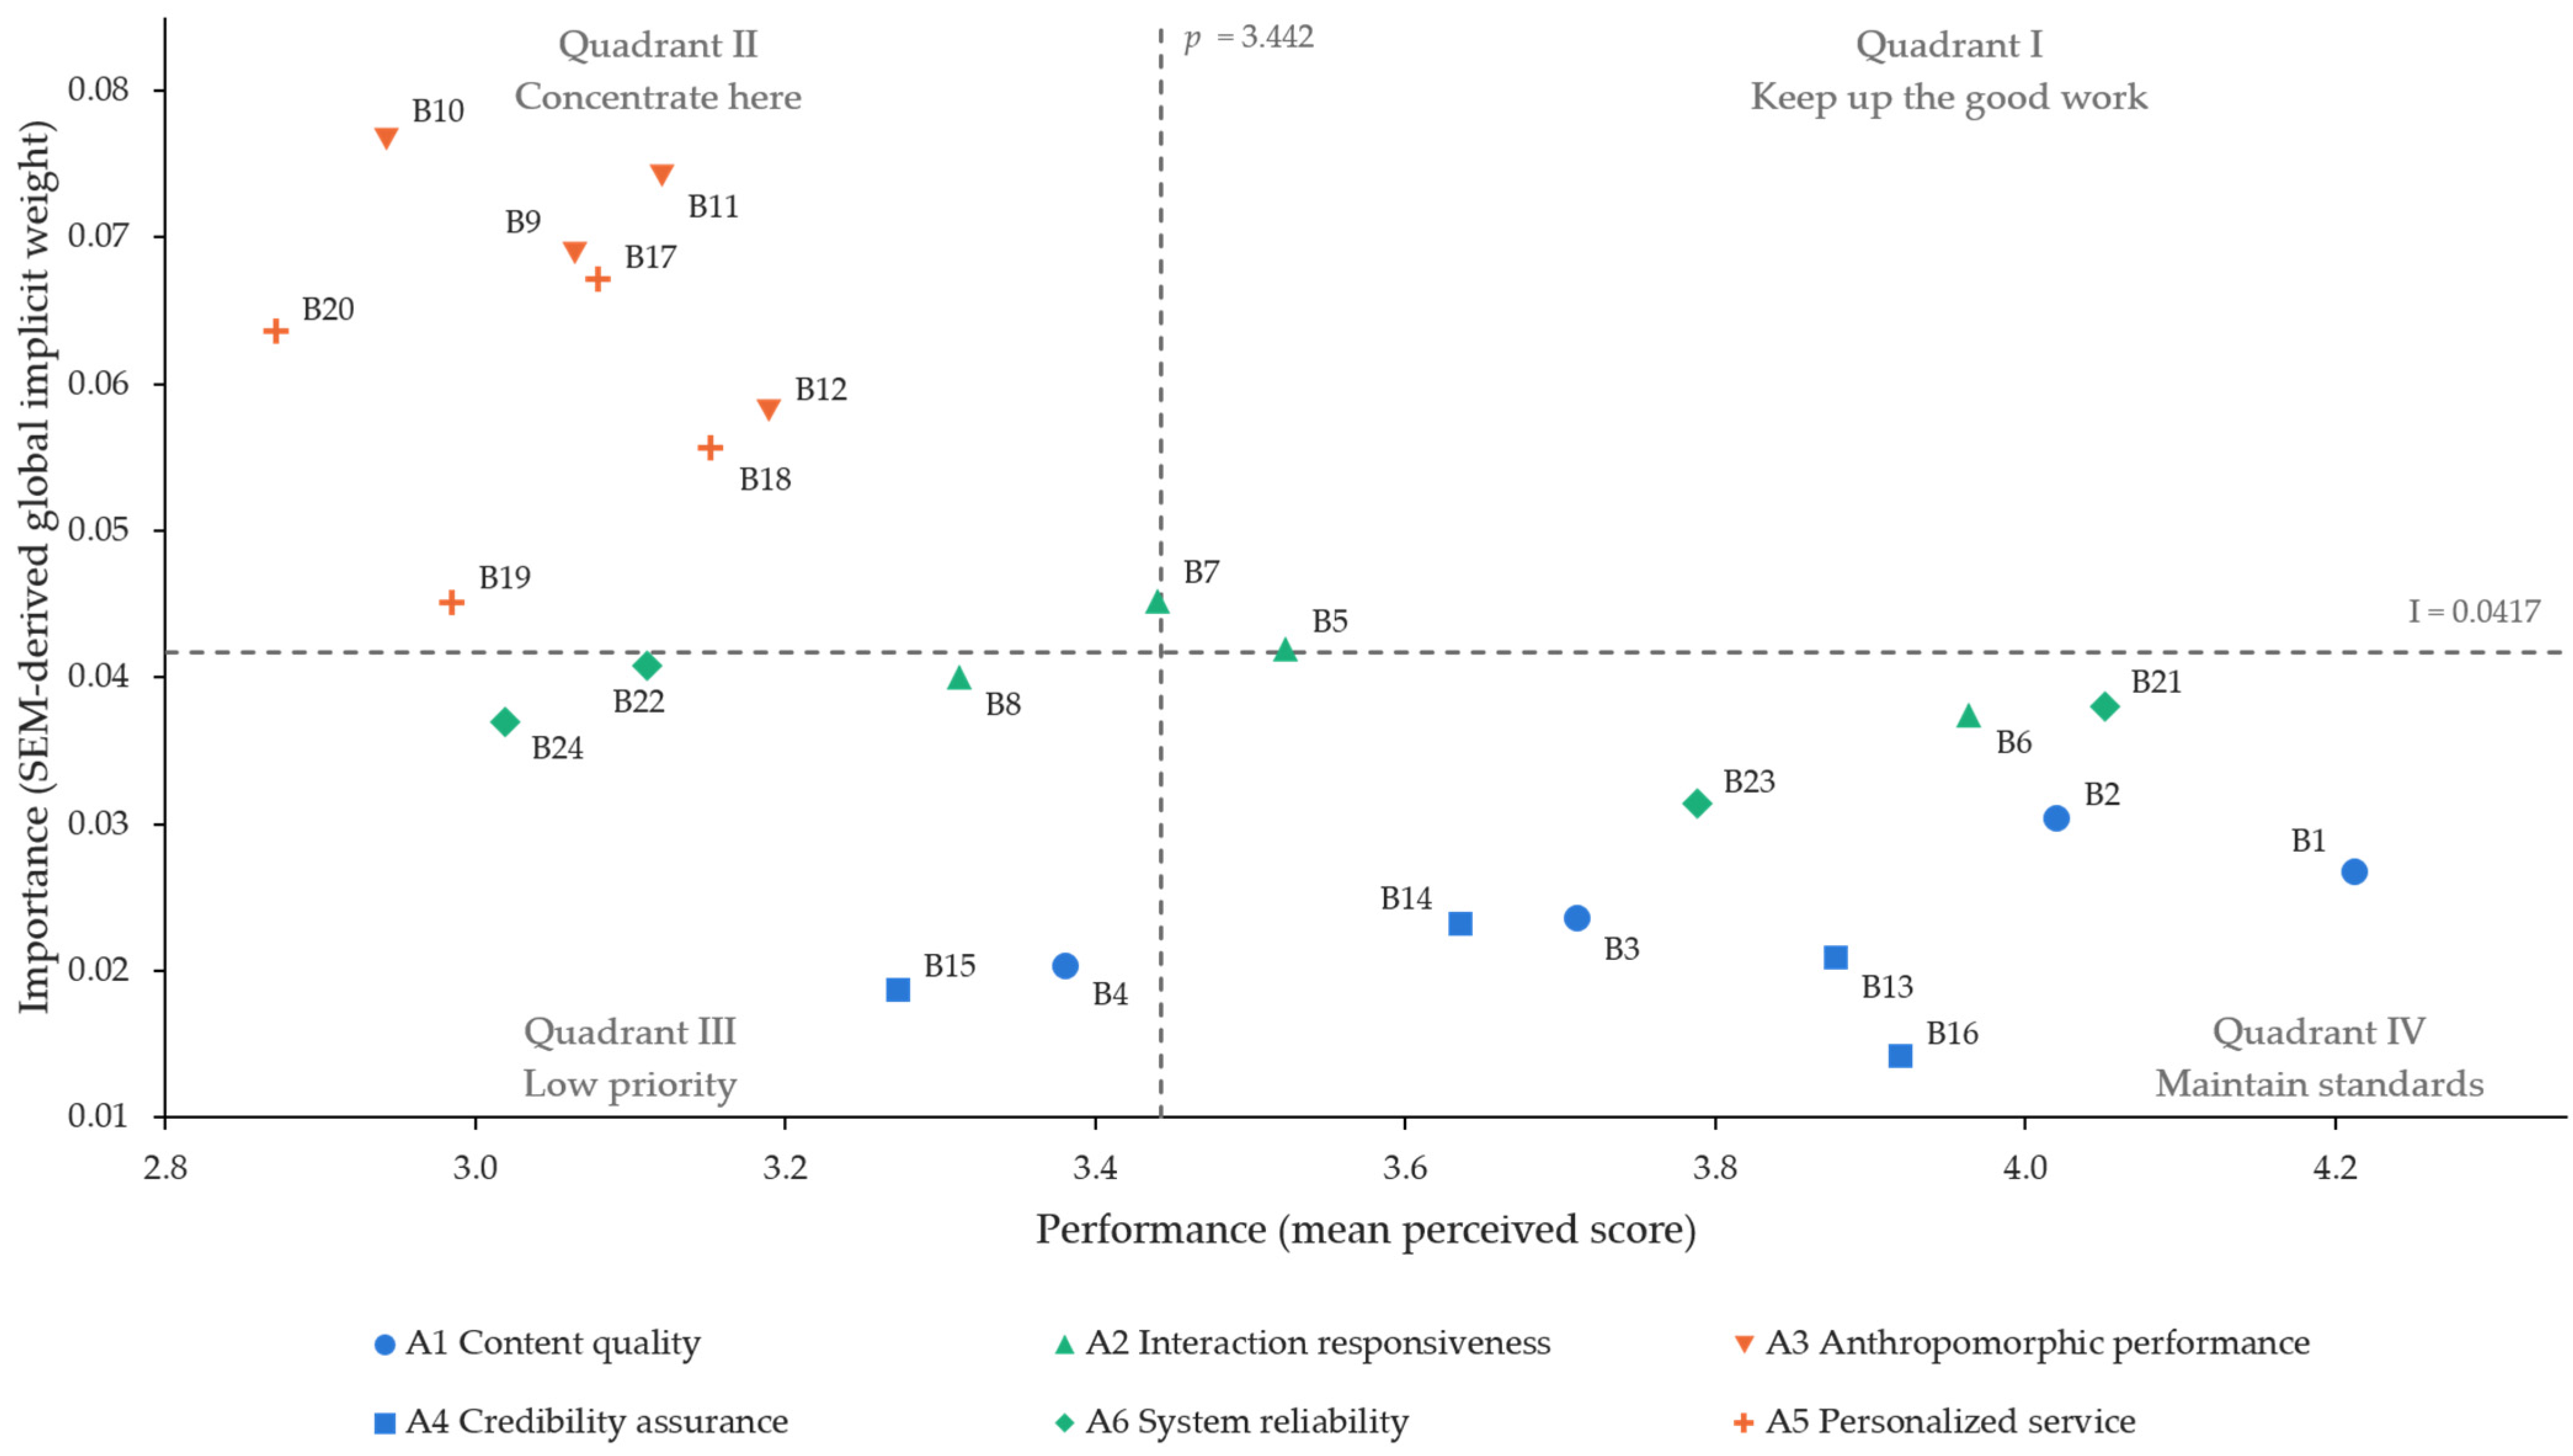

Disclaimer/Publisher’s Note: The statements, opinions and data contained in all publications are solely those of the individual author(s) and contributor(s) and not of MDPI and/or the editor(s). MDPI and/or the editor(s) disclaim responsibility for any injury to people or property resulting from any ideas, methods, instructions or products referred to in the content. |
© 2026 by the authors. Licensee MDPI, Basel, Switzerland. This article is an open access article distributed under the terms and conditions of the Creative Commons Attribution (CC BY) license.