


Highlights
Please indicate how your work links to systems science via your contributions to systems practice, theory, and/or methodology.
- Operationalizes a bounded disclosure architecture through cross-layer configuration, weakest-layer information, subsequent cross-domain technological recombination, and historically predetermined organizational capacity.
- Measures cross-domain recombination with firm-first ICT–production technology patent combinations.
What are the main findings and/or the implications of the main findings?
- Complete disclosure predicts novel-combination applications and subsequent granted-application counts, but not general patent expansion or conditional grant probability.
- The signal is stronger in historically larger firms and adds only small out-of-time predictive gains; it is not evidence of adoption or causal innovation performance.
Abstract
Annual reports increasingly mention digital technologies, but whether multi-layer disclosure predicts technological recombination is unclear. We classify disclosure into data infrastructure, intelligent analytics, and business execution, and define complete disclosure as the presence of all three. We track invention patents containing firm-first combinations of information and communication technology (ICT) and production technology. The sample matches 2017–2021 reports for 2669 Chinese manufacturers to patent histories from 1985 to 2024, yielding 10,478 firm-year observations. After controlling for digital disclosure, prior patents, firm characteristics, and high-dimensional fixed effects, complete disclosure is associated with a 5.26% higher value of one plus the novel-combination application count three years later and a 4.01 percentage-point higher probability of at least one application. The association is stronger among larger firms. Complete disclosure also predicts more applications granted within two years but not a higher grant probability conditional on filing. Out-of-time predictive gains are detectable but small. Independent coding shows that complete disclosure is not equivalent to technology adoption, while strict patent co-classification enriches for substantive links between digital technologies and production processes. For investors, regulators, and managers, multi-layer disclosure is a conditional signal of future recombination, not evidence of deployment, patent quality, commercialization, or causal performance.
1. Introduction
Annual-report text has become an important source for identifying corporate priorities and intangible activities [1,2,3]. It is especially useful for studying digitalization because software, data infrastructure, and algorithmic projects are not fully visible in standard financial accounts. Yet firms may also mention digital technologies to follow industry language, respond to policy, or communicate with capital markets. Prior research links corporate digital language to financing, risk, and innovation [4,5,6] but also documents gaps between digital claims and investment, strategic presentation, and digital washing [7,8,9,10,11]. A higher keyword count therefore does not necessarily indicate broader technology adoption. The relevant question is whether the structure of digital disclosure contains information beyond total word frequency and whether that information appears in subsequent technological output.
This question has a systems dimension in manufacturing. Digitalization often spans data collection and connectivity, analysis and prediction, and the integration of analytical output into equipment, processes, and production management. These functions are conceptually connected, but the available data do not reveal whether they are jointly deployed or operationally interdependent within the firm. Research on information technology and organizational complementarities shows that the returns to digital investment depend on the work organization, employee skills, and other technology modules [12,13,14,15]. Studies of manufacturing firms also find that internet applications, external knowledge search, and absorptive capacity shape process and exploratory innovation [16,17]. When an annual report covers data infrastructure, intelligent analytics, and business execution together, the text does not prove that these modules are operating. It may, however, reveal that management is organizing a technology agenda across layers. If that agenda has substantive content, it should precede new links between information and communication technology (ICT) knowledge and production knowledge, rather than a general rise in patenting.
We use “system” in a bounded analytical sense rather than as a synonym for a bundle of digital technologies. The framework distinguishes four dimensions: the presence of multiple functional elements, cross-layer architectural configuration, information contained in the weakest layer, and organizational boundary conditions affecting the reliability of the signal. Conventional complementarity analysis generally asks whether jointly deployed inputs generate superadditive performance. We do not observe joint deployment or operating returns. Instead, we operationalize a bounded disclosure architecture and examine whether cross-layer configuration and weakest-layer information predict subsequent firm-first ICT–production technology recombination, conditional on historically predetermined organizational capacity.
We examine whether multi-layer digital disclosure predicts subsequent technological recombination. We first identify three disclosure layers in listed-company annual reports: data infrastructure, intelligent analytics, and business execution. Complete disclosure means that all three layers appear in the same report. We then use International Patent Classification (IPC) codes to identify invention patents that contain both a strict ICT subclass and a production technology subclass. Each four-digit ICT and production technology pair is compared with the firm’s patent history since 1985. The main outcome is the number of invention patent applications filed three years after the report year that contain at least one pair not previously observed for the firm. Because annual reports are usually published in the following calendar year, this outcome occurs roughly two years after public disclosure.
The strict sample covers annual reports from 2017 to 2021 and patent outcomes from 2020 to 2024. It contains 10,478 firm-year observations for 2669 firms in 29 two-digit manufacturing industries. The baseline model includes firm, industry-by-year, and province-by-year fixed effects. It also controls for total digital disclosure, prior ICT and invention patent stocks, and firm size, cash, leverage, inventory, research and development (R&D), and capital intensity measured before the report year. The coefficient on Complete is 0.0513, which corresponds to a 5.26% conditional difference in one plus the novel-combination patent count. Complete disclosure is also associated with a 4.01 percentage-point higher probability of at least one novel-combination patent. The finding holds with a five-year novelty window, counts of distinct combinations, combination shares, and Poisson pseudo-maximum likelihood. Among applications with a complete two-year observation window, complete disclosure predicts more novel-combination applications that later receive a grant. It does not predict a higher grant probability among applications already filed. Nor does it consistently predict all invention patents, portfolio entropy, or broad portfolio redirection. The evidence therefore concerns the formation and progression of new links between ICT and production knowledge, not general innovation growth or higher quality per application.
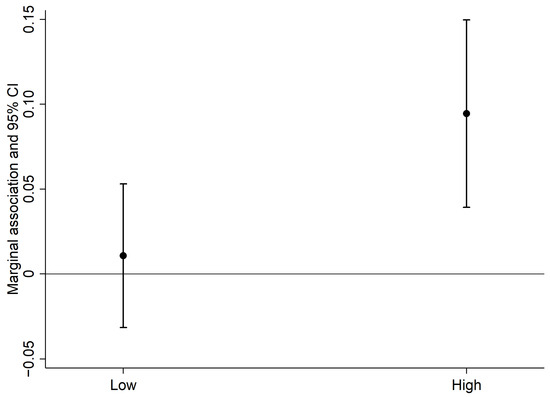
The structure of disclosure also matters. The all-three-layer state exceeds the average association of the three two-layer states by 0.0494. A stronger weakest layer predicts more novel-combination patents, while balance across layers yields a similar but less precise result. Historical firm scale is an important boundary condition. The marginal association of Complete is close to zero at one standard deviation below mean scale and 0.0945 at one standard deviation above it. The result survives controls for pre-report patent trends, patenting in the report year and the next two years, a future-disclosure negative control, overlap weighting, and a sample restricted to firms that change disclosure status. None of 1999 residual-label permutations within industry-year cells produces a coefficient as large in absolute value as the observed estimate. A stacked event-time comparison with clean controls shows no significant difference in novel-combination patents in the two periods before the first sustained complete disclosure. The difference appears in the transition year and is largest in year three. The corresponding analysis of all invention patents shows a pre-existing difference and no post-transition increase. An out-of-time exercise, trained on disclosures from 2017 to 2019 and outcomes from 2020 to 2022 and tested on disclosures from 2020 to 2021 and outcomes from 2023 to 2024, produces statistically detectable but small predictive gains. Disclosure architecture is therefore more useful for screening than as a stand-alone forecasting tool.
Chinese manufacturing provides a useful setting. A-share firms follow a standardized annual disclosure cycle, manufacturing patent records have broad coverage, and the integration of digital technologies with the real economy advanced throughout the study period. China’s Fourteenth Five-Year Plan for the Digital Economy promoted this integration, but we do not treat that plan or any other policy as an intervention. The institutional setting explains why firms increasingly discuss digitalization; the empirical question is whether the internal structure of that discussion predicts later technology combinations.
The study makes three contributions. First, it moves the measurement of digital disclosure from total frequency to disclosure architecture. Layer states, weakest-layer intensity, and cross-layer balance provide observable indicators of disclosure architecture that are consistent with, but do not directly identify, module interdependence. The systems contribution lies in linking cross-layer configuration, bottleneck information, subsequent cross-domain output, and historically predetermined organizational capacity within one bounded empirical framework. This differs from a conventional complementarity test because we do not estimate superadditive returns from jointly deployed technologies. Second, prior work uses firm patent records to identify the integration of digital and physical technologies and to compare digital claims with technological innovation [18,19]. We narrow the subsequent outcome to ICT and production technology IPC combinations not previously observed for the firm. This measure is closer to the recombination of existing knowledge components [20,21,22,23,24] and can be reproduced from public classification fields. Third, two manual audits define the limits of both measures. Independent coding of 394 annual-report sentences shows that complete disclosure is not a proxy for implementation. An independent blinded review of 200 patents by two coders shows that strict co-classification substantially enriches for functional links between digital technologies and production processes. The resulting claim is deliberately specific: multi-layer disclosure is a conditional forward-looking signal whose reliability depends on disclosure architecture and organizational capacity.
The remainder of the article proceeds as follows. Section 2 reviews the relevant literature and develops the hypotheses. Section 3 describes the data, measures, and statistical methods. Section 4 reports the results. Section 5 discusses their theoretical and practical implications and their limits beyond the Chinese setting. Section 6 concludes. The Supplementary Information provides the full dictionary, patent classification rules, robustness tests, identification diagnostics, prespecified organizational boundary tests, and out-of-time prediction results.
2. Literature Background and Hypothesis Development
2.1. Forward-Looking Content and Contextual Limits of Digital Disclosure
Corporate disclosure can reduce information asymmetry between managers and outside investors, but managers retain discretion over wording and emphasis [1,2,3]. Digital activities often involve dispersed investment, inconsistent accounting categories, and delayed output. Annual reports may therefore reveal a firm’s technology priorities before those priorities appear in financial accounts or granted patents. Disclosure can contain forward-looking information when it arises from budgeting, project coordination, or an R&D agenda.
That information content is not automatic. Digital terminology is salient, so firms can use popular concepts to respond to regulatory and market expectations or simply describe plans, background conditions, and peer trends [4,7,8,9,10,11]. Treating every keyword occurrence as implementation conflates action, intention, and narrative. A report that covers data infrastructure, intelligent analytics, and business execution addresses a broader problem space than a single keyword count. It remains a disclosure state, but it may correspond to a technology agenda that spans infrastructure, analysis, and production settings. If the agenda has a technological basis, the three-layer structure should predict subsequent observable output after total disclosure frequency and prior patent accumulation are held constant.
H1.
Conditional on total digital disclosure, prior patent stocks, and pre-disclosure firm characteristics, complete three-layer digital disclosure is positively associated with novel ICT and production technology patent combinations three years later.
2.2. Disclosure Architecture, Weakest-Layer Information, and Technological Recombination
A manufacturing firm can be viewed as a socio-technical system composed of technology modules, people, processes, and external relationships. The data infrastructure layer collects, stores, and connects information. The intelligent analytics layer converts data into detection, prediction, and optimization. The business execution layer embeds those outputs in product design, process control, equipment maintenance, and production management. Conceptually, a missing or weak layer may interrupt the sequence, which motivates the weakest-layer test. Algorithms cannot operate reliably without stable data; data have limited operational value without analysis; and analytical output does not become a production solution without an execution setting. Evidence that information technology creates value through joint organizational and technological configurations is consistent with this interdependence [12,13,14,15,16,17].
The analytical boundary is the A-share manufacturing firm. Data infrastructure, intelligent analytics, and business execution are treated as functionally differentiated modules within a potentially interdependent architecture. R&D staff, financial resources, organizational coordination, and intellectual property management provide the capacity to operate them. Disclosure rules, industry technology opportunities, and the external knowledge environment form the system environment. We do not observe whether the three modules are jointly deployed, operationally connected, or linked through feedback and adaptive reconfiguration within the firm. We test whether their joint presence in public disclosure predicts later cross-domain technology combinations. The empirical system boundary is therefore the firm’s internal modules and organizational capacity; the outcome boundary is subsequent firm-level patent recombinations. Neither extends to supply-chain restructuring or the actual deployment of a digital system.
Innovation itself often proceeds through recombination. An invention need not rely on entirely unfamiliar knowledge; it may connect existing components in a new way [20,21]. Patent classification combinations can identify this form of novelty. Multiple classifications on the same patent indicate that examination and classification place its technical scope across the corresponding fields. A pair not seen in the firm’s prior patents provides a firm-level measure of a new connection [22,23,24]. In our setting, the joint appearance of a four-digit ICT subclass and a four-digit mechanical, material, chemical engineering, or production-control subclass indicates that the patent document contains an observable cross-domain solution.
If complete disclosure reflects a relatively coherent technology agenda, the all-three-layer state should predict such combinations more strongly than a state covering only two layers. The weakest link may also constrain the signal. High total frequency does not create a complete cross-layer problem space if one layer is nearly absent. A more balanced distribution may better cover the sequence from information infrastructure through analysis to production use. These tests concern the information content of disclosure structure; they do not imply that words create patents.
H2a.
The association between the all-three-layer disclosure state and subsequent novel ICT and production technology combinations is stronger than the average association of the three two-layer states.
H2b.
Conditional on total digital disclosure, a stronger weakest layer and greater balance across the three layers are associated with more subsequent novel ICT and production technology combinations.
2.3. Organizational Capacity
Cross-domain invention requires more than a technical idea. Firms also need R&D personnel, experimental facilities, coordination across departments, and intellectual property management. Larger firms generally have more complete R&D functions, a broader stock of knowledge that can be recombined, and greater capacity to absorb the fixed cost from proof of concept to patent application. Smaller firms may describe an equally broad digital direction yet lack the financial, human, or project-governance resources needed to produce a formal application.
Scale can also add hierarchy and slow decisions, so it is not sufficient for successful digitalization. We focus instead on the conditional reliability of the disclosure signal. If complete disclosure is connected to an internal technology agenda, firms with greater organizational resources should be better able to convert that agenda into observable combination applications. Evidence from the United States shows that artificial intelligence adoption is concentrated among larger firms [15], while work on European manufacturing of small- and medium-sized enterprises stresses the limits imposed by financial and organizational resources [25].
H3.
The positive association between complete disclosure and subsequent novel ICT and production technology combinations is stronger for firms with larger historical scale.
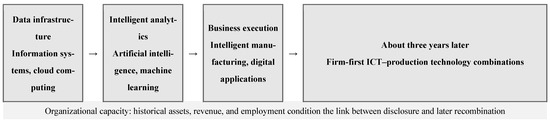
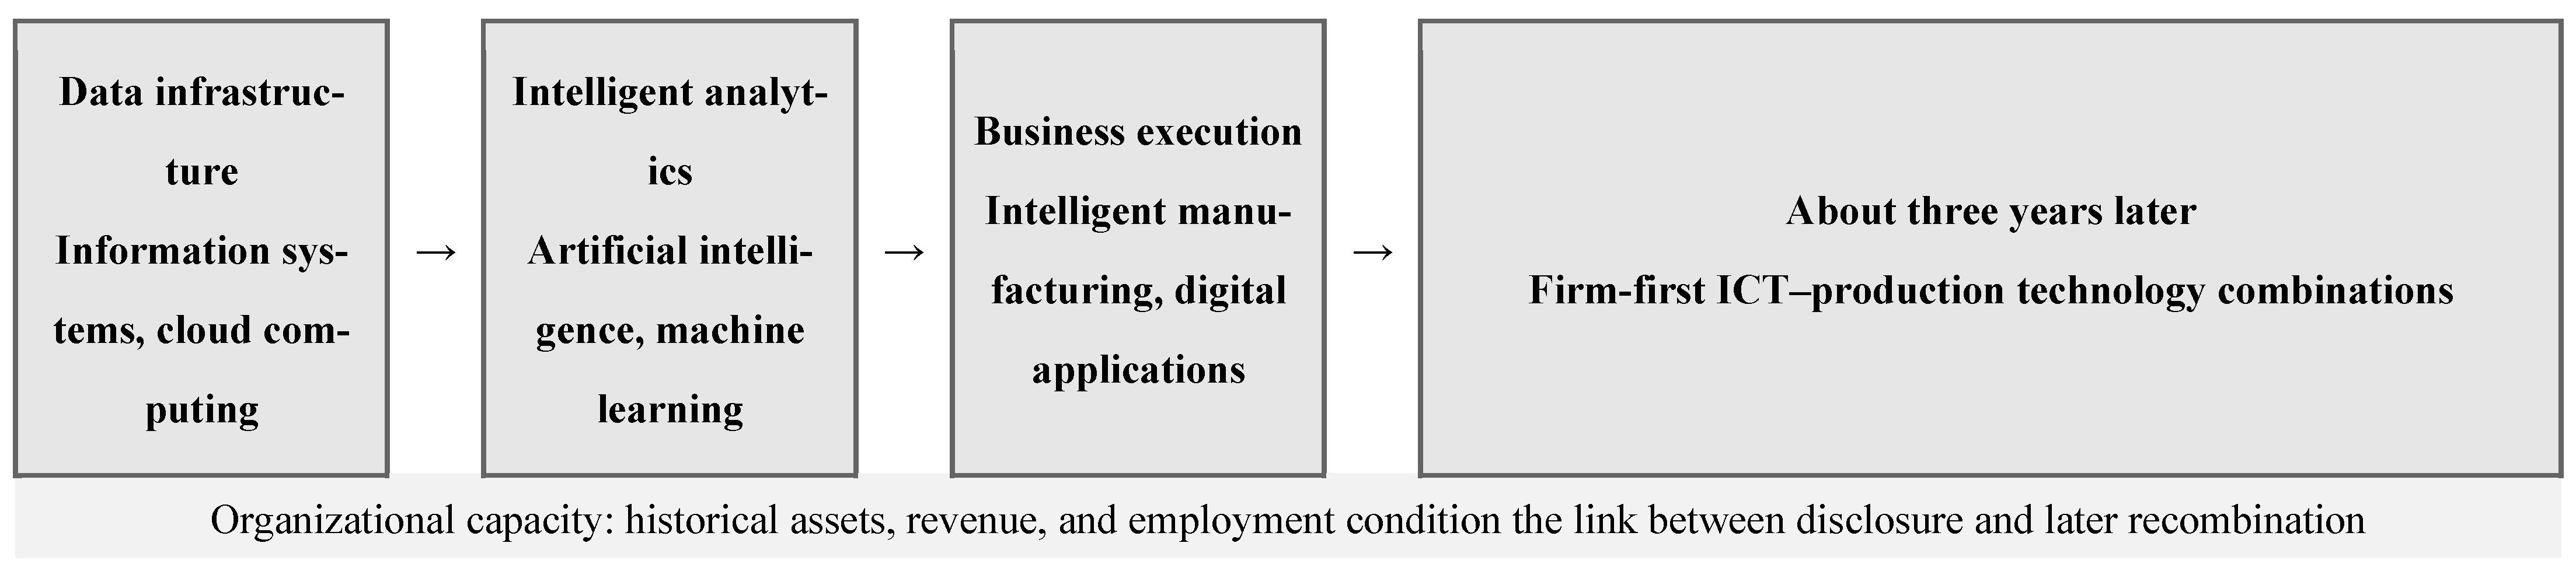
Figure 1 summarizes the bounded analytical framework and the temporal ordering among multi-layer disclosure, organizational capacity, and subsequent technological recombination.
Figure 1.
Analytical framework: multi-layer disclosure, organizational capacity, and subsequent technological recombination. Note: Complete disclosure means only that all three types of content appear. The arrows represent the temporal and predictive relationships examined in the study; they do not indicate that a digital system has been deployed or that the relationship is causal.
3. Materials and Methods
This section translates the proposed bounded disclosure architecture into observable measures. We construct disclosure architecture, novel ICT and production technology combinations, and organizational-resource measures within a common firm-year framework. We then specify the baseline model, architecture comparisons, event-time analysis, and organizational boundary tests.
3.1. Data Sources and Sample Construction
We use three original data sources. First, listed-company annual reports provide the text used to construct digital disclosure measures. Reports are organized by six-digit stock code and fiscal year. We extract the Chinese body text and remove headers, footers, anomalous characters, and duplicated passages. Second, the Listed-Company Patent Detail Database provides application numbers, application and grant years, patent type, primary and additional IPC classifications, titles, abstracts, and principal claims. We aggregate patents filed by listed firms and their affiliated entities using the linked stock code and deduplicate application numbers within each stock code. Patent applications and the main outcomes are observed through 2024, while grant status is updated through May 2026. Third, the China Stock Market & Accounting Research (CSMAR) database provides industry, province, total assets, cash, liabilities, inventory, R&D, fixed assets, and other firm information. The authors perform all text cleaning, firm-year matching, IPC parsing, historical-combination comparisons, grant-window coding, and construction of regression variables. Text extraction, dictionary matching, IPC parsing, and variable construction were performed using Python 3.12.10 (Python Software Foundation, Wilmington, DE, USA). Statistical analyses were conducted using Stata/MP 14.0 (StataCorp LLC, College Station, TX, USA).
The source text spans 2013 to 2024. Patent records from 1985 to 2024 define the novelty history, and grant outcomes are followed through May 2026. To keep outcome years complete and controls predetermined, the strict regression sample uses annual reports from 2017 to 2021 and matches them to patent applications from 2020 to 2024. The initial text–patent match contains 11,664 firm-year observations for 2994 firms. Requiring nonmissing predetermined financial controls other than R&D leaves 10,478 observations for 2669 firms. For estimation, missing R&D is coded as zero and accompanied by a missing-value indicator; we do not infer the unobserved R&D value from other covariates. Continuous financial variables are winsorized at the 1st and 99th percentiles.
Table 1 describes the sample. Complete disclosure accounts for 22.80% of the strict sample and rises from 14.87% in 2017 to 28.53% in 2021. A novel-combination patent appears three years after the report year in 15.24% of observations. The mean count is 0.344 and the median is zero. Because the outcome is zero-inflated and right-skewed, we report extensive-margin, distinct-combination, and Poisson pseudo-maximum likelihood estimates in addition to the log-linear specification.
Table 1.
Sample construction, year alignment, and descriptive statistics.
3.2. Multi-Layer Digital Technology Disclosure
We divide the dictionary into three layers according to the role of a technology in the manufacturing decision chain. The data infrastructure layer includes cloud computing, big data, information systems, and the industrial internet. The intelligent analytics layer includes artificial intelligence, machine learning, and intelligent data analysis. The business execution layer includes intelligent manufacturing and the application of digital technologies in operating settings. We divide each layer’s keyword count by the number of Chinese characters in the report, scale it per 10,000 characters, and transform it as ln(1 + x). Complete equals one when every layer contains at least one match. DigitalIntensity is calculated as ln[1 + 10,000 × (the total digital-keyword count divided by the number of Chinese characters in the report)] and controls for the overall frequency of digital language.
The baseline threshold is deliberately transparent. It measures disclosure coverage, not adoption. Business execution terms may include heterogeneous references to e-commerce, mobile payments, digital marketing, and financial technology. We therefore use two narrower definitions. The first removes broad financial, departmental, and market-oriented expressions. The second retains only intelligent manufacturing as evidence of business execution. We also require at least two hits per layer, test for complete disclosure in consecutive years, and combine persistence with the narrow dictionary. Raising a count threshold mechanically need not improve measurement because it may remove infrequent but specific statements. We report every definition regardless of statistical significance.
3.3. Novel ICT and Production Technology Patent Combinations
The patent measure is constructed in four steps. First, we retain invention patents and extract four-digit codes from primary and additional IPC fields. Second, the strict ICT set contains G06F, G06K, G06N, G06Q, G06T, G10L, H04L, and H04W, following the OECD ICT patent taxonomy and the European Patent Office’s classification of fourth industrial revolution technologies [26,27]. Prior patent research also uses classification co-occurrence to identify technological convergence [28,29]. Production technologies cover manufacturing processes, machining, chemical engineering, materials handling, logistics and packaging, energy equipment, and production control. Table S2 reports the full code list and screening rules. Third, we form every four-digit ICT and production technology pair that occurs on the same patent. Fourth, we compare each pair in year t with all pairs observed for that firm from 1985 through t − 1. An invention patent is a novel-combination patent if it contains at least one previously unobserved pair.
The main outcome, NovelRecomb, is ln(1 + the number of novel-combination applications) in year s + 3, where s is the report year. Application year is closer to the timing of technological activity than grant year and is less affected by differences in examination duration. Alternative outcomes include an indicator for at least one novel-combination patent, the number of new pairs, combinations not seen in the previous five years, the share of novel-combination patents among strict co-classified patents, and the raw count, estimated by Poisson pseudo-maximum likelihood. We also use grant years observed through May 2026 to identify applications granted within two years. Applications from 2020 to 2023 provide a complete two-year observation window. Within filed novel-combination applications, we separately estimate the conditional grant probability. Granted-application counts capture how many applications progress to an observed grant, whereas conditional grant probabilities describe screening within the set of filed applications. Neither is a direct measure of economic value or commercialization. Negative-control outcomes include all invention patents, the number of four-digit IPC classes, portfolio entropy, and the Jaccard distance from the previous three years.
3.4. Manual Validation Audits
Table 2 reports the results of the two manual validation audits.The annual-report audit draws a stratified sample of 400 manufacturing firm-years from 2013 to 2024 by year and disclosure combination. We downloaded and verified 397 reports, and 394 firm-years contain a codable sentence. Two coders, blinded to the regression results and to each other’s decisions, classified the focal sentence as current application, planned development, policy or market background, or other. They resolved disagreements after reviewing the surrounding text. Initial agreement was 92.13%, with a Cohen’s kappa of 0.892. After adjudication, only 64 sentences clearly described current application. Conditional on year and industry, Complete does not consistently predict current-application language; the industry-level wild-cluster bootstrap p-value is 0.323. Complete should therefore be interpreted as disclosure architecture rather than technology adoption.
Table 2.
Manual validity audits of annual-report text and patent classification.
The patent audit uses 200 invention patents stratified by prespecified machine-coded indicators. Two coders review titles, abstracts, principal claims, and IPC information. They independently judge whether a patent contains a substantive digital technology, a specific production object, and a functional link between them in the same technical solution. Initial agreement is 94.50%, with a kappa of 0.843 [30]. Among 51 strictly co-classified patents, 26 are judged to contain a substantive link. The corresponding count is 20 among 149 non-co-classified patents, a difference of 37.56 percentage points and an odds ratio of 6.708 (two-sided Fisher p < 0.001). The stratified audit does not estimate the positive rate in the full database. It tests whether the classification rule enriches for the intended technical content.
3.5. Statistical Methods and Inference
The baseline model is
The subscripts i, j, p, and s denote the firm, two-digit manufacturing industry, province, and report year, respectively. NovelRecomb is the natural logarithm of one plus the number of novel ICT–production technology combination patent applications filed by firm i in year s + 3. Complete equals one if all three disclosure layers appear in the annual report for year s, while DigitalIntensity controls for the overall intensity of digital disclosure in the same report. PatentBase contains the logarithmic three-year stocks of ICT invention patent applications and all invention patent applications filed from s − 2 through s. Because annual reports for fiscal year s are normally released in year s + 1, these patent stocks are observed before the report becomes public. X contains firm size, the cash-to-assets ratio, leverage, the inventory-to-assets ratio, R&D intensity, an indicator for missing R&D data, and the fixed-assets-to-assets ratio, all measured in year s − 1. Firm fixed effects, μ, absorb time-invariant firm characteristics; industry-by-year fixed effects, λ, absorb annual technological conditions common to firms in the same industry; and province-by-year fixed effects, φ, absorb local annual conditions. The coefficient β therefore captures the conditional within-firm association between complete multi-layer disclosure in year s and novel-combination patenting in year s + 3. It is interpreted as an association rather than a causal effect.
Standard errors are clustered by firm because Complete and the outcomes vary at the firm-year level. As checks for a small number of common technology environments, we also cluster by the 29 industries and use a wild cluster bootstrap with 9999 Rademacher draws [31]. Count outcomes are estimated separately by Poisson pseudo-maximum likelihood. Firms choose their disclosure, and unobserved management quality or technology agendas may affect both disclosure and patenting.
3.6. Disclosure Architecture, Event Time, and Organizational Boundary
The architecture test converts the three-layer indicators into eight mutually exclusive states: no layer, three single-layer states, three two-layer states, and the all-three-layer state. To test H2a, we estimate these states in the same regression and compare the coefficient on the all-three-layer state with the mean coefficient on the three two-layer states. The post-estimation contrast is defined as follows:
Here, BA, BE, and AE denote the data infrastructure–analytics, data infrastructure–execution, and analytics–execution states, respectively, while BAE denotes the all-three-layer state. A positive indicates that the all-three-layer state has a stronger association with subsequent technological recombination than the average of the three two-layer states. This contrast is a comparison across disclosure states rather than a temporal change. H2b is examined in separate regressions using two continuous measures: the standardized minimum of the three report-length-normalized layer densities and the standardized Shannon balance index of their keyword shares. The balance index reaches its maximum when the three layers are represented equally and declines as disclosure becomes concentrated in one or two layers.
The event-time analysis defines a transition as the first year in which a firm reports complete disclosure in both the current and following years after reporting incomplete disclosure in the preceding two years. Each transition cohort is combined with clean-control firms that do not report complete disclosure anywhere within the same seven-year window. Let c denote the transition cohort, t the calendar year, and r = t − c the relative year. The stacked event-time model is specified as follows:
In Equation (3), equals one if firm i belongs to transition cohort c. Relative year − 1 is omitted as the reference period. The model includes cohort-by-firm fixed effects, , cohort-by-industry-by-year fixed effects, , and cohort-by-province-by-year fixed effects, . Standard errors are clustered at the firm level. Stacking the cohorts prevents firms undergoing transitions at different times from serving as contaminated controls for one another [32,33,34]. Because entry into complete disclosure is chosen by the firm rather than generated by an exogenous intervention, we interpret Equation (3) as a stacked event-time comparison rather than a causal difference-in-differences design. Its purpose is to examine pre-transition differences and the timing of subsequent outcomes.
H3 is tested by interacting Complete with fixed historical firm scale. is the standardized firm-level mean of log total assets from 2014 to 2016. Fixing this measure before the disclosure and outcome periods prevents the moderator from incorporating information realized during the subsequent patent-outcome period. The corresponding model is
Because is fixed over time, its main effect is absorbed by the firm fixed effects and is therefore not separately estimated in Equation (4). The coefficient captures whether the association between complete disclosure and subsequent novel-combination patenting varies with historical firm scale. Alternative specifications replace historical total assets with mean operating revenue or employment over the same 2014–2016 period. Because the resource measure is standardized, the marginal association of Complete is at one standard deviation below the mean and at one standard deviation above the mean.
4. Results
4.1. Baseline Results
Table 3 adds fixed effects and controls in stages. Column 1 includes firm and year fixed effects; the coefficient on Complete is 0.0457. Column 2 replaces year effects with industry-by-year and province-by-year fixed effects, yielding 0.0447. Column 3 adds total digital disclosure and pre-disclosure patent stocks, and the coefficient rises to 0.0514. Column 4 adds the full set of pre-disclosure financial characteristics. The coefficient is 0.0513, with a firm-clustered standard error of 0.0167 and a p-value of 0.0021. Its direction and magnitude are stable across columns. General digital language, prior patent accumulation, and standard firm characteristics do not account for the main association.
Table 3.
Multi-layer complete disclosure and subsequent firm-first ICT–production technology combinations.
Because the dependent variable is ln(1 + patent count), the column 4 coefficient corresponds to exp(0.0513) −1, or 5.26%. Conditional on the fixed effects and controls, a firm’s predicted value of one plus the novel-combination patent count is, on average, 5.26% higher when its report contains all three layers. This is an association, not a claim that complete disclosure causes a 5.26% increase in patents. Total digital disclosure and the financial controls are not statistically significant in the full model. This does not imply that they are irrelevant to innovation; it means that their short-run deviations from firm-specific levels have no stable independent association once the fixed effects and other controls are included.
4.2. Extensive Margin and Outcome Specificity
Panel A of Table 4 tests whether the baseline result depends on the log transformation or a small number of high values. Replacing the outcome with an indicator for at least one novel-combination patent yields a coefficient of 0.0401, a 4.01 percentage-point difference on the extensive margin. The number of distinct new IPC pairs yields 0.0556. Defining novelty relative to the previous five years produces coefficients of 0.0550 for patent counts and 0.0585 for distinct-pair counts. The share of novel-combination patents among strict co-classified patents is also positively associated with Complete. Finally, the Poisson pseudo-maximum likelihood coefficient is 0.2238. High-dimensional fixed effects remove firms whose outcome is always zero, reducing this sample to 3663 observations, so the estimate is a distributional robustness check rather than a replacement for the full-sample model.
Table 4.
Novel-combination outcomes, outcome specificity, and subsequent grant progress.
Panel B asks whether Complete merely predicts more patenting. Its coefficients are not significant for all invention patents, IPC breadth, portfolio entropy, or the Jaccard distance from the previous three years. Complete disclosure predicts new links between ICT and production technologies, not a broad redirection of the entire patent portfolio or a general expansion of invention patenting. This contrast gives technological recombination a more specific empirical meaning than a count of digital patents.
Panel C separates the formation of novel-combination applications from later grant outcomes. To avoid right-censoring from applications that have not had time to complete examination, we retain applications from 2020 to 2023, each of which has a complete two-year grant window by the database cutoff. The coefficient on Complete is 0.0355 for the number granted within two years (p = 0.0077) and 0.0364 for the probability of at least one grant within two years (p = 0.0118). Complete disclosure thus predicts more novel-combination applications and more applications that reach an observed grant. It does not yet establish higher quality per application.
4.3. Disclosure Architecture and Weakest-Layer Evidence
Table 5 compares disclosure structures directly. Panel A uses no disclosure as the reference state. Among the seven nonzero states, only the all-three-layer state is statistically significant, with a coefficient of 0.0504. No one-layer or two-layer state has a stable association. In Panel B, the all-three-layer state exceeds the average of the three two-layer states by 0.0494 (p = 0.0071). Each pairwise contrast is positive, although its precision varies; Table S3 reports the full set. The evidence supports a difference relative to the average two-layer state, but not superiority over every two-layer state considered separately.
Table 5.
Cross-layer disclosure configuration and weakest-layer evidence.
Panel C evaluates continuous architecture measures. A one-standard-deviation increase in the weakest layer is associated with 0.0230 higher log novel-combination patents (p = 0.0493). Shannon balance has a coefficient of 0.0109 (p = 0.0788), which is directionally consistent but less precise. A saturated model includes the three layers, all pairwise interactions, and the three-way interaction. The fully saturated three-way interaction is 0.0372 (SE = 0.0553, p = 0.501) and is not statistically significant. Although correlations across layers and sparse disclosure states reduce its precision, this result means that the analysis does not establish strict superadditivity or operational interdependence among the three layers. The all-three-layer contrast supports the information content of cross-layer configuration, while the positive weakest-layer coefficient is consistent with a weakest-link condition. The balance estimate is positive but less precise. Table S3 reports all lower-order and interaction terms. Accordingly, H2a is supported, whereas H2b receives partial support from the weakest-layer measure; the balance result remains suggestive.
4.4. Disclosure Definitions, Historical Windows, and Statistical Inference
Table 6 evaluates alternative disclosure definitions, novelty windows, and inference procedures. Panel A first narrows the business execution layer. The coefficient is 0.0453 after removing broad financial, departmental, and market-oriented terms, and 0.0445 when intelligent manufacturing is the only execution term. Both are significant at the 5% level. Persistent-disclosure definitions and mechanical thresholds differ in direction and precision; Table S3 reports them in full. The main association survives two narrower execution definitions, but mechanically higher frequency thresholds or consecutive-year requirements do not necessarily improve disclosure measurement.
Table 6.
Disclosure definitions, novelty windows, and inference with few industry clusters.
Panel B changes the novelty window. The main measure treats a pair as new if the firm has never used it since 1985. A five-year rolling window yields a similar estimate. Leaving out one outcome year at a time produces coefficients from 0.0442 to 0.0671, all positive with p-values below 0.023. Excluding the 2024 outcome gives 0.0671, so the result is not driven by applications near the end of the database that may not yet be fully visible. Leaving out each of the 29 industries in turn yields coefficients from 0.0467 to 0.0553, with all p-values below 0.007.
Panel C addresses inference with a limited number of industry clusters. Clustering by the 29 industries produces the same coefficient, 0.0513, with a standard error of 0.00917. A wild cluster bootstrap with 9999 draws gives a p-value of 0.0003. The industry-clustered standard error is smaller than the firm-clustered value, so we retain the more conservative firm-clustered inference as the main result. The industry-level checks show that common technology environments do not overturn this result.
4.5. Timing, Selection, and Identification Boundary
Table 7 narrows several alternative explanations. First, the Complete coefficient is 0.0516 after controlling for the trend in novel-combination patents over the three years before the report and 0.0522 after controlling for their pre-report mean. Second, patent applications in the report year precede the formal publication of the annual report and may reflect an existing technology agenda. Controlling for report-year novel-combination activity leaves a coefficient of 0.0513. Adding the same outcome from the first and second years after the report produces 0.0541. The three-year association is not a mechanical continuation of contemporaneous patenting. Because intermediate patenting may belong to the actual development path, this specification is an incremental prediction test rather than a causal mediation model.
Table 7.
Timing, selection, permutation, and event-time tests.
Third, following the negative-control approach [35], we include complete disclosure measured after the outcome, together with current Complete. The current coefficient is 0.0697; the future-disclosure coefficient is 0.00518 (p = 0.784). Fourth, overlap weights based on pre-disclosure digital intensity, patent stocks, and firm characteristics yield 0.0571 [36]. Fifth, restricting the sample to 827 firms that change Complete status yields 0.0507. Sixth, we permute residualized Complete labels 1999 times within industry-year cells. The permutation distribution is centered near zero, its 99th percentile is 0.0251, and no permuted coefficient reaches the observed absolute value of 0.0513. The plus-one adjusted two-sided empirical p-value is 0.0005. These tests cannot remove every time-varying omitted factor, but the result is not readily explained by prior patent trends, selection on observed characteristics, permanent disclosure types, or an accidental assignment of disclosure labels.
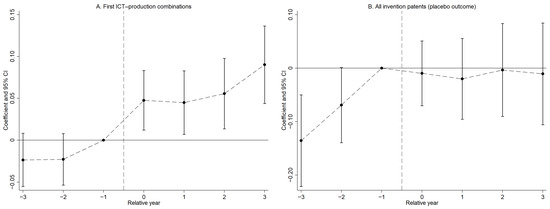
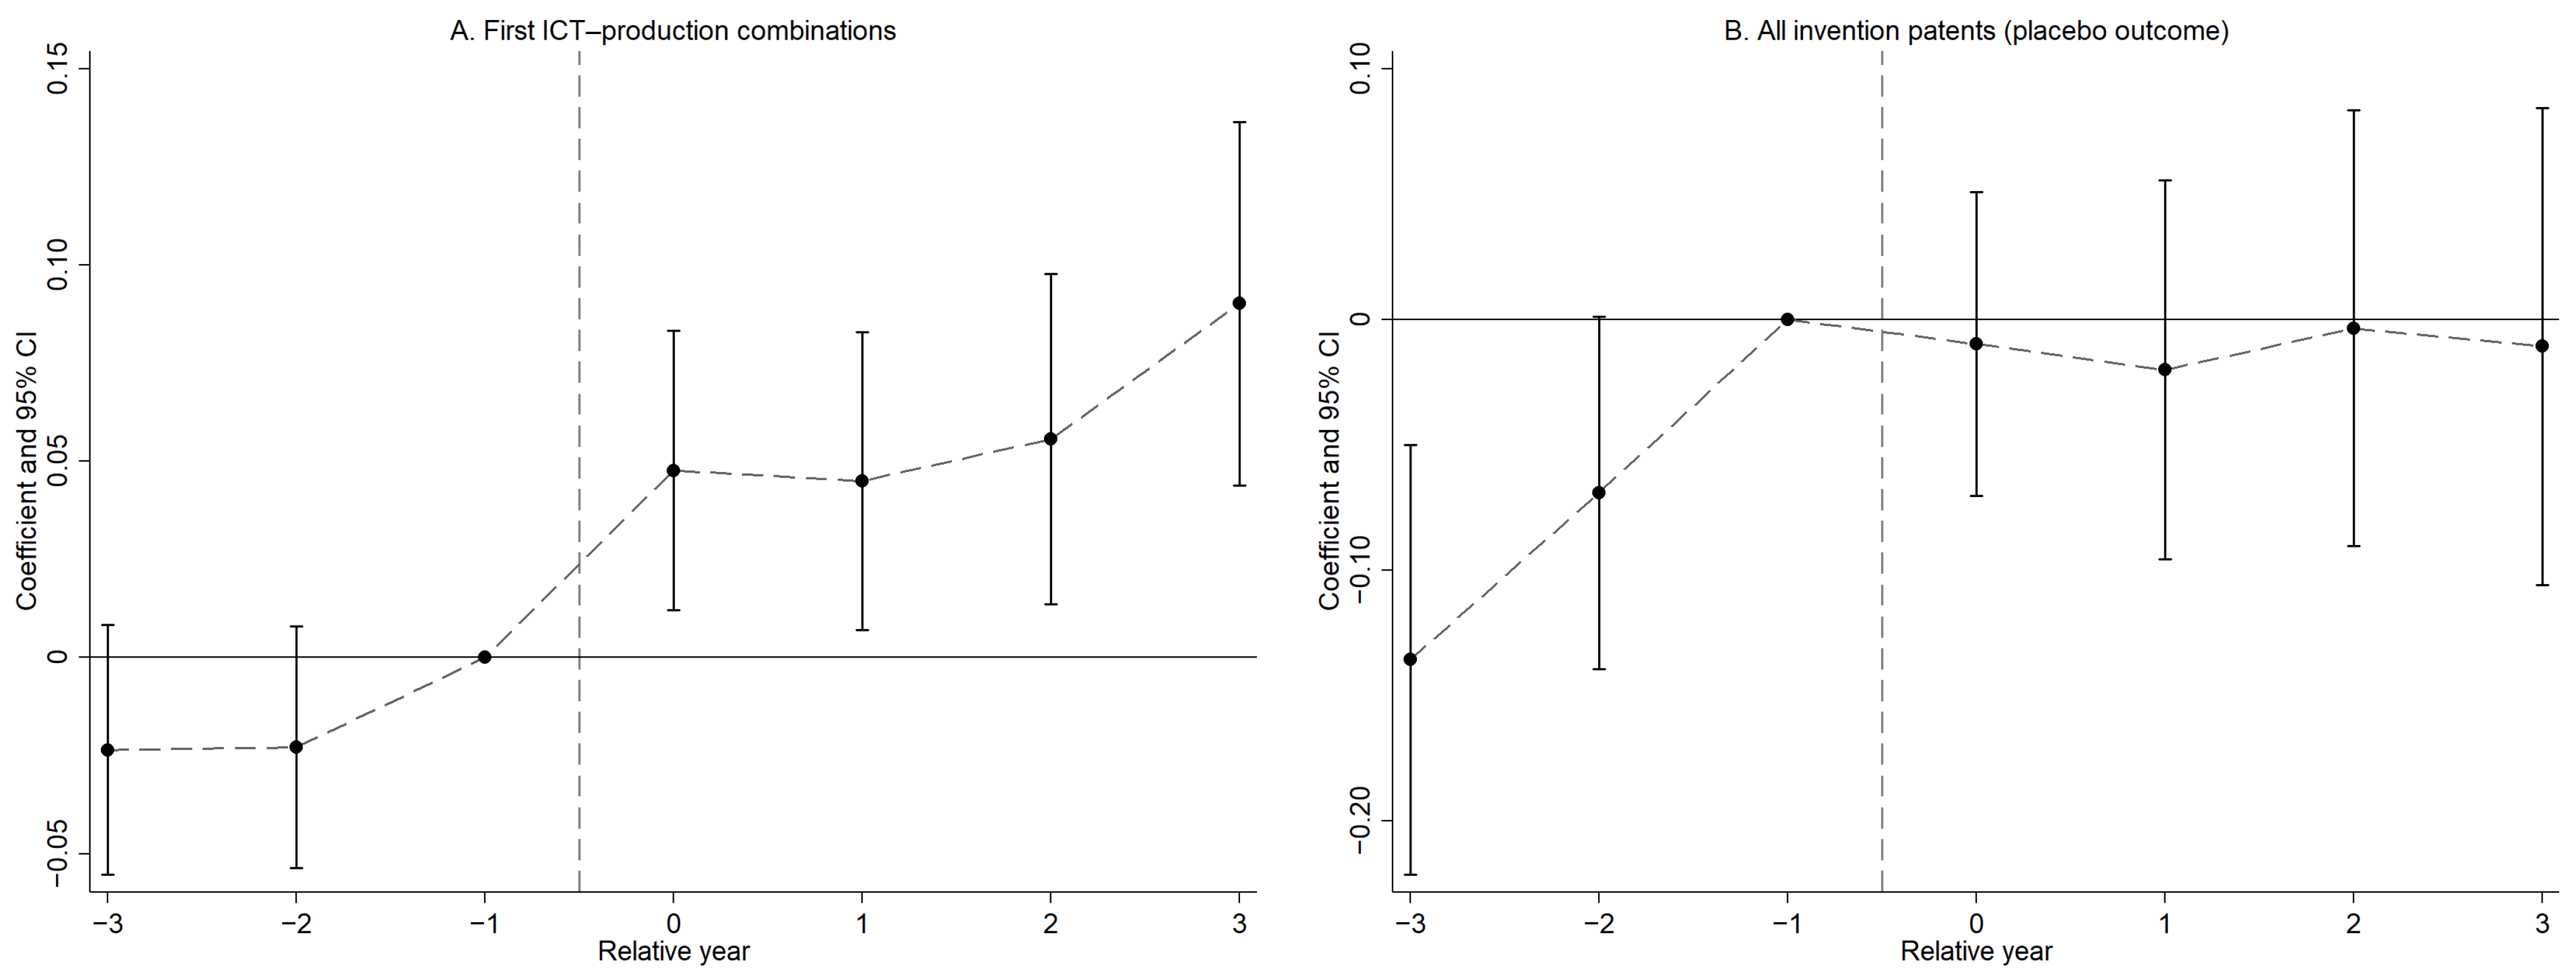
Figure 2 reports the stacked event-time estimates using strict clean controls. In Panel A, coefficients at relative years minus three and minus two are −0.0235 and −0.0228; their joint p-value is 0.261. The coefficient is 0.0477 in the transition year, remains positive, and reaches 0.0902 in year three. Complete disclosure may therefore reveal a technology agenda already taking shape before publication, with information that persists and becomes more visible over time. This timing does not support a claim that disclosure language independently causes innovation, but it is consistent with a forward-looking signal. Panel B uses all invention patents as a placebo outcome. The pre-period coefficients are jointly significant (p = 0.0082), while post-transition coefficients are not. Firms with complete disclosure already differ in general innovation, whereas the main post-transition pattern is specific to novel ICT and production technology combinations. This is why the baseline controls for prior patenting and why the interpretation remains conditional.
Figure 2.
Strict clean-control event-time estimates around the first sustained complete disclosure. Note: Relative year −1 is the reference period. Black dots show the coefficient estimates; vertical solid bars show 95% confidence intervals; the horizontal solid line denotes zero; the vertical dashed line separates the pre-transition period from the transition and post-transition periods; and the dashed segments connecting the dots are included only as a visual guide. Panel (A) uses firm-first ICT–production technology combinations; Panel (B) uses all invention patent applications as a placebo outcome. Treated firms are incomplete in the two preceding years and then report complete disclosure in two consecutive years. Control firms never report complete disclosure during the seven-year cohort window.
Taken together, the two panels in Figure 2 provide a bounded timing result. Novel-combination patents do not differ significantly in the two periods before the first sustained complete disclosure. The difference becomes positive after the transition and grows thereafter. Not all invention patents show the same post-transition pattern. The forward-looking information in complete disclosure is therefore more closely tied to new links between ICT and production knowledge than to a broad increase in innovation. Because firms choose their disclosure state, this is evidence of temporal alignment and outcome specificity, not proof that disclosure causes recombination.
We also construct three shift-share candidate instruments that combine historical disclosure exposure with national digital-disclosure diffusion outside the firm’s industry [37,38]. Their first stages are weak and weaken further after historical exposure trends are included. One candidate also predicts the pre-disclosure patent outcome. We therefore do not use the corresponding two-stage least-squares estimates for causal identification. Table S6 reports the full diagnostics.
4.6. Firm Scale and Signal Reliability
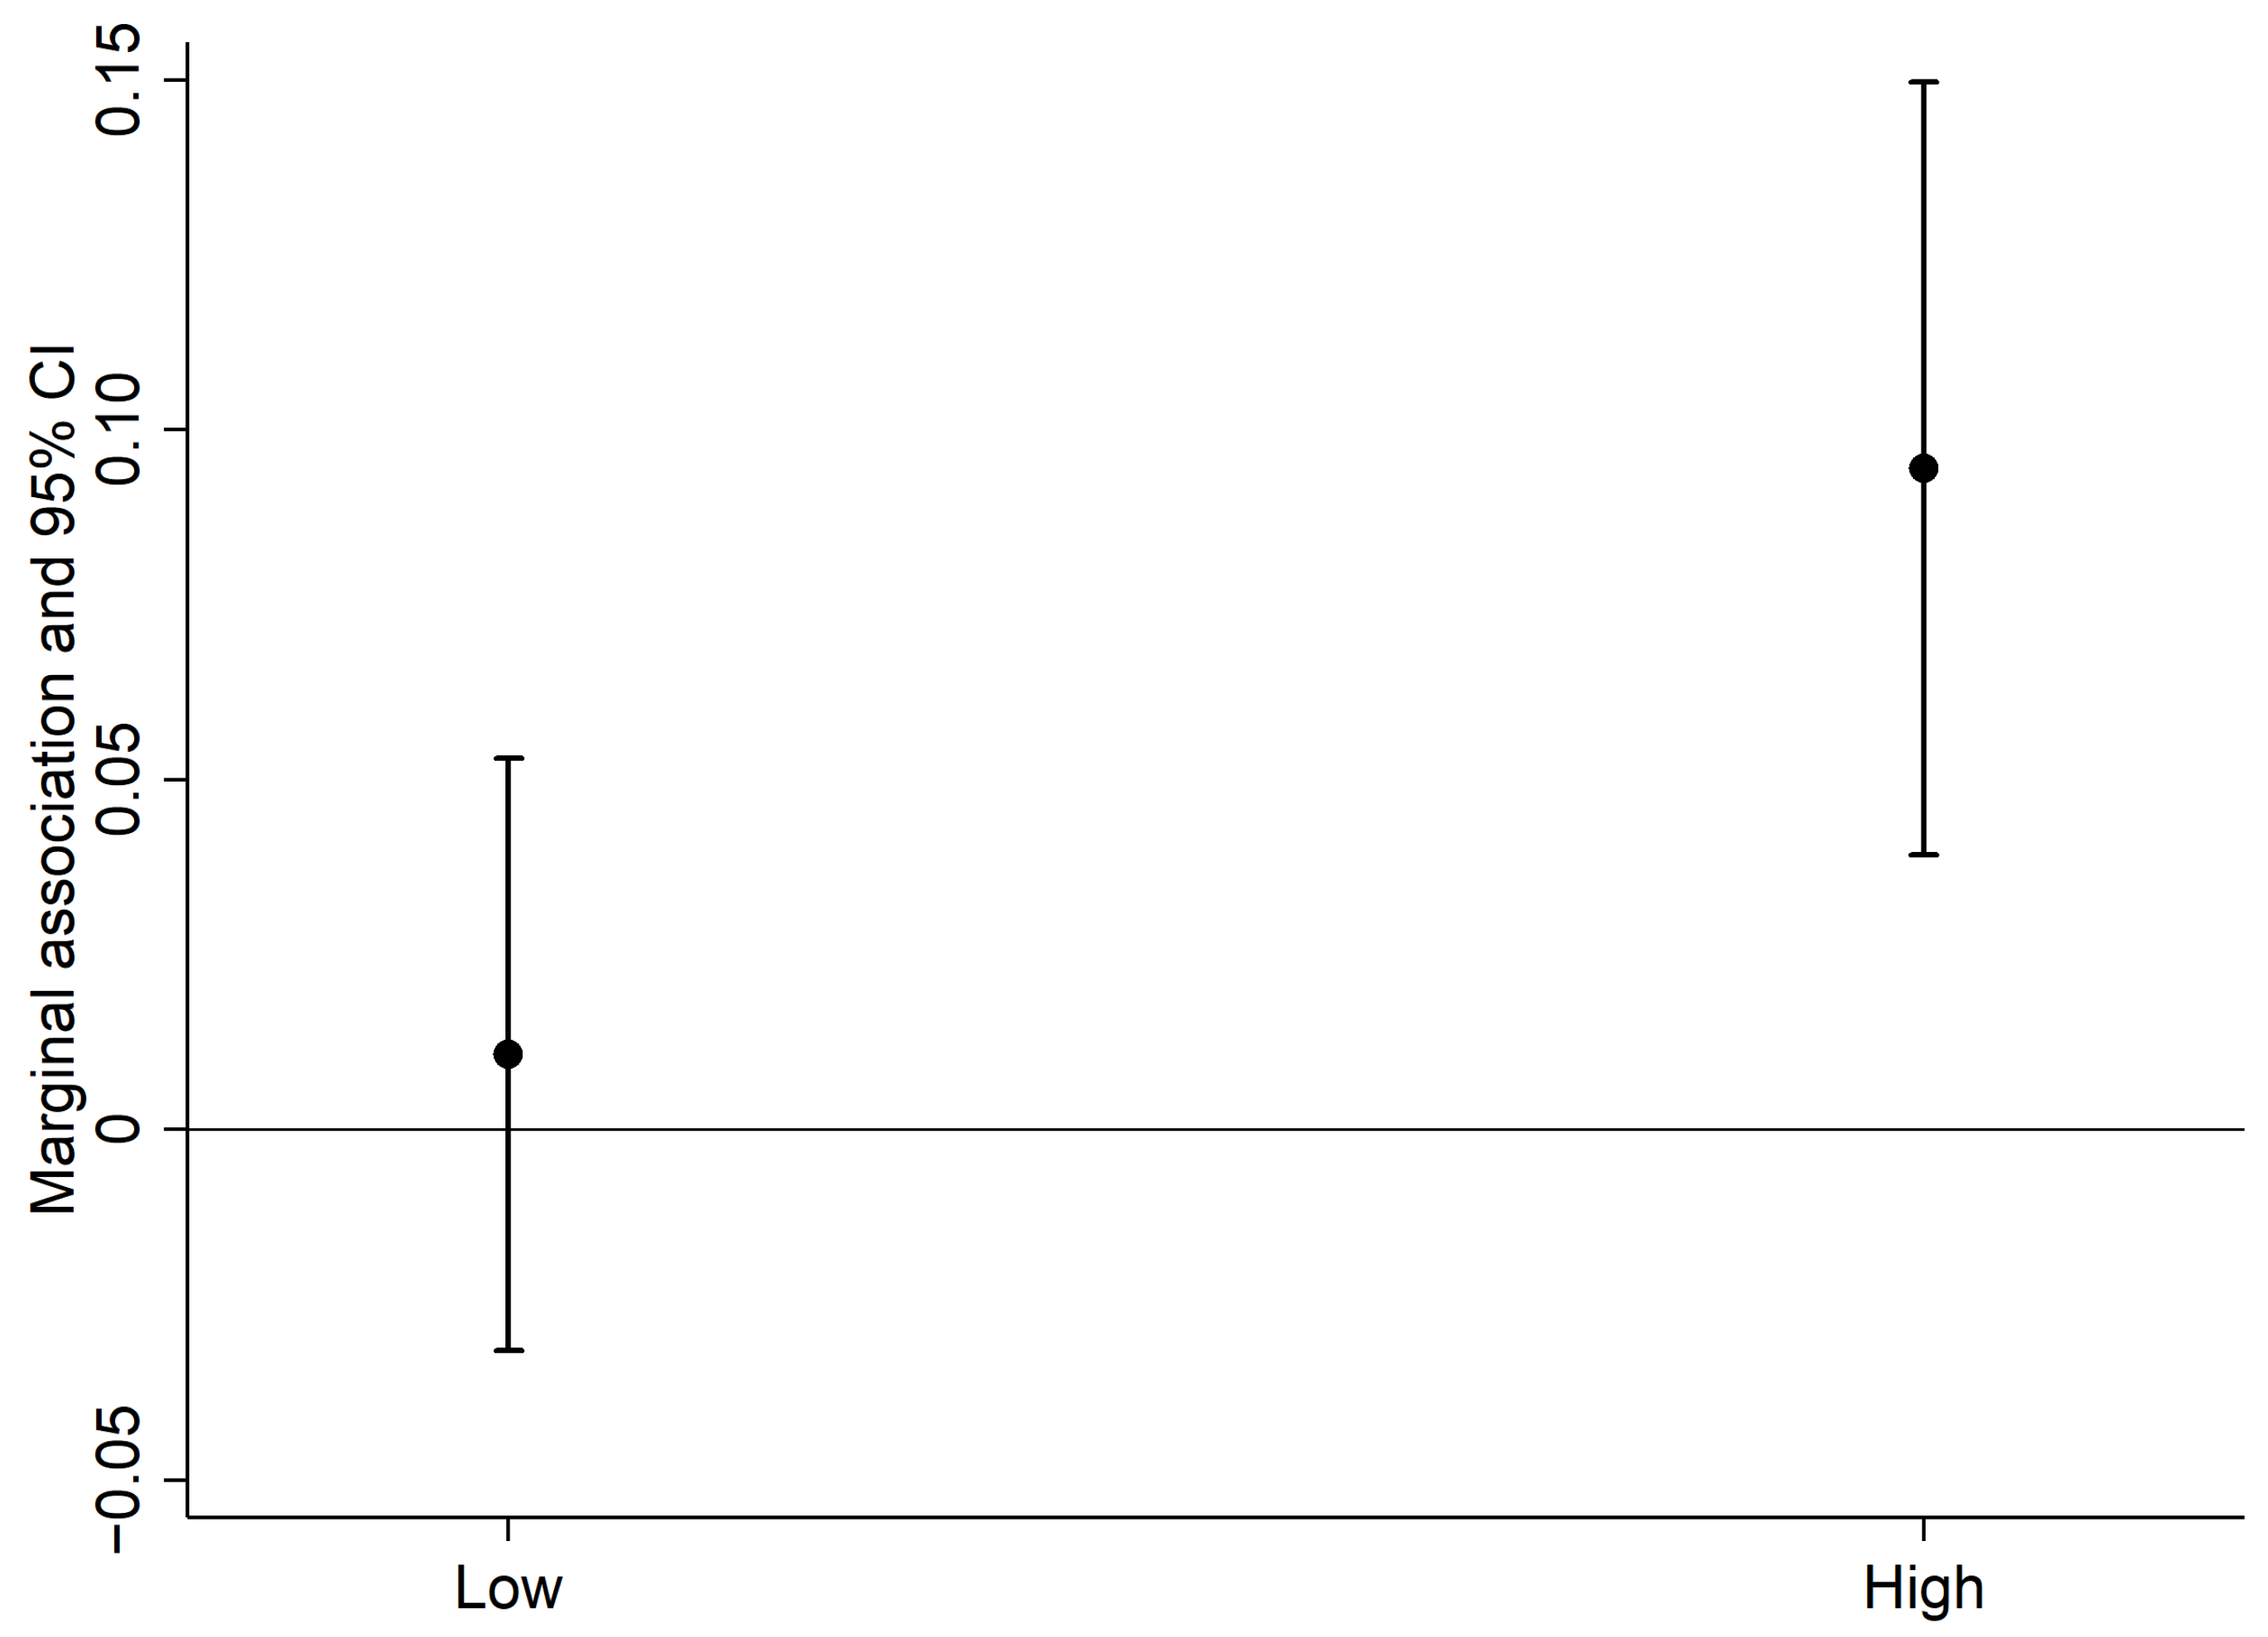
Table 8 tests H3. The main measure is average total assets from 2014 to 2016, fixed before the disclosure and outcome periods. The interaction between Complete and historical scale is 0.0419 (p = 0.0257). At one standard deviation below mean scale, the marginal association of Complete is 0.0107 and is not significant. At one standard deviation above the mean, it is 0.0945 (p < 0.001). Interactions using historical operating revenue and employment are 0.0407 and 0.0368, respectively, and both are significant at the 5% level. Figure 3 visualizes the corresponding marginal associations at one standard deviation below and above the mean of historical firm scale.
Table 8.
Historical organizational resources and the conditional predictive association of complete disclosure.
Figure 3.
Marginal predictive association of complete disclosure at different levels of historical firm scale. Note: Low and high correspond to one standard deviation below and above the mean of average total assets in 2014–2016. Points are marginal estimates and lines are 95% confidence intervals.
Scale is best interpreted as a broad boundary on organizational capacity rather than a single mechanism. Combining digital and production knowledge in one invention application requires R&D staff, experimental facilities, cross-department coordination, and intellectual property procedures. Larger firms are more likely to possess these resources, so the same disclosure architecture carries more information about subsequent recombination. Five prespecified interactions with human capital, ownership, high-technology industry, peer disclosure, and prior ICT patents have raw p-values from 0.318 to 0.784 and Holm-adjusted p-values of one; Table S7 reports them in full. The scale result does not imply that digitalization is always more effective in large firms. It shows that the disclosure signal is more reliable when organizational resources are greater.
4.7. Out-of-Time Prediction and Outcome Boundaries
Table S8 evaluates whether disclosure architecture adds predictive information in a genuinely later sample. The models are trained using 2017–2019 reports and tested using 2020–2021 reports. The base model achieves an AUC of 0.81440 in the held-out sample. Adding Complete increases the AUC by 0.00110 (p = 0.025), reduces the Brier score by 0.000268 (p = 0.025), and reduces log loss by 0.000720 (p = 0.057). The number of disclosed layers and disclosure breadth produce similarly small improvements. Although several pairwise differences are statistically detectable, the joint equality test for the four AUCs gives p = 0.0826, and all absolute gains are modest. Disclosure architecture therefore contains some incremental forward-looking information, but it should be used as an auxiliary screening signal rather than a stand-alone forecasting tool.
Grant outcomes provide a second boundary. At the firm-year level, Complete predicts more novel-combination applications granted within two years. Among filed novel-combination applications, however, the coefficient for the two-year grant probability is −0.0023 (p = 0.963) and remains close to zero after controlling for the number of novel pairs on a patent. A three-year window gives the same conclusion. Complete disclosure predicts the number of cross-domain applications that firms form and advance, not a higher examination success rate for each application. We do not observe patent licensing, transfer revenue, product adoption, or productivity, so neither application counts nor granted-application counts are interpreted as commercial value.
Other outcome checks further define the scope of the main result. Complete does not consistently predict all invention-patent applications, portfolio entropy, or broad Jaccard redirection, while the first-difference estimate remains positive but is less precisely estimated (Table S4). Table S5 reports two additional diagnostics. The stacked event-time comparison shows no jointly significant difference in the main outcome during the two pre-transition periods (p = 0.261), followed by positive coefficients after the transition. The Oster coefficient-stability calculation, using Rmax equal to 1.3 or 2.0 times the full-model within-R2, yields positive adjusted coefficients under equal proportional selection on observables and unobservables (0.0569 and 0.0700, respectively). Because entry into complete disclosure is self-selected and the Oster calculations depend on small within-R2 changes and assumed Rmax values, these findings are interpreted as timing and coefficient-stability diagnostics rather than causal identification. The candidate-instrument results in Table S6 are reported for the same diagnostic purpose [39].
5. Discussion
5.1. Theoretical Implications
The system’s contribution of this study rests on an explicit analytical boundary and on the distinction between architecture and operation. A conventional complementarity analysis asks whether jointly deployed technologies generate superadditive performance returns. We do not observe joint deployment, operational flows, or returns from the combined use of the three technologies. Instead, we represent a bounded disclosure architecture composed of three functionally differentiated layers, a subsequent cross-domain output, and historically predetermined organizational capacity. The framework is systemic because it organizes the evidence around cross-layer configuration, weakest-layer information, an output boundary, and an organizational-resource boundary rather than around isolated technology counts.
The four dimensions receive different levels of empirical support. First, the presence of multiple elements is observed through the eight disclosure states, and the all-three-layer state has a stronger association than the average of the three two-layer states. Second, this configuration difference is consistent with architectural interdependence, but the nonsignificant, fully saturated three-way interaction means that strict superadditivity and operational interdependence are not established. Third, weakest-layer intensity is positively associated with subsequent recombination, whereas cross-layer balance is only marginally significant; this pattern provides qualified evidence consistent with a weakest-link condition. Fourth, the association is stronger in firms with greater historical scale, supporting an organizational boundary on signal reliability. Because process-level data are unavailable, the study does not identify feedback or adaptive reconfiguration. Its contribution is therefore to operationalize a bounded system architecture in disclosure, not to demonstrate an operating digital system.
The results also connect research on corporate disclosure with work on technological recombination. Digital-disclosure studies usually compare word counts, tone, and investment behavior [4,5,6,7,8,9,10,11]. Recombination studies use patent classes or citations to observe new links between knowledge components [20,21,22,23,24]. We measure the two constructs separately and in temporal order. Complete describes cross-layer coverage in a report; a novel-combination patent describes a later IPC link not previously observed in that firm. Complete retains information after total disclosure frequency is controlled, and its three-year association remains after contemporaneous and intermediate patent activity is added. Annual-report text is not a substitute for patent evidence, and patents do not relabel disclosure as capability.
5.2. Measurement Implications
The two manual audits define the measurement boundary directly. Only 16.24% of the sampled keyword sentences clearly describe current application, and complete disclosure does not reliably identify an implementation context. Keyword matches should therefore not be called digital technology adoption. In the patent audit, human coders identify functional links much more often among strict co-classified patents than among non-co-classified patents. Public classifications can thus enrich for the intended technical content, although strict co-classification still produces false positives and misses digital production solutions without joint classification. Future measurement can combine co-classification, claim semantics, citation direction, and software investment.
Novel combinations add a separate distinction. Counts of digital patents pool repeated use of existing classifications with new links. A pair that is new to the firm’s history is closer to the recombination margin of technology search. The result is similar when novelty is defined over the full history since 1985 or over the previous five years, but it does not extend to broad redirection of the patent portfolio. Firms may add a small number of cross-domain links within an existing portfolio rather than replace their overall technology direction. Complete disclosure also predicts more novel-combination applications granted within two years without raising the conditional grant probability. The measure therefore captures expansion of a cross-domain application pipeline, not better examination quality per application.
5.3. Practical Implications and International Relevance
For investors and regulators, complete three-layer disclosure can guide follow-up questions but should not be converted directly into a score of completed digitalization. Due diligence should examine subsequent patents, software and equipment investments, staffing, and operating-process evidence. Out-of-time tests show that disclosure architecture adds statistically detectable but small predictive gains to existing information. It is suitable as a screening input, and its limited incremental performance also warns against treating plans and background language as action in automated text classification.
For manufacturing managers, disclosure quality depends on more than the number of digital terms. Reports that connect data infrastructure, analytical methods, and production settings to specific operating problems are more likely to correspond to a subsequent cross-domain technology agenda. The scale boundary also points to a fixed cost between articulating an agenda and producing a patentable output. Shared test facilities, data infrastructure, and intellectual property services may reduce that cost for smaller firms, but policy evaluation should still rely on observable inputs and outputs rather than digital word counts.
International evidence provides useful context. Artificial intelligence adoption in the United States is concentrated among larger firms and depends on complementary organizational resources [15]. Research on advanced manufacturing firms in China identifies external knowledge search and absorptive capacity as links between digitalization and exploratory innovation [17]. Evidence from manufacturing small- and medium-sized enterprises in Poland and the Czech Republic connects financial management with perceptions of sustainable operations [25]. Although these studies use different outcomes and institutional settings, they all point to organizational constraints on the value of digital technologies. Our evidence adds that organizational capacity also affects the reliability of public disclosure as a technology signal. The idea may extend to economies with standardized corporate reporting and matchable patent records, but the dictionary, patent taxonomy, and scale threshold require local calibration.
5.4. Limitations and Future Research
The study has four limitations. First, firms choose complete disclosure. Fixed effects, predetermined controls, overlap weighting, negative controls, permutations, and event-time comparisons narrow the set of alternative explanations but do not create a randomized causal effect. The candidate Bartik instruments fail the prespecified diagnostics and are not used as causal evidence. Future research may exploit institutional changes with a clear exogenous implementation date and no direct effect on patent recombination, although the exclusion restriction would still require separate justification. The same boundary applies to the systems interpretation. The data do not observe information flows, feedback loops, joint deployment, or adaptive reconfiguration across the three modules; these operating properties remain outside the empirical scope of the study.
Second, novel-combination patents measure observable application activity. The number of applications granted within two years provides evidence on progression through examination, but conditional grant probability does not increase and we lack data on licensing, product adoption, or productivity. The measure excludes software purchases, process changes, trade secrets, and unpatented improvements and does not establish patent quality or commercialization. Future work could link patent citations, licensing and transfer records, claim semantics, connected equipment, and product data. Third, the outcome window ends in 2024. Results strengthen when 2024 is excluded, but recent applications should be revisited as the database is updated. Fourth, the sample consists of listed Chinese manufacturing firms. The stronger association among larger firms should not be extrapolated directly to unlisted small firms. Cross-country annual-report and patent matching could test whether the three-layer dictionary and organizational boundary travel across institutions. With transaction-level procurement records and consistently identified suppliers, future research could also examine whether internal technological recombination precedes changes in external supply networks and whether those changes predict subsequent operating outcomes.
6. Conclusions
We examine whether multi-layer digital technology disclosure in annual reports predicts subsequent technological recombination. The strict sample combines annual reports from 2017 to 2021, patent histories from 1985 to 2024, and pre-disclosure financial data for 10,478 firm-year observations. The joint presence of data infrastructure, intelligent analytics, and business execution is associated with more firm-first ICT and production technology patent combinations three years later. The main coefficient is 0.0513, and the extensive-margin difference is 4.01 percentage points. The all-three-layer state exceeds the average two-layer state, the weakest layer provides additional information, and the same architecture is more informative in firms with larger historical scale. Complete disclosure also predicts more novel-combination applications granted within two years, but not a higher grant probability among filed applications. Out-of-time predictive gains are detectable but small.
These findings do not relabel annual-report language as technology adoption. The text audit shows that complete disclosure does not consistently separate current application from plans or background statements. The patent audit shows only that strict co-classification enriches for substantive links between digital technologies and production processes. The result does not extend equally to general invention patenting or broad portfolio redirection, and the grant evidence concerns application counts rather than conditional examination success. Multi-layer digital disclosure is therefore a conditional forward-looking signal of cross-domain technological recombination. Its reliability depends on disclosure architecture and organizational capacity, and it is not evidence of current deployment, patent quality, commercialization, or causal innovation performance. Taken together, the evidence supports the predictive content of multiple-element configurations, weakest-layer information, and historically predetermined organizational boundaries. It does not establish an operating digital system or causal interdependence among the modules.
Supplementary Materials
The following supporting information can be downloaded at https://www.mdpi.com/article/10.3390/systems14101244/s1, Table S1, Three-layer digital technology dictionary; Table S2, IPC scope and patent-screening rules for ICT and production technologies; Table S3, Full results for disclosure definitions and architecture; Table S4, Outcome specificity, alternative estimators, and subsequent grant progress; Table S5, Event-time patterns and Oster coefficient-stability diagnostics; Figure S1, Distribution from 1999 residual-label permutations within industry-year cells; Table S6, Diagnostics for candidate Bartik instruments; Table S7, Other prespecified organizational boundaries and an alternative scale measure; and Table S8, Out-of-time predictive performance in the current sample. References [26,27,37,38,39] are cited in the Supplementary Information.
Author Contributions
Conceptualization, S.P. and S.Z.; methodology, S.P.; software, S.P.; data curation, S.P.; formal analysis, S.P.; validation, S.P. and S.Z.; writing—original draft preparation, S.P.; writing—review and editing, S.Z.; supervision, S.Z. All authors have read and agreed to the published version of the manuscript.
Funding
This research received no external funding.
Data Availability Statement
This study uses listed-company annual reports, the Listed-Company Patent Detail Database, and firm-level financial and basic information from the China Stock Market & Accounting Research (CSMAR) database. Proprietary firm-level records are subject to the providers’ license terms and cannot be redistributed by the authors. Annual reports are available through statutory disclosure channels. The authors constructed all firm-year matches, text dictionaries, disclosure measures, IPC rules, historical-combination measures, patent aggregates, and regression variables. Non-proprietary code, dictionaries, and documentation are available from the corresponding author upon reasonable request, subject to the restrictions governing the source data.
Conflicts of Interest
The authors declare no conflicts of interest.
References
- Healy, P.M.; Palepu, K.G. Information asymmetry, corporate disclosure, and the capital markets: A review of the empirical disclosure literature. J. Account. Econ. 2001, 31, 405–440. [Google Scholar] [CrossRef] [Scilit]
- Loughran, T.; McDonald, B. When is a liability not a liability? Textual analysis, dictionaries, and 10-Ks. J. Financ. 2011, 66, 35–65. [Google Scholar] [CrossRef] [Scilit]
- Gentzkow, M.; Kelly, B.; Taddy, M. Text as data. J. Econ. Lit. 2019, 57, 535–574. [Google Scholar] [CrossRef] [Scilit]
- Zhang, W.; Lu, C.; Liang, S. More words but less investment: Rookie CEOs and firms’ digital transformations. China J. Account. Res. 2023, 16, 100305. [Google Scholar] [CrossRef] [Scilit]
- Guo, B.; Huang, X. Digital transformation tone signal and the cost of equity: Evidence from Chinese listed companies. Financ. Res. Lett. 2024, 59, 104720. [Google Scholar] [CrossRef] [Scilit]
- Han, F.; Zhang, X.; Chan, K.C.; Li, Y. Firms’ digital transformation and management earnings forecasts: Evidence from China. Borsa Istanb. Rev. 2023, 23, 1356–1366. [Google Scholar] [CrossRef] [Scilit]
- Feng, Y.; Li, Y.; Lin, T. Digital transformation whitewashing and financing constraints. Financ. Res. Lett. 2024, 69, 106242. [Google Scholar] [CrossRef] [Scilit]
- Guan, K.; Fu, M.; Zhu, H. Opportunistic behaviour behind corporate digitalization disclosure: The moderating role of economic policy uncertainty. Financ. Res. Lett. 2024, 66, 105704. [Google Scholar] [CrossRef] [Scilit]
- Huang, Z.; Lim, K.-P. Going digital: Do actions speak louder than words? Appl. Econ. Lett. 2025, 32, 188–192. [Google Scholar] [CrossRef] [Scilit]
- Cao, Z.; Tang, C.; Li, Z. The impact of digital transformation on firm risk: Effort by talk or effort by walk. Pac.-Basin Financ. J. 2025, 94, 102971. [Google Scholar] [CrossRef] [Scilit]
- Wei, C.; Zhou, H.; Zhang, X.; Ouyang, S. The dark side of digital transformation: Digital washing and accounting conservatism. Int. Rev. Econ. Financ. 2025, 98, 103933. [Google Scholar] [CrossRef] [Scilit]
- Bresnahan, T.F.; Brynjolfsson, E.; Hitt, L.M. Information technology, workplace organization, and the demand for skilled labor: Firm-level evidence. Q. J. Econ. 2002, 117, 339–376. [Google Scholar] [CrossRef] [Scilit]
- Aral, S.; Brynjolfsson, E.; Wu, L. Three-way complementarities: Performance pay, human resource analytics, and information technology. Manag. Sci. 2012, 58, 913–931. [Google Scholar] [CrossRef] [Scilit]
- Battaglia, D.; Galati, F.; Molinaro, M.; Pessot, E. Full, hybrid and platform complementarity: Exploring the Industry 4.0 technology-performance link. Int. J. Prod. Econ. 2023, 263, 108949. [Google Scholar] [CrossRef] [Scilit]
- McElheran, K.; Li, J.F.; Brynjolfsson, E.; Kroff, Z.; Dinlersoz, E.; Foster, L.S.; Zolas, N. AI adoption in America: Who, what, and where. J. Econ. Manag. Strategy 2024, 33, 375–415. [Google Scholar] [CrossRef] [Scilit]
- Li, X.; Li, X.; Ding, S. How do Internet applications affect process innovation in Chinese manufacturing companies? Econ. Res.-Ekon. Istraž. 2023, 36, 2120045. [Google Scholar] [CrossRef] [Scilit]
- Li, X.; Han, H.; He, H. Advanced manufacturing firms’ digital transformation and exploratory innovation. Appl. Econ. Lett. 2025, 32, 1414–1420. [Google Scholar] [CrossRef] [Scilit]
- Lu, C.; Li, R. The integration of digital and real economy technologies and corporate value creation efficiency: Evidence from Chinese enterprise patent information. Econ. Anal. Policy 2026, 91, 967–986. [Google Scholar] [CrossRef] [Scilit]
- Du, W.; Li, M. Corporations’ digital attitude and digital technology innovation: Are the heart and mouth in agreement or not? Financ. Res. Lett. 2025, 75, 106910. [Google Scholar] [CrossRef] [Scilit]
- Fleming, L. Recombinant uncertainty in technological search. Manag. Sci. 2001, 47, 117–132. [Google Scholar] [CrossRef] [Scilit]
- Antonelli, C.; Krafft, J.; Quatraro, F. Recombinant knowledge and growth: The case of ICTs. Struct. Change Econ. Dyn. 2010, 21, 50–69. [Google Scholar] [CrossRef] [Scilit]
- Strumsky, D.; Lobo, J. Identifying the sources of technological novelty in the process of invention. Res. Policy 2015, 44, 1445–1461. [Google Scholar] [CrossRef] [Scilit]
- Verhoeven, D.; Bakker, J.; Veugelers, R. Measuring technological novelty with patent-based indicators. Res. Policy 2016, 45, 707–723. [Google Scholar] [CrossRef] [Scilit]
- Clancy, M.S. Inventing by combining pre-existing technologies: Patent evidence on learning and fishing out. Res. Policy 2018, 47, 252–265. [Google Scholar] [CrossRef] [Scilit]
- Bednarz, J.; Matasova, T. Financial management in the context of sustainable development in Polish and Czech manufacturing SMEs. J. Bus. Sect. 2024, 2, 62–72. [Google Scholar] [CrossRef] [Scilit]
- Inaba, T.; Squicciarini, M. ICT: A New Taxonomy Based on the International Patent Classification. In OECD Science, Technology and Industry Working Papers; OECD Publishing: Paris, France, 2017; No.2017/01. [Google Scholar] [CrossRef]
- European Patent Office. Patents and the Fourth Industrial Revolution: The Inventions Behind Digital Transformation; EPO: Munich, Germany, 2017. Available online: https://www.epo.org/en/news-events/in-focus/ict/fourth-industrial-revolution (accessed on 6 September 2026).
- Karvonen, M.; Kässi, T. Patent citations as a tool for analysing the early stages of convergence. Technol. Forecast. Soc. Change 2013, 80, 1094–1107. [Google Scholar] [CrossRef] [Scilit]
- Kim, M.-S.; Kim, C. On a patent analysis method for technological convergence. Procedia Soc. Behav. Sci. 2012, 40, 657–663. [Google Scholar] [CrossRef] [Scilit]
- Cohen, J. A coefficient of agreement for nominal scales. Educ. Psychol. Meas. 1960, 20, 37–46. [Google Scholar] [CrossRef] [Scilit]
- Roodman, D.; MacKinnon, J.G.; Nielsen, M.Ø.; Webb, M.D. Fast and wild: Bootstrap inference in Stata using boottest. Stata J. 2019, 19, 4–60. [Google Scholar] [CrossRef] [Scilit]
- Cengiz, D.; Dube, A.; Lindner, A.; Zipperer, B. The effect of minimum wages on low-wage jobs. Q. J. Econ. 2019, 134, 1405–1454. [Google Scholar] [CrossRef] [Scilit]
- Sun, L.; Abraham, S. Estimating dynamic treatment effects in event studies with heterogeneous treatment effects. J. Econom. 2021, 225, 175–199. [Google Scholar] [CrossRef] [Scilit]
- Callaway, B.; Sant’Anna, P.H.C. Difference-in-differences with multiple time periods. J. Econom. 2021, 225, 200–230. [Google Scholar] [CrossRef] [Scilit]
- Lipsitch, M.; Tchetgen Tchetgen, E.; Cohen, T. Negative controls: A tool for detecting confounding and bias in observational studies. Epidemiology 2010, 21, 383–388. [Google Scholar] [CrossRef] [Scilit] [PubMed]
- Li, F.; Morgan, K.L.; Zaslavsky, A.M. Balancing covariates via propensity score weighting. J. Am. Stat. Assoc. 2018, 113, 390–400. [Google Scholar] [CrossRef] [Scilit]
- Goldsmith-Pinkham, P.; Sorkin, I.; Swift, H. Bartik instruments: What, when, why, and how. Am. Econ. Rev. 2020, 110, 2586–2624. [Google Scholar] [CrossRef] [Scilit]
- Borusyak, K.; Hull, P.; Jaravel, X. Quasi-experimental shift-share research designs. Rev. Econ. Stud. 2022, 89, 181–213. [Google Scholar] [CrossRef] [Scilit] [PubMed]
- Oster, E. Unobservable selection and coefficient stability: Theory and evidence. J. Bus. Econ. Stat. 2019, 37, 187–204. [Google Scholar] [CrossRef] [Scilit]

Disclaimer/Publisher’s Note: The statements, opinions and data contained in all publications are solely those of the individual author(s) and contributor(s) and not of MDPI and/or the editor(s). MDPI and/or the editor(s) disclaim responsibility for any injury to people or property resulting from any ideas, methods, instructions or products referred to in the content. |
© 2026 by the authors. Licensee MDPI, Basel, Switzerland. This article is an open access article distributed under the terms and conditions of the Creative Commons Attribution (CC BY) license.