


Highlights
Please indicate how your work links to systems science via your contributions to systems practice, theory, and/or methodology.
- Develops a portfolio-level screening methodology that connects lifecycle carbon, asset categories, and material inflows, enabling infrastructure impacts to be examined across the wider asset system, rather than at individual project level.
- Extends systems practice by showing how hotspot analysis can be used to prioritise attention across a heterogeneous infrastructure portfolio before more detailed project-level engineering, risk, cost, and circularity appraisal.
What are the main findings and/or the implications of the main findings?
- Carbon and material impacts are highly concentrated in a limited number of lifecycle stages, asset categories, and material groups, indicating that uniform portfolio-wide carbon-reduction trajectories may overlook where the greatest impacts occur.
- Different hotspot profiles require different circular-economy strategies: assets dominated by capital/replacement impacts require different interventions from those dominated by operational/refurbishment impacts, supporting differentiated, rather than uniform, CE prioritisation.
Abstract
Infrastructure organisations must reduce carbon emissions, improve resource efficiency, and maintain service performance across large ageing asset portfolios. However, circular-economy interventions in infrastructure are often organised around individual projects, limiting understanding of where material and carbon impacts accumulate at portfolio level. This paper develops a top-down portfolio-level modelling approach to support circular-economy prioritisation in flood-risk management infrastructure. The study integrates public asset-register data with organisational carbon and material-flow datasets to identify lifecycle, asset, and material hotspots across a distributed infrastructure portfolio. Using 415 asset-level carbon records and 5486 material-level records, the analysis estimates whole-life carbon distribution across asset classes and maps material inflows across material–asset combinations. The findings reveal a strong concentration effect: a small number of lifecycle stages, asset types, and materials account for a disproportionate share of portfolio-level impacts. Replacement carbon emerges as a major whole-life contributor, while walls, embankments, and channels dominate asset-level emissions, given the organization context. At the material level, soil/clay, steel, concrete, and stone represent key hotspots, showing that circular-economy strategies should address both high-carbon materials and high-material mass earthworks. The paper contributes a portfolio-level screening approach that shifts circular-economy analysis from project-level optimisation to portfolio-level prioritisation.
1. Introduction
Circular-economy (CE) research has increasingly positioned the built environment and infrastructure sectors as critical domains for reducing material extraction, waste generation, and embodied carbon [1]. Prior studies show that circular-economy implementation in construction requires lifecycle thinking, material recovery, supply-chain coordination, and new prioritisation approaches that move beyond linear take–make–dispose models [2,3,4,5]. Material flow analysis has also become an important method for examining construction material stocks and flows, particularly where resource efficiency depends on understanding how materials accumulate, move, and exit the built environment [6,7,8]. In parallel, infrastructure carbon management standards and whole-life carbon approaches have emphasised the need to assess emissions across capital, operational, maintenance, refurbishment, replacement, and end-of-life stages, rather than focusing only on construction-stage impacts [9,10].
However, much of the existing circular-economy and carbon-reduction literature remains centred on the project, product, building, or component as the main unit of analysis [2,11,12]. This project-level focus is valuable, but it provides limited guidance for infrastructure owners who manage large portfolios of heterogeneous assets over long time horizons and must decide where circular-economy interventions should be prioritized to address the net-zero targets [13,14]. Existing studies have developed circularity assessment frameworks, lifecycle design strategies, and decision-making tools for construction projects, but they less frequently explain how asset owners can identify material–asset hotspots across an entire infrastructure portfolio [15,16,17,18]. Accordingly, this paper addresses the following research question:
How can a portfolio-level screening method identify relative lifecycle-carbon, asset, and material hotspots to inform subsequent circular-economy appraisal?
This paper addresses this question by developing and applying a top-down portfolio-level (“Portfolio comprises part or all of an organisation’s investment required to achieve its objectives. Governed through its portfolio (or business) plan, a portfolio comprises work components, such as other portfolios, programmes, projects, other related work and work packages combined for particular outcome to be achieved.” [19]) modelling approach for circular-economy prioritisation. The method combines hotspot analysis using material–asset analysis to identify where carbon and material inflows are concentrated across lifecycle stages, asset classes, and material groups, reflecting the role of hotspot analysis in prioritising areas where the greatest impact can be achieved [20]. Empirically, the study uses flood-risk management infrastructure as the analytical context and integrates asset-register data with organisational carbon and material-flow datasets, including 415 asset-level carbon records and 5486 material-level records. This enables the paper to move from generic circular-economy principles to a more differentiated understanding of which material–asset combinations matter most at portfolio scale.
The findings matter because infrastructure organisations are increasingly expected to deliver net-zero commitments, climate adaptation, and value for money, simultaneously [1,21]. A portfolio-level view shows that circular-economy opportunities are not evenly distributed across all projects, assets, or materials, but are concentrated in specific lifecycle stages and material–asset relationships. These findings affect how circular-economy decision-making should be organised: rather than applying generic circularity principles across every scheme, asset owners can prioritise interventions where material demand, replacement cycles, and embodied carbon are most significant. By treating circular-economy transition as a portfolio-level prioritisation problem, rather than a project-level optimisation problem, the paper responds directly to the need for modelling and prioritisation approaches that can accelerate circular-economy implementation at scale.
2. Literature Review
2.1. Circular Economy in Infrastructure: From Ambition to Delivery Challenge
The built environment consumes large quantities of resources, stores materials over long periods, and generates significant end-of-life waste, making it central to circular-economy transition. Prior studies show that circular-economy implementation in construction requires lifecycle thinking, material recovery, design for adaptability, supply-chain coordination, and procurement models that move beyond linear take–make–dispose approaches [2,3,4,5,22]. These studies establish that circularity cannot be treated only as a waste-management problem, but must be embedded across design, construction, operation, maintenance, refurbishment, and recovery stages.
Infrastructure provides a particularly important, but challenging, setting for circular-economy implementation. Unlike consumer products or short-life assets, infrastructure systems are long-lived, capital-intensive, spatially fixed, and embedded within essential public services. Circular-economy strategies must therefore maintain safety, service performance, climate resilience, regulatory compliance, and value for money while reducing material demand and carbon emissions. Existing studies identify recurring barriers to circular-economy implementation in construction, including fragmented supply chains, limited data availability, unclear ownership of secondary materials, risk aversion, regulatory uncertainty, and weak incentives for reuse [2,23,24,25].
Recent research has begun to examine circular-economy strategies more directly within infrastructure and capital project delivery [26]. Sanchez and Haas argue that capital project planning is critical because many circular-economy opportunities are locked in during early design and planning stages [18]. Coenen et al. develop a bridge circularity assessment framework to support resource efficiency in infrastructure projects [15], while Smith et al. show how circular-economy approaches can be integrated into major infrastructure delivery [27]. Other studies examine specific circular strategies such as structural product reuse, recycled asphalt, low-carbon concrete, steel reuse, and adaptive reuse [11,12,28,29,30,31,32].
This body of work demonstrates the fact that the circular economy is increasingly relevant to infrastructure, but it also reveals a limitation in how the problem is commonly framed. Much of the literature, however, remains focused on individual projects, components, buildings, materials, or technical solutions [2,11,12]. These studies provide valuable insights into feasibility and project-level performance; however, they offer more limited guidance to infrastructure owners seeking to prioritise interventions across large- and heterogeneous-asset portfolios. The first unresolved issue therefore concerns scale. We argue that, while circular-economy knowledge has become increasingly sophisticated at the project level, its application at the portfolio level remains comparatively underdeveloped, particularly for strategic hotspot screening and prioritisation.
2.2. Why Project-Level Circularity Needs Portfolio-Level Material Intelligence
Project-level circular-economy assessment is important because infrastructure interventions are ultimately designed, procured, and delivered through projects. At this level, practitioners can compare design options, select lower-carbon materials, reduce waste, specify recycled content, extend design life, and test reuse opportunities. Decision-support tools such as multi-criteria decision-making models (net present value or incremental cost–benefit analysis), circularity indicators, lifecycle assessment tools, and circular-economy key performance indicators help structure these choices [16,33,34,35]. Such tools are valuable because circular-economy decisions often involve multiple criteria, including cost, carbon, technical feasibility, procurement risk, service performance, regulatory compliance, and long-term value creation.
However, project-level analysis can obscure how impacts accumulate across an infrastructure system. A single project may be improved in isolation while the wider portfolio continues to reproduce high material demand through repeated maintenance, refurbishment, and replacement cycles. Likewise, a circular solution that performs well in one scheme may have limited portfolio-level effect if it is not applied to the asset types or material flows that dominate portfolio carbon. This matters because infrastructure owners rarely face a single optimisation problem; they face a prioritisation problem across many assets, many locations, many intervention types, and many future funding cycles.
Material–asset analysis at portfolio-level offers a way to address this prioritisation problem because it shifts attention from isolated projects to the movement, accumulation, and transformation of materials within a larger set of heterogenous assets and programmes [13]. Material flow analysis has been widely used to examine resource use, material stocks, recycling potential, and circularity across economic and built-environment systems [6,7,8,36]. In construction and infrastructure, material-flow approaches are particularly relevant because built assets act as long-term material stocks that influence future extraction, reuse, recycling, and waste-management pathways. This stock-based view is central to the circular economy because materials embedded in infrastructure are not only future waste liabilities, but also potential future resources.
A material-flow perspective is especially important where carbon reduction depends not only on substituting one material for another, but also on avoiding unnecessary inflow, extending asset life, reducing replacement frequency, and improving recovery routes. Whole-life carbon guidance reinforces this wider lifecycle view by emphasising emissions across capital works, operation, maintenance, refurbishment, replacement, and end-of-life processes, rather than only construction-stage impacts [9,10]. For long-lived infrastructure, replacement and maintenance cycles may be as strategically important as initial construction carbon emission, but the cumulative effects of these emissions are often aggregated in ways that provide limited visibility across the asset lifecycle. The second unresolved issue, therefore, concerns visibility. We argue that a circular economy needs material-flow evidence organised around the way infrastructure portfolios are owned, maintained, and renewed.
2.3. Hotspot Analysis as a Bridge from Measurement to Portfolio Prioritisation
Material and carbon measurement alone does not automatically lead to better circular-economy outcomes. Organisations still need prioritisation approaches that can translate data into priorities, especially where resources, time, and organisational attention are limited. Hotspot analysis is useful in this context because it identifies where the most significant environmental, social, or economic impacts occur before more detailed technical assessment is undertaken. Barthel et al. position hotspot analysis as a life-cycle management approach that supports action by focusing attention on the areas where intervention is likely to matter most [20].
In this paper, hotspot analysis is understood through the four-step process outlined by Barthel et al.: (a) defining the goal and scope, (b) gathering and analysing relevant data, (c) identifying and validating hotspots, and (d) prioritising actions [20]. This sequence is appropriate for portfolio-level circular-economy assessment because it moves from system definition to data structuring, then from hotspot identification to intervention prioritisation. The approach is also consistent with wider hotspot analysis guidance, which emphasises that hotspot studies should be usable, transparent, robust, inclusive, comprehensive, and clearly communicated, so that findings can support decisions by industry, government, and other stakeholders [37]. This matters because hotspot analysis is not only a technical exercise; it is also a way to translate complex evidence into priorities that decision makers can act upon.
Hotspot analysis has been applied across multiple scales and sectors, including product-category and product-portfolio studies, as well as sector-, city-, and national-level studies. Existing methodological reviews identify applications associated with the Waste and Resources Action Programme (WRAP)’s Product Sustainability Forum, the Sustainability Consortium, the Association of Home Appliance Manufacturers, and sustainable consumption and production initiatives [20,37,38]. The evidence base can include life-cycle studies, material-flow data, input–output data, market information, product information, expert judgement, and stakeholder concerns. This flexibility makes hotspot analysis particularly relevant for material-intensive infrastructure portfolios, where full life-cycle assessment across every asset, material, and project may be impractical.
However, hotspot analysis also has limitations. Wider hotspot analysis guidance highlights challenges around data quality, data gaps, stakeholder gaps, assumptions, proxy data, and the level of robustness required for the intended decision [37]. Barthel et al. also note that hotspot methods often require expert judgement, can be difficult to apply, and frequently lack integration of financial data, particularly the costs and benefits of addressing identified hotspots [20]. These limitations are important because they create a gap between identifying hotspots and translating them into actionable decision support. For this reason, hotspot analysis should be treated as a strategic screening and prioritisation method, rather than a substitute for detailed life-cycle assessment, engineering appraisal, or cost–benefit analysis.
A portfolio-level perspective strengthens this argument because infrastructure circularity depends on the interaction between materials, assets, supply chains, governance arrangements, and value-creation mechanisms. Circular-economy research increasingly recognises the need to understand interdependencies between circular business models, supply chains, organisational capabilities, and value creation [39,40,41]. Similarly, systems-thinking research on complex sustainability challenges emphasises the fact that interventions should be understood in relation to wider structures and feedbacks, rather than as isolated actions [42,43]. For infrastructure, this means that circular-economy prioritisation should connect material-level interventions with asset-level performance and portfolio-level outcomes.
The problem, however, is that existing circular-economy tools do not always make this connection. Many tools assess whether a project, design option, product, or material choice is more circular, but fewer tools identify which asset categories or material flows should be prioritised across an entire portfolio. Similarly, project-level carbon tools can quantify scheme-level emissions, but may not show how lifecycle carbon is distributed across the asset base. The third unresolved issue, therefore, concerns prioritisation architecture. We argue that infrastructure organisations (asset owners) need methods that connect material-flow evidence, whole-life carbon, and portfolio prioritisation.
Hotspot analysis informs circular-economy prioritisation by identifying where limited organisational resources and more detailed assessment should be concentrated. In this study, the relevant prioritisation factors include the magnitude of whole-life carbon, material-input intensity, frequency of intervention, and prevalence of the asset type across the portfolio and lifecycle stage. The identified hotspots are therefore not treated as automatic investment decisions, but as an initial portfolio-level screening layer that directs further engineering, environmental, financial, and flood-risk appraisal. This interpretation is consistent with Government Functional Standard GovS 002 [44], which defines a portfolio as part or all of an organisation’s investment required to achieve its objectives and emphasises coordinated decision-making across portfolios, programmes, projects, and related work to improve outcomes, manage risks, and secure value for money.
3. Methodology
3.1. Research Design
This study adopts a top-down portfolio-level modelling approach to examine how circular-economy prioritisation can be supported across a flood-risk management-infrastructure asset base. The method combines hotspot analysis and material–asset mapping to identify where carbon and material inflows are concentrated across lifecycle stages, asset categories, and material groups. Hotspot analysis was selected because it provides a pragmatic balance between analytical depth and decision usability, particularly where organisations need to prioritise action using available but imperfect datasets. Material–asset mapping analysis was used to connect material inputs with asset categories, allowing circular-economy opportunities to be examined at portfolio scale, rather than only at individual project level.
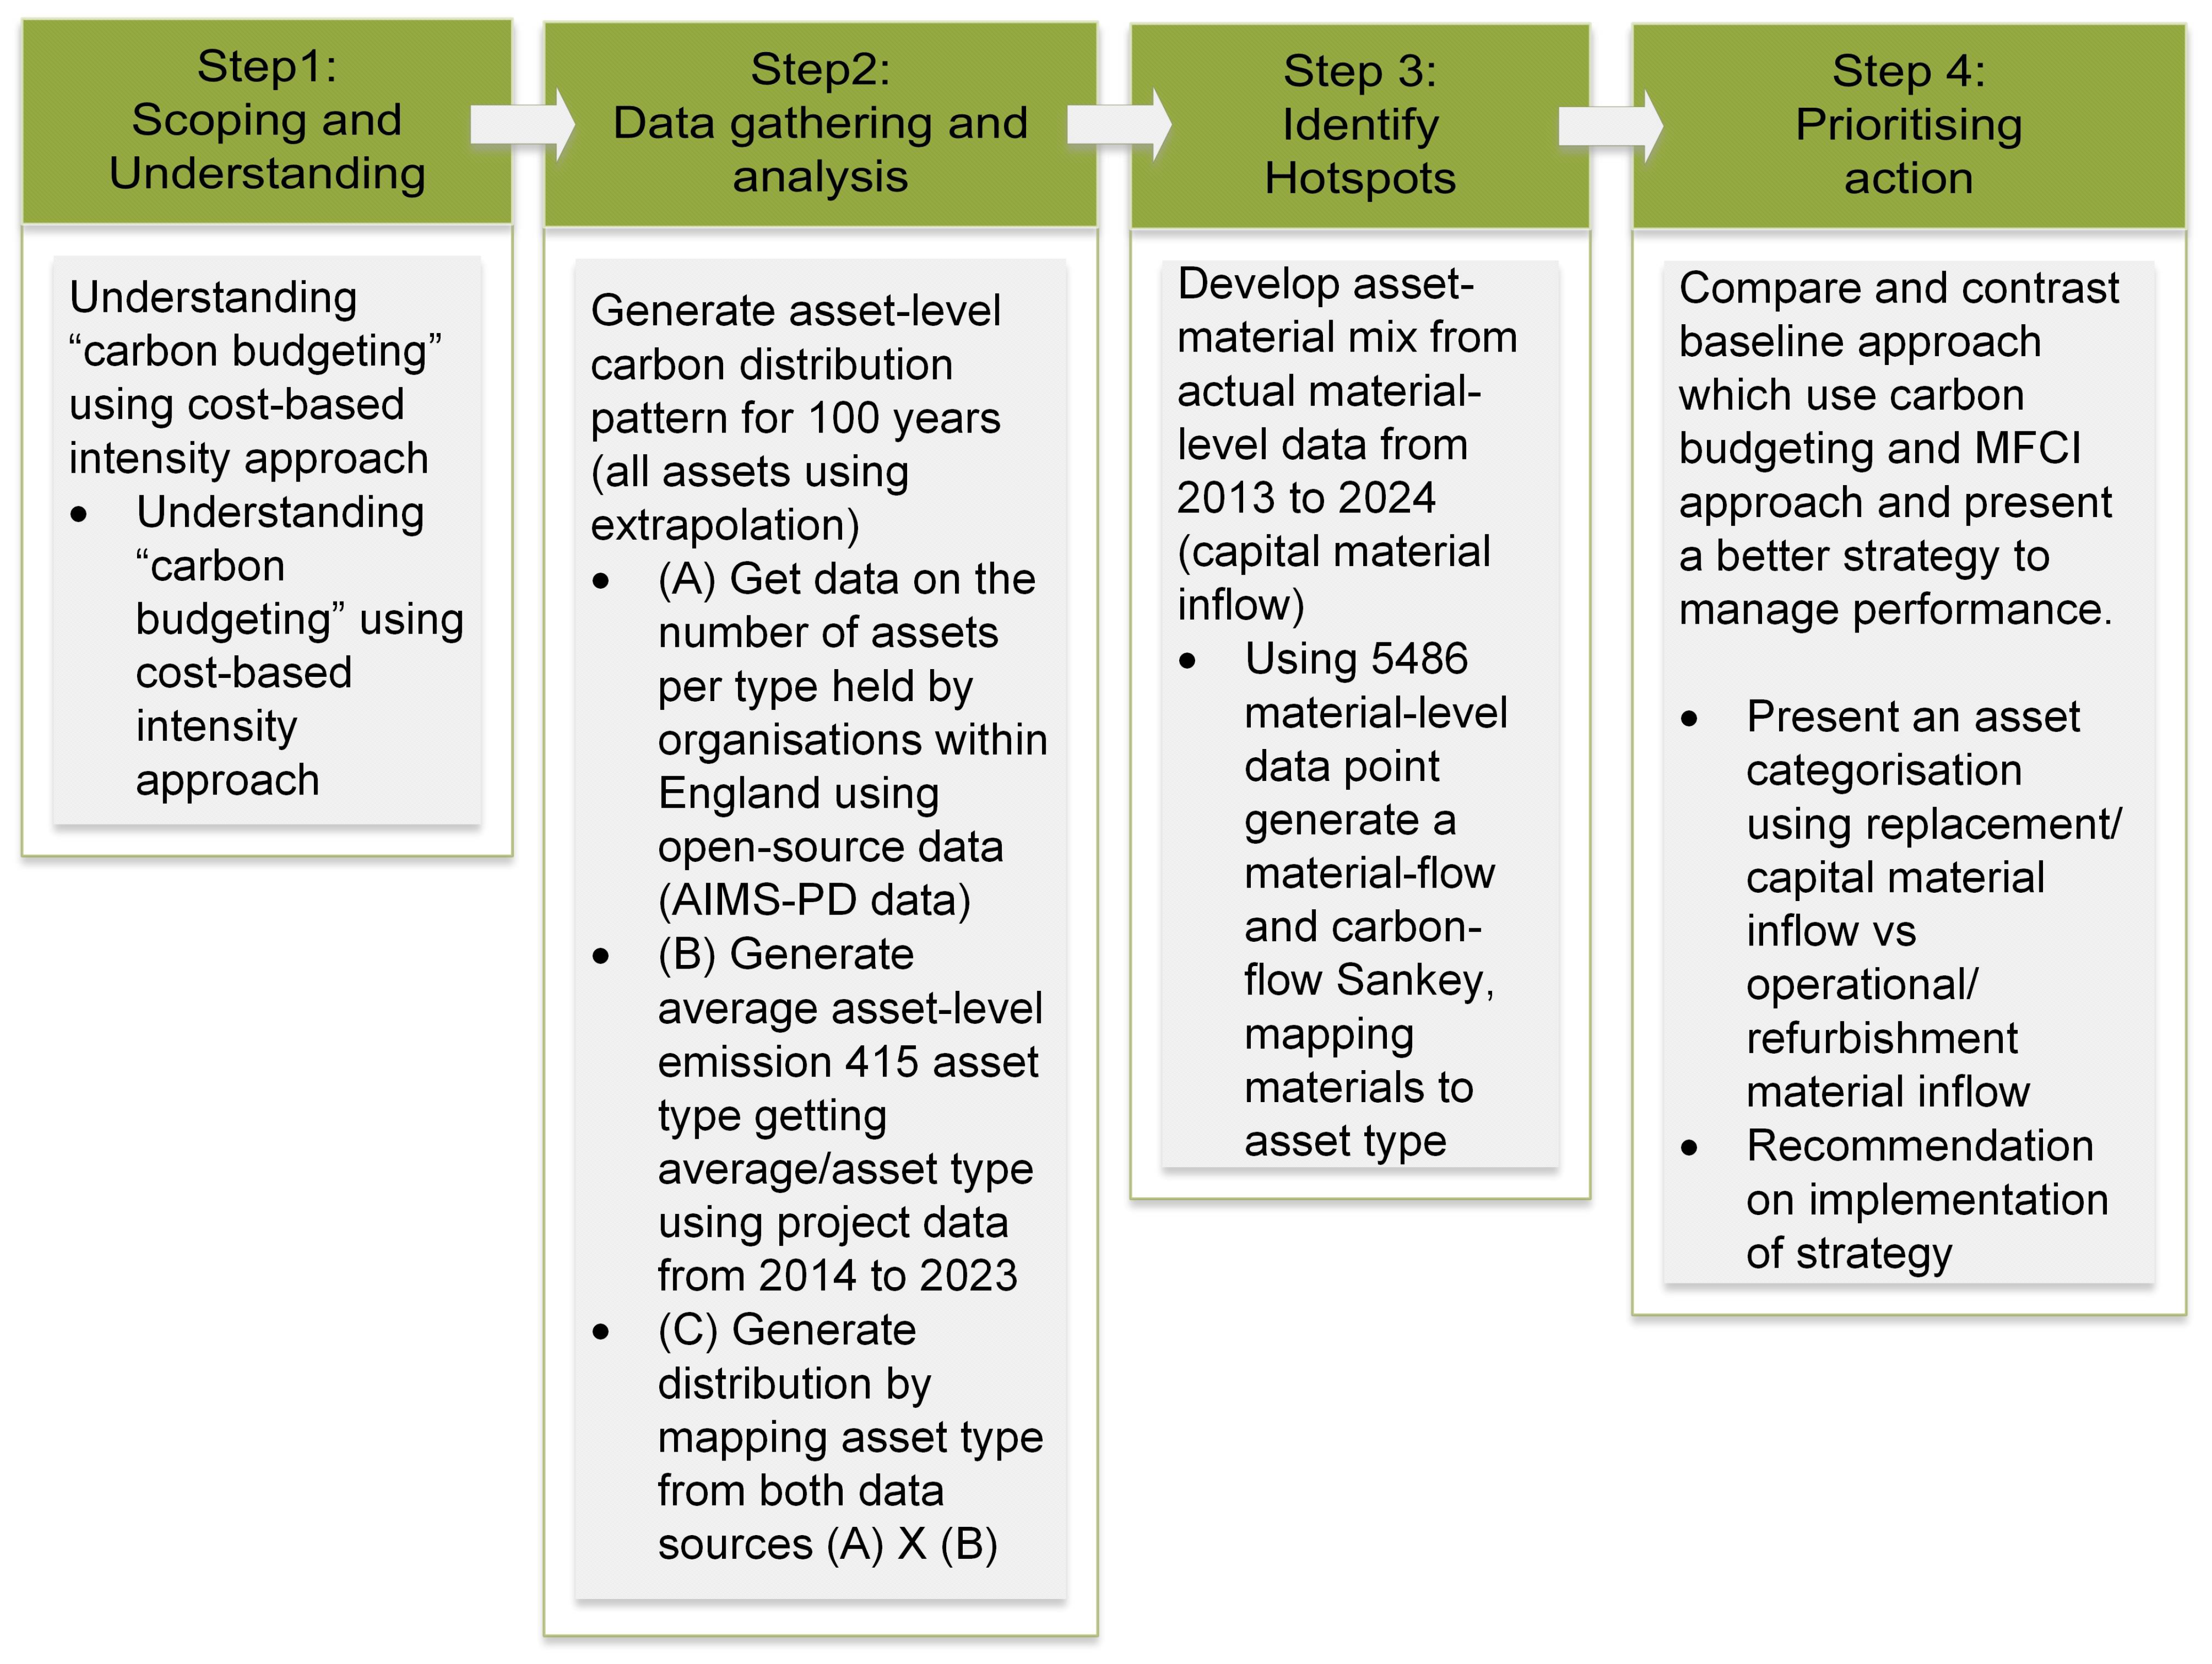
The methodological approach follows the four-step hotspot analysis process outlined by Barthel et al., as shown in Figure 1 [20]. Hotspot analysis is appropriate because it supports the rapid assimilation of diverse evidence sources and helps identify priority areas where the greatest impacts can be addressed. It is not used here as a substitute for detailed life-cycle assessment, engineering appraisal, or cost–benefit analysis. Instead, it is used as an upstream screening and prioritisation method to guide where more detailed circular-economy assessment should be focused.
Figure 1.
Hotspot analysis (adapted from Barthel et al. for this study [20]).
The unit of analysis is the infrastructure asset portfolio. Within this portfolio, the analysis is conducted at three embedded levels: lifecycle stage, asset type, and material group. The lifecycle-stage analysis examines capital, operational, replacement, refurbishment, and demolition carbon. The asset-level analysis identifies which asset categories contribute most to portfolio-level carbon. The material-level analysis maps material inflows and embodied capital carbon across asset categories to identify material–asset hotspots.
Methodologically, the study uses established aggregation and hotspot techniques but combines them in a novel analytical sequence linking project records, asset-register prevalence, lifecycle-carbon profiles, material–asset mappings and asset-specific circular-economy prioritisation.
3.2. Empirical Context
The empirical context is flood-risk management infrastructure in England. This context is appropriate because flood-risk assets are material-intensive, long-lived, geographically distributed, and exposed to changing climate risks. The portfolio includes assets such as walls, embankments, channels, culverts, beaches, debris screens, high grounds, pump houses, outfall structures, and related flood-defence or water-management assets. These assets differ in function, material composition, intervention frequency, and lifecycle-carbon profile, making them suitable for examining material–asset specificity in circular-economy prioritisation.
Flood-risk management infrastructure also provides a useful setting for portfolio-level analysis because asset owners must balance climate adaptation, public safety, service performance, whole-life cost, and carbon reduction. Project-level carbon tools can estimate the emissions of individual schemes, but they do not necessarily reveal which asset categories, lifecycle stages, or material groups dominate across the wider asset base. The portfolio context, therefore, allows the study to examine the circular economy as a wider system prioritisation problem, rather than only as a project-level design or procurement issue.
Although the underlying carbon and material records originate from individual projects, their purpose in this study is not to evaluate isolated schemes or to calculate hydrological flood risk directly. The project-level records are harmonised by asset type, lifecycle stage, and material category and then combined with portfolio asset-register information to identify recurring patterns across the wider flood-risk management system. This aggregation reflects the portfolio–programme–project hierarchy described in Government Functional Standard GovS 002, in which projects form components of wider organisational portfolios and portfolio management supports the alignment and prioritisation of investments against organisational objectives. The resulting hotspots can therefore inform which asset classes, renewal pathways, and material-intensive interventions warrant further investigation within future programmes and projects. However, they do not replace conventional flood-risk assessment based on hazard probability, hydraulic performance, asset condition, and consequences to people and property; rather, they add a complementary resource, carbon, and lifecycle perspective to flood-risk management decision-making.
3.3. Data Sources
The study combined quantitative portfolio datasets with qualitative and documentary evidence used to contextualise, interpret and validate the modelling assumptions as collaborative research [45]. The quantitative analysis drew primarily on the publicly accessible Asset Information Management System—Public Data (AIMS-PD) and two organisational extracts from the Carbon Collation Tool (CCT). Interviews, meetings, correspondence, organisational documents and expert reviews were not treated as additional observations in the hotspot calculations. Instead, they supported interpretation of the data structures, resolution of classification inconsistencies, development of modelling assumptions and validation of the aggregate findings. Table 1 summarises the data sources and their role in the study.
Table 1.
Data sources and their usage.
The quantitative hotspot calculations were therefore based on AIMS-PD and the two CCT extracts, while the qualitative and documentary sources supported contextual interpretation, category mapping, assumption development and practitioner validation. Further details on lifecycle-carbon definitions, dataset characteristics, screening procedures, harmonisation rules and modelling assumptions are provided in Supplementary S1. Because the native organisational datasets are subject to embargo and contain project-sensitive information, record-level data and identifiable mappings cannot be publicly disclosed. The Supplementary Material, therefore, reports on the analytical procedure, non-disclosive category definitions and aggregate dataset characteristics required to assess methodological logic, without revealing protected source records.
3.4. Operationalising the Four-Step Hotspot Analysis Process
The first step, defining goal and scope, established the flood-risk management portfolio as the system boundary. The aim was to identify lifecycle, asset, and material hotspots relevant to circular-economy prioritisation. The lifecycle scope included capital, operational, replacement, refurbishment, and demolition carbon over a static comparative 100-year assessment period. The analytical levels were defined as lifecycle stage, asset category, and material group.
The second step, gathering and analysing data, combining public asset-register data, asset-level carbon records, and material-flow records. Data preparation involved defining the analytical entity, harmonising asset categories, cleaning carbon and material records, and linking carbon and material information to asset types. In the public asset-register data, the asset sub-category was treated as the primary asset entity, while asset ID counts were used as the portfolio-scaling attribute. The carbon dataset was used to estimate average whole-life carbon by asset type, while the material-flow dataset was used to identify material–asset relationships.
The third step, identifying and validating hotspots, analysed concentration patterns across lifecycle stages, asset categories, and material groups. Lifecycle hotspots were identified by comparing the relative contribution of capital, operational, replacement, refurbishment, and demolition carbon. Asset hotspots were identified by estimating which asset categories contributed most to whole-life portfolio carbon. Material hotspots were identified by assessing which material groups dominated material mass inflow and embodied carbon. The material-level results also acted as a structural and interpretive triangulation check because they were based on actual material-to-asset mappings and practitioner validation of the modelling logic and interpretive robustness of the results.
The fourth step, prioritising actions, interpreted the hotspots as circular-economy intervention points. Hotspots were not treated only as descriptive outputs, but as a basis for identifying where circular-economy strategies could be targeted. Potential intervention areas included design-life extension, replacement avoidance, material reuse, local material balancing, low-carbon specification, operational efficiency, refurbishment-first approaches, and recovery planning. This step translated the hotspot results into an asset/material-specific circular-economy prioritisation logic. Table 2 summarises the four steps and their outputs.
Table 2.
Operationalisation of Barthel et al.’s four-step hotspot analysis process.
3.5. Data Preparation and Modelling Procedure
Data preparation was required because the source datasets were not originally designed for circular-economy portfolio modelling. The public asset register, carbon tools, and material-flow records used different definitions for assets, sub-assets, asset classes, and elements. A manual harmonisation process was therefore undertaken to align asset categories across datasets before lifecycle, asset-level, and material-level analysis could be conducted (see Supplementary S1 for more details).
The modelling procedure involved three linked analytical stages. First, asset counts were gathered from the public asset register and used to represent the number of assets in each asset category. Second, average whole-life carbon values were calculated for each asset type from the cleaned 415-record asset-level dataset. These average values were then multiplied by asset counts to estimate portfolio-level carbon distribution by asset type and lifecycle stage. The calculation can be summarised as
- Carbon:where Cp,i is the estimated portfolio-level carbon for asset category i; is the average carbon per asset in category i; and Ni is the number of asset IDs in that category. The stages of carbon corresponding to asset lifecycle are defined in Supplementary S1.
- Material mass:where Mp,i is the estimated portfolio-level material mass for asset category i; is the average material mass per asset in category i; and Ni is the number of asset IDs in that category. The stages of material inflow correspond to the asset lifecycle stages defined in Supplementary S1.
These calculations were used to estimate relative portfolio-level distributions for hotspot screening, rather than to produce precise asset-level inventories.
Third, the 5486-record material-flow dataset was used to map material groups to asset categories. Material contributions were analysed by both mass and embodied carbon. This allowed the study to distinguish high-mass materials from high-carbon materials and to identify where material–asset combinations created the strongest circular-economy priorities. The analysis, therefore, produced three outputs: lifecycle-carbon distribution, asset-level carbon distribution, and material–asset hotspot profiles.
The use of asset-ID counts as the portfolio-scaling variable requires careful interpretation. Asset identifiers represent managed asset entities, rather than standardised physical units, and assets within the same category may differ in length, area, capacity, material composition and complexity. AIMS-PD applies segmentation conventions to linear assets; for example, embankments are divided according to ownership, common design or construction characteristics, and are generally capped at a maximum length of 600 m. This provides some consistency in the representation of extensive assets, but does not remove all within-category variation. Nevertheless, the resulting estimates are interpreted as relative portfolio distributions and hotspot-screening indicators, rather than precise asset-level or organisational carbon totals. Complete physical or functional normalisation was not possible because comparable length, area, volume, capacity and replacement-value data were not consistently available across the integrated datasets.
3.6. Technical Challenges, Visualisation, and Interpretation Choices
Applying hotspot analysis to flood-risk infrastructure datasets required several methodological choices. First, the datasets operated at different levels of resolution. The asset-level carbon dataset provided lifecycle-carbon values by asset type, but did not include detailed material-flow information. The material-level dataset provided material-to-asset records, but was focused mainly on material level. The two datasets were therefore used in complementary ways: asset-level data estimated whole-life carbon distribution, while material-level data identified material–asset relationships.
Second, the analysis required scaling and interpretation assumptions. Asset ID counts were used to estimate portfolio-level carbon by asset type, while average carbon values from cleaned asset-level records were used to represent typical carbon signatures. The outputs should therefore be interpreted as relative distribution patterns, rather than precise asset-by-asset carbon estimates. This is consistent with hotspot analysis as a strategic screening and prioritisation method, rather than a certified carbon inventory.
Third, visualisation choices were made to support interpretation and prioritisation. Pareto-style charts were used to show concentration effects across asset types and materials. Lifecycle-carbon charts were used to compare capital, operational, replacement, refurbishment, and demolition carbon over the 100-year assessment period. Sankey diagrams were used to visualise material–asset relationships by showing how materials flow into asset categories and where dominant material pathways occur (Sankey diagrams are attached in the paper as Supplementary S2). These visualisations were selected because hotspot analysis is intended to translate complex evidence into accessible outputs for decision makers.
3.7. Development of the Portfolio-Level Asset Characterisation Matrix
The Portfolio-Level Asset Characterisation Matrix was developed as a strategic screening tool for the organisation’s existing flood-and coastal-risk-management asset portfolio, rather than as a hydrological risk model or a substitute for formal investment appraisal. AIMS-PD provided the population and classification of asset identifiers, while project-level carbon and material records from the Carbon Collation Tool supplied sampled evidence on the carbon and material characteristics associated with different asset types. The two sources were linked through a manual harmonisation process because their original asset categories, subcategories and naming conventions were not fully aligned (see the AIMS-PD, CCT and harmonised nomenclature in the notes below the figures). Asset descriptions were reviewed and mapped into a common analytical classification, after which the number of asset identifiers in each category was combined with the corresponding average lifecycle-carbon values derived from the CCT sample. Material records were separately grouped by common material and asset categories to identify recurring material–asset relationships. The resulting portfolio prioritisation matrix therefore integrates asset prevalence with sampled carbon and material inflows, to reveal where impacts are concentrated across lifecycle stages, asset types and materials.
The matrix supports organisational prioritisation, rather than automatic project selection. Hotspot rankings identify asset and material categories that warrant greater attention, but decisions on individual interventions remain subject to established flood-risk management processes, including asset condition, residual life, hydraulic performance, service criticality, risk to receptors, technical feasibility, cost and statutory appraisal requirements. Portfolio-level evidence is therefore used to direct attention and further investigation, while project-level appraisal determines whether, when, and how an intervention should proceed.
The relationship between the collected data and the proposed prioritisation framework is, therefore, sequential. AIMS-PD establishes the prevalence of asset types across the portfolio; the asset-level CCT records identify lifecycle-carbon concentrations; and the material-level CCT records identify high-mass and high-carbon material–asset relationships. These three evidence layers generate the lifecycle, asset and material hotspots that populate the portfolio-level prioritisation matrix. The matrix indicates where circular-economy intervention may offer the greatest portfolio-level benefit, while asset condition, residual life, hydraulic performance, flood-risk criticality, technical feasibility and cost determine whether and how an intervention progresses through established project appraisal. The framework therefore complements, rather than replaces, conventional flood-risk assessment and investment decision-making.
3.8. Assumptions and Limitations
Several assumptions underpin the analysis. Asset ID counts were treated as a proxy for asset quantity. Average carbon values from the cleaned asset-level records were assumed to provide a reasonable basis for estimating relative portfolio-level carbon distribution. The 100-year assessment period was used as a consistent lifecycle static-comparison boundary, rather than a dynamic forecast of future asset condition, climate exposure, or technology change. Material-level analysis focused mainly on capital material inflows because this was the most detailed material information available in the dataset. Capital material inflows on assets can be for any intervention such as new-build, refurbishment, replacement or demolition. For each intervention the CCT tool aligns with PAS 2080 Stage [9], so it gives the capital material inflow at the project level, which has many assets in different interventions, but needs capital inflow of material from cradle to gate for respective intervention. The rest of the stages for a future forecast are based on organisational design and life assumptions, and are projected based on capital carbon. See more details in Supplementary S1.
The analysis has limitations. First, the source datasets were operational and were not created for circular-economy or hotspot modelling. Asset definitions, material categories, and carbon-reporting structures therefore required harmonisation. Second, the asset-level carbon results should be interpreted as indicative portfolio patterns, rather than precise asset-specific estimates. Third, the 100-year assessment period does not dynamically account for future changes in climate exposure, asset deterioration, design standards, material technologies, or supply-chain decarbonisation. Fourth, although the methodological logic is transferable, the specific hotspot results are context-dependent, and reflect the material and asset profile of flood-risk management infrastructure.
These limitations define the appropriate use of the model. The approach is intended as a strategic screening and prioritisation tool. It identifies where circular-economy effort should be focused before more detailed project-level engineering, lifecycle, and cost-benefit assessments are undertaken. Its strength lies in converting operational carbon and material datasets into portfolio-level decision intelligence that can guide targeted circular-economy intervention.
4. Results
4.1. Baselining and Understanding of Current Approach
The organisation has developed relatively mature carbon-governance arrangements and has measured and reported construction-related carbon emissions for several years. In 2019, it established an ambition to become net-zero by 2030 against a construction-related emissions baseline of approximately 148,000 tCO2e per annum. Based on the 2019/20 baseline, a year-on-year reduction glide path was established; however, a new £5.2 billion capital investment programme for 2022–2027 was estimated to add approximately 600,000 tCO2e, implying an estimated 13.2% year-on-year reduction in construction-related emissions to remain on the original trajectory. Despite revisions to the carbon-management framework, sustainability-linked KPIs and circular-economy pilots, performance remained below expectations. This challenge is captured in the organisation’s 2025 scorecard: “In the first 5 years of our net zero journey, we are forecasting to have reduced emissions by 2%. In the next 5 years, we need to achieve 45% to hit our 2030 milestone”. During the research period, the longer-term net-zero date was subsequently revised to 2045–2050, while the interim ambition of a 45% reduction by 2030 was retained. This raises an important management question regarding how substantially greater reductions can be identified and operationalised across the infrastructure portfolio.
The present approach addresses this challenge primarily through carbon baselining, budgeting and project-level intensity targets, including tCO2e per £10,000 of expenditure. While this provides a useful mechanism for setting and monitoring carbon performance, evidence collected during the research suggested that such cost-normalised targets provide limited visibility of the underlying lifecycle stages, asset categories, material flows and repeated intervention cycles responsible for emissions. The portfolio analysis therefore complements, rather than replaces, the existing carbon-management system by disaggregating impacts across lifecycle stage, asset type and material group. As outlined in Figure 1, the final stage of the hotspot analysis compares this baseline carbon-budgeting logic with the material-focused circular innovation (MFCI) framework (see Supplementary S3) subsequently used to identify potential lifecycle-specific circular strategies [26].
4.2. Portfolio Impacts Are Concentrated, Not Evenly Distributed
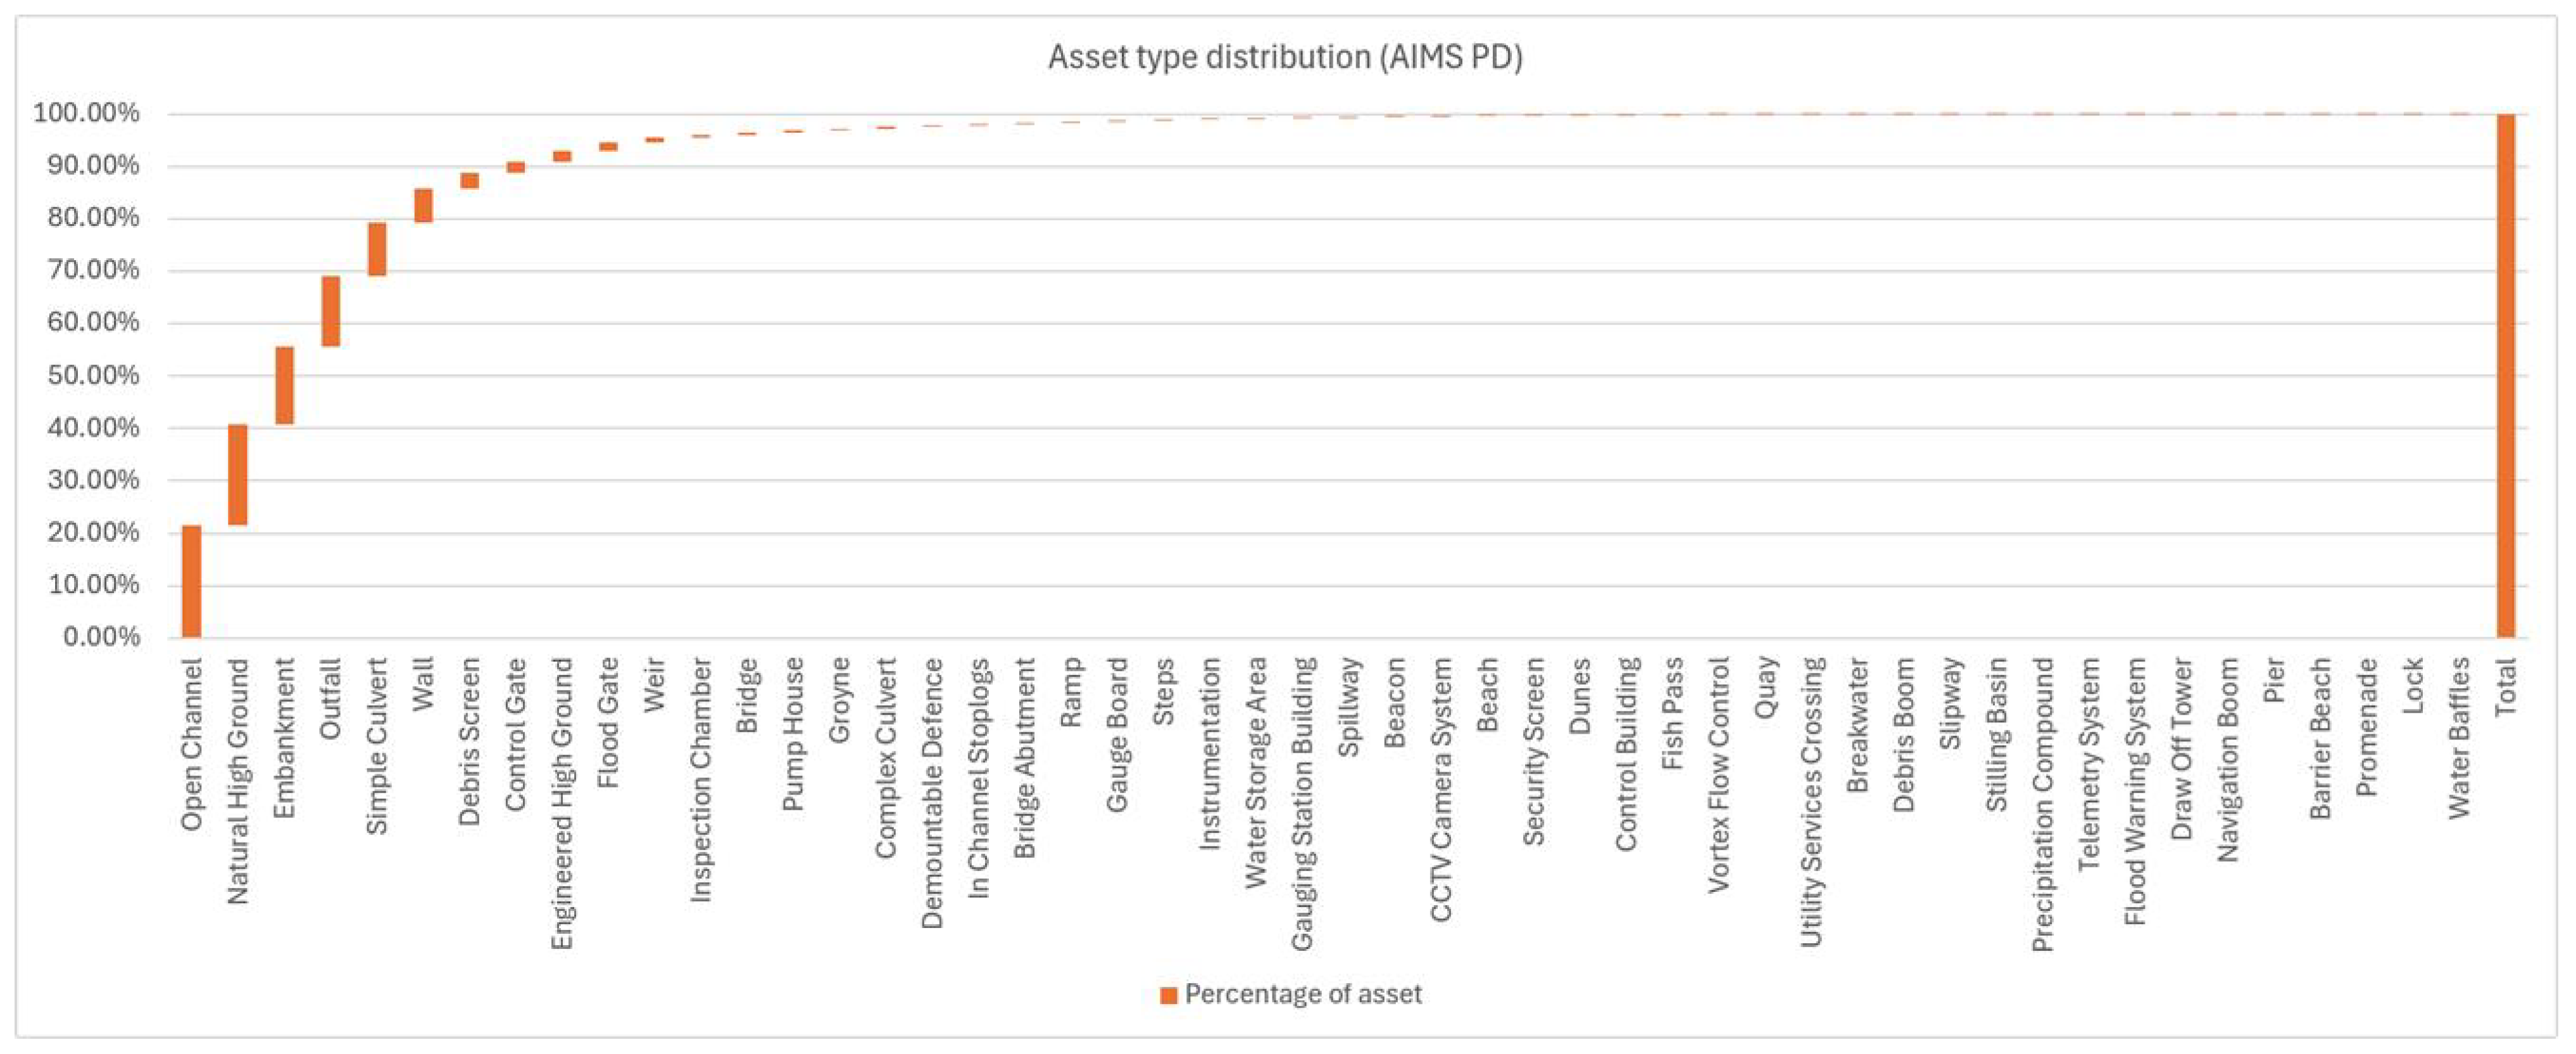
The top-down analysis shows that carbon and material impacts are concentrated across a limited number of lifecycle stages, asset types, and material groups. The asset-register distribution (see Figure 2) indicates a Pareto-style pattern, where a small number of asset categories dominate the portfolio. This matters because circular-economy prioritisation should not treat all assets or projects equally. Instead, portfolio-level prioritisation should begin by identifying where the largest system-level impacts occur.
Figure 2.
Distribution of asset types in the flood-risk management portfolio (Author’s own). Note: Figures labelled as derived from AIMS PD retain the nomenclature of the public asset register. Equivalent terms were harmonised into common analytical categories for portfolio-level aggregation.
4.3. Replacement Carbon Is the Largest Lifecycle Hotspot
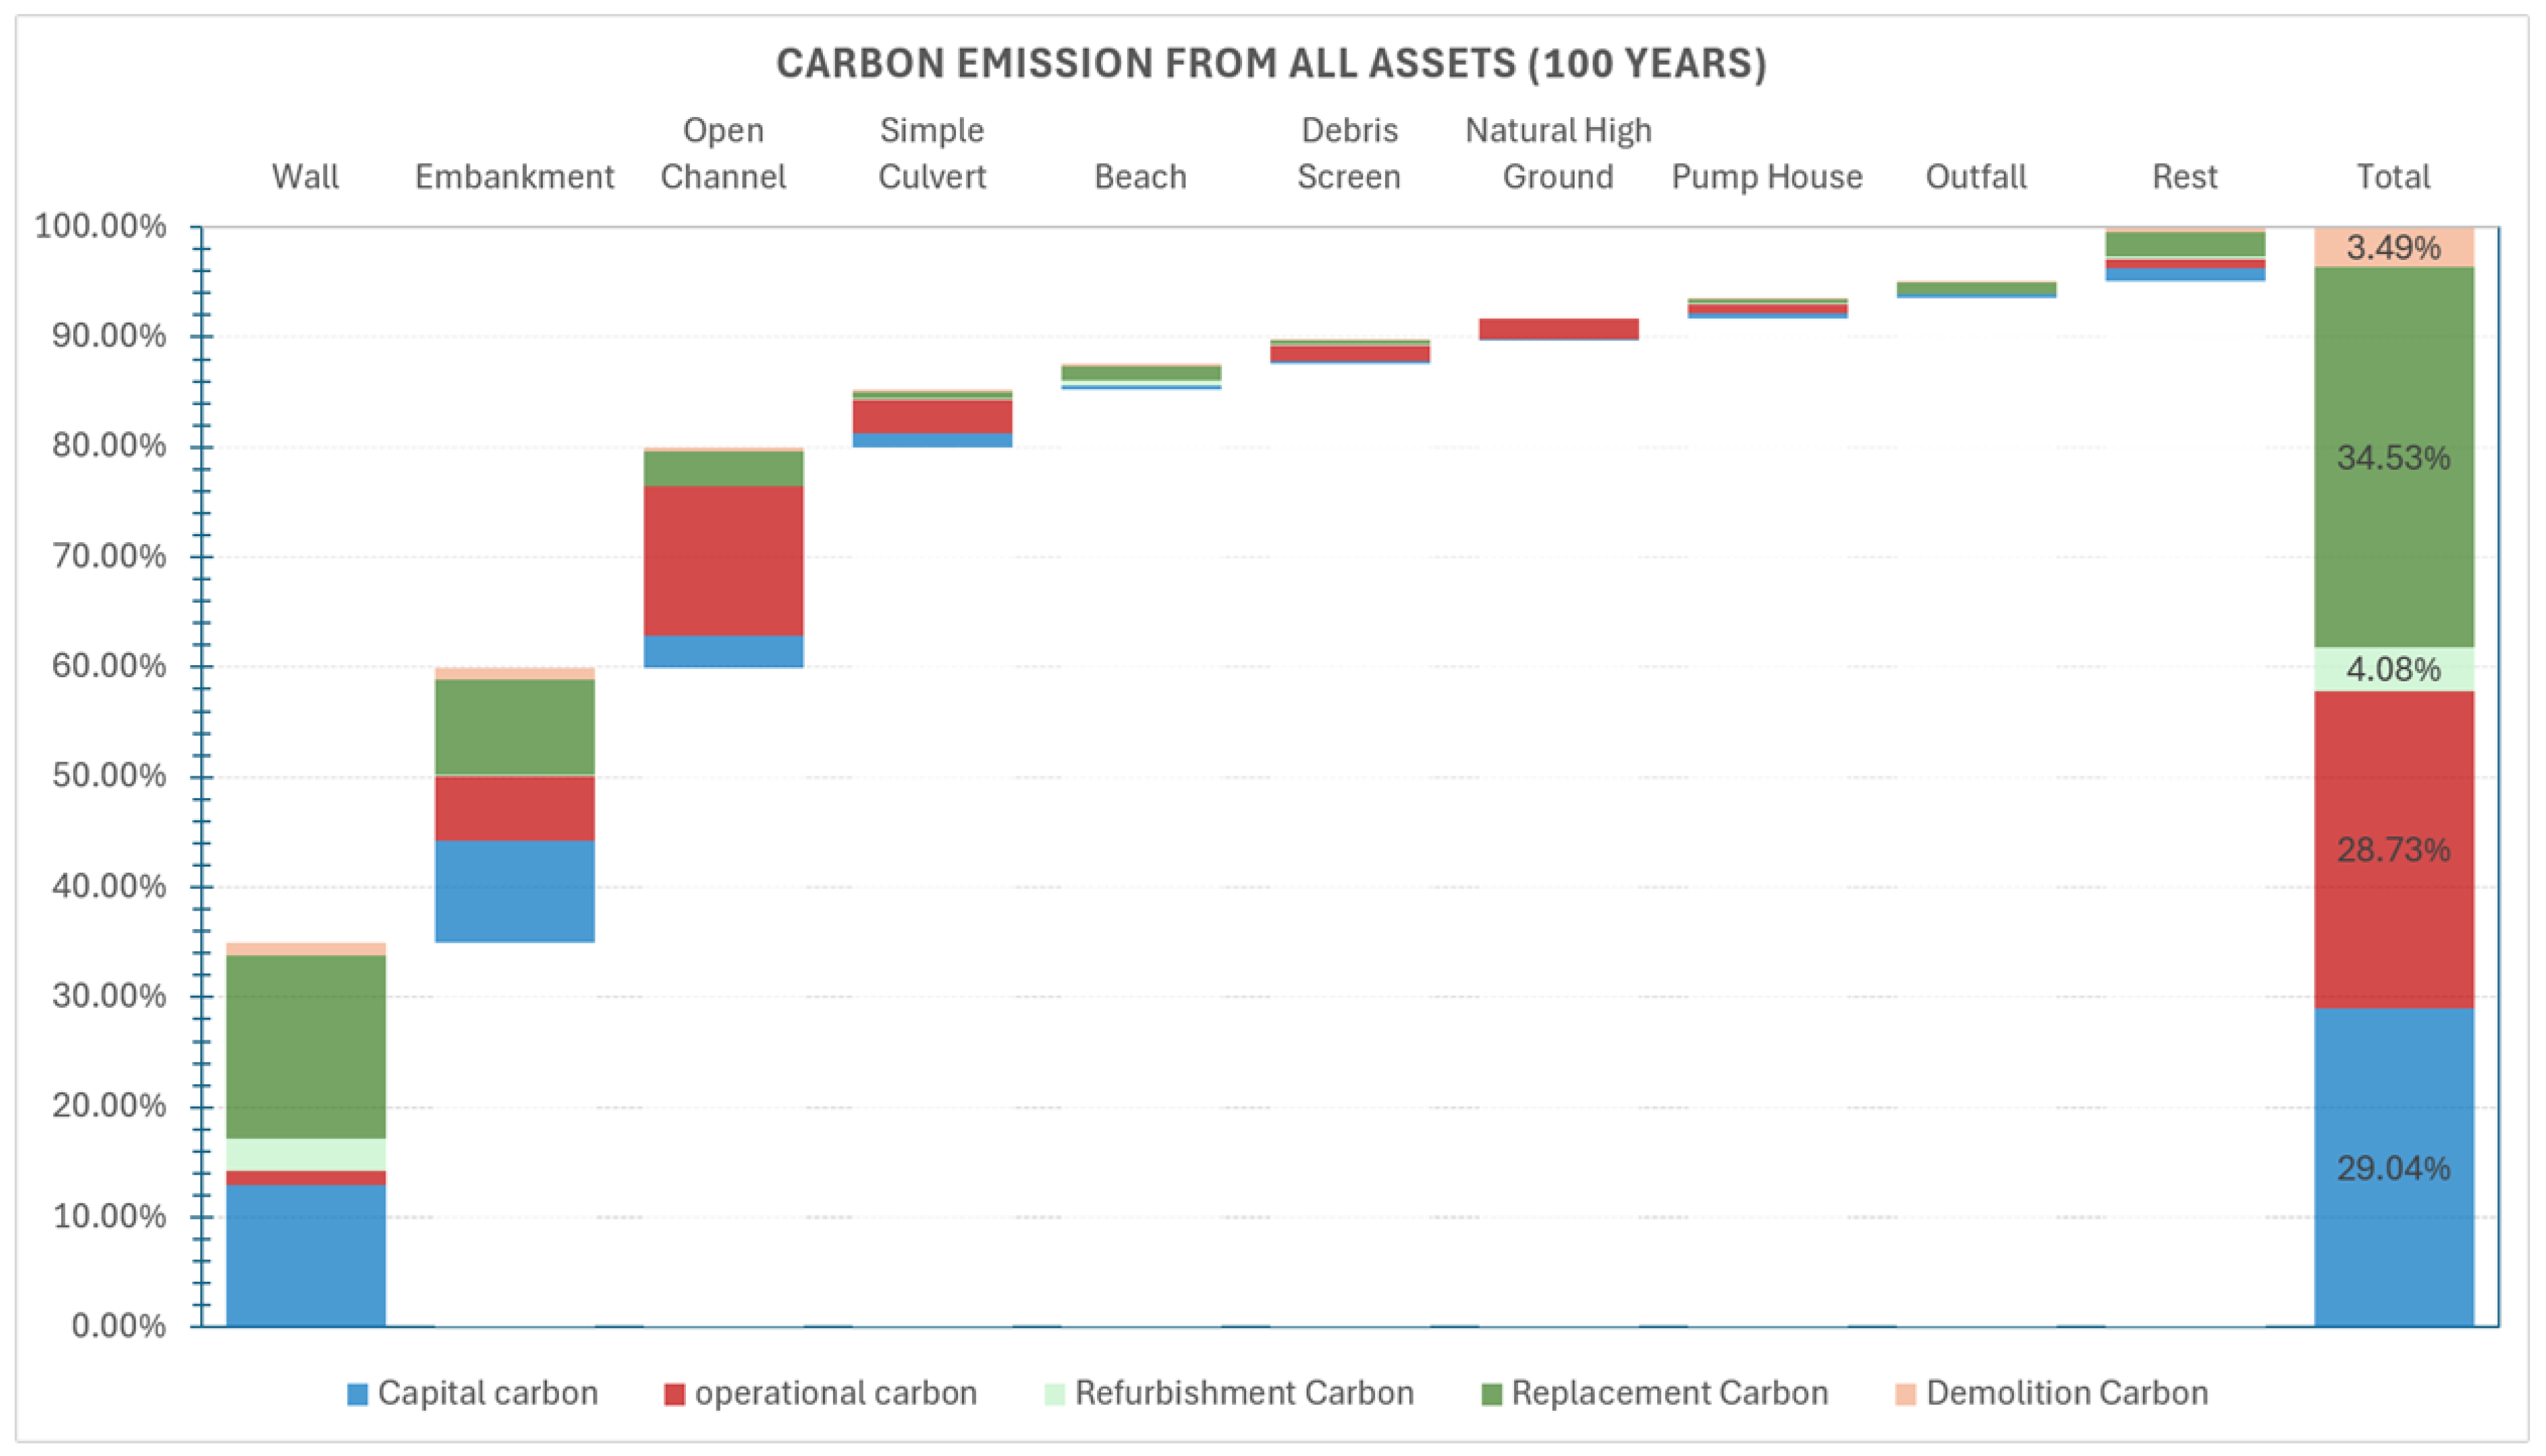
The lifecycle-stage analysis shows that replacement carbon is the largest contributor to estimated whole-life carbon over the static comparative 100-year assessment period. Replacement accounts for approximately 35% of total estimated emissions, compared with 29% from capital carbon and 29% from operational carbon. Refurbishment and demolition carbon contribute to smaller shares.
This result shows that carbon reduction cannot be treated only as a construction-stage issue. Circular-economy strategies must also address future renewal cycles through design-life extension, partial renewal, refurbishment-first approaches, maintainability, and material recovery.
4.4. Walls, Embankments, and Channels Dominate Asset-Level Carbon
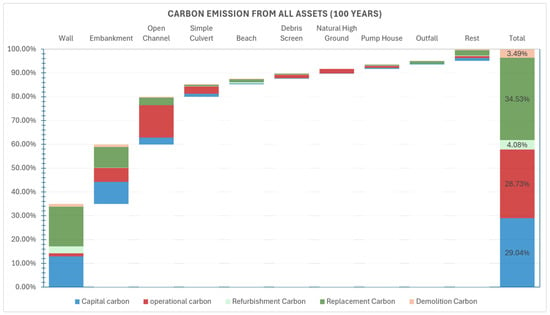
The asset-level analysis shows that a small number of asset types dominate whole-life carbon. Walls, embankments, and channels account for approximately 80% of estimated portfolio carbon over the 100 years. When simple culverts, beaches, debris screens, high grounds, pump houses, and outfall structures are added, nine asset types account for more than 90% of total estimated carbon (see Figure 3).
Figure 3.
Whole-life carbon distribution by lifecycle stage over the 100-year assessment period (Author’s own). Note: Figure label uses the equivalent terms harmonised into common analytical categories for portfolio-level aggregation. Further, Figure 3 illustrates three screening insights: (i) Pareto-type concentration of portfolio carbon across asset categories; (ii) the relative contribution of lifecycle-carbon stages over the 100-year assessment boundary; and (iii) variation in lifecycle-carbon profiles between asset categories.
This concentration indicates that circular-economy interventions should first target the highest-impact asset categories, rather than being spread evenly across the portfolio. It also shows that different asset types require different strategies. Walls and embankments are strongly associated with capital and replacement carbon, while culverts, channels, and debris screens show stronger operational carbon signatures.
4.5. A Small Group of Materials Drives Most Carbon and Mass Inflow
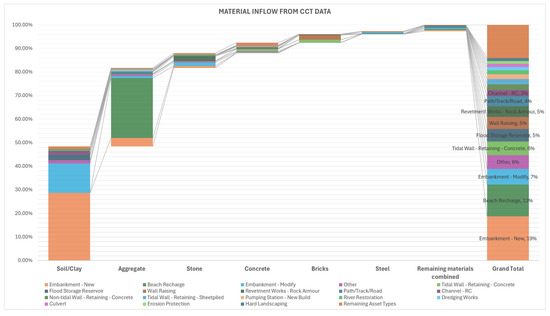
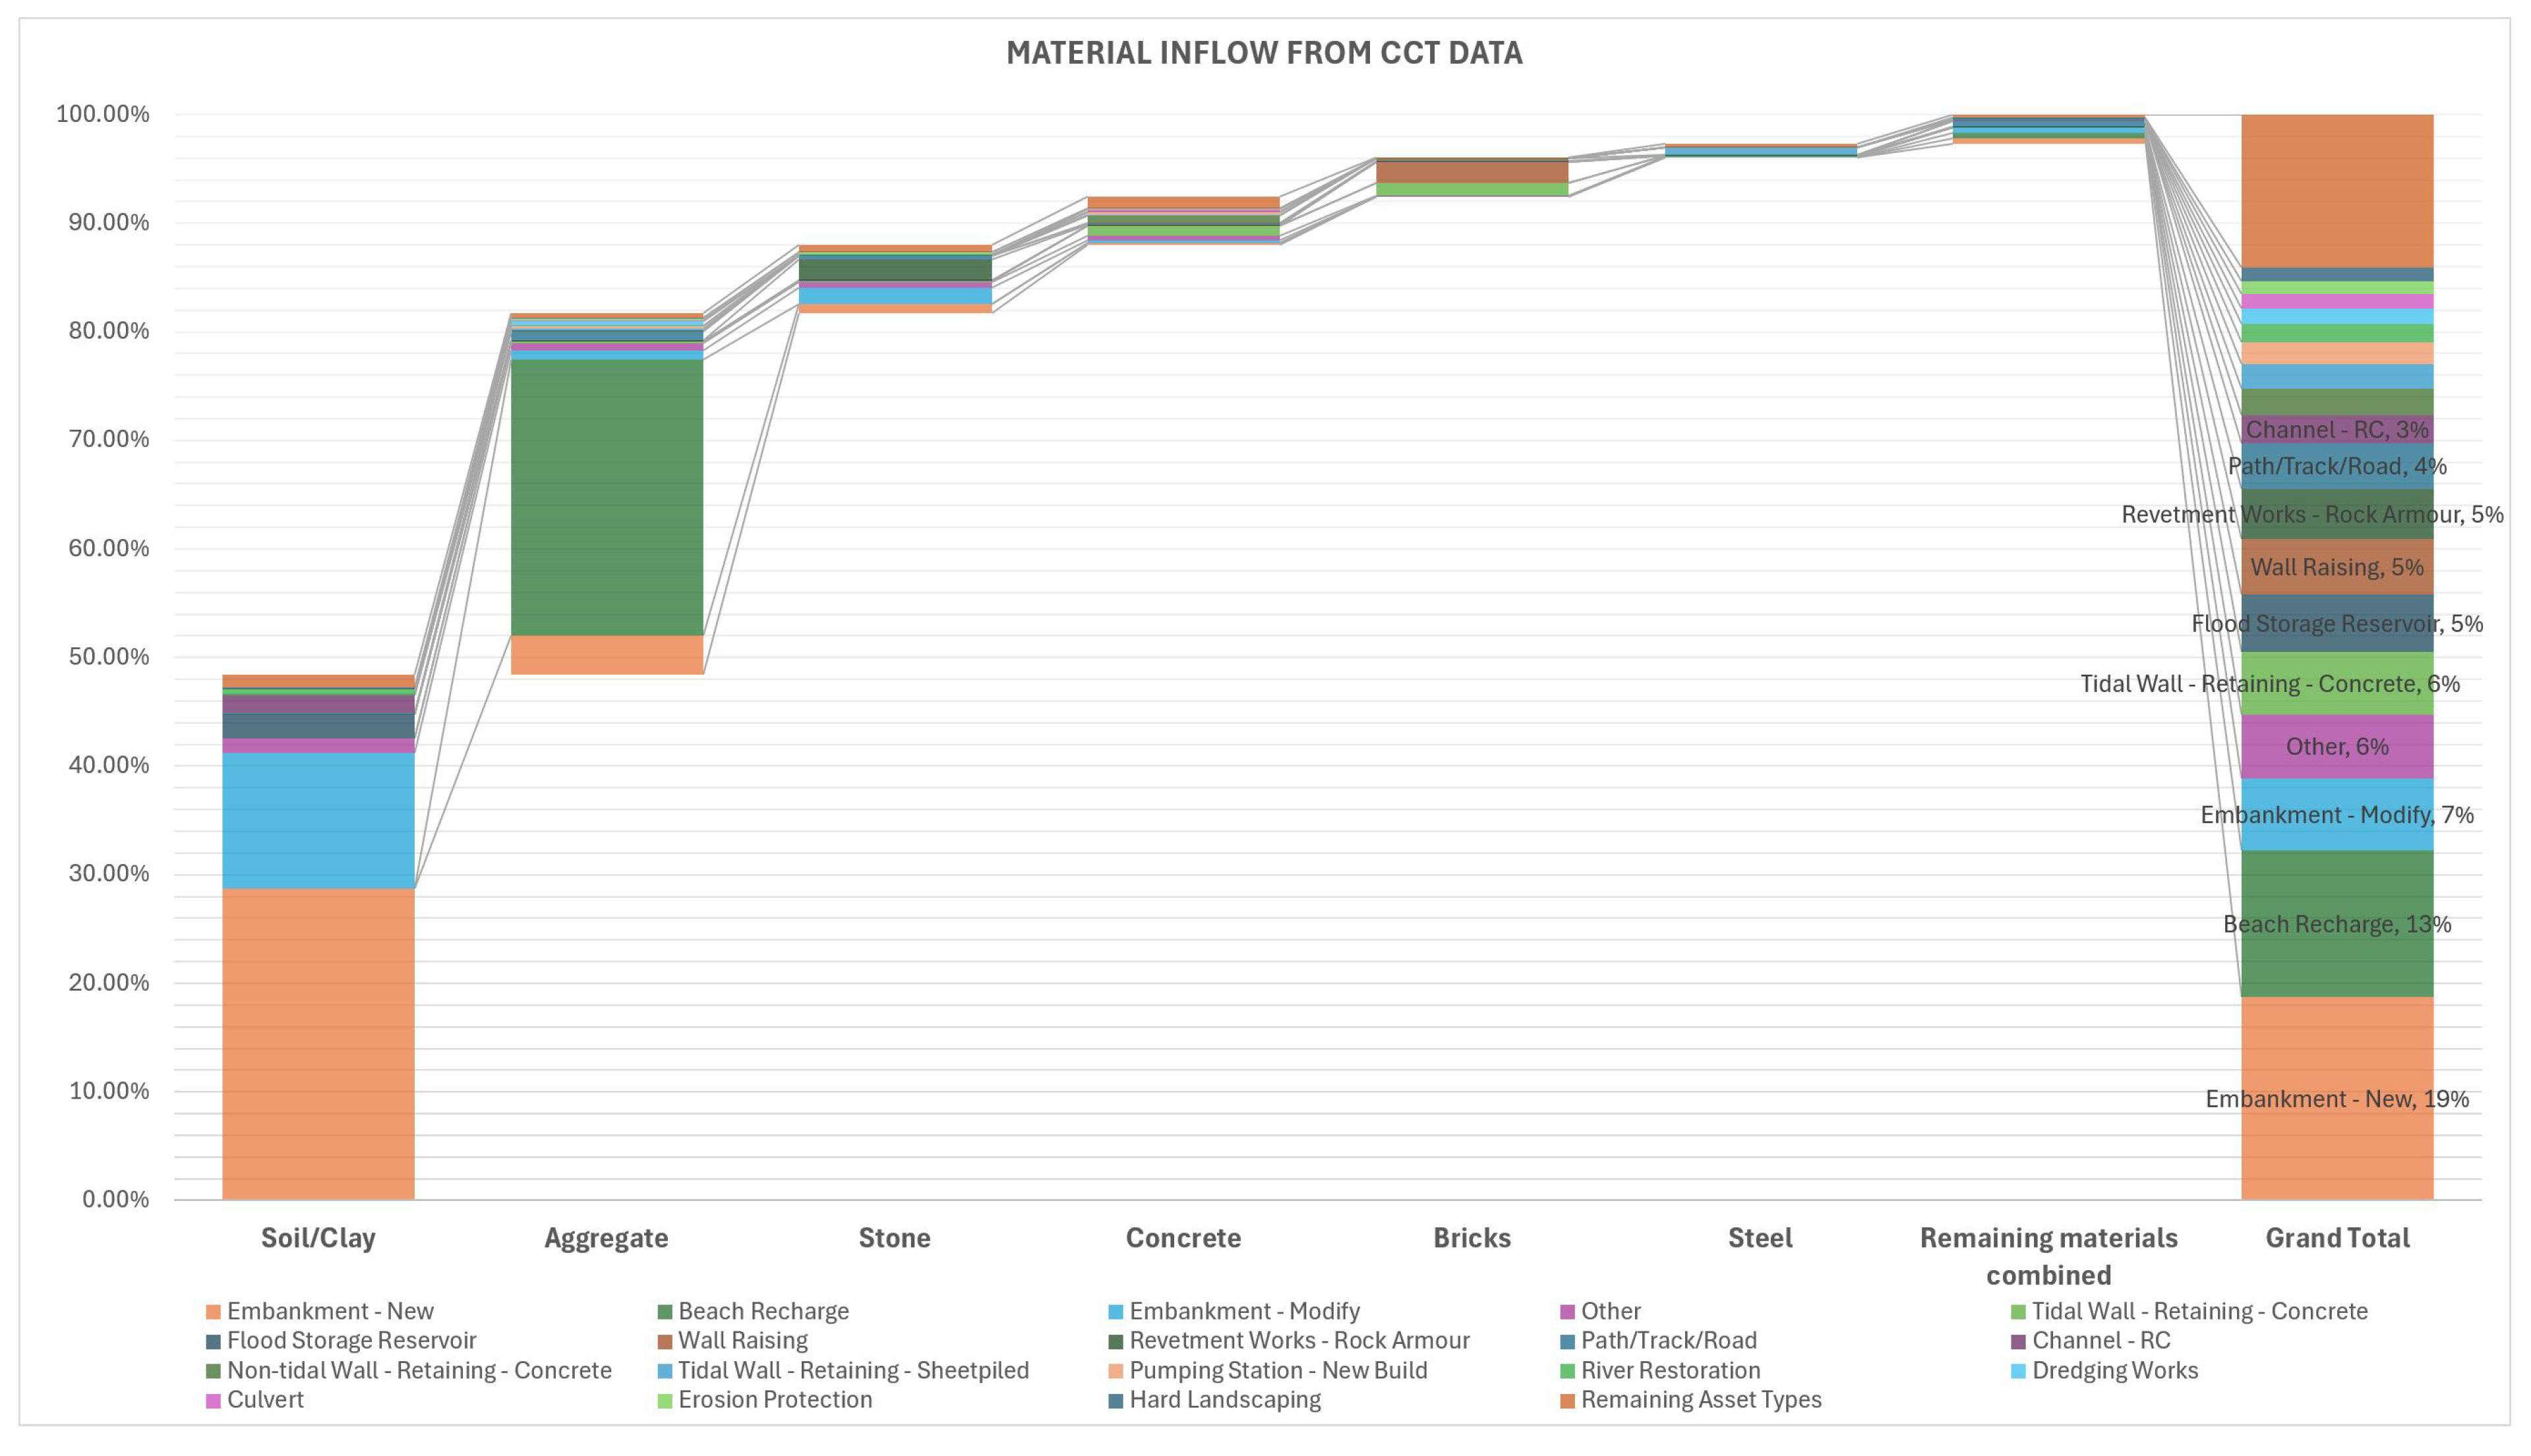
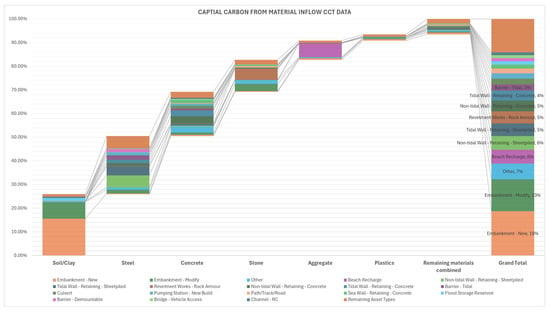
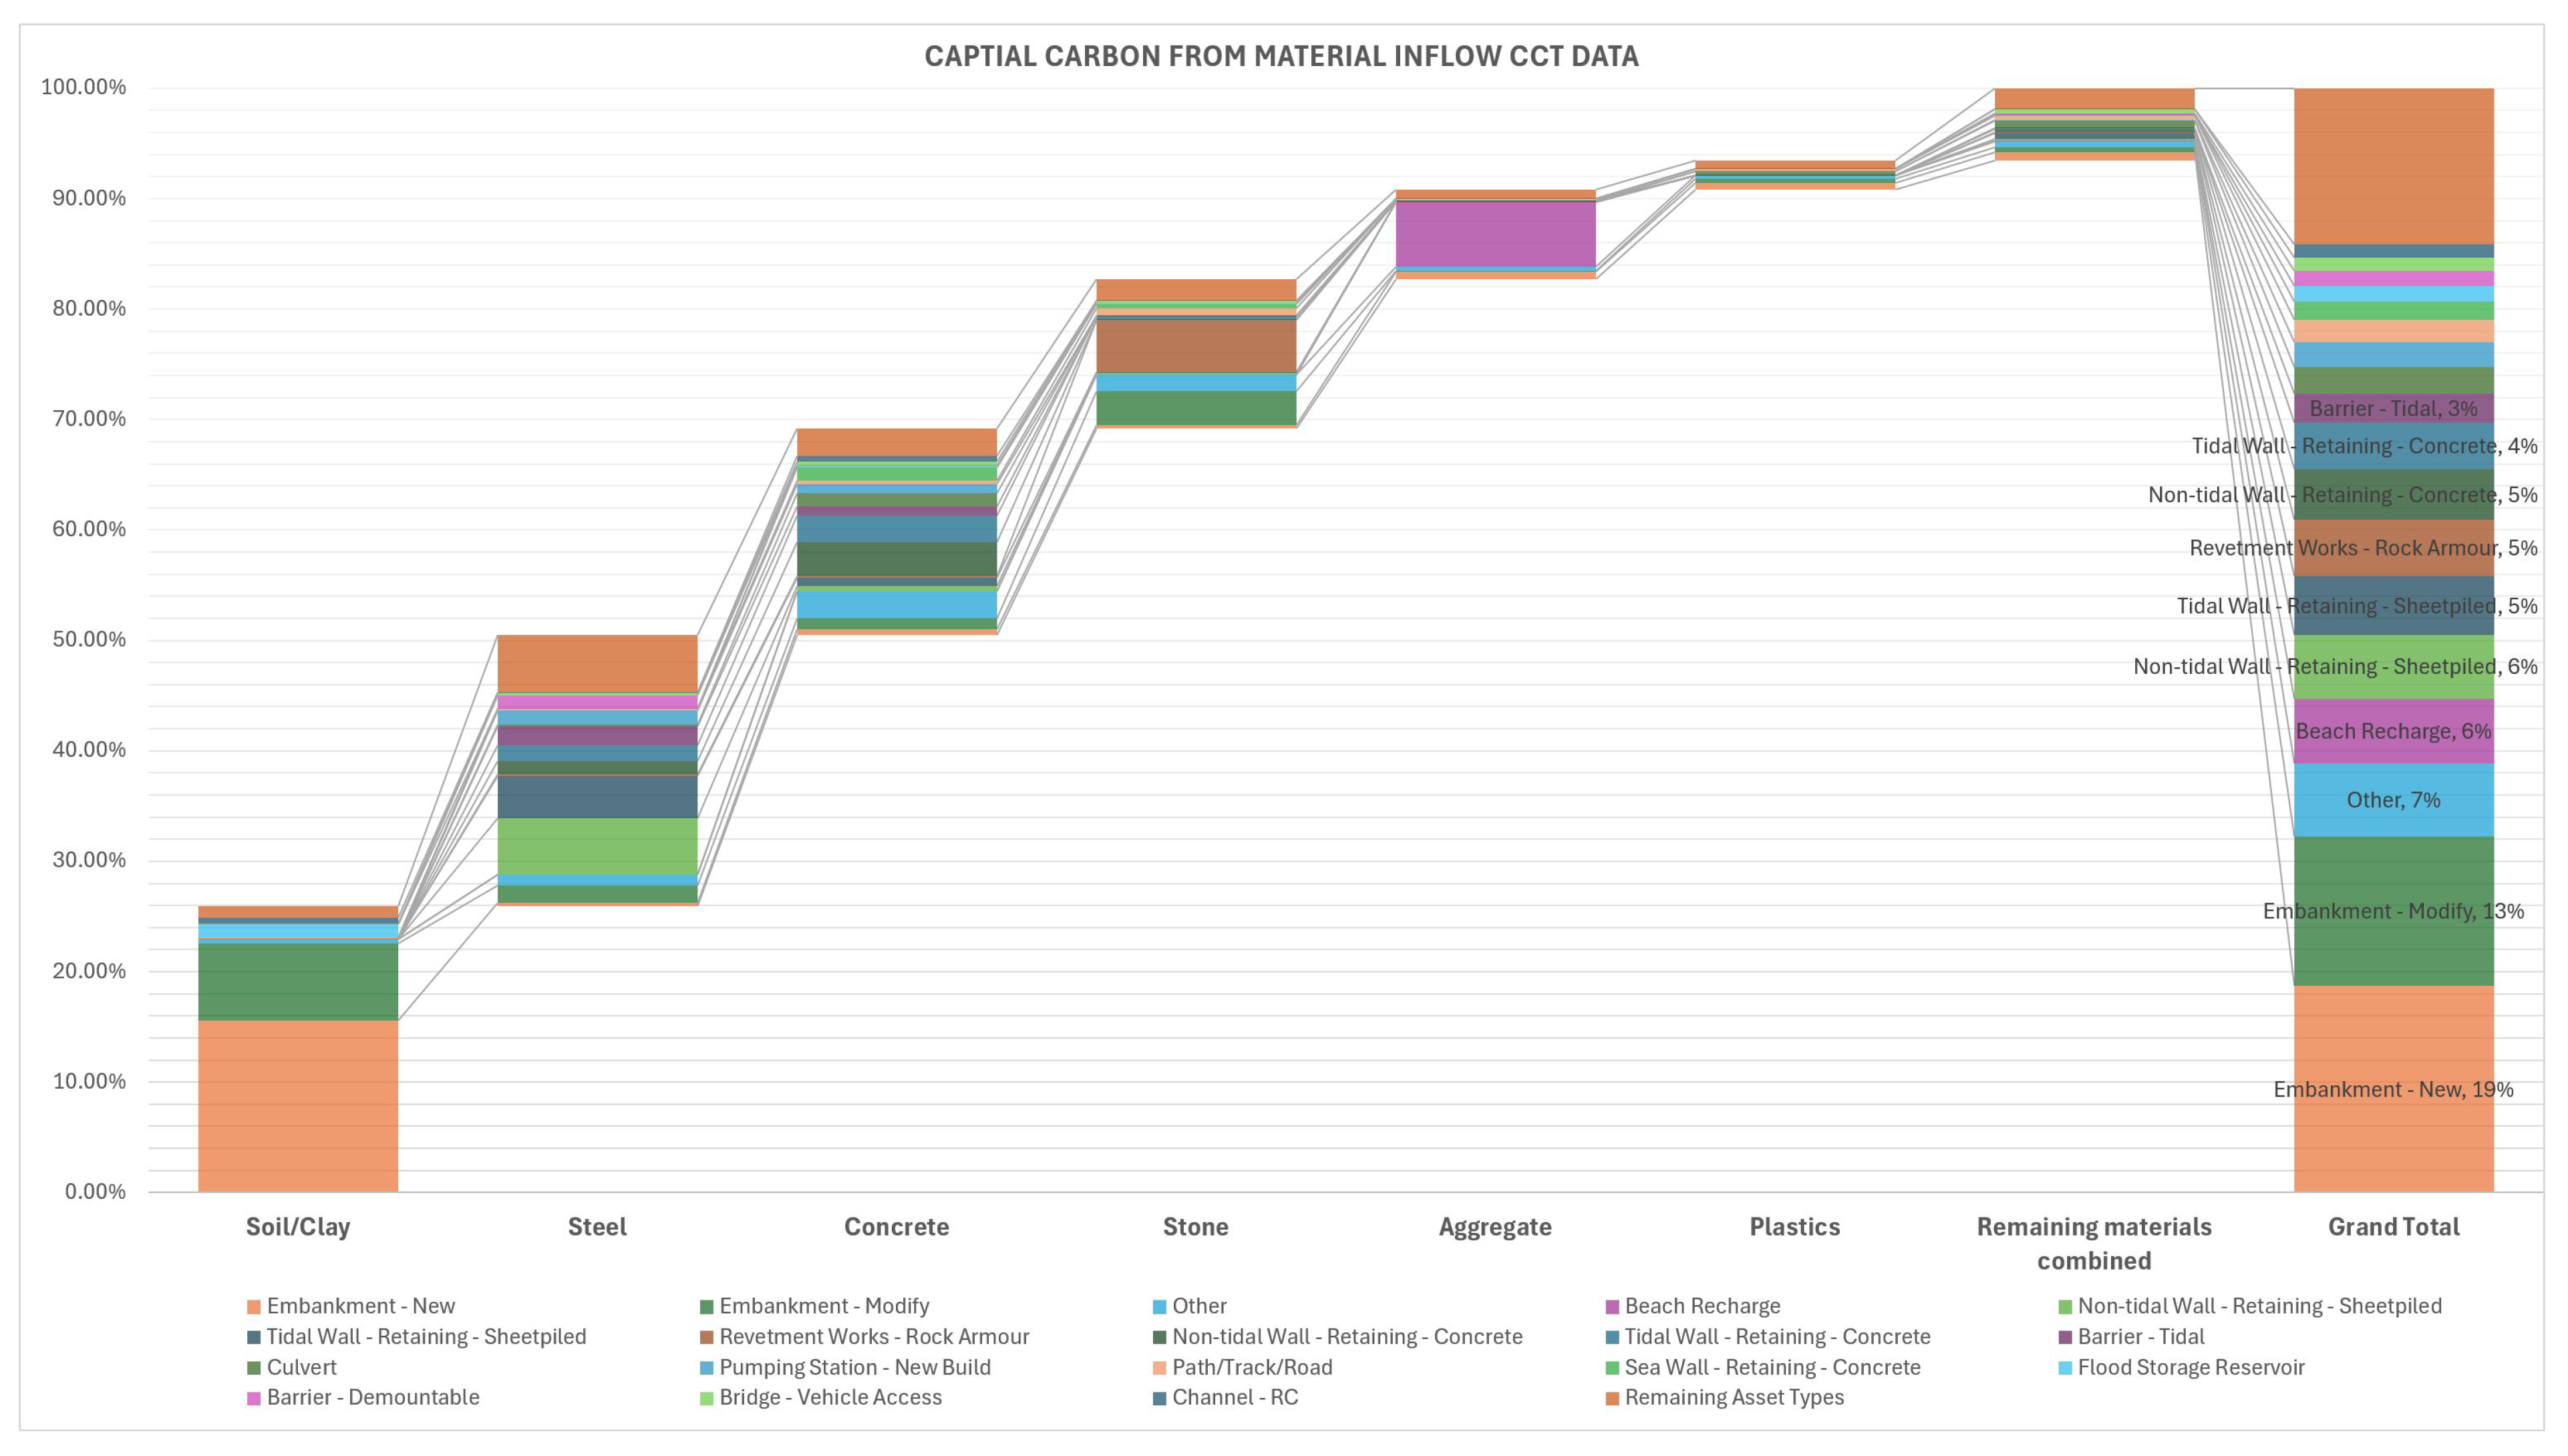
The material-level analysis shows that soil/clay, and stone account for more than 80% of total material-related carbon (see Figure 4), whereas soil/clay, steel, and concrete account for more than 80% material inflow. When aggregates and plastics are included, the share rises to nearly 90% of material inflow. This confirms that material impacts are also highly concentrated in a few material groups across both embodied carbon and material mass.
Figure 4.
Material contribution to material mass inflow across the portfolio (Author’s Own). Note: Figures labelled as derived from CCT data retain the project-level asset terminology used in the Carbon Collation Tool, whereas figures derived from AIMS-PD use the nomenclature of the public asset register. Equivalent terms were harmonised into common analytical categories for portfolio-level aggregation.
A key finding is that soil/clay is the largest contributor by both carbon and material mass (see Figure 4 and Figure 5). This challenges the organisation assumption that concrete is always the dominant infrastructure-material hotspot. Steel shows a different profile: it contributes strongly to carbon, despite a smaller mass share, indicating that it is a high-carbon-intensity material. Therefore, circular-economy strategies must distinguish between high-mass (volume) materials such as soil/clay, aggregates, and stone, and high-carbon materials such as steel and concrete.
Figure 5.
Material-associated capital carbon contribution across the portfolio (Author’s Own). Note: Figures labelled as derived from CCT data retain the project-level asset terminology used in the Carbon Collation Tool, whereas figures derived from AIMS-PD use the nomenclature of the public asset register. Equivalent terms were harmonised into common analytical categories for portfolio-level aggregation.
4.6. Summary of Results
Overall, the results show that circular-economy opportunities are concentrated at three levels. First, replacement carbon is the largest lifecycle hotspot. Second, walls, embankments, and channels dominate asset-level hotspots. Third, soil/clay, steel, concrete, and stone are strategic hotpots for material groups.
These findings support a targeted portfolio strategy. Rather than managing circular-economy innovation across all projects equally, infrastructure owners can focus first on the lifecycle stages, asset types, and material groups that account for most portfolio-level impact. This provides the empirical basis for the Section 5, which explains how top-down hotspot analysis can support circular-economy prioritisation, carbon budgeting, and asset-specific intervention strategies.
5. Discussion
5.1. Circular Economy Needs Portfolio-Level Prioritisation
The results support the central argument developed in the literature review: project-level circular-economy assessment is necessary, but insufficient for infrastructure asset owners. Existing studies show the value of circular design, lifecycle assessment, material recovery, and decision-support tools at project or component level [15,18,46]. However, our results show that carbon and material impacts are highly concentrated across the portfolio. This means that circular-economy implementation should begin with a portfolio-level question: where will circular-economy intervention create the greatest portfolio-level effect?
This shifts circular-economy operationalisation from generic improvement to targeted prioritisation. Instead of applying similar circular-economy expectations across all projects, asset owners can focus first on the lifecycle stages, asset types, and materials that dominate whole-life carbon and material inflow hotspots. This is consistent with hotspot analysis, which aims to identify priority areas where intervention is most likely to matter [20]. The contribution of this paper is to show how hotspot analysis can be operationalised at the material–asset level for infrastructure portfolios.
5.2. Replacement Carbon Reframes the Circular-Economy Problem
The finding that replacement carbon is the largest lifecycle hotspot changes how the circular economy should be understood in flood-risk infrastructure, given the organisation context. The circular economy is often associated with material substitution, recycled content, and waste reduction during project delivery. These remain important, but the results show that future replacement cycles may create a larger whole-life carbon burden than initial construction. Therefore, circular-economy strategies must also focus on asset-life extension, refurbishment-first decisions, partial renewal, maintainability, and recovery planning.
This finding aligns with whole-life carbon guidance, which emphasises that emissions should be assessed beyond construction-stage carbon [9,10]. It also strengthens the link between the circular economy and asset management. For long-lived infrastructure, reducing future material inflow by improving resource productivity may be as important as lowering the carbon intensity of current materials. The circular economy should therefore be treated not only as a procurement or construction strategy, but as a lifecycle asset-management strategy.
5.3. Material–Asset Specificity Matters
The material results show that circular-economy strategies cannot be designed around materials alone. Soil/clay, steel, concrete, and stone dominate the portfolio hotspots, but their significance differs. Soil/clay is a high-material mass hotspot, while steel is a high-carbon-intensity hotspot. Concrete and stone are important across both material demand and carbon contribution. This distinction extends the material-flow literature by showing why portfolio-level material intelligence needs to be linked to asset function and lifecycle stage [6,7,8].
The finding also challenges the organisation’s assumption that infrastructure decarbonisation should focus mainly on concrete. In flood-risk management, earthworks and high-volume material movement can be equally strategic. This means that soil reuse, local material balancing, reduced excavation, and avoided transport should sit alongside low-carbon concrete, steel reuse, and recycled-content strategies. Circular-economy value is therefore created by matching the intervention to the specific material–asset relationship.
5.4. A Differentiated Asset Strategy Is Needed
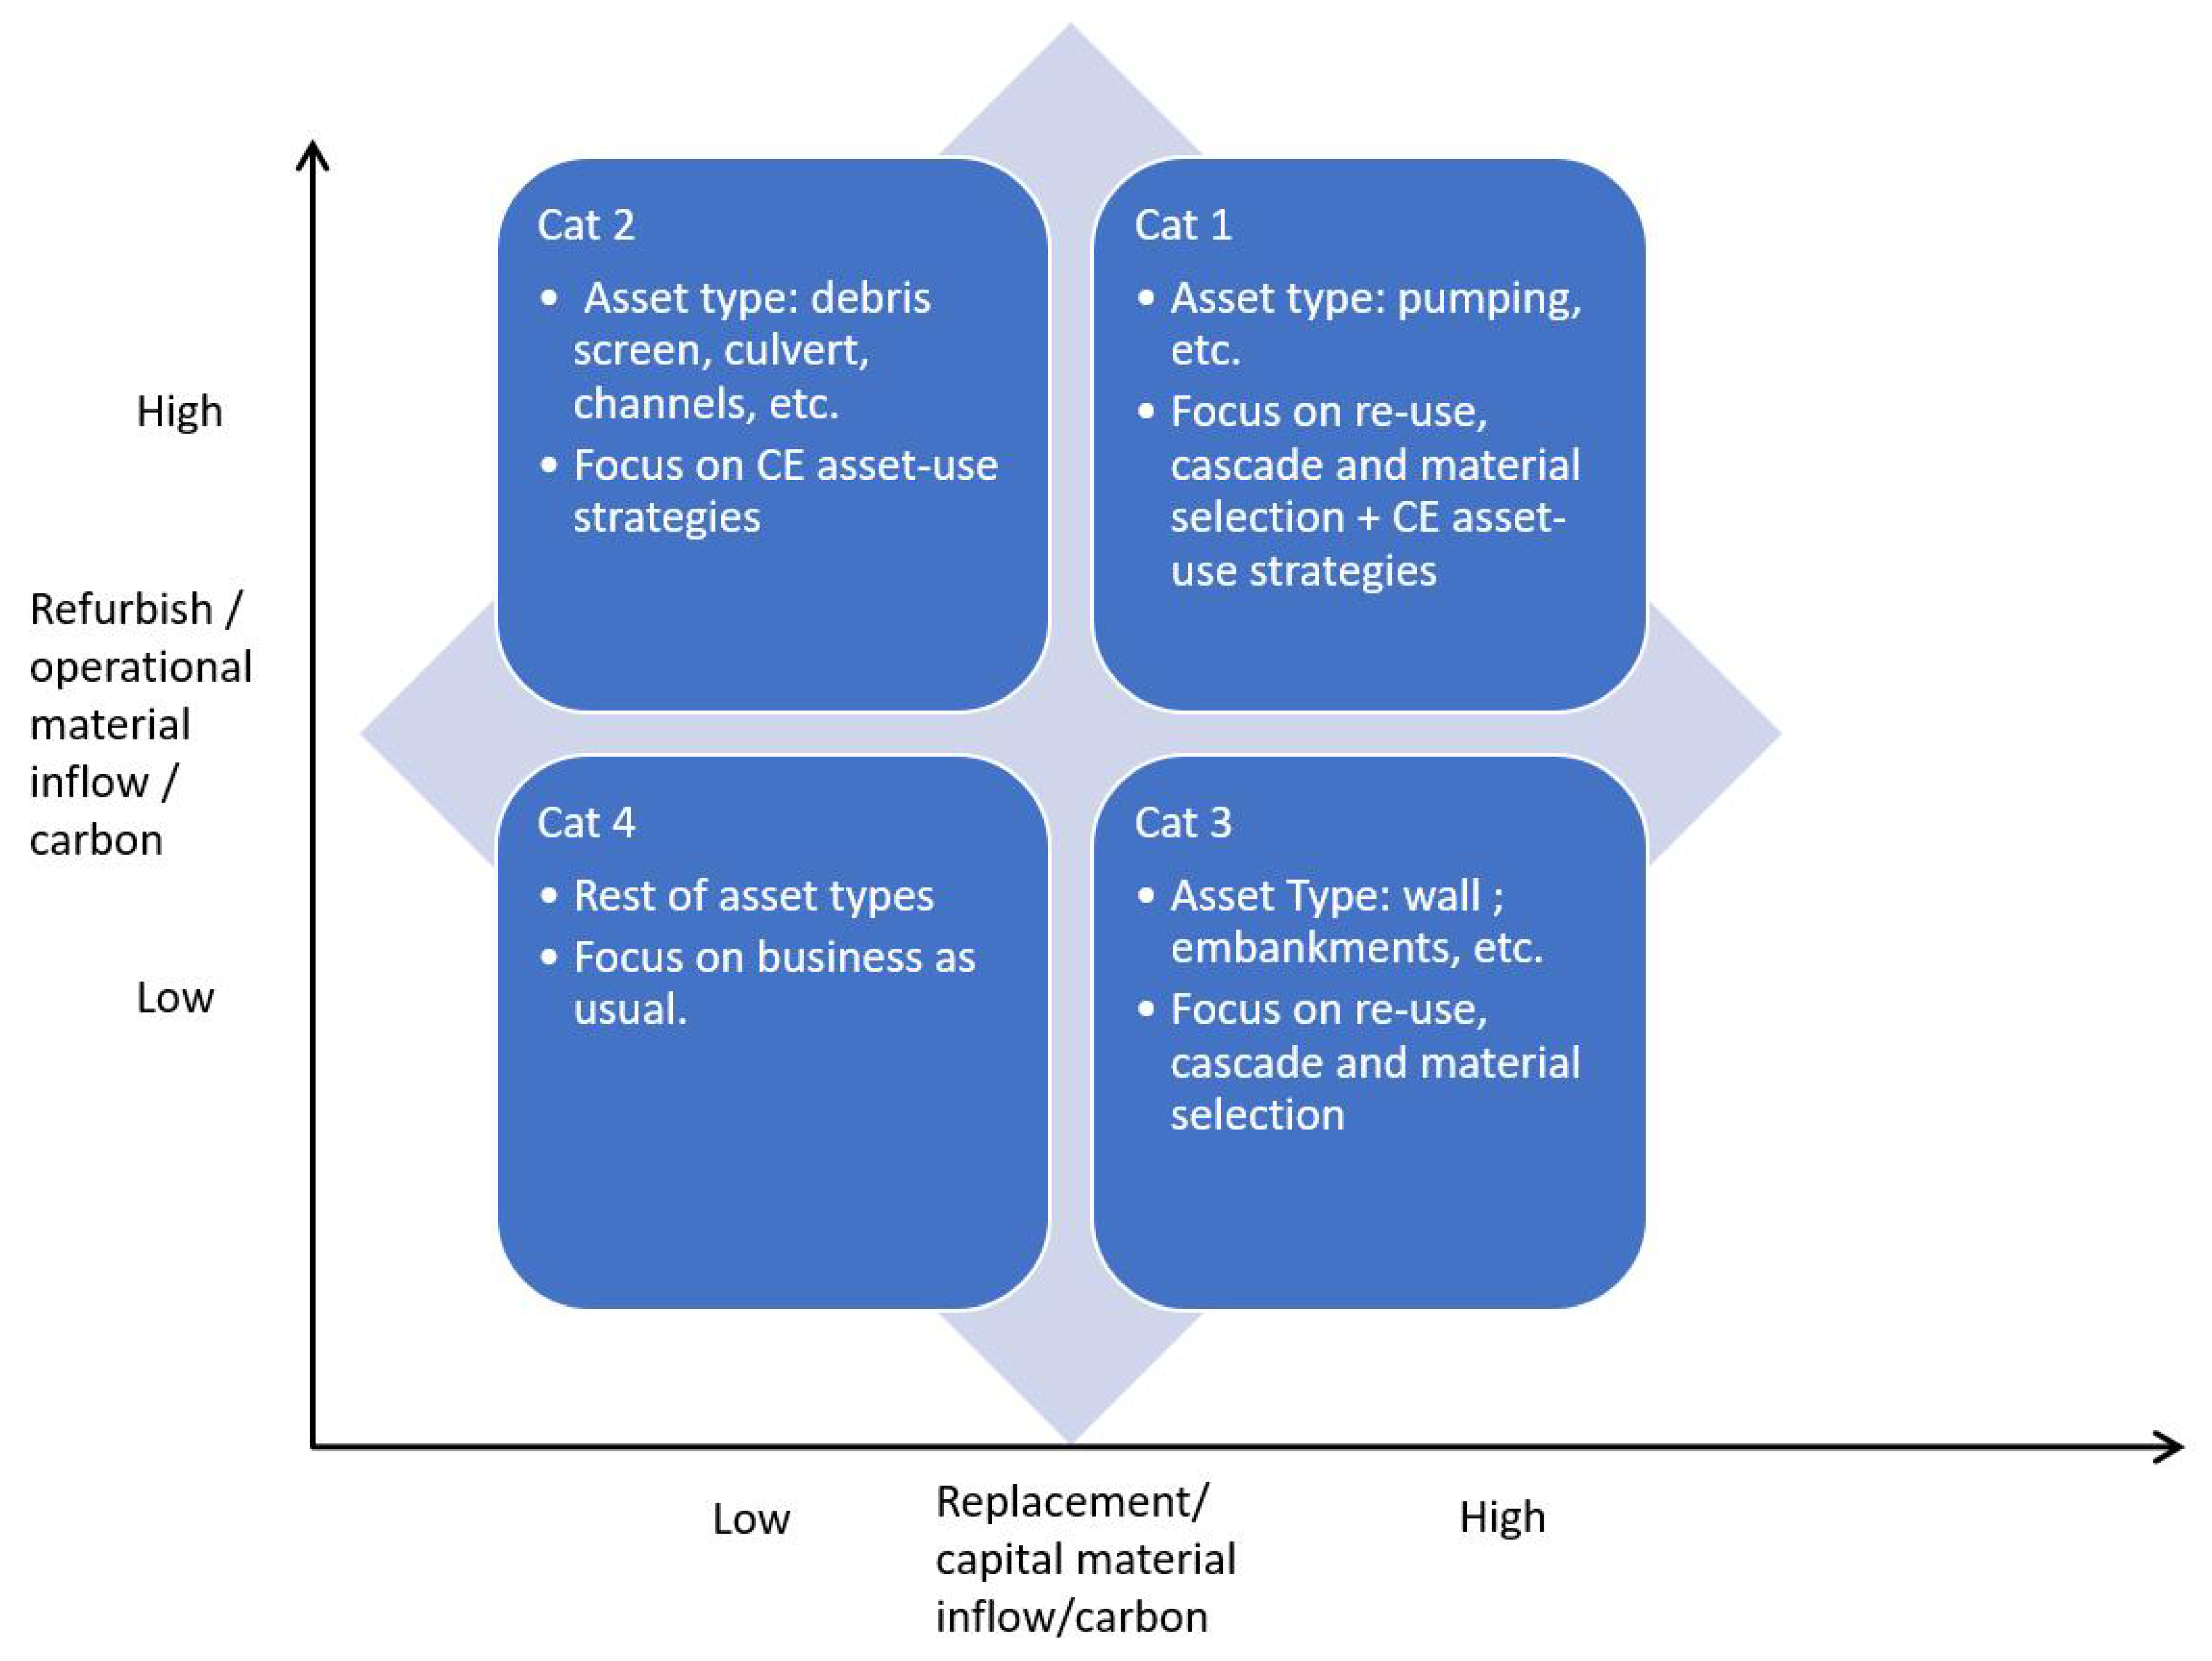
The Asset Categorisation Matrix was developed by translating the lifecycle hotspot results into a two-dimensional portfolio screening tool. The horizontal axis represents the relative importance of capital and replacement material/carbon-related impacts, while the vertical axis represents the relative importance of operational and refurbishment impacts. Asset categories were positioned using the dominant lifecycle patterns observed in the CCT analysis and the Pareto-style concentration results. The “high” and “low” distinctions are therefore relative classifications derived from the portfolio distribution, rather than fixed numerical or universal engineering thresholds. The matrix is intended as a conceptual prioritisation framework that differentiates asset categories according to their dominant lifecycle burden and indicates the types of circular-economy interventions that may warrant further examination.
For strategy identification, the study draws on the six-stage lifecycle-based Material-Focused Circular Innovation (MFCI) framework developed by the authors [26] (see Supplementary S3), which identifies a repertoire of CE strategies across different stages of the asset lifecycle. In this study, MFCI is used as a strategy-selection layer following portfolio screening, rather than as a prescriptive decision model. The identified lifecycle, asset and material hotspots are first used to determine where intervention is likely to have the greatest portfolio-level effect; the MFCI framework is then used to translate these priorities into a potential action agenda for asset owners. Supplementary S3 provides the detailed mapping between asset categories and potential MFCI interventions across idea viability, design and procurement, construction, asset handover, asset use and end-of-life stages. These interventions represent priorities for further CE appraisal, rather than predetermined investment or engineering decisions.
Asset condition ratings were not used to determine the original quadrant positions because consistent condition data was not available within the integrated dataset. Condition, residual life, hydraulic performance, service criticality and risk to receptors are, instead, treated as subsequent appraisal criteria. Accordingly, the matrix supports initial portfolio screening but does not determine whether an individual asset should be maintained, refurbished, replaced or decommissioned.
The asset-level results show that walls, embankments and channels account for most portfolio carbon hotspots, while a wider group of nine asset types accounts for almost all remaining impact. This supports a differentiated, rather than uniform, CE strategy. Assets dominated by capital and replacement impacts, such as walls and embankments, warrant greater attention to circular design, design-life extension, material selection, reuse, recovery and replacement avoidance. Assets with stronger operational and refurbishment signatures, such as culverts, channels and debris screens, require greater emphasis on maintainability, operational efficiency, proactive maintenance and reduced intervention frequency. Where both lifecycle dimensions are significant, a broader combination of MFCI strategies may be appropriate.
This finding also has implications for carbon budgeting. A uniform carbon-reduction glide path across all asset types may obscure the fact that different assets have different lifecycle-carbon signatures and material profiles, given the organisation’s current approach. Portfolio-level carbon budgets can, therefore, be complemented by asset-specific material strategies that identify where and how reductions may be achieved. In this sense, carbon budgeting defines the performance requirement, while the hotspot analysis identifies the lifecycle, asset and material priorities through which that requirement can be operationalised.
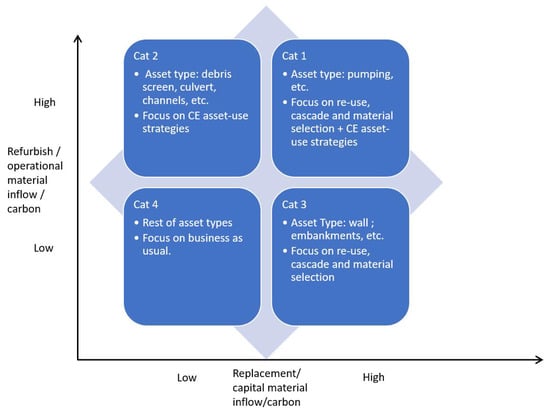
The 2 × 2 matrix in Figure 6 categorises assets based on two key lifecycle factors:
Figure 6.
Asset categorisation matrix (Author’s own). Note: Asset categories are positioned according to their relative capital/replacement and operational/refurbishment lifecycle impacts. The high–low classifications represent comparative portfolio patterns, rather than fixed engineering thresholds. The matrix is a strategic screening tool and should be used alongside asset condition, residual life, hydraulic performance, criticality, flood risk and formal investment appraisal (see Supplementary S3 for more details).
X-axis: Replacement and capital material inflow (high or low).
Y-axis: Refurbishment/operational material inflow (high or low).
Mapping an asset onto one of the matrix’s four quadrants enables tailored CE strategy recommendations:
- Category 1: High capital/replacement and high operational/refurbishment impacts
Typical assets: pumping stations and similar assets, including mechanical, electrical, instrumentation, control and automation (MEICA) systems, where both recurring operational demands and capital or replacement interventions are significant.
Potential Priorities: these assets warrant the broadest combination of MFCI strategies. Potential priorities include circular project appraisal, business-model innovation, circular design and material selection, procurement and contract innovation, traceability, asset-life extension, proactive maintenance, operational efficiency, and end-of-life recovery planning. Because impacts occur across several lifecycle stages, these assets require integrated intervention, rather than a single material- or project-level response.
- Category 2: High operational/refurbishment and low capital/replacement impacts
Typical assets: debris screens, culverts and other assets where recurring operation, maintenance or refurbishment impacts are relatively more significant than capital or replacement impacts.
Potential Priorities: priority should be given to MFCI asset-use strategies (see Supplementary S3), particularly asset-life extension, condition-based monitoring, proactive maintenance, operational efficiency and reduction in intervention frequency. Where appropriate, improved traceability and design-for-maintainability can also support longer service life and reduce recurring material and carbon demand.
- Category 3: Low operational/refurbishment and high capital/replacement impacts
Typical assets: walls, embankments and other materially intensive assets where initial construction and future replacement dominate lifecycle impacts.
Potential Priorities: priority should be given to MFCI strategies relating to circular appraisal, material selection, design optimisation, sourcing and procurement, reuse, replacement avoidance, and end-of-life recovery or cascading (see Supplementary S3). Particular attention should be given to retaining existing assets where feasible, extending design life, reducing virgin-material demand and enabling future recovery of high-volume or high-carbon materials.
- Category 4: Low impacts on both lifecycle dimensions
Typical assets: assets with comparatively low capital/replacement and operational/refurbishment impacts within the portfolio distribution.
Potential Priorities: these assets represent a lower immediate priority for portfolio-level CE intervention. Apply minimum circularity and carbon requirements by periodic review and project-level appraisal where changes in asset condition, residual life, flood risk, criticality or other local factors justify further intervention.
6. Conclusions
This paper examined how top-down material–asset hotspot analysis can support portfolio-level circular-economy screening in flood-risk management infrastructure. By combining hotspot analysis with material–asset mapping analysis, the study developed a prioritisation and screening approach that links lifecycle carbon, asset categories, and material inflows. The findings show that circular-economy opportunities are not evenly distributed across the portfolio: replacement carbon is potentially the largest lifecycle hotspot, walls, embankments, and channels are asset-level hotspots, and soil/clay, steel, concrete, and stone are material-level hotspots. Overall, the paper reframes circular-economy transition in infrastructure as a portfolio-level prioritization problem, rather than only a project-level optimisation problem.
6.1. Transferability to Other Material Portfolios and Capital Delivery Systems
Although the empirical focus is flood-risk management infrastructure, the hotspot approach has wider methodological relevance for other material-intensive portfolios and capital delivery systems. Hotspot analysis has already been applied across product, product-category, product-portfolio, sector, city, and national-level studies [20,37,38,47]. The same logic could support prioritisation in highways, rail, water infrastructure, energy networks, healthcare estates, public buildings, housing, and industrial facilities. The transferability lies not in applying the flood-risk results, but in applying the same methodological process: define the portfolio boundary, harmonise asset and material data, identify lifecycle and material hotspots, visualise concentration patterns, and translate findings into intervention priorities using the MFCI approach.
6.2. Research Agenda for Hotspot Analysis in Circular-Economy Portfolios
Future research should extend hotspot analysis from static portfolio snapshots to dynamic models that incorporate asset deterioration, intervention timing, climate exposure, changing performance standards, and supply-chain decarbonisation. Hotspot analysis should also be integrated with cost, benefit–cost ratio, carbon budgeting, procurement data, and whole-life value assessment, to strengthen the business case for circular-economy interventions. Further work should examine how digital asset registers, material passports, building information modelling, carbon tools, and procurement systems can produce more reliable material–asset intelligence. Comparative studies across highways, rail, water, energy, healthcare, and public estates would also help test whether similar concentration patterns occur across different material portfolios.
6.3. Implications: Contribution to Portfolio-Level Thinking
The paper contributes to circular-economy operationalisation literature by showing how imperfect but operationally meaningful datasets can guide portfolio-level system prioritisation. The proposed top-down material–asset hotspot approach connects material-flow evidence, whole-life carbon, asset categories, and circular-economy strategy selection. It also aligns with a differentiated view of the circular economy at portfolio level: the portfolio is not simply a collection of projects, but an evolving material–asset system shaped by intervention cycles, climate exposure, asset function, and organisational carbon targets. For practitioners, the findings suggest a clear sequence: use portfolio-level hotspot analysis to identify dominant lifecycle stages, asset types, and material groups; classify assets according to capital/replacement and operational/refurbishment material inflows; and then apply detailed project-level assessment where the portfolio analysis shows the greatest potential for portfolio-level value.
Supplementary Materials
The following supporting information can be downloaded at: https://www.mdpi.com/article/10.3390/systems14101237/s1, Supplementary Section S1. Data & Method Description, Supplementary Section S2. Data Visualisation, and Supplementary Section S3. MFCI Framework and Strategy Mapping. References [48,49] are cited in the supplementary materials.
Author Contributions
Conceptualisation, M.J. and M.Z.; methodology, M.J.; formal analysis, M.J.; investigation, M.J.; data curation, M.J.; writing—original draft preparation, M.J.; supervision, P.H., M.Z.; writing—review and editing, M.J., P.H. and M.Z.; visualisation, M.J.; project administration, M.J., P.H. and M.Z. All authors have read and agreed to the published version of the manuscript.
Funding
This research received no external funding.
Institutional Review Board Statement
Ethical approval was granted by the University of Exeter Research Ethics Committee through the Worktribe Research Management System Application ID: 5037267 on 5th July 2024.
Informed Consent Statement
All participants provided informed consent prior to participation, with verbal consent reconfirmed immediately before each interview.
Data Availability Statement
The datasets presented in this article are not readily available because the underlying organisational carbon and material datasets are subject to confidentiality and embargo restrictions and contain project-sensitive information. Requests to access the datasets should be directed to the authors of this article.
Conflicts of Interest
The authors declare no conflicts of interest.
Abbreviations
| Abbreviation | Full form |
| AIMS-PD | Asset Information Management System—Public Data |
| CCT | Carbon Collation Tool |
| CE | Circular economy |
| FRM | Flood-risk management |
| GHG | Greenhouse gas |
| ID | Identifier |
| MEICA | Mechanical, electrical, instrumentation, control and automation |
| MFA | Material flow analysis |
| MFCI | Material-focused circular innovation |
| WRAP | Waste and Resources Action Programme |
References
- Sharmina, M.; Pappas, D.; Scott, K.; Gallego-Schmid, A. Impact of Circular Economy Measures in the European Union Built Environment on a Net-Zero Target. Circ. Econ. Sust. 2023, 3, 1989–2008. [Google Scholar] [CrossRef] [Scilit]
- Adams, K.T.; Osmani, M.; Thorpe, T.; Thornback, J. Circular Economy in Construction: Current Awareness, Challenges and Enablers. Proc. Inst. Civ. Eng.-Waste Resour. Manag. 2017, 170, 15–24. [Google Scholar] [CrossRef] [Scilit]
- Chen, Q.; Feng, H.; Garcia de Soto, B. Revamping Construction Supply Chain Processes with Circular Economy Strategies: A Systematic Literature Review. J. Clean. Prod. 2022, 335, 130240. [Google Scholar] [CrossRef] [Scilit]
- Ding, L.; Wang, T.; Chan, P.W. Forward and Reverse Logistics for Circular Economy in Construction: A Systematic Literature Review. J. Clean. Prod. 2023, 388, 135981. [Google Scholar] [CrossRef] [Scilit]
- Eberhardt, L.C.M.; Birkved, M.; Birgisdottir, H. Building Design and Construction Strategies for a Circular Economy. Archit. Eng. Des. Manag. 2022, 18, 93–113. [Google Scholar] [CrossRef] [Scilit]
- Augiseau, V.; Barles, S. Studying Construction Materials Flows and Stock: A Review. Resour. Conserv. Recycl. 2017, 123, 153–164. [Google Scholar] [CrossRef] [Scilit]
- Graedel, T.E. Material Flow Analysis from Origin to Evolution. Environ. Sci. Technol. 2019, 53, 12188–12196. [Google Scholar] [CrossRef] [Scilit]
- Haas, W.; Krausmann, F.; Wiedenhofer, D.; Heinz, M. How Circular Is the Global Economy?: An Assessment of Material Flows, Waste Production, and Recycling in the European Union and the World in 2005. J. Ind. Ecol. 2015, 19, 765–777. [Google Scholar] [CrossRef] [Scilit]
- BSI. PAS 2080: Carbon Management in Buildings and Infrastructure Guidance. Available online: https://www.ice.org.uk/engineering-resources/briefing-sheets/guidance-document-pas2080/ (accessed on 13 July 2024).
- RICS. Whole Life Carbon Assessment for the Built Environment, RICS Professional Standard, 2nd ed.; RICS iConsult: London, UK, 2024; Available online: https://consultations.rics.org/connect.ti/whole_life_carbon_standard/viewCompoundDoc?docid=13626324&partId=13629428&voteid= (accessed on 19 February 2024).
- Küpfer, C.; Bastien-Masse, M.; Fivet, C. Reuse of Concrete Components in New Construction Projects: Critical Review of 77 Circular Precedents. J. Clean. Prod. 2023, 383, 135235. [Google Scholar] [CrossRef] [Scilit]
- Ahmeti, M.; Ahmetaj, M.; Krelani, V. Evaluating the Potential of Recycled Asphalt for Sustainable Road Construction: An Environmental and Economic Analysis. Civ. Eng. J. 2023, 9, 1482–1490. [Google Scholar] [CrossRef] [Scilit]
- Morris, P.W.G. Climate Change and What the Project Management Profession Should Be Doing About It—A UK Perspective; APM: Princes Risborough, UK, 2017. [Google Scholar]
- Winch, G. Projecting for Sustainability Transitions: Advancing the Contribution of Peter Morris. EPOJ Eng. Proj. Organ. J. 2022, 11, 16. [Google Scholar] [CrossRef] [Scilit]
- Coenen, T.B.J.; Santos, J.; Fennis, S.A.A.M.; Halman, J.I.M. Development of a Bridge Circularity Assessment Framework to Promote Resource Efficiency in Infrastructure Projects. J. Ind. Ecol. 2021, 25, 288–304. [Google Scholar] [CrossRef] [Scilit]
- Abadi, M.; Moore, D.R.; Sammuneh, M.A. A Framework of Indicators to Measure Project Circularity in Construction Circular Economy. Proc. Inst. Civ. Eng. Manag. Procure. Law 2022, 175, 54–66. [Google Scholar] [CrossRef] [Scilit]
- Medina, E.M.; Fu, F. A New Circular Economy Framework for Construction Projects. Proc. Inst. Civ. Eng. Eng. Sustain. 2021, 174, 304–315. [Google Scholar] [CrossRef] [Scilit]
- Sanchez, B.; Haas, C. Capital Project Planning for a Circular Economy. Constr. Manag. Econ. 2018, 36, 303–312. [Google Scholar] [CrossRef] [Scilit]
- GOV.UK. Functional Standards Common Glossary. Available online: https://www.gov.uk/government/publications/functional-standards-common-glossary/functional-standards-common-glossary (accessed on 16 October 2023).
- Barthel, M.; Fava, J.A.; Harnanan, C.A.; Strothmann, P.; Khan, S.; Miller, S. Hotspots Analysis: Providing the Focus for Action. In Life Cycle Management; Springer: Dordrecht, The Netherlands, 2015; pp. 149–167. [Google Scholar]
- Infrastructure’s Carbon Reduction Falling Short of Net-Zero Target Rate. Available online: https://www.ice.org.uk/news-insight/news-and-blogs/latest-news/news/infrastructure-s-carbon-reduction-falling-short-of-net-zero-target-rate/ (accessed on 30 April 2023).
- Jain, P.; Priyadarshini, J.; Gupta, A.K. Frameworks, Linkages, Benefits, Challenges, and Future Scope in Procurement 4.0: A Systematic Literature Review From 2014 to 2023. IEEE Trans. Eng. Manag. 2024, 71, 10295–10313. [Google Scholar] [CrossRef] [Scilit]
- Guerra, B.C.; Leite, F. Circular Economy in the Construction Industry: An Overview of United States Stakeholders’ Awareness, Major Challenges, and Enablers. Resour. Conserv. Recycl. 2021, 170, 105617. [Google Scholar] [CrossRef] [Scilit]
- Hart, J.; Adams, K.; Giesekam, J.; Tingley, D.D.; Pomponi, F. Barriers and Drivers in a Circular Economy: The Case of the Built Environment. Procedia CIRP 2019, 80, 619–624. [Google Scholar] [CrossRef] [Scilit]
- Kirchherr, J.; Piscicelli, L.; Bour, R.; Kostense-Smit, E.; Muller, J.; Huibrechtse-Truijens, A.; Hekkert, M. Barriers to the Circular Economy: Evidence From the European Union (EU). Ecol. Econ. 2018, 150, 264–272. [Google Scholar] [CrossRef] [Scilit]
- Jain, M.; Hopkinson, P.; Zils, M. Material-Focused Circular Innovation Framework to Address the Cost and Carbon Challenge in Capital Project Delivery: A Scoping Literature Review. Resour. Conserv. Recycl. 2026, 225, 108613. [Google Scholar] [CrossRef] [Scilit]
- Smith, D.N.; Baldrey, S.; Holm, C.; Gordon-Smith, E.; Barrett, W. Integration of Circular Economy Approaches into a Major Infrastructure Project Case Study-National Highways’ A303 Circular Economy Pathfinder Project. Circ. Econ. Sust. 2023, 3, 1793–1818. [Google Scholar] [CrossRef] [Scilit]
- Arora, M.; Raspall, F.; Fearnley, L.; Silva, A. Urban Mining in Buildings for a Circular Economy: Planning, Process and Feasibility Prospects. Resour. Conserv. Recycl. 2021, 174, 105754. [Google Scholar] [CrossRef] [Scilit]
- Fohl, F.; Hechler, O. Reuse of Steel Sheet Piles—Best Practice. In Creating a Roadmap Towards Circularity in the Built Environment; Bragança, L., Cvetkovska, M., Askar, R., Ungureanu, V., Eds.; Springer Tracts in Civil Engineering; Springer Nature: Cham, Switzerland, 2024; pp. 25–35. [Google Scholar]
- Hopkinson, P.; Chen, H.-M.; Zhou, K.; Wang, Y.; Lam, D. Recovery and Reuse of Structural Products from End-of-Life Buildings. Proc. Inst. Civ. Eng.-Eng. Sustain. 2019, 172, 119–128. [Google Scholar] [CrossRef] [Scilit]
- Arranz, C.F.A.; Arroyabe, M.F.; Demirel, P.; Kesidou, E.; Panwar, R.; Pinkse, J. Reconciling Circular Economy and Net Zero: Firm Capabilities to Resolve Sustainability Tensions. Br. J. Manag. 2026, 37, e70061. [Google Scholar] [CrossRef] [Scilit]
- Mattinzioli, T.; Sol-Sánchez, M.; Jiménez del Barco Carrión, A.; Moreno-Navarro, F.; del Carmen Rubio-Gámez, M.; Martínez, G. Analysis of the GHG Savings and Cost-Effectiveness of Asphalt Pavement Climate Mitigation Strategies. J. Clean. Prod. 2021, 320, 128768. [Google Scholar] [CrossRef] [Scilit]
- Chammout, B.; El-adaway, I. Circular Economy in Construction: Decision-Making Factors and Future Research Avenues. J. Constr. Eng. Manag. 2025, 151, 04025059. [Google Scholar] [CrossRef] [Scilit]
- Khedmati-Morasae, E.; Zils, M.; Hopkinson, P.; Nolan, R.; Charnley, F.; Okorie, O.; Abu-Bakar, H. Advancing the Discourse: A next-Generation Value Chain-Based Taxonomy for Circular Economy Key Performance Indicators. Sustain. Prod. Consum. 2024, 48, 219–234. [Google Scholar] [CrossRef] [Scilit]
- Parchomenko, A.; Nelen, D.; Gillabel, J.; Rechberger, H. Measuring the Circular Economy—A Multiple Correspondence Analysis of 63 Metrics. J. Clean. Prod. 2019, 210, 200–216. [Google Scholar] [CrossRef] [Scilit]
- Islam, M.T.; Huda, N. Material Flow Analysis (MFA) as a Strategic Tool in E-Waste Management: Applications, Trends and Future Directions. J. Environ. Manag. 2019, 244, 344–361. [Google Scholar] [CrossRef] [Scilit]
- UNEP. Hotspots Analysis: An Overarching Methodological Framework and Guidance for Product and Sector Level Application; UNEP: Nairobi, Kenya, 2017. [Google Scholar]
- Barthel, M.; Fava, J.; Harnanan, C.; Valdivia, S.; Khan, S.; James, K.; Smerek, A. Hotspots Analysis: Mapping of Existing Methodologies, Tools and Guidance and Initial Recommendations for the Development of Global Guidance; UNEP/SETAC Life Cycle Initiative-Flagship Project 3a (Phase 1); UNEP: Nairobi, Kenya, 2014. [Google Scholar]
- Geissdoerfer, M.; Pieroni, M.; Pigosso, D.; Soufani, K. Circular Business Models: A Review. J. Clean. Prod. 2020, 277, 123741. [Google Scholar] [CrossRef] [Scilit]
- Hopkinson, P.; De Angelis, R.; Zils, M. Systemic Building Blocks for Creating and Capturing Value from Circular Economy. Resour. Conserv. Recycl. 2020, 155, 104672. [Google Scholar] [CrossRef] [Scilit]
- Lowe, B.H.; Genovese, A. What Theories of Value (Could) Underpin Our Circular Futures? Ecol. Econ. 2022, 195, 107382. [Google Scholar] [CrossRef] [Scilit]
- Grewatsch, S.; Kennedy, S.; Bansal, P. Tackling Wicked Problems in Strategic Management with Systems Thinking. Strateg. Organ. 2023, 21, 721–732. [Google Scholar] [CrossRef] [Scilit]
- Schad, J.; Bansal, P. Seeing the Forest and the Trees: How a Systems Perspective Informs Paradox Research. J. Manag. Stud. 2018, 55, 1490–1506. [Google Scholar] [CrossRef] [Scilit]
- Government Functional Standard GovS 002: Project Delivery. Available online: https://www.gov.uk/government/publications/project-delivery-functional-standard (accessed on 21 October 2022).
- Touboulic, A.; Walker, H. A Relational, Transformative and Engaged Approach to Sustainable Supply Chain Management: The Potential of Action Research. Hum. Relat. 2016, 69, 301–343. [Google Scholar] [CrossRef] [Scilit]
- Abadi, M.; Moore, D.R. Selection of Circular Proposals in Building Projects: An MCDM Model for Lifecycle Circularity Assessments Using AHP. Buildings 2022, 12, 1110. [Google Scholar] [CrossRef] [Scilit]
- Barthel, M.; Fava, J.A.; Harnanan, C.A.; Strothmann, P.; Khan, S.; Miller, S. LCA Compendium—The Complete World of Life Cycle Assessment. In Life Cycle Management; Sonnemann, G., Margni, M., Eds.; Springer: Dordrecht, The Netherlands, 2015. [Google Scholar]
- ICE database Embodied Carbon Footprint Database; Circular Ecology: London, UK, 2019.
- Embankment. Available online: https://environment.data.gov.uk/asset-management/drl-app/revision/current/categories/Defence/asset-types/Embankment (accessed on 30 May 2024).

Disclaimer/Publisher’s Note: The statements, opinions and data contained in all publications are solely those of the individual author(s) and contributor(s) and not of MDPI and/or the editor(s). MDPI and/or the editor(s) disclaim responsibility for any injury to people or property resulting from any ideas, methods, instructions or products referred to in the content. |
© 2026 by the authors. Licensee MDPI, Basel, Switzerland. This article is an open access article distributed under the terms and conditions of the Creative Commons Attribution (CC BY) license.