


Simple Summary
Protein domains are related at different levels, from broad structural similarities to close evolutionary relationships. Distinguishing these relationships is challenging, particularly among domains sharing similar overall structures. We developed a method that learns compact numerical representations of protein domains while preserving their hierarchical relationships. Its key innovation is to use known classification hierarchies both to select informative training examples and to guide how domain similarities are ordered and their distances are organized. Tests on two established protein-domain databases demonstrate substantially improved accuracy across multiple classification levels compared with existing methods. Once computed, the resulting representations enable rapid comparison of large protein-domain collections, supporting the exploration of protein structural and evolutionary relationships.
Abstract
Accurately distinguishing protein-domain relationships across multiple hierarchical levels, from broad structural similarities to close homologous relationships, remains challenging. We propose hierarchical ranking and distance learning (HRD), a framework that translates nested domain classifications into coordinated sampling and geometric supervision. Its central idea is to use five ordered relationship groups both to construct informative training batches and to organize a unified similarity space. Specifically, relation-covering sampling exposes coarse-to-fine comparisons, while joint ranking and distance supervision enforces hierarchical ordering and provides consistent geometric references across queries. Learned-query attention aggregates frozen ProtT5 residue features into compact 512-dimensional embeddings for multilevel comparison. On CATH and SCOPe, HRD achieves the highest mean across all 24 dataset–level–metric comparisons against nine official-weight configurations and four retrained baselines, with average improvements of 14.42 and 5.80 percentage points, respectively. Ablations substantiate the contributions of learned aggregation, relationship coverage, and geometric supervision. HRD hence provides an effective approach to preserving graded protein-domain relationships in a shared embedding space.
1. Introduction
Protein domains are fundamental units of protein structure and evolution [1]. Their relationships are inherently hierarchical, ranging from broad structural similarities to close homologous relationships [2,3]. Classification systems such as CATH and SCOPe organize these relationships into nested categories, including structural classes, folds or topologies, and homologous superfamilies or families [4,5]. Accurately distinguishing relationships across these levels is essential for characterizing protein structural and evolutionary relatedness. In particular, domains sharing broad structural characteristics may differ substantially at finer classification levels, making multilevel similarity comparison a challenging computational task.
Recent advances in protein similarity learning have been driven by increasingly informative sequence representations and task-specific supervision [6,7]. Protein language models provide contextual sequence features that capture information relevant to protein structure and function [8,9,10]. Building on these representations, methods such as knnProtT5, PROST, and discrete-cosine-transform embeddings enable efficient similarity search through fixed-dimensional sequence representations [11,12,13]. Beyond general-purpose embeddings, TM-Vec, PLMSearch, and RProt-Vec learn similarity representations using structure-derived supervision [14,15,16]. More recent approaches, including DHR, Gaia, and ProTrek, further extend protein retrieval through dense retrieval learning, genomic context, and multimodal alignment [17,18,19]. Hierarchical supervision has also been explored, notably by ProtTucker, which leverages CATH classifications to construct contrastive triplets [20]. Together, these developments have substantially advanced sequence-based protein similarity comparison, demonstrating the value of both pretrained representations and biologically informed supervision [21].
An important challenge remaining unsolved is to faithfully capture graded hierarchical relationships within a unified similarity space. Hierarchical protein-domain comparison requires distinguishing multiple degrees of relatedness, yet existing hierarchical contrastive approaches primarily enforce relative comparisons without explicitly organizing distances across relationship levels and queries. Moreover, uneven relationship frequencies limit informative comparisons during training. These limitations call for coordinated sampling and geometric supervision.
To address this challenge, we propose hierarchical ranking and distance learning (HRD). The key mechanism of HRD is a coordinated use of hierarchical classification information throughout similarity learning. Rather than using hierarchy labels solely to define positive and negative pairs, HRD uses five graded relationship groups as a common basis for both training-sample selection and embedding-space organization. Specifically, relation-covering sampling increases the availability of coarse-to-fine comparisons; ranking and distance supervision jointly encourage correct relative ordering and consistent relation-specific distances. Combined with learned-query pooling, HRD produces reusable compact 512-dimensional representations for all categories. In this way, HRD translates discrete classification relationships into a unified continuous similarity space without level-specific embeddings.
We evaluate HRD across four levels of CATH and SCOPe benchmarks. HRD consistently exceeds nine official-weight configurations and four baselines retrained on identical partitions in all 24 dataset–level–metric comparisons, with average gains of 14.42 and 5.80 percentage points on the respective benchmarks. The largest CATH improvements occur at Architecture and Topology, where distinguishing neighboring branches within a shared higher-level category is particularly important. Ablations and representation analyses further characterize the contributions of learned aggregation, relationship coverage, and geometric supervision.
2. Materials and Methods
2.1. Hierarchical Similarity Learning
HRD maps a protein-domain amino-acid sequence to a fixed-length vector for similarity comparison. CATH uses Class, Architecture, Topology, and Homologous Superfamily; SCOPe uses Class, Fold, Superfamily, and Family [4,5]. Matching a category requires matching its full ancestral path. Each pair of distinct domains therefore belongs to exactly one relationship group, , ordered from weakest to strongest. Here, denotes a shared path of exactly i levels: pairs have different Classes, – pairs first diverge at the next level, and pairs match at all four levels.
2.2. Sequence Representation
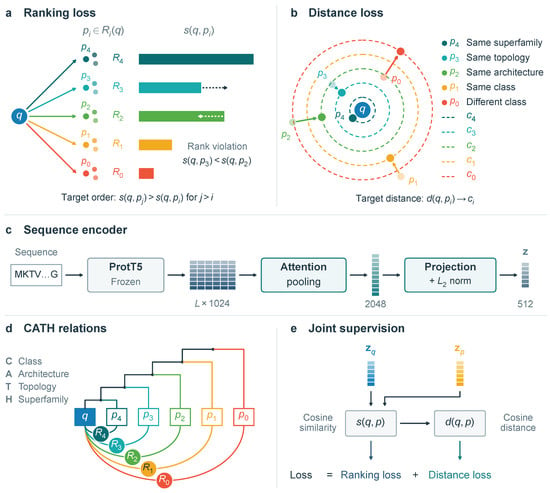
Frozen ProtT5 provides 1024-dimensional residue-level features [8]. Learned queries aggregate these features through cross-attention [22,23] into a 2048-dimensional pooled representation. A two-layer multilayer perceptron (MLP; ) followed by normalization produces the final 512-dimensional representation. For normalized vectors and , similarity and distance are
The same normalized vector and cosine score serve all classification levels. Figure 1 summarizes the architecture and its joint supervision.
Figure 1.
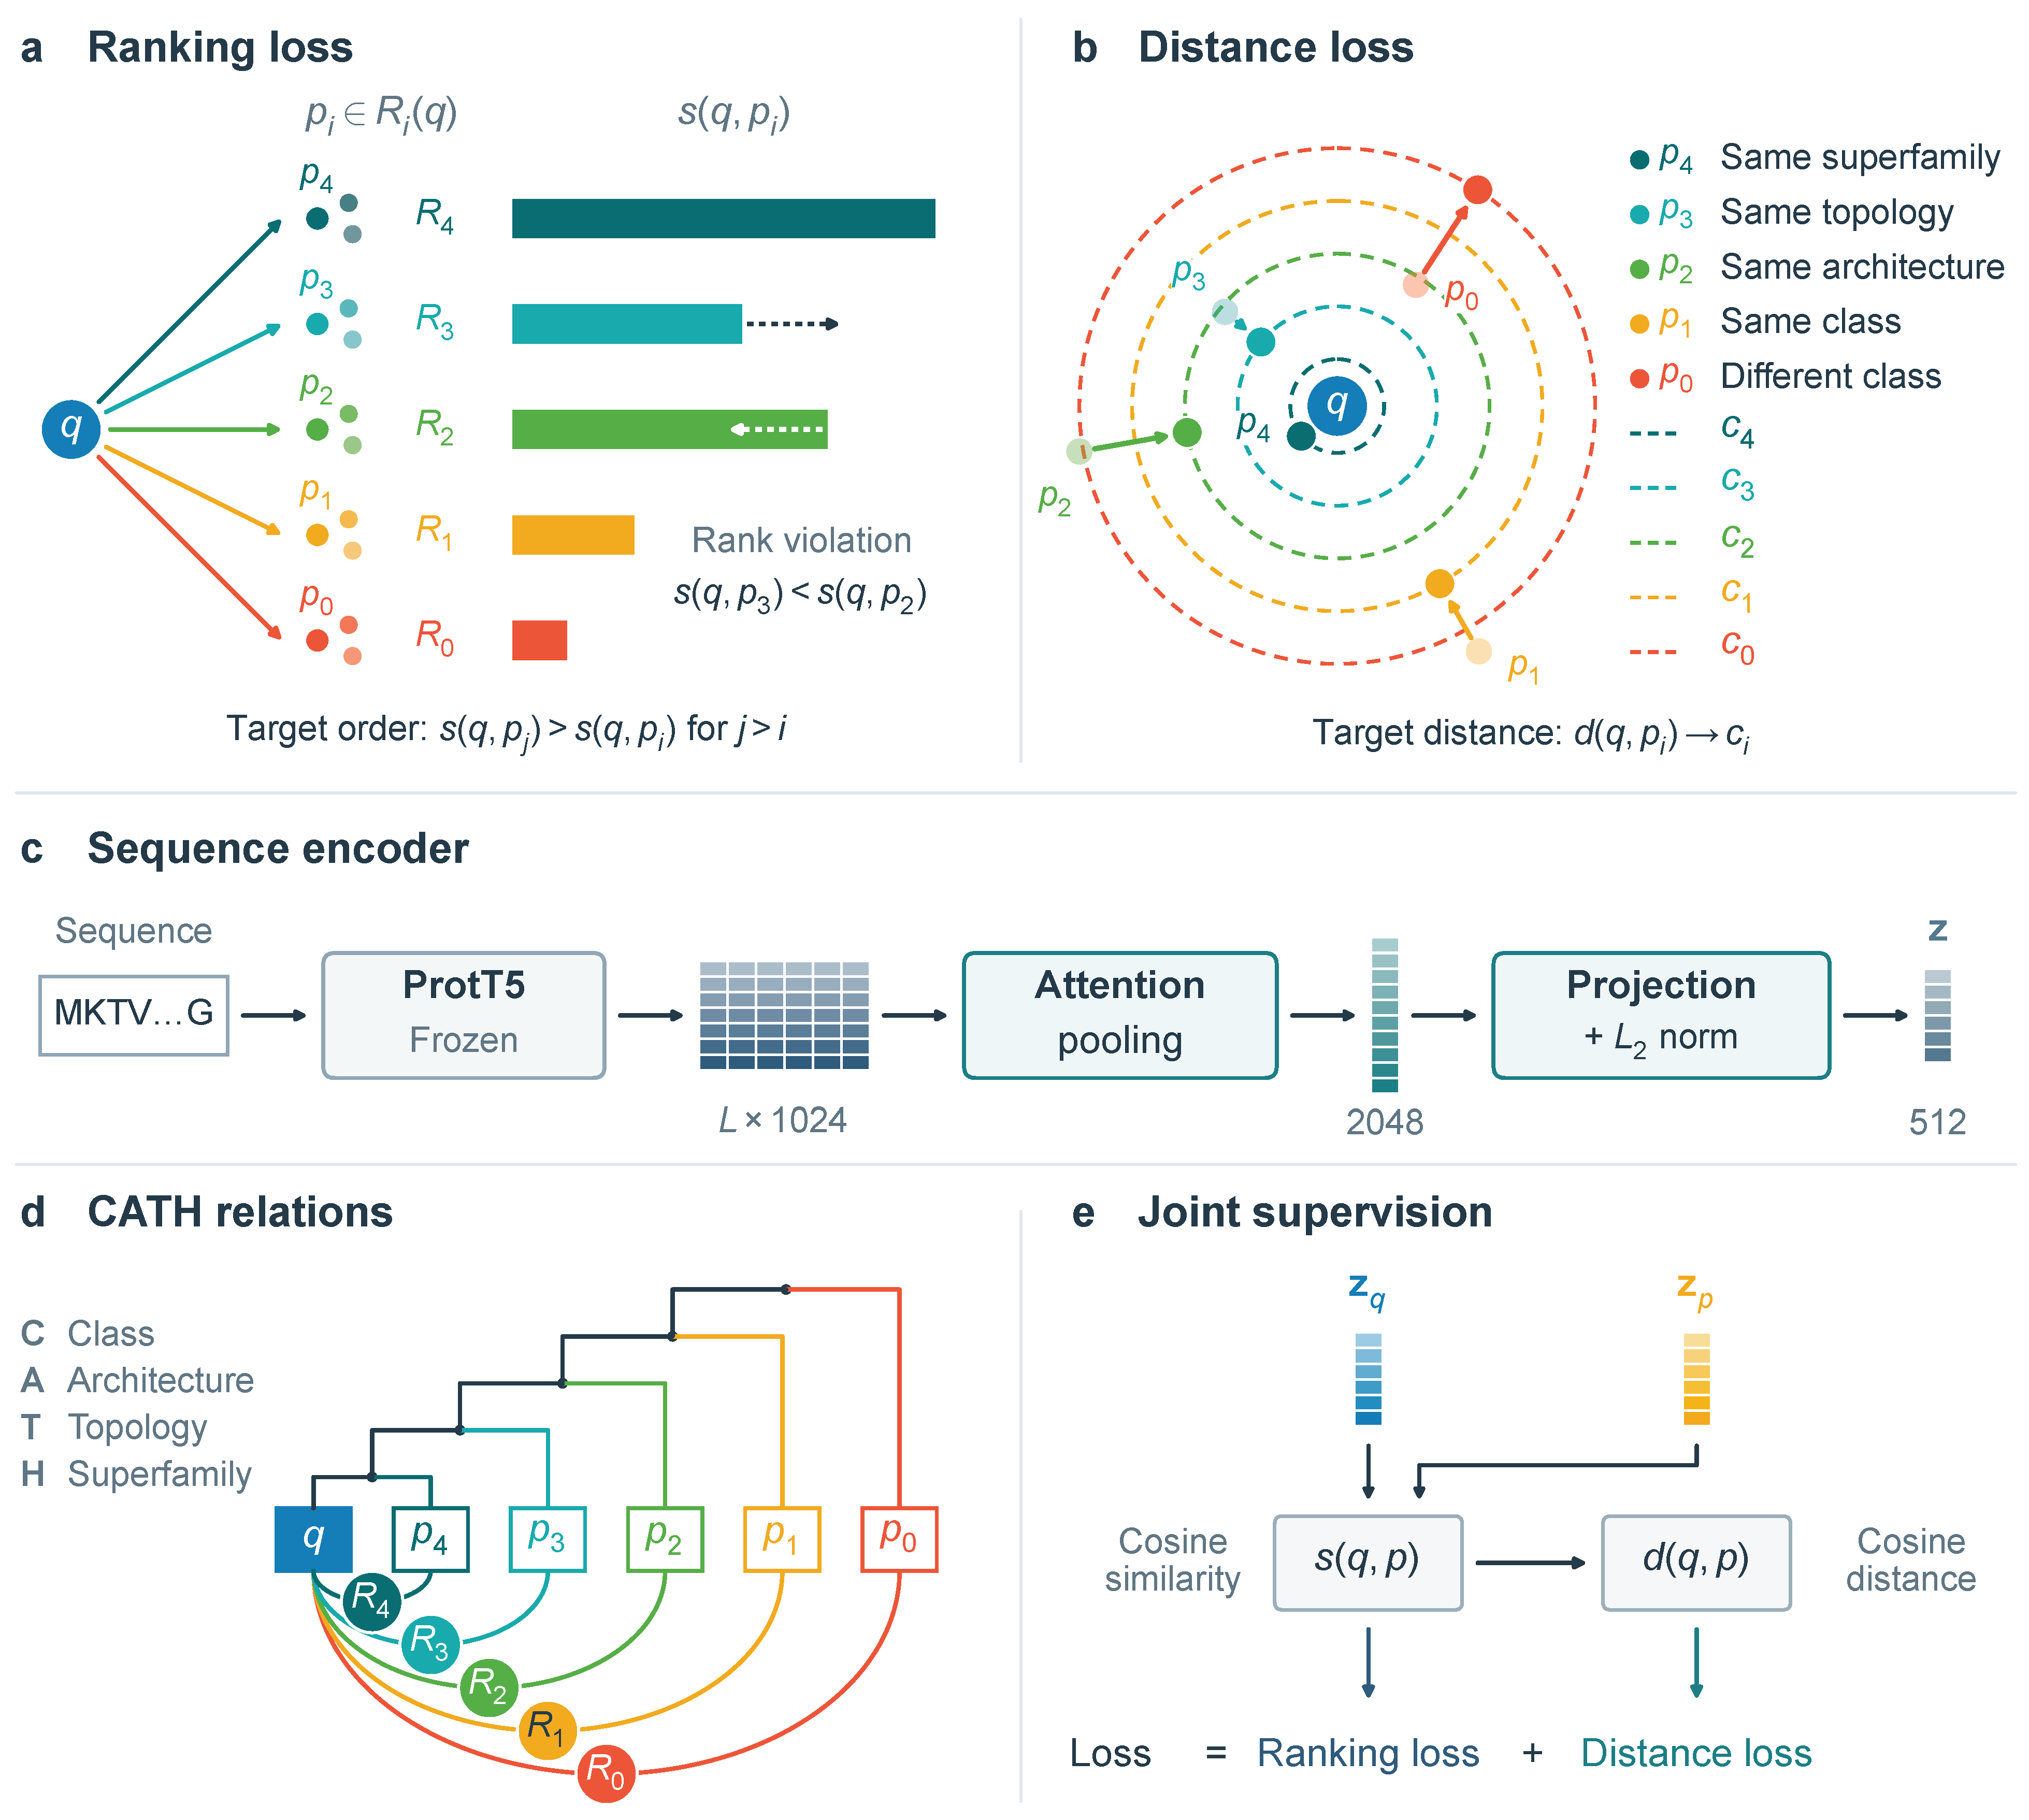
HRD model architecture and joint supervision. (a) Ranking supervision penalizes violations of the expected similarity ordering, ensuring that stronger hierarchical relationships are ranked above weaker ones for each query. (b) Distance loss encourages relation-specific target distances, providing consistent geometric references across queries. (c) Frozen ProtT5 residue features are aggregated through learned-query attention pooling and projected into normalized 512-dimensional embeddings. (d) The CATH hierarchy defines five ordered exclusive relationship groups , from different Classes to the same Superfamily, guiding both sampling and supervision. (e) Ranking and distance objectives jointly organize a unified embedding space, enabling multilevel similarity comparison using a single cosine similarity score.
2.3. Relation-Covering Sampling
Each training domain serves once as a main sequence per epoch. For each main sequence, we sample at most one support from each of the five relationship groups, without repeating any input sequence within the batch. Unavailable groups are left empty. All batch sequences contribute to ranking, while the sampled main–support pairs provide distance supervision.
2.4. Joint Ranking and Distance Supervision
For a batch query q, let contain candidates in exactly , and let contain candidates in weaker groups . Self-pairs are excluded. For and , we define
Weaker candidates with high similarity incur larger penalties. This formulation draws on rank-aware contrastive learning [24], with classification relationships defining the order. Let contain queries with nonempty positive and negative sets, and contain represented positive relationship groups. The ranking objective is
Averaging within positive groups, across queries, and across relationship levels gives coarse and fine supervision equal weight at the level of each represented group.
Distance supervision uses a weighted mean squared error (MSE) against a fixed target for each relationship. For sampled main–support pairs and the nonempty groups ,
Since hierarchical classifications define an ordering of relationships rather than calibrated structural or evolutionary distances, we parameterize the relation-specific targets using a monotonic distance scale. Specifically, we set and for , where controls the target separation between adjacent relationship groups. The distance targets are treated as dataset-specific hyperparameters. We select them through a coarse validation-set search around the uniform preset for – and keep them fixed throughout training. The resulting targets for – are in CATH and in SCOPe. These values are not assumed to be optimal; their sensitivity is examined in Section S6. The complete objective is fixed throughout training:
Both terms supervise the full 512-dimensional vector: ranking provides query-dependent comparisons, and distance targets provide shared geometric references across batches.
2.5. Datasets and Evaluation
We use the public CATHS40 (v4.4) and SCOPe40 (v2.08) datasets [4,5,25]. For CATHS40, the study includes domains from the canonical classes 1–4 [26]; for SCOPe40, all domains are included. For each dataset, we use an independent Class-stratified split of approximately 70% training, 10% validation, and 20% test data, with random seed 0 (Table 1). These partitions are domain-disjoint rather than superfamily-disjoint, although 766 CATH and 231 SCOPe test domains belong to superfamilies absent from training. We further assess HRD’s generalization to unseen superfamilies using a superfamily-held-out evaluation (Section S7).
Table 1.
Domain-sequence partitions and classification hierarchies. Parentheses give the number of distinct complete categories in the retained dataset.
At each level, positives share the complete current-level label, including deeper matches; negatives share its immediate parent but differ at the current level. At Class, the parent is the common root. For example, at CATH Topology, and pairs are positives, while pairs (the same Architecture but different Topologies) are negatives; and pairs are excluded. All methods use identical eligible unordered pairs and query candidates, excluding self-pairs.
The area under the receiver operating characteristic curve (AUROC) measures positive–negative score ordering, with ties receiving half credit [27]. Average precision (AP) [28] sums precision weighted by recall increments at distinct descending score thresholds, processing ties together. Query-macro AP (qAP) applies this definition per query and averages equally over queries with at least one positive and one negative. AP describes the global pair ranking; qAP describes the typical eligible query.
2.6. Training and Comparisons
We compare HRD with nine official configurations: knnProtT5, PROST, DCTglobal, ProtTucker, TM-Vec CATH base, PLMSearch, DHR v1, Gaia [18,29], and the ProTrek 650M sequence branch [11,12,13,14,15,17,19,20], retaining their released weights, native preprocessing, and scoring rules. We also retrain ProtTucker, PLMSearch, TM-Vec, and RProt-Vec on the same datasets and splits as HRD [14,15,16,20]. Retraining follows their published or released architectures and objectives, with checkpoints selected by mean validation qAP across four levels. Configurations and validation trajectories are provided in Section S2 and Figure S2.
We implement HRD in Python 3.12 using PyTorch 2.8.0 (CUDA 12.8) and Hugging Face Transformers 4.44.2. HRD is trained with AdamW [30] at a learning rate of and 64 main sequences per batch, for at most 10 epochs on CATH and 20 on SCOPe. Checkpoints are selected by the mean of the 12 validation metrics, with one checkpoint used for all test evaluations. HRD, the four retrained baselines, and the ablation variants are each trained independently using five random seeds. Results are reported as mean ± sample standard deviation across training seeds on the same fixed dataset split, reflecting training variability. Additional training settings are given in Table S1.
Five individual ablations and one combined ablation test the contributions of ranking supervision, distance supervision, learned pooling, relation-covering sampling, and hierarchical loss averaging. We further examine representation geometry, retrieval behavior, and computational cost. We use NumPy 1.26.4 and SciPy 1.14.1 for numerical analysis, Matplotlib 3.9.2 for plotting, and 3Dmol.js (https://3dmol.org/ accessed on 24 October 2026) to render domain structures.
3. Results
3.1. Performance Across Classification Levels
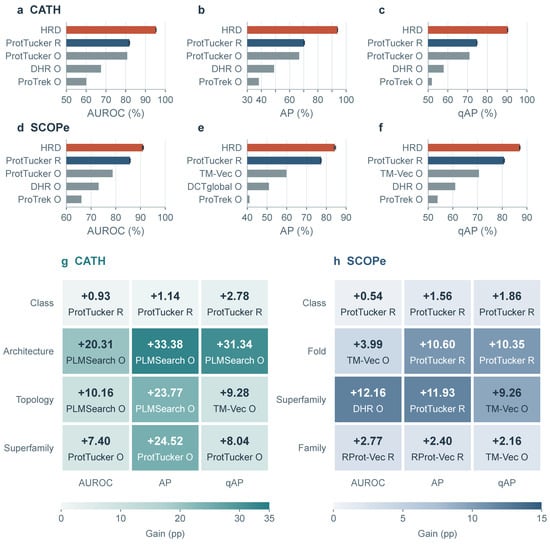
HRD achieves the highest mean score in all 24 dataset–level–metric comparisons (Table 2 and Table 3). Relative to the strongest official or retrained baseline in each comparison, the average improvement is 14.42 percentage points on CATH and 5.80 on SCOPe, giving an overall gain of 10.11 points (Figure 2).
Table 2.
CATH test results (%). Superscript O: official weights; Superscript R: retrained. HRD and all retrained baselines report mean ± sample SD. qAP: query-macro AP. Best and second-best values are bold and underlined, respectively.
Table 3.
SCOPe test results (%). Superscript O: official weights; Superscript R: retrained. HRD and all retrained baselines report mean ± sample SD. qAP: query-macro AP. Best and second-best values are bold and underlined, respectively.
Figure 2.
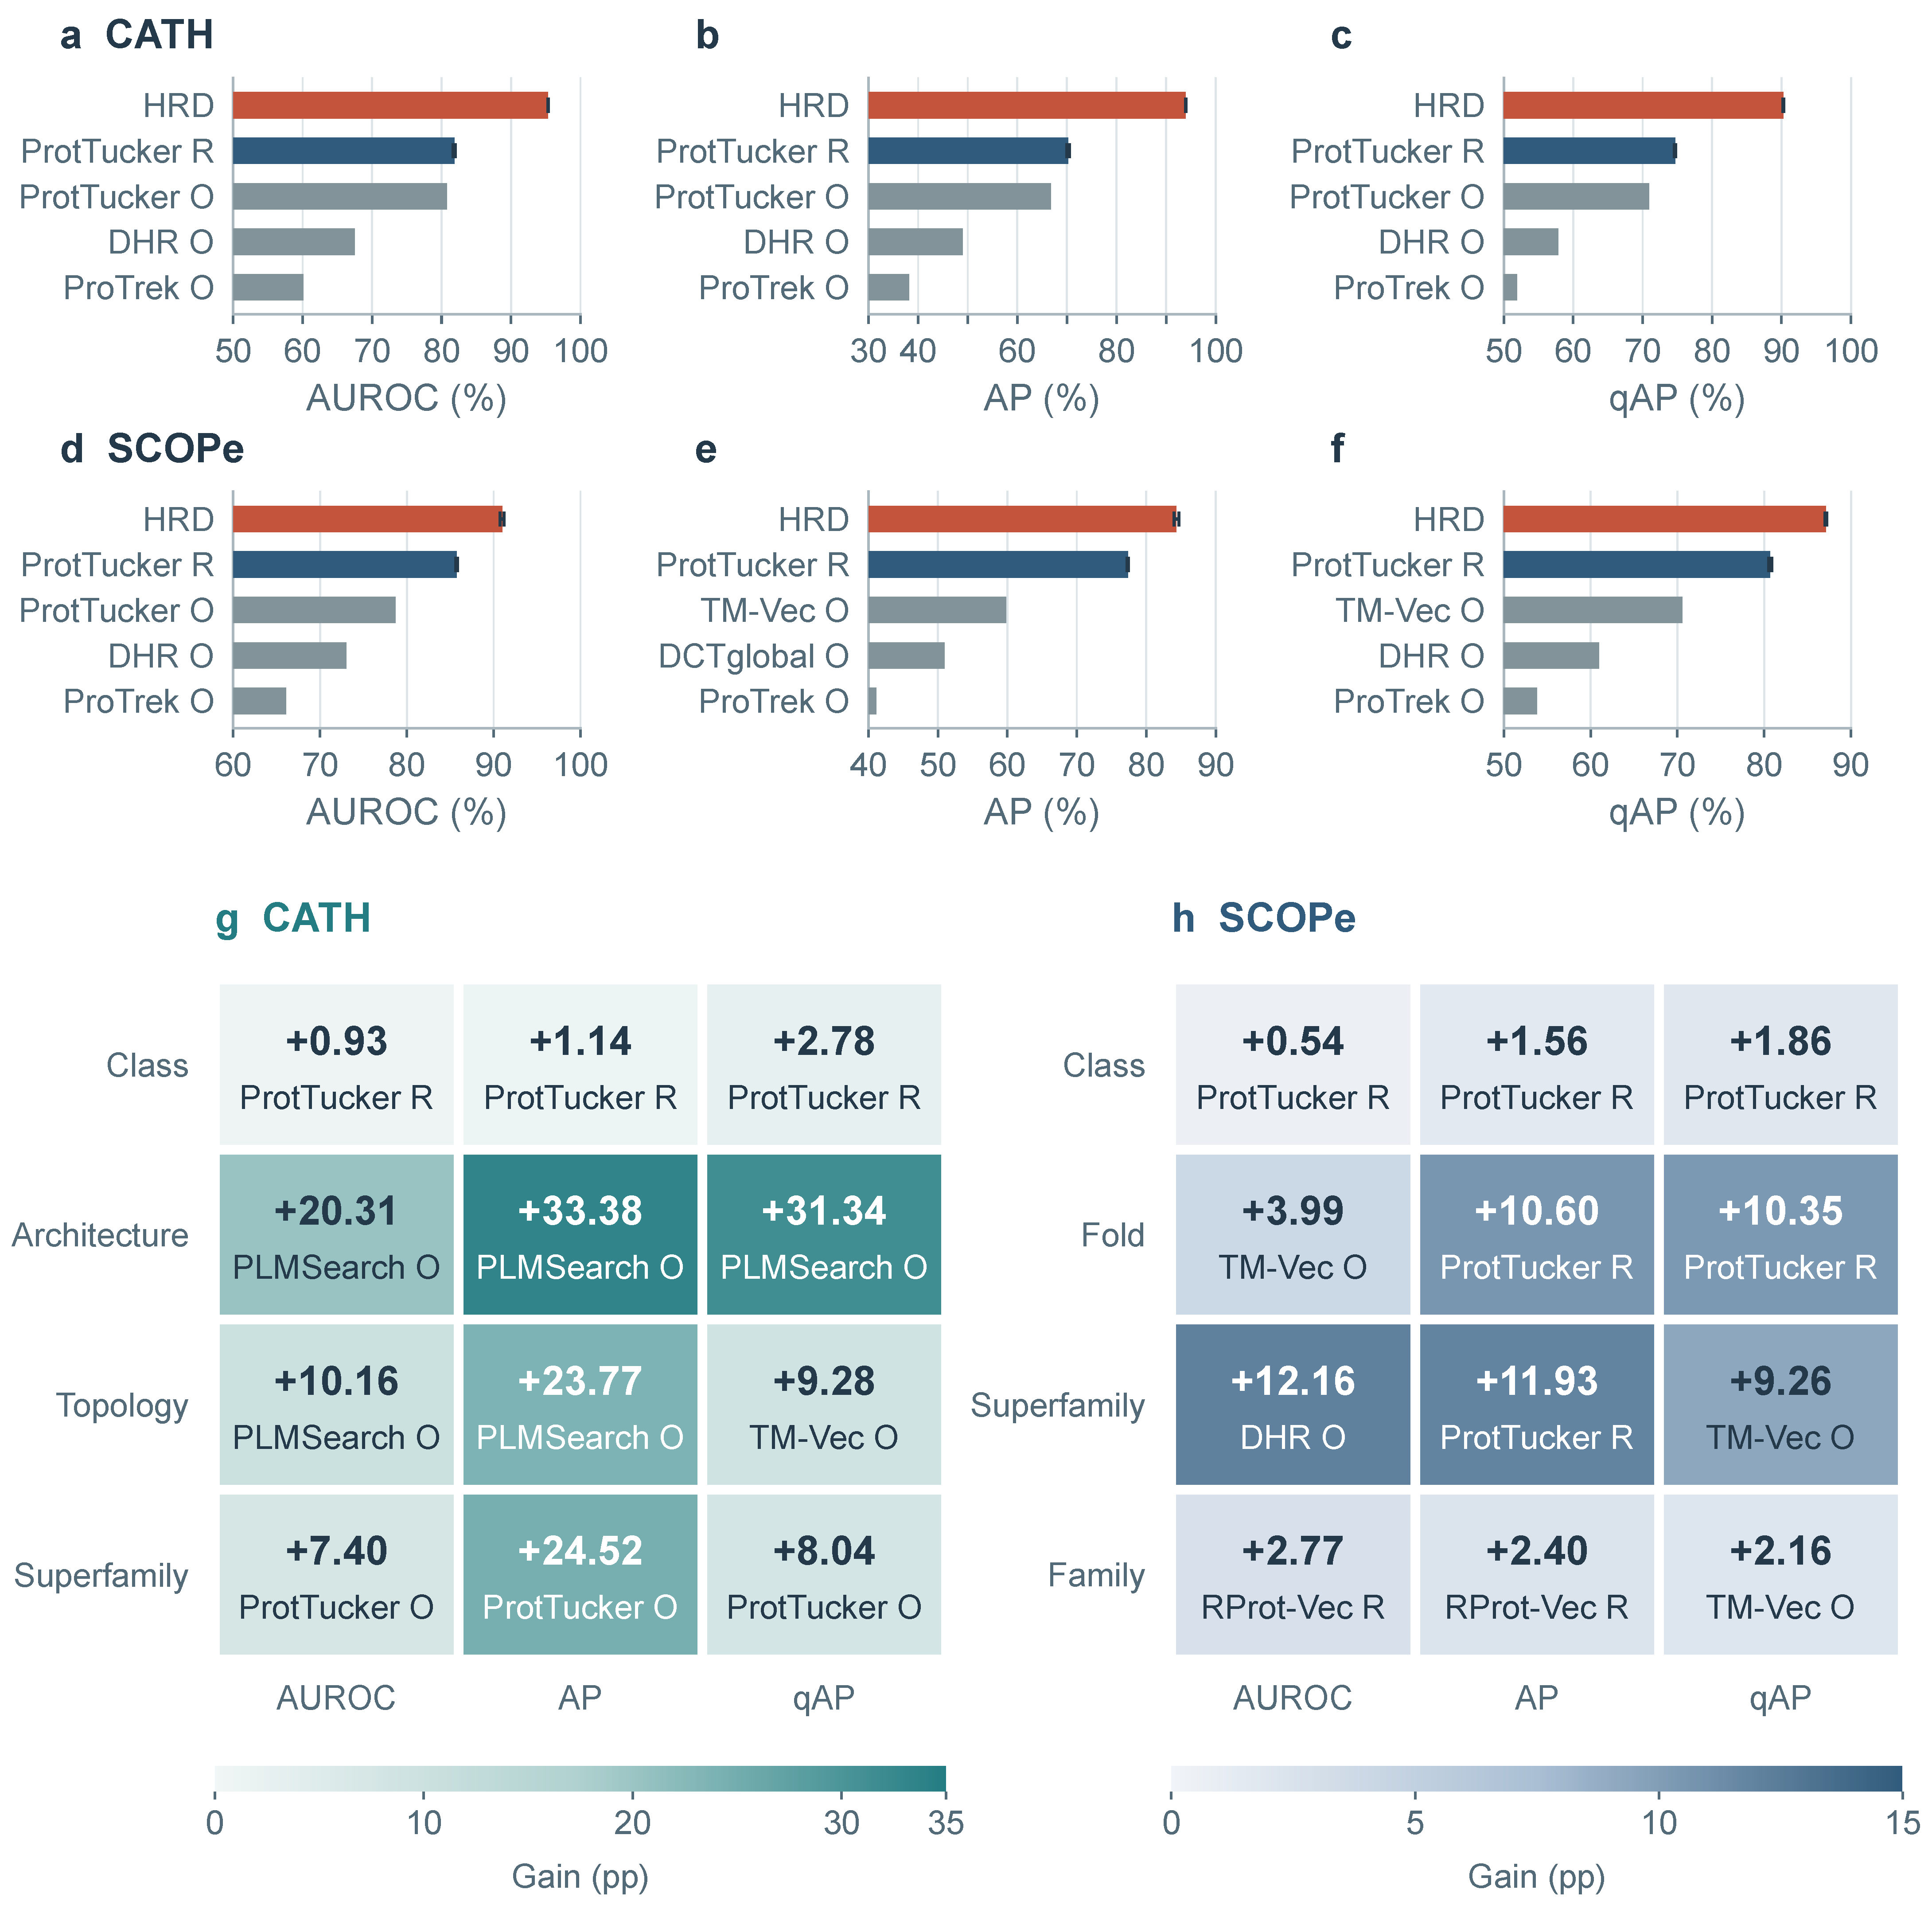
Four-level mean performance and level-specific gains. (a–f) HRD versus the strongest retrained baseline and the strongest, median, and weakest official baselines, selected by each metric’s four-level mean. Error bars indicate sample SD across five training runs. (g,h) HRD minus the strongest baseline at each level and metric (percentage points). O/R denote official/retrained weights; qAP denotes query-macro AP.
The largest CATH gains occur at Architecture and Topology, where candidates share a Class or Architecture, respectively. Architecture AP increases from 57.14% to 90.52%, and Topology AP from 70.12% to 93.89%. These gains show improved discrimination between categories nested within the same structural parent. Superfamily AP rises from 71.04% to 95.57%, extending this improvement to homologous groups within a common Topology. HRD therefore resolves relationships at successive depths of the CATH hierarchy, with particularly large benefits for distinctions within broad structural categories.
On SCOPe, Fold AP increases from 81.46% to 92.05%, while Superfamily AUROC rises from 82.40% to 94.57%. At Family, HRD raises AP from the strongest baseline value of 49.98% to 52.38%, and qAP from 66.19% to 68.35%. Here, positive and negative candidates already share a Superfamily, so the improvement reflects finer discrimination among related domains. Together, the Fold, Superfamily, and Family results show useful retrieval gains as comparisons progress through increasingly specific categories.
Across both datasets, the gains in AUROC, AP, and qAP indicate stronger positive–negative ordering, greater concentration of positives among highly scored pairs, and better retrieval for the typical eligible query. The strongest comparator varies across levels and includes both released and retrained models. HRD leads these comparisons using one 512-dimensional representation for all four levels, supporting its ability to capture both coarse and fine relationships in a shared embedding.
3.2. Score Ordering Across the Hierarchy
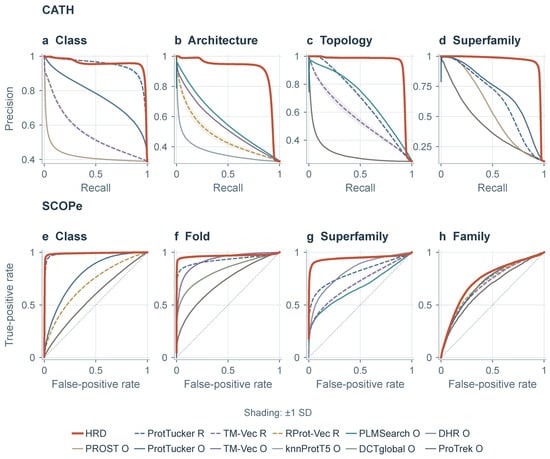
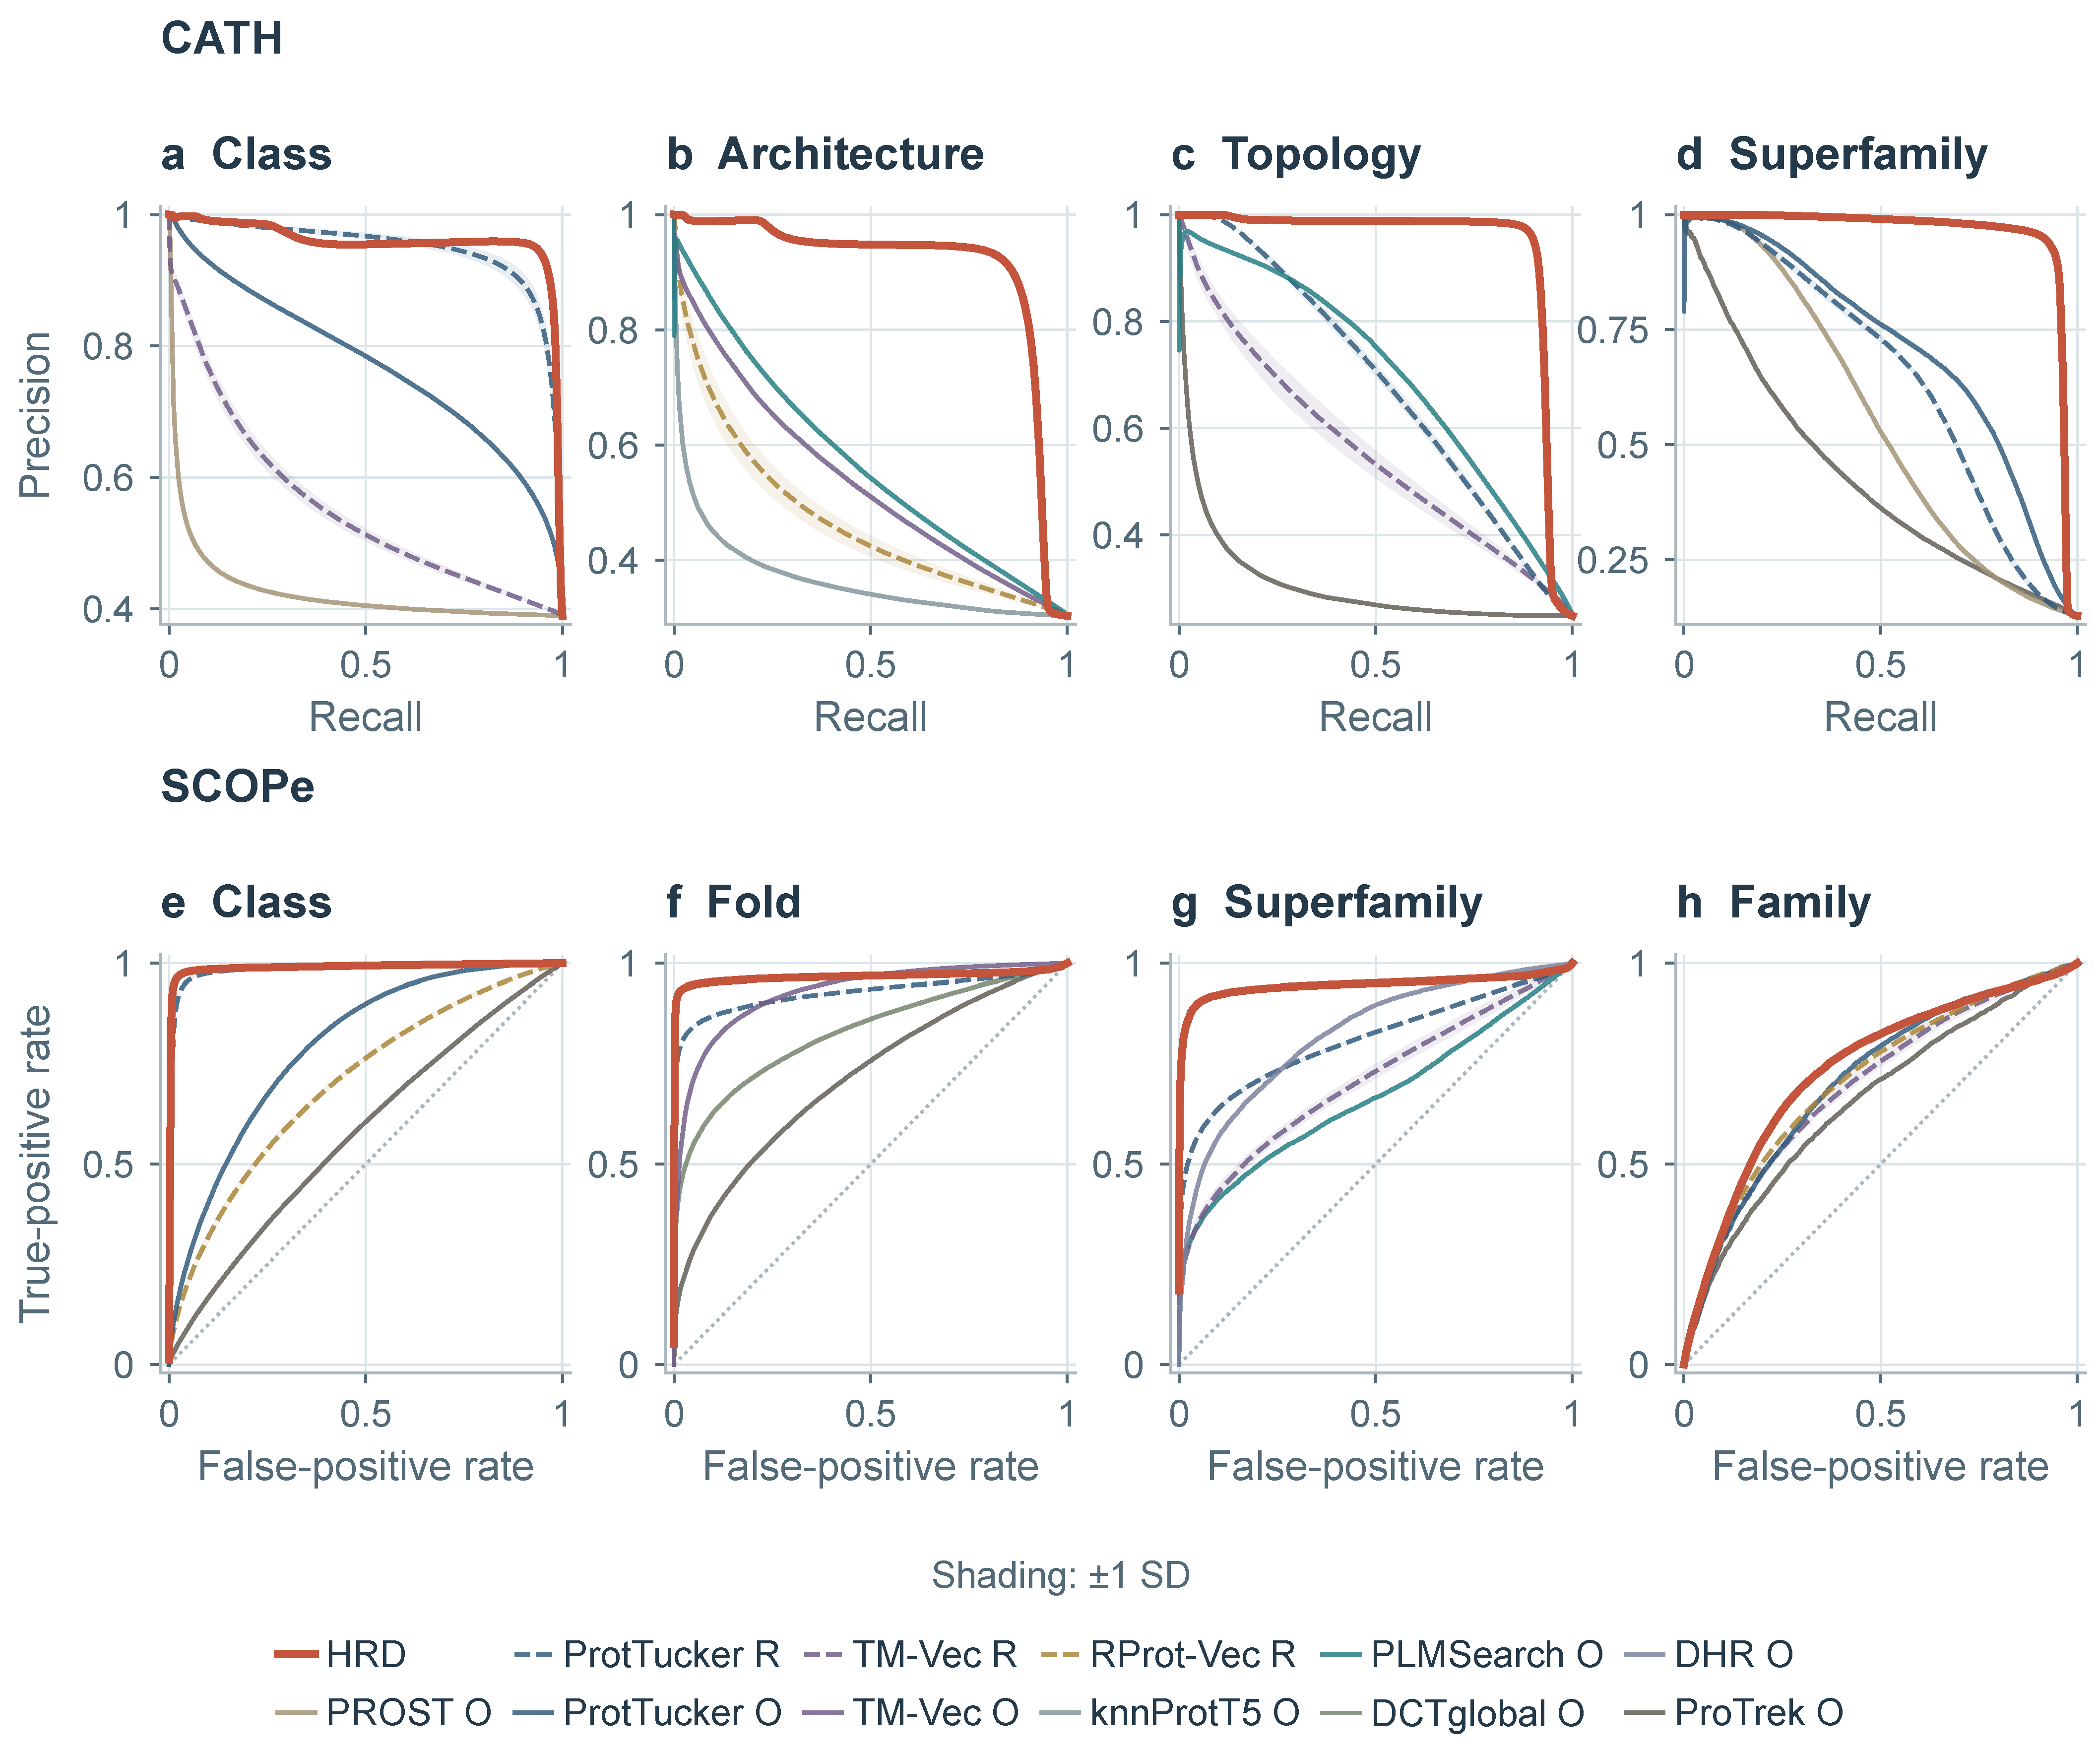
HRD maintains high precision through much of the recall range at CATH Architecture, Topology, and Superfamily in the precision–recall (PR) curves (Figure 3a–d). Retrieving more relevant pairs therefore preserves a high proportion of correct matches. On SCOPe, the receiver operating characteristic (ROC) curves show the clearest separation at Superfamily, where HRD recovers more positives across a broad range of false-positive rates (Figure 3e–h). The smaller separation at Family agrees with the more modest gains in the aggregate metrics, locating the strongest benefits at the same hierarchy levels identified by the performance tables.
Figure 3.
PR and ROC curves on eligible test pairs. Each panel shows HRD and the two highest-ranked, median-ranked, and lowest-ranked baselines by AP (a–d) or AUROC (e–h). (a–d) CATH precision–recall curves for Class, Architecture, Topology, and Superfamily. (e–h) SCOPe receiver operating characteristic curves for Class, Fold, Superfamily, and Family. Lines and shaded bands show means and ± one sample SD for HRD and retrained models. Dotted diagonals in the ROC panels indicate chance performance. O and R denote official and retrained configurations.
3.3. Component Contributions
Learned attention pooling increases four-level mean AUROC from 94.79% to 95.33% on CATH and from 90.20% to 90.98% on SCOPe relative to mean pooling (Table 4; level-specific results in Tables S5 and S6). With comparable trainable parameter counts, learned attention pooling improves discrimination on both datasets. On SCOPe, distance supervision alone and joint supervision reach 91.04% and 90.98%, respectively, showing strong overall pair discrimination with relationship-specific distance targets.
Table 4.
Component ablations (%). For each metric, scores are averaged equally over the four hierarchy levels within each run. Values report mean ± sample SD; the best mean in each column is bold.
HRD achieves the highest four-level mean AP on both datasets, reaching 93.95% on CATH and 84.34% on SCOPe. Learned pooling contributes gains of 0.79 and 1.07 percentage points over mean pooling. Joint supervision also exceeds both single-objective variants on each dataset. These comparisons show that learned residue aggregation and complementary ranking and distance supervision improve the prioritization of relevant pairs.
HRD also achieves the highest four-level mean qAP, reaching 90.26% on CATH and 87.10% on SCOPe. Relation-covering support sampling raises qAP by 0.59 and 1.78 percentage points over random supports, while hierarchical averaging improves it by 1.31 and 0.87 points over flat averaging. The gains from both components show that covering multiple relationship strengths and balancing their training contributions improve the ranking of relevant candidates for individual queries.
The combined ablation uses ranking alone, mean pooling, random supports, and flat averaging. Compared with this variant, HRD improves four-level mean AUROC, AP, and qAP by 9.63, 17.36, and 10.94 percentage points on CATH and by 6.99, 8.35, and 4.33 points on SCOPe, respectively. The larger performance losses under combined ablation than under individual ablations highlight the joint contribution of these components to multilevel domain discrimination.
3.4. Organization of the Learned Representation
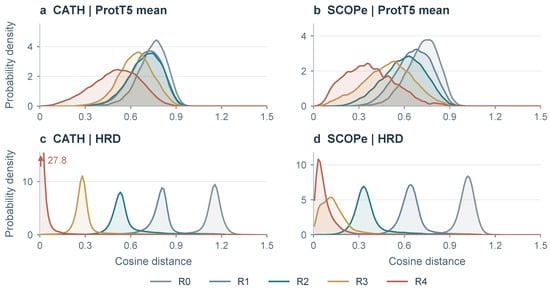
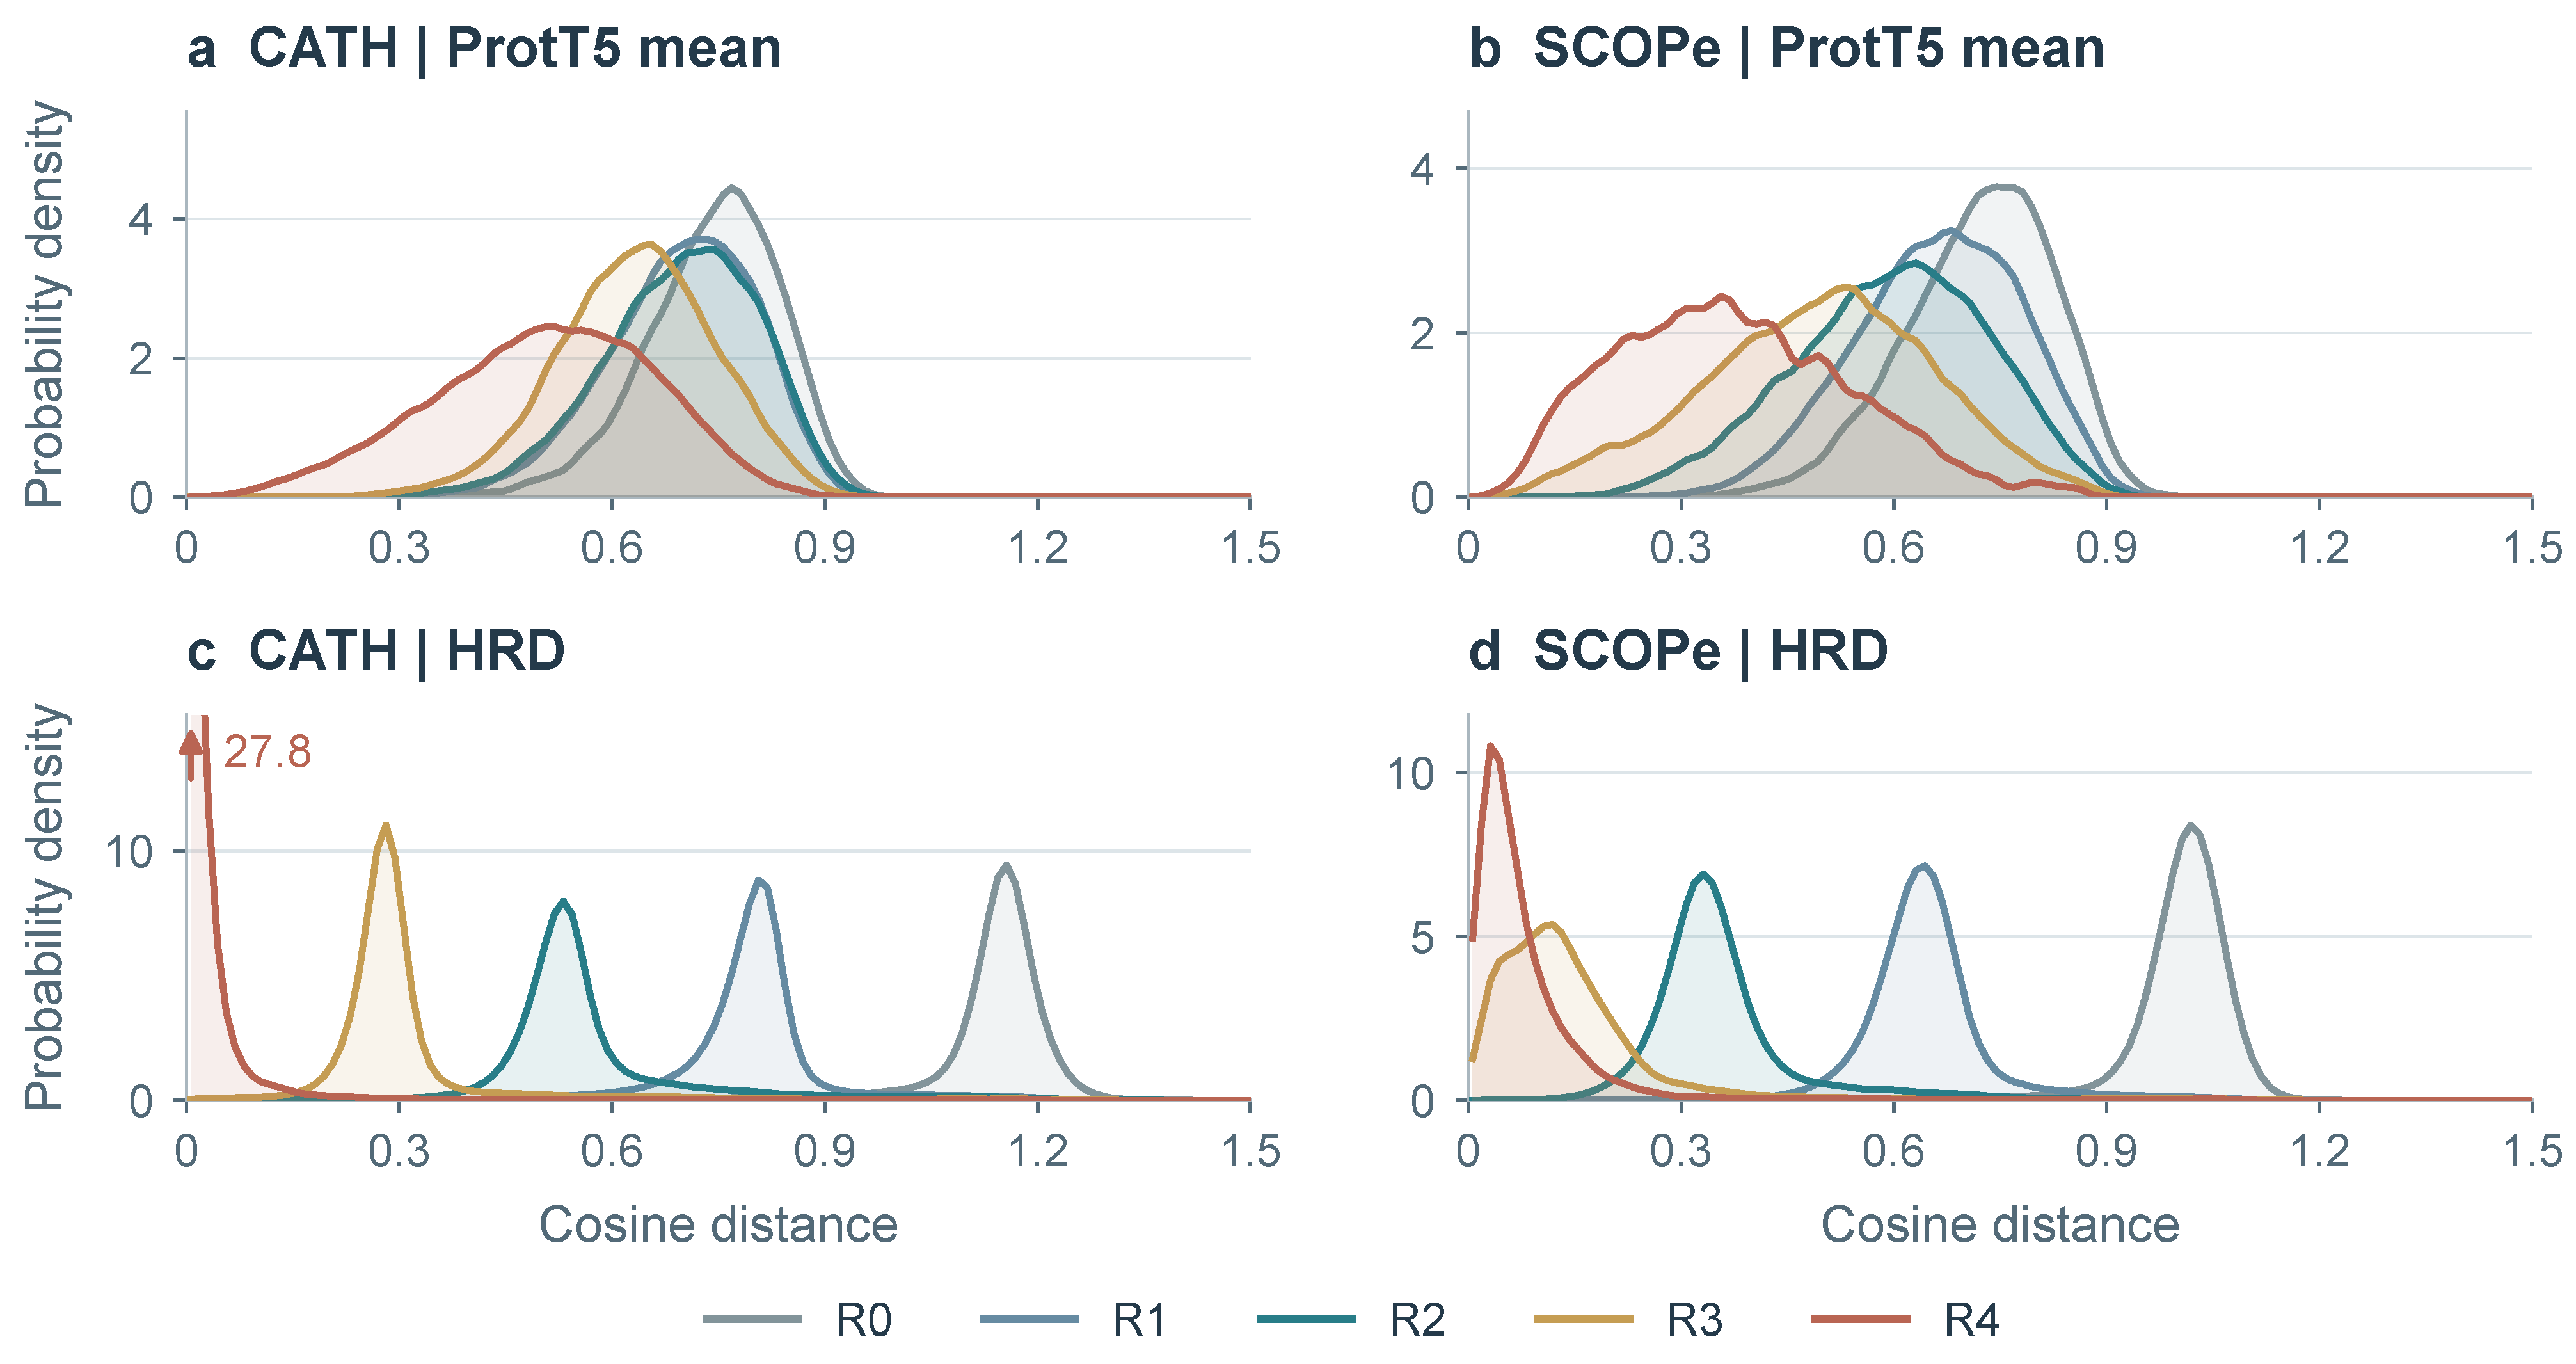
Relationship-conditioned distances show how HRD organizes the hierarchy in its embedding space (Figure 4). In the original ProtT5 mean representation, CATH and have nearly identical mean distances, 0.698 and 0.696; HRD separates them to 0.799 and 0.573. Pairs sharing an Architecture () are therefore closer on average than pairs sharing only a Class (). This distinction aligns with the large Architecture AP gain and shows that the representation resolves finer relationships within a Class. On both datasets, mean distances decrease consistently from to , providing a common geometric ordering from the weakest to the strongest relationship. SCOPe and have a mean-distance separation of 0.064, consistent with the smaller performance gains at Family (Table 3) and placing fine Family distinctions within compact Superfamily neighborhoods.
Figure 4.
Relationship-conditioned cosine-distance distributions. (a,b) Normalized ProtT5 residue means on CATH and SCOPe; (c,d) the corresponding HRD representations. Colors denote the five exclusive relationships –, ordered from weakest to strongest. Distance is cosine similarity. Labels give the full heights of truncated peaks. Pair sampling is described in Section S4.
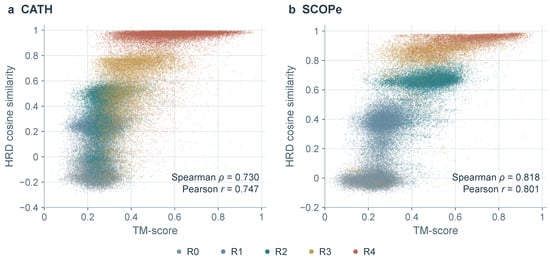
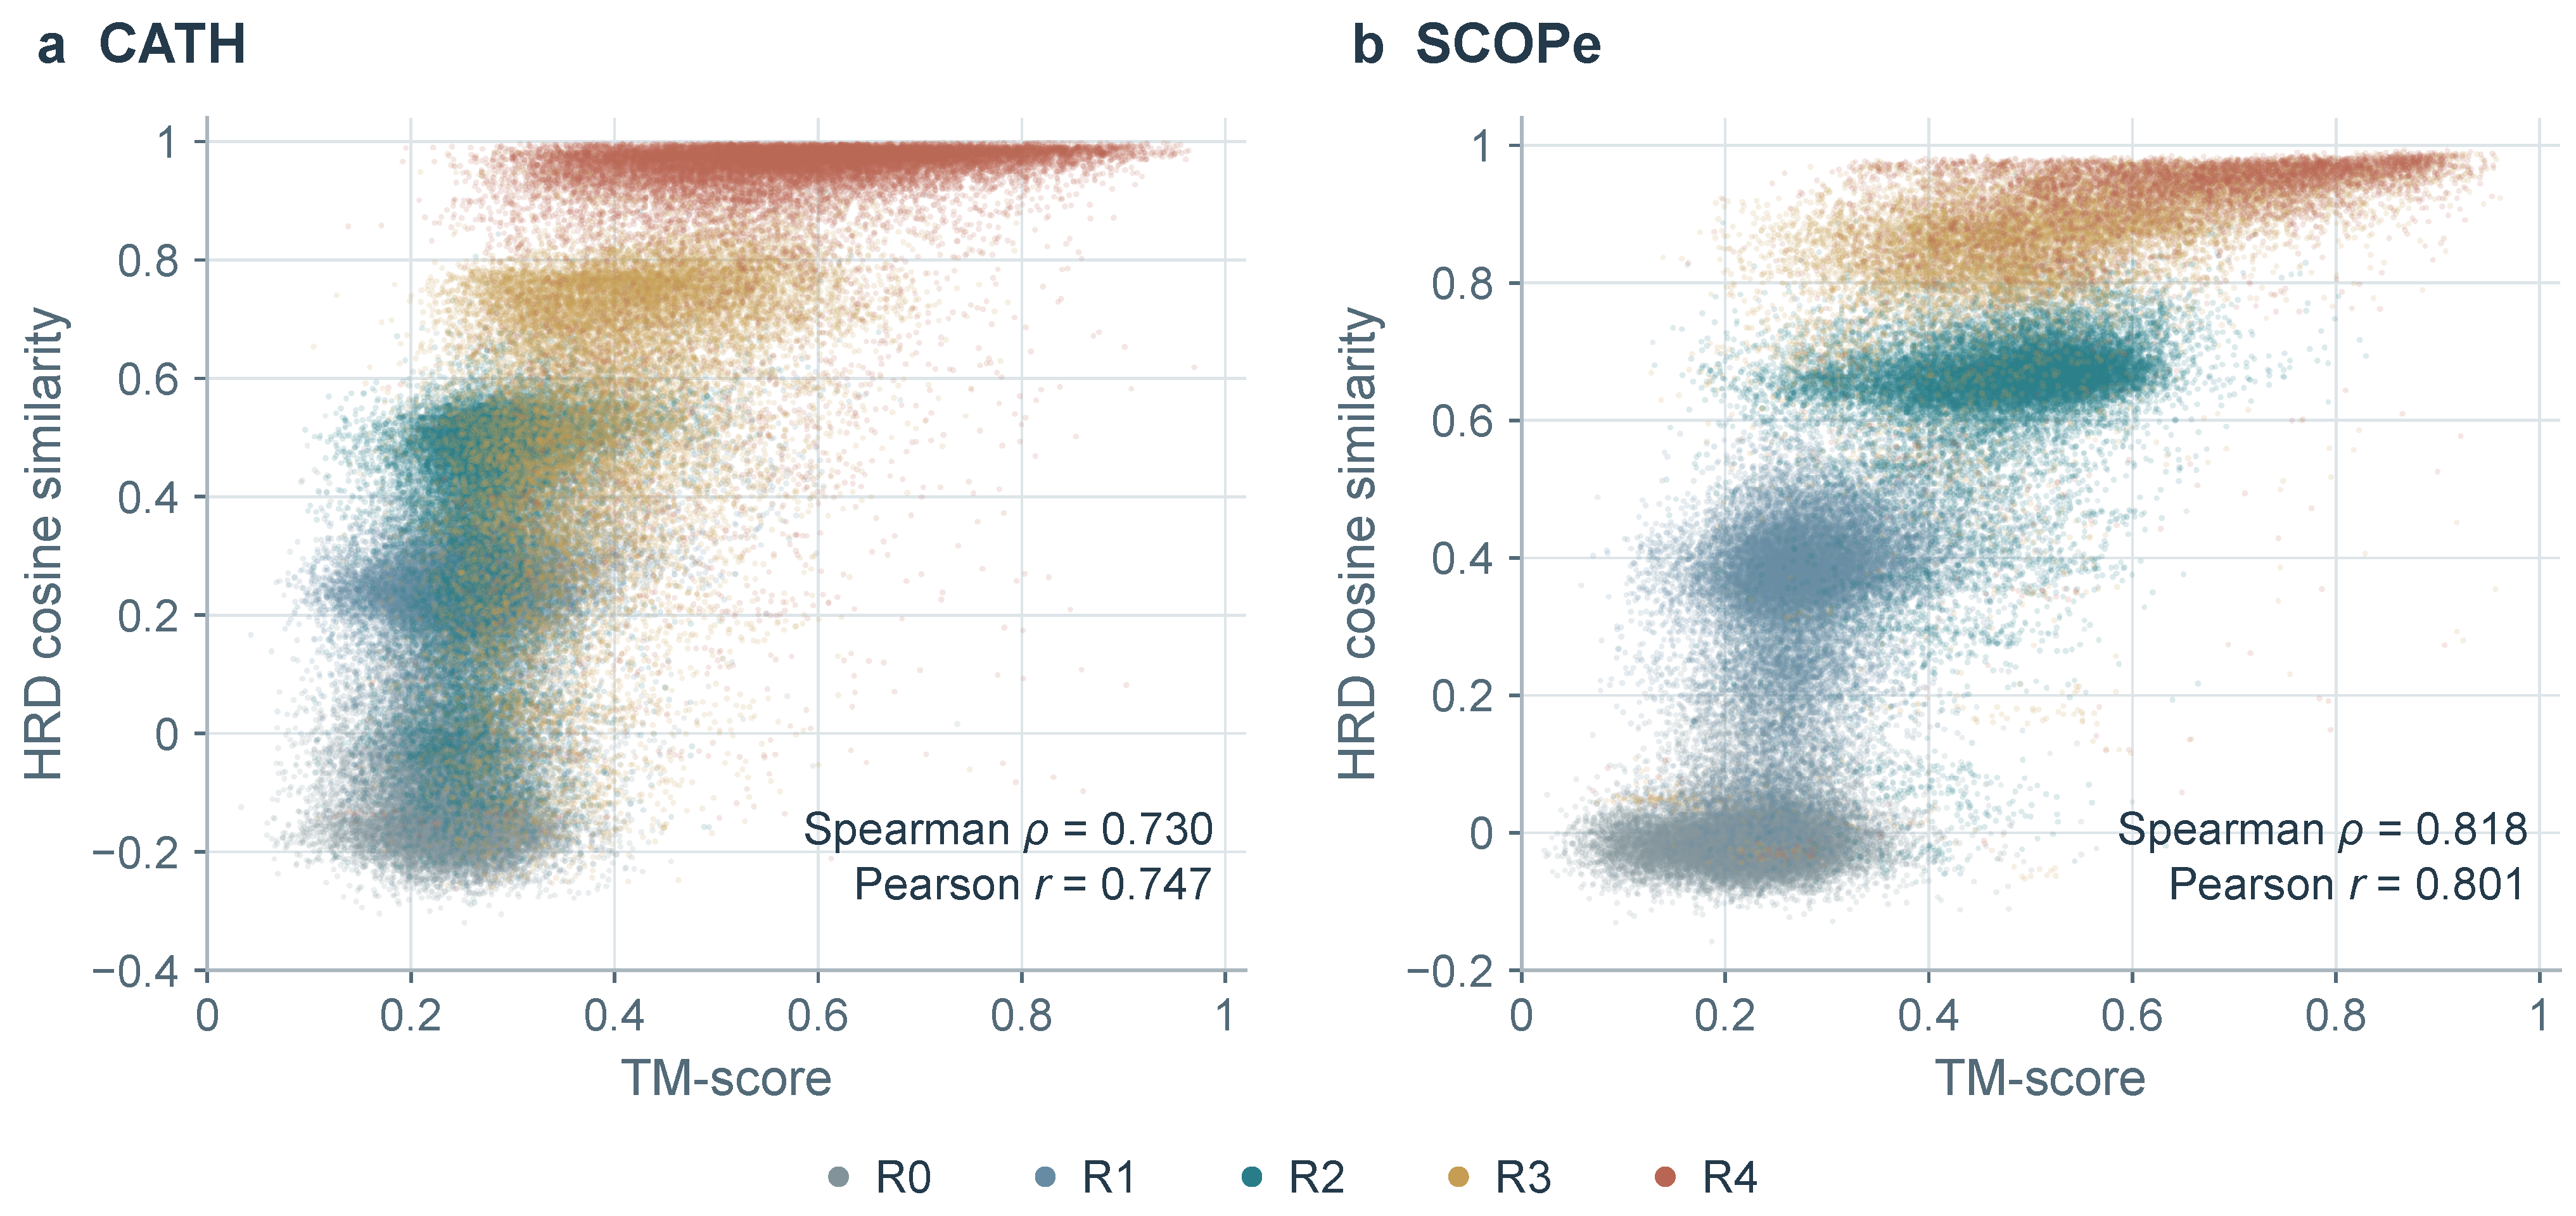
HRD similarities also correlate with structural similarity measured by TM-align (version 20240303) [31] (Figure 5). For the randomly sampled test pairs, similarity scores averaged over five training runs yield Spearman correlations of 0.730 on CATH and 0.818 on SCOPe; Pearson correlations are 0.747 and 0.801, respectively. Pairs with closer hierarchical relationships tend to have both higher HRD similarities and higher TM-scores, supporting the structural relevance of the learned hierarchy.
Figure 5.
Correlation between HRD similarity and TM-score. (a) CATH (100,000 pairs); (b) SCOPe (78,020 pairs). Colors denote –. HRD similarities are averaged over five training runs; coefficients are calculated from these plotted values. TM-scores use average-length normalization.
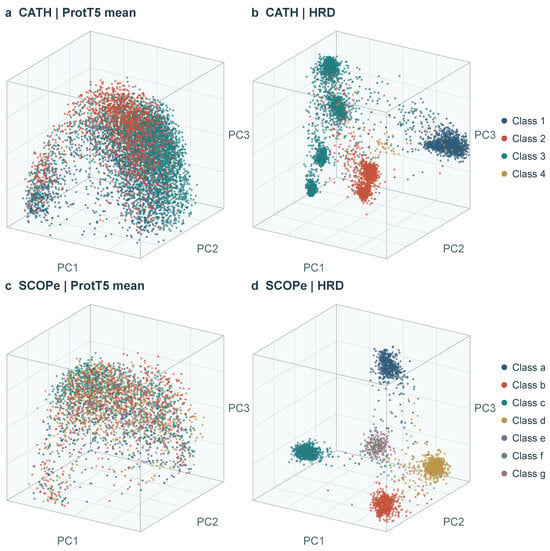
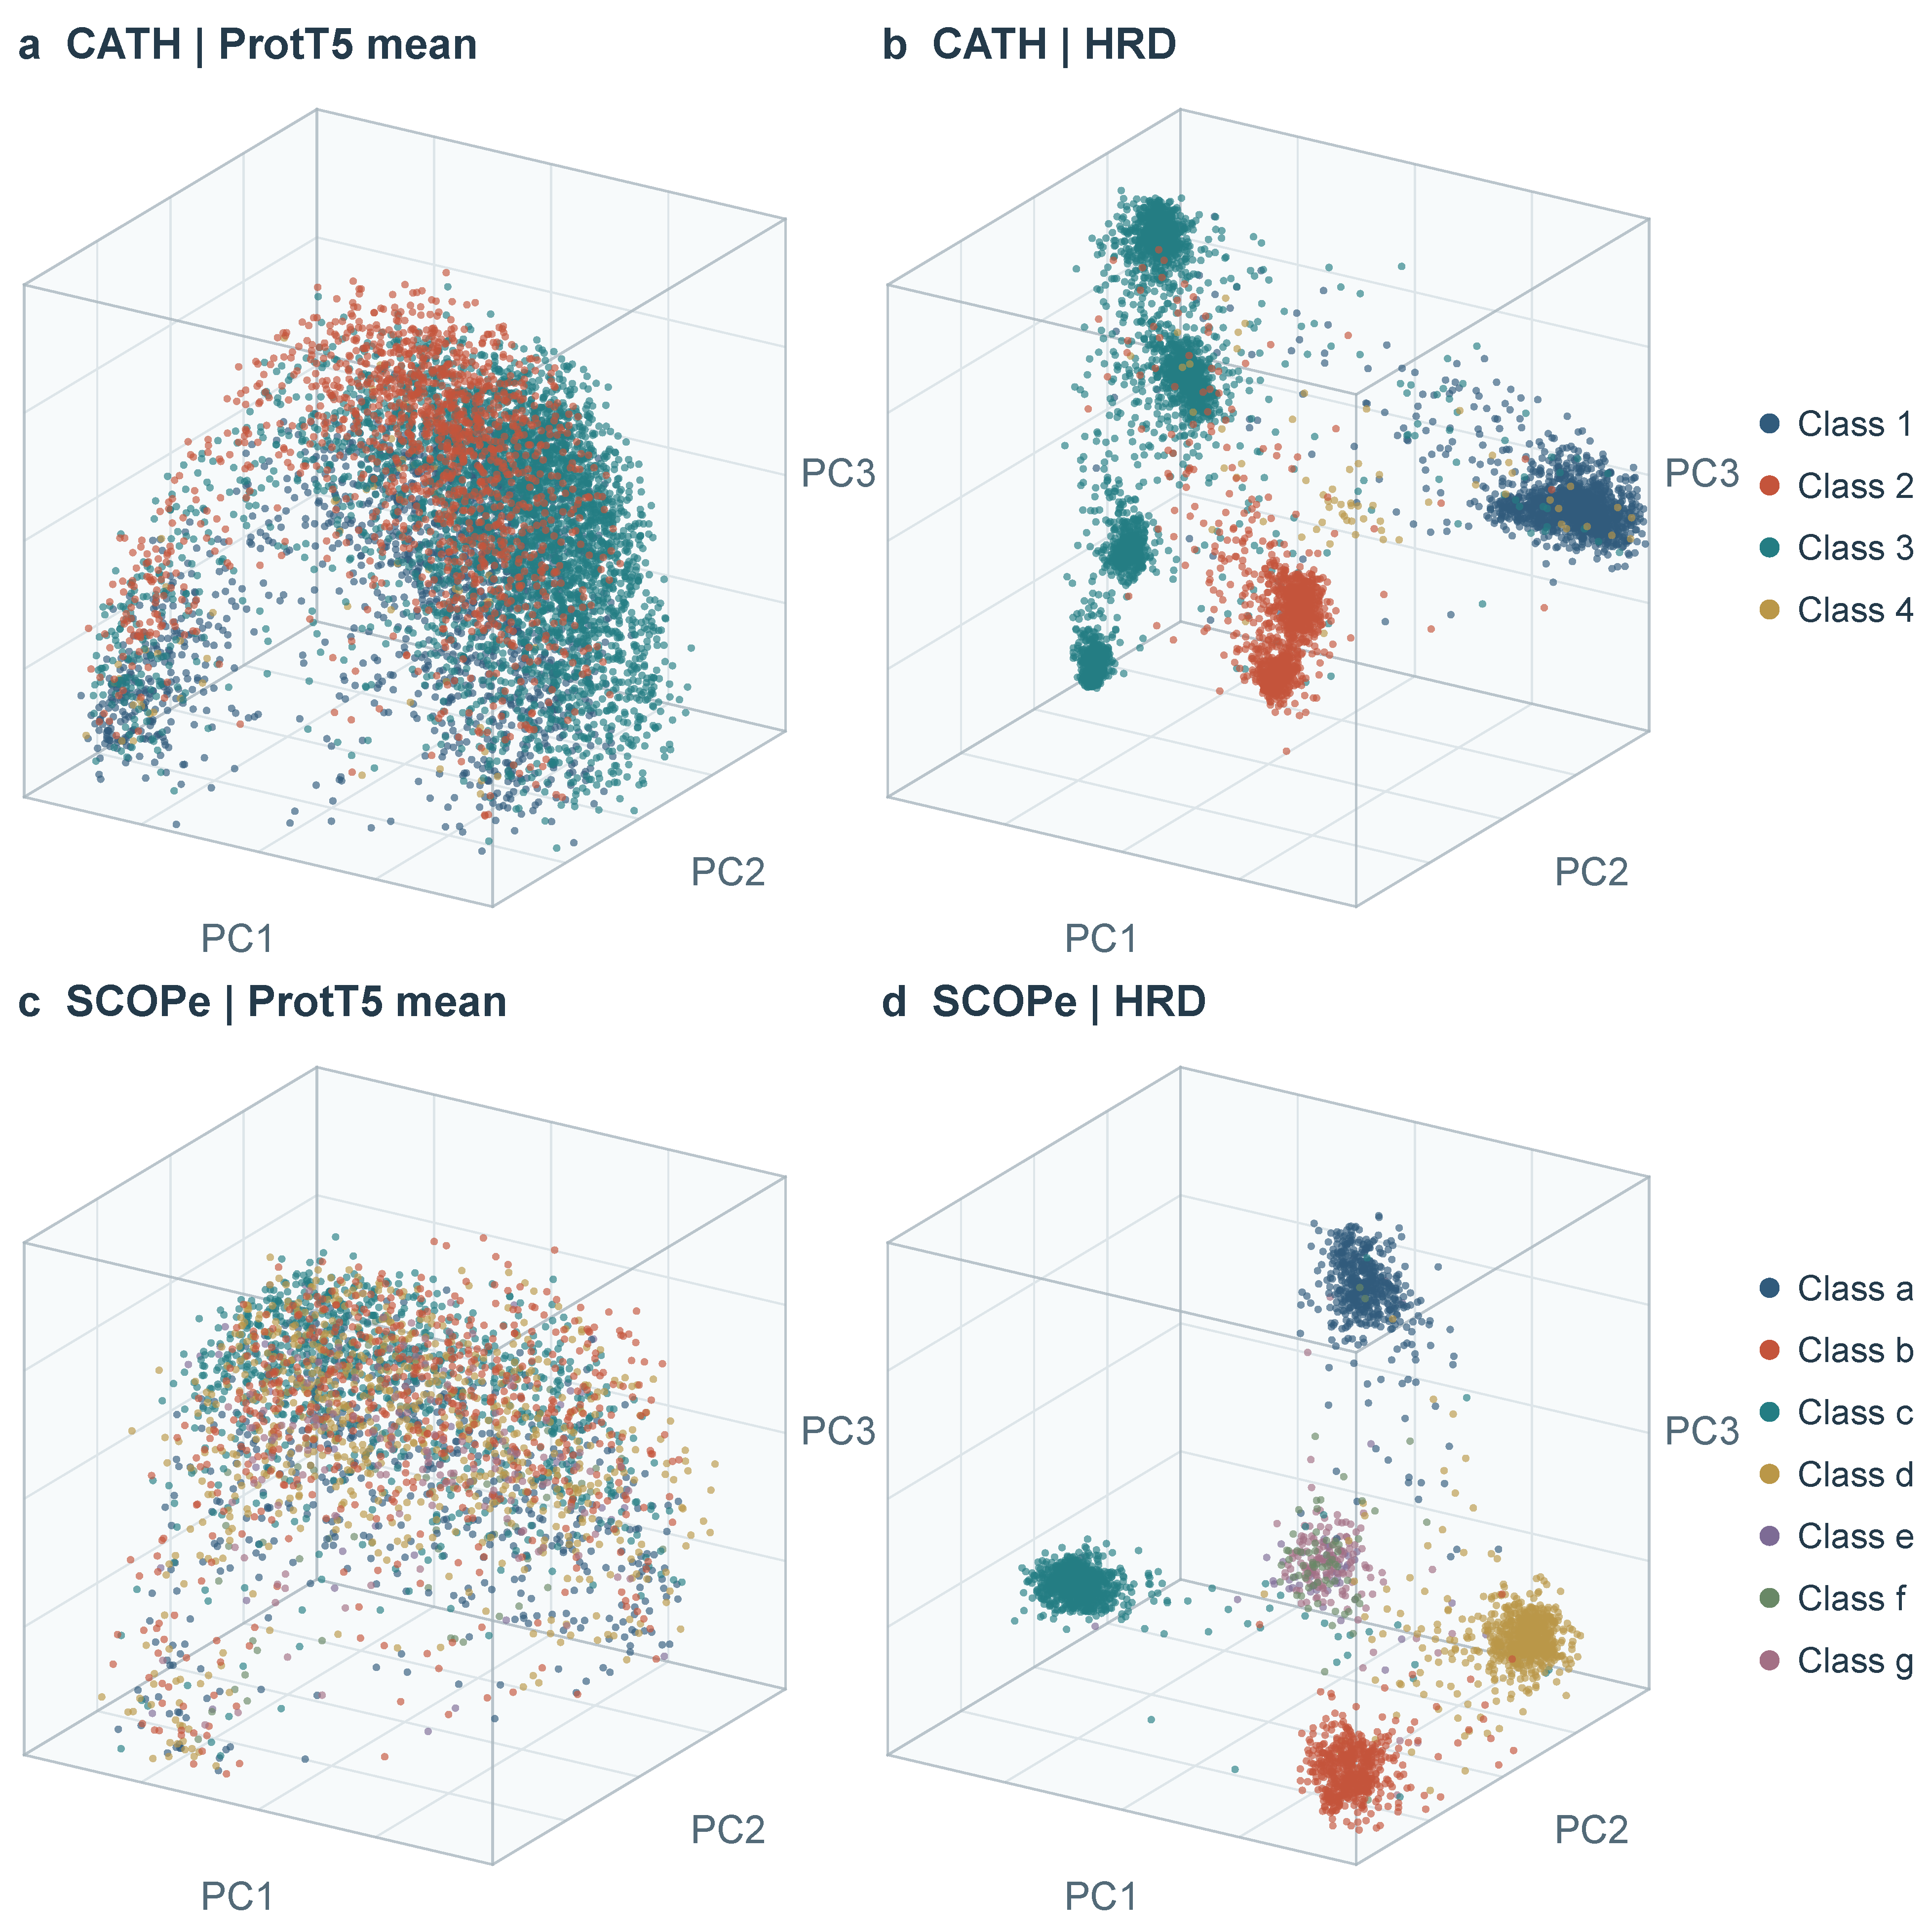
HRD forms more distinct Class-associated regions than ProtT5 residue means in the PCA [32] projections (Figure 6). The broad overlap between Classes in the original features is reduced in the learned representation. This Class-level organization complements the progressively shorter distances observed for closer relationships, linking broad structural separation with multilevel ordering in the same embedding.
Figure 6.
Three-dimensional PCA views of normalized test representations. (a,b) CATH ProtT5 residue means and HRD; (c,d) the corresponding SCOPe representations. Colors denote Class.
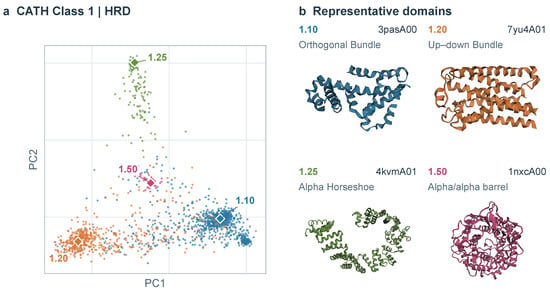
HRD also distinguishes domain architectures within the same structural Class. CATH Class 1 provides a representative example (Figure 7): domains from the same Architecture tend to cluster together in the PCA plot, while different Architectures are concentrated in different regions. The representative structures all consist mainly of -helices, but differ in their arrangement, forming orthogonal bundles (1.10), up–down bundles (1.20), alpha horseshoes (1.25), and barrels (1.50).
Figure 7.
HRD representations and domain structures, using CATH Class 1 as an example. (a) Two-dimensional PCA of 1611 test-domain representations, colored by Architecture. (b) Representative structures of the domains marked by diamonds in (a).
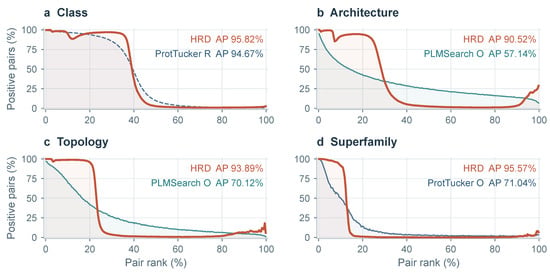
All-pair ranking connects the learned geometry to the CATH AP gains (Figure 8). At Architecture, Topology, and Superfamily, HRD concentrates pairs with the required relationship near the top of the similarity rankings. The effect is especially pronounced at Architecture, where mean AP exceeds the strongest baseline by 33.38 points. The early concentration of positives explains the improved precision as relevant pairs are retrieved and complements the separation between relationship groups observed in the distance analysis.
Figure 8.
All-pair ranking AP on CATH. (a–d) Class, Architecture, Topology, and Superfamily. Curves show the local proportion of positive pairs along lists of all eligible test pairs ordered by decreasing similarity. HRD is compared with the baseline having the highest pair AP at each level. O and R denote official and retrained configurations.
3.5. Retrieval Examples and Sequence Length
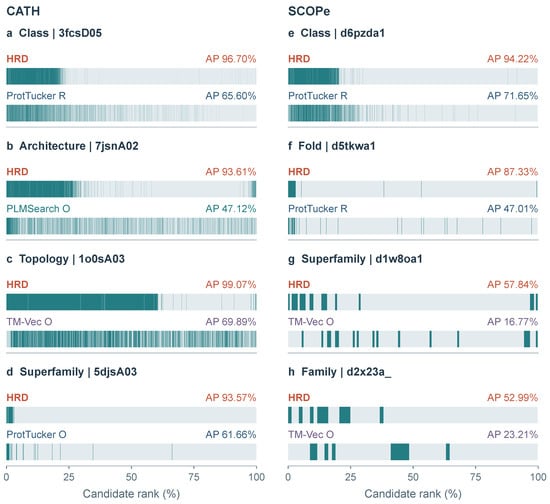
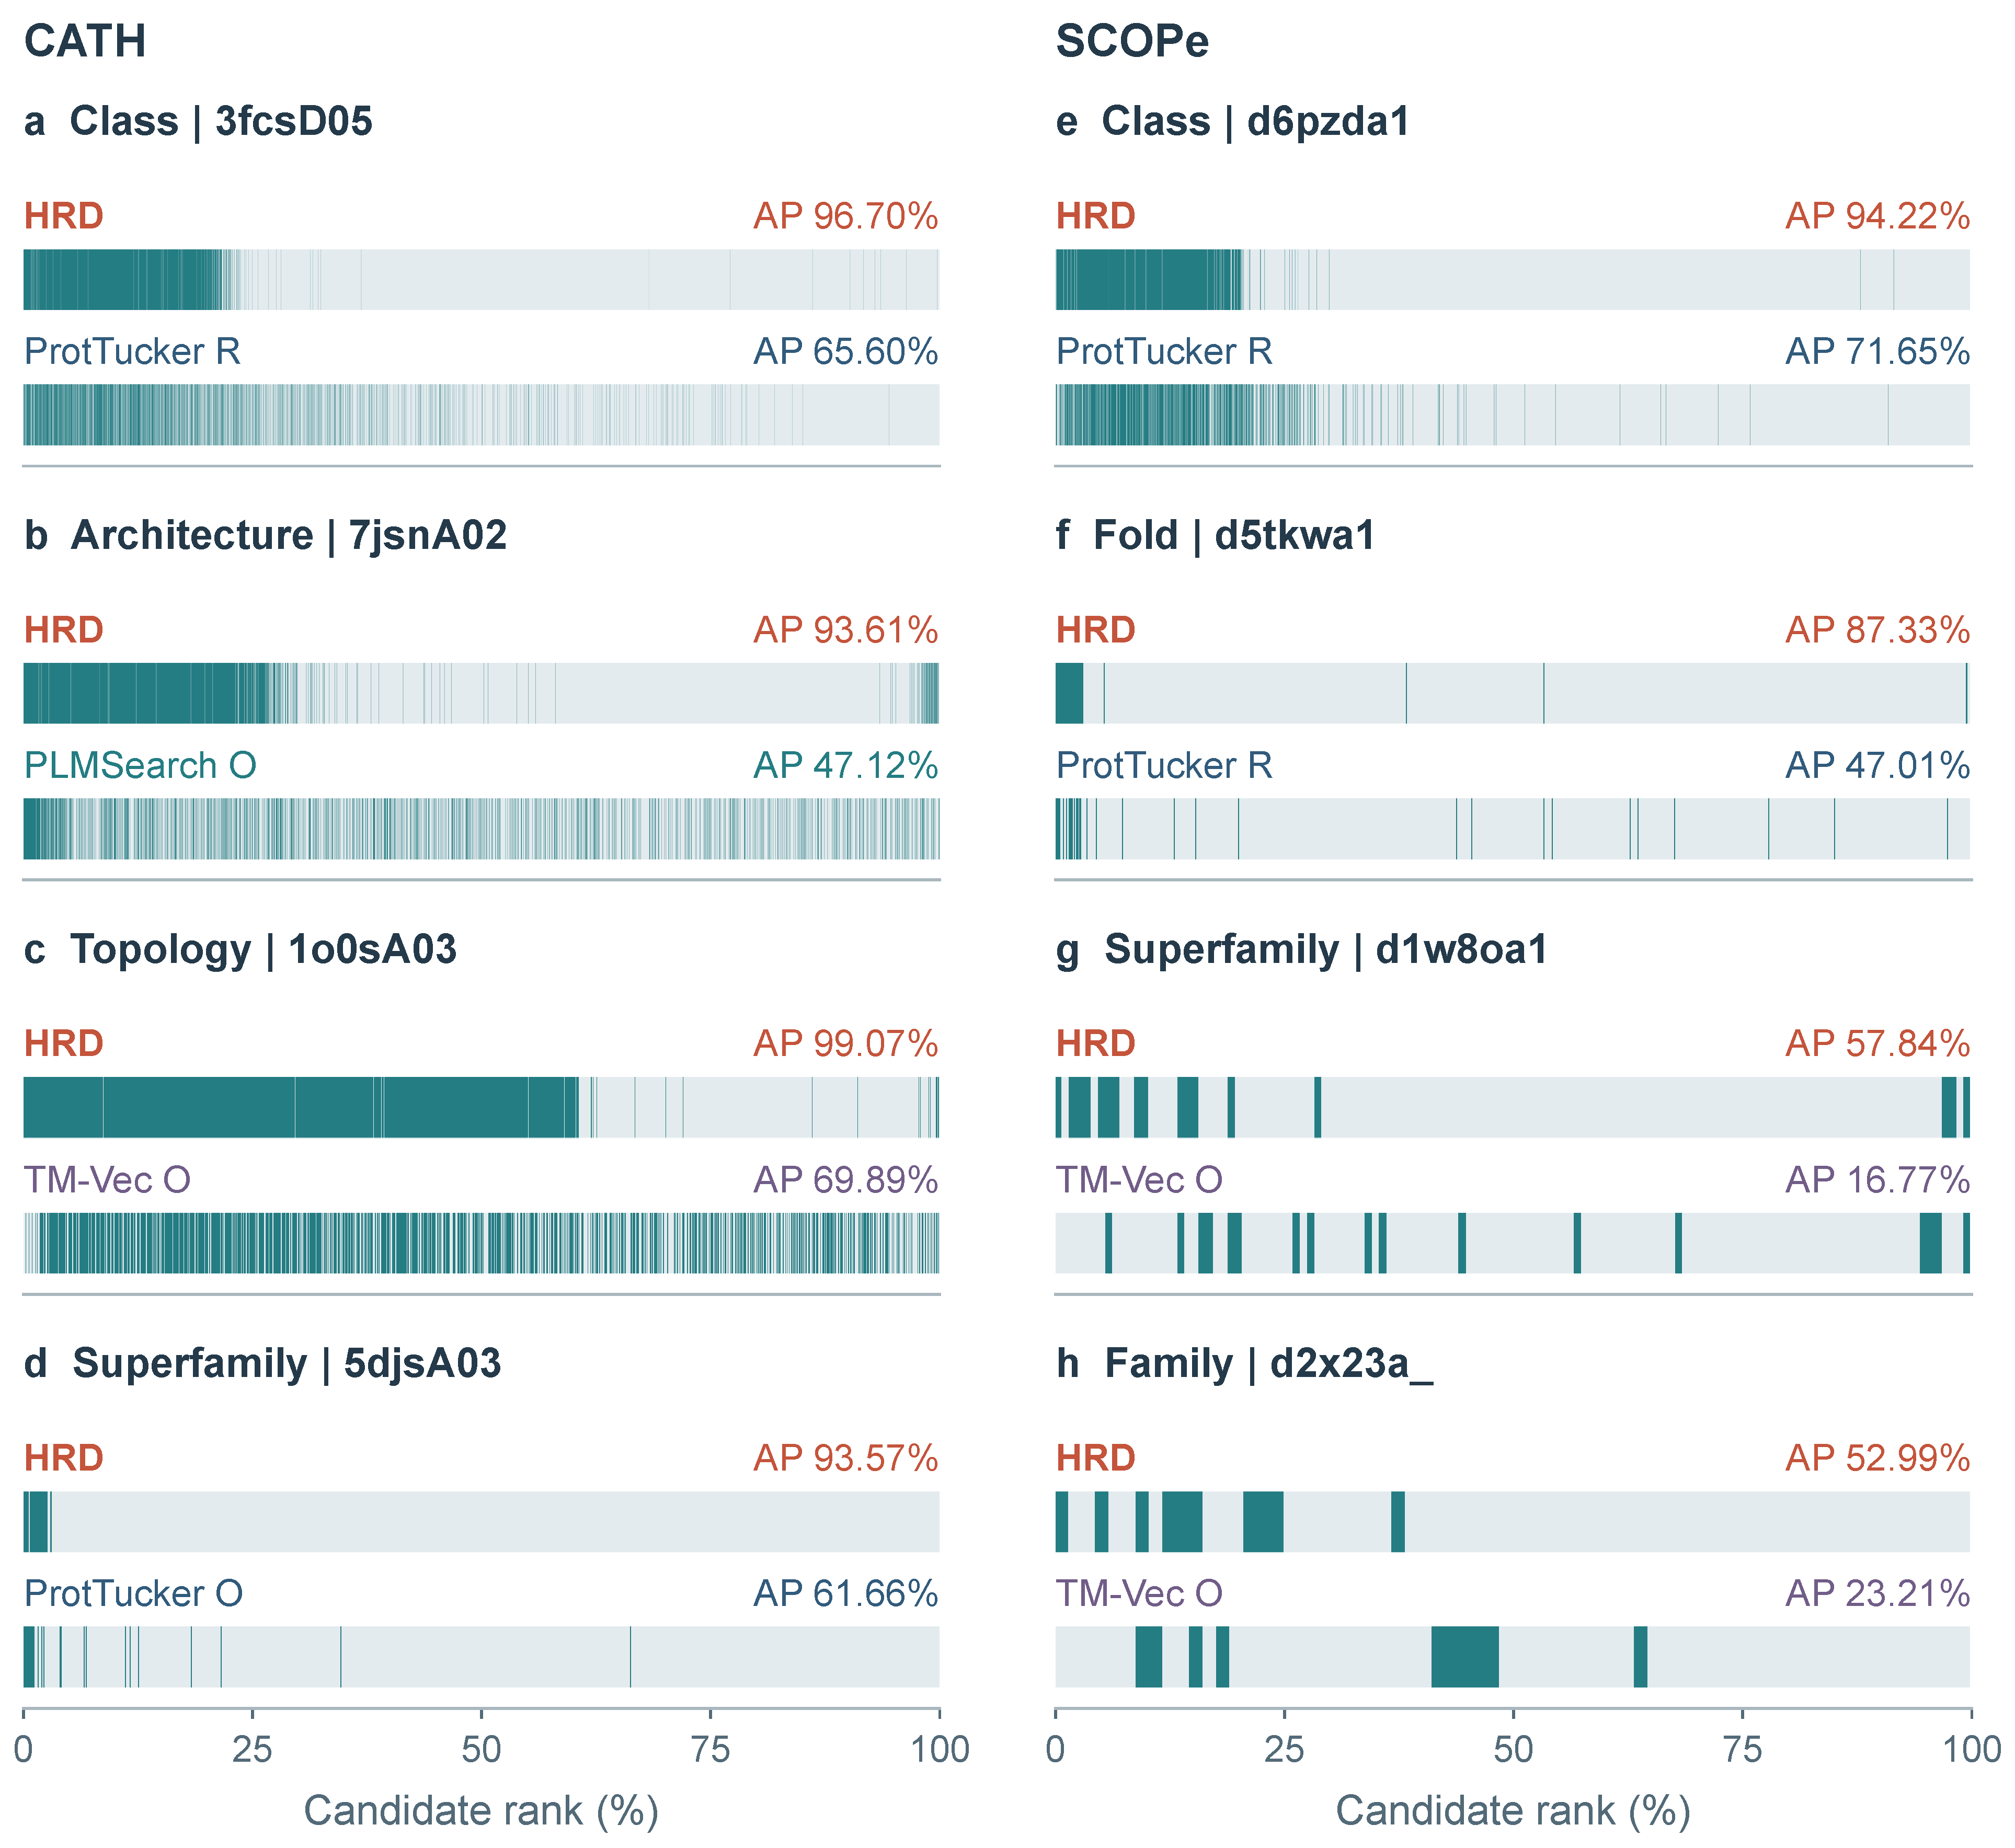
Individual retrieval lists show how the aggregate improvements translate into the ordering of candidates for a query (Figure 9). For CATH Architecture query 7jsnA02, HRD raises query AP from 47.12% to 93.61%; at Topology, 1o0sA03 improves from 69.89% to 99.07%. In both examples, positive candidates become more concentrated near the beginning of the ranking. HRD thus prioritizes domains in the desired category over candidates that share its parent but belong to a different category, making the early retrieval results more relevant to the query.
Figure 9.
Individual query-ranking strips. Each panel compares HRD with the baseline having the highest aggregate qAP at that level; labels give query identity and query AP. Candidates are ordered by similarity. Teal denotes positives and pale gray same-parent negatives. Query selection is described in Section S4.
The SCOPe examples show the same improvement for finer relationships. For Superfamily query d1w8oa1, AP increases from 16.77% to 57.84%, and for Family query d2x23a_, from 23.21% to 52.99%. The higher placement of relevant domains demonstrates improved prioritization within the shared Fold or Superfamily candidate sets.
The retrieval advantage also extends across sequence lengths: HRD has the highest mean qAP in all 32 dataset–level–length groups (Figure S1). At CATH Topology, its qAP rises from 68.95% for queries shorter than 100 residues to 96.66% for those of at least 400 residues, showing particularly strong retrieval in the longest group. The consistent lead within each length group establishes that HRD’s gains cover both short and long domain sequences in the two datasets.
3.6. Computational Efficiency
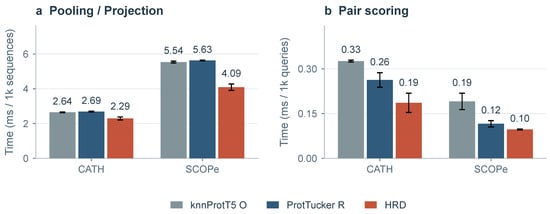
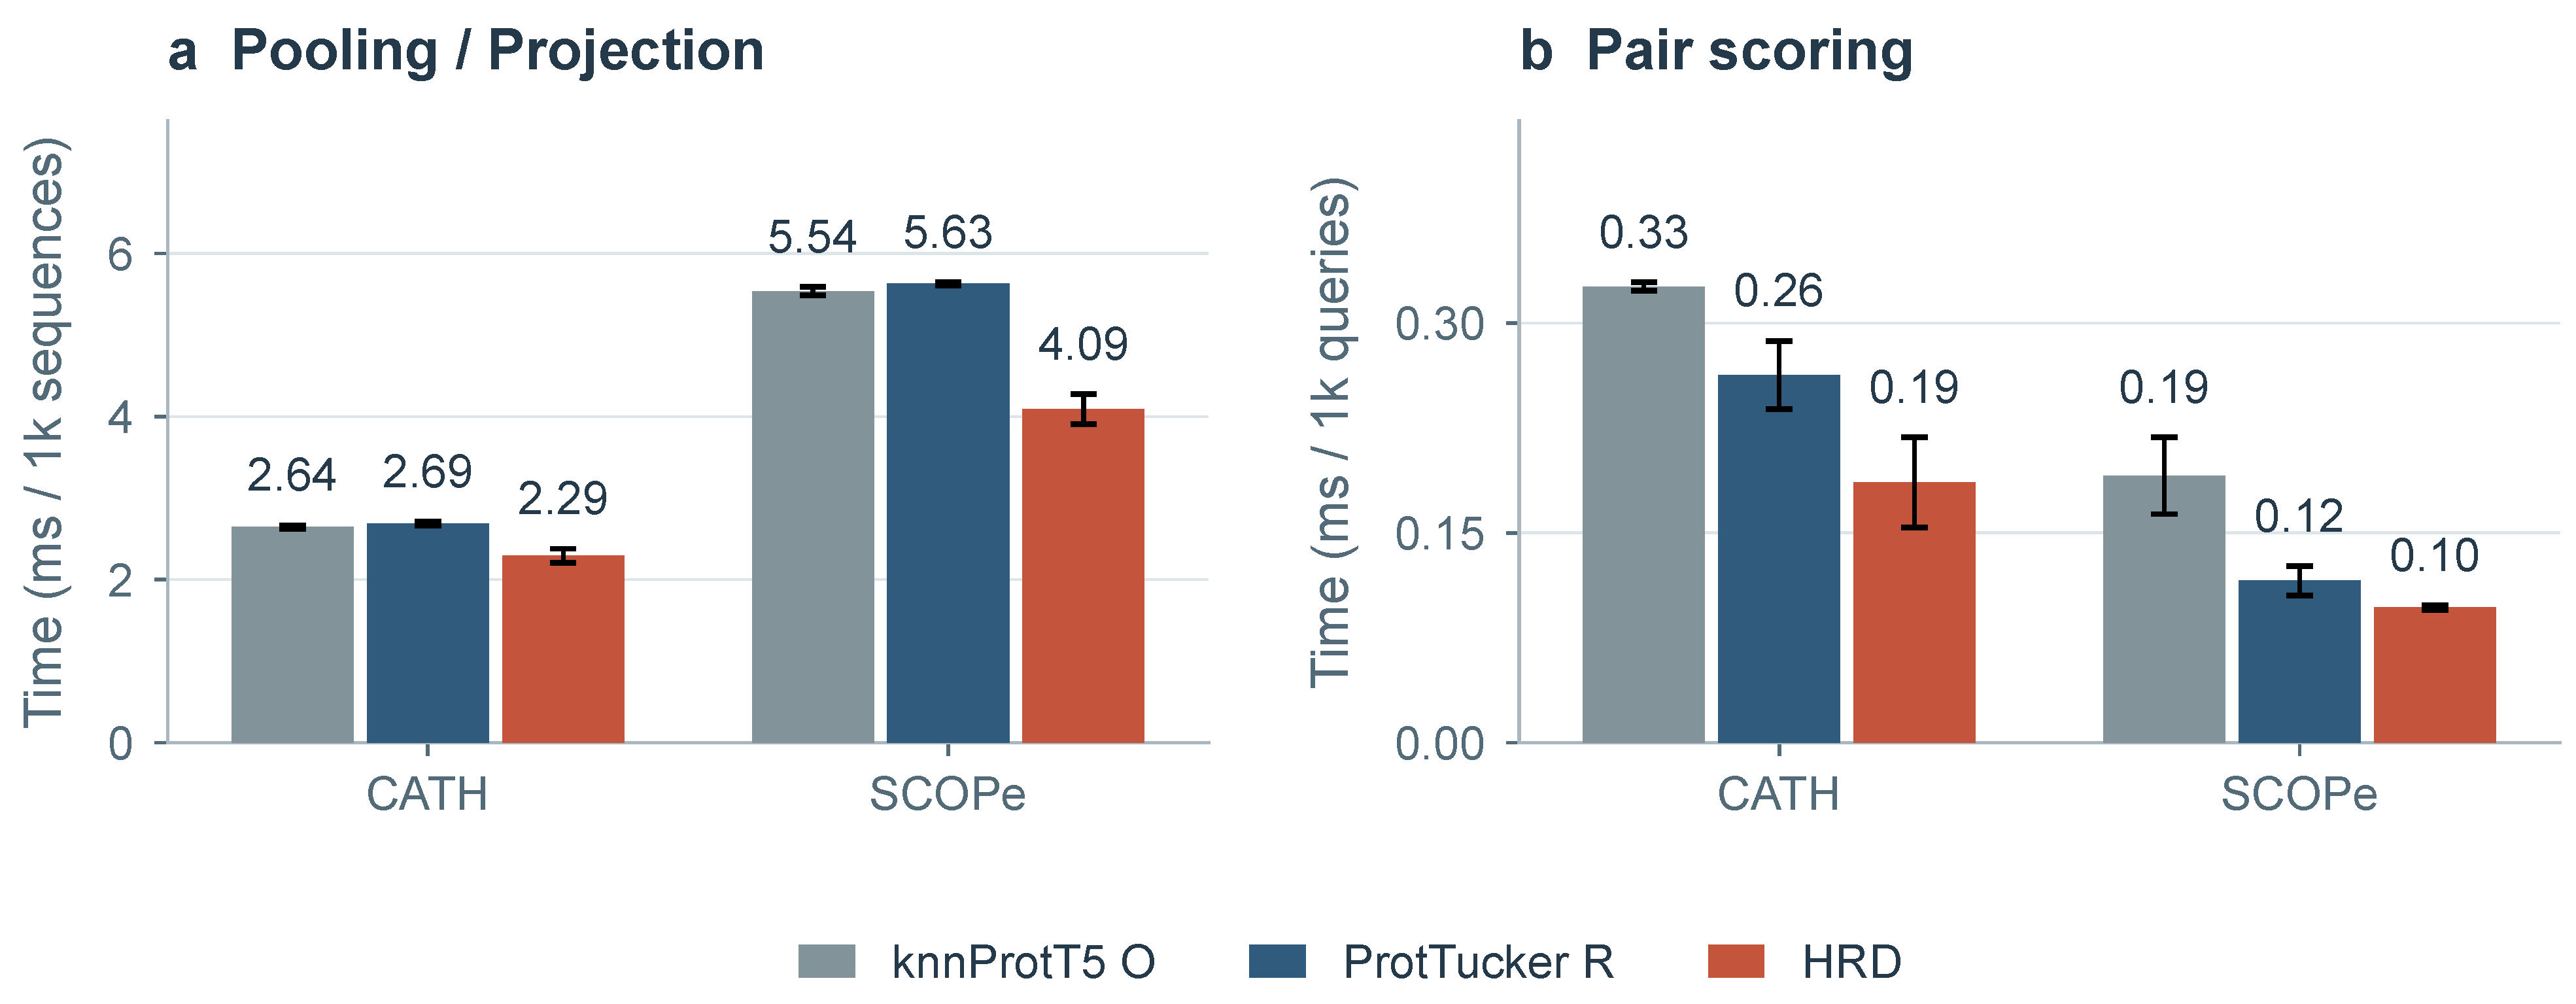
We measure runtimes on a GeForce RTX 4090 D GPU (NVIDIA Corporation, Santa Clara, CA, USA). With precomputed residue features, HRD has the lowest mean pooling/projection and pair-scoring times among HRD, ProtTucker, and knnProtT5 under the benchmark configurations (Figure 10). Pooling/projection takes 2.293 and 4.091 ms per 1k sequences on CATH and SCOPe, respectively; pair scoring takes 0.186 and 0.097 ms per 1k queries. Each 512-dimensional FP32 embedding occupies 2 KiB per domain and can be reused across hierarchy levels. Compact storage and low measured scoring costs support efficient repeated searches over the same stored domain representations. Training costs for complete runs and the full timing protocol are reported in the Supplementary Materials.
Figure 10.
Stagewise efficiency. (a) Pooling/Projection time per 1k sequences. (b) Pair-scoring time per 1k queries against the full test set. Bars and error bars indicate mean ± sample SD. Frozen ProtT5 encoding is excluded; measurement settings are provided in Section S5.
4. Discussion
The results highlight the biological importance of distinguishing protein-domain relationships at different hierarchical levels. Structural resemblance does not necessarily imply close evolutionary relatedness: domains may share similar overall architectures while differing in their topological connectivity or homologous classification [2,3]. HRD achieves its largest improvements at the intermediate levels of CATH, particularly Architecture and Topology, suggesting that hierarchical supervision is especially valuable for resolving structural distinctions that are less effectively captured by conventional sequence embeddings. This is important because recognizing broad structural similarity and identifying more specific domain relationships represent different levels of biological interpretation.
A central insight of HRD is that hierarchical classification knowledge can guide both which relationships are learned and how they are represented geometrically. Relation-covering sampling exposes the model to different degrees of relatedness, while ranking supervision preserves their relative ordering and distance supervision provides shared geometric references across queries. Together, these mechanisms translate discrete biological classifications into a continuous similarity space.
This hierarchical organization also offers practical advantages. A single compact representation supports comparisons at different biological resolutions, from broad structural categories to finer homologous groups, without requiring separate models or pairwise prediction networks. Such representations may facilitate the prioritization of related domains for subsequent structural and evolutionary analysis, particularly in large protein collections where exhaustive comparisons are computationally demanding [33].
Domain delineation provides a practical route for extending HRD to proteins with unknown domain boundaries. Domain sequences obtained using DPAM-AI, Merizo, SWORD2, or FUpred [34,35,36,37] could be compared within the same HRD embedding space. Accurate boundaries allow HRD to aggregate features from the complete domain while excluding residues from neighboring domains. Boundary errors that truncate the domain or include neighboring residues may alter the pooled representation and affect similarity scores and retrieval rankings.
The compact representation also supports rapid candidate screening for downstream structural analysis. Once domain embeddings are precomputed, pairwise comparison requires only a cosine similarity calculation. This allows more detailed structural comparisons with Foldseek, Dali, or TM-align [31,38,39] to focus on a smaller candidate set when corresponding query and candidate structures are available. Such screening could support structural analogue identification and template selection for modeling and assembly workflows, including I-TASSER-MTD and DEMO [40,41,42].
An important direction for further development is to move beyond fixed, relation-specific distance targets. Domains within the same hierarchical category may still exhibit substantial structural and evolutionary diversity. Adaptive geometric constraints, potentially informed by continuous structural similarities, could better preserve this variation while maintaining hierarchical organization. This may be particularly valuable for distinguishing closely related domains at the finest classification levels, where substantial overlap remains.
5. Conclusions
Overall, HRD demonstrates that explicitly coordinating hierarchical relationship coverage with ranking and distance supervision provides an effective approach to multilevel protein-domain similarity learning. More broadly, it illustrates the potential of embedding structured biological knowledge into sequence-based similarity representations to capture relationships at multiple biological resolutions.
Supplementary Materials
The following supporting information can be downloaded at https://www.mdpi.com/article/10.3390/biology15222136/s1, Section S1: Training Settings; Section S2: Baseline Configurations; Section S3: Component Results; Section S4: Representation and Retrieval Analyses; Section S5: Efficiency Measurements; Section S6: Sensitivity to Distance Targets; Section S7: Generalization to Unseen Superfamilies; Figure S1: Query-macro AP by sequence-length group; Figure S2: Validation curves for retrained baselines; Table S1: HRD configuration; Table S2: Sequence representations and similarity scores; Table S3: Baseline retraining settings; Table S4: Four-level mean performance of retrained baselines (%), reported as mean ± sample SD; Table S5: CATH ablation results; Table S6: SCOPe ablation results; Table S7: HRD distance statistics by relationship group; Table S8: Computational costs, mean ± sample SD; Table S9: Sensitivity to distance targets (%); Table S10: Dataset partitions with held-out superfamilies; Table S11: qAP on held-out superfamilies (%).
Author Contributions
Conceptualization, Y.G. and W.C.; formal analysis, Y.G.; investigation, Y.G.; data curation, Y.G.; writing, Y.G. and W.C. All authors have read and agreed to the published version of the manuscript.
Funding
This work is supported by Excellence Fund of Soochow University (NH11802725) and SU-Humanson Joint Project on Intelligent Pharmacology (H250106).
Data Availability Statement
CATHS40 (v4.4) and SCOPe40 (v2.08) are publicly available from CATH (https://www.cathdb.info/, accessed on 24 October 2026) and SCOPe (https://scop.berkeley.edu/, accessed on 24 October 2026), respectively. The HRD source code is available on GitHub (https://github.com/polarkaid/HRD-Protein, accessed on 24 October 2026), and trained model weights are available on Hugging Face (https://huggingface.co/polarkaid/HRD-Protein, accessed on 24 October 2026).
Conflicts of Interest
The authors declare no conflict of interest.
References
- Ponting, C.P.; Russell, R.R. The Natural History of Protein Domains. Annu. Rev. Biophys. 2002, 31, 45–71. [Google Scholar] [CrossRef] [Scilit] [PubMed]
- Orengo, C.A.; Michie, A.D.; Jones, S.; Jones, D.T.; Swindells, M.B.; Thornton, J.M. CATH—A hierarchic classification of protein domain structures. Structure 1997, 5, 1093–1109. [Google Scholar] [CrossRef] [Scilit] [PubMed]
- Murzin, A.G.; Brenner, S.E.; Hubbard, T.; Chothia, C. SCOP: A structural classification of proteins database for the investigation of sequences and structures. J. Mol. Biol. 1995, 247, 536–540. [Google Scholar] [CrossRef] [Scilit]
- Waman, V.P.; Bordin, N.; Lau, A.; Kandathil, S.; Wells, J.; Miller, D.; Velankar, S.; Jones, D.T.; Sillitoe, I.; Orengo, C. CATH v4.4: Major expansion of CATH by experimental and predicted structural data. Nucleic Acids Res. 2025, 53, D348–D355. [Google Scholar] [CrossRef] [Scilit] [PubMed]
- Chandonia, J.M.; Guan, L.; Lin, S.; Yu, C.; Fox, N.K.; Brenner, S.E. SCOPe: Improvements to the structural classification of proteins—Extended database to facilitate variant interpretation and machine learning. Nucleic Acids Res. 2022, 50, D553–D559. [Google Scholar] [CrossRef] [Scilit] [PubMed]
- Heinzinger, M.; Elnaggar, A.; Wang, Y.; Dallago, C.; Nechaev, D.; Matthes, F.; Rost, B. Modeling aspects of the language of life through transfer-learning protein sequences. BMC Bioinform. 2019, 20, 723. [Google Scholar] [CrossRef] [Scilit] [PubMed]
- Bepler, T.; Berger, B. Learning protein sequence embeddings using information from structure. In Proceedings of the International Conference on Learning Representations, New Orleans, LA, USA, 6–9 May 2019. [Google Scholar]
- Elnaggar, A.; Heinzinger, M.; Dallago, C.; Rehawi, G.; Wang, Y.; Jones, L.; Gibbs, T.; Feher, T.; Angerer, C.; Steinegger, M.; et al. ProtTrans: Toward Understanding the Language of Life Through Self-Supervised Learning. IEEE Trans. Pattern Anal. Mach. Intell. 2022, 44, 7112–7127. [Google Scholar] [CrossRef] [Scilit] [PubMed]
- Rives, A.; Meier, J.; Sercu, T.; Goyal, S.; Lin, Z.; Liu, J.; Guo, D.; Ott, M.; Zitnick, C.L.; Ma, J.; et al. Biological structure and function emerge from scaling unsupervised learning to 250 million protein sequences. Proc. Natl. Acad. Sci. USA 2021, 118, e2016239118. [Google Scholar] [CrossRef] [Scilit] [PubMed]
- Lin, Z.; Akin, H.; Rao, R.; Hie, B.; Zhu, Z.; Lu, W.; Smetanin, N.; Verkuil, R.; Kabeli, O.; Shmueli, Y.; et al. Evolutionary-scale prediction of atomic-level protein structure with a language model. Science 2023, 379, 1123–1130. [Google Scholar] [CrossRef] [Scilit] [PubMed]
- Schütze, K.; Heinzinger, M.; Steinegger, M.; Rost, B. Nearest neighbor search on embeddings rapidly identifies distant protein relations. Front. Bioinform. 2022, 2, 1033775. [Google Scholar] [CrossRef] [Scilit] [PubMed]
- Kilinc, M.; Jia, K.; Jernigan, R.L. Improved global protein homolog detection with major gains in function identification. Proc. Natl. Acad. Sci. USA 2023, 120, e2211823120. [Google Scholar] [CrossRef] [Scilit] [PubMed]
- Iovino, B.G.; Tang, H.; Ye, Y. Protein domain embeddings for fast and accurate similarity search. Genome Res. 2024, 34, 1434–1444. [Google Scholar] [CrossRef] [Scilit] [PubMed]
- Hamamsy, T.; Morton, J.T.; Blackwell, R.; Berenberg, D.; Carriero, N.; Gligorijevic, V.; Strauss, C.E.M.; Leman, J.K.; Cho, K.; Bonneau, R. Protein remote homology detection and structural alignment using deep learning. Nat. Biotechnol. 2024, 42, 975–985. [Google Scholar] [CrossRef] [Scilit] [PubMed]
- Liu, W.; Wang, Z.; You, R.; Xie, C.; Wei, H.; Xiong, Y.; Yang, J.; Zhu, S. PLMSearch: Protein language model powers accurate and fast sequence search for remote homology. Nat. Commun. 2024, 15, 2775, Correction in Nat. Commun. 2024, 15, 7766. [Google Scholar] [CrossRef] [Scilit] [PubMed]
- Zhang, Y.; Zhang, W. Rprot-Vec: A deep learning approach for fast protein structure similarity calculation. BMC Bioinform. 2025, 26, 171. [Google Scholar] [CrossRef] [Scilit] [PubMed]
- Hong, L.; Hu, Z.; Sun, S.; Tang, X.; Wang, J.; Tan, Q.; Zheng, L.; Wang, S.; Xu, S.; King, I.; et al. Fast, sensitive detection of protein homologs using deep dense retrieval. Nat. Biotechnol. 2025, 43, 983–995. [Google Scholar] [CrossRef] [Scilit] [PubMed]
- Jha, N.; Kravitz, J.; West-Roberts, J.; Lu, C.; Camargo, A.P.; Roux, S.; Cornman, A.; Hwang, Y. Gaia: An AI-enabled genomic context–aware platform for protein sequence annotation. Sci. Adv. 2025, 11, eadv5109. [Google Scholar] [CrossRef] [Scilit] [PubMed]
- Su, J.; He, Y.; You, S.; Jiang, S.; Zhou, X.; Zhang, X.; Wang, Y.; Su, X.; Tolstoy, I.; Chang, X.; et al. A trimodal protein language model enables advanced protein searches. Nat. Biotechnol. 2026, 44, 1310–1316. [Google Scholar] [CrossRef] [Scilit] [PubMed]
- Heinzinger, M.; Littmann, M.; Sillitoe, I.; Bordin, N.; Orengo, C.; Rost, B. Contrastive learning on protein embeddings enlightens midnight zone. NAR Genom. Bioinform. 2022, 4, lqac043. [Google Scholar] [CrossRef] [Scilit] [PubMed]
- Kilinc, M.; Jia, K.; Jernigan, R.L. Major advances in protein function assignment by remote homolog detection with protein language models—A review. Curr. Opin. Struct. Biol. 2025, 90, 102984. [Google Scholar] [CrossRef] [Scilit] [PubMed]
- Vaswani, A.; Shazeer, N.; Parmar, N.; Uszkoreit, J.; Jones, L.; Gomez, A.N.; Kaiser, Ł.; Polosukhin, I. Attention is All you Need. In Proceedings of the Advances in Neural Information Processing Systems; Guyon, I., Luxburg, U.V., Bengio, S., Wallach, H., Fergus, R., Vishwanathan, S., Garnett, R., Eds.; Curran Associates, Inc.: Red Hook, NY, USA, 2017; Volume 30. [Google Scholar]
- Lee, J.; Lee, Y.; Kim, J.; Kosiorek, A.; Choi, S.; Teh, Y.W. Set Transformer: A Framework for Attention-based Permutation-Invariant Neural Networks. In Proceedings of the 36th International Conference on Machine Learning, PMLR (Proceedings of Machine Learning Research), Long Beach, CA, USA, 9–15 June 2019; Chaudhuri, K., Salakhutdinov, R., Eds.; Volume 97, pp. 3744–3753. [Google Scholar]
- Hoffmann, D.T.; Behrmann, N.; Gall, J.; Brox, T.; Noroozi, M. Ranking info noise contrastive estimation: Boosting contrastive learning via ranked positives. In Proceedings of the AAAI Conference on Artificial Intelligence, Virtual, 22 February–1 March 2022; Volume 36, pp. 897–905. [Google Scholar]
- Chandonia, J.M.; Hon, G.; Walker, N.S.; Lo Conte, L.; Koehl, P.; Levitt, M.; Brenner, S.E. The ASTRAL Compendium in 2004. Nucleic Acids Res. 2004, 32, D189–D192. [Google Scholar] [CrossRef] [Scilit] [PubMed]
- Sillitoe, I.; Bordin, N.; Dawson, N.; Waman, V.P.; Ashford, P.; Scholes, H.M.; Pang, C.S.M.; Woodridge, L.; Rauer, C.; Sen, N.; et al. CATH: Increased structural coverage of functional space. Nucleic Acids Res. 2021, 49, D266–D273. [Google Scholar] [CrossRef] [Scilit] [PubMed]
- Fawcett, T. An introduction to ROC analysis. Pattern Recognit. Lett. 2006, 27, 861–874. [Google Scholar] [CrossRef] [Scilit]
- Manning, C.D.; Raghavan, P.; Schütze, H. Introduction to Information Retrieval; Cambridge University Press: Cambridge, UK, 2008. [Google Scholar]
- Cornman, A.; West-Roberts, J.; Camargo, A.; Roux, S.; Beracochea, M.; Mirdita, M.; Ovchinnikov, S.; Hwang, Y. The OMG dataset: An Open MetaGenomic corpus for mixed-modality genomic language modeling. In Proceedings of the International Conference on Learning Representations, Singapore, 24–28 April 2025; Yue, Y., Garg, A., Peng, N., Sha, F., Yu, R., Eds.; Volume 2025, pp. 88174–88198. [Google Scholar]
- Loshchilov, I.; Hutter, F. Decoupled Weight Decay Regularization. In Proceedings of the International Conference on Learning Representations, New Orleans, LA, USA, 6–9 May 2019. [Google Scholar]
- Zhang, Y.; Skolnick, J. TM-align: A protein structure alignment algorithm based on the TM-score. Nucleic Acids Res. 2005, 33, 2302–2309. [Google Scholar] [CrossRef] [Scilit] [PubMed]
- Jolliffe, I.T.; Cadima, J. Principal component analysis: A review and recent developments. Philos. Trans. R. Soc. A Math. Phys. Eng. Sci. 2016, 374, 20150202. [Google Scholar] [CrossRef] [Scilit] [PubMed]
- Steinegger, M.; Söding, J. MMseqs2 enables sensitive protein sequence searching for the analysis of massive data sets. Nat. Biotechnol. 2017, 35, 1026–1028. [Google Scholar] [CrossRef] [Scilit] [PubMed]
- Durham, J.; Zhang, J.; Schaeffer, R.D.; Cong, Q. DPAM-AI: A domain parser for AlphaFold models powered by artificial intelligence. Bioinformatics 2025, 41, btae740. [Google Scholar] [CrossRef] [Scilit] [PubMed]
- Lau, A.M.; Kandathil, S.M.; Jones, D.T. Merizo: A rapid and accurate protein domain segmentation method using invariant point attention. Nat. Commun. 2023, 14, 8445. [Google Scholar] [CrossRef] [Scilit] [PubMed]
- Cretin, G.; Galochkina, T.; Vander Meersche, Y.; de Brevern, A.; Postic, G.; Gelly, J.C. SWORD2: Hierarchical analysis of protein 3D structures. Nucleic Acids Res. 2022, 50, W732–W738. [Google Scholar] [CrossRef] [Scilit] [PubMed]
- Zheng, W.; Zhou, X.; Wuyun, Q.; Pearce, R.; Li, Y.; Zhang, Y. FUpred: Detecting protein domains through deep-learning-based contact map prediction. Bioinformatics 2020, 36, 3749–3757. [Google Scholar] [CrossRef] [Scilit] [PubMed]
- van Kempen, M.; Kim, S.S.; Tumescheit, C.; Mirdita, M.; Lee, J.; Gilchrist, C.L.M.; Söding, J.; Steinegger, M. Fast and accurate protein structure search with Foldseek. Nat. Biotechnol. 2024, 42, 243–246. [Google Scholar] [CrossRef] [Scilit] [PubMed]
- Holm, L. Dali server: Structural unification of protein families. Nucleic Acids Res. 2022, 50, W210–W215. [Google Scholar] [CrossRef] [Scilit] [PubMed]
- Zhou, X.; Zheng, W.; Li, Y.; Pearce, R.; Zhang, C.; Bell, E.W.; Zhang, G.; Zhang, Y. I-TASSER-MTD: A deep-learning-based platform for multi-domain protein structure and function prediction. Nat. Protoc. 2022, 17, 2326–2353. [Google Scholar] [CrossRef] [Scilit] [PubMed]
- Zhou, X.; Peng, C.; Zheng, W.; Li, Y.; Zhang, G.; Zhang, Y. DEMO2: Assemble multi-domain protein structures by coupling analogous template alignments with deep-learning inter-domain restraint prediction. Nucleic Acids Res. 2022, 50, W235–W245. [Google Scholar] [CrossRef] [Scilit] [PubMed]
- Zhou, X.; Hu, J.; Zhang, C.; Zhang, G.; Zhang, Y. Assembling multidomain protein structures through analogous global structural alignments. Proc. Natl. Acad. Sci. USA 2019, 116, 15930–15938. [Google Scholar] [CrossRef] [Scilit] [PubMed]

Disclaimer/Publisher’s Note: The statements, opinions and data contained in all publications are solely those of the individual author(s) and contributor(s) and not of MDPI and/or the editor(s). MDPI and/or the editor(s) disclaim responsibility for any injury to people or property resulting from any ideas, methods, instructions or products referred to in the content. |
© 2026 by the authors. Licensee MDPI, Basel, Switzerland. This article is an open access article distributed under the terms and conditions of the Creative Commons Attribution (CC BY) license.