


Simple Summary
Reservoirs create shoreline zones that are periodically flooded and exposed. These changing conditions can trigger landslides and bank collapses, which may affect the plants growing there. However, it is not clear whether the risk of such hazards is linked to the types of plant communities that develop. We surveyed 57 plots at two water levels in the Three Gorges Reservoir shoreline zone, covering four levels of hazard risk. We found that an association between hazard risk and plant community composition was detected in the middle-elevation band but not in the high-elevation band. Several species were suggested as candidate indicators of particular risk classes, including Phyllanthus virgatus for the moderate-risk class and Acalypha australis for the high-risk class. These candidates require further validation, but our findings can help managers decide where to focus monitoring in areas prone to landslides and bank collapses.
Abstract
Large-scale water conservancy projects create water level fluctuation zones with alternating submergence and exposure, where geological hazards are frequent. While the inundation regime is known to drive vegetation patterns, the association between geological hazard risk and plant communities at the species level remains poorly understood. We surveyed 57 plots in the middle-elevation band (155–165 m) and high-elevation band (165–175 m) in the water level fluctuation zones of the Three Gorges Reservoir, spanning four geological hazard risk classes (none, low, moderate, high). Results showed that an association between geological hazard risk and plant community was detected in the middle-elevation band but not in the high-elevation band. This pattern was statistically supported for species richness (interaction p = 0.002). Six species were identified as candidate indicator species, including Phyllanthus virgatus and Cyperus odoratus for the moderate-risk class and Acalypha australis for the high-risk class. Our findings suggest that the middle-elevation band, particularly the moderate-risk class, is a zone where geological hazard risk is associated with plant community patterns, providing candidate indicator species for future monitoring and restoration in geohazard-prone drawdown zones.
1. Introduction
Large-scale water conservancy projects, while regulating river runoff, create water level fluctuation zones (WLFZ) characterized by periodic alternation between inundation and exposure [1,2]. Under this regulated hydrological regime, these areas are subject to severe soil erosion and frequent geological hazards such as landslides and collapses, and have become critical zones affecting the ecological safety of reservoir bank slopes [3,4,5]. Geological hazards and associated slope disturbances can modify local terrain and soil conditions, thereby affecting plant community composition and structure [6,7]. Vegetation in the WLFZs plays an important role in soil stabilization, bank stability, and water conservation [8,9,10]. Therefore, plant communities are not only important responders to environmental changes on reservoir banks but also important components of ecological assessment and restoration [8]. Understanding the distribution patterns and structural characteristics of plant communities in WLFZs under frequent geological hazards is important for the ecological protection and restoration of reservoir-bank slopes.
Geological hazard risk levels are commonly used spatial zoning units in hazard management, reservoir-bank management, and ecological restoration [11]. Therefore, compared with considering hazard susceptibility alone, assessing whether different risk levels correspond to identifiable vegetation differences has more direct management implications. Geological hazard risk reflects both susceptibility to hazard occurrence and its potential consequences, including the exposure and vulnerability of people, infrastructure, and other assets [11]. Susceptibility is influenced by environmental conditions such as topography, geology, hydrology, and slope characteristics [11,12]. Many of these environmental conditions also influence plant community distribution and composition, particularly in reservoir WLFZs where inundation regimes and soil conditions strongly structure vegetation patterns [13]. Therefore, plant communities may reflect environmental differences associated with the susceptibility component of risk, but whether they can distinguish geological hazard risk levels that also incorporate potential consequences remains unclear. Previous studies have shown that vegetation characteristics are closely related to landslide activity and slope stability [14,15], indicating close links between plant communities and processes such as slope instability, erosion, and substrate disturbance. However, direct evidence linking plant community characteristics to geological hazard risk levels remains limited. In addition, because regulated water-level fluctuations strongly influence vegetation composition and diversity in WLFZs [2,13] and can also contribute to bank instability, it is necessary to determine whether vegetation differences among risk levels remain consistent across different water-level bands.
While community-level comparisons provide a basis for this assessment, species-level analyses can further identify the species associated with particular risk levels. Indicator species analysis is an effective method for identifying species significantly associated with particular environmental conditions or ecological groups [16], and has been widely used in vegetation-environment studies (e.g., [17,18,19]). Several studies in water level fluctuation zones have used indicator species analysis to identify species indicative of the water level gradient [20,21,22]. However, it remains unclear whether particular species are consistently associated with different geological hazard risk levels and which species may serve as potential indicators of individual risk levels. This species-level knowledge gap is important because indicator species can help reveal differences in species composition among risk levels and may provide useful references for species selection in ecological monitoring and restoration [23]. These gaps highlight the need for empirical research at both the community and species levels.
The WLFZ of the Three Gorges Reservoir (TGR) is a typical area subject to both extreme hydrological fluctuations and frequent geological hazards [4,24]. Reservoir operation causes annual water-level fluctuations between approximately 145 and 175 m, creating a WLFZ with a vertical range of about 30 m [1,2]. Repeated cycles of inundation, exposure, and weathering can progressively weaken slope materials, while hydrodynamic processes such as wave erosion and seepage pressure further intensify bank instability [3,25], contributing to frequent landslides and collapses [4,24]. Therefore, the WLFZ of the TGR provides an ideal setting for examining the relationships between geological hazard risk and vegetation under strong water-level fluctuations. Previous studies have extensively investigated water-level-driven vegetation dynamics in the WLFZ of the TGR (e.g., [8,26]) and have conducted numerous geological hazard risk assessments (e.g., [4,24]). Recent research has also explored the use of plant diversity in bank-slope stability assessment [27], demonstrating the potential application of vegetation characteristics in slope stability evaluation. However, direct evidence linking plant communities to geological hazard risk levels remains scarce in this region, especially across different elevation bands.
To fill up these knowledge gaps, we investigated vegetation along the water-level gradient of the WLFZ of the TGR and combined community-level metrics with indicator species analysis to assess whether identifiable vegetation differences exist among geological hazard risk levels. Specifically, we addressed two questions: (1) At the community level, do species richness, vegetation cover, diversity, and biomass differ among risk levels, and are these differences consistent across water-level bands? (2) At the species level, which plant species are significantly associated with different risk levels and may serve as potential indicators of those risk levels? By addressing these questions, this study aims to describe the association between geological hazard risk levels and plant community characteristics and to explore the potential of vegetation as an auxiliary ecological indicator for risk zoning, thereby providing a scientific basis for ecological assessment, vegetation monitoring, and ecological restoration of reservoir-bank slopes.
2. Materials and Methods
2.1. Study Area
The study area is located in the water-level fluctuation zone (WLFZ) of the Three Gorges Reservoir (TGR), spanning four typical counties: Zhongxian, Fuling, Wushan, and Fengjie. This region has a subtropical humid monsoon climate, with a mean annual temperature of 17–19 °C and a mean annual precipitation of 1000–1200 mm. The main soil types are purple soil and yellow soil, with a soil depth generally ranging from 30 to 80 cm and a silty loam texture. The vegetation is predominantly herbaceous, with common dominant species including Cynodon dactylon, Persicaria lapathifolia, Xanthium strumarium, Cyperus rotundus, Hemarthria sibirica, and Abutilon theophrasti. Since the TGR was fully impounded in 2010, the reservoir has been operated under a winter impoundment—summer drawdown schedule: the water level rises from September, peaks at 175 m a.s.l. in November, and recedes to 145 m a.s.l. by the following May, exposing the water level fluctuation zones for summer growth. This seasonal hydrologic regime has created a distinct elevation gradient corresponding directly to the water level gradient, with higher elevations experiencing shorter inundation durations and vice versa. This gradient has thus become the primary driver of vegetation zonation in the WLFZ.
2.2. Geological Hazard Risk Classification
The geological hazard risk classes used in this study were obtained from a pre-existing comprehensive geological hazard assessment conducted by a qualified professional agency at the Three Gorges Reservoir scale. The assessment integrated geological hazard susceptibility and element-at-risk vulnerability: susceptibility was evaluated at the slope-unit scale considering topographic, lithological, hydrological conditions and vegetation cover (NDVI); vulnerability was assessed based on the exposure and coping capacity of population, infrastructure, and land use. The assessment covered the broader reservoir area, not only the water level fluctuation zones. The integrated assessment assigned each slope unit to one of four risk classes: none, low, moderate, and high. In this study, we directly adopted the classification results as pre-existing management zoning units and did not reconstruct or re-validate the classification; the detailed modelling parameters of the assessment are held by the assessment agency and are beyond the scope of this study. These classes are used as categorical descriptors of management risk, not as independently measured physical disturbance intensities.
2.3. Vegetation Survey
A stratified sampling method was used to divide the 145–175 m elevation range into three zones: low elevation (145–155 m), middle elevation (155–165 m), and high elevation (165–175 m). These bands correspond to different inundation histories rather than to water level at the time of sampling; throughout the text we refer to them as elevation bands. The low-elevation band was represented by only three plots due to accessibility constraints during the sampling period and was excluded from the core statistical analyses. The core dataset therefore comprised 57 plots: 31 in the middle-elevation band (none: 10, low: 6, moderate: 6, high: 9) and 26 in the high-elevation band (none: 6, low: 6, moderate: 5, high: 9). The distribution of plots across counties is provided in Table S1. Within each county, sampling sites were separated by at least 1 km. At each site, 2–3 replicate plots were established on the same slope, with distances of approximately 200–300 m between plots. Each plot measured 1 m × 1 m, and spatial coordinates (longitude, latitude) and topographic variables (elevation, slope, aspect) were recorded. A total of 11 independent slope units were identified. The number of plots per slope unit ranged from 1 to 6, and 10 of the 11 slope units spanned two elevation bands (Table S2). The correspondence between plots and slope units is provided in Table S3. The vegetation survey was conducted in July 2025 during the peak growing season. Within each plot, all vascular plant species were recorded, along with species name, height (cm), cover (%), and density (individuals·m−2). For clonal plants, a ramet with an independent root system was counted as one individual.
2.4. Community Metrics and Importance Values
Species richness was defined as the total number of species recorded in each plot. Community total cover was the percentage of ground surface covered by plant vertical projections. The Shannon diversity index was calculated based on species cover data using the formula , where pi is the cover of species i divided by the sum of the covers of all species in the plot, so that the proportions sum to one, and S is the number of species. Aboveground biomass was harvested at ground level within each plot, oven-dried at 70 °C for at least 48 h until constant weight, and weighed.
Importance value (IV) was calculated separately for each risk class at the middle-elevation band using a pooled approach across all plots within each risk class: relative abundance was calculated as the total number of individuals of a species divided by the total number of individuals of all species across all plots within that risk class; relative frequency as the number of plots in which a species occurred divided by the sum of occurrence frequencies of all species within that risk class; and relative dominance as the species’ total cover divided by the total cover of all species within that risk class. IV = (Relative abundance + Relative frequency + Relative dominance)/3.
2.5. Statistical Analyses
All statistical analyses were performed in R version 4.3.2. Species richness, community coverage, Shannon diversity, and aboveground biomass were analyzed with linear models including risk class, elevation band, and their interaction. Because slope units were purposively selected by risk class rather than randomly sampled, cluster-robust standard errors clustered by slope unit were used instead of mixed-effects models. The variance-covariance matrix was estimated using vcovCL 3.1.3 with an HC1 small-sample correction, clustered by slope unit. Joint Wald tests were used for the main risk effect and the interaction, and Tukey contrasts with cluster-robust standard errors and Benjamini–Hochberg adjustment were used for pairwise comparisons. As a sensitivity check, plot values were averaged by slope unit × elevation band and risk effects were re-tested at the slope-unit level.
Bray–Curtis distances were calculated from species coverage data. NMDS was used for ordination. PERMANOVA was used to test risk class, elevation band, and their interaction; the overall model (Community composition ~ Risk class × Elevation band) used restricted permutation within slope units (blocks = slope unit) and marginal tests, and the slope-unit-level analysis (Mean community composition ~ Risk class) was used for the risk main effect because risk class is constant within slope units. Within-band PERMANOVA (Community composition ~ Risk class) used the individual plot as the exchangeable unit with unrestricted permutation. Multivariate dispersion was tested with betadisper and permutest.
Species coverage data were Hellinger-transformed before RDA. Risk class and elevation band were treated as categorical factors. The full RDA model (Community composition ~ Risk class + Elevation band) was tested with unrestricted permutation. Adjusted R2, marginal permutation tests, and variance partitioning were used to quantify independent and shared contributions. Indicator species analysis was restricted to the middle-elevation band (n = 31) to avoid confounding by elevation-related species turnover. The IndVal.g function in the indicspecies package was used with risk class as the grouping variable and 9999 permutations. IndVal values ≥ 0.5 were used as a descriptive benchmark for candidate indicators; species with raw p < 0.05 and IndVal ≥ 0.5 but non-significant after BH adjustment were reported as candidate indicators, not as statistically confirmed indicators.
3. Results
3.1. Community Structural Metrics Across the Geological Hazard Risk Classes and Elevation Bands
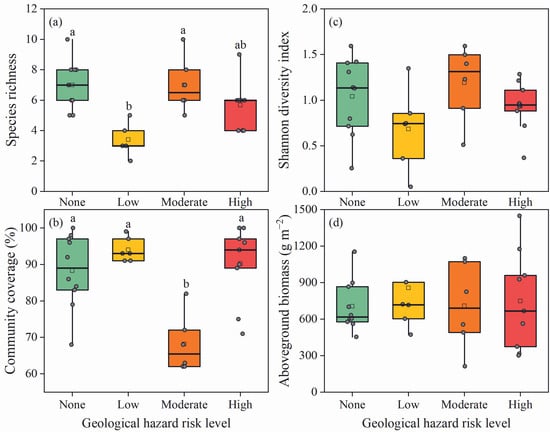
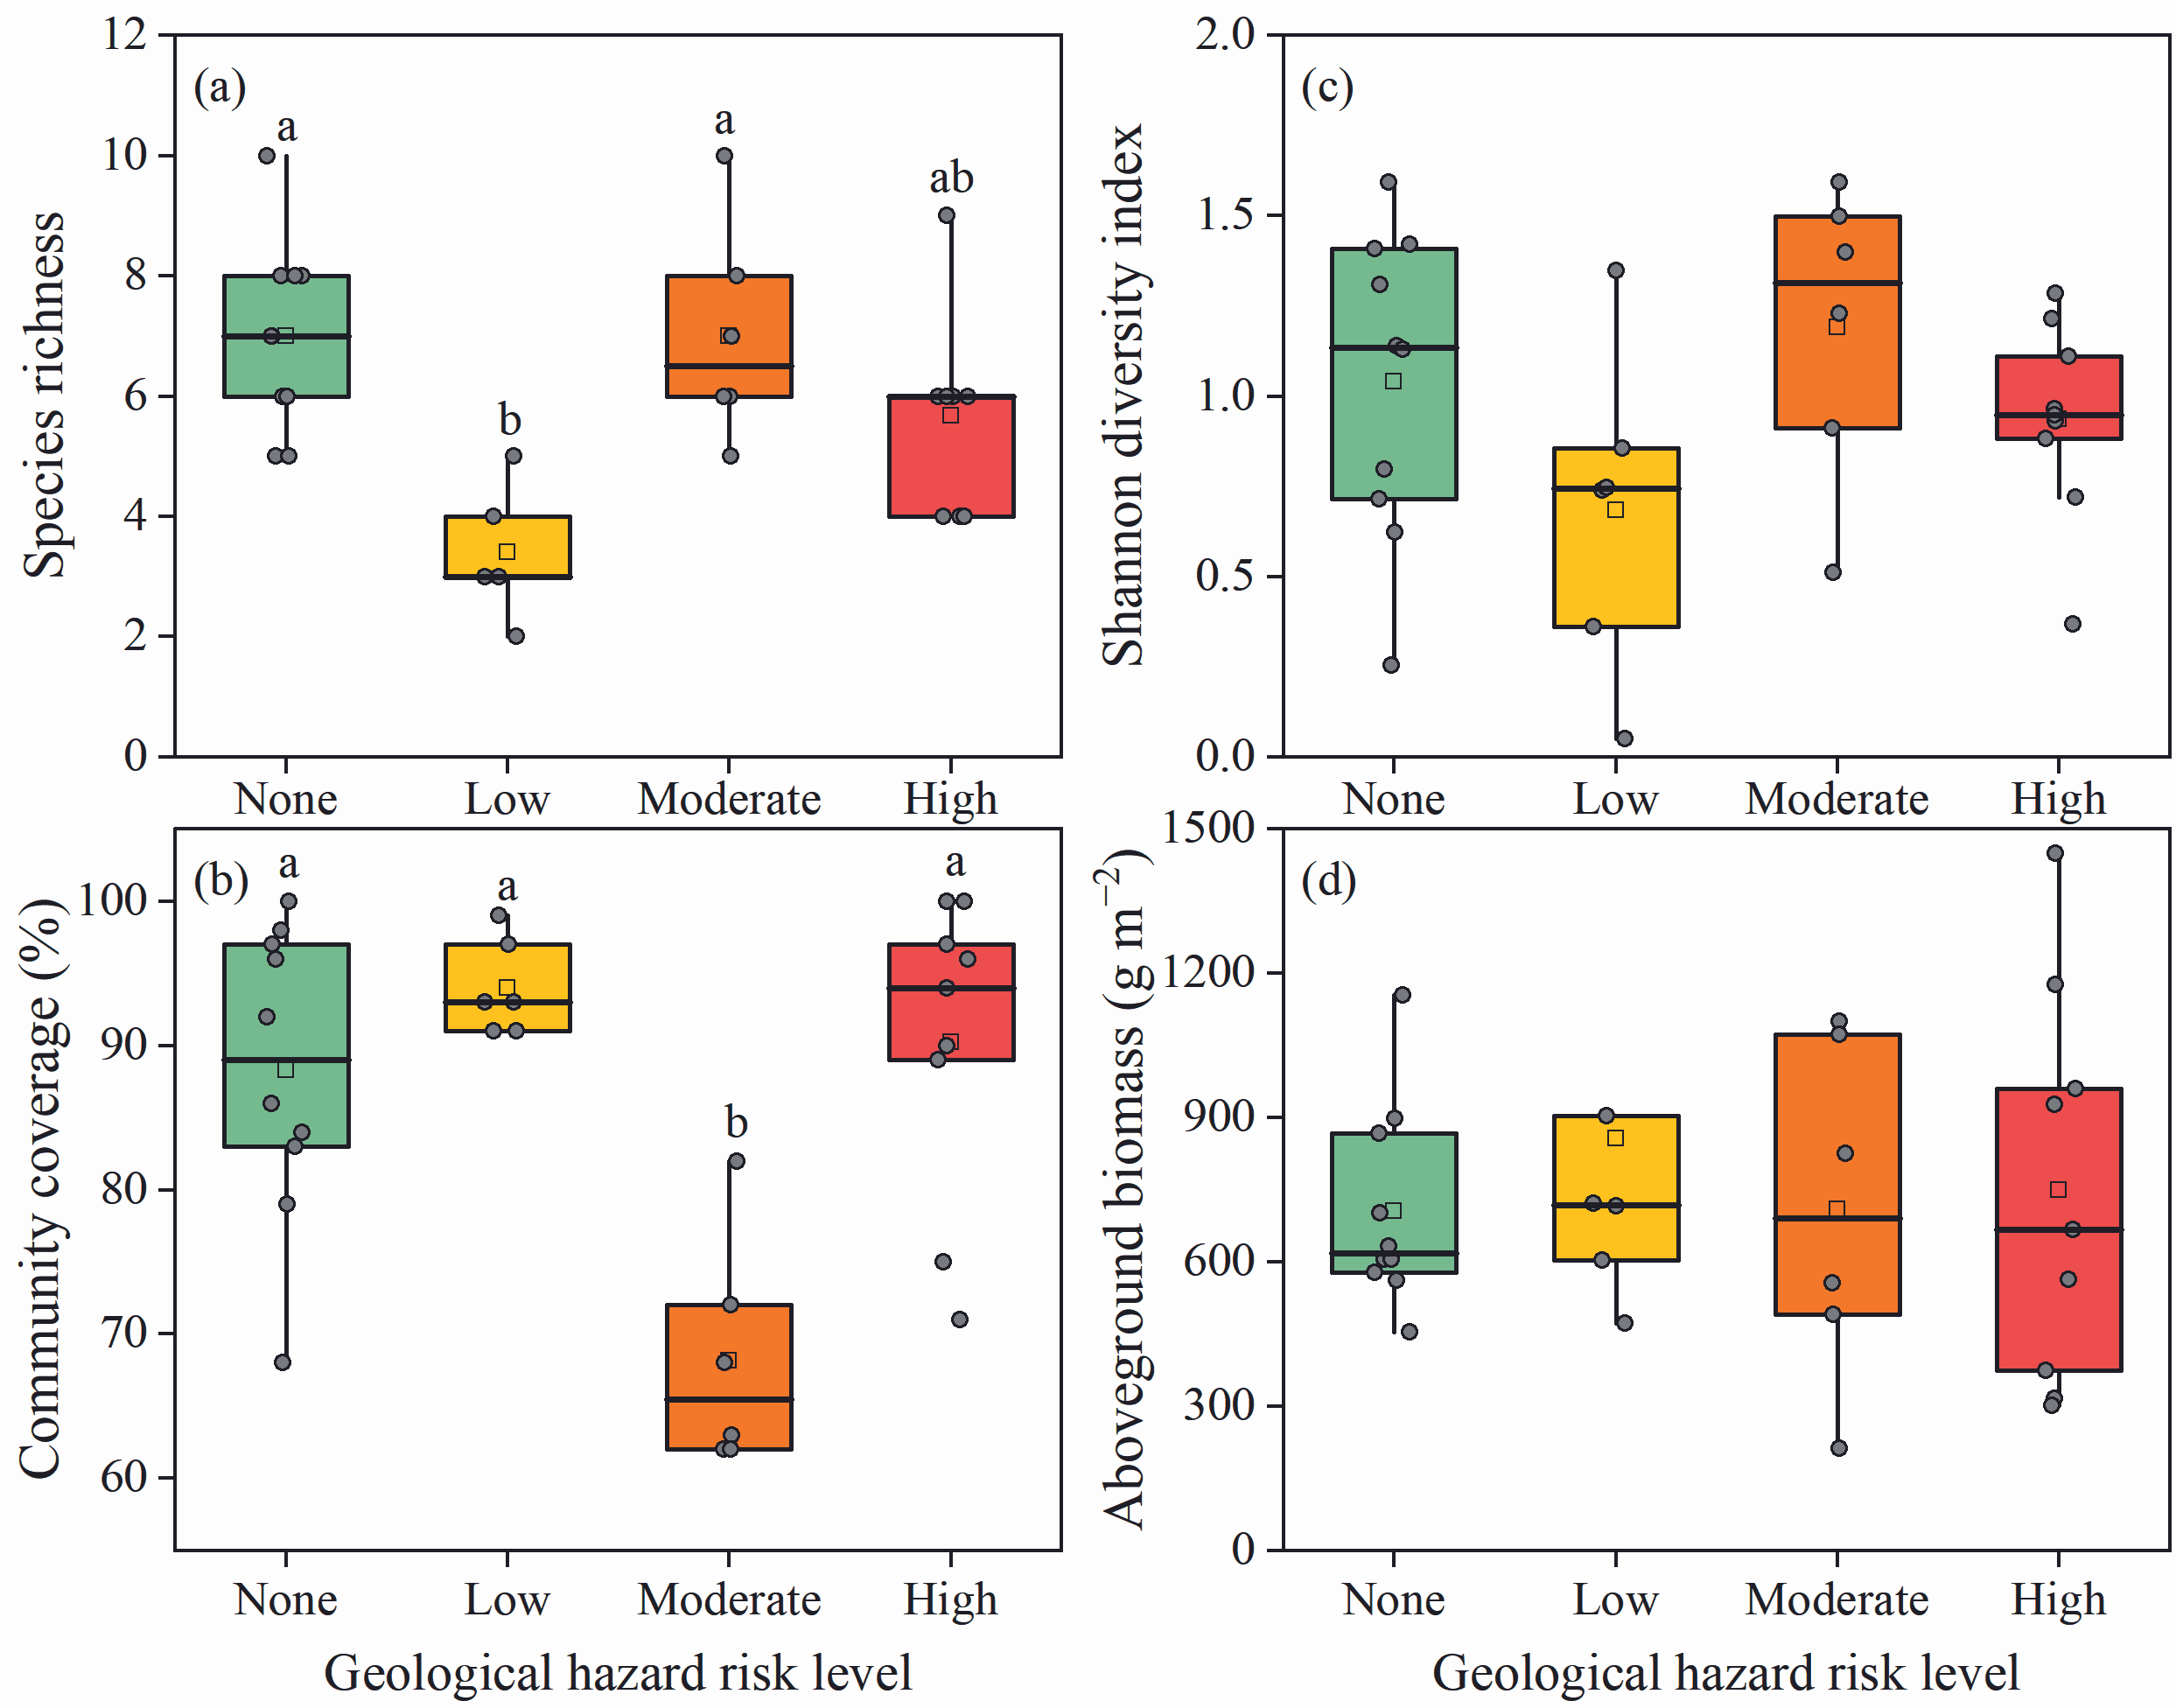
In the pooled model, the risk × elevation-band interaction was significant for species richness (F = 5.62, df = 3, 49, p = 0.002) but not for cover, Shannon diversity, or biomass (all p > 0.05). The risk main effect was significant for richness, cover, and Shannon diversity (all p < 0.05) but not biomass (p = 0.154; Table S4). At the middle-elevation band (155–165 m), richness, cover, and Shannon diversity differed significantly among risk classes (all p < 0.001), whereas biomass did not (p = 0.156). Species richness was lowest in the low-risk class (3.40 ± 1.14), significantly lower than in the no-risk and moderate-risk classes (both 7.00; p < 0.05; Figure 1). Coverage was lowest in the moderate-risk class (68.2% ± 7.86%), significantly lower than in the no-risk, low-risk, and high-risk classes (p < 0.05; Figure 1).
Figure 1.
Community structural metrics among geological hazard risk classes within the middle-elevation band (155–165 m). (a) Species richness; (b) Community cover; (c) Shannon diversity; (d) Aboveground biomass. Different lowercase letters above boxes indicate significant differences among risk classes (p < 0.05). No letters are shown for Shannon diversity because no pairwise contrast remained significant after Benjamini–Hochberg adjustment. Boxes show median and interquartile range; whiskers extend to 1.5× the interquartile range; open diamonds indicate means; grey dots represent raw data points (individual plots).
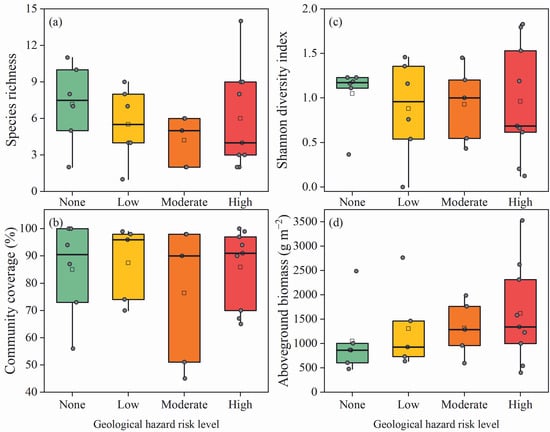
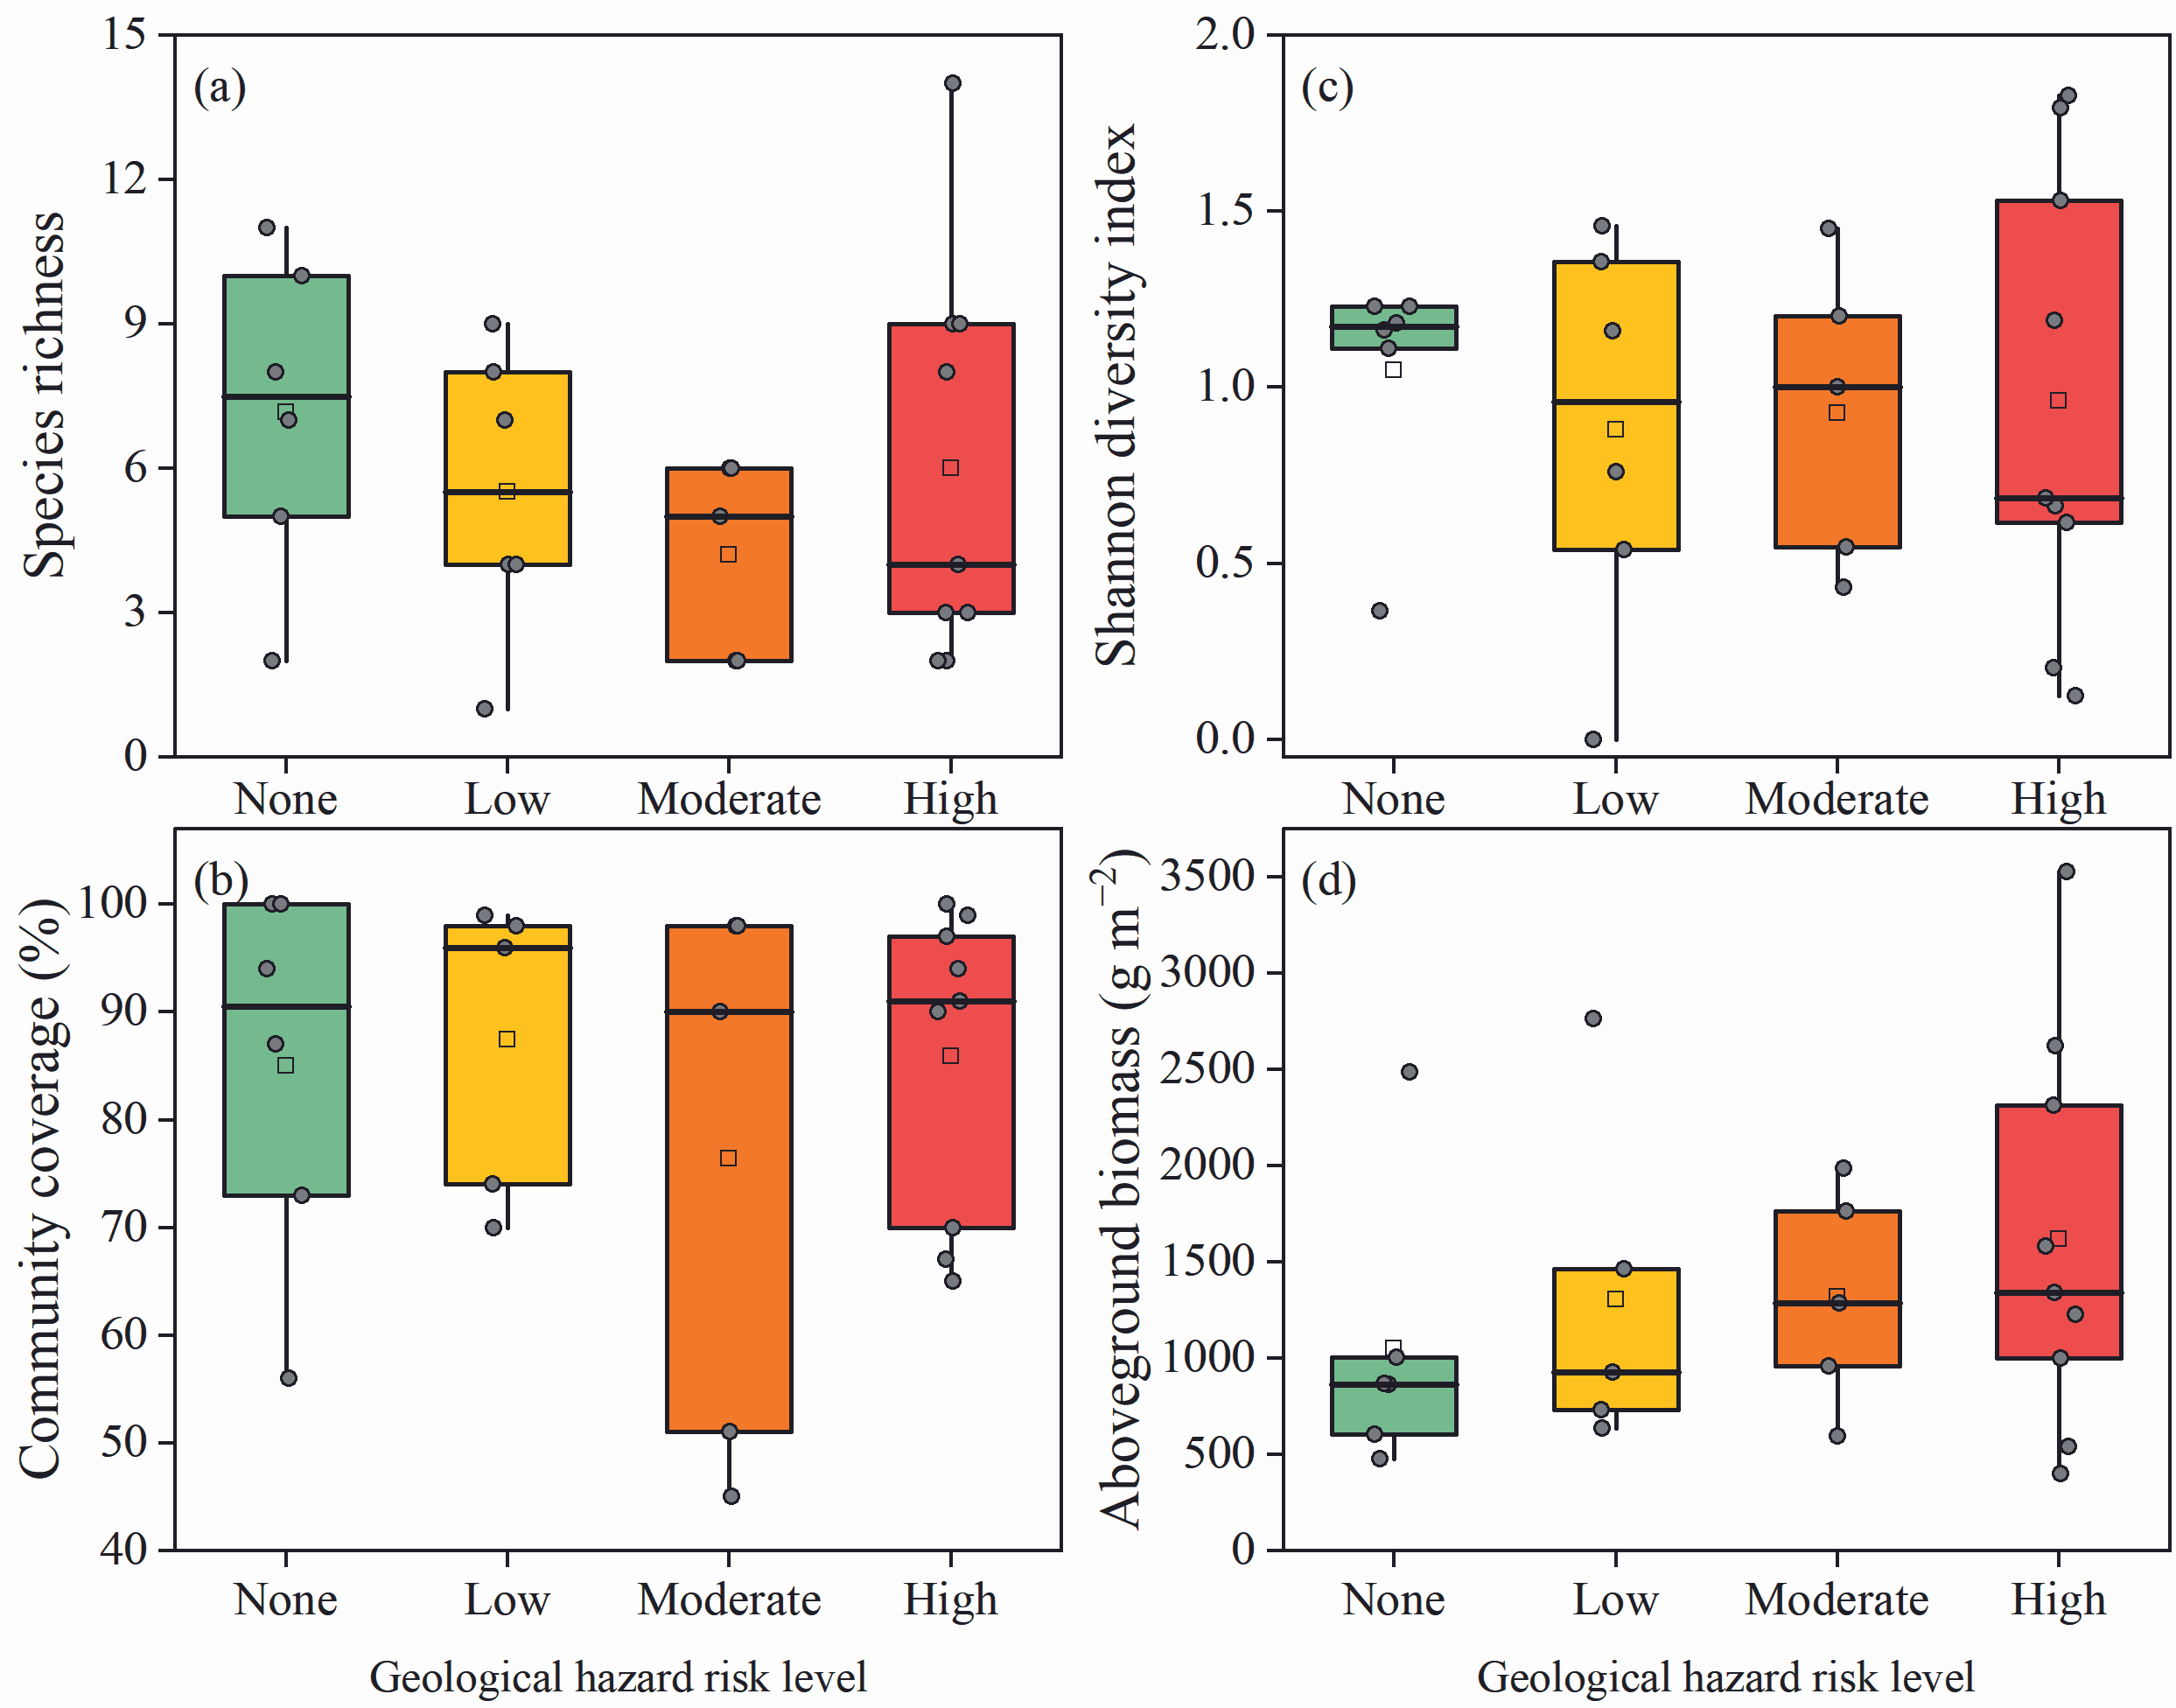
A slope-unit-level aggregation analysis (n = 11) showed a marginal risk effect on richness in the middle band (p = 0.068), consistent in direction with the plot-level result; other metrics were not significant at this level, but the number of units per risk class (2–4) limited power (Table S4). At the high-elevation band (165–175 m), no community metrics differed among risk classes (all p > 0.05; Figure 2).
Figure 2.
Community structural metrics among geological hazard risk classes within the high-elevation band (165–175 m). (a) Species richness; (b) Community cover; (c) Shannon diversity; (d) Aboveground biomass. Boxes show median and interquartile range; whiskers extend to 1.5× the interquartile range; open diamonds indicate means; grey dots represent raw data points (individual plots).
3.2. Community Composition in Relation to Geological Hazard Risk Classes and Elevation Bands
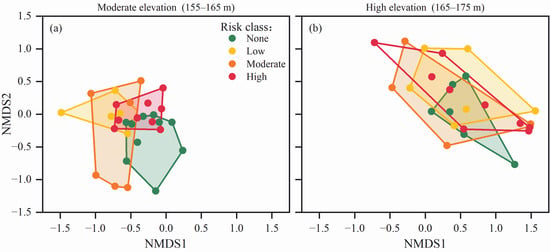
NMDS ordination showed partial differentiation by elevation band, with appreciable overlap among geological hazard risk classes within each band (stress = 0.164; Figure 3). Separate PERMANOVA within each elevation band showed that risk class was significantly associated with community composition in the middle-elevation band (R2 = 0.217, p = 0.003) but not in the high-elevation band (R2 = 0.080, p = 0.908; Table S5). A slope-unit-level PERMANOVA pooling both elevation bands showed no significant association between risk class and composition (R2 = 0.293, p = 0.534, n = 11; Table S5). In the overall model, the elevation band had a significant main effect (R2 = 0.169, p < 0.001), whereas the risk × elevation-band interaction (R2 = 0.060, p = 0.133; Table S5) was not significant. Multivariate dispersion was homogeneous across risk classes (p = 0.399) but marginally heterogeneous across elevation bands (p = 0.066; Table S5).
Figure 3.
NMDS ordination of plant community composition at the middle- and high-elevation bands. Different colors represent different geological hazard risk classes (none, low, moderate, high); convex hulls indicate the distribution range of each group. (a) 155–165 m; (b) 165–175 m.
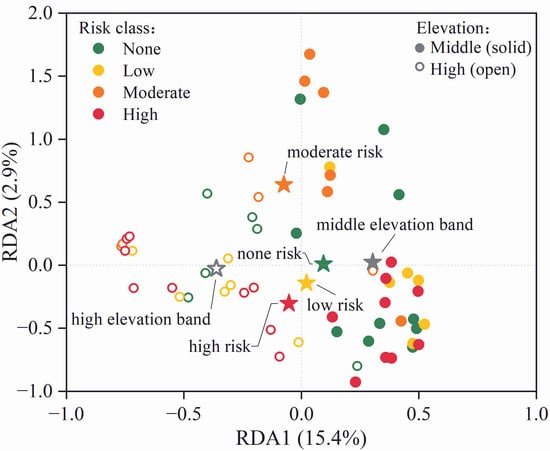
RDA showed that risk class and elevation band together explained 21.5% of the total variation in community composition (adjusted R2 = 0.154, p = 0.001; Figure 4). Marginal tests indicated that elevation band explained 14.1% independently (F = 9.83, p = 0.001), whereas risk class explained 1.8% independently (F = 1.40, p = 0.077); shared variance was negligible (Table S5).
Figure 4.
Redundancy analysis (RDA) biplot of community composition constrained by geological hazard risk class and elevation band. Solid circles represent individual plots, colored by risk class and shaped by elevation band. Large stars indicate group centroids for each risk class and elevation band; the leader lines connect centroids to their labels.
3.3. Indicator Species Analysis
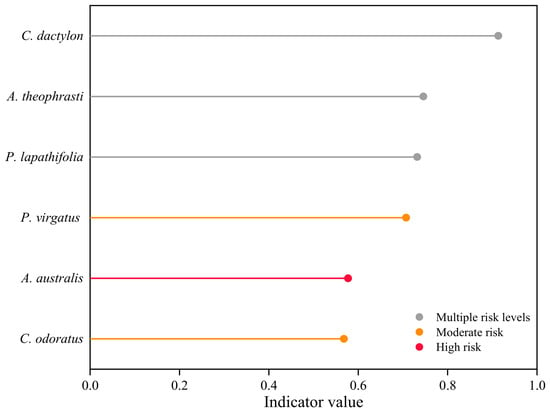
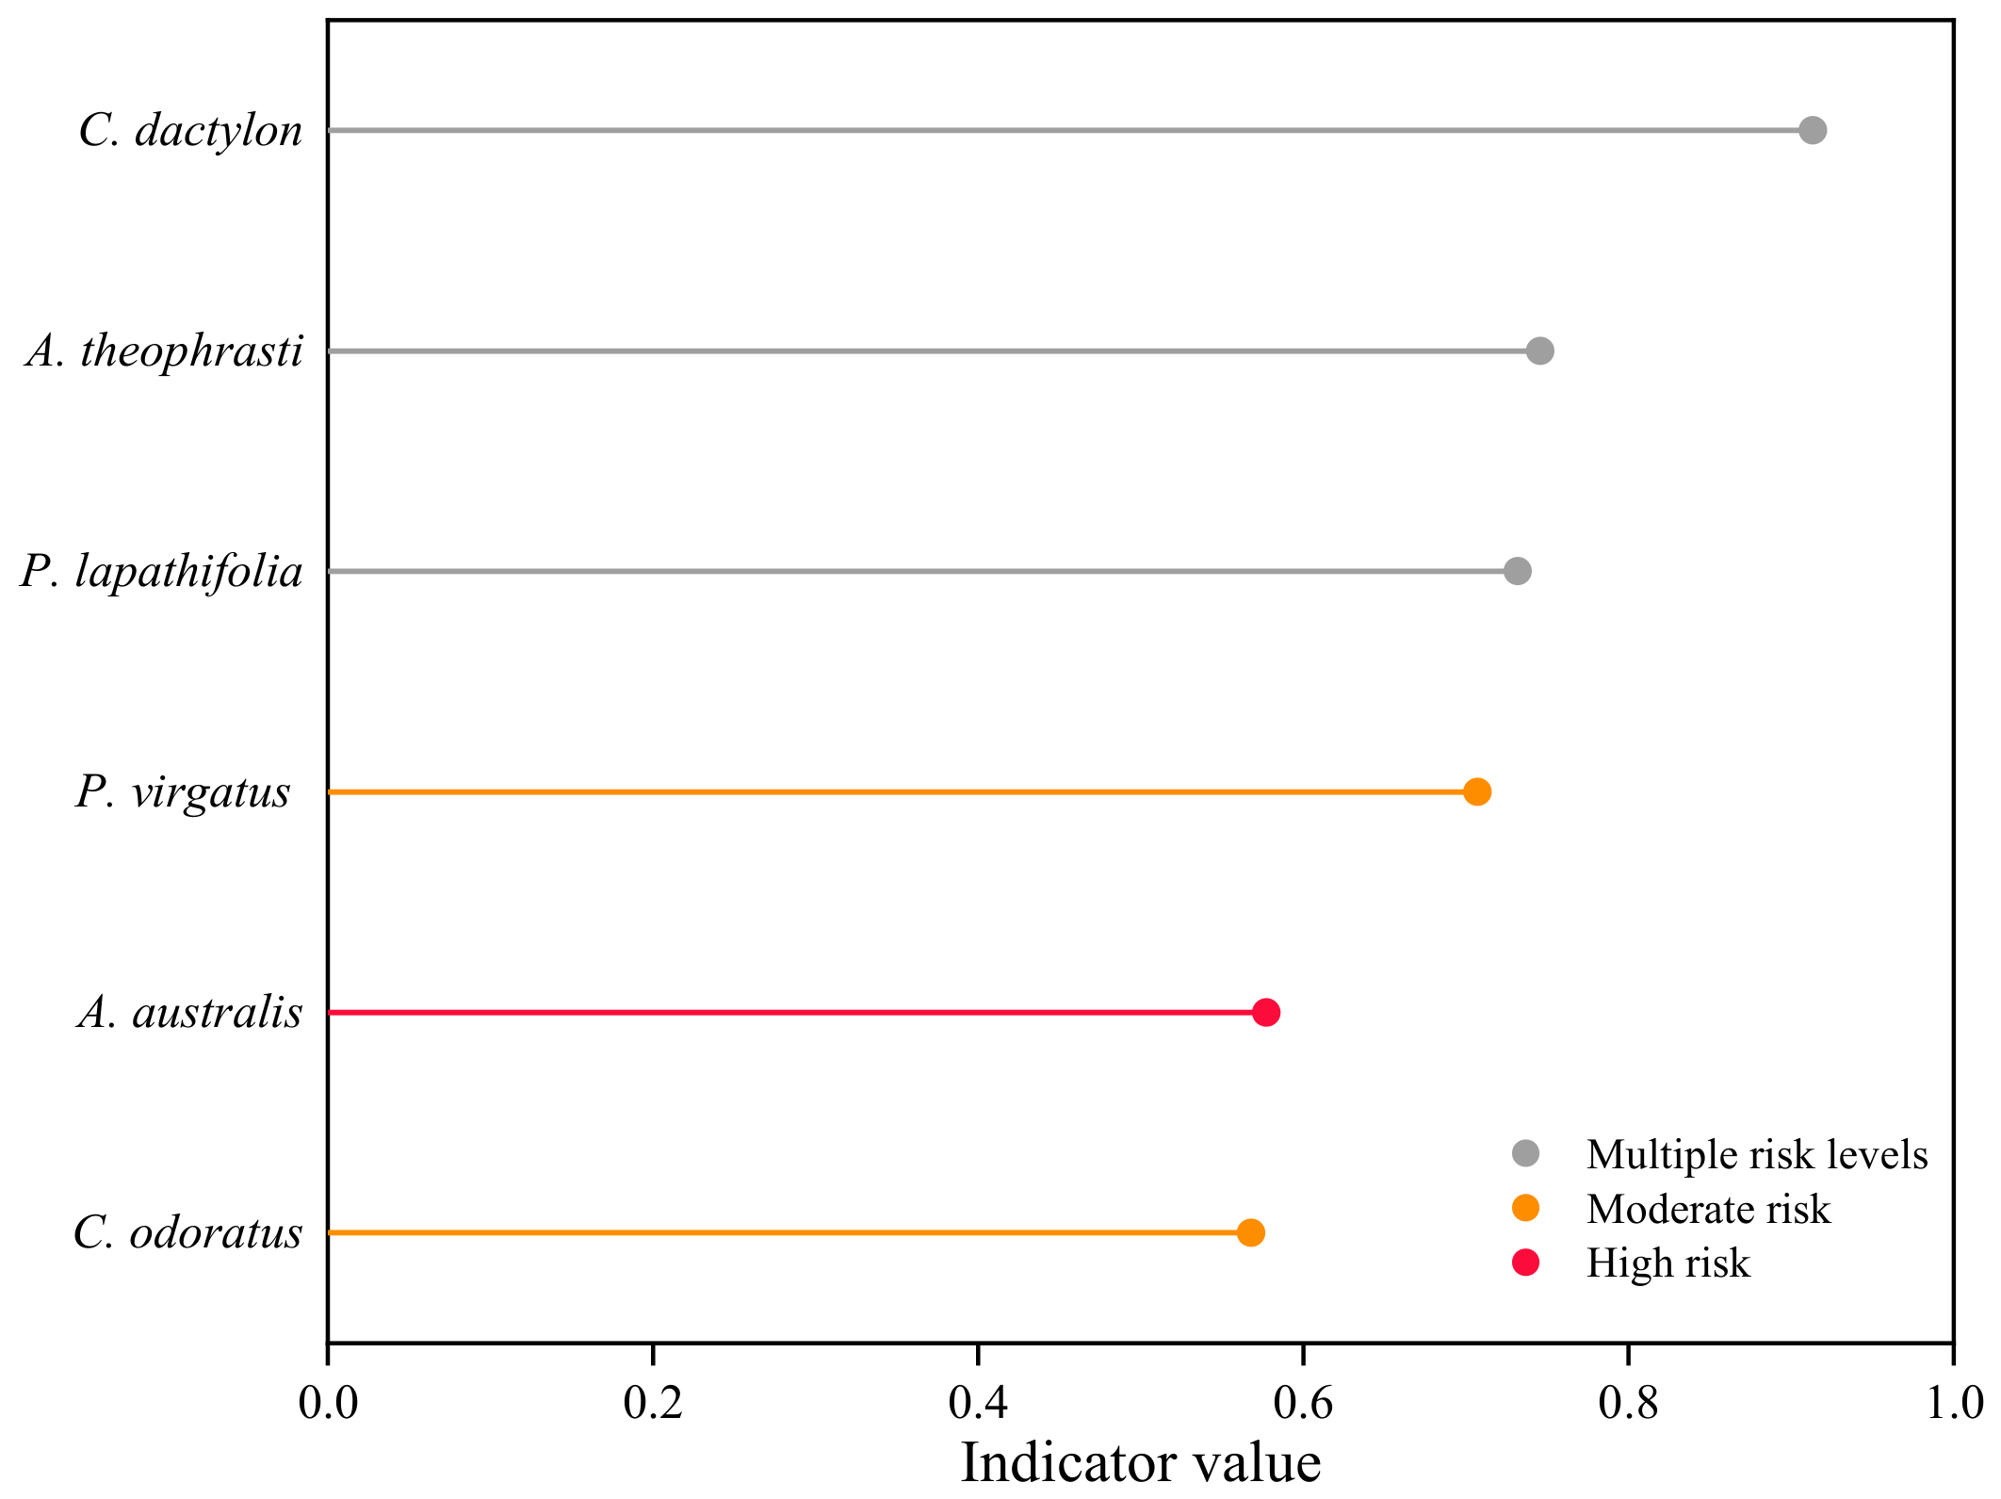
At the middle-elevation band, six species showed raw indicator values significant at p < 0.05 and IndVal ≥ 0.5 (Figure 5; Table S6), ranging from 0.568 to 0.913. C. dactylon was associated with no-risk, low-risk, and high-risk classes (IndVal = 0.913). A. theophrasti was associated with no-risk and low-risk classes (0.746). Persicaria lapathifolia was associated with no-risk and moderate-risk classes (0.732). Phyllanthus virgatus (0.707) and Cyperus odoratus (0.568) were significantly associated with the moderate-risk class, while Acalypha australis was significantly associated with the high-risk class (0.577). After Benjamini–Hochberg adjustment, no species remained significant (all adjusted p >0.05; Table S6).
Figure 5.
Indicator species of geological hazard risk classes in the middle-elevation band (n = 31). Bar length represents IndVal; colors indicate the risk level(s) with which each species was associated at raw p < 0.05. No species remained significant after Benjamini–Hochberg adjustment; species are therefore shown as candidate indicators.
Occurrence patterns were consistent with the IndVal results. P. virgatus occurred in three of six moderate-risk plots from two slope units and in none of the other risk classes; A. australis occurred in three of nine high-risk plots and in no other class; C. odoratus occurred in two of six moderate-risk plots and in one no-risk plot from two slope units; C. dactylon occurred in most plots across all risk classes; P. lapathifolia and A. theophrasti were associated with two-risk combinations (none + moderate and none + low, respectively). Full occupancy data are provided in Table S6.
3.4. Importance Value of Dominant Species at the Middle-Elevation Band
C. dactylon remained a dominant species in all four risk classes, with importance values of 44.7, 49.0, 16.0, and 48.7 in the none, low, moderate, and high-risk classes, respectively (Table 1). Its importance value was notably lower in the moderate-risk class (16.0) than in the other three classes (44.7–49.0). The remaining top-five species varied among risk classes: X. strumarium, P. lapathifolia, A. theophrasti, and Digitaria sanguinalis in the no-risk class; C. rotundus, A. theophrasti, D. sanguinalis, and Kyllinga polyphylla in the low-risk class; C. rotundus, P. lapathifolia, Melilotus suaveolens, and C. odoratus in the moderate-risk class; and C. rotundus, X. strumarium, Echinochloa crus-galli var. mitis, and Eclipta prostrata in the high-risk class.
Table 1.
Top five species by importance value (%) within each risk class at the middle-elevation band.
4. Discussion
4.1. The Middle-Elevation Band as a Zone of Detectable Risk Association with Plant Communities
Our study found that an association between geological hazard risk and plant community was detected in the middle-elevation band (155–165 m) but not in the high-elevation band (165–175 m). This pattern was statistically supported for species richness (interaction p = 0.002), whereas for community composition, the overall interaction was not significant. These results indicate that the middle-elevation band is a zone where the risk association is detectable, particularly for species richness.
The detection in the middle-elevation band may be related to its intermediate inundation position. Within the 145–175 m elevation range of the TGR, the low-elevation band (145–155 m) experiences the longest annual inundation (approximately 240 days). Under prolonged flooding stress, the community is dominated by a few flood-tolerant species, is structurally simple, and has limited capacity to respond to additional disturbances [28]. In contrast, the high-elevation band has the shortest annual inundation (approximately 30–60 days), with relatively stable habitats dominated by competitive species that buffer more effectively against episodic disturbances [29]. The middle-elevation band, located between these two extremes, experiences approximately 120–180 days of annual inundation, a moderate level of flooding stress. Plant communities in this band experience both water level fluctuations and slope erosion processes [8]; they do not exhibit the species-poor, structurally simplified state of the low-elevation band [13,30], nor the stable buffering capacity of the high-elevation band [31]. This intermediate state, characterized by both resource availability and competitive instability, may render the community more responsive to additional environmental perturbations [29,32].
This inference is consistent with evidence from multiple research lines. Soil aggregate stability and erosion resistance exhibit marked changes in this elevation band [33,34], and microbial community assembly also shifts significantly across this interval [35]. Plant community studies have shown that species diversity can peak under moderate inundation [36,37], and invasive plants preferentially colonize intermediate elevations [38]. Although these studies addressed different processes, all lines of evidence indicate that the 155–165 m interval is an ecologically active elevation band within the water level fluctuation zones. This ecological activity may arise from the combined influence of multiple environmental factors rather than from any single factor.
4.2. Candidate Indicator Species Across Geological Hazard Risk Classes at the Middle-Elevation Band
At the middle-elevation band, species composition differed among geological hazard risk classes. The candidate indicator species associated with the moderate-risk class were P. virgatus and C. odoratus. This species-level pattern was consistent with several changes in community characteristics in the moderate-risk class, including the jointly highest species richness with the no-risk class (both 7.00), the lowest total cover (68.2%), and the lowest importance value of C. dactylon among the four risk classes (16.0; Table 1). The occurrence of moderate-risk candidates may be related to the weakening of dominant species status. In the no-risk zone, the importance value of C. dactylon reached 44.7, far exceeding that of other species, and its stoloniferous growth and rapid clonal reproduction enabled it to establish a competitive monopoly in stable habitats [39]. In the moderate-risk zone, the importance value of C. dactylon dropped to 16.0; the range among the top five species narrowed to 12.0 compared with 41.0 in the no-risk class and 46.0 in the high-risk class; C. odoratus entered the top five, and the importance values of C. rotundus and P. lapathifolia increased. This pattern is consistent with the general pattern of dominant-species decline and subordinate-species increase in disturbance ecology [32,40], though the underlying ecological mechanisms require future testing.
The association of A. australis with the high-risk class may be related to slope processes specific to that class, because the importance value of C. dactylon remained high at 48.7 in the high-risk class and its dominant status was not weakened. The occurrence of A. australis therefore did not follow the pattern of declining dominant-species importance and may be related to local slope processes, although this interpretation requires further testing. In contrast, C. dactylon had a high IndVal (0.913) but occurred widely across all risk classes and was the dominant species in all four classes (Table 1), indicating that it is a generalist rather than a risk-specific candidate. A. theophrasti and P. lapathifolia were associated with combinations of multiple risk classes and showed lower specificity. These distribution patterns indicate that the most common species at the middle-elevation band were not sensitive to risk class, and that risk-specific candidates were limited to a small number of species.
4.3. Management Implications and Limitations
This study has two management implications. First, future ecological monitoring could prioritize the middle-elevation band (155–165 m), particularly the moderate-risk class, as a target area for validating these preliminary patterns. Second, candidate indicator species such as P. virgatus can guide future monitoring and hypothesis-driven validation, but they require further validation before being used as management indicators. In addition, this study has several limitations. The low-elevation band (145–155 m) was represented by only three plots and was excluded from the core analyses, limiting our ability to characterize the full inundation gradient. The survey was also based on a single season (July 2025) and cannot capture temporal dynamics or long-term succession. Future studies should include additional sampling at low water levels and repeated surveys to further verify our findings.
5. Conclusions
The association between geological hazard risk and plant community was detected at the plot level in the middle-elevation band (155–165 m) but not in the high-elevation band (165–175 m), and this pattern was statistically supported for species richness. Six species were suggested as candidate indicator species, including Phyllanthus virgatus and Cyperus odoratus for the moderate-risk class and Acalypha australis for the high-risk class. The middle-elevation band, particularly the moderate-risk class, can be prioritized for future monitoring, and these candidate species provide concrete targets for validation in cross-season and larger-scale studies.
Supplementary Materials
The following supporting information can be downloaded at: https://www.mdpi.com/article/10.3390/biology15222094/s1, Table S1: Distribution of plots across county, elevation band, and risk class; Table S2: Summary of the 11 independent slope units; Table S3: Correspondence between plots and slope units; Table S4: Fixed effects of geological hazard risk class, elevation band, and their interaction on community structural metrics; Table S5: Multivariate analyses of community composition in relation to geological hazard risk classes and elevation bands; Table S6: Indicator species analysis at the middle-elevation band (n = 31).
Author Contributions
Z.W.: Conceptualization, data curation, formal analysis, funding acquisition, investigation, writing—original draft. Y.G.: Supervision, writing—review & editing. Y.L.: Funding acquisition, conceptualization, data curation, investigation, writing—original draft. All authors have read and agreed to the published version of the manuscript.
Funding
This work was supported by the Geological Disaster Patterns and Mitigation Strategies Under River–Reservoir Hydrodynamics in the Three Gorges Reservoir Fluctuation Zone (No. 5000002024CC20004), and the National Natural Science Foundation of China (No. 42101074).
Data Availability Statement
Data are available from the authors upon reasonable request.
Acknowledgments
We thank experimentalists Zhi Ding, Pujia Yu, Yuanqing Li, Feng Qian, and Debing Kong of Southwest University for providing the Primacs SNC200-IC-E, the Total Nitrogen-Speciation Carbon Analyzer.
Conflicts of Interest
Author Yutao Gao is employed by the company PowerChina Chengdu Engineering Corporation Limited. The remaining authors declare that the research was conducted in the absence of any commercial or financial relationships that could be construed as a potential conflict of interest.
References
- Bao, Y.H.; Gao, P.; He, X.B. The water-level fluctuation zone of Three Gorges Reservoir—A unique geomorphological unit. Earth-Sci. Rev. 2015, 150, 14–24. [Google Scholar] [CrossRef] [Scilit]
- Zhu, K.W.; Chen, Y.C.; Zhang, S.; Lei, B.; Yang, Z.M.; Huang, L. Vegetation of the water-level fluctuation zone in the Three Gorges Reservoir at the initial impoundment stage. Glob. Ecol. Conserv. 2020, 21, e00866. [Google Scholar] [CrossRef] [Scilit]
- He, X.; Bao, Y. Research advances on soil erosion and ecological restoration in the riparian zone of the Three Gorges Reservoir. Sci. Soil Water Conserv. 2019, 17, 160–168. [Google Scholar] [CrossRef]
- Li, Z.; Chen, L.; Zhu, Z.; Shi, Q.; Wang, K.; ZHong, Z.; Zhang, G.; Zuo, Q.; Deng, H. Progress and prospects of geological hazards prevention and control in the Three Gorges Reservoir area. J. Wuhan Univ. (Nat. Sci. Ed.) 2026, 72, 175–187. [Google Scholar]
- Tang, H.M.; Wasowski, J.; Juang, C.H. Geohazards in the Three Gorges Reservoir Area, China Lessons learned from decades of research. Eng. Geol. 2019, 261, 105267. [Google Scholar] [CrossRef] [Scilit]
- Arora, J.; Manish, K.; Nautiyal, D.C.; Lakhanpaul, S.; Pandit, M.K. Changes in vegetation composition and structure following landslide-induced disturbance in the Himalaya. J. Asia-Pac. Biodivers. 2024, 17, 704–711. [Google Scholar] [CrossRef] [Scilit]
- Rasigraf, O.; Wagner, D. Landslides: An emerging model for ecosystem and soil chronosequence research. Earth-Sci. Rev. 2022, 231, 104064. [Google Scholar] [CrossRef] [Scilit]
- Feng, W.; Tang, Y.; Rao, J.; Tang, Q.; Li, J.; Wei, J.; He, X.B. Differentiation characteristics of soil properties under different vegetation types and slope positions in water-level fluctuation zone of Three Gorges Reservoir. J. Soil Water Conserv. 2026, 40, 150–158. [Google Scholar] [CrossRef]
- Bao, Y.H.; He, X.B.; Zhong, R.H.; Gao, J.C.; Tang, Q. Revegetation and its effects on soil reinforcement in the riparian zone of Three-Gorge Reservoir. Res. Soil Water Conserv. 2014, 21, 171–174+180. [Google Scholar] [CrossRef]
- Cho, H.; Marrs, R.H.; Alday, J.G.; Cho, K.-H. Vertical and longitudinal variations in plant communities of drawdown zone of a monsoonal riverine reservoir in South Korea. J. Ecol. Environ. 2019, 43, 27. [Google Scholar] [CrossRef] [Scilit]
- Fell, R.; Corominas, J.; Bonnard, C.; Cascini, L.; Leroi, E.; Savage, W.Z.; Eng, J.-J.T.C.L. Guidelines for landslide susceptibility, hazard and risk zoning for land-use planning Commentary. Eng. Geol. 2008, 102, 99–111. [Google Scholar] [CrossRef] [Scilit]
- Quevedo, R.P.; Velastegui-Montoya, A.; Montalván-Burbano, N.; Morante-Carballo, F.; Korup, O.; Rennó, C.D. Land use and land cover as a conditioning factor in landslide susceptibility: A literature review. Landslides 2023, 20, 967–982. [Google Scholar] [CrossRef] [Scilit]
- Ye, C.; Zhang, K.R.; Deng, Q.; Zhang, Q.F. Plant communities in relation to ‘flooding and soil characteristics in the water level fluctuation zone of the Three Gorges Reservoir, China. Environ. Sci. Pollut. R. 2013, 20, 1794–1802. [Google Scholar] [CrossRef] [Scilit] [PubMed]
- Lopes, L.F.; Oliveira, S.C.; Neto, C.; Zêzere, J.L. Vegetation evolution by ecological succession as a potential bioindicator of landslides relative age in Southwestern Mediterranean region. Nat. Hazards 2020, 103, 599–622. [Google Scholar] [CrossRef] [Scilit]
- Mohd Salleh, M.R.; Norhairi, N.H.A.; Ismail, Z.; Abd Rahman, M.Z.; Abdul Khanan, M.F.; Asmadi, M.A.; Razak, K.A.; Tam, T.H.; Osman, M.J. Classification of translational landslide activity using vegetation anomalies indicator (vai) in kundasang, sabah. Int. Arch. Photogramm. Remote Sens. Spat. Inf. Sci. 2022, XLVI-4/W3-2021, 247–256. [Google Scholar] [CrossRef] [Scilit]
- Dufrene, M.; Legendre, P. Species assemblages and indicator species: The need for a flexible asymmetrical approach. Ecol. Monogr. 1997, 67, 345–366. [Google Scholar] [CrossRef] [Scilit]
- Podani, J.; Csányi, B. Detecting indicator species: Some extensions of the IndVal measure. Ecol. Indic. 2010, 10, 1119–1124. [Google Scholar] [CrossRef] [Scilit]
- Leote, P.; Cajaiba, R.L.; Cabral, J.A.; Brescovit, A.D.; Santos, M. Are data-mining techniques useful for selecting ecological indicators in biodiverse regions? Bridges between market basket analysis and indicator value analysis from a case study in the neotropics. Ecol. Indic. 2020, 109, 105833. [Google Scholar] [CrossRef] [Scilit]
- Wildi, O.; Feldmeyer-Christe, E. Indicator values (IndVal) mimic ranking by F-ratio in real-world vegetation data. Community Ecol. 2013, 14, 139–143. [Google Scholar] [CrossRef] [Scilit]
- Sun, R.; Liu, H.; Ding, J.; Yuan, X. Quantitative analyses of plant communities in the hydro-fluctuation area in kaixian county after impoundment of the three-gorge reservoir. J. Ecol. Rural Environ. 2011, 27, 23–28. [Google Scholar]
- Bai, Q.; Bao, Y.; Wei, J.; Yu, Y.; Luo, P.; Wang, Y.; He, X. Distribution characteristics of plant communities in the water level fluctuation zone of heilongtan reservoir in Meishan City, Sichuan Province. Wetl. Sci. 2024, 22, 874–883. [Google Scholar] [CrossRef]
- Drinkard, M.K.; Kershner, M.W.; Romito, A.; Nieset, J.; de Szalay, F.A. Responses of plants and invertebrate assemblages to water-level fluctuation in headwater wetlands. J. N. Am. Benthol. Soc. 2011, 30, 981–996. [Google Scholar] [CrossRef] [Scilit]
- Siddig, A.A.H.; Ellison, A.M.; Ochs, A.; Villar-Leeman, C.; Lau, M.K. How do ecologists select and use indicator species to monitor ecological change? Insights from 14 years of publication in Ecological Indicators. Ecol. Indic. 2016, 60, 223–230. [Google Scholar] [CrossRef] [Scilit]
- Jiao, P.; Chen, H.; Zhang, J.; Duan, Y.; Li, Y.; Xu, H. Research progress on ecological environment problems caused by landslides in water-level-fluctuating zone of Three Gorges Reservoir area. J. Chongqing Norm. Univ. (Nat. Sci.) 2022, 39, 46–55. [Google Scholar]
- Xi, Y.; Chen, J.; Ji, D.; Deng, H.; Xu, T.; Huang, Y. Research progress on eco-environmental impact of the water level fluctuation zone in the Three Gorges Reservoir area. J. Wuhan Univ. (Nat. Sci. Ed.) 2024, 70, 1–6. [Google Scholar] [CrossRef]
- Rao, J.; Tang, Q.; Feng, W.; Wei, J.; He, X.B. Habitat condition and vegetation restoration patterns in the water level fluctuation zone of the Three Gorges Reservoir. J. Soil Water Conserv. 2024, 38, 310–318. [Google Scholar] [CrossRef]
- Qi, Z.; Wang, Y.; Li, T.; Zhang, G.; Zhang, X.; Li, P. The role of roots in riverbank stabilization under extreme fluctuating water conditions: From the perspective of riparian plant diversity. Catena 2026, 267, 109979. [Google Scholar] [CrossRef] [Scilit]
- Cheng, L.; Yuan, X.Z.; Sun, K.; Tang, T.; Yuan, J. Responses of plant communities and theirfunctional traits in the water level fluctuation zoneof the Three Gorges Reservoir area to different flooding intensities. Acta Ecol. Sin. 2024, 44, 4795–4807. [Google Scholar] [CrossRef]
- Suding, K.N.; Ashton, I.W.; Bechtold, H.; Bowman, W.D.; Mobley, M.L.; Winkleman, R. Plant and microbe contribution to community resilience in a directionally changing environment. Ecol. Monogr. 2008, 78, 313–329. [Google Scholar] [CrossRef] [Scilit]
- Liu, Y.; Duan, X.D.; Li, X.L.; Yi, W.X.; Chen, G.; Yang, J.; Deng, D.L.; Guo, X.J.; Yang, Z.J.; Huang, G.Y.; et al. Anti-seasonal flooding drives substantial alterations in riparian plant diversity and niche characteristics in a unique hydro-fluctuation zone. Ecol. Evol. 2024, 14, e70036. [Google Scholar] [CrossRef] [Scilit] [PubMed]
- Wang, H.Y.; Sun, T.; Liu, Y.; Liu, W.; Xiao, H.L. Stoichiometric characteristics and homeostasis of leaf nitrogen and phosphorus responding to different water surface elevations in hydro-fluctuation zone of the Three Gorges Reservoir. Aquat. Sci. 2023, 85, 80. [Google Scholar] [CrossRef] [Scilit]
- Connell, J.H. Diversity in tropical rain forests and coral reefs—High diversity of trees and corals is maintained only in a Non-Equilibrium State. Science 1978, 199, 1302–1310. [Google Scholar] [CrossRef] [Scilit] [PubMed]
- Nsabimana, G.; Bao, Y.H.; He, X.B.; Nambajimana, J.D.; Segatagara, B.M.; Khurram, D.; Zhou, J. Hydrological alterations accelerate soil aggregate and pore structure degradation in the water-level fluctuation zone of the Three Gorges Reservoir, China. Land Degrad. Dev. 2025, 36, 4874–4885. [Google Scholar] [CrossRef] [Scilit]
- Xiao, H.; Guo, P.; Zhang, Q.H.; Hu, H.; Hong, H.; Zhang, L.; Yang, Y.S.; Xia, Z.Y.; Li, M.Y.; Kang, H.L.; et al. Variation in soil properties and its influence on the dynamic change of soil erosion resistance to overland flow in the water-level fluctuation zone of the Three Gorges Reservoir, China. Catena 2022, 213, 106141. [Google Scholar] [CrossRef] [Scilit]
- Yang, Y.N.; Li, Z.; Chen, Y.; Zhang, Y.Y.; Lu, L.H. Periodic flooding alters ecological processes and carbon metabolism efficiency of riparian soil microbial communities in the three Gorges Reservoir area, China. J. Environ. Manag. 2025, 376, 124534. [Google Scholar] [CrossRef] [Scilit] [PubMed]
- Chen, Z.L.; Yuan, X.Z.; Ross-Nickoll, M.; Hollert, H.; Schäffer, A. Moderate inundation stimulates plant community assembly in the drawdown zone of China’s Three Gorges Reservoir. Environ. Sci. Eur. 2020, 32, 79. [Google Scholar] [CrossRef] [Scilit]
- Guo, Y.; Yang, S.; Shen, Y.F.; Xiao, W.F.; Cheng, R.M. Study on the natural distribution characteristics and community species diversity of existing plants in the Three Gorges Reservoir. Acta Ecol. Sin. 2019, 39, 4255–4265. [Google Scholar] [CrossRef]
- Wang, Y.F.; Liu, Y.; Ma, M.H.; Ding, Z.; Wu, S.J.; Jia, W.T.; Chen, Q.; Yi, X.M.; Zhang, J.; Li, X.H.; et al. Dam-induced difference of invasive plant species distribution along the riparian habitats. Sci. Total Environ. 2022, 808, 152103. [Google Scholar] [CrossRef] [Scilit] [PubMed]
- Zhou, Q.; Chen, Y.J.; Zhang, H.; Wu, S.J.; Liu, Y. Evidence for clonal integration of clones contributing to unexpectedly higher benefits for interspecific neighbours. Physiol. Plant. 2024, 176, e70017. [Google Scholar] [CrossRef] [Scilit] [PubMed]
- Tilman, D. Competition and biodiversity in spatially structured habitats. Ecology 1994, 75, 2–16. [Google Scholar] [CrossRef] [Scilit]

Disclaimer/Publisher’s Note: The statements, opinions and data contained in all publications are solely those of the individual author(s) and contributor(s) and not of MDPI and/or the editor(s). MDPI and/or the editor(s) disclaim responsibility for any injury to people or property resulting from any ideas, methods, instructions or products referred to in the content. |
© 2026 by the authors. Licensee MDPI, Basel, Switzerland. This article is an open access article distributed under the terms and conditions of the Creative Commons Attribution (CC BY) license.