


Simple Summary
Beekeepers and researchers increasingly fit hives with sensors that record temperature, weight, sound, and bee movement at the entrance. Almost all of these systems raise an alarm only when a measurement crosses a fixed limit, such as brood temperature falling below 33 °C. Honey bee colonies work hard to hold such conditions steady, so by the time a limit is crossed the colony is often in serious difficulty. However, it may be more informative to analyse the daily rhythm of the measurements. A healthy colony repeats a strong and regular daily pattern, and a colony under pressure can hold its average conditions near normal for a while, but its daily pattern becomes weaker, less regular, and/or shifted in timing. In this review, we examine each sensor technology used on hives, ask whether its data have the timing and length of record that this analysis needs, and summarise which daily patterns have been reported. Using a synthetic dataset, not a real colony, we then illustrate how rhythm-based measures could flag a slowly developing problem weeks before a conventional temperature alarm. The data and workflow are openly available so the approach can be applied to real hive records.
Abstract
Disruption of daily patterns of activity, physiology, or social interaction is associated with stress and reduced fitness across species. In social insects such as honey bees (Apis mellifera), circadian organisation extends to the colony level, where rhythms emerge from interactions among individual clocks, hive conditions, and environmental cues. Precision apiculture offers a mature sensor toolkit for measuring colony-level variables, and several data streams carry early-warning information about colony condition. Almost all alarms, however, are triggered against set points rather than against the daily rhythm of the signal. We review each sensor technology to establish whether its data have been, or could be, analysed with a chronobiological lens, describing the measurement principle, the achievable temporal resolution and record continuity, the rhythmic signature expected on biological grounds, and any evidence that such a signature has been reported. We then use a synthetic dataset to illustrate the workflow: in this simulated example, rhythm metrics flagged a gradually developing decline approximately three weeks before a conventional threshold alert on the same data. This lead time is a property of the simulation and awaits validation on real colonies. Wherever continuous behavioural monitoring is deployed, rhythm-based metrics may offer a route to earlier, more interpretable detection of change than set point comparisons.
1. Introduction
Concerns over honey bee (Apis mellifera) colony losses, which are a direct threat to food security and the stability of ecosystems, have largely driven the development of sensor-based tools for monitoring colony health. This practice, often termed “precision apiculture” or “precision beekeeping”, relies on continuous data collection to track hive conditions and inform colony management.
In nearly every attempt to predict declining colony health, thresholds are set at a single level (a temperature, a mass, a count, or a concentration) or an acceptable range. This is a reasonable default, and it works well for discrete high-impact events such as swarming, queen loss, or sudden population collapse [1,2]. It is less suited to the gradual behavioural shifts that may precede those events. Honey bee colonies are resilient superorganisms that expend considerable effort to hold internal conditions constant. A colony under sustained pressure may continue to defend brood nest temperature within the normal 33 to 36 °C range while reallocating labour away from foraging, grooming, and comb maintenance to do so. Under a set point rule, an alarm will sound only once the defence itself fails, at which point substantial damage may have already occurred and intervention options are limited.
One dimension of behaviour that is routinely recorded in almost all organisms, but seldom analysed, is its temporal structure. Daily rhythms synchronise biological activity and physiology with predictable environmental cycles. Across taxa, disruption of these rhythms is associated with illness or stress [3,4,5]. Neonicotinoids, for example, have been shown to disrupt the circadian rhythms of individual honey bees kept in laboratory conditions [6] and affect the colony in the field [7,8].
A circadian rhythm is generated by an endogenous clock: it persists with a period close to 24 h under constant conditions and is entrained, rather than driven, by environmental cycles. A diel or daily pattern is simply a 24 h periodicity observed in the field, and in a hive record it is the joint product of the colony’s circadian organisation and of direct environmental driving (masking) by light, temperature, weather, and foraging opportunity. Fixed hive sensors record diel patterns, not circadian rhythms as such; separating the two would require constant conditions or explicit modelling of the environmental drivers. Throughout this review we, therefore, use “circadian” for the colony’s internal temporal organisation and its known mechanisms, “daily” or “diel” for what a sensor records, and “rhythm metrics” for quantities computed from the recorded daily pattern. The diagnostic proposal rests on departures of a colony’s daily pattern from its own baseline under comparable environmental conditions, which is why concurrent environmental covariates are indispensable (Section 5.3), and why a change in a daily pattern should be read as a change in colony condition only once environmental driving has been accounted for.
Rhythm metrics are attractive as diagnostic quantities because a colony can serve as its own control: ratios such as relative amplitude, timings such as acrophase, and stability indices are referenced to the colony’s own recent record rather than to a population norm. We hypothesise that such normalised features are less dependent than absolute levels on between-colony differences in size, genotype, hive construction, or sensor placement. This is plausible but, to our knowledge, untested: between-colony variation in amplitude, acrophase, and stability may itself be substantial, and sensor placement affects amplitude more than phase (Section 3.1). We, therefore, state it as a testable hypothesis, and the within-colony baselines of Recommendation 6 are the design that tests it rather than assumes it.
The practical obstacle to rhythm-based monitoring is not, for most modalities, a hardware limitation. Connected hive scales record at intervals of 5–60 min for months at a time; entrance counters, RFID readers, and in-hive temperature loggers routinely operate continuously across seasons; camera systems record for extended periods where power is available. The temporal resolution needed for rhythm analysis is, therefore, already being achieved. What is usually missing is analytical: raw high-resolution time series are commonly reduced to daily summaries or to threshold-crossing events before they are stored or reported, streams from different sensors are not clock-synchronised, and rhythm-derived quantities are seldom computed.
Numerous reviews of precision apiculture and associated sensor technologies already exist, covering the hardware, its specifications, and its performance in the field, and we do not attempt to duplicate them [9,10,11,12,13,14,15,16,17,18]; readers seeking technical detail on a particular sensor are directed there. Our intention for reviewing the sensor technologies is to understand whether a chronobiological lens could be applied to the data, and if there has been any attempt to analyse daily rhythms.
Specifically, in this review we aim to: (i) survey the sensor technologies used in honey bee research and assess, for each, the temporal resolution and record the achievable continuity, and whether rhythm-derived quantities have been reported; (ii) explain why set point interpretation systematically detects change late in systems that actively defend their set points; and (iii) demonstrate a framework using a simulated multi-sensor dataset to quantify potential improvements in detection lead time. We are not proposing that rhythm analysis should replace level-based monitoring but rather that it be computed alongside existing approaches using data that are already being collected.
The reason we develop the argument in a social insect, rather than any other organism, is mechanistic. In a superorganism, the colony-level rhythm is not simply the sum of individual clocks; it is produced by social synchronisation, including substrate-borne vibrational cues and trophallactic contact, and by the collective regulation of the nest environment [19,20,21,22,23]. Thus, colony-level rhythms are measurable with fixed sensors and without tagging individuals; and the synchronisation machinery is itself a candidate point of failure, so a colony can lose temporal coherence while its aggregate output remains within range. The same social organisation also makes the colony rhythm plastic: individual workers move between arrhythmic in-nest tasks and strongly rhythmic foraging according to colony need Bloch & Robinson 2001 [19], so the colony-level rhythm is expected to vary with workforce composition, brood amount, and season even in a healthy colony.
2. Methods for the Literature Review
This review is narrative rather than systematic, as there have already been a number of systematic reviews of precision beekeeping technologies. In addition to the papers covered in those reviews, we searched Google Scholar for (“honey bee” OR “honeybee” OR “Apis mellifera” OR “colony”) AND (“circadian” OR “diel” OR “daily rhythm” OR “actogram” OR “entrainment” OR “periodogram”) and considered the first 100 results (10 pages) to ascertain whether there has been an application of chronobiological analysis to the data in the context of honey bee monitoring. Additionally, the list of references was fed into a large language model with internet access (Fable 5, Anthropic™) with the prompt “We are writing an academic paper on the use of sensor technology for monitoring honey bee hives and the application of chronobiological analysis to any generated data. Please review the list of references attached and ensure it is complete. Please list any new reference in APA style with a url.”
Synthesis Approach
Because the included studies differ in design, outcome, and reporting to an extent that precludes meta-analysis, we synthesised each modality narratively against the same seven criteria: (i) temporal resolution, (ii) record continuity, (iii) level of organisation resolved, (iv) behavioural specificity, (v) robustness to environmental noise, (vi) scalability and field readiness, and (vii) demonstrated suitability for rhythm analysis. For each modality, we also record whether validation against an independent behavioural reference was reported.
3. Results of the Literature Review—Sensor Technologies
Below, each modality is assessed against the criteria set out in Section Synthesis Approach. Commercial availability is summarised in Table 1; the comparative assessment, including the rhythm audit, is summarised in Table 2.
Table 1.
Sensor technologies for honey bee colony monitoring: measurement location and commercial availability.
3.1. Physicochemical Sensors
Measurement. Temperature, humidity, and carbon dioxide (CO2) probes report the internal conditions that the colony actively regulates. They are low-cost, low-power, minimally invasive, and typically sample every 1–15 min for months. Healthy colonies hold brood nest temperature between 33 and 36 °C through clustering, flight muscle shivering, fanning, and evaporative cooling [24,25,26,27,28], and relative humidity between roughly 50 and 90% [12]. Compact non-dispersive infrared sensors have made CO2 a practical monitoring parameter reflecting colony size, ventilation dynamics, metabolic state, and aspects of forager communication [19,22,29,30].
Rhythmic content demonstrated. All three of the above variables show clear daily cycles [29,31,32,33,34]. Despite this, the daily cycle is often averaged out rather than utilised as a quantity of interest, for example [26,35]. In field records these are diel patterns in the sense defined in Section 1, and the rhythm metrics of Section 4 are computed on them as such.
Predicted signature. Because these variables are tightly regulated by the colony, their mean values and daily amplitudes may remain relatively constant despite changes in colony condition. Consequently, their diagnostic value may lie more in the stability of the daily rhythm and its phase relationship to entrance activity and/or external environmental conditions. Specifically: (i) a colony under increasing thermoregulatory load should show rising intra-daily variability in temperature before any change in daily mean; (ii) CO2 amplitude should reflect colony metabolic output and is, therefore, expected to decrease ahead of population decline; and (iii) the phase lag between the CO2 peak and the entrance activity peak should be stable in a functioning colony and should drift or decouple when ventilation behaviour is no longer matched to foraging load.
Constraints. These signals are integrative: they reflect the combined outcomes of many interacting processes and cannot on their own identify the behaviour producing a change [9]. Interpretation is context-dependent, and strong internal gradients make readings sensitive to sensor placement, which matters more for amplitude than for phase. Persistent declines in CO2 have been associated with colony collapse, and elevated CO2 with pesticide exposure and possible effects of Varroa dynamics [36,37], but these are level-based associations.
3.2. Gas Sensor Arrays (Electronic Nose)
Measurement. Arrays of partially selective gas sensors, often termed “electronic noses”, sample hive air and respond to the mixture of volatile organic compounds produced by adult bees, brood, comb, food resources, and pathogens. Where a CO2 sensor (Section 3.1) reports a single compound, an array output provides a “chemical fingerprint”. Field deployments have discriminated Varroa-infested from Varroa-free colonies [38,39].
Rhythmic content demonstrated. No rhythm-derived quantities have been reported. However, the signal carries daily structure, as the accuracy with which Varroa infestation can be classified from hive air varies systematically with the time of day at which the air is sampled [39]. However, the authors chose to analyse and report periods where the true positive rate for all three infestation categories exceeded the 24 h average rather than analysing the rhythm.
Predicted signature. Hive air composition integrates ventilation, foraging returns, nectar ripening and brood metabolism, each of which follows the colony’s daily rhythm. A healthy colony should, therefore, express a stable daily rhythm. Loss of amplitude or drift in phase of that waveform would be predicted under the same logic as for CO2: a colony reallocating labour away from ventilation and foraging changes the timing of air exchange before mean composition moves outside a fixed range. Because the measurement is chemical rather than behavioural, this modality could also separate microbially driven change from behavioural change when paired with an entrance counter.
Constraints. Practical constraints are sensor drift, cross-sensitivity to temperature and humidity, and the need for a controlled sampling protocol [40].
3.3. Hive Scales
Measurement. Load cells beneath the hive record total hive mass, typically every 15–60 min across seasons. Mass reflects the combined effects of foraging, nectar intake, honey storage and consumption, wax building, and brood rearing [41]. Advances in load cell technology and data integration have made weight a standard component of electronic hive systems [42,43].
Rhythmic content demonstrated. Hive weight is among the most obviously rhythmic hive signals: mass falls as foragers depart and rises as they return, producing a pronounced daily waveform (a diel pattern driven largely by foraging opportunity, and so heavily masked by weather, rather than a direct read out of the colony’s endogenous clock), superimposed on longer-term changes associated with swarming, nectar flow, overwintering, and colony loss [2,44,45,46]. However, published reports generally reduce the series to threshold events, like a 2–3 kg step change indicating a swarm or a sustained decline indicating starvation [45,47,48].
Predicted signature. The daily mass waveform contains at least three separable rhythm parameters that are not routinely reported: the time of the morning inflection (forager departure onset), the acrophase (the time at which a rhythm peaks) of the net gain phase, and the amplitude of the daily excursion normalised to total mass. A colony losing foraging capacity may show a later and less steep morning inflection and a reduced normalised excursion, and that these may appear before net mass loss becomes detectable against seasonal trend.
Constraints. Weight cannot distinguish among the processes contributing to a change, so it is most informative when considered alongside other variables. Rainfall, equipment additions, and manipulations introduce artefacts that must be flagged rather than smoothed. Because absolute mass differs greatly among colonies, normalised rhythm parameters are more transferable than raw amplitudes.
3.4. Infrared and Thermal Imaging
Measurement. Unlike single-point probes, thermal imaging provides high-definition spatial distribution of temperature [25,49]. Applications include estimating colony size from cluster heat signatures [50,51], detecting defensive thoracic heating against hornets [52], identifying abnormal brood temperature patterns potentially linked to Varroa infestation [53], and monitoring forager traffic [54].
Rhythmic content demonstrated. Infrared entrance beams produce exactly the kind of continuous, low-dimensional count series that rhythm analysis requires, and daily traffic profiles are visible in such data. Full thermal imaging, by contrast, is generally deployed as an intermittent diagnostic rather than a continuous recording, and we found little evidence of rhythm-level analysis of thermal image series.
Predicted signature. Thermal imaging offers spatially resolved rhythms. The centroid and area of the thermally active region likely oscillate daily in a functioning colony, and that loss of this spatial oscillation precedes the mean temperature decline that current threshold rules detect for predicting colony loss, disruptions to foraging patterns, and Varroa infestation.
Constraints. Colony size estimates from heat maps are indicative rather than diagnostic. The non-invasive advantage is not always retained: brood mapping for Varroa has required hives to be opened and frames removed [53]. Hardware cost is high, some applications need multiple cameras per hive [50], and entrance infrared requires a narrow field of view that complicates setup [54]. Detectable thermal change ahead of swarming occurs only once departure preparation is underway [49], which limits its warning value.
3.5. Acoustic and Vibrational Sensors
Measurement. Microphones and vibration detectors (accelerometers and piezoelectrics) have been combined with machine learning for behavioural classification [1,55,56].
Rhythmic content demonstrated. There is a definite daily rhythm of hive sound [34,57,58]. Substrate-borne vibrations have also been identified as social cues capable of entraining circadian rhythms, implicating them in social synchronisation of the colony clock [23]. This makes vibration both a readout of rhythm and part of its mechanism. Otherwise, acoustic work has concentrated on discrete signals: queen piping and quacking during succession [59,60], pre-swarm worker sounds [61,62], agitation during robbing, and baseline shifts under Varroa infestation or pesticide exposure [63,64,65]. Vibrational sensors have been used to assess queen presence and swarming readiness [66] and to detect begging signals and colony-wide vibration signals [67,68].
Predicted signature. Because acoustic signals contain information across multiple frequency bands, rhythm analysis can be performed separately for each band and for patterns over multiple bands, potentially revealing behavioural changes that would be obscured in a single measure of acoustic amplitude. Different bands (or combinations of bands) carry different information, and the phase relationship among bands is probably a more specific indicator of colony state than total acoustic power. Loss of coherence between bands could indicate, for example, that the colony is no longer coordinating ventilation with foraging.
Constraints. Data volume is large; airborne signals are susceptible to wind, rain, and machinery noise [66]; and vibrational data depend strongly on frame material and sensor mounting, so each installation requires its own calibration and there is no single, standardised healthy baseline. Published analysis uses short windows, sometimes only up to one or two days, which does not produce enough data for rhythm-stability assessment.
3.6. Video and Imaging Systems
Measurement. Cameras at the hive entrance record forager movement and behaviours such as pollen return, grooming, or swarming [69,70,71]. Restricted pathways or tunnels simplify tracking and support estimates of foraging rate, pollen return, and Varroa infestation [72,73,74,75]. Stereo and multi-camera systems reconstruct three-dimensional flight trajectories at the entrance, allowing flight speed, curvature, and hovering to be quantified [76,77]. Internal recordings are less common because of lighting, spatial, and maintenance constraints, but they have been used in laboratory and field settings to capture bee behaviours [78,79,80], to detect Varroa [81], and video is widely used to validate other sensors, such as entry/exit detectors and the ESF recordings (see Section 3.11) [82,83,84].
Rhythmic content demonstrated. Entrance video yields continuous count and trajectory series that are, in principle, ideal for rhythm analysis, and daily traffic patterns are evident in published traces. One preprint article has proposed an automated tracking system that reportedly showed a circadian pattern in information transfer between individual bees [85]. However, we found little published analysis of video-derived series as rhythms over multi-week records, which we attribute to storage and processing cost rather than to any property of the signal.
Predicted signature. Video can deliver rhythms of behaviourally specific metrics at colony scale, such as the daily profile of pollen-laden returns relative to total returns. The ratio of pollen-bearing to total returning foragers will have its own acrophase, reflecting brood demand, and changes in daily profile may provide an earlier indication of changing brood status than total forager traffic alone. Three-dimensional trajectory data additionally permit rhythms of flight performance (e.g., speed and curvature) rather than merely flight frequency, and changes in these metrics may indicate declining forager performance.
Constraints. High bee density causes occlusion and frustrates some automated detection techniques. Internal recording requires lighting: visible light may alter behaviour, red light is a partial compromise [86], and infrared alternatives trade spatial resolution and contrast, with sensitivity to wax and propolis accumulation. Outdoors, variable illumination, rain, wind, and obstruction degrade tracking [87]. Power and storage demands have historically limited deployment in off-grid locations, although on-device inference may be a solution.
3.7. Radio Frequency Identification (RFID) and Harmonic Radar
Measurement. Radio Frequency Identification (RFID) measurements involve affixing passive tags on the thorax of individual bees. Those tags are read by sensors at the hive entrance, logging exit and re-entry times to record trip frequency, trip duration, lifetime activity budgets, and return rates [88,89,90,91,92]. Harmonic radar is a spatial tracking method where a small antenna stuck to the thorax of individual bees re-radiates an emitted signal, allowing flight paths to be reconstructed to about 1 km [93,94,95]. Its natural outputs are trajectories, navigational decisions, and search behaviour; it has been central to demonstrating time-compensated cognitive maps and the inference of food location from waggle dance information [96,97]. RFID answers when and how often bees forage, while harmonic radar answers where and by what route.
Rhythmiccontent demonstrated. RFID has the strongest track record of any modality for analysis of behavioural timing across the lifespan, which is close to rhythm analysis in method even where it is not framed that way. Automated breakpoint procedures applied to lifelong RFID records have been used to detect the age at onset of foraging and to quantify ontogenetic shifts in time activity patterns [98], sleep patterns [99], and lifespan and pre-foraging stage have been characterised from the same kind of data [100]. RFID has also been used to quantify sublethal pesticide effects on foraging and homing [101,102] and pathogen effects on forager performance [103]. Time-of-day structure in these datasets is typically present but usually analysed as a covariate rather than as the outcome.
Predicted signature. In addition to the aforementioned life-cycle analysis, the distribution of individual foraging onset times, rather than their mean, is probably more diagnostic because a colony under stress may show increased between-individual dispersion in onset time and a flattening of the population activity profile, reflecting loss of social synchronisation, before mean trip frequency changes appreciably.
Constraints. Neither method observes in-nest social behaviour, brood care, or collective dynamics directly. RFID tagging is labour-intensive, and there are continuing concerns that the tags or aerials alter behaviour [84,104]. This approach is totally impractical outside the intensive research setting. Harmonic radar is generally limited to a few individuals at a time and requires specialised outdoor equipment. Both are best regarded as research instruments. Importantly, forager return statistics reflect mortality that has already occurred, which makes them lagging rather than leading indicators of colony condition [8,105].
Table 2.
Comparative assessment of sensor modalities against the seven criteria. The final column records whether rhythm-derived quantities have been reported from the modality. Note that temporal resolution is widely adequate, but rhythm-derived quantities are reported from very few modalities.
3.8. Doppler Radar
Measurement. Doppler radar detects motion from frequency shifts in reflected signals, without tagging or visual access, and has been used to estimate entrance activity from bees moving toward or away from the antenna [106]. Systems have been deployed alongside accelerometers to capture swarming, robbing, and defensive responses [107], and internally-focused micro-Doppler approaches can detect vibration patterns associated with general activity and queen presence [108].
Rhythmic content demonstrated. Doppler output is a continuous activity index, which is the simplest possible input to rhythm analysis, and sensor units are portable and can be solar-powered. However, we are not aware of any multi-week rhythm analysis of Doppler hive data.
Predicted signature. Given that Doppler integrates all motion into one channel, its value is in period and phase rather than in behavioural specificity. Doppler-derived activity likely yields acrophase and interdaily stability estimates closely comparable to those from capacitive or infrared counters, and agreement between the two could establish Doppler as a low-cost, contact-free substitute where entrance modification is undesirable.
Constraints. Individual behaviours and social interactions cannot be isolated. Wind-blown vegetation, passing animals, and rainfall introduce noise and reduce accuracy [109]. Furthermore, radar operates in frequency bands whose effects on insect physiology are not fully characterised [110], which warrants caution in long-term deployment near colonies.
3.9. Light Detection and Ranging (LiDAR)
Measurement. LiDAR non-invasively detects insects in flight. Polarisation LiDAR has been demonstrated on free-flying honey bees, discriminating bees from background over hundreds of metres during landmine detection trials [111]. Entomological LiDAR more generally counts insect transits along a fixed transect and resolves wingbeat frequency modulation, which supports coarse taxonomic separation [112]. It is the only modality in this review that measures flight activity at landscape scale without instrumenting either the hive or the bee.
Rhythmic content demonstrated. Entomological LiDAR data from other taxa have shown diel flight activity cycles over multi-day deployments [112], so the temporal resolution and record length required for rhythm analysis are within demonstrated capability.
Predicted signature. The aggregate daily flight waveform of the colonies likely shows onset after dawn, weather-gated midday structure, and cessation before dusk. This is the same waveform an entrance counter would show, but it is measured across the foraging landscape and may contain direction of flight also.
Constraints. Attribution to a focal colony is the central difficulty, and weather is a strong masking variable.
3.10. Capacitive Sensors
Measurement. Capacitance sensors at the entrance generate a low-power electric field and register brief changes as bees pass through, giving time-stamped counts without tagging or visual tracking [82,113].
Rhythmic content demonstrated. Capacitive sensors can measure colony-level entry activity without the need to label individual bees and with lower power consumption than cameras. Performance is largely insensitive to light and weather, and continuous operation over weeks to months is routine; entrance traffic analysed across multiple days shows shifts in foraging onset and offset and in activity level [86]. Rhythm parameters are nonetheless seldom reported explicitly.
Predicted signature. Capacitive count series may show rhythmic activity patterns, and a reduction in amplitude of the daily signal may indicate the onset of Varroa-associated or nutritional stress well before total daily counts fall outside their seasonal range.
Constraints. Behavioural specificity is low: forager roles, flight purpose, and, depending on configuration, direction of travel cannot reliably be distinguished. Overlapping passage during periods of high traffic can lead to undercounting, and accumulation of bees at the hive entrance during overheating or early swarming produces a sustained baseline shift that corrupts counts [114]. Capacitance, therefore, provides a coarse activity measure, which is adequate for phase and stability estimation but not for behavioural attribution.
3.11. Electrostatic Field (ESF) Sensors
Measurement. ESF sensors detect fluctuations in local electric fields produced by charged, moving bees. Charge accumulates through friction with air during flight and through contact with hive surfaces and other individuals [83], and wing vibration, abdominal shaking, and walking generate localised field fluctuations. These fields are detected by nearby individuals and influence behaviours including the waggle dance, fanning, and inhibitory stop signals [83,115]. ESF sensing operates in complete darkness without artificial lighting or visual access and can identify specific in-nest behaviours such as waggle dancing, fanning, and potentially tremble, grooming, and shaking movements from their characteristic time-frequency signatures [116].
Rhythmic content demonstrated. ESF sensing is at an early stage of development and, to our knowledge, no multi-week ESF record has been published.
Predicted signature. If in-nest behaviours can be classified reliably over long records, ESF would provide something no other modality currently offers: rhythms of specific social behaviours measured inside the nest without disturbance. The waggle dance rate may have a pronounced daily acrophase preceding the entrance activity acrophase, and that fanning rate has a distinct thermally driven phase, so that the lag between these two behavioural rhythms would index the colony’s allocation of effort between foraging and thermoregulation. Further, behavioural markers from ESF may well be expressed in signal-specific spatial and temporal distributions, allowing us to test the possibility of localised colony clock(s).
Constraints. There is no commercial system, no established performance data across hive materials, colony sizes, or seasons, and no independent validation of behavioural classification accuracy under field conditions, despite a large amount of data already collected [116].
3.12. Comparative Synthesis
Adequate temporal resolution is widespread in the sensors currently available in precision apiculture. Physicochemical probes, hive scales, capacitive and infrared entrance counters, RFID, and Doppler radar all sample at intervals well inside the range required to resolve a 24 h cycle, and all are capable of continuous operation over the multi-week records that rhythm stability assessment requires. On the criterion that matters most for circadian work, the deployed base is already adequate.
Furthermore, rhythm-derived quantities are reported from very few of the current datasets. Series are often reduced to daily means, maxima, and minima, or to threshold-crossing events, before analysis. Where rhythm has been analysed directly, such as colony rhythm recognised from hive sound [57], entrainment by substrate-borne vibration [22], temperature and CO2 [32], or timing structure in lifelong RFID records [98], it has generally been treated as a biological question in its own right rather than as a diagnostic instrument.
Viewed across Table 1, Table 2 and Table 3, the technical characteristics point in one direction. The modalities that best satisfy the requirements of rhythm analysis (sub-hourly sampling, negligible drift over weeks, low power, insensitivity to lighting and weather, and routine season-long deployment) are the simplest and least expensive: temperature and humidity probes, hive scales, and capacitive or infrared entrance counters. The more sophisticated modalities, which offer greater behavioural specificity, are precisely those whose power, storage, lighting, or calibration demands have so far prevented the long continuous records that rhythm analysis needs. The data best suited to the approach we propose are, therefore, already being collected at scale, which underlines our central conclusion that the barrier is analytical rather than technological.
Table 3.
Measurement resolution and drift characteristics of each sensor modality that bear on rhythm analysis. Resolution is judged against the daily excursion of the signal since a rhythm can only be estimated where instrument noise is small relative to the daily change; drift matters because a trend over a multi-week record biases the mean and the baseline limits more than it biases phase or normalised amplitude.
4. A Worked Demonstration on Simulated Data
To illustrate how data might be analysed through a chronobiological lens, we generated a synthetic multi-sensor dataset representing two hives and applied both set point and rhythm-based analyses to it. The example is a demonstration of the workflow and of the logic set out in Section 5.1, and it is circular by construction: the perturbation is specified in the rhythm domain (amplitude, phase, envelope, and day-to-day variability of entrance activity), so the rhythm metrics were bound to respond to it, and the temperature stream is specified to fail late, so the set point rule was bound to respond late. The detection lead time it yields is, therefore, a property of the simulation, not an empirical finding. Its purpose is to show what rhythm-based monitoring might look like in practice, to make the mechanism of Section 5.1 concrete, and to provide an analytic framework that could be applied to real hive records.
4.1. Methods
We generated 70 days of data at 5 min resolution (288 observations per day) for two colonies, a control and a perturbed colony, sharing a common weather record. Two streams were simulated for each: entrance activity (counts per 5 min, Poisson-distributed about a unimodal daily envelope with a 13.5 h acrophase) and brood nest temperature (regulated around 34.8 °C with a small daily oscillation). A shared multiplicative day-quality factor represented weather-driven masking of foraging. Both colonies carried day-to-day random effects in amplitude and phase.
From day 30, the perturbed colony was subjected to a gradual perturbation ramping linearly over 25 days, comprising four simultaneous changes: a 55% reduction in activity amplitude, a 2.2 h delay in acrophase, broadening of the daily activity envelope with loss of night-time consolidation, and a progressive increase in day-to-day variability of both amplitude and phase, representing loss of social synchronisation. Brood temperature was allowed to fail only late, from day 52, reflecting the compensation mechanisms previously discussed.
Simulated data were generated with a custom Python (version 3.14.4) script. Analysis was conducted in AnCiR (v β.74.1; https://ancir.pages.dev/; https://doi.org/10.5281/zenodo.19340642; accessed on 21 September 2026). The data generation script, the simulated dataset, and the AnCiR session that reproduces every figure are archived on Zenodo (https://doi.org/10.5281/zenodo.22884569).
Rhythm metrics were computed on rolling 7-day windows advanced in daily steps. For each window, we estimated four rhythm metrics: cosinor relative amplitude and acrophase [117], and interdaily stability and intradaily variability [118]. A baseline was established from windows ending on or before day 28, and control limits set at the baseline mean ± 3 SD. An alert was raised when a metric fell outside its limits for three consecutive windows. For comparison, a conventional threshold alert was raised when brood nest temperature first fell below 33 °C.
4.2. Results
Figure 1 shows the two raw streams and the four rhythm metrics on a common time axis. Brood nest temperature in the perturbed colony (Figure 1a) remained within the normal range for more than three weeks after perturbation onset because the simulated colony, like a real one, was specified to defend temperature until late in its decline; the 33 °C set point was first crossed on day 56. Entrance activity (Figure 1b) tells a different story: the daily amplitude of the perturbed colony began to shrink from day 30, and its night-time activity increased, while the control colony kept its rhythm throughout. Figure 1c–f show how the four rolling rhythm metrics, all computed on entrance activity, responded. Relative amplitude (Figure 1c) gave the earliest sustained alert, on day 35, five days after onset and consistent with a 7-day analysis window. Interdaily stability (Figure 1e) followed on day 37 as the day-to-day reproducibility of the waveform degraded, acrophase (Figure 1d) on day 43 as the accumulated phase delay exceeded its control limit, and intradaily variability (Figure 1f) on day 46 as the within-day profile fragmented. The control colony crossed no limit on any metric (grey series), so the false alarm count over the 70-day record was zero. Table 4 summarises the alert days. In this synthetic example, the earliest rhythm-based alert preceded the conventional threshold alert by 21 days. This interval reflects the perturbation we chose to simulate (a 55% amplitude loss ramping over 25 days, with brood temperature defended until day 52). Any rhythm-based alarm timing needs to be established empirically.
Figure 1.
Simulated demonstration of rhythm-based versus set point detection on the control (grey) and perturbed (black or coloured) colonies, all panels on one time axis. (a) Brood nest temperature, with the 33 °C set point (dashed horizontal line); the perturbed colony defends temperature near 34.8 °C until day 52, and the set point alert fires on day 56. (b) Entrance activity (bees per 5 min); the perturbed colony’s daily amplitude shrinks after perturbation onset while the control colony keeps its rhythm. (c–f) Rolling rhythm metrics, all computed on entrance activity in 7-day windows advanced daily and labelled by their end day: (c) relative amplitude of entrance activity (cosinor amplitude divided by MESOR), alert on day 35; (d) acrophase of entrance activity (time of peak activity, hours), alert on day 43; (e) interdaily stability of entrance activity, alert on day 37; (f) intradaily variability of entrance activity, alert on day 46. In (c–f), the dashed horizontal line is the control limit (baseline mean ± 3 SD from windows ending on or before day 28), and an alert is raised when the metric lies outside its limit for three consecutive windows. In every panel, the shaded region is the 28-day baseline window, the dotted vertical line marks perturbation onset (day 30), and coloured vertical lines mark the first alert from each rhythm metric and from the temperature set point. The control colony crosses no limit in any panel.
Table 4.
Alert day for each detection rule in the simulated example (perturbation onset day 30; all rhythm rules computed on entrance activity; the set point rule on brood nest temperature).
Amplitude responded first because amplitude reduction was the largest component of the simulated perturbation. The order in which the remaining metrics responded reflects how quickly each component of the perturbation accumulated relative to its baseline variability: loss of day-to-day stability as the between-day variance grew, then phase drift as the 2.2 h delay accumulated, and intradaily variability last, as the within-day fragmentation developed most gradually. In the field, this ordering may be informative, as different stressors could be expected to produce different patterns of change across the metrics.
5. Discussion
5.1. Why Set Point Monitoring Detects Change Late
Current monitoring is technically advanced but conceptually homeostatic. It assumes that a healthy honey bee colony remains within a fixed, stable range, and it programmes alerts to fire when a measurement crosses an absolute limit. The difficulty is that colonies are resilient, and expend considerable energy remaining stable while under pressure [119]. Moreover, the circadian rhythms suggest that organisms maintain homeorhesis [120], rather than homeostasis, and so measuring the changes in rhythms may better reflect the underlying biology. Absolute values may, therefore, be a late indication of trouble.
The brood temperature example confirms this. A system that alerts when hive temperature falls below the 33–36 °C range is likely identifying a terminal state. Temperatures depart from the range when the brood nest has been lost or worker density has fallen below the minimum required for thermoregulation, that is, once the failure has already happened. The same logic applies across modalities: a 3 kg step loss in hive mass identifies a swarm that has departed; a spike in acoustic power identifies agitation already underway; a fall in forager return rate identifies individuals that have already died. Each of these is a lagging indicator by construction because each is defined by the crossing of a boundary that the colony has been actively defending.
This review and analysis suggests that a more sensitive approach may be to monitor the behavioural effort required to maintain stability rather than the stability itself. A colony under pathogen or nutritional pressure may keep the nest warm, but it does so by reallocating labour away from foraging, grooming, and comb maintenance. Such reallocation changes when activities occur and how tightly they are coordinated long before it changes what the aggregate sensor reads. Rhythm parameters (amplitude, phase, day-to-day reproducibility, and the phase relationships among concurrently recorded streams) are possibly a more direct measurement of that coordination and so may act as an “early warning” signal [121,122].
Rhythm metrics are not universally superior, and we do not propose them as a replacement for threshold rules. As the rhythms are computed over multi-day windows, they are slow to respond to acute, discrete events, such as swarming, robbing, wasp attack, hive tipping, or theft, all of which are detected faster and more reliably by threshold or step change rules on the raw series. Rhythm metrics also have their own failure modes, principally environmental masking, which is why concurrent environmental covariates are essential (Recommendation 4), as is biological variability, discussed next.
Biological variability is a second and less tractable source of false alarms. The honey bee circadian system is strongly socially regulated. Young nurse bees tend brood around the clock with weak or absent behavioural rhythms and attenuated clock gene cycling, foragers are robustly diurnal, and workers switch between these states, in both directions, according to the needs of the colony [19,123,124]. Social cues can override photic entrainment altogether [125]. The rhythm that a fixed sensor records is, therefore, a weighted mixture of these individual patterns, and its amplitude, phase, and stability will shift whenever the mixture does: as the forager-to-nurse ratio changes with brood area and colony size, after swarming or requeening, during a nectar flow, and across the season as the colony moves from brood rearing to a broodless winter cluster whose thermoregulation is governed by different mechanisms [126]. None of these changes is a sign of ill health, yet each would register on the metrics used in Section 4. Within-colony baselines and control limits (Recommendation 6) absorb some of this variation because the colony is compared with its own recent past rather than with a population norm, but a 28-day baseline cannot absorb seasonal transitions or management interventions. In practice, rhythm-based alerts will need to be interpreted against a record of colony size, brood area, and beekeeper manipulations, and the expected seasonal trajectory of the metrics will need to be characterised empirically before departures from it can be read as warnings.
The worked example in Section 4 uses synthetic data and is circular by design: the perturbation was specified in the rhythm domain, so the rhythm metrics were bound to respond, and the comparator variable was specified to fail late. The three-week lead time it reports is a consequence of what we specified, not evidence that such a lead time is observed in the field, and the ordering of the four metrics is likewise a property of the simulated stressor. What the example does show is the mechanism by which a colony that defends its set point can change its temporal organisation long before the defended variable moves, and the workflow by which such a change would be detected. Whether real stressors act on colony rhythms in this way, and with what lead, can only be settled with real records analysed against pre-specified rules (Recommendation 7). We have provided the data generation script and the complete analysis session so that the workflow can be applied to real records.
5.2. Generality Beyond Honey Bees
Honey bee colonies are a useful model system for rhythm-based monitoring for four specific reasons: (i) colonies occupy a fixed nest site, so fixed sensors can record continuously for months without recapture or battery replacement; (ii) the superorganism structure means colony-level rhythms are measurable in aggregate signals without tracking individuals; (iii) colonies are strongly entrained by light and temperature, giving a well-defined expected rhythm against which departures can be assessed; and (iv) a large instrumented base already exists, so the analytical framework can be applied retrospectively to archived records.
Importantly, the metrics and approach are not bee-specific. Interdaily stability, intradaily variability, and relative amplitude were developed for human rest activity actigraphy [127,128], and rhythm analysis is well-established in many fields [117].
The use of chronobiological analysis requires data to span many days, so short deployments are unsuitable. A disturbance-free baseline must also be obtainable, and masking covariates must be measurable, which is straightforward at a fixed apiary and much harder for a hive that is moved for pollination or a free-ranging animal moving through heterogeneous conditions.
The approach will also transfer poorly to some systems. Species with weak circadian organisation, animals undergoing hibernation, those whose activity is dominated by episodic events, such as long-distance migration, and those whose rhythms reorganise seasonally in ways that are themselves adaptive will all generate rhythm changes that are normal rather than pathological. In such systems, the metrics remain computable, but their interpretation as health indicators does not follow.
5.3. Recommendations
Based on this synthesis, we propose seven recommendations for data collection, analysis, and reporting, presented in order of increasing complexity of implementation.
- •
- Report sampling interval and total record duration in every sensor-based study. These determine what temporal analysis is possible and are frequently omitted.
- •
- Archive the raw high-resolution series, not daily summaries or threshold-crossing events. Reduction is irreversible, and it discards precisely the structure that rhythm analysis needs.
- •
- Synchronise clocks across sensors to a common network time source and record timestamps in UTC with an explicit offset.
- •
- Record environmental and colony covariates concurrently (weather at the apiary, colony size, brood area, and all beekeeper manipulations), at the same temporal resolution as the behavioural streams where possible.
- •
- Report at least one rhythm metric (relative amplitude, acrophase, or interdaily stability) alongside conventional level-based summaries. This is a small addition to any analysis and would rapidly build the comparative base that currently does not exist.
- •
- Establish within-colony baselines and set control limits from them rather than from population set points.
- •
- Benchmark lead time explicitly against a threshold rule computed on the same data, using pre-specified decision rules and published code.
6. Conclusions
Circadian rhythms offer a powerful but underused framework for interpreting behavioural data in ecological monitoring, and honey bee colonies, whose activity reflects internal physiological processes and strongly cyclic external conditions, are a well-suited system in which to demonstrate it. Four insights emerge from this review. First, the sensing problem is largely solved: fourteen of the fifteen modalities surveyed already achieve the temporal resolution needed for rhythm analysis, and the simplest and cheapest of them routinely produce the season-long continuous records that it requires. Second, the analytical opportunity is largely unexploited: rhythm-derived quantities have been reported from only a handful of modalities, and raw series are routinely reduced to daily summaries or threshold events before the rhythmic structure can be examined. Third, set point alarms are late by construction in a system that actively defends its set points, so monitoring the behavioural effort required to maintain stability, rather than stability itself, is the more sensitive strategy; our synthetic example illustrates that mechanism and the workflow for detecting it, not the lead time to expect in real colonies. Fourth, the principal obstacles to adoption are not technical but biological and procedural: the plasticity of the colony rhythm with workforce composition, brood area, and season means that normative trajectories must be characterised empirically, and lead times must be benchmarked against threshold rules on the same real data using pre-specified decision rules. The seven recommendations in Section 5.3 are intended to make that validation possible with data that are already being collected. Although this review focuses on honey bees, circadian patterns structure behaviour in many species, and the same reasoning applies wherever animals are monitored continuously, linking field observation to physiological state in ecological research, health assessment, and animal management. The proposition is simple and testable: watch the rhythms in different signals, and the harmony among them, not only the levels.
Author Contributions
R.A.M. drafted an early version of the manuscript; D.C. updated the draft, performed the literature searches, and ran the simulation with analyses; J.F.C., M.A.T., C.D.M., F.M., C.M.S., M.D.M.P., L.A.A., B.H.P., R.M. and G.R.W. contributed critically to the drafts and gave final approval for publication. All authors have read and agreed to the published version of the manuscript.
Funding
This work was supported by the Marsden Fund Council from Government funding, managed by the Royal Society Te Apārangi: Marsden Grant 24-UOA-241 and a Catalyst Strategic Grant (Project ID: 23-UOA-039-CSG). Additional support was provided by the University of Auckland through the Transdisciplinary Ideation Fund.
Institutional Review Board Statement
Not applicable.
Informed Consent Statement
Not applicable.
Data Availability Statement
This review reports no primary empirical data. The script that generates the simulated dataset and the AnCiR session that reproduces the analysis for the worked example in Section 4 are available at https://doi.org/10.5281/zenodo.22884569. This study is a synthesis of monitoring technologies and an analytical framework; it does not involve primary field data collection.
Conflicts of Interest
The authors declare no conflicts of interest.
References
- Abdollahi, M.; Giovenazzo, P.; Falk, T.H. Automated Beehive Acoustics Monitoring: A Comprehensive Review of the Literature and Recommendations for Future Work. Appl. Sci. 2022, 12, 3920. [Google Scholar] [CrossRef] [Scilit]
- Degenfellner, J.; Templ, M. Modeling Bee Hive Dynamics: Assessing Colony Health Using Hive Weight and Environmental Parameters. Comput. Electron. Agric. 2024, 218, 108742. [Google Scholar] [CrossRef] [Scilit]
- Froy, O. Circadian Rhythms, Aging, and Life Span in Mammals. Physiology 2011, 26, 225–235. [Google Scholar] [CrossRef] [Scilit]
- Jerigova, V.; Zeman, M.; Okuliarova, M. Circadian Disruption and Consequences on Innate Immunity and Inflammatory Response. Int. J. Mol. Sci. 2022, 23, 13722. [Google Scholar] [CrossRef] [Scilit]
- Karatsoreos, I.N.; Bhagat, S.; Bloss, E.B.; Morrison, J.H.; McEwen, B.S. Disruption of Circadian Clocks Has Ramifications for Metabolism, Brain, and Behavior. Proc. Natl. Acad. Sci. USA 2011, 108, 1657–1662. [Google Scholar] [CrossRef] [Scilit]
- Tackenberg, M.C.; Giannoni-Guzmán, M.A.; Sanchez-Perez, E.; Doll, C.A.; Agosto-Rivera, J.L.; Broadie, K.; Moore, D.; McMahon, D.G. Neonicotinoids Disrupt Circadian Rhythms and Sleep in Honey Bees. Sci. Rep. 2020, 10, 17929. [Google Scholar] [CrossRef] [Scilit]
- Henry, M.; Béguin, M.; Requier, F.; Rollin, O.; Odoux, J.-F.; Aupinel, P.; Aptel, J.; Tchamitchian, S.; Decourtye, A. A Common Pesticide Decreases Foraging Success and Survival in Honey Bees. Science 2012, 336, 348–350. [Google Scholar] [CrossRef] [Scilit]
- Tison, L.; Hahn, M.-L.; Holtz, S.; Rößner, A.; Greggers, U.; Bischoff, G.; Menzel, R. Honey Bees’ Behavior Is Impaired by Chronic Exposure to the Neonicotinoid Thiacloprid in the Field. Environ. Sci. Technol. 2016, 50, 7218–7227. [Google Scholar] [CrossRef] [Scilit]
- Alleri, M.; Amoroso, S.; Catania, P.; Lo Verde, G.; Orlando, S.; Ragusa, E.; Sinacori, M.; Vallone, M.; Vella, A. Recent Developments on Precision Beekeeping: A Systematic Literature Review. J. Agric. Food Res. 2023, 14, 100726. [Google Scholar] [CrossRef] [Scilit]
- Jeong, K.; Oh, H.; Lee, Y.; Seo, H.; Jo, G.; Jeong, J.; Park, G.; Choi, J.; Seo, Y.-D.; Jeong, J.-H.; et al. IoT and AI Systems for Enhancing Bee Colony Strength in Precision Beekeeping: A Survey and Future Research Directions. IEEE Internet Things J. 2025, 12, 362–389. [Google Scholar] [CrossRef] [Scilit]
- Turyagyenda, A.; Katumba, A.; Akol, R.; Nsabagwa, M.; Mkiramweni, M.E. IoT and Machine Learning Techniques for Precision Beekeeping: A Review. AI 2025, 6, 26. [Google Scholar] [CrossRef] [Scilit]
- Abou-Shaara, H.F.; Owayss, A.A.; Ibrahim, Y.Y.; Basuny, N.K. A Review of Impacts of Temperature and Relative Humidity on Various Activities of Honey Bees. Insectes Sociaux 2017, 64, 455–463. [Google Scholar] [CrossRef] [Scilit]
- Barlow, S.E.; O’Neill, M.A. Technological Advances in Field Studies of Pollinator Ecology and the Future of E-Ecology. Curr. Opin. Insect Sci. 2020, 38, 15–25. [Google Scholar] [CrossRef] [Scilit]
- Danieli, P.P.; Addeo, N.F.; Lazzari, F.; Manganello, F.; Bovera, F. Precision Beekeeping Systems: State of the Art, Pros and Cons, and Their Application as Tools for Advancing the Beekeeping Sector. Animals 2023, 14, 70. [Google Scholar] [CrossRef] [Scilit]
- Hadjur, H.; Ammar, D.; Lefèvre, L. Toward an Intelligent and Efficient Beehive: A Survey of Precision Beekeeping Systems and Services. Comput. Electron. Agric. 2022, 192, 106604. [Google Scholar] [CrossRef] [Scilit]
- Zacepins, A.; Brusbardis, V.; Meitalovs, J.; Stalidzans, E. Challenges in the Development of Precision Beekeeping. Biosyst. Eng. 2015, 130, 60–71. [Google Scholar] [CrossRef] [Scilit]
- Zaman, A.; Dorin, A. A Framework for Better Sensor-Based Beehive Health Monitoring. Comput. Electron. Agric. 2023, 210, 107906. [Google Scholar] [CrossRef] [Scilit]
- Šabić, J.; Perković, T.; Šolić, P.; Šerić, L. Buzzing with Intelligence: A Systematic Review of Smart Beehive Technologies. Sensors 2025, 25, 5359. [Google Scholar] [CrossRef] [Scilit]
- Bloch, G.; Robinson, G.E. Reversal of Honeybee Behavioural Rhythms. Nature 2001, 410, 1048. [Google Scholar] [CrossRef] [Scilit]
- Bloch, G. The Social Clock of the Honeybee. J. Biol. Rhythms 2010, 25, 307–317. [Google Scholar] [CrossRef] [Scilit]
- Frisch, B.; Koeniger, N. Social Synchronization of the Activity Rhythms of Honeybees within a Colony. Behav. Ecol. Sociobiol. 1994, 35, 91–98. [Google Scholar] [CrossRef]
- Siehler, O.; Wang, S.; Bloch, G. Social Synchronization of Circadian Rhythms with a Focus on Honeybees. Philos. Trans. R. Soc. B 2021, 376, 20200342. [Google Scholar] [CrossRef] [Scilit]
- Siehler, O.; Bloch, G. Colony Volatiles and Substrate-Borne Vibrations Entrain Circadian Rhythms and Are Potential Cues Mediating Social Synchronization in Honey Bee Colonies. J. Biol. Rhythms 2020, 35, 246–256. [Google Scholar] [CrossRef] [Scilit]
- Heinrich, B. Keeping a Cool Head: Honeybee Thermoregulation. Science 1979, 205, 1269–1271. [Google Scholar] [CrossRef] [Scilit]
- Kleinhenz, M.; Bujok, B.; Fuchs, S.; Tautz, J. Hot Bees in Empty Broodnest Cells: Heating from Within. J. Exp. Biol. 2003, 206, 4217–4231. [Google Scholar] [CrossRef] [Scilit]
- Minaud, E.; Rebaudo, F.; Mainardi, G.; Vardakas, P.; Hatjina, F.; Steffan-Dewenter, I.; Requier, F. Temperature in Overwintering Honey Bee Colonies Reveals Brood Status and Predicts Colony Mortality. Ecol. Indic. 2024, 169, 112961. [Google Scholar] [CrossRef] [Scilit]
- Simpson, J. Nest Climate Regulation in Honey Bee Colonies. Science 1961, 133, 1327–1333. [Google Scholar] [CrossRef] [Scilit]
- Stabentheiner, A.; Kovac, H.; Brodschneider, R. Honeybee Colony Thermoregulation—Regulatory Mechanisms and Contribution of Individuals in Dependence on Age, Location and Thermal Stress. PLoS ONE 2010, 5, e8967. [Google Scholar] [CrossRef] [Scilit]
- Bencsik, M.; McVeigh, A.; Tsakonas, C.; Kumar, T.; Chamberlain, L.; Newton, M.I. A Monitoring System for Carbon Dioxide in Honeybee Hives: An Indicator of Colony Health. Sensors 2023, 23, 3588. [Google Scholar] [CrossRef] [Scilit]
- Meikle, W.G.; Barg, A.; Weiss, M. Honey Bee Colonies Maintain CO2 and Temperature Regimes in Spite of Change in Hive Ventilation Characteristics. Apidologie 2022, 53, 51. [Google Scholar] [CrossRef] [Scilit]
- Cecchi, S.; Spinsante, S.; Terenzi, A.; Orcioni, S. A Smart Sensor-Based Measurement System for Advanced Bee Hive Monitoring. Sensors 2020, 20, 2726. [Google Scholar] [CrossRef] [Scilit]
- Meikle, W.G.; Weiss, M. Temperature and CO2 Concentration in Honey Bee Hives Exhibit Circadian Rhythms. Sci. Rep. 2025, 15, 22042. [Google Scholar] [CrossRef] [Scilit]
- Ohashi, M.; Okada, R.; Kimura, T.; Ikeno, H. Observation System for the Control of the Hive Environment by the Honeybee (Apis mellifera). Behav. Res. Methods 2009, 41, 782–786. [Google Scholar] [CrossRef] [Scilit]
- Zhu, Y.; Abdollahi, M.; Maucourt, S.; Coallier, N.; Guimarães, H.R.; Giovenazzo, P.; Falk, T.H. MSPB: A Longitudinal Multi-Sensor Dataset with Phenotypic Trait Measurements from Honey Bees. Sci. Data 2024, 11, 860. [Google Scholar] [CrossRef] [Scilit]
- Colin, T.; Dakos, V.; Barron, A.B.; Meikle, W.G.; Altmann, E.G.; Latty, T. Temperature as an Early Warning Signal of Honeybee Colony Failure. Ecol. Inform. 2025, 92, 103445. [Google Scholar] [CrossRef] [Scilit]
- Bahreini, R.; Currie, R.W. The Potential of Bee-Generated Carbon Dioxide for Control of Varroa Mite (Mesostigmata: Varroidae) in Indoor Overwintering Honey Bee (Hymenoptera: Apidae) Colonies. J. Econ. Entomol. 2015, 108, 2153–2167. [Google Scholar] [CrossRef] [Scilit]
- Meikle, W.G.; Adamczyk, J.J.; Weiss, M.; Ross, J.; Werle, C.; Beren, E. Sublethal Concentrations of Clothianidin Affect Honey Bee Colony Growth and Hive CO2 Concentration. Sci. Rep. 2021, 11, 4364. [Google Scholar] [CrossRef] [Scilit]
- Szczurek, A.; Maciejewska, M.; Bąk, B.; Wilde, J.; Siuda, M. Semiconductor Gas Sensor as a Detector of Varroa Destructor Infestation of Honey Bee Colonies—Statistical Evaluation. Comput. Electron. Agric. 2019, 162, 405–411. [Google Scholar] [CrossRef] [Scilit]
- Szczurek, A.; Maciejewska, M.; Zajiczek, Ż.; Bąk, B.; Wilk, J.; Wilde, J.; Siuda, M. The Effectiveness of Varroa Destructor Infestation Classification Using an E-Nose Depending on the Time of Day. Sensors 2020, 20, 2532. [Google Scholar] [CrossRef] [Scilit]
- Szczurek, A.; Maciejewska, M. Beehive Air Sampling and Sensing Device Operation in Apicultural Applications—Methodological and Technical Aspects. Sensors 2021, 21, 4019. [Google Scholar] [CrossRef] [Scilit]
- McMinn-Sauder, H.B.G.; Colin, T.; Gaines Day, H.R.; Quinlan, G.; Smart, A.; Meikle, W.G.; Johnson, R.M.; Sponsler, D.B. Next-Generation Colony Weight Monitoring: A Review and Prospectus. Apidologie 2024, 55, 13. [Google Scholar] [CrossRef] [Scilit]
- Pandey, A.; Hasan, M.E.; Gour, S.S.; Kumar, A. Advancements in Beekeeping Practices: Integrating Continuous Weight Monitoring for Precision Hive Management. In Lecture Notes in Mechanical Engineering; Springer Nature: Singapore, 2026; pp. 337–347. ISBN 9789819528271. [Google Scholar]
- Ternar, T.N.; Giurgiu, A.I.; Albanese, G.; Urcan, A.C.; Bobiș, O.; Dezmirean, D.S. Types of Smart Devices Used for Beekeeping, Their Development and Possible Perspectives. An Overview. Sci. Pap. Anim. Sci. Biotechnol. 2025, 58, 250–263. [Google Scholar]
- Arias-Calluari, K.; Colin, T.; Latty, T.; Myerscough, M.; Altmann, E.G. Modelling Daily Weight Variation in Honey Bee Hives. PLoS Comput. Biol. 2023, 19, e1010880. [Google Scholar] [CrossRef] [Scilit]
- Meikle, W.G.; Rector, B.G.; Mercadier, G.; Holst, N. Within-Day Variation in Continuous Hive Weight Data as a Measure of Honey Bee Colony Activity. Apidologie 2008, 39, 694–707. [Google Scholar] [CrossRef] [Scilit]
- Meikle, W.G.; Weiss, M.; Stilwell, A.R. Monitoring Colony Phenology Using Within-Day Variability in Continuous Weight and Temperature of Honey Bee Hives. Apidologie 2016, 47, 1–14. [Google Scholar] [CrossRef] [Scilit]
- Meikle, W.G.; Holst, N. Application of Continuous Monitoring of Honeybee Colonies. Apidologie 2015, 46, 10–22. [Google Scholar] [CrossRef] [Scilit]
- Zacepins, A.; Kviesis, A.; Komasilovs, V.; Brodschneider, R. When It Pays to Catch a Swarm—Evaluation of the Economic Importance of Remote Honey Bee (Apis mellifera) Colony Swarming Detection. Agriculture 2021, 11, 967. [Google Scholar] [CrossRef] [Scilit]
- Seeley, T.D.; Kleinhenz, M.; Bujok, B.; Tautz, J. Thorough Warm-up before Take-off in Honey Bee Swarms. Naturwissenschaften 2003, 90, 256–260. [Google Scholar] [CrossRef] [Scilit]
- López-Fernández, L.; Lagüela, S.; Rodríguez-Gonzálvez, P.; Martín-Jiménez, J.A.; González-Aguilera, D. Close-Range Photogrammetry and Infrared Imaging for Non-Invasive Honeybee Hive Population Assessment. ISPRS Int. J. Geo-Inf. 2018, 7, 350. [Google Scholar] [CrossRef] [Scilit]
- Shaw, J.A.; Nugent, P.W.; Johnson, J.; Bromenshenk, J.J.; Henderson, C.B.; Debnam, S. Long-Wave Infrared Imaging for Non-Invasive Beehive Population Assessment. Opt. Express 2010, 19, 399. [Google Scholar] [CrossRef] [Scilit]
- Ono, M.; Igarashi, T.; Ohno, E.; Sasaki, M. Unusual Thermal Defence by a Honeybee against Mass Attack by Hornets. Nature 1995, 377, 334–336. [Google Scholar] [CrossRef] [Scilit]
- Sipos, T.; Orsi-Gibicsár, S.; Schieszl, T.; Donkó, T.; Zakk, Z.; Farkas, S.; Binder, A.; Keszthelyi, S. Tracking Varroa Parasitism Using Handheld Infrared Cameras: Is Eusocial Fever the Key? Insects 2024, 15, 693. [Google Scholar] [CrossRef] [Scilit]
- Williams, S.M.; Bariselli, S.; Palego, C.; Holland, R.; Cross, P. A Comparison of Machine-Learning Assisted Optical and Thermal Camera Systems for Beehive Activity Counting. Smart Agric. Technol. 2022, 2, 100038. [Google Scholar] [CrossRef] [Scilit]
- Bell, H.C.; Keitzman, P.M.; Nieh, J.C. The Complex World of Honey Bee Vibrational Signaling: A Response to Ramsey et al. (2017). arXiv 2024, arXiv:2408.14430. [Google Scholar]
- Ramsey, M.; Bencsik, M.; Newton, M.I. Long-Term Trends in the Honeybee ‘Whooping Signal’ Revealed by Automated Detection. PLoS ONE 2017, 12, e0171162. [Google Scholar] [CrossRef] [Scilit]
- Cejrowski, T.; Szymański, J.; Logofătu, D. Buzz-Based Recognition of the Honeybee Colony Circadian Rhythm. Comput. Electron. Agric. 2020, 175, 105586. [Google Scholar] [CrossRef] [Scilit]
- Mezquida, D.A.; Martínez, J.L. Short Communication. Platform for Bee-Hives Monitoring Based on Sound Analysis. A Perpetual Wareh. Swarm’s Dly. Act. Span. J. Agric. Res. 2009, 7, 824–828. [Google Scholar] [CrossRef] [Scilit]
- Kirchner, W.H. Acoustical Communication in Social Insects. In Orientation and Communication in Arthropods; Birkhäuser: Basel, Switzerland, 1997; pp. 273–300. ISBN 978-3-0348-9811-9. [Google Scholar]
- Michelsen, A.; Kirchner, W.H.; Andersen, B.B.; Lindauer, M. The Tooting and Quacking Vibration Signals of Honeybee Queens: A Quantitative Analysis. J. Comp. Physiol. A 1986, 158, 605–611. [Google Scholar] [CrossRef] [Scilit]
- Zgank, A. Acoustic Monitoring and Classification of Bee Swarm Activity Using MFCC Feature Extraction and HMM Acoustic Modeling. In Proceedings of the 2018 ELEKTRO; IEEE: New York, NY, USA, 2018; pp. 1–4. [Google Scholar]
- Zlatkova, A.; Kokolanski, Z.; Tashkovski, D. Honeybees Swarming Detection Approach by Sound Signal Processing. In Proceedings of the 2020 XXIX International Scientific Conference Electronics (ET); IEEE: New York, NY, USA, 2020; pp. 1–3. [Google Scholar]
- Qandour, A.; Ahmad, I.; Habibi, D.; Leppard, M. Remote Beehive Monitoring Using Acoustic Signals. Acoust. Aust. 2014, 42, 204–209. [Google Scholar]
- Sharif, M.Z.; Wario, F.; Di, N.; Xue, R.; Liu, F. Soundscape Indices: New Features for Classifying Beehive Audio Samples. Sociobiology 2020, 67, 566–571. [Google Scholar] [CrossRef] [Scilit]
- Zhao, Y.; Deng, G.; Zhang, L.; Di, N.; Jiang, X.; Li, Z. Based Investigate of Beehive Sound to Detect Air Pollutants by Machine Learning. Ecol. Inform. 2021, 61, 101246. [Google Scholar] [CrossRef] [Scilit]
- Uthoff, C.; Homsi, M.N.; von Bergen, M. Acoustic and Vibration Monitoring of Honeybee Colonies for Beekeeping-Relevant Aspects of Presence of Queen Bee and Swarming. Comput. Electron. Agric. 2023, 205, 107589. [Google Scholar] [CrossRef] [Scilit]
- Michelsen, A.; Kirchner, W.H.; Lindauer, M. Sound and Vibrational Signals in the Dance Language of the Honeybee, Apis mellifera. Behav. Ecol. Sociobiol. 1986, 18, 207–212. [Google Scholar] [CrossRef] [Scilit]
- Painter-Kurt, S.; Schneider, S.S. Age and Behavior of Honey Bees, Apis mellifera (Hymenoptera: Apidae), That Perform Vibration Signals on Workers. Ethology 1998, 104, 457–473. [Google Scholar] [CrossRef] [Scilit]
- Ngo, T.N.; Wu, K.-C.; Yang, E.-C.; Lin, T.-T. A Real-Time Imaging System for Multiple Honey Bee Tracking and Activity Monitoring. Comput. Electron. Agric. 2019, 163, 104841. [Google Scholar] [CrossRef] [Scilit]
- Rodriguez, I.F.; Chan, J.; Alvarez Rios, M.; Branson, K.; Agosto-Rivera, J.L.; Giray, T.; Mégret, R. Automated Video Monitoring of Unmarked and Marked Honey Bees at the Hive Entrance. Front. Comput. Sci. 2022, 3, 769338. [Google Scholar] [CrossRef] [Scilit]
- Voudiotis, G.; Kontogiannis, S.; Pikridas, C. Proposed Smart Monitoring System for the Detection of Bee Swarming. Inventions 2021, 6, 87. [Google Scholar] [CrossRef] [Scilit]
- Bjerge, K.; Frigaard, C.E.; Mikkelsen, P.H.; Nielsen, T.H.; Misbih, M.; Kryger, P. A Computer Vision System to Monitor the Infestation Level of Varroa Destructor in a Honeybee Colony. Comput. Electron. Agric. 2019, 164, 104898. [Google Scholar] [CrossRef] [Scilit]
- Crawford, E.; Leidenberger, S.; Norrström, N.; Niklasson, M. Using Video Footage for Observing Honey Bee Behaviour at Hive Entrances. Bee World 2022, 99, 139–142. [Google Scholar] [CrossRef] [Scilit]
- Sevín, S.; Tutun, H.; Mutlu, S. Detection of Varroa Mites from Honey Bee Hives by Smart Technology Var-Gor: A Hive Monitoring and Image Processing Device. Turk. J. Vet. Anim. Sci. 2021, 45, 487–491. [Google Scholar] [CrossRef] [Scilit]
- Yang, C.; Collins, J.; Beckerleg, M. A Model for Pollen Measurement Using Video Monitoring of Honey Bees. Sens. Imaging 2018, 19, 2. [Google Scholar] [CrossRef] [Scilit]
- Chiron, G.; Gomez-Krämer, P.; Ménard, M.; Requier, F. 3D Tracking of Honeybees Enhanced by Environmental Context. In Lecture Notes in Computer Science; Springer: Berlin/Heidelberg, Germany, 2013; pp. 702–711. ISBN 978-3-642-41180-9. [Google Scholar]
- Poidatz, J.; Chiron, G.; Kennedy, P.; Osborne, J.; Requier, F. Density of Predating Asian Hornets at Hives Disturbs the 3D Flight Performance of Honey Bees and Decreases Predation Success. Ecol. Evol. 2023, 13, e9902. [Google Scholar] [CrossRef] [Scilit]
- Vo-Doan, T.T.; Titov, V.V.; Harrap, M.J.M.; Lochner, S.; Straw, A.D. High-Resolution Outdoor Videography of Insects Using Fast Lock-On Tracking. Sci. Robot. 2024, 9, eadm7689. [Google Scholar] [CrossRef] [Scilit]
- Landgraf, T.; Rojas, R.; Nguyen, H.; Kriegel, F.; Stettin, K. Analysis of the Waggle Dance Motion of Honeybees for the Design of a Biomimetic Honeybee Robot. PLoS ONE 2011, 6, e21354. [Google Scholar] [CrossRef] [Scilit]
- Siefert, P.; Buling, N.; Grünewald, B. Honey Bee Behaviours within the Hive: Insights from Long-Term Video Analysis. PLoS ONE 2021, 16, e0247323. [Google Scholar] [CrossRef] [Scilit]
- Voudiotis, G.; Moraiti, A.; Kontogiannis, S. Deep Learning Beehive Monitoring System for Early Detection of the Varroa Mite. Signals 2022, 3, 506–523. [Google Scholar] [CrossRef] [Scilit]
- Bermig, S.; Odemer, R.; Gombert, A.J.; Frommberger, M.; Rosenquist, R.; Pistorius, J. Experimental Validation of an Electronic Counting Device to Determine Flight Activity of Honey Bees (Apis mellifera L.). J. Cultiv. Plants 2020, 72. [Google Scholar] [CrossRef]
- Greggers, U.; Koch, G.; Schmidt, V.; Dürr, A.; Floriou-Servou, A.; Piepenbrock, D.; Göpfert, M.C.; Menzel, R. Reception and Learning of Electric Fields in Bees. Proc. R. Soc. B. 2013, 280, 20130528. [Google Scholar] [CrossRef] [Scilit]
- Nunes-Silva, P.; Hrncir, M.; Guimarães, J.T.F.; Arruda, H.; Costa, L.; Pessin, G.; Siqueira, J.O.; de Souza, P.; Imperatriz-Fonseca, V.L. Applications of RFID Technology on the Study of Bees. Insectes Sociaux 2019, 66, 15–24. [Google Scholar] [CrossRef] [Scilit]
- Mellert, J.; Kłos, W.; Dormagen, D.M.; Wild, B.; Zachariae, A.; Smith, M.L.; Galizia, C.G.; Landgraf, T. Collective Flow of Circadian Clock Information in Honeybee Colonies. bioRxiv 2024. [Google Scholar] [CrossRef] [Scilit]
- Odemer, R. Approaches, Challenges and Recent Advances in Automated Bee Counting Devices: A Review. Ann. Appl. Biol. 2022, 180, 73–89. [Google Scholar] [CrossRef] [Scilit]
- Bromenshenk, J.; Henderson, C.; Seccomb, R.; Welch, P.; Debnam, S.; Firth, D. Bees as Biosensors: Chemosensory Ability, Honey Bee Monitoring Systems, and Emergent Sensor Technologies Derived from the Pollinator Syndrome. Biosensors 2015, 5, 678–711. [Google Scholar] [CrossRef] [Scilit]
- Bordier, C.; Klein, S.; Le Conte, Y.; Barron, A.B.; Alaux, C. Stress Decreases Pollen Foraging Performance in Honeybees. J. Exp. Biol. 2018, 221, 171470. [Google Scholar] [CrossRef] [Scilit]
- Colin, T.; Warren, R.J.; Quarrell, S.R.; Allen, G.R.; Barron, A.B. Evaluating the Foraging Performance of Individual Honey Bees in Different Environments with Automated Field RFID Systems. Ecosphere 2022, 13, e4088. [Google Scholar] [CrossRef] [Scilit]
- Merk, J.; Anastasi, M.; McGruddy, R.; Manley, B.; Felden, A.; Lester, P.J. Longevity and Foraging Performance of Honey Bees Treated with an RNAi-Based Varroa Destructor Biopesticide. Sci. Rep. 2026, 16, 8208. [Google Scholar] [CrossRef] [Scilit]
- Perry, C.J.; Søvik, E.; Myerscough, M.R.; Barron, A.B. Rapid Behavioral Maturation Accelerates Failure of Stressed Honey Bee Colonies. Proc. Natl. Acad. Sci. USA 2015, 112, 3427–3432. [Google Scholar] [CrossRef]
- Tenczar, P.; Lutz, C.C.; Rao, V.D.; Goldenfeld, N.; Robinson, G.E. Automated Monitoring Reveals Extreme Interindividual Variation and Plasticity in Honeybee Foraging Activity Levels. Anim. Behav. 2014, 95, 41–48. [Google Scholar] [CrossRef] [Scilit]
- Riley, J.R.; Smith, A.D.; Reynolds, D.R.; Edwards, A.S.; Osborne, J.L.; Williams, I.H.; Carreck, N.L.; Poppy, G.M. Tracking Bees with Harmonic Radar. Nature 1996, 379, 29–30. [Google Scholar] [CrossRef] [Scilit]
- Riley, J.R.; Greggers, U.; Smith, A.D.; Reynolds, D.R.; Menzel, R. The Flight Paths of Honeybees Recruited by the Waggle Dance. Nature 2005, 435, 205–207. [Google Scholar] [CrossRef] [Scilit]
- Woodgate, J.L.; Makinson, J.C.; Rossi, N.; Lim, K.S.; Reynolds, A.M.; Rawlings, C.J.; Chittka, L. Harmonic Radar Tracking Reveals That Honeybee Drones Navigate between Multiple Aerial Leks. iScience 2021, 24, 102499. [Google Scholar] [CrossRef] [Scilit]
- Cheeseman, J.F.; Millar, C.D.; Greggers, U.; Lehmann, K.; Pawley, M.D.M.; Gallistel, C.R.; Warman, G.R.; Menzel, R. Way-Finding in Displaced Clock-Shifted Bees Proves Bees Use a Cognitive Map. Proc. Natl. Acad. Sci. USA 2014, 111, 8949–8954. [Google Scholar] [CrossRef] [Scilit]
- Wang, Z.; Chen, X.; Becker, F.; Greggers, U.; Walter, S.; Werner, M.; Gallistel, C.R.; Menzel, R. Honey Bees Infer Source Location from the Dances of Returning Foragers. Proc. Natl. Acad. Sci. USA 2023, 120, e2213068120. [Google Scholar] [CrossRef] [Scilit]
- Requier, F.; Henry, M.; Decourtye, A.; Brun, F.; Aupinel, P.; Rebaudo, F.; Bretagnolle, V. Measuring Ontogenetic Shifts in Central-place Foragers: A Case Study with Honeybees. J. Anim. Ecol. 2020, 89, 1860–1871. [Google Scholar] [CrossRef] [Scilit]
- Beyaert, L.; Greggers, U.; Menzel, R. Honeybees Consolidate Navigation Memory during Sleep. J. Exp. Biol. 2012, 215, 3981–3988. [Google Scholar] [CrossRef] [Scilit]
- Prado, A.; Requier, F.; Crauser, D.; Le Conte, Y.; Bretagnolle, V.; Alaux, C. Honeybee Lifespan: The Critical Role of Pre-Foraging Stage. R. Soc. Open Sci. 2020, 7, 200998. [Google Scholar] [CrossRef] [Scilit]
- Henry, M.; Bertrand, C.; Le Féon, V.; Requier, F.; Odoux, J.-F.; Aupinel, P.; Bretagnolle, V.; Decourtye, A. Pesticide Risk Assessment in Free-Ranging Bees Is Weather and Landscape Dependent. Nat. Commun. 2014, 5, 4359. [Google Scholar] [CrossRef] [Scilit]
- Schneider, C.W.; Tautz, J.; Grünewald, B.; Fuchs, S. RFID Tracking of Sublethal Effects of Two Neonicotinoid Insecticides on the Foraging Behavior of Apis mellifera. PLoS ONE 2012, 7, e30023. [Google Scholar] [CrossRef] [Scilit]
- Benaets, K.; Van Geystelen, A.; Cardoen, D.; De Smet, L.; de Graaf, D.C.; Schoofs, L.; Larmuseau, M.H.D.; Brettell, L.E.; Martin, S.J.; Wenseleers, T. Covert Deformed Wing Virus Infections Have Long-Term Deleterious Effects on Honeybee Foraging and Survival. Proc. R. Soc. B Biol. Sci. 2017, 284, 20162149. [Google Scholar] [CrossRef] [Scilit]
- Kim, J.; Jung, M.; Kim, H.G.; Lee, D.-H. Potential of Harmonic Radar System for Use on Five Economically Important Insects: Radar Tag Attachment on Insects and Its Impact on Flight Capacity. J. Asia-Pac. Entomol. 2016, 19, 371–375. [Google Scholar] [CrossRef] [Scilit]
- Tison, L.; Duer, A.; Púčiková, V.; Greggers, U.; Menzel, R. Detrimental Effects of Clothianidin on Foraging and Dance Communication in Honey Bees. PLoS ONE 2020, 15, e0241134. [Google Scholar] [CrossRef] [Scilit]
- Souza Cunha, A.E.; Rose, J.; Prior, J.; Aumann, H.M.; Emanetoglu, N.W.; Drummond, F.A. A Novel Non-Invasive Radar to Monitor Honey Bee Colony Health. Comput. Electron. Agric. 2020, 170, 105241. [Google Scholar] [CrossRef] [Scilit]
- Aumann, H.M.; Aumann, M.K.; Emanetoglu, N.W. Janus: A Combined Radar and Vibration Sensor for Beehive Monitoring. IEEE Sens. Lett. 2021, 5, 1–4. [Google Scholar] [CrossRef] [Scilit]
- Kurin, T.; Horlbeck, M.; Dafner, M.; Dorn, C.; Reissland, T.; Weigel, R.; Lurz, F. A Novel Noninvasive Micro-Doppler-Radar-Based Beehive Monitoring System. In Proceedings of the 2023 Asia-Pacific Microwave Conference (APMC); IEEE: New York, NY, USA, 2023; pp. 306–308. [Google Scholar]
- Williams, S.M.; Aldabashi, N.; Cross, P.; Palego, C. Challenges in Developing a Real-Time Bee-Counting Radar. Sensors 2023, 23, 5250. [Google Scholar] [CrossRef] [Scilit]
- Thielens, A.; Greco, M.K.; Verloock, L.; Martens, L.; Joseph, W. Radio-Frequency Electromagnetic Field Exposure of Western Honey Bees. Sci. Rep. 2020, 10, 461. [Google Scholar] [CrossRef] [Scilit]
- Shaw, J.A.; Seldomridge, N.L.; Dunkle, D.L.; Nugent, P.W.; Spangler, L.H.; Bromenshenk, J.J.; Henderson, C.B.; Churnside, J.H.; Wilson, J.J. Polarization Lidar Measurements of Honey Bees in Flight for Locating Land Mines. Opt. Express 2005, 13, 5853–5863. [Google Scholar] [CrossRef] [Scilit]
- Brydegaard, M.; Jansson, S. Advances in Entomological Laser Radar. J. Eng. 2019, 2019, 7542–7545. [Google Scholar] [CrossRef] [Scilit]
- Campbell, J.M.; Dahn, D.C.; Ryan, D.A.J. Capacitance-Based Sensor for Monitoring Bees Passing through a Tunnel. Meas. Sci. Technol. 2005, 16, 2503–2510. [Google Scholar] [CrossRef] [Scilit]
- Rowe, E.B.; Prathibha, P.; Marting, P.R.; Smith, M.L. Honey Bee Beards: Internal and External Factors Driving Mass Thermoregulatory Evacuation. Insectes Sociaux 2025, 73, 201–211. [Google Scholar] [CrossRef] [Scilit]
- Clarke, D.; Morley, E.; Robert, D. The Bee, the Flower, and the Electric Field: Electric Ecology and Aerial Electroreception. J. Comp. Physiol. A 2017, 203, 737–748. [Google Scholar] [CrossRef] [Scilit]
- Paffhausen, B.H.; Petrasch, J.; Greggers, U.; Duer, A.; Wang, Z.; Menzel, S.; Stieber, P.; Haink, K.; Geldenhuys, M.; Čavojská, J.; et al. The Electronic Bee Spy: Eavesdropping on Honeybee Communication via Electrostatic Field Recordings. Front. Behav. Neurosci. 2021, 15, 647224. [Google Scholar] [CrossRef] [Scilit]
- Refinetti, R.; Cornélissen, G.; Halberg, F. Procedures for Numerical Analysis of Circadian Rhythms. Biol. Rhythm Res. 2007, 38, 275–325. [Google Scholar] [CrossRef] [Scilit]
- Gonçalves, B.S.B.; Cavalcanti, P.R.A.; Tavares, G.R.; Campos, T.F.; Araujo, J.F. Nonparametric Methods in Actigraphy: An Update. Sleep Sci. 2014, 7, 158–164. [Google Scholar] [CrossRef] [Scilit]
- Khoury, D.S.; Myerscough, M.R.; Barron, A.B. A Quantitative Model of Honey Bee Colony Population Dynamics. PLoS ONE 2011, 6, e18491. [Google Scholar] [CrossRef] [Scilit]
- Casey, T.; Plaut, K.; Boerman, J. Circadian Clocks and Their Role in Lactation Competence. Domest. Anim. Endocrinol. 2022, 78, 106680. [Google Scholar] [CrossRef] [Scilit]
- Dakos, V.; Carpenter, S.R.; Brock, W.A.; Ellison, A.M.; Guttal, V.; Ives, A.R.; Kéfi, S.; Livina, V.; Seekell, D.A.; van Nes, E.H.; et al. Methods for Detecting Early Warnings of Critical Transitions in Time Series Illustrated Using Simulated Ecological Data. PLoS ONE 2012, 7, e41010. [Google Scholar] [CrossRef] [Scilit]
- Scheffer, M.; Bascompte, J.; Brock, W.A.; Brovkin, V.; Carpenter, S.R.; Dakos, V.; Held, H.; van Nes, E.H.; Rietkerk, M.; Sugihara, G. Early-Warning Signals for Critical Transitions. Nature 2009, 461, 53–59. [Google Scholar] [CrossRef] [Scilit]
- Van Someren, E.J.W.; Swaab, D.F.; Colenda, C.C.; Cohen, W.; McCall, W.V.; Rosenquist, P.B. Bright Light Therapy: Improved Sensitivity to Its Effects on Rest-Activity Rhythms in Alzheimer Patients by Application of Nonparametric Methods. Chronobiol. Int. 1999, 16, 505–518. [Google Scholar] [CrossRef] [Scilit]
- Witting, W.; Kwa, I.H.; Eikelenboom, P.; Mirmiran, M.; Swaab, D.F. Alterations in the Circadian Rest-Activity Rhythm in Aging and Alzheimer’s Disease. Biol. Psychiatry 1990, 27, 563–572. [Google Scholar] [CrossRef] [Scilit]
- Shemesh, Y.; Cohen, M.; Bloch, G. Natural Plasticity in Circadian Rhythms Is Mediated by Reorganization in the Molecular Clockwork in Honeybees. FASEB J. 2007, 21, 2304–2311. [Google Scholar] [CrossRef] [Scilit]
- Eban-Rothschild, A.D.; Bloch, G. Differences in the Sleep Architecture of Forager and Young Honeybees (Apis mellifera). J. Exp. Biol. 2008, 211, 2408–2416. [Google Scholar] [CrossRef] [Scilit]
- Fuchikawa, T.; Eban-Rothschild, A.; Nagari, M.; Shemesh, Y.; Bloch, G. Potent Social Synchronization Can Override Photic Entrainment of Circadian Rhythms. Nat. Commun. 2016, 7, 11662. [Google Scholar] [CrossRef] [Scilit]
- Stabentheiner, A.; Pressl, H.; Papst, T.; Hrassnigg, N.; Crailsheim, K. Endothermic Heat Production in Honeybee Winter Clusters. J. Exp. Biol. 2003, 206, 353–358. [Google Scholar] [CrossRef] [Scilit]
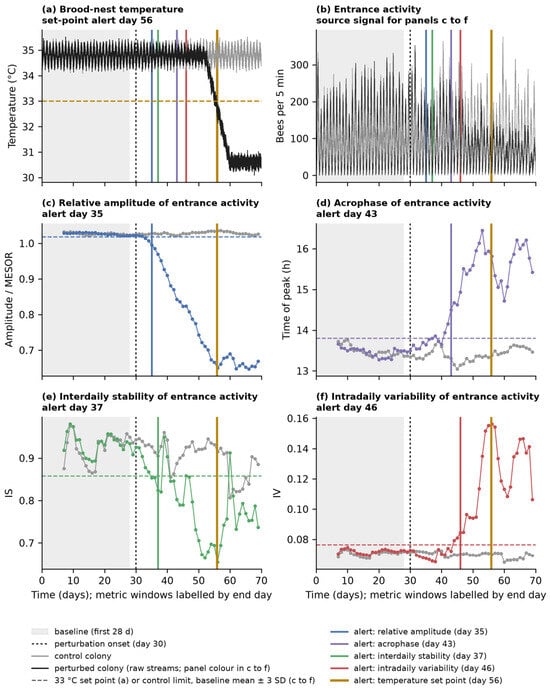
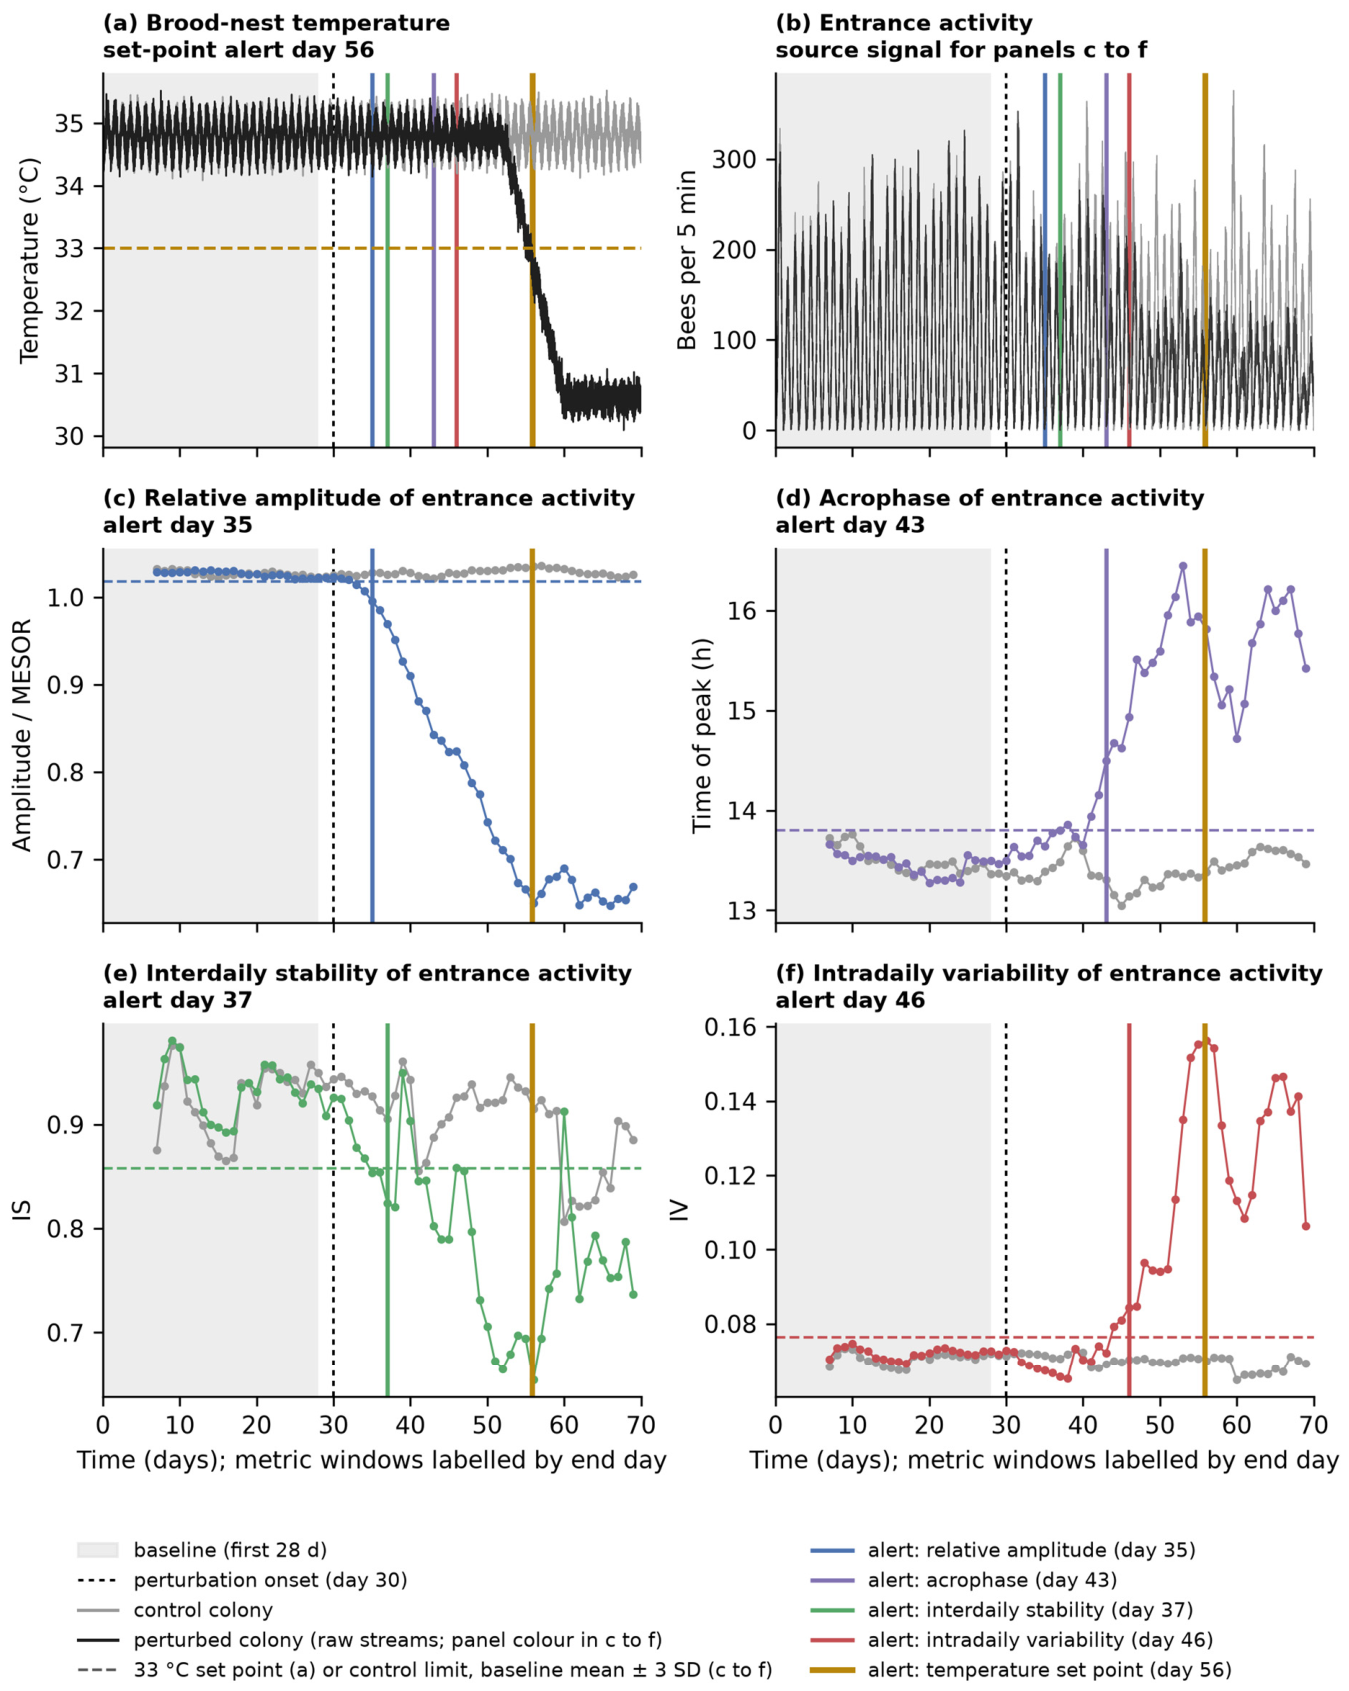

Disclaimer/Publisher’s Note: The statements, opinions and data contained in all publications are solely those of the individual author(s) and contributor(s) and not of MDPI and/or the editor(s). MDPI and/or the editor(s) disclaim responsibility for any injury to people or property resulting from any ideas, methods, instructions or products referred to in the content. |
© 2026 by the authors. Licensee MDPI, Basel, Switzerland. This article is an open access article distributed under the terms and conditions of the Creative Commons Attribution (CC BY) license.