


Simple Summary
As stressors are ubiquitous in the environment, organisms need to regulate their behavioral and physiological responses to cope with such challenges. Sea cucumbers (Apostichopus japonicus) are invertebrates lacking a centralized brain, and they exhibit the fleeing, adhesion, and thanatosis patterns in response to different stressors. We performed a transcriptomic analysis of coelomocytes on stressed sea cucumbers to elucidate the potential molecular mechanisms underlying these stress response patterns. This study can deepen our understanding of stress response patterns in sea cucumbers and provide valuable insights into the stress responses of invertebrates that lack a centralized brain.
Abstract
Sea cucumbers (Apostichopus japonicus) show fleeing, adhesion, and thanatosis patterns upon exposure to various stressors. However, the molecular mechanisms underlying these contrasting stress response patterns remain largely unknown. In the present study, we performed a transcriptomic analysis of coelomocytes on stressed sea cucumbers to elucidate the potential molecular mechanisms. The RNA-seq results revealed that several matrix metalloproteinase (MMP) family genes, along with HTR4, HRH2, and ADRA1D (which are involved in neuroactive ligand–receptor interactions), were significantly upregulated in the fleeing pattern. These genes may facilitate rapid movement. In the adhesion pattern, PHKA and PGK were significantly downregulated, and the differentially expressed genes (DEGs) were significantly enriched in the longevity regulating pathway, accompanied by downregulation of KRAS and HSPA1. These genes and the pathway may be involved in the reallocation of energy resources during the adhesion pattern. In the thanatosis pattern, DEGs were significantly enriched in the MAPK signaling pathway (including upregulation of ANGPT1 and FGFR1) and in the Rap1 and Ras signaling pathways (with downregulation of key genes: RAPGEF4, RRAS2, and RaLA). These genes potentially contribute to sustaining the thanatosis pattern. These transcriptomic profiles provide novel insights into the distinct molecular signatures underlying each stress response pattern in A. japonicus.
1. Introduction
As stressors are ubiquitous in the environment, organisms need to regulate behavioral and physiological responses to resist stressors [1]. These responses are crucial for their survival [2]. Fleeing, freezing and thanatosis are common stress response patterns, exhibiting distinct behavioral and physiological alterations [3,4,5]. Sea cucumbers are non-centralized brain invertebrates [6]. The natural geographical range of Apostichopus japonicus extends across the coasts of China, Japan, Korea, and the Russian Far East [7]. Furthermore, they actively farmed in aquaculture due to their high economic value [8]. Intensive aquaculture mitigates certain environmental stressors, but some stressors are inevitable. The death of some individuals in a sea cucumber population exposes the remaining individuals to conspecific carcasses, which is a stressor that exists in both natural and aquaculture environments. In aquaculture environments, aquafarmers use pressurized water jets to rinse feces from the bottom of the culture tanks. This inevitably subjects sea cucumbers to the seawater rinsing. To grade by size, aqua-farmers place sea cucumbers on a mesh sieve and shake it back and forth so that smaller individuals fall through while larger ones remain. This process inevitably subjects sea cucumbers to mechanical disturbance. Our previous study demonstrated that A. japonicus exhibits fleeing, adhesion and thanatosis patterns to different stressors [9]. Escape responses are characterized by faster movement speeds and regulated by the concerted action of multiple neurotransmitters [10,11]. During the fleeing pattern, sea cucumbers exhibit increased movement speed, along with elevated concentrations of serotonin and norepinephrine [9,11]. However, it remains unclear whether additional neurotransmitters contribute to this response and what mechanisms sustain continuous rapid crawling. In the adhesion pattern, increased adhesion capacity is associated with elevated cortisol and reduced Gamma-aminobutyric acid (GABA) levels [9]. Upon exposure to stressors, both cortisol and GABA participate in the adaptive reallocation of energy metabolism [12,13]. Whether the energy allocation changes during this stress response pattern remains unknown. In the thanatosis pattern, sea cucumbers become motionless and contract into a spherical shape, accompanied by a reduction in glucose levels [9,14]. This contractile response requires sustained muscle contraction. The signaling pathways regulating muscle contraction and glucose fluctuations remain unclear. These unanswered questions limit our in-depth understanding of stress response patterns in sea cucumbers.
Molecular processes are closely related to behavioral and physiological responses [15]. The gene expression serves as the basis for linking genotype to phenotype, and RNA synthesis constructs complex gene expression networks [16]. Transcriptome analysis has become a common tool in the stress physiology of marine organisms [17,18,19], because it enables the genome-wide identification of differentially expressed gens and provides crucial information on the molecular determinants of phenotypic responses [20]. Based on these advantages, this approach has been increasingly utilized to investigate the molecular mechanisms of stress response in sea cucumbers exposed to various stressors [21,22,23]. Chang et al. (2022) used transcriptomic sequencing to elucidate how sea cucumbers (A. japonicus) respond to heat stress at the molecular level [21]. Similarly, Jiang et al. (2024) applied this method to reveal the changes in energy metabolism in sea cucumbers (Holothuria moebii) exposed to hypotonic environment [22]. Therefore, transcriptomics is a suitable method to elucidate the molecular mechanisms of fleeing, adhesion and thanatosis patterns.
The present study aimed to comparatively elucidate the molecular mechanisms underlying fleeing, adhesion and thanatosis patterns using the method of transcriptomic sequencing. Our findings extend current knowledge of how sea cucumbers respond to stressful stimuli at the mechanistic level.
2. Materials and Methods
2.1. Experimental Animals and Housing Conditions
The sea cucumber individuals (~10 g) used in this experiment were transported from Dalian Xinyulong Marine Organisms Seed Industry Technology Co., Ltd. (Dalian, China) to the Key Laboratory of Mariculture & Stock Enhancement in the North China’s Sea, Ministry of Agriculture and Rural Affairs at Dalian Ocean University (38°81′ N, 121°39′ E). To adapt to the laboratory environment, sea cucumbers were randomly distributed among four stocked tanks (80 cm × 50 cm × 55 cm) and were fed daily for five days. During the acclimation period, all tanks were supplied with filtered seawater under constant aeration, and received adequate food. The food consisted of sea mud mixed with a commercial diet in a 4:1 ratio. The commercial diet was provided by Anyuan Industrial Co., Ltd. (Dalian, China). Any uneaten food and feces were cleared from the tanks each day. Additionally, 25% of the seawater volume in every tank was replaced daily. A portable water quality meter (YSI Incorporated, Yellow Springs, OH, USA) was used to measure water quality parameters daily for five days prior to the start of the experiment. Dissolved oxygen was 7.46 ± 0.08 mg/L, salinity 29.14 ± 0.04, pH 8.06 ± 0.02 and water temperature 8.46 ± 0.03 °C (mean ± SE).
2.2. Experiment Design
Three distinct types of stressors were applied to sea cucumbers to induce the specific stress response patterns. These stressors were based on our previous method [9], and consisted of exposure to conspecific carcasses, seawater rinsing, and mechanical disturbance. In A. japonicus, a coelomic cavity containing coelomic fluid lies between the body wall and the visceral mass [24]. This unique body structure enables neurotransmitters, neuropeptides, and hormones to be released into the coelomic fluid and distributed via it to act as systemic signals. During stress responses, coelomocytes continuously exchange molecular signals with the neuroendocrine system and the musculature. Each group contained three individuals, and coelomocytes from each individual were separately subjected to transcriptomic analysis.
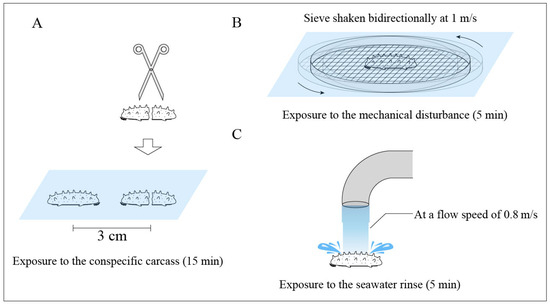
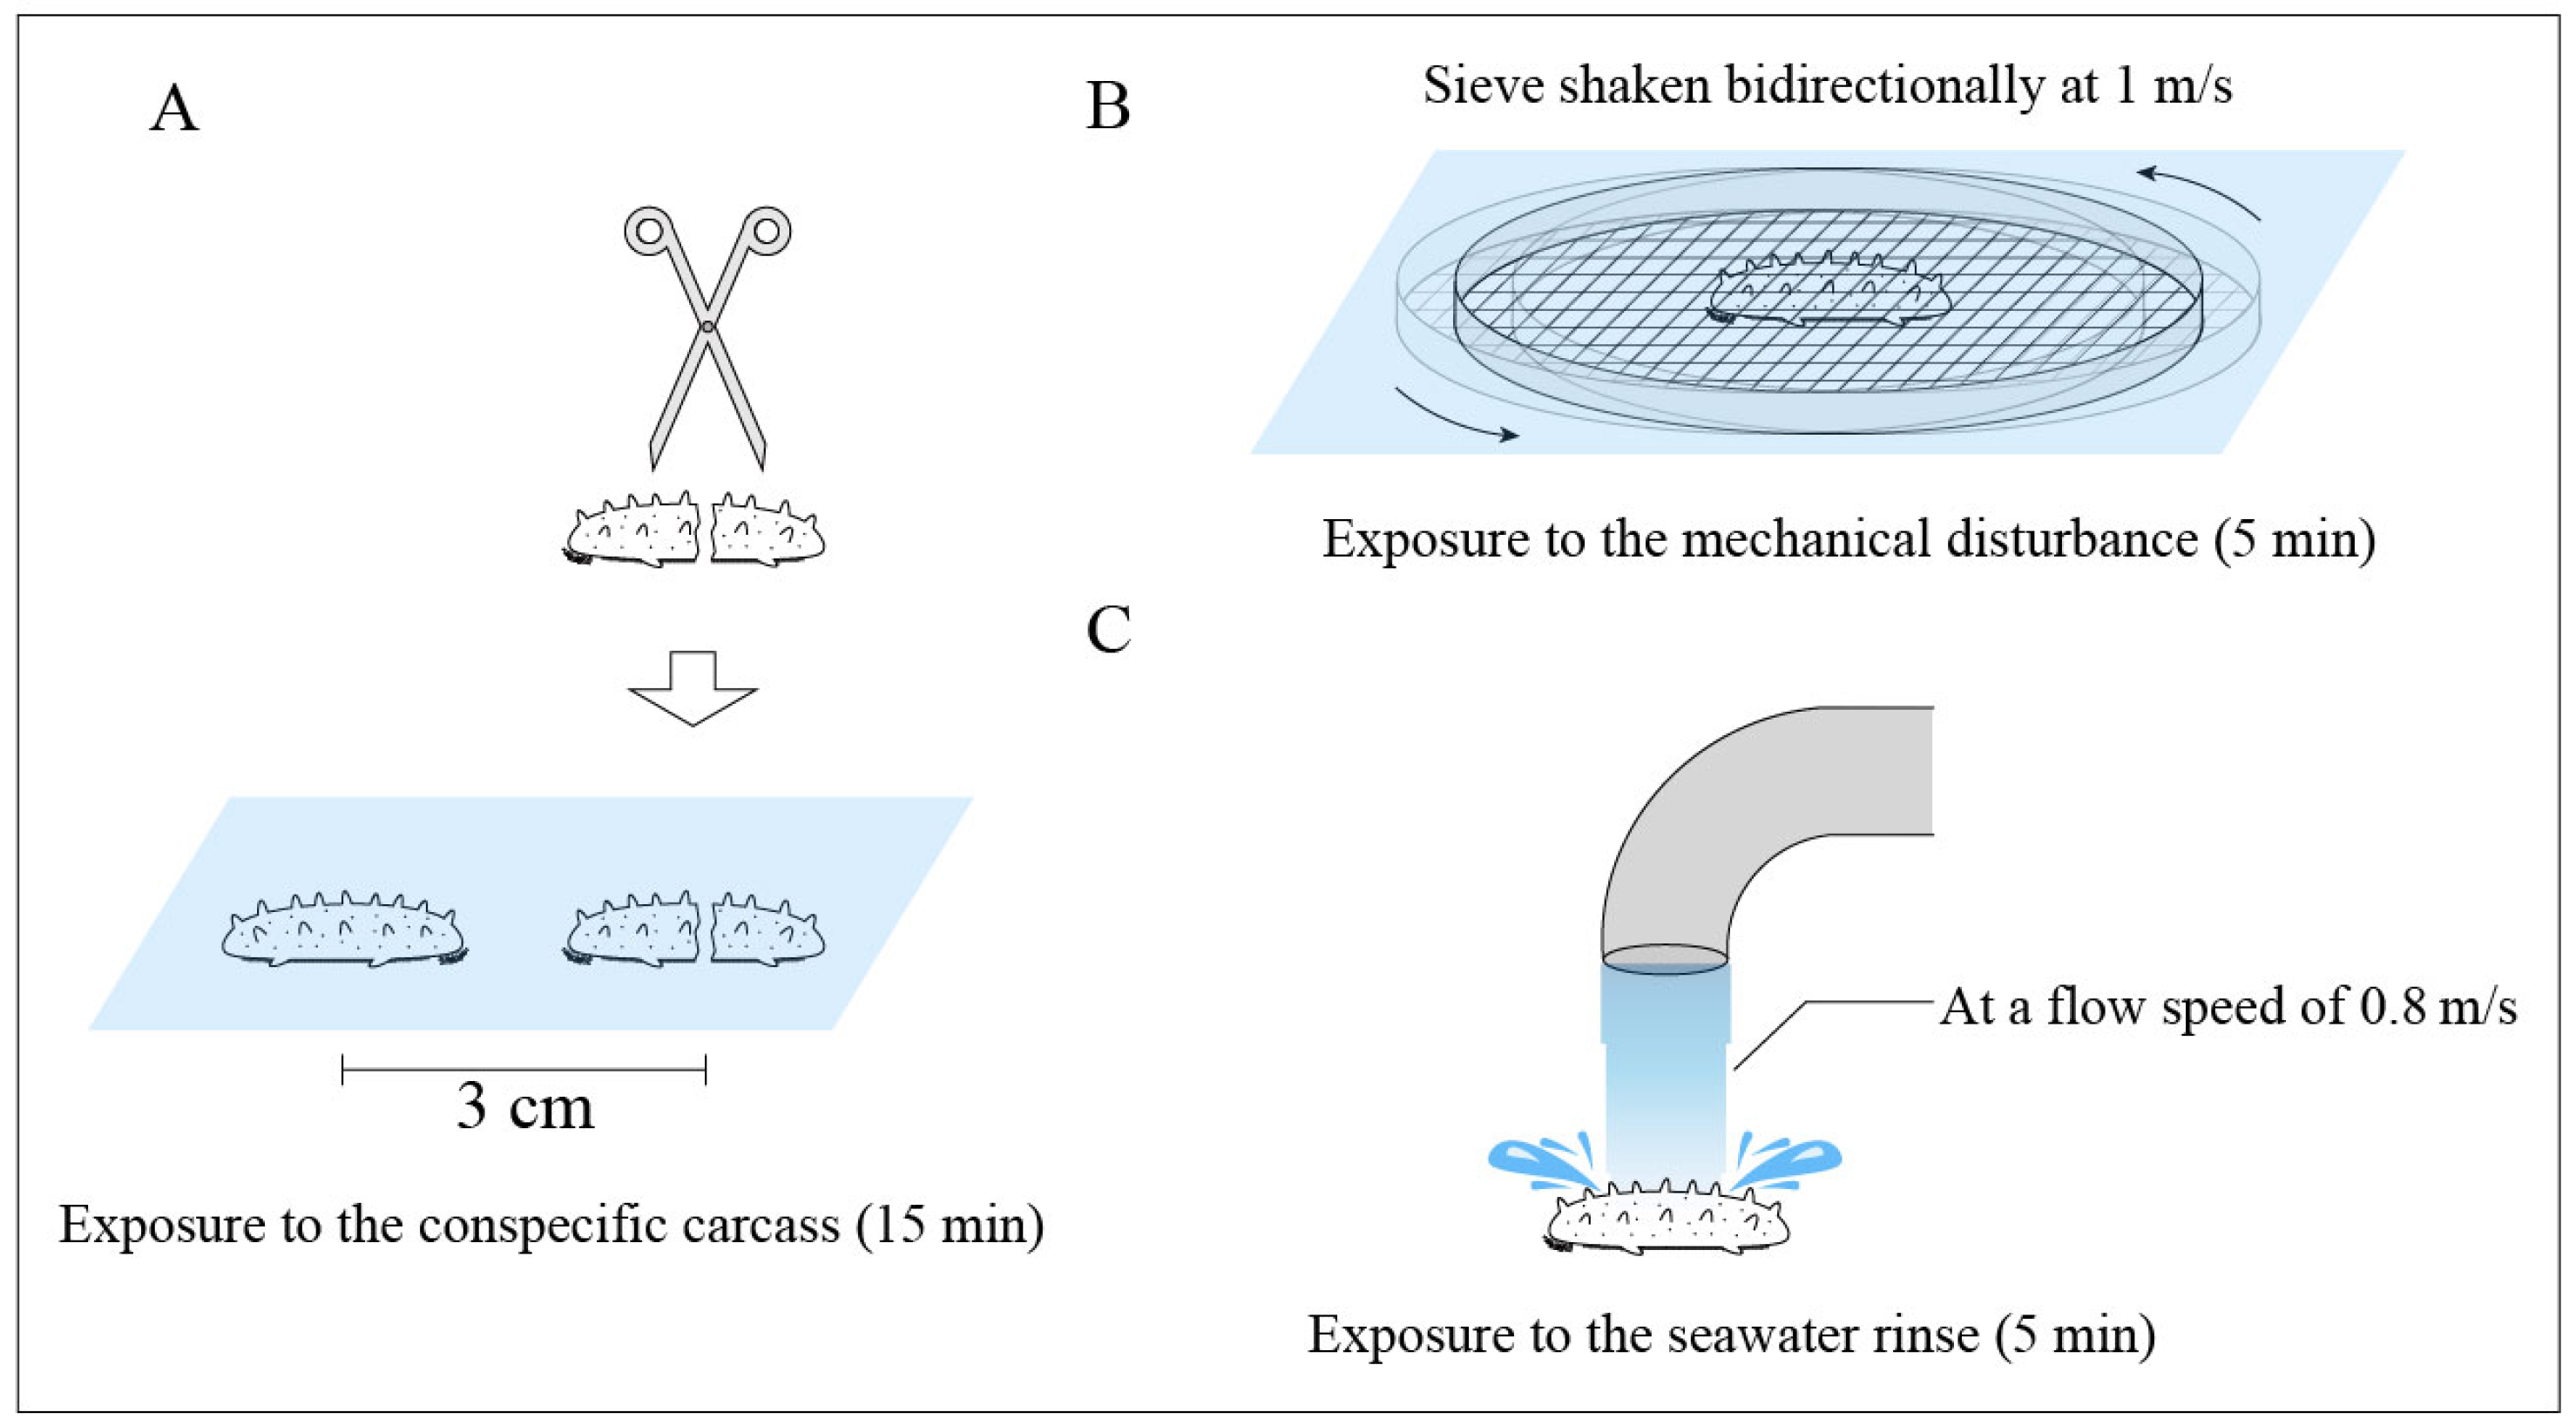
Sea cucumbers were induced to exhibit the fleeing pattern by exposure to conspecific carcasses, following the experimental procedure below. One sea cucumber perished from oxygen deprivation in a plastic box without aeration (length × width × height: 20 cm × 20 cm × 15 cm). Its carcass was then bisected and used as a stressor of conspecific carcass. The conspecific carcass was positioned on the floor of the container (length × width × height: 45 cm × 33 cm × 10 cm). Meanwhile, the experimental sea cucumber was placed at a distance of 3 cm from the dead conspecific stressor, and this exposure lasted for 15 min (Figure 1A). The sea cucumbers induced into the fleeing pattern by using the above method were designated as group F. Sea cucumbers were induced to exhibit the adhesion pattern by exposure to a 5 min rinse of seawater at a flow speed of 0.8 m/s (Figure 1C). The sea cucumbers induced into the adhesion pattern by using the above method were designated as group A. Sea cucumbers were induced to exhibit the thanatosis pattern by mechanical disturbance following experimental procedure below. The experimental procedure involved putting a sea cucumber into a plastic sieve and then shaking the sieve bidirectionally at a speed of 1 m/s in seawater for 5 min (Figure 1B). Sea cucumbers that entered the thanatosis pattern via the above procedure were assigned to group T. Individuals not subjected to any stressor served as the control group (group C).
Figure 1.
Sea cucumbers were exposed to conspecific carcasses (A), mechanical disturbance (B), and seawater rinsing (C), respectively.
2.3. Sample Collection
These coelomocytes samples were collected immediately upon stressor removal. Sea cucumbers from each group were dissected along their ventral sides on an ice surface. Coelomic fluid was collected into 1.5 mL centrifuge tubes using sterilized syringes. Subsequently, the collected samples were centrifuged at 3000 rpm for 10 min using a refrigerated centrifuge (Eppendorf AG, Hamburg, Germany) at 4 °C. The coelomocytes at the bottom of the centrifuge tubes were retained and kept in a −80 °C freezer for subsequent analysis.
2.4. Transcriptomic Analyses
2.4.1. RNA Extraction, Library Construction and Transcriptome Analyses
Following the instructions provided by the manufacturer, the total RNA was isolated from coelomocytes with TRIzol reagent (Invitrogen, Carlsbad, CA, USA). The concentration and purity of the RNA were assessed on an Agilent 2100 Bioanalyzer system (Agilent Technologies, Santa Clara, CA, USA). The RNA integrity number (RIN) of all samples exceeded 7.0. Following quality control validation, mRNA enrichment was carried out with oligo(dT)-conjugated magnetic beads. The enriched mRNA was then fragmented into pieces of appropriate size using a fragmentation buffer. First-strand cDNA was synthesized from the enriched mRNA using random hexamer primers through reverse transcription. Subsequently, the second-strand cDNA was synthesized to form double-stranded DNA. Next, the DNA fragments were subjected to end repair, A-tailing (adenylation), adaptor ligation, and PCR amplification. Finally, the PCR products were purified to obtain the final library. Following circularization, the single-stranded library was subjected to rolling circle amplification (RCA) using phi29 polymerase to generate DNA nanoballs (DNBs), each containing over 300 copies of the original circularized molecule. These DNBs were then deposited onto a patterned nanoarray, and paired-end 150 bp (PE150) sequencing was performed on the DNBSEQ platform using the DNBSEQ-T7 instrument (BGI-Shenzhen, China) in Wuhan.
2.4.2. Read Mapping to the Reference Genome
The raw data were filtered using SOAPnuke (version 1.6.5) [25]. Clean reads were obtained after the removal of reads containing adapter sequences, reads containing poly-N, and low-quality reads from raw data. The filtered clean reads were saved in FASTQ format. Additionally, the Q20 and Q30 scores of the clean reads were calculated to assess sequencing quality. These high-quality clean reads served as the basis for all subsequent analyses. The reference genome and annotation files of the sea cucumber (A. japonicus) were obtained from the website at https://doi.org/10.1038/s41597-023-02368-9 [26]. HISAT (version 2.2.1) was employed to map the clean reads to the reference genome [27]. To identify novel transcripts, the genome-aligned reads were assembled into transcripts using StringTie (version 2.2.1) for each sample. All assembled transcripts were merged with Cuffmerge and compared to the reference annotation with Cuffcompare. Those with class codes “u”, “i”, “o”, or “j” were defined as novel. A custom reference transcriptome was then constructed by combining the known reference transcripts and the novel transcripts. Subsequently, the quality-controlled clean data were aligned to the custom reference transcriptome (including known and novel transcripts) using Bowtie2 (version 2.4.5) [28], and the gene expression levels in each sample were calculated using the RSEM (version 1.3.1) software package [29].
2.4.3. Differential Gene Expression Analysis
DESeq2 (version 1.40.2) was employed to compare gene expression levels across different groups [30], with significance thresholds set at a |log2 fold change| ≥ 1 and a Q value (adjusted p-value) ˂ 0.05. A heatmap of the DEGs was generated using the heatmap function in software R (version 4.4.2) to visualize clustering patterns.
2.4.4. GO and KEGG Enrichment Analysis of DEGs
Functional categorization of the DEGs was conducted based on Gene Ontology (GO) and Kyoto Encyclopedia of Genes and Genomes (KEGG). Enrichment analyses for KEGG pathways and GO terms were performed using the phyper function in software R (version 4.4.2). Pathways with a Q-value ˂ 0.05 were deemed to exhibit statistically significant enrichment.
2.4.5. Reverse Transcription-Quantitative PCR (RT-qPCR) Validation
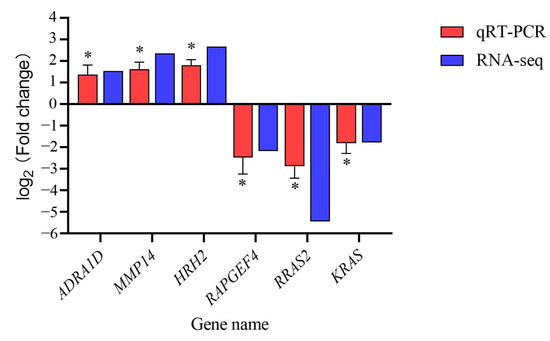
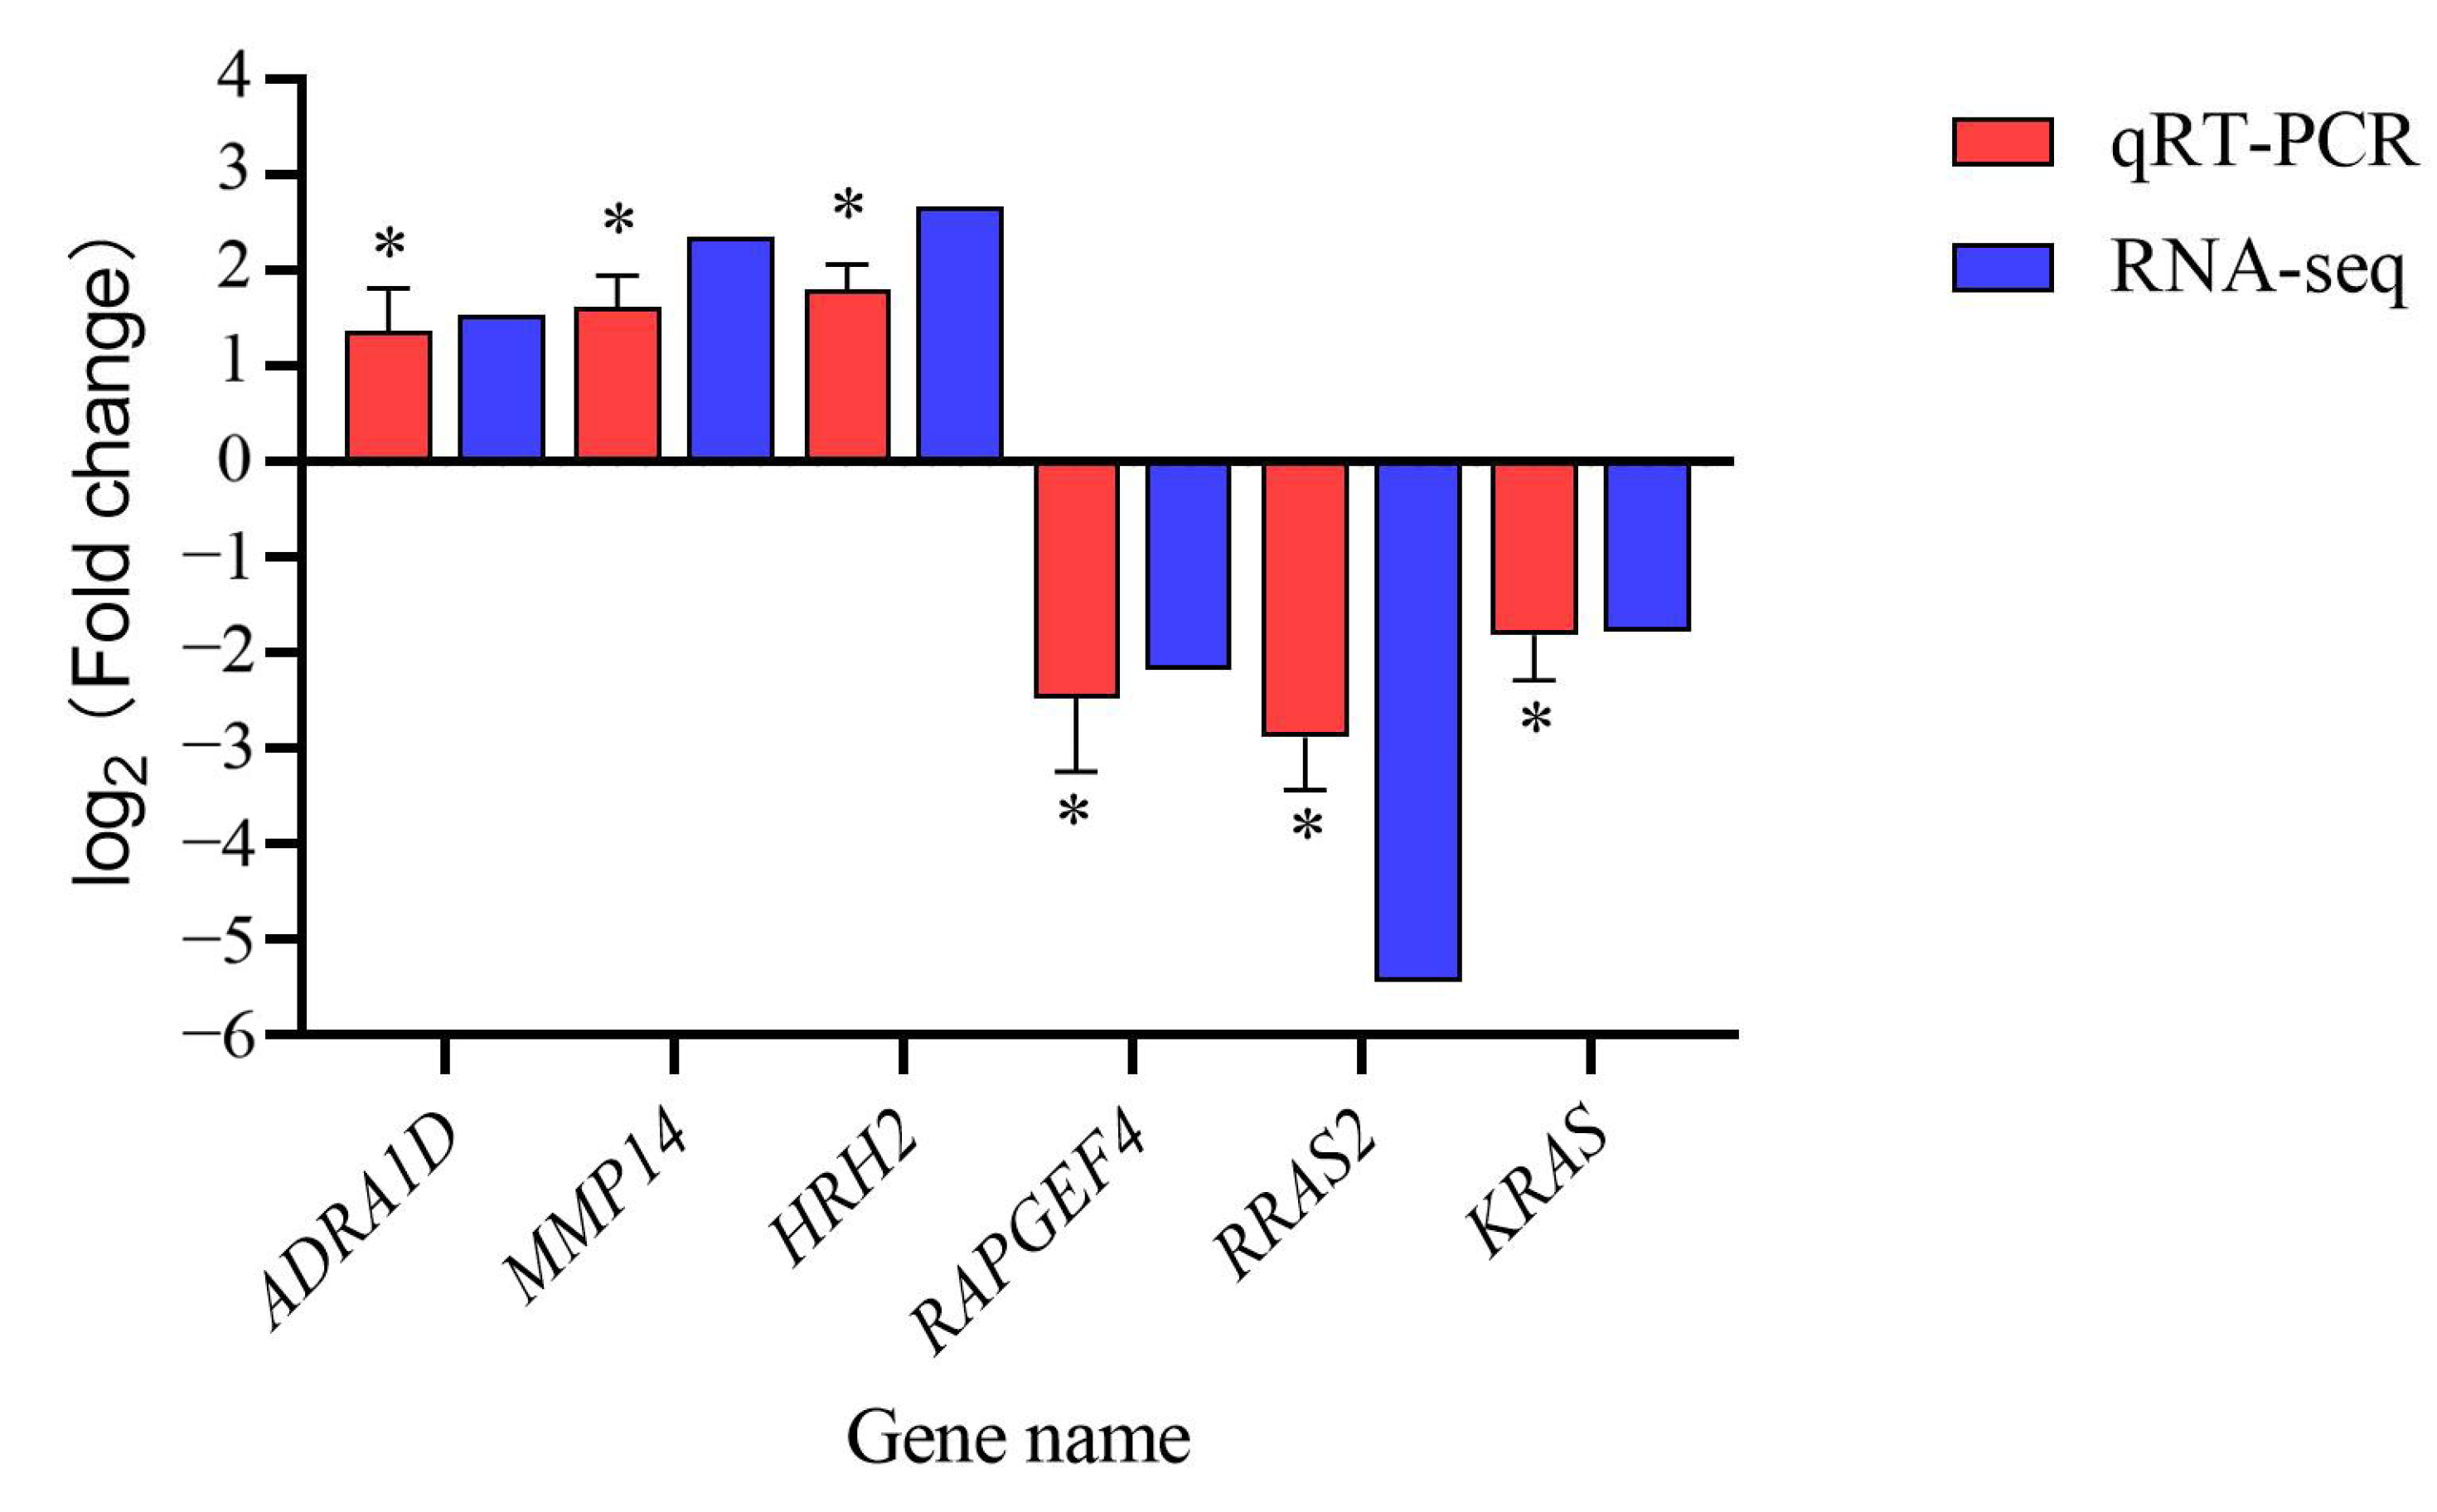
To validate the RNA-seq results, we randomly selected 6 DEGs for RT-qPCR validation. Coelomocyte RNA was reverse-transcribed into cDNA using the FastKing One-Step gDNA Removal and cDNA First-Strand Synthesis PreMix KR118-02 (TIANGEN Biotech Co., Ltd., Beijing, China) according to the manufacturer’s instructions. Primers were designed using NCBI Primer-BLAST (https://www.ncbi.nlm.nih.gov/tools/primer-blast/, accessed on 25 April 2026), and all primer sequences were provided in Table 1. Real-time PCR was performed on a QuantStudio 1 Plus Real-Time PCR System (Thermo Fisher Scientific, Waltham, MA, USA) using the TIANGEN FP217-02 kit (TIANGEN Biotech Co., Ltd., Beijing, China). The thermal cycling conditions were as follows: initial denaturation at 95 °C for 2 min, followed by 40 cycles of denaturation at 95 °C for 5 s and annealing at 60 °C for 15 s. The Cytb gene was used as the reference gene for normalization of target gene expression [31]. The relative expression level of the target gene was calculated using the 2−ΔΔCt method, and the results are presented as log2 fold change. The software SPSS (version 20) was used for data analysis. The Shapiro-Wilk test was used to assess normality. As the data were normally distributed, an independent samples t-test was used to compare the differences between groups. Statistical significance was set at p < 0.05.
Table 1.
Sequences of primers used for quantitative real-time PCR.
3. Results
3.1. Transcriptome Sequencing and Assembly
Transcriptome sequencing was performed on coelomocyte samples from sea cucumbers in groups C, F, A and T, respectively. After quality control, we obtained approximately 79.55 Gb of sequencing data. Each sample produced an average of 6.63 Gb data, with Q20 exceeding 98.46%, Q30 above 95.06%, and a clean reads ratio greater than 97.92% (The data are presented in the Appendix A Table A1). Sequence mapping analysis revealed that the total mapping rate for all samples was between 84.21% and 87.19%, while the proportion uniquely mapped to the reference genome ranged from 76.52% to 81.27% (The data are presented in the Appendix A Table A2). These results indicate high quality of the sequencing and library construction, confirming that the samples are appropriate for further analysis.
3.2. Analysis of Differentially Expressed Genes (DEGs)
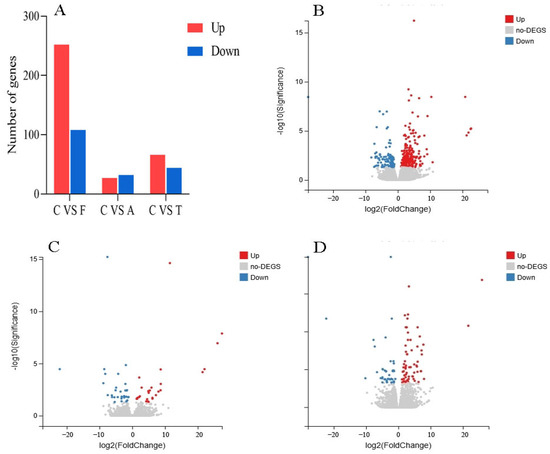
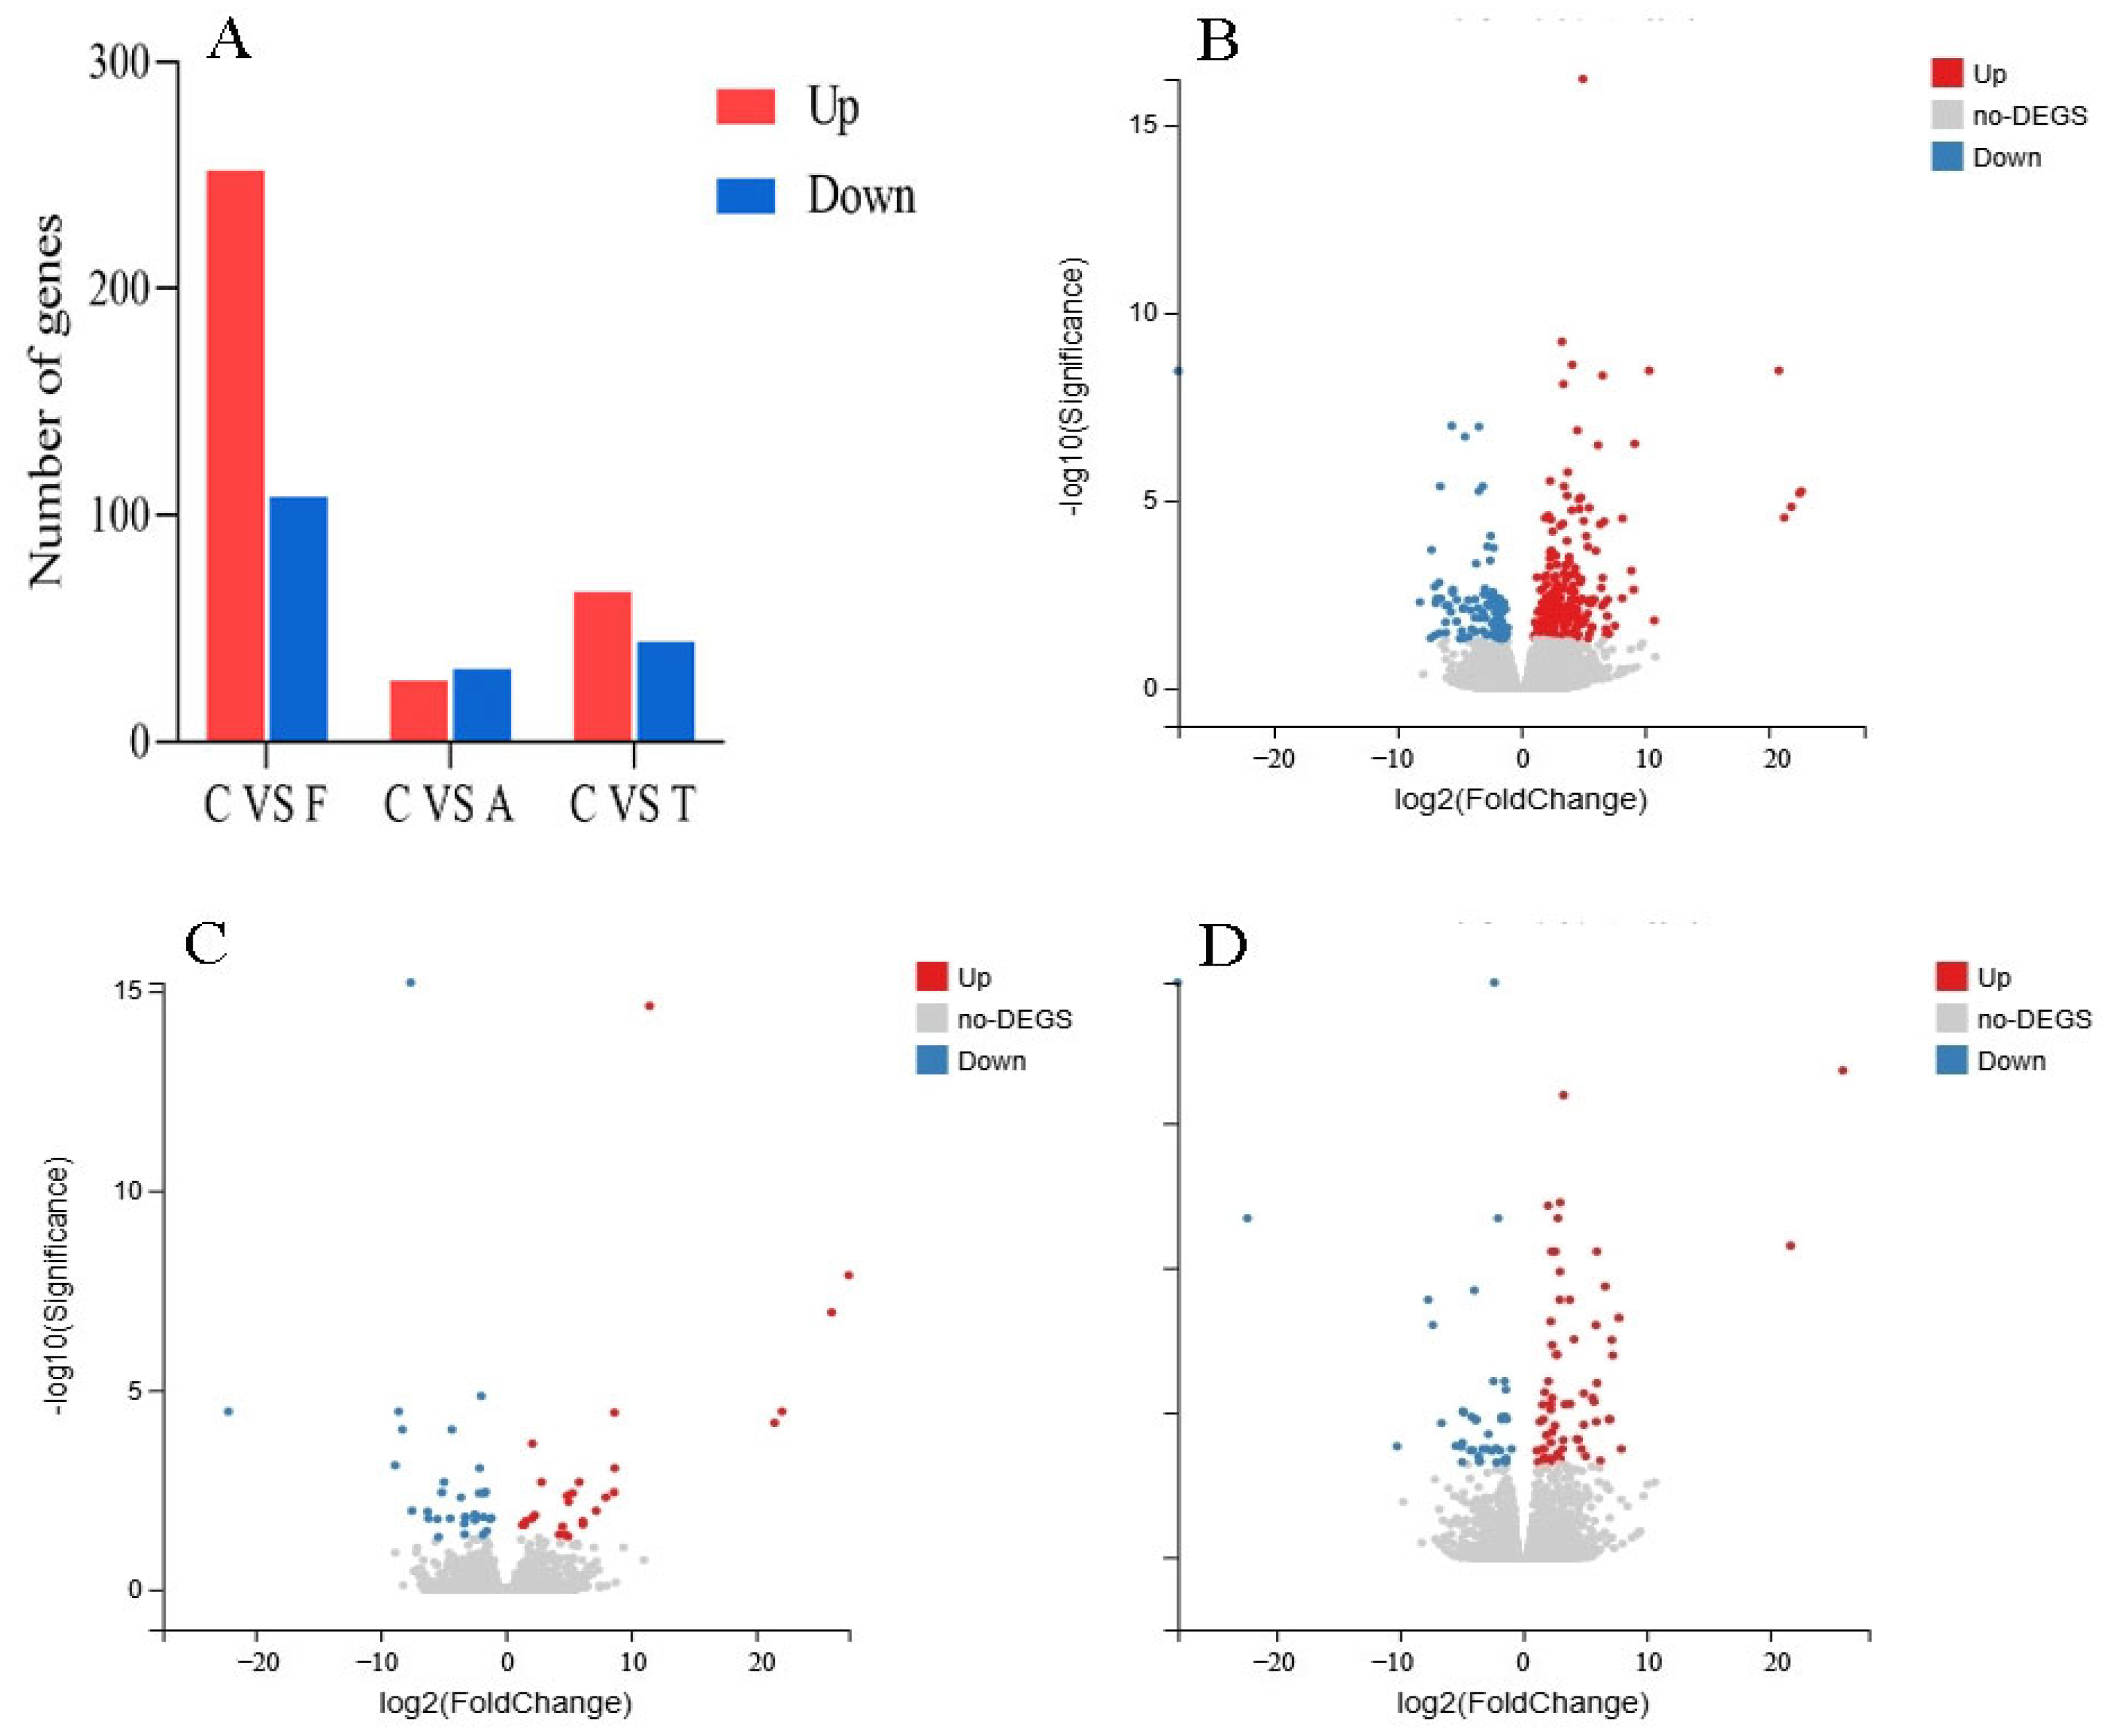
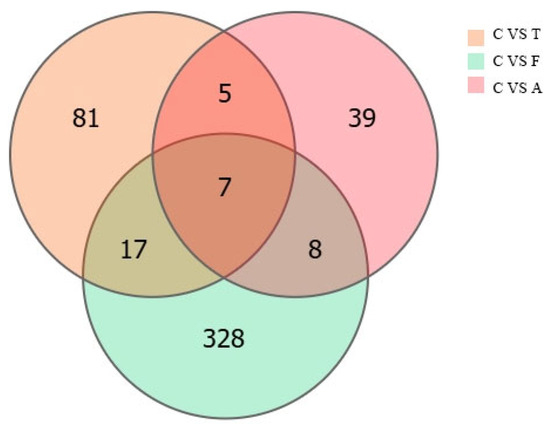
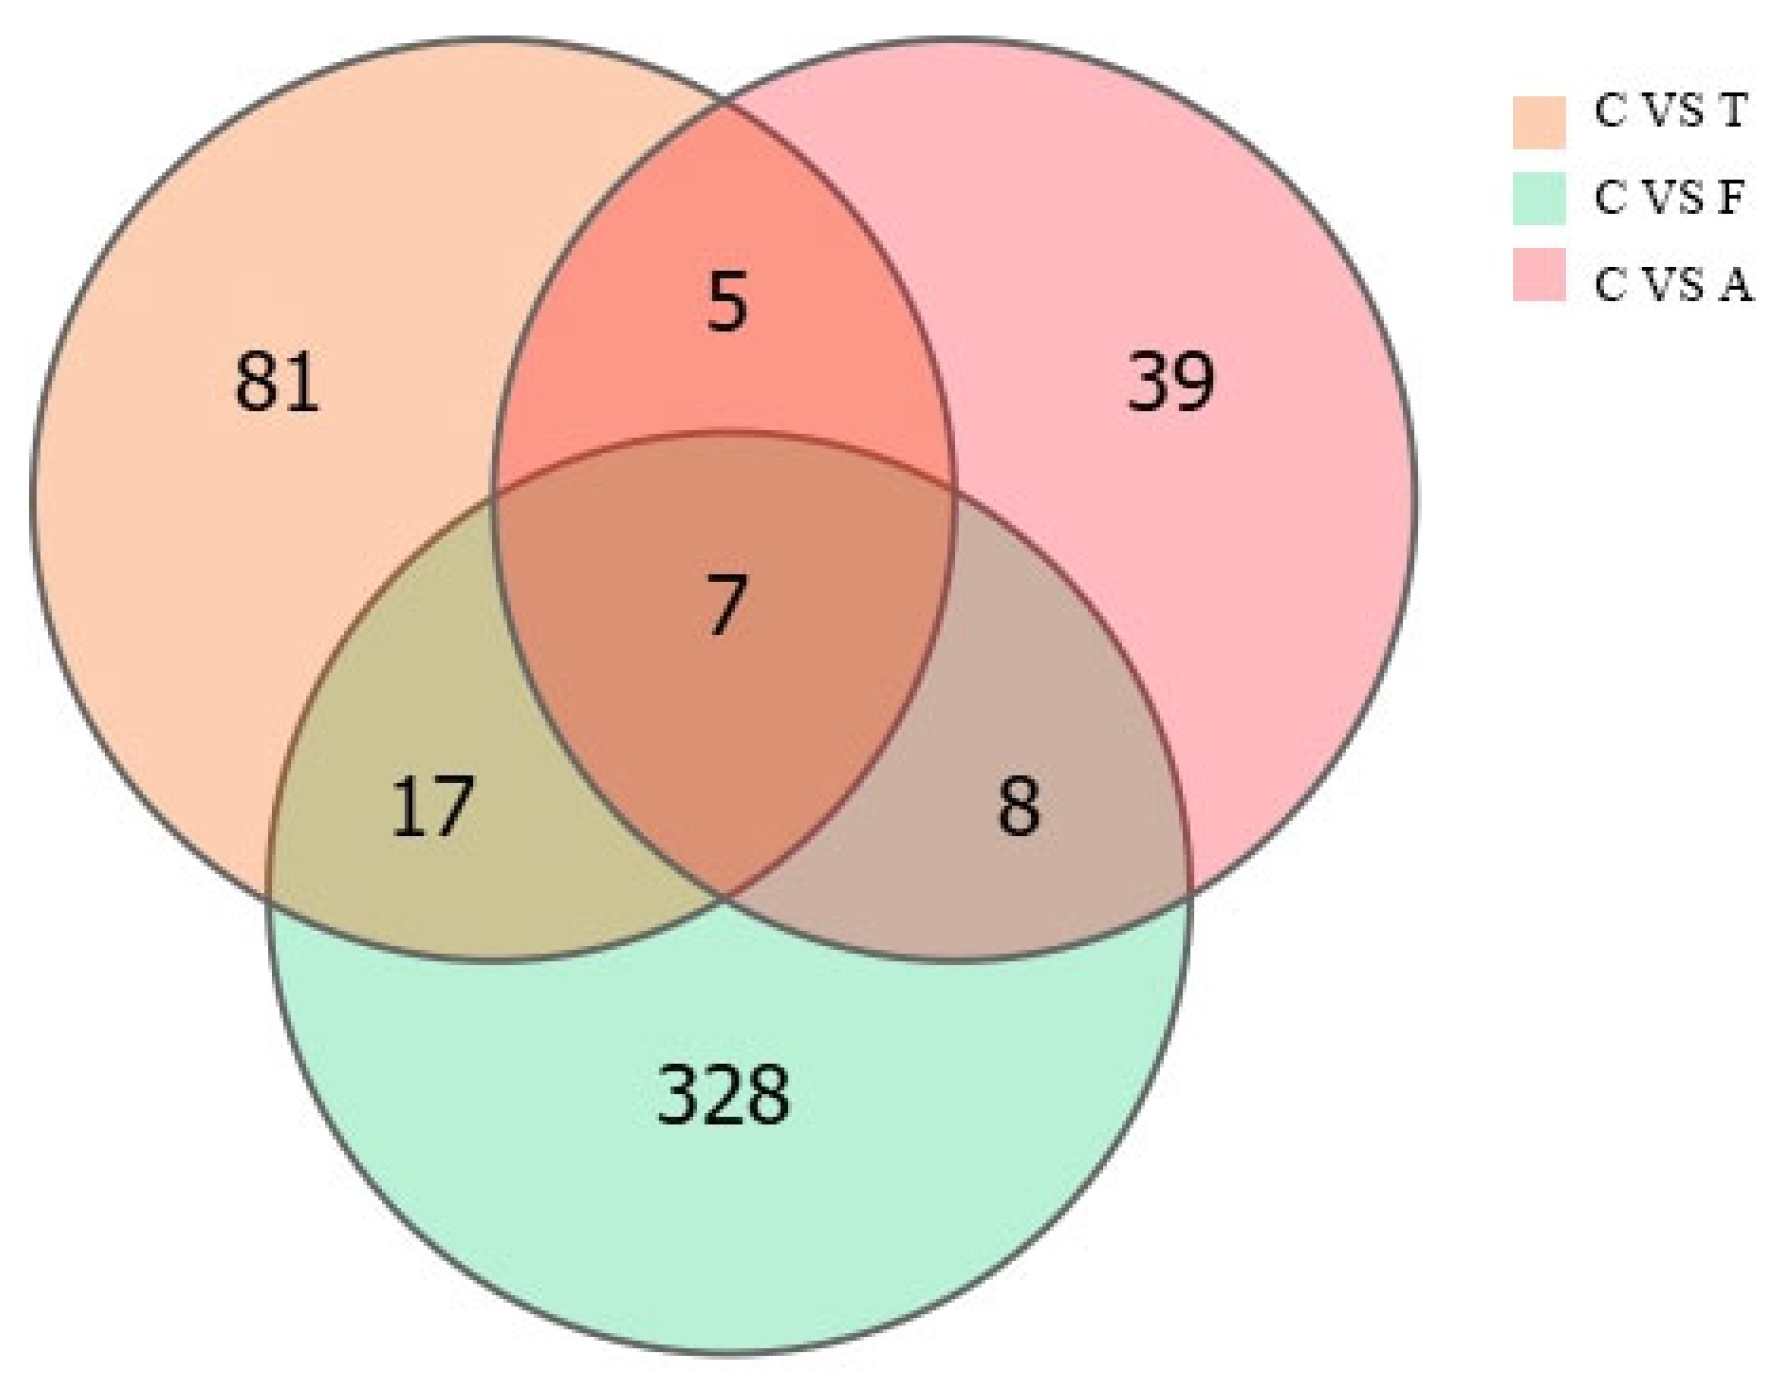
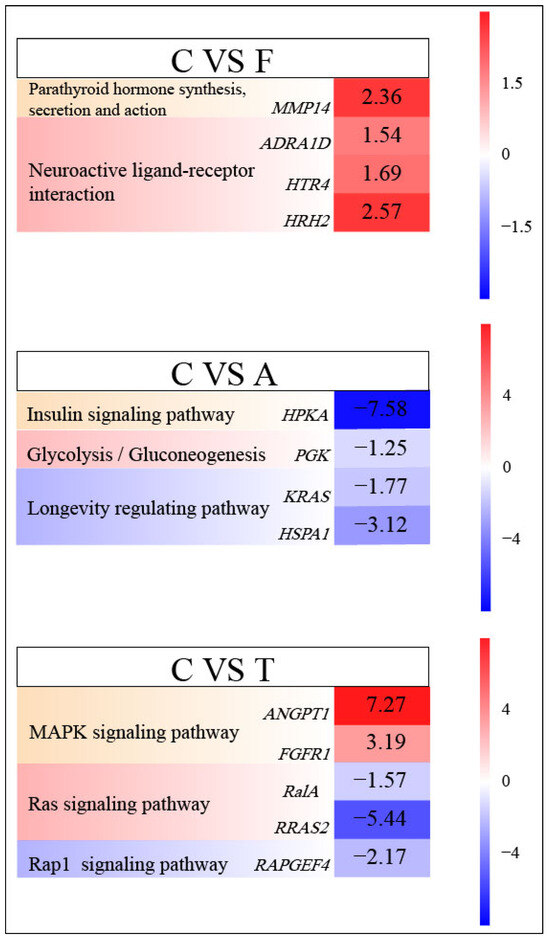
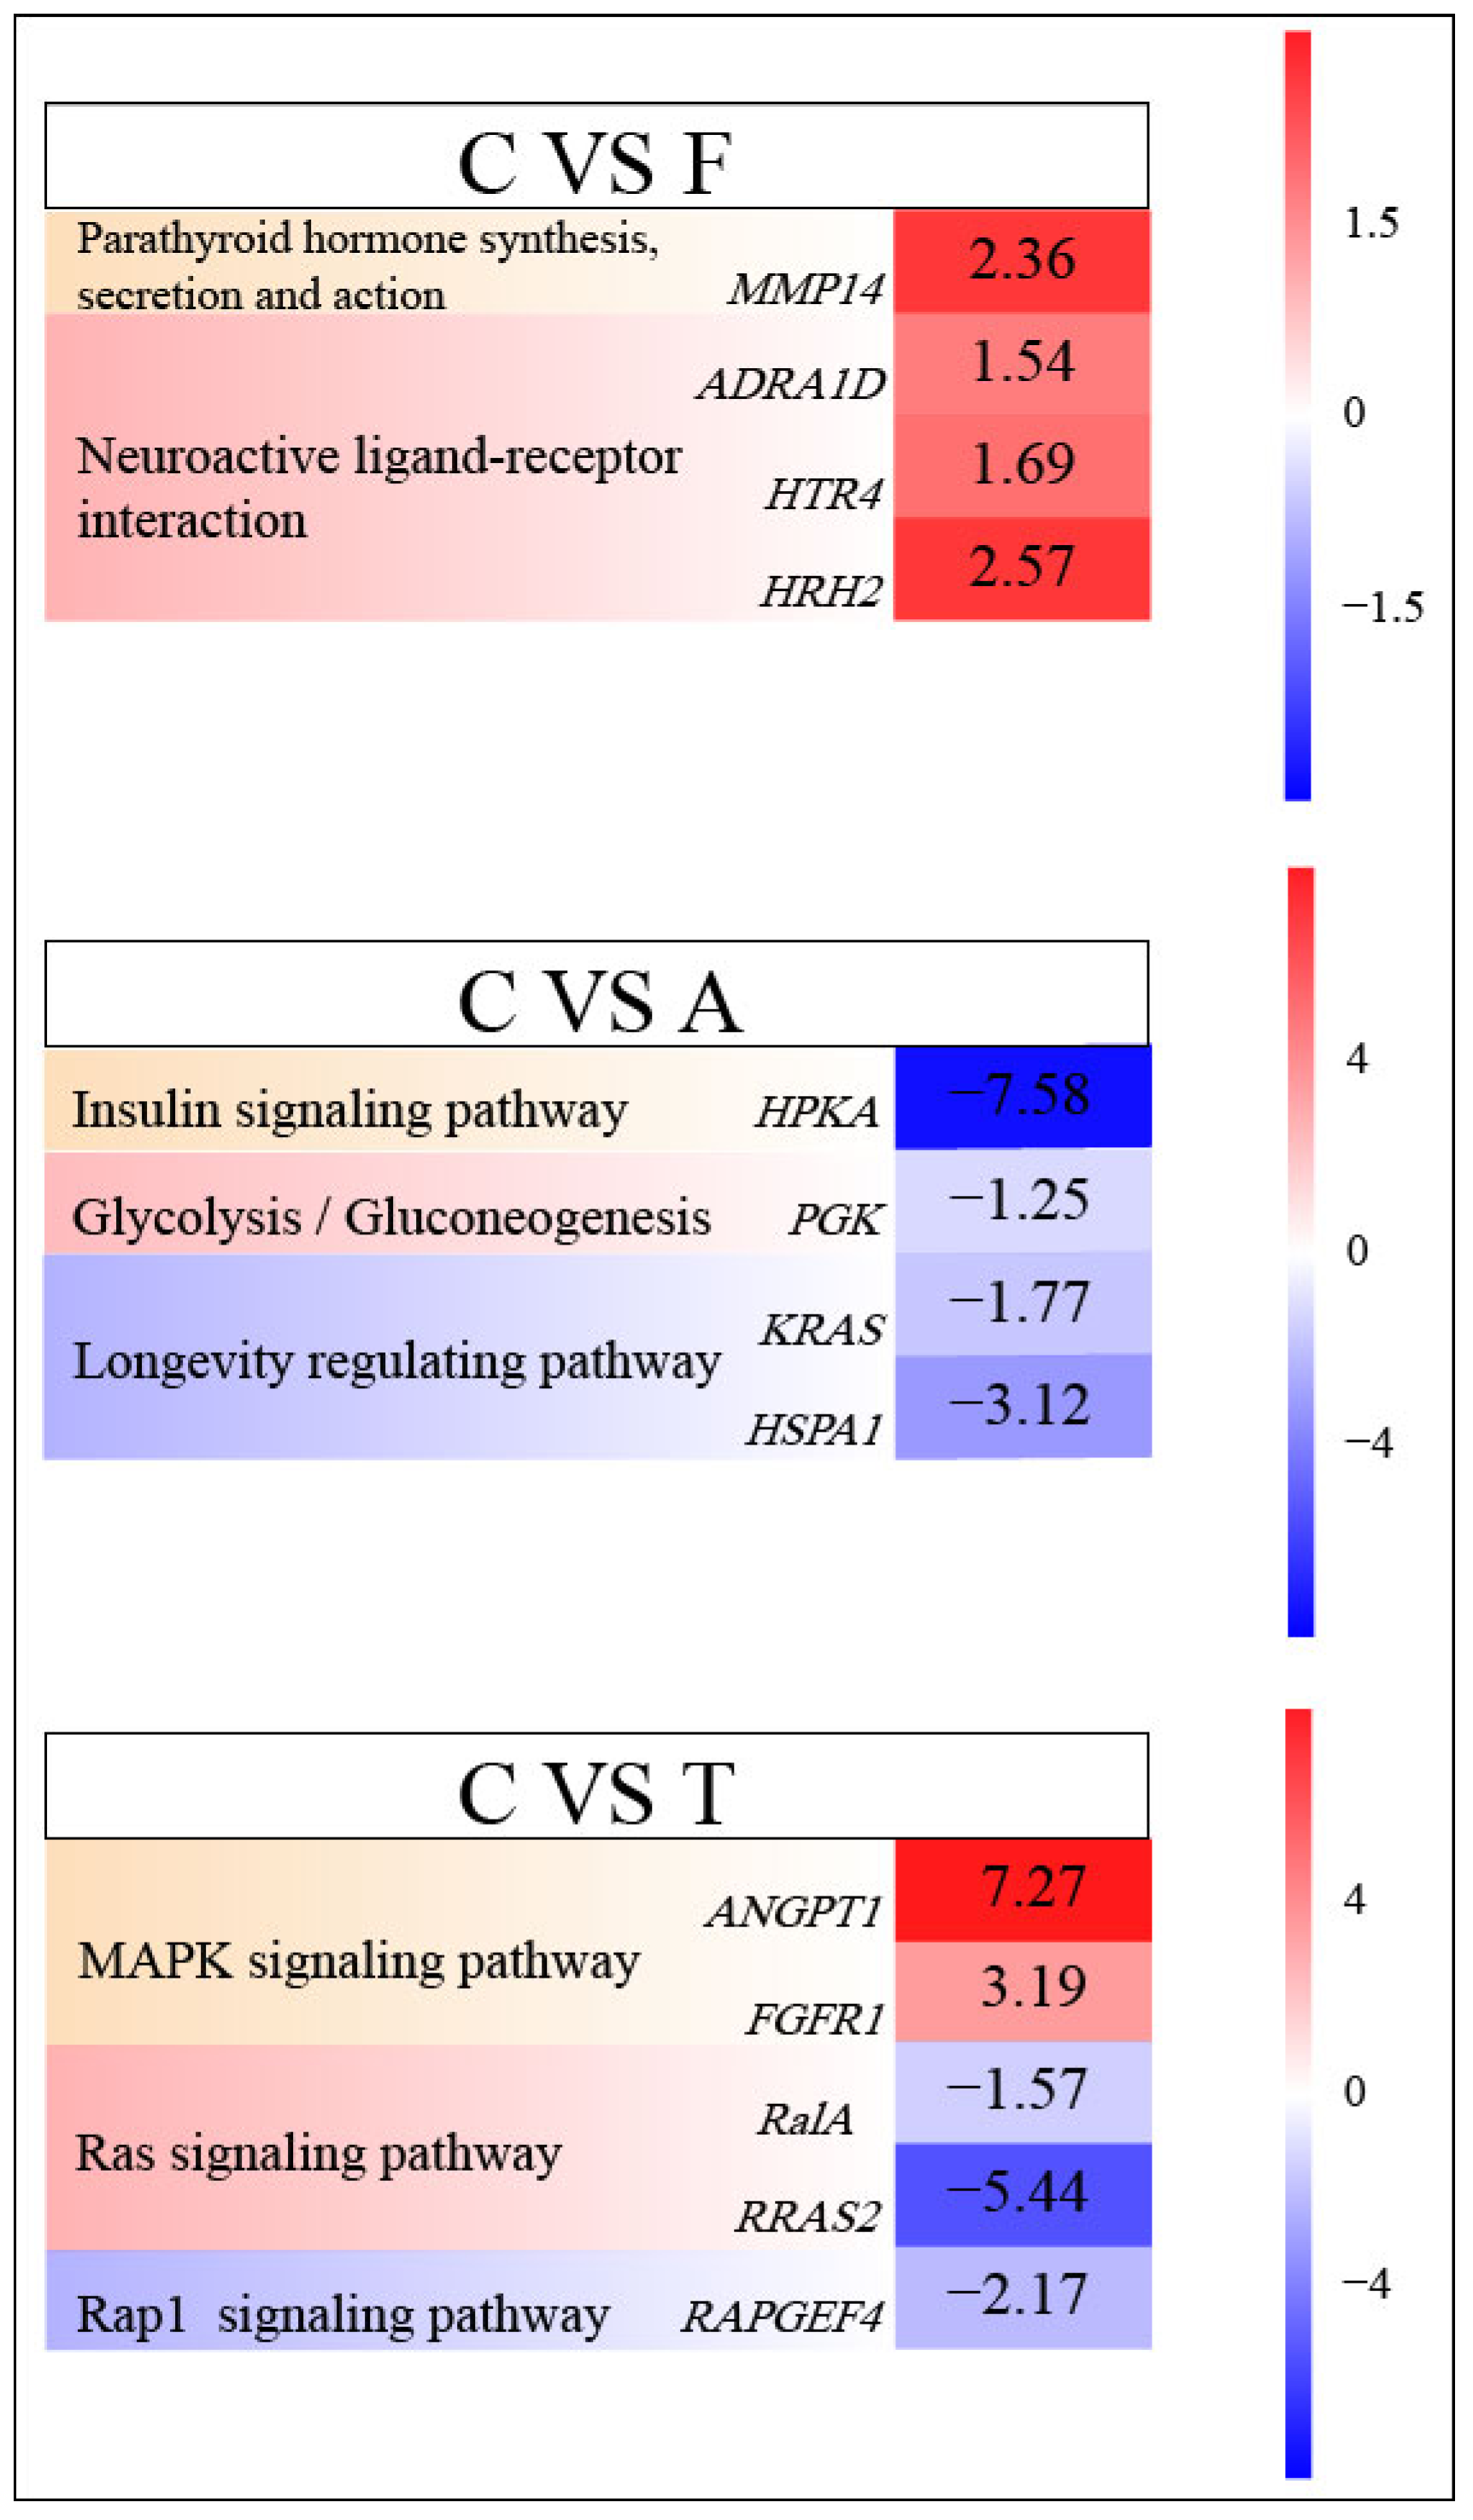
A total of 360 DEGs were identified in the comparison between group F and group C (Figure 2A). Among these, 252 genes were upregulated and 108 genes were downregulated (Figure 2B). The detailed results of the DEGs and their transcripts between groups F and C were provided in the Supplementary Materials S1 and S2, respectively. A comparison between groups A and C identified 59 DEGs (Figure 2A), comprising 27 upregulated and 32 downregulated genes (Figure 2C). The detailed results of the DEGs and their transcripts between groups A and C were provided in the Supplementary Materials S3 and S4, respectively. A total of 110 DEGs were identified in the comparison between groups T and C (Figure 2A). Among these, 66 genes were upregulated and 44 genes were downregulated (Figure 2D). Venn diagram analysis revealed that among these DEGs, 7 DEGs were shared by all three stress groups. The detailed results of the DEGs and their transcripts between groups T and C were provided in the Supplementary Materials S5 and S6, respectively. Regarding the overlaps between any two groups, 17 DEGs were shared between groups F and T. 8 DEGs were shared between groups F and A. 5 DEGs were shared between groups A and T. In addition, 328, 39, and 81 DEGs were uniquely identified in the groups F, A and T, respectively (Figure 3). This distribution pattern suggests that the three stress patterns trigger substantially distinct transcriptional reprogramming. Based on pathway analysis, genes significantly associated with the pathways were identified, and their expression levels (upregulated or downregulated) are presented in Figure 4.
Figure 2.
The number of differentially expressed genes (A), and the numbers of significantly up-regulated and down-regulated genes in groups F (B), A (C), and T (D).
Figure 3.
Venn diagram of differentially expressed genes among different comparison groups. C, T, F, A refer to groups C, T, F, A, respectively.
Figure 4.
The names and expression trends (log2 fold change) of differentially expressed genes in the experimental group. C, T, F, A refer to groups C, T, F, A, respectively.
3.3. GO Enrichment Analysis of DEGs
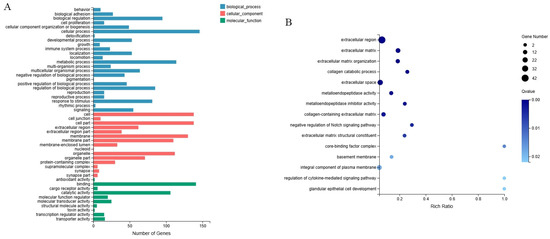
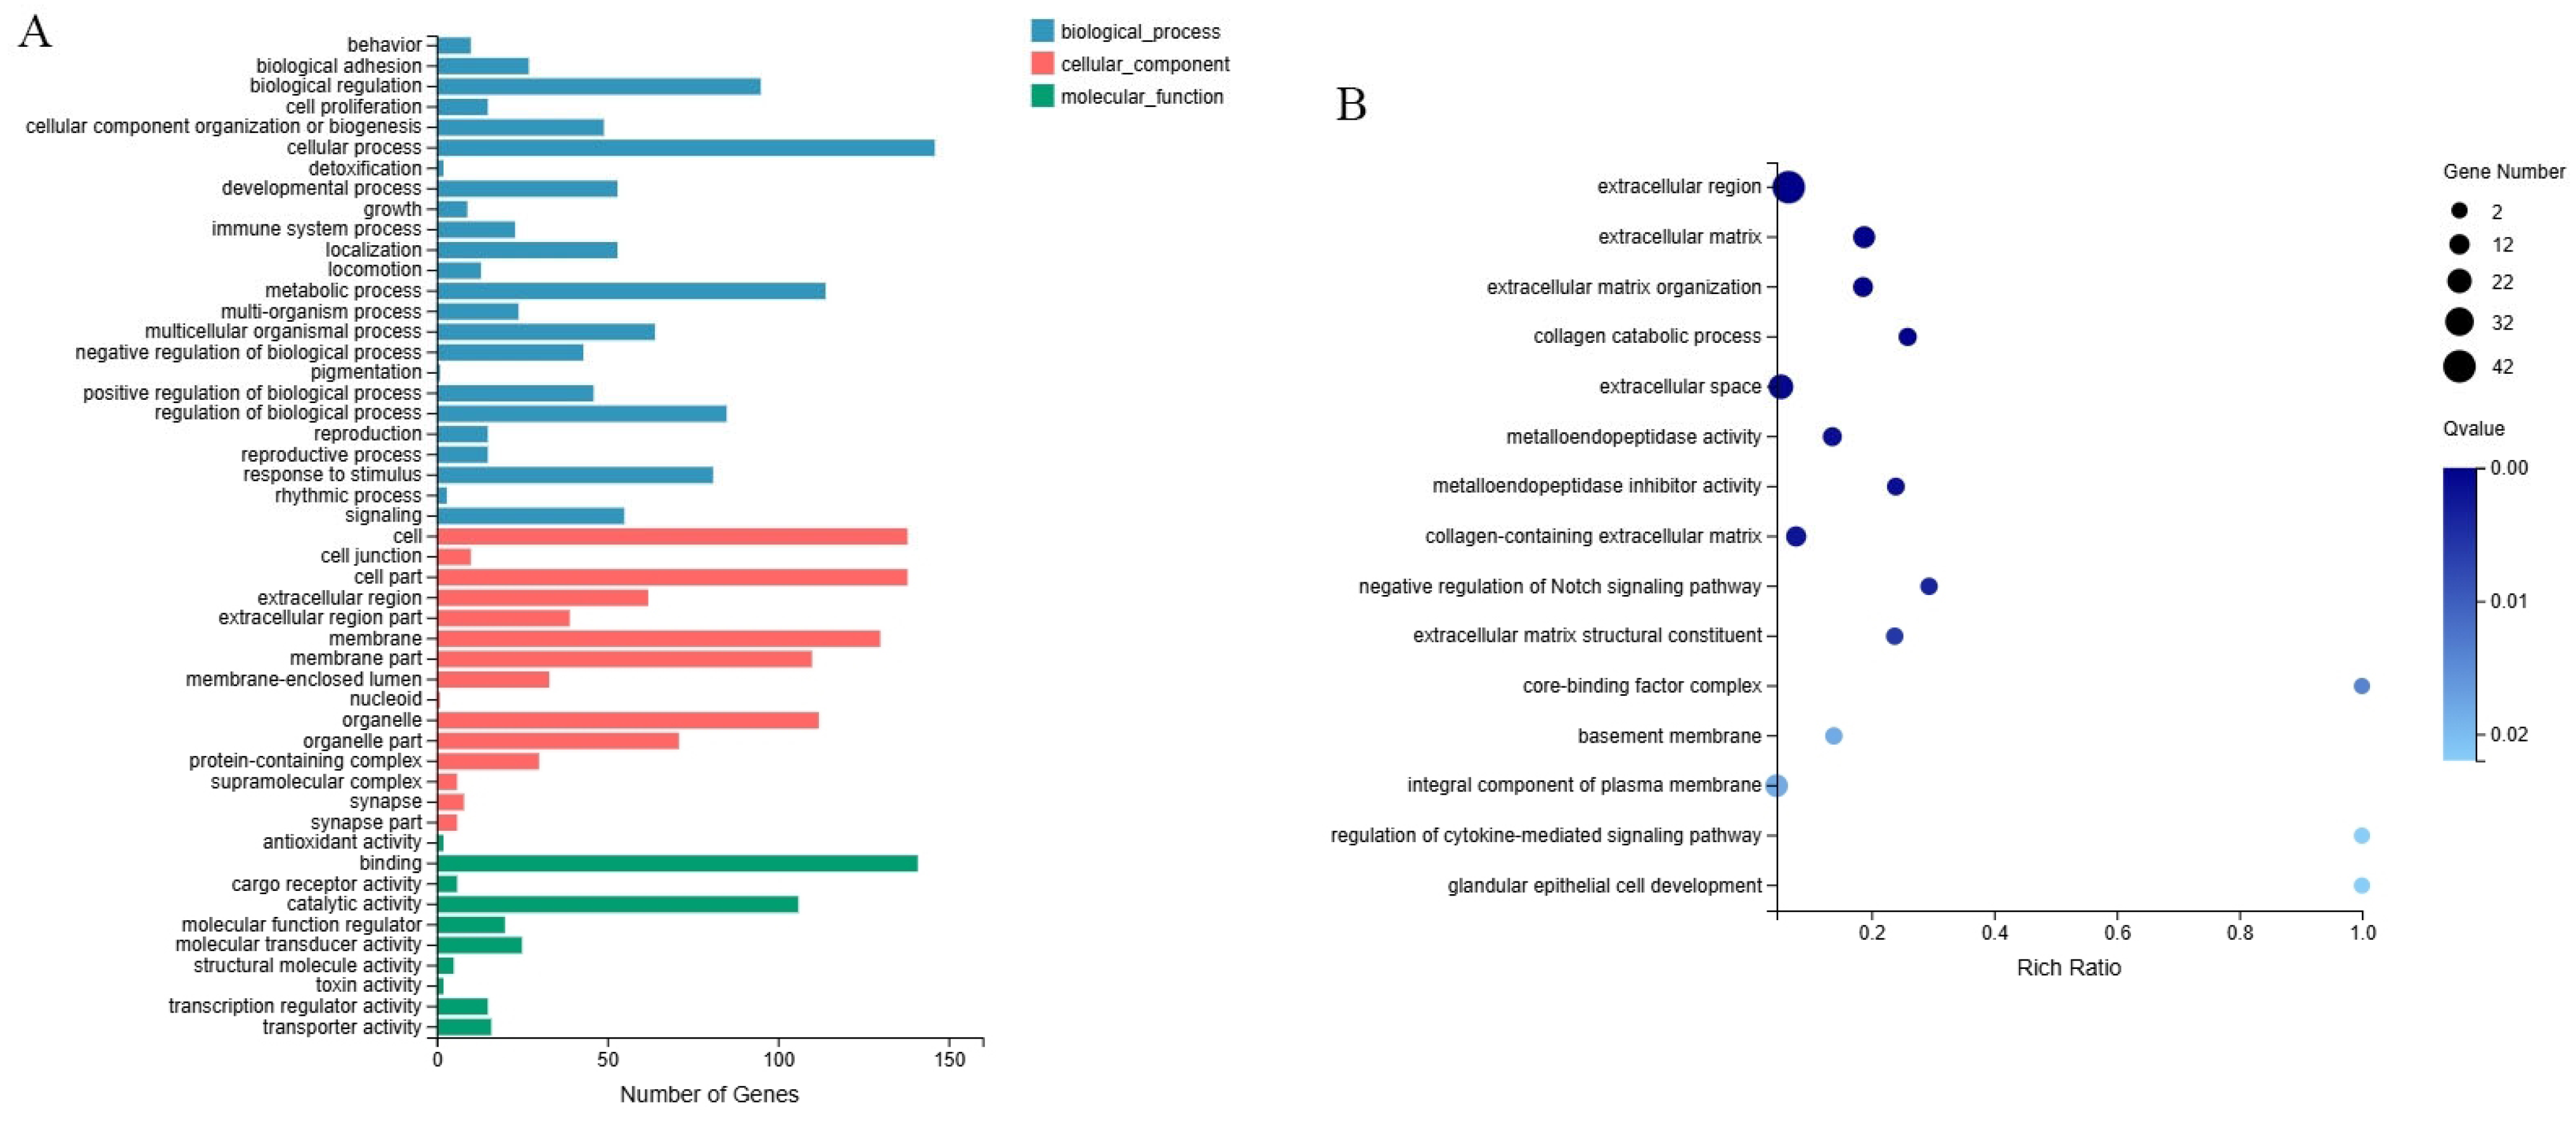
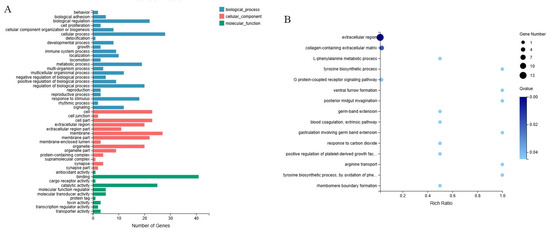
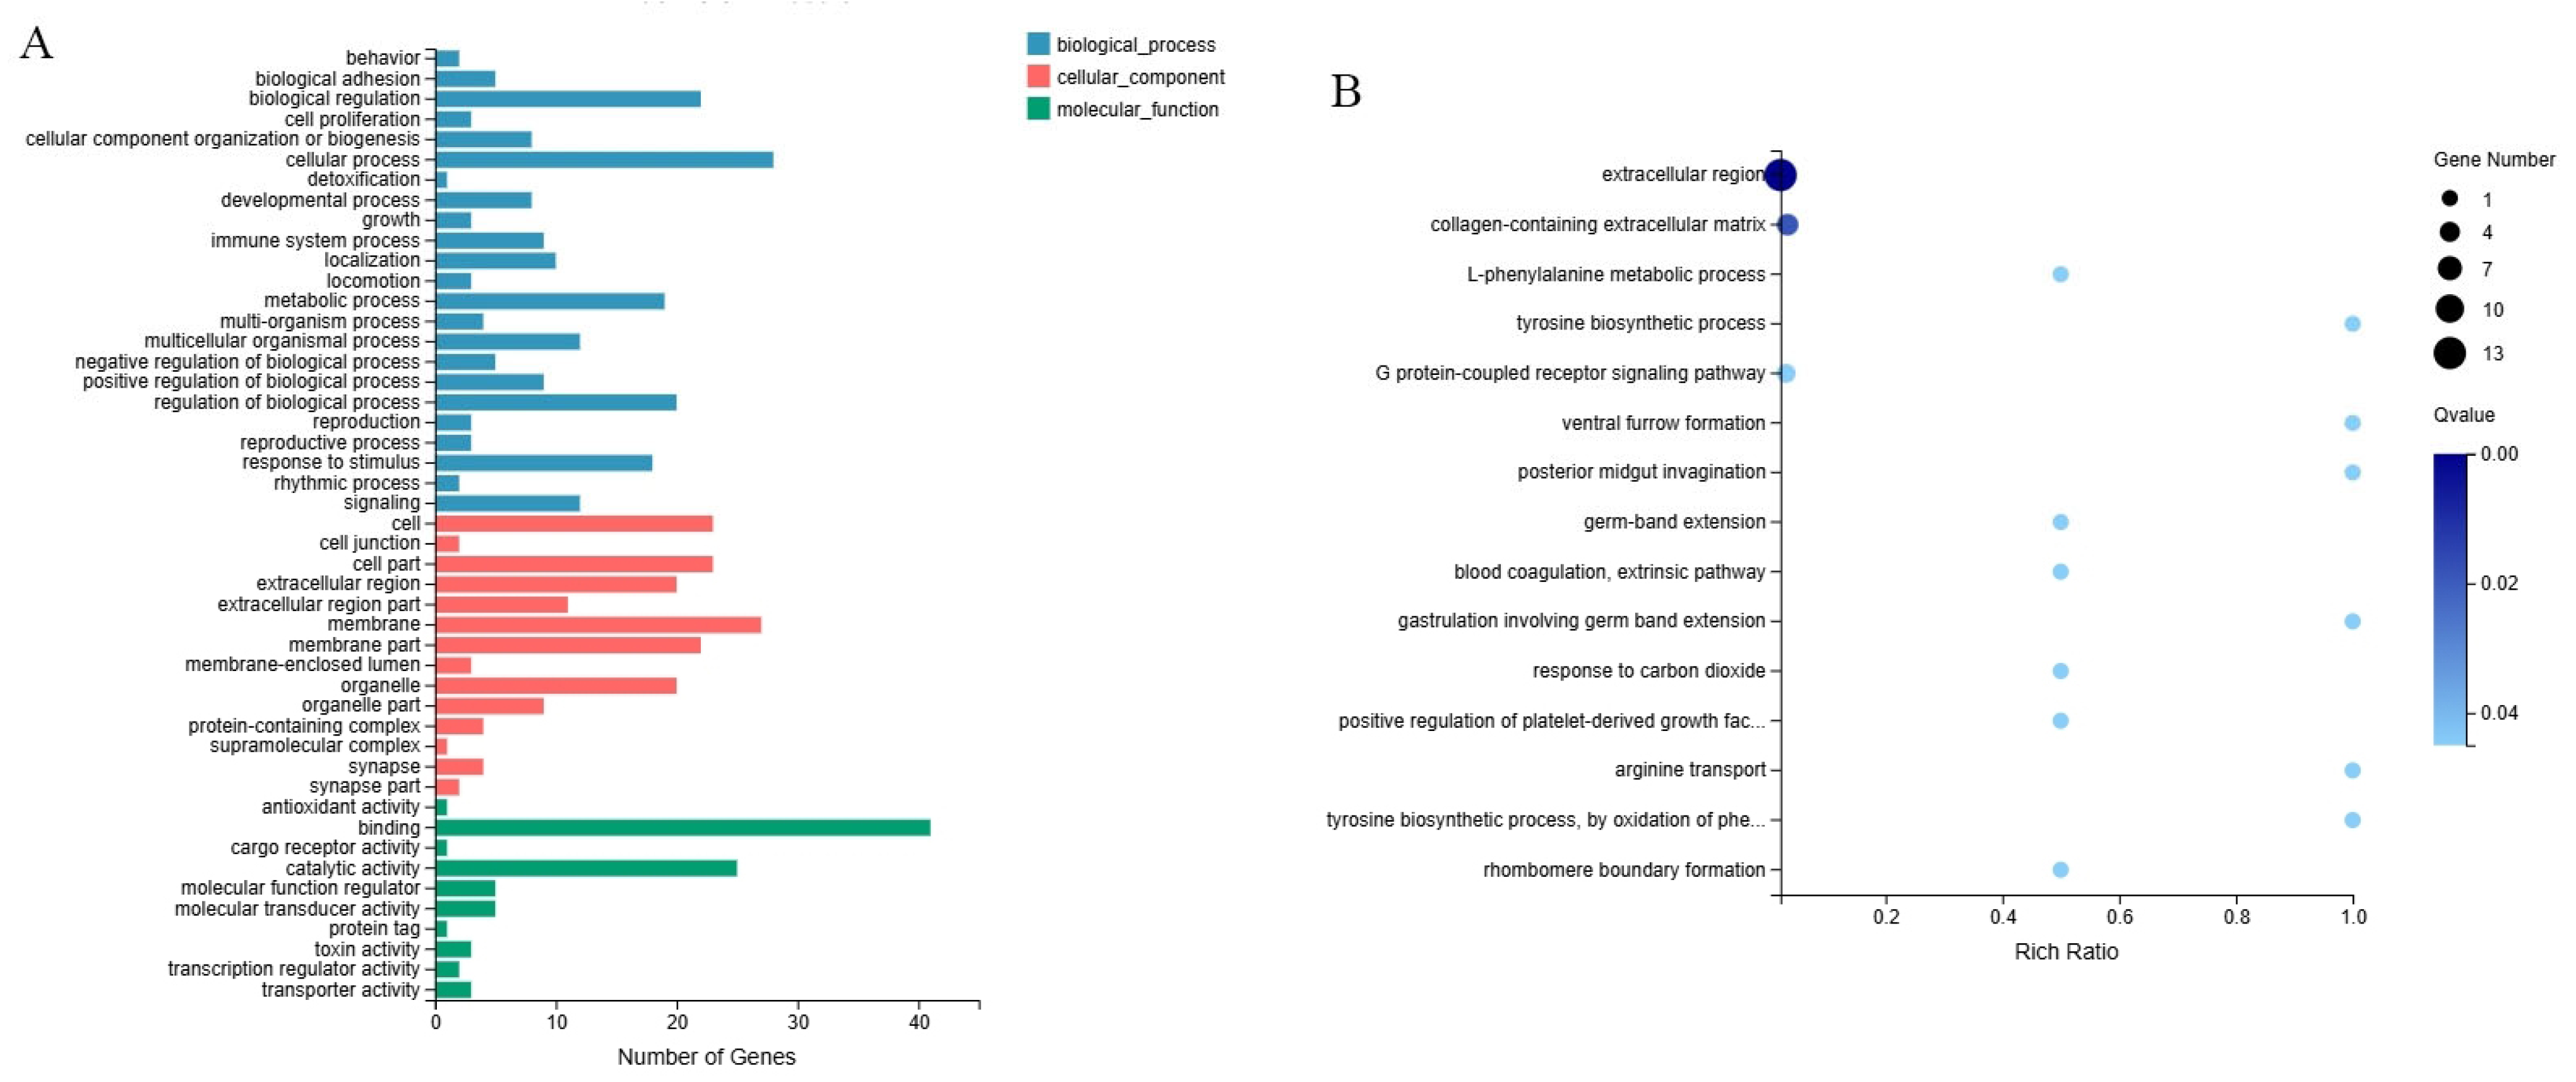
GO enrichment analysis revealed that the DEGs in group F were primarily annotated to the three main GO categories: biological process, cellular component, and molecular function. Among biological process terms, cellular process predominated; the major cellular component terms were cell and cell part; and the major molecular function term was binding (Figure 5A). GO enrichment analysis identified 43 significantly enriched terms between groups F and C, comprising 32 biological processes, 7 cellular components, and 4 molecular functions. The top 15 enriched terms with the smallest Q-values are presented in Figure 5B.
Figure 5.
GO classification (A) and enrichment analysis (B) of differentially expressed genes between groups F and C.
GO enrichment analysis revealed that the DEGs in group A were primarily annotated to the three main GO categories: biological process, cellular component, and molecular function. Among the biological process terms, cellular process and metabolic process predominated; the major cellular component terms were cell, cell part, and membrane; and the most prominent molecular function terms were binding and catalytic activity (Figure 6A). GO enrichment analysis identified 42 significantly enriched terms between groups A and C, comprising 36 biological processes and 6 molecular functions. The top 15 terms with the smallest Q-values are presented in Figure 6B.
Figure 6.
GO classification (A) and enrichment analysis (B) of differentially expressed genes between groups A and C.
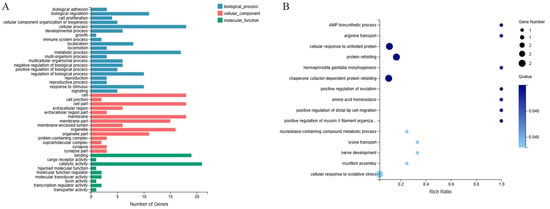
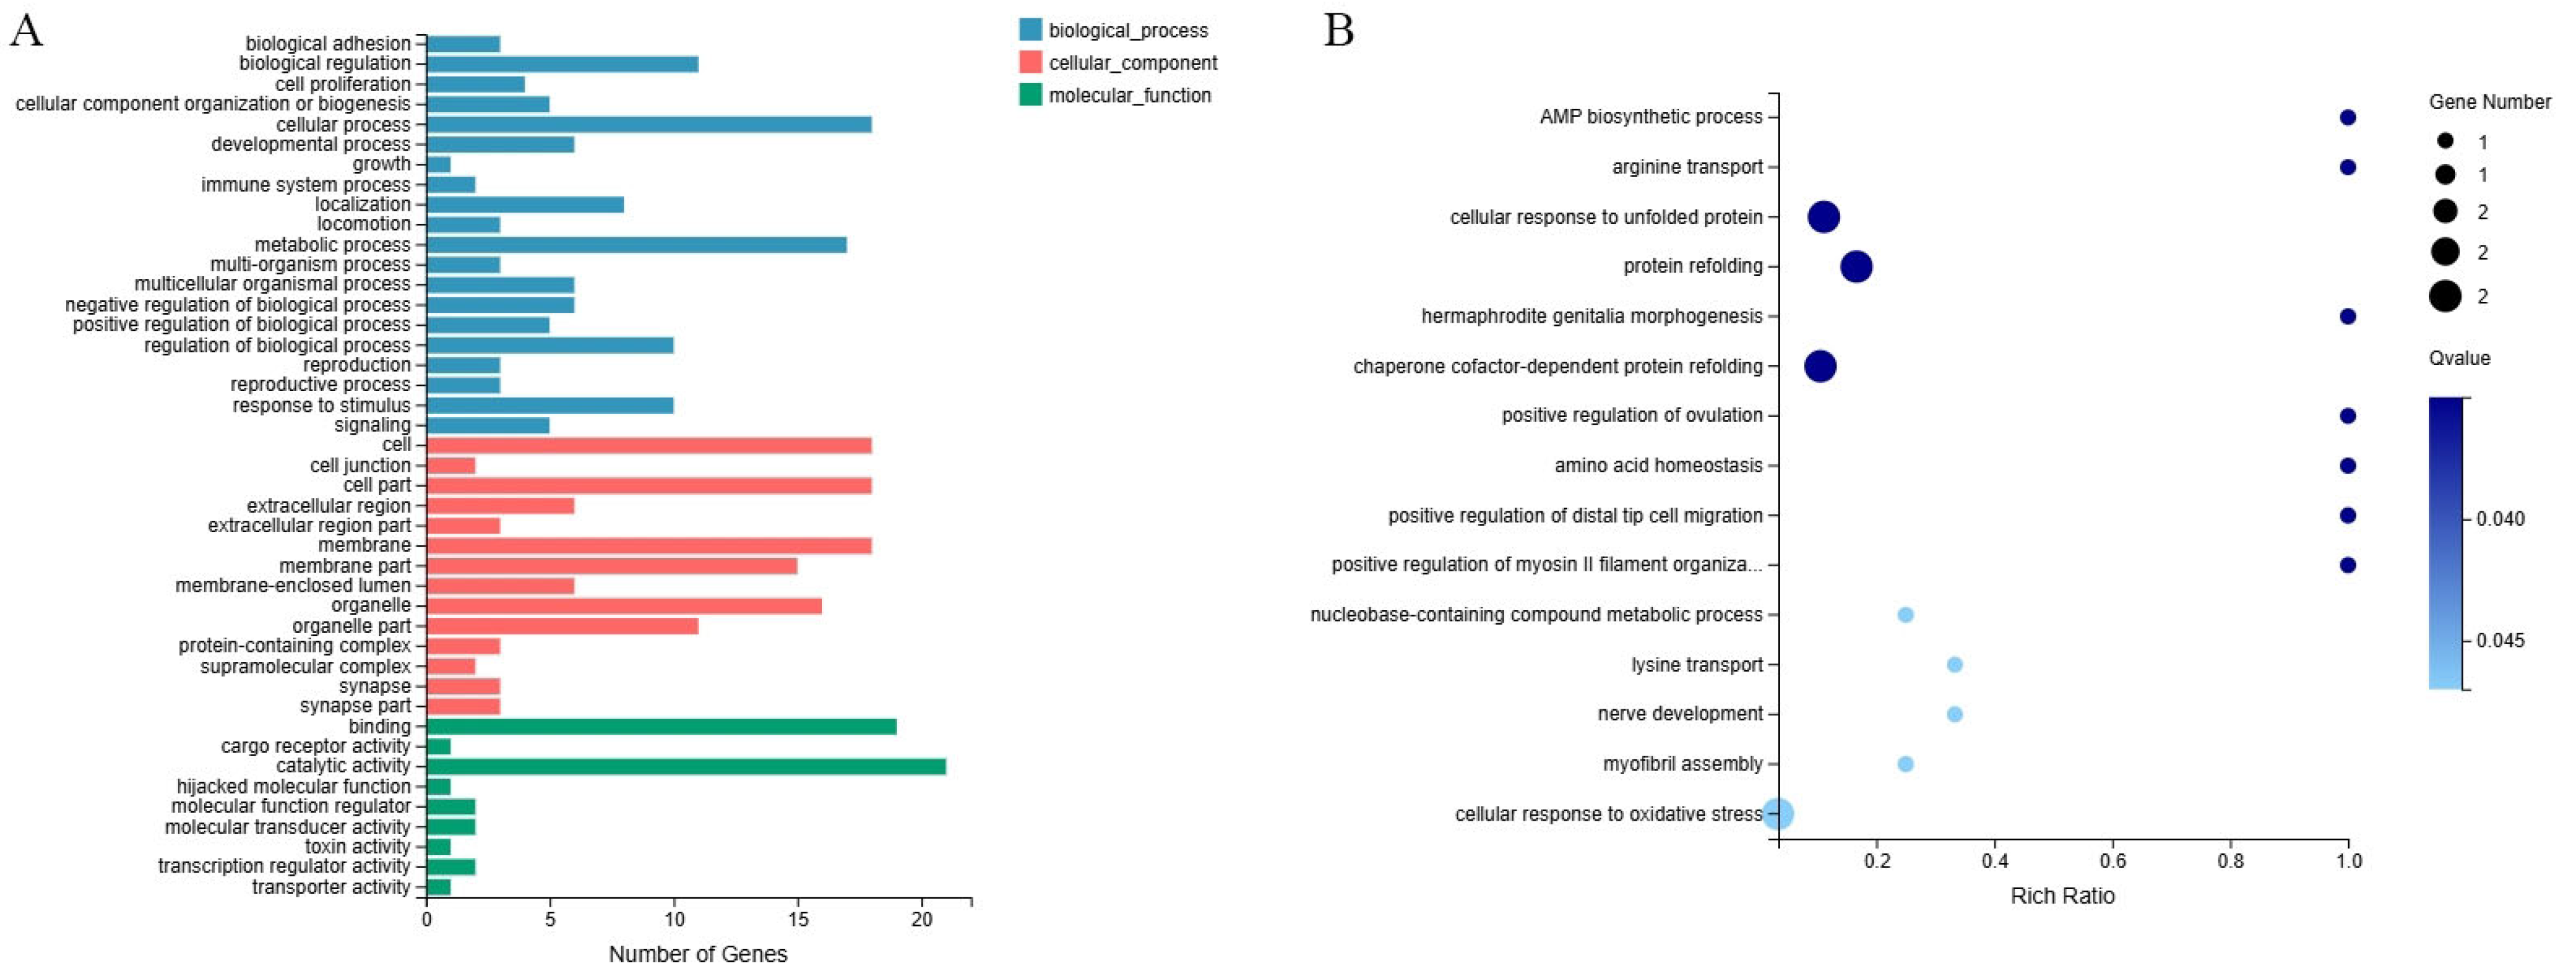
GO enrichment analysis revealed that the DEGs in group T were primarily annotated to the three main GO categories: biological process, cellular component, and molecular function. Among biological process terms, cellular process and biological regulation were predominant. The major cellular component terms were membrane, cell, and cell part. The most prominent molecular function terms were binding and catalytic activity (Figure 7A). GO enrichment analysis identified 57 significantly enriched terms between groups T and C, comprising 55 biological processes and 2 cellular components. The top 15 terms with the smallest Q-values are presented in Figure 7B.
Figure 7.
GO classification (A) and enrichment analysis (B) of differentially expressed genes between groups T and C.
3.4. KEGG Enrichment Analysis of DEGs
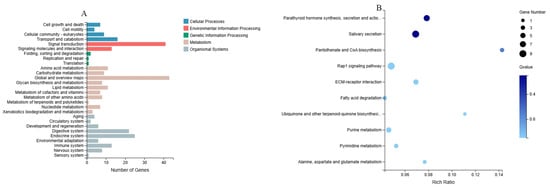
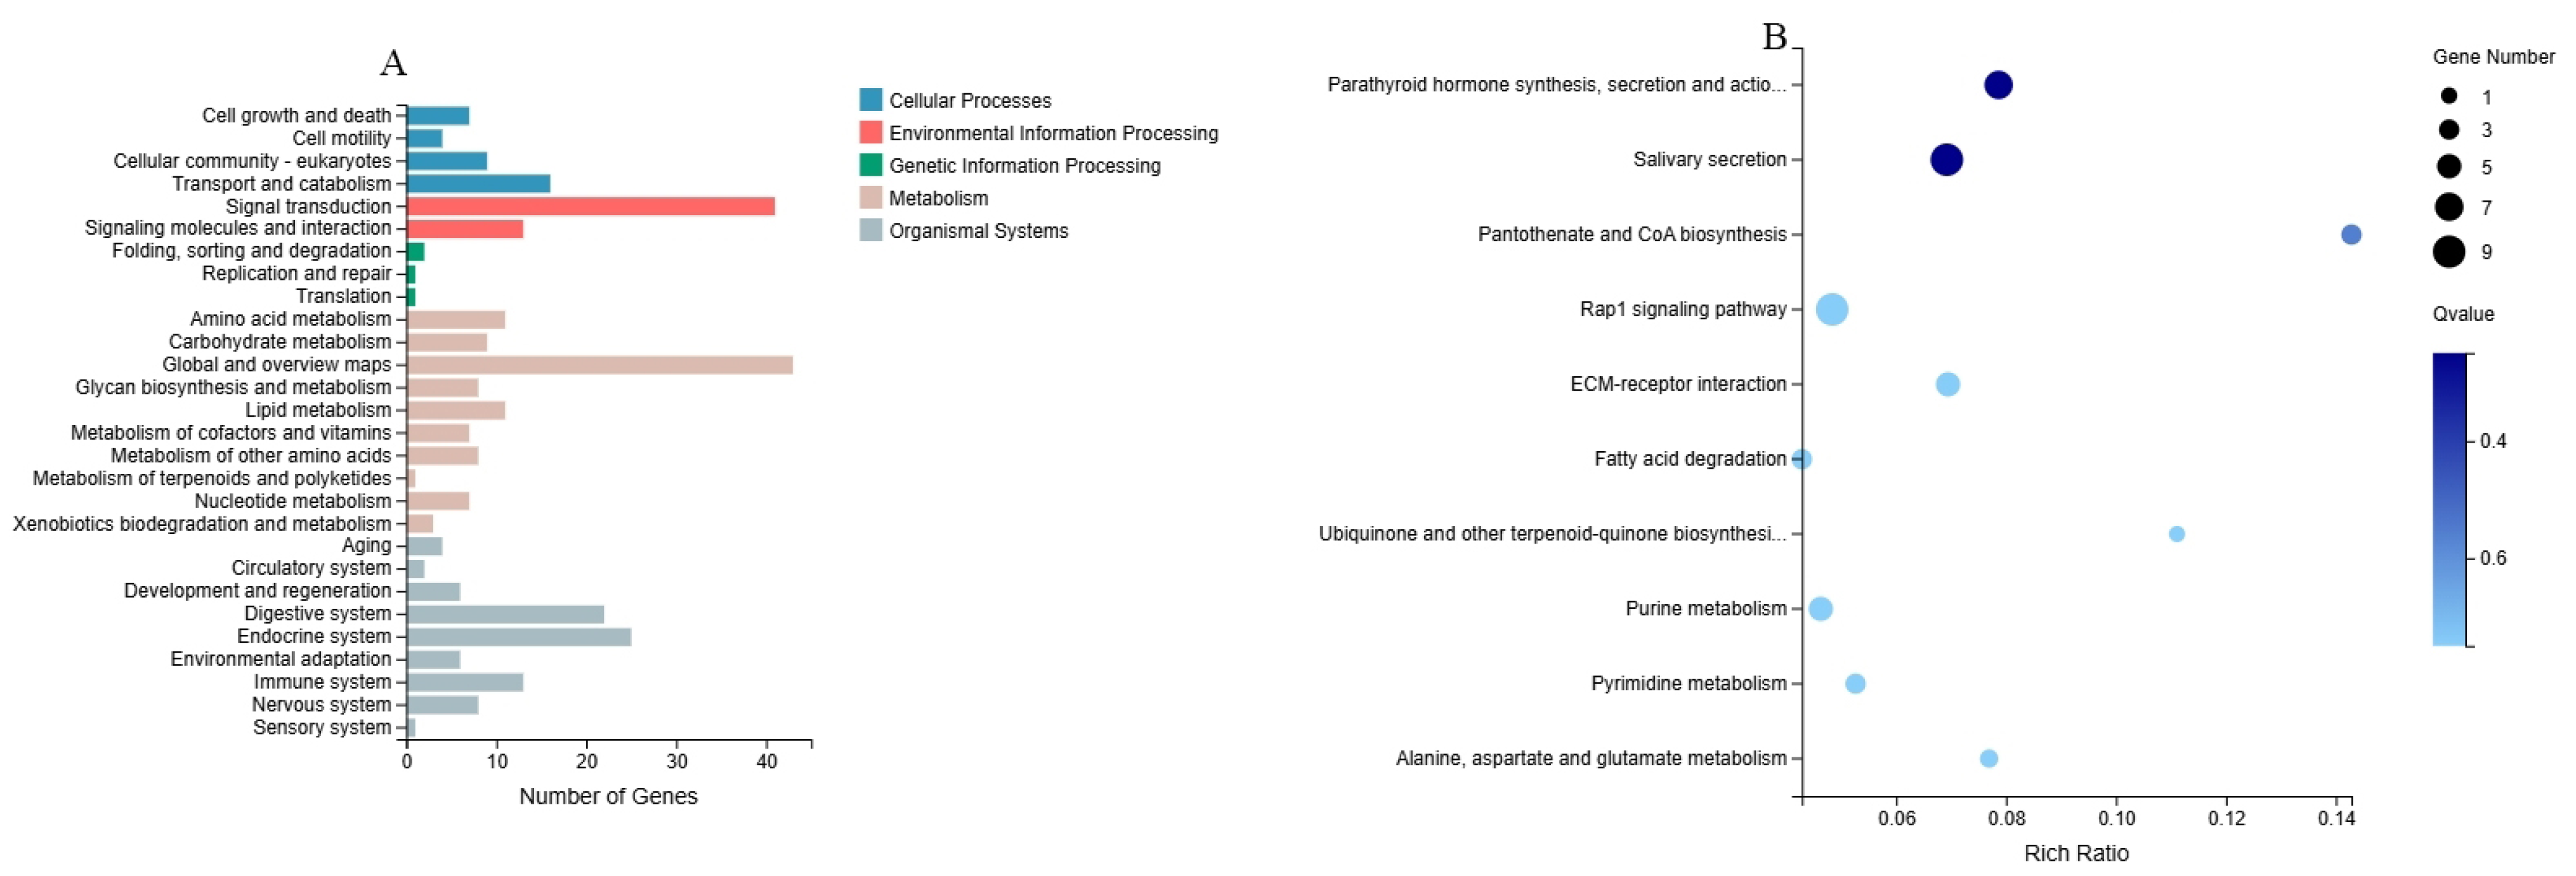
KEGG analysis revealed that the DEGs in group F were primarily annotated in two functional categories: signal transduction under environmental information processing, and global and overview maps under metabolism (Figure 8A). The top 10 most highly enriched pathways between groups F and C are shown in Figure 8B. While several pathways showed nominal significance (p < 0.05), these did not remain significant after the FDR correction.
Figure 8.
KEGG pathway classification (A) and enrichment (B) of differentially expressed genes between groups F and C.
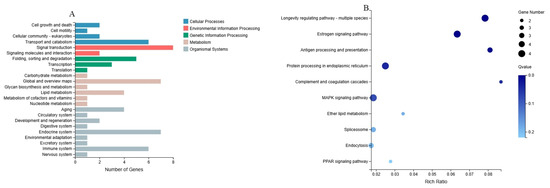
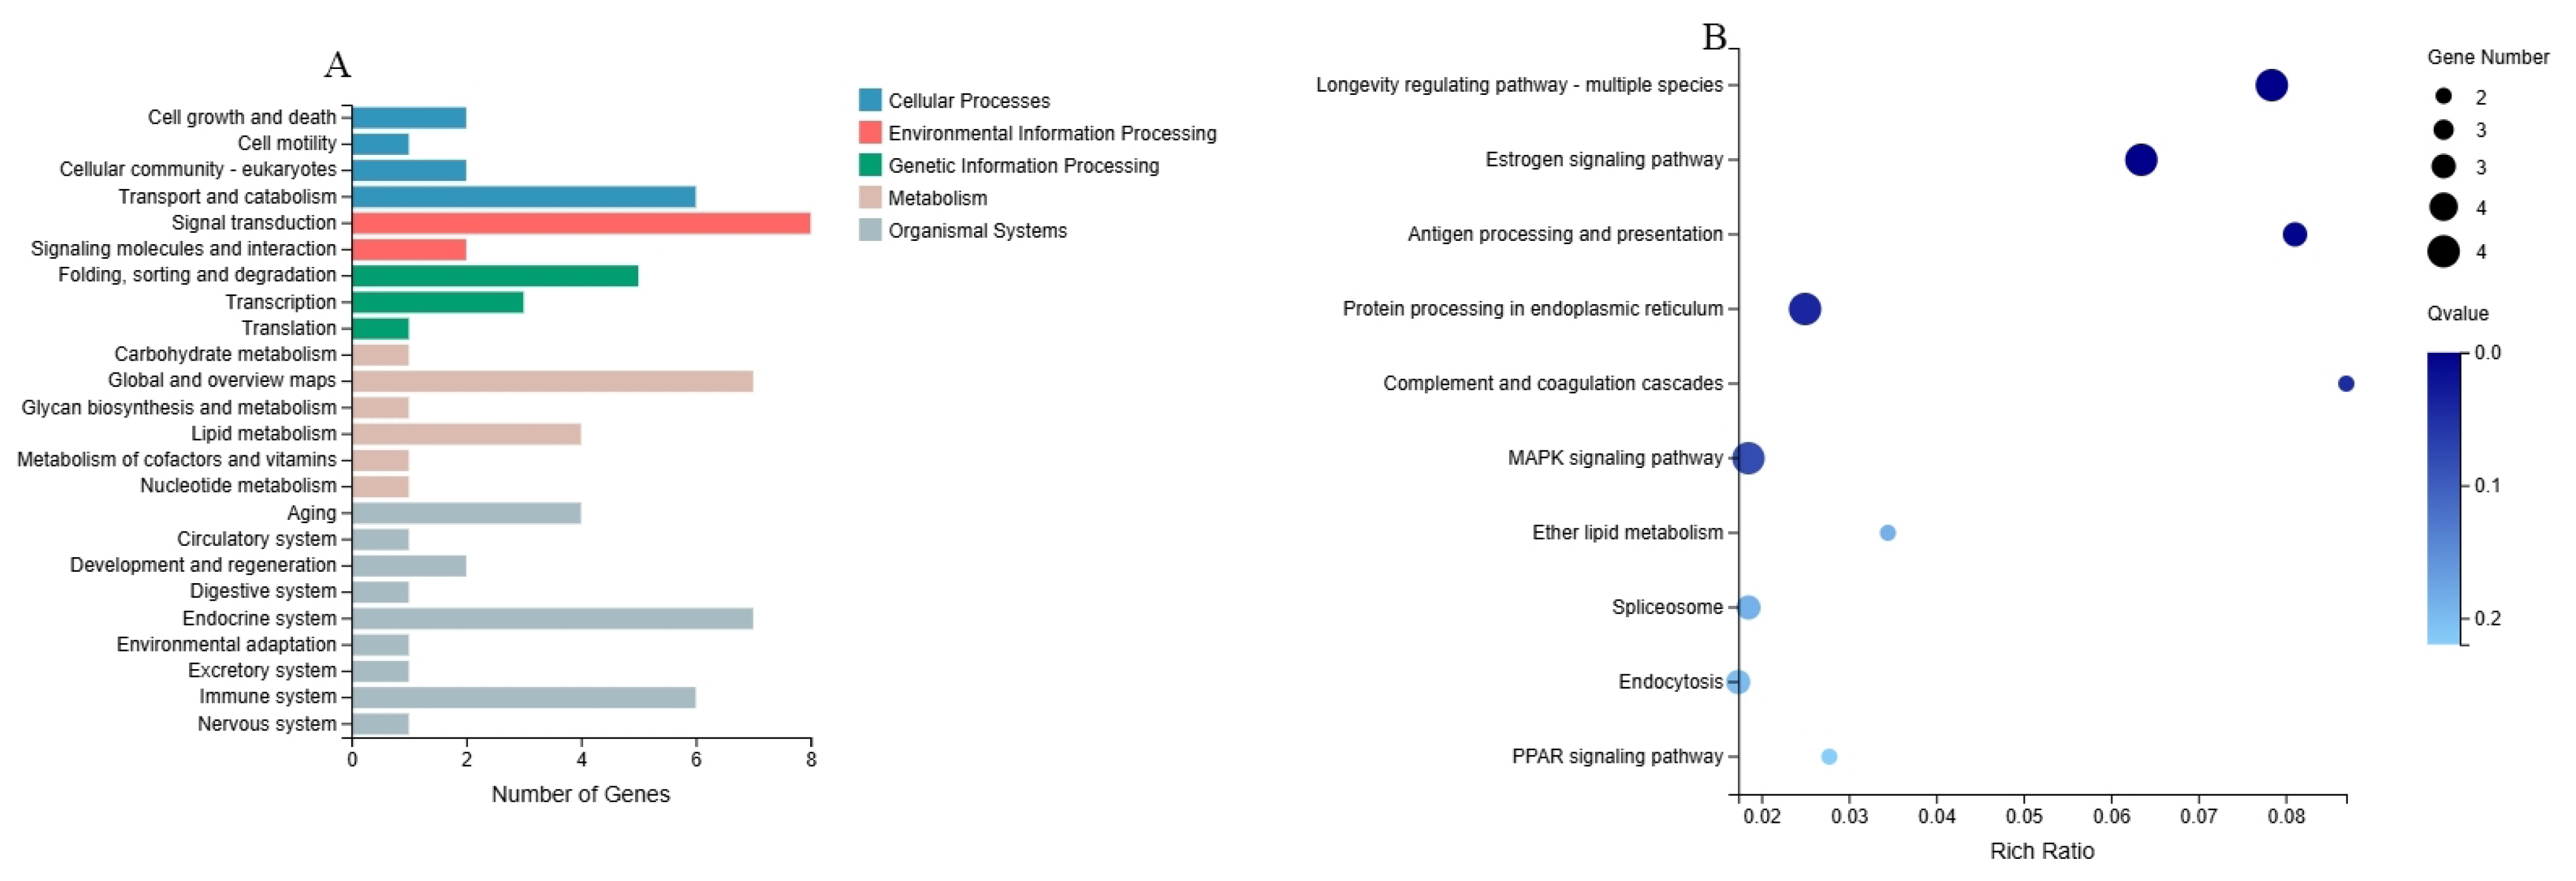
KEGG analysis revealed that the DEGs in group A were primarily annotated three functional categories: signal transduction under environmental information processing, global and overview maps under metabolism and endocrine system under organismal systems (Figure 9A). The top 10 most highly enriched pathways between groups A and C were shown in Figure 9B. Among these, DEGs were significantly enriched in pathways such as the longevity regulating pathway, estrogen signaling pathway, antigen processing and presentation, protein processing in endoplasmic reticulum, and complement and coagulation cascades.
Figure 9.
KEGG pathway classification (A) and enrichment (B) of differentially expressed genes between groups A and C.
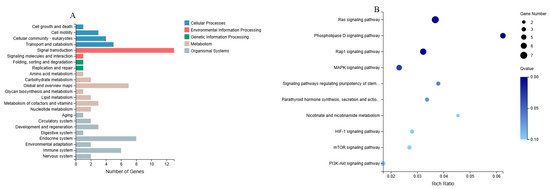
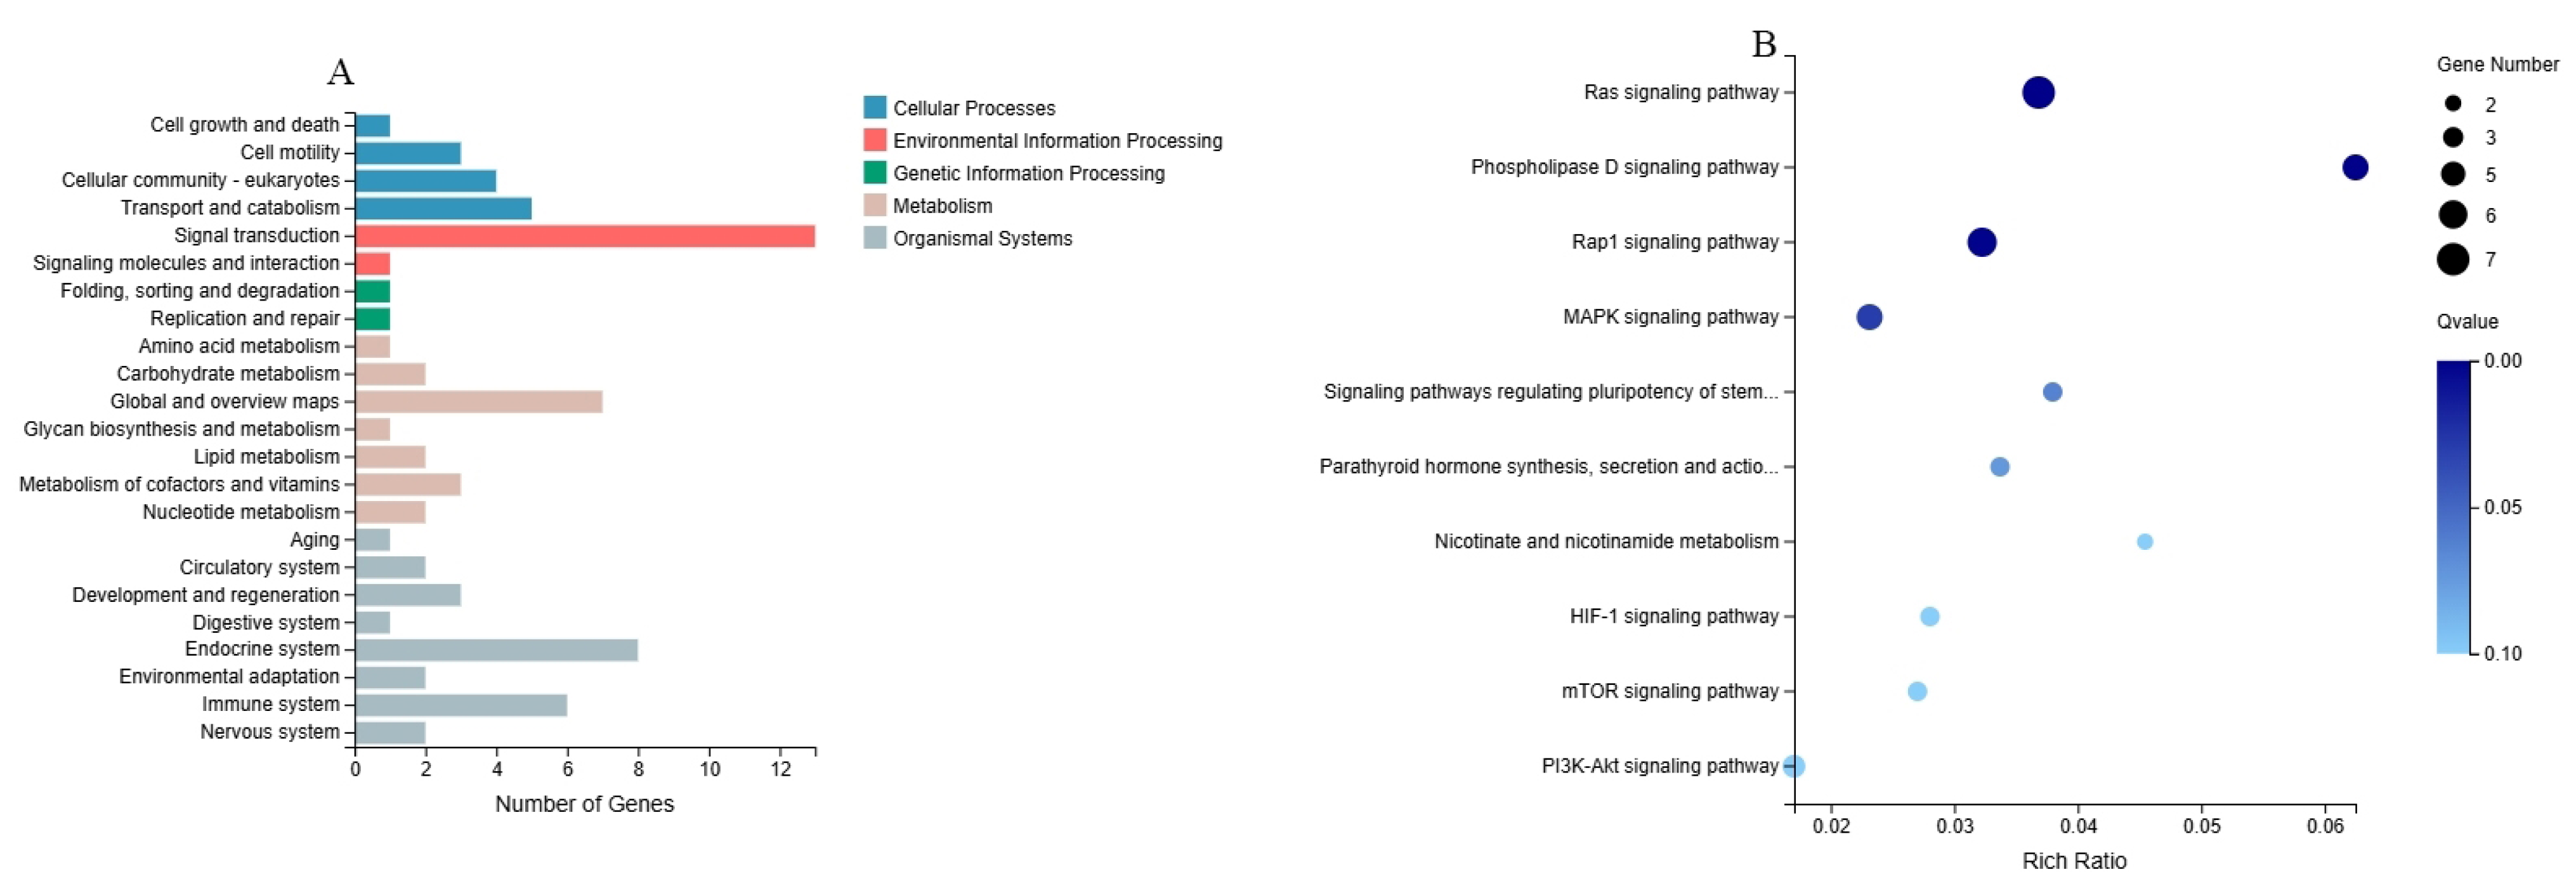
KEGG analysis revealed that the DEGs in group T were primarily annotated three functional categories: signal transduction under environmental information processing, global and overview maps under metabolism and endocrine system under organismal systems (Figure 10A). The top 10 most highly enriched pathways between groups T and C were shown in Figure 10B. Among these, DEGs were significantly enriched in several pathways, including Phospholipase D, Ras, Rap1 and MAPK signaling pathways.
Figure 10.
KEGG pathway classification (A) and enrichment (B) of differentially expressed genes between groups T and C.
3.5. RT-qPCR Validation
The results of RT-qPCR and RNA-seq analyses for six genes were presented in Figure 11 (mean ± SE). The RT-qPCR confirmed that all six selected genes (ADRA1D, MMP14, HRH2, RAPGEF4, RRAS2, and KRAS) were significantly differentially expressed (p < 0.05), with expression trends consistent with the RNA-seq data. Thus, these RT-qPCR results confirmed the reliability of the RNA-seq data.
Figure 11.
qRT-PCR validation of RNA-seq results for six differentially expressed genes (The asterisk * mean p ˂ 0.05).
4. Discussion
4.1. Regulatory Mechanisms Potentially Driving the Fleeing Pattern
Fleeing is an important behavioral strategy employed by organisms to evade threats [32]. Organisms exhibit rapid and vigorous movement during the escape response [33]. Sea cucumbers exhibit a significantly increased crawling frequency and move faster when displaying the fleeing pattern [9]. Calcium ions are essential for sustained muscle contraction in high-intensity exercise [34]. In the present study, we found a consistent significant upregulation of several matrix metalloproteinase genes, including MMP14, MMP15 and MMP24. The MMP14 is transcriptionally regulated by parathyroid hormone signaling in osteocytes, and its protein product promotes bone resorption, a key process for releasing calcium from the bone into the bloodstream [35]. Apostichopus japonicus possesses an endoskeleton made of ossicles [24], which holds the potential to release calcium ions. These results suggest that the matrix metalloproteinase family, especially MMP14, may participate in the regulation of the fleeing pattern, possibly by modulating the availability of calcium ion to support continuous rapid movement.
Escape response is regulated by the concerted action of multiple neurotransmitters [10]. The present study found the significant upregulation of three genes HTR4, ADRA1D, and HRH2, which encode receptors for 5-HT, adrenaline/norepinephrine, and histamine, respectively. These results suggest that the fleeing pattern is not regulated by a single neurotransmitter alone, but rather involves a coordinated modulation of these multiple receptor systems in sea cucumbers. 5-HT receptors mediate the signal transduction of 5-HT [36]. They mediate and sustain the vigilance state induced by conspecific alarm substance in zebrafish Danio rerio, thereby increasing their sensitivity to threatening stimuli [37]. Consistently, sea cucumbers exhibited a flight reaction when being exposed to conspecific corpses, accompanied by significantly higher 5-HT levels [11]. These findings suggest that the activation of the 5-HT receptors may facilitate the perception of danger signals in sea cucumbers. The adrenergic receptors receive the signal from norepinephrine and epinephrine [38]. These catecholamines are involved in the physiological activation of the sympathetic nervous system [39], which is responsible for initiating the “fight or flight” response [40]. Furthermore, a significantly higher level of norepinephrine was observed in sea cucumbers exposed to conspecific corpses in fleeing pattern [9]. These results suggest that the adrenergic receptor plays a potentially important role in initiating the fleeing pattern. Histamine is an important neurotransmitter, and its effects are mediated through histamine receptors [41]. Histaminergic neurons specifically mediate accelerated motor behaviors during alertness in mice [42]. Histaminergic neurons are present in the buccal tentacles, circumoral nerve ring, and body wall papillae of the sea cucumber Leptosynapta clarki, and histamine significantly promotes the crawling frequency in them [43]. These findings suggest histaminergic neurons may participate in the crawling behavior in fleeing patten. In summary, the upregulation of HTR4, HRH2, and ADRA1D may play important roles in regulation of the fleeing pattern in sea cucumbers.
4.2. Potential Regulatory Mechanisms of Adhesion Pattern
Glycolysis is a crucial pathway for energy production [44]. Under stress conditions, glycolytic flux is modulated to reorganize cellular energy metabolism [45,46]. In the present study, the expression of PHKA and PGK was significantly downregulated in adhesion pattern (group A). Both genes play important roles in the glycolysis. Phosphorylase kinase plays a critical role in initiating glycogenolysis by activating glycogen phosphorylase via phosphorylation [47,48]. Phosphoglycerate kinase participates in the first ATP-generating step of glycolysis [49,50]. These results suggest that there was a reduced glycolytic flux in the adhesion pattern. According to existing studies, such physiological changes suggest an energy-conserving strategy that prioritizes the allocation of limited energy to vital tissues [51,52]. Consistent with this strategy, sea cucumbers may allocate a greater proportion of available energy to vital tissues to sustain the adhesion pattern. In addition, the present transcriptomic analysis revealed that the DEGs were significantly enriched in the longevity regulating pathway in adhesion pattern (group A), with a significant downregulation of KRAS and HSPA1. Cell proliferation and differentiation require a continuous energy supply and are temporarily arrested when energy reserves become limited [53,54]. KRAS serves as a key regulator of cell proliferation and differentiation [55,56], and inhibition of the signaling leads cells to rapidly cease proliferation and enter a reversible and quiescent state [57]. These findings suggest that cell proliferation and differentiation may be reduced as part of an adaptive strategy to reallocate limited energy resources. Heat shock protein (HSP) family genes are frequently transcriptionally upregulated to enable organisms to withstand stressful environments [58,59]. However, the synthesis and functional maintenance of HSPs represent an energetically costly process [60,61]. Therefore, organisms downregulate the expression levels of certain HSP family members to optimize energy allocation under energy-limited conditions. For example, HSP70 expression was significantly reduced in brown adipose tissue of hibernating thirteen-lined ground squirrel Spermophilus tridecemlineatus [62]. Similarly, a significant downregulation of HSP70 mRNA was observed in the liver of hibernating chipmunk Tamias asiaticus [63]. The significant downregulation of HSPA1 may be an energy allocation strategy to adapt the limited energy supply. In summary, sea cucumbers appear to reallocate energy resources by suspending energy-intensive biological processes to sustain adhesion pattern.
4.3. Regulatory Mechanisms Underlying Thanatosis Pattern
Body wall musculature of sea cucumbers mainly consists of an outer longitudinal and an inner circular smooth muscle layer [64]. Sea cucumbers curl up their bodies in the thanatosis pattern [9]. The maintenance of this contracted posture requires the coordinated involvement of both circular and longitudinal smooth muscles. In the present study, the transcriptomic analysis revealed that the DEGs were significantly enriched in the MAPK signaling pathways in thanatosis pattern (group T), with significant upregulation of ANGPT1 and FGFR1. Meanwhile, the expression of RhoA was significantly downregulated in group T. RhoA is a key regulator of smooth muscle contraction, and its activation is necessary for various smooth muscle contractions [65]. This seemingly contradictory combination of signals may result from the diversity of regulatory mechanisms governing smooth muscle contraction. The RhoA/ROCK pathway drives contraction by inhibiting myosin light chain phosphatase (MLCP) to enhance calcium sensitization [66]. However, the MAPK pathway can participate in the regulation of contraction independently of RhoA. Dessy et al. (1998) demonstrated that MAPK activation directly induces Ca2+-independent smooth muscle contraction [67]. The underlying mechanism involves MAPK (particularly ERK1/2) phosphorylating the actin-binding protein caldesmon, causing its dissociation from F-actin. This relieves caldesmon-mediated inhibition of actin–myosin interaction, thereby permitting cross-bridge formation and tension maintenance [68]. ANGPT1 and FGFR1 both potently activate the MAPK signaling pathway [69,70]. These results suggest that the MAPK pathway and RhoA may be jointly involved in sustaining body wall smooth muscle contraction during the thanatosis pattern in sea cucumbers.
Organisms reallocate energy to cope with various stress states [71]. Glucose is the primary source of energy [72]. Acute stress may disrupt glucose homeostasis, leading to dramatic fluctuations in blood glucose levels [73]. In the present study, transcriptomic analysis revealed that the DEGs were significantly enriched in the Rap1 signaling pathway in group T, with the significant downregulation of the RAPGEF4. RAPGEF4 is a key activator of Rap1. Inhibition of central Rap1 activity significantly reduces blood glucose levels in mice [74]. Consistently, Wang et al. (2025) reported that sea cucumbers subjected to mechanical disturbance for 10 min exhibited significantly reduced glucose levels (the same method for inducing sea cucumbers into thanatosis pattern) [14]. The significant downregulation of the RAPGEF4 in Rap1 signaling pathway suggests that RAPGEF4 may be involved in decreased glucose levels under thanatosis pattern. In addition, the present transcriptomic analysis revealed that the DEGs were significantly enriched in the Ras signaling pathway in group T, with the significant downregulation of the genes of RRAS2 and RalA. RRAS2 directly binds to and activates PI3Kα, accelerating cellular glucose uptake [75]. RalA regulates glucose homeostasis by promoting glucose uptake in brown adipose tissue [76]. The downregulation of these genes indicates a reduction in the efficiency of cellular glucose uptake. This may be an adaptive adjustment to the decreased glucose availability. In addition, sea cucumbers displayed a tendency to remain stationary after the termination of the thanatosis pattern [9]. The stationary tendency may be attributed to the failure to restoring glucose homeostasis.
4.4. Limitations of the Study
These stress response patterns were induced by the specific stressor type, intensity, and duration used in this study. Whether they would change under different stress conditions remains unclear, and this will be investigated in future study. In addition, it is valuable to conduct transcriptomic profiling of neural and muscle tissues from sea cucumbers in different stress response patterns, with the aim of gaining deeper insights.
5. Conclusions
Fleeing, adhesion, and thanatosis are common stress response patterns to various types of stressors in sea cucumbers. RNA-seq results revealed that the fleeing pattern is potentially regulated by the HTR4, HRH2, ADRA1D and MMP14. In the adhesion pattern, sea cucumbers may reallocate energy resources to maintain adhesion by suppressing energy-intensive processes via downregulation of the longevity-regulating pathway and PGK. In the thanatosis pattern, MAPK pathway potentially regulates muscle contraction to maintain the contracted posture. The Rap1 and Ras pathways potentially participate in the reduction in glucose and the adaptations, respectively. The present study offers valuable insights into comprehending the potential molecular regulatory mechanisms of the fleeing, adhesion, and thanatosis patterns in sea cucumbers.
Supplementary Materials
The following supporting information can be downloaded at: https://www.mdpi.com/article/10.3390/biology15120975/s1, The detailed results of the DEGs and their transcripts between groups F and C were provided in the Supplementary Materials S1 and S2, respectively. The detailed results of the DEGs and their transcripts between groups A and C were provided in the Supplementary Materials S3 and S4, respectively. The detailed results of the DEGs and their transcripts between groups T and C were provided in the Supplementary Materials S5 and S6, respectively.
Author Contributions
Conceptualization, G.W. and C.Z.; methodology, G.W., H.W., Q.G. and C.Z.; formal analysis, G.W., H.W. and X.W.; investigation, G.W., H.W. and X.W.; Visualization, G.W. and H.W.; writing—original draft preparation, G.W.; writing—review and editing, Q.G. and C.Z.; supervision, Q.G. and C.Z. All authors have read and agreed to the published version of the manuscript.
Funding
Agriculture Major Project of Liaoning Province Science and Technology Department (2023JH1/10200007), National Key R&D Program of China (2018YFC0310702), Natural Science Foundation of Liaoning Province (2024-MSLH-042), National Key Research and Development Program of Dalian (2022YF16SN066).
Institutional Review Board Statement
Not applicable.
Informed Consent Statement
Not applicable.
Data Availability Statement
The transcriptomic data have been deposited with links to BioProject accession number PRJNA1467255 in the NCBI BioProject database (https://www.ncbi.nlm.nih.gov/bioproject/, accessed on 18 May 2026).
Conflicts of Interest
The authors declare no conflicts of interest.
Appendix A
Table A1.
Quality control and data statistics for clean reads.
Table A2.
Sequence mapping analysis.
References
- Bohus, B.; Benus, R.F.; Fokkema, D.S.; Koolhaas, J.M.; Nyakas, C.; van Oortmersse, G.A.; Prins, A.J.; de Ruiter, A.J.; Scheurink, A.J.; Steffens, A.B. Neuroendocrine states and behavioral and physiological stress responses. Prog. Brain Res. 1987, 72, 57–70. [Google Scholar] [CrossRef] [Scilit] [PubMed]
- Schradin, C.; Makuya, L.; Pillay, N.; Rimbach, R. Harshness is not stress. Trends Ecol. Evol. 2023, 38, 224–227. [Google Scholar] [CrossRef] [Scilit] [PubMed]
- Gabrielsen, G.W.; Smith, E.N. Physiological responses associated with feigned death in the American opossum. Acta Physiol. Scand. 1985, 123, 393–398. [Google Scholar] [CrossRef] [Scilit] [PubMed]
- Herman, J.P.; McKlveen, J.M.; Ghosal, S.; Kopp, B.; Wulsin, A.; Makinson, R.; Scheimann, J.; Myers, B. Regulation of the hypothalamic-pituitary-adrenocortical stress response. Compr. Physiol. 2016, 6, 603–621. [Google Scholar] [CrossRef] [Scilit] [PubMed]
- Salay, L.D.; Ishiko, N.; Huberman, A.D. A midline thalamic circuit determines reactions to visual threat. Nature 2018, 557, 183–189. [Google Scholar] [CrossRef] [Scilit] [PubMed]
- Mashanov, V.S.; Zueva, O.R.; Heinzeller, T.; Dolmatov, I.Y. Ultrastructure of the circumoral nerve ring and the radial nerve cords in holothurians (Echinodermata). Zoomorphology 2006, 125, 27–38. [Google Scholar] [CrossRef] [Scilit]
- Zhang, X.F.; Liu, Y.; Li, Y.; Zhao, X.D. Identification of the geographical origins of sea cucumber (Apostichopus japonicus) in northern China by using stable isotope ratios and fatty acid profiles. Food Chem. 2017, 218, 269–276. [Google Scholar] [CrossRef] [Scilit] [PubMed]
- Han, Q.; Keesing, J.K.; Liu, D. A review of sea cucumber aquaculture, ranching, and stock enhancement in China. Rev. Fish. Sci. Aquacult. 2016, 24, 326–341. [Google Scholar] [CrossRef] [Scilit]
- Wu, G.; Tian, R.H.; Li, X.; Wang, H.Y.; Ju, W.B.; Wang, S.Y.; Zhao, C. Stress response patterns of fleeing, adhesion and thanatosis in the sea cucumber Apostichopus japonicus. Mar. Biol. 2025, 172, 184. [Google Scholar] [CrossRef] [Scilit]
- Florman, J.T.; Alkema, M.J. Co-transmission of neuropeptides and monoamines choreograph the C. elegans escape response. PLoS Genet. 2022, 18, e1010091. [Google Scholar] [CrossRef] [Scilit] [PubMed]
- Zhao, Z.H.; Li, X.; Sun, Y.Z.; Huang, X.Y.; Ding, J.; Chang, Y.Q.; Zhao, C. Effects of alarm cues on behavior and physiology of the sea cucumber Apostichopus japonicus. Aquac. Rep. 2023, 33, 101806. [Google Scholar] [CrossRef] [Scilit]
- Radley, J.J.; Gosselink, K.L.; Sawchenko, P.E. A discrete GABAergic relay mediates medial prefrontal cortical inhibition of the neuroendocrine stress response. J. Neurosci. 2009, 29, 7330–7340. [Google Scholar] [CrossRef] [Scilit] [PubMed]
- Myers, B.; McKlveen, J.M.; Herman, J.P. Glucocorticoid actions on synapses, circuits, and behavior: Implications for the energetics of stress. Front. Neuroendocr. 2014, 35, 180–196. [Google Scholar] [CrossRef] [Scilit] [PubMed]
- Wang, H.Y.; Tian, R.H.; Wu, G.; Huang, X.Y.; Zhao, Z.H.; Ding, P.; Zhao, C. Crevices increase feeding behavior, crawling behavior and glucose level of stressed sea cucumbers (Apostichopus japonicus). J. Exp. Mar. Biol. Ecol. 2025, 583, 152088. [Google Scholar] [CrossRef] [Scilit]
- Zhang, Z.; Fu, Y.; Shen, F.; Zhang, Z.; Guo, H.; Zhang, X. Barren environment damages cognitive abilities in fish: Behavioral and transcriptome mechanisms. Sci. Total Environ. 2021, 794, 148805. [Google Scholar] [CrossRef] [Scilit] [PubMed]
- Marguerat, S.; Bähler, J. RNA-seq: From technology to biology. Cell. Mol. Life Sci. 2010, 67, 569–579. [Google Scholar] [CrossRef] [Scilit] [PubMed]
- Wang, Y.H.; Zhou, S.S.; Liu, T.Y.; Chen, M.Y.; Li, W.T.; Zhang, X.M. The transcriptomic responses of the ark shell, Anadara broughtonii, to sulfide and hypoxia exposure. Mol. Biol. Rep. 2019, 46, 4245–4257. [Google Scholar] [CrossRef] [Scilit] [PubMed]
- Barkan, R.; Cooke, I.; Watson, S.A.; Strugnell, J.M. Synthesis of transcriptomic studies reveals a core response to heat stress in abalone (genus Haliotis). BMC Genom. 2025, 26, 474. [Google Scholar] [CrossRef] [Scilit] [PubMed]
- Hou, Y.K.; Liang, C.F.; Kizi, D.D.R.; Liu, J. Transcriptomic analysis of the hepatopancreas response to low-pH stress in kuruma shrimp (Marsupenaeus japonicus). Comp. Biochem. Physiol. Part D Genom. Proteom. 2026, 57, 101667. [Google Scholar] [CrossRef] [Scilit] [PubMed]
- Roelofs, D.; Morgan, J.; Stürzenbaum, S. The significance of genome-wide transcriptional regulation in the evolution of stress tolerance. Evol. Ecol. 2010, 24, 527–539. [Google Scholar] [CrossRef] [Scilit]
- Chang, M.; Li, B.; Liao, M.; Rong, X.; Wang, Y.; Wang, J.; Yu, Y.; Zhang, Z.; Wang, C. Differential expression of miRNAs in the body wall of the sea cucumber Apostichopus japonicus under heat stress. Front. Physiol. 2022, 13, 929094. [Google Scholar] [CrossRef] [Scilit] [PubMed]
- Jiang, J.Y.; Tang, Y.N.; Cao, Z.Z.; Zhou, C.; Yu, Z.H. Effects of hypo-osmotic stress on osmoregulation, antioxidant response, and energy metabolism in sea cucumber Holothuria moebii under desalination environment. Environ. Res. 2024, 252, 118800. [Google Scholar] [CrossRef] [Scilit] [PubMed]
- Wang, Y.; Zheng, Y.; Yin, Y.; Sun, L.; Chen, M. miRNA-mRNA interaction mechanism in echinoderm Apostichopus japonicus in response to acute hypoxia. Aquaculture 2025, 604, 742487. [Google Scholar] [CrossRef] [Scilit]
- Gao, F.; Yang, H. Anatomy. In The Sea Cucumber Apostichopus japonicus: Biology, Ecology and Aquaculture; Yang, H., Hamel, J.-F., Mercier, A., Eds.; Elsevier: Amsterdam, The Netherlands, 2015; Volume 39, pp. 53–76. [Google Scholar] [CrossRef] [Scilit]
- Chen, Y.X.; Chen, Y.S.; Shi, C.M.; Huang, Z.B.; Zhang, Y.; Li, S.K.; Li, Y.; Ye, J.; Yu, C.; Li, Z.; et al. SOAPnuke: A MapReduce acceleration-supported software for integrated quality control and preprocessing of high-throughput sequencing data. Gigascience 2018, 7, gix120. [Google Scholar] [CrossRef] [Scilit] [PubMed]
- Sun, L.; Jiang, C.; Su, F.; Cui, W.; Yang, H. Chromosome-level genome assembly of the sea cucumber Apostichopus japonicus. Sci. Data 2023, 10, 454. [Google Scholar] [CrossRef] [Scilit] [PubMed]
- Kim, D.; Langmead, B.; Salzberg, S.L. HISAT: A fast spliced aligner with low memory requirements. Nat. Methods 2015, 12, 357–360. [Google Scholar] [CrossRef] [Scilit] [PubMed]
- Langmead, B.; Salzberg, S.L. Fast gapped-read alignment with Bowtie 2. Nat. Methods 2012, 9, 357–359. [Google Scholar] [CrossRef] [Scilit] [PubMed]
- Li, B.; Dewey, C.N. RSEM: Accurate transcript quantification from RNA-Seq data with or without a reference genome. BMC Bioinform. 2011, 12, 323. [Google Scholar] [CrossRef] [Scilit] [PubMed]
- Love, M.I.; Huber, W.; Anders, S. Moderated estimation of fold change and dispersion for RNA-seq data with DESeq2. Genome Biol. 2014, 15, 550. [Google Scholar] [CrossRef] [Scilit] [PubMed]
- Yang, A.F.; Zhou, Z.C.; Dong, Y.; Jiang, B.; Wang, X.Y.; Chen, Z.; Guan, X.Y.; Wang, B.; Sun, D.P. Stability comparison of cytb and β-actin genes expression in sea cucumber (Apostichopus japonicus). J. Agric. Sci. Technol. 2010, 12, 79–84, (With English Abstract). [Google Scholar] [CrossRef]
- Crawford, M.; Masterson, F.A. Species-specific defense reactions and avoidance learning. Pav. J. Biol. Sci. 1982, 17, 204–214. [Google Scholar] [CrossRef] [Scilit] [PubMed]
- Yalçınkaya, B.H.; Erikli, Ş.; Özilgen, B.A.; Olcay, A.B.; Sorgüven, E.; Özilgen, M. Thermodynamic analysis of the squid mantle muscles and giant axon during slow swimming and jet escape propulsion. Energy 2016, 102, 537–549. [Google Scholar] [CrossRef] [Scilit]
- Hostrup, M.; Bangsbo, J. Limitations in intense exercise performance of athletes-effect of speed endurance training on ion handling and fatigue development. J. Physiol. 2017, 595, 2897–2913. [Google Scholar] [CrossRef] [Scilit] [PubMed]
- Delgado-Calle, J.; Hancock, B.; Likine, E.F.; Sato, A.Y.; McAndrews, K.; Sanudo, C.; Bruzzaniti, A.; Riancho, J.A.; Tonra, J.R.; Bellido, T. MMP14 is a novel target of PTH signaling in osteocytes that controls resorption by regulating soluble RANKL production. FASEB J. 2018, 32, 2878–2890. [Google Scholar] [CrossRef] [Scilit] [PubMed]
- De Filippo, R.; Schmitz, D. Transcriptomic mapping of the 5-HT receptor landscape. Patterns 2024, 5, 101048. [Google Scholar] [CrossRef] [Scilit] [PubMed]
- Zhao, Y.; Huang, C.X.; Gu, Y.M.; Zhao, Y.C.; Ren, W.J.; Wang, Y.T.; Chen, J.J.; Guan, N.N.; Song, J.R. Serotonergic modulation of vigilance states in zebrafish and mice. Nat. Commun. 2024, 15, 2596. [Google Scholar] [CrossRef] [Scilit] [PubMed]
- Jahnel, U.; Kaufmann, B.; Rombusch, M.; Nawrath, H. Contribution of both α- and β-adrenoceptors to the inotropic effects of catecholamines in the rabbit heart. Naunyn-Schmiedeberg’s Arch. Pharmacol. 1992, 346, 665–672. [Google Scholar] [CrossRef] [Scilit] [PubMed]
- Jansen, A.S.; Nguyen, X.V.; Karpitskiy, V.; Mettenleiter, T.C.; Loewy, A.D. Central command neurons of the sympathetic nervous system: Basis of the fight-or-flight response. Science 1995, 270, 644–646. [Google Scholar] [CrossRef] [Scilit] [PubMed]
- Bers, D.M.; Despa, S. Na/K-ATPase—An integral player in the adrenergic fight-or-flight response. Trends Cardiovasc. Med. 2009, 19, 111–118. [Google Scholar] [CrossRef] [Scilit] [PubMed]
- Obara, I.; Telezhkin, V.; Alrashdi, I.; Chazot, P.L. Histamine, histamine receptors, and neuropathic pain relief. Br. J. Pharmacol. 2020, 177, 580–599. [Google Scholar] [CrossRef] [Scilit] [PubMed]
- Yang, L.; Zhang, M.; Zhou, Y.; Jiang, D.; Yu, L.; Xu, L.; Fei, F.; Lin, W.; Zheng, Y.; Wu, J.; et al. Histamine-tuned subicular circuit mediates alert-driven accelerated locomotion in mice. Nat. Commun. 2024, 15, 9887. [Google Scholar] [CrossRef] [Scilit] [PubMed]
- Hoekstra, L.A.; Moroz, L.L.; Heyland, A. Novel insights into the echinoderm nervous system from histaminergic and FMRFaminergic-like cells in the sea cucumber Leptosynapta clarki. PLoS ONE 2012, 7, e44220. [Google Scholar] [CrossRef] [Scilit] [PubMed]
- Haran, M.; Gross, A. Balancing glycolysis and mitochondrial OXPHOS: Lessons from the hematopoietic system and exercising muscles. Mitochondrion 2014, 19, 3–7. [Google Scholar] [CrossRef] [Scilit] [PubMed]
- Li, Z.; Chen, S.X.; Jiang, S.; Yang, Y.N.; Yan, X.C. Unlocking the secrets of glucose metabolism reprogramming: The role in pulmonary diseases. Front. Pharmacol. 2025, 16, 1551452. [Google Scholar] [CrossRef] [Scilit] [PubMed]
- Ashraf, A.; Bruce, E.D. A review of HIF-1α-mediated integration of metabolic reprogramming, mitochondrial function, and PI3K/Akt–MAPK–Nrf2–NF-κB signaling. Antioxidants 2026, 15, 378. [Google Scholar] [CrossRef] [Scilit] [PubMed]
- Brushia, R.J.; Walsh, D.A. Phosphorylase kinase: The complexity of its regulation is reflected in the complexity of its structure. Front. Biosci. 1999, 4, 618–641. [Google Scholar] [CrossRef] [Scilit] [PubMed]
- Ma, R.; Du, B.; Shi, C.; Wang, L.; Zeng, F.; Han, J.; Guan, H.; Wang, Y.; Yan, K. Molecular basis for the regulation of human phosphorylase kinase by phosphorylation and Ca2+. Nat. Commun. 2025, 16, 3020. [Google Scholar] [CrossRef] [Scilit] [PubMed]
- Ganapathy, U.; Marrero, J.; Calhoun, S.; Eoh, H.; de Carvalho, L.P.S.; Rhee, K.; Ehrt, S. Two enzymes with redundant fructose bisphosphatase activity sustain gluconeogenesis and virulence in Mycobacterium tuberculosis. Nat. Commun. 2015, 6, 7912. [Google Scholar] [CrossRef] [Scilit] [PubMed]
- Li, X.; Jiang, Y.; Meisenhelder, J.; Yang, W.; Hawke, D.H.; Zheng, Y.; Xia, Y.; Aldape, K.; He, J.; Hunter, T.; et al. Mitochondria-translocated PGK1 functions as a protein kinase to coordinate glycolysis and the TCA cycle in tumorigenesis. Mol. Cell 2016, 61, 705–719. [Google Scholar] [CrossRef] [Scilit] [PubMed]
- Karimi, R.; Yanovich, A.; Elbarbry, F.; Cleven, A. Adaptive Effects of Endocrine Hormones on Metabolism of Macronutrients during Fasting and Starvation: A Scoping Review. Metabolites 2024, 14, 336. [Google Scholar] [CrossRef] [Scilit] [PubMed]
- Antomagesh, F.; Vijayan, M.M. Stable-isotope tracing reveals the role of corticosteroid receptors in driving cortisol-mediated central and peripheral glucose regulation in zebrafish. Front. Endocrinol. 2025, 16, 1670637. [Google Scholar] [CrossRef] [Scilit] [PubMed]
- Iglesias, M.; Felix, D.A.; Gutiérrez-Gutiérrez, Ó.; De Miguel-Bonet, M.D.M.; Sahu, S.; Fernández-Varas, B.; Perona, R.; Aboobaker, A.A.; Flores, I.; González-Estévez, C. Downregulation of mTOR signaling increases stem cell population telomere length during starvation of immortal planarians. Stem Cell Rep. 2019, 13, 405–418. [Google Scholar] [CrossRef] [Scilit] [PubMed]
- Nonninger, T.J.; Mak, J.; Gerisch, B.; Ramponi, V.; Kawamura, K.; Ripa, R.; Schilling, K.; Latza, C.; Kölschbach, J.; Serrano, M.; et al. A TFEB-TGFβ axis systemically regulates diapause, stem cell resilience and protects against a senescence-like state. Nat. Aging 2025, 5, 1340–1357. [Google Scholar] [CrossRef] [Scilit] [PubMed]
- Haigis, K.; Kendall, K.; Wang, Y.; Cheung, A.; Haigis, M.C.; Glickman, J.N.; Niwa-Kawakita, M.; Sweet-Cordero, A.; Sebolt-Leopold, J.; Shannon, K.M.; et al. Differential effects of oncogenic K-Ras and N-Ras on proliferation, differentiation and tumor progression in the colon. Nat. Genet. 2008, 40, 600–608. [Google Scholar] [CrossRef] [Scilit] [PubMed]
- Iovanna, J.; Dusetti, N. Why isn’t an oncogenic mutation in KRAS enough to induce and sustain transformation? Crit. Rev. Oncol. Hematol. 2026, 219, 105110. [Google Scholar] [CrossRef] [Scilit] [PubMed]
- Xue, J.Y.; Zhao, Y.; Aronowitz, J.; Mai, T.T.; Vides, A.; Qeriqi, B.; Kim, D.; Li, C.; de Stanchina, E.; Mazutis, L.; et al. Rapid non-uniform adaptation to conformation-specific KRAS(G12C) inhibition. Nature 2020, 577, 421–425. [Google Scholar] [CrossRef] [Scilit] [PubMed]
- Liu, S.; Liu, Y.; Bao, E.; Tang, S. The protective role of heat shock proteins against stresses in animal breeding. Int. J. Mol. Sci. 2024, 25, 8208. [Google Scholar] [CrossRef] [Scilit] [PubMed]
- Awoleye, M.O.; Agbonifo, W.O.; Chimezie, J.; Francis, H.O.; Adedeji, T.G. Thermoregulatory limits in an era of climate change: A systematic review of molecular insights. Environ. Res. 2026, 288, 123246. [Google Scholar] [CrossRef] [Scilit] [PubMed]
- El Samad, H.; Khammash, M.; Homescu, C.; Petzold, L. Optimal performance of the heat-shock gene regulatory network. IFAC Proc. Vol. 2005, 38, 19–24. [Google Scholar] [CrossRef] [Scilit]
- Hoekstra, L.A.; Montooth, K.L. Inducing extra copies of the Hsp70 gene in Drosophila melanogaster increases energetic demand. BMC Evol. Biol. 2013, 13, 68. [Google Scholar] [CrossRef] [Scilit] [PubMed]
- Carey, H.V.; Sills, N.S.; Gorham, D.A. Stress proteins in mammalian hibernation. Am. Zool. 1999, 39, 825–835. [Google Scholar] [CrossRef] [Scilit]
- Tsukamoto, D.; Hasegawa, T.; Hirose, S.I.; Sakurai, Y.; Ito, M.; Takamatsu, N. Circadian transcription factor HSF1 regulates differential HSP70 gene transcription during the arousal-torpor cycle in mammalian hibernation. Sci. Rep. 2019, 9, 832. [Google Scholar] [CrossRef] [Scilit] [PubMed]
- Li, X.; Zhou, H.Y.; Qin, Y.J.; Xin, J.H. Microstructure and ultrastructure of body wall in sea cucumber Apostichopus japonicus. J. Dalian Fish. Univ. 2010, 25, 289–292. [Google Scholar] [CrossRef]
- Zhang, W.; Huang, Y.; Gunst, S.J. The small GTPase RhoA regulates the contraction of smooth muscle tissues by catalyzing the assembly of cytoskeletal signaling complexes at membrane adhesion sites. J. Biol. Chem. 2012, 287, 33996–34008. [Google Scholar] [CrossRef] [Scilit] [PubMed]
- Somlyo, A.P.; Somlyo, A.V. Ca2+ sensitivity of smooth muscle and nonmuscle myosin II: Modulated by G proteins, kinases, and myosin phosphatase. Physiol. Rev. 2003, 83, 1325–1358. [Google Scholar] [CrossRef] [Scilit] [PubMed]
- Dessy, C.; Kim, I.; Sougnez, C.L.; Laporte, R.; Morgan, K.G. A role for MAP kinase in differentiated smooth muscle contraction evoked by alpha-adrenoceptor stimulation. Am. J. Physiol. 1998, 275, C1081–C1086. [Google Scholar] [CrossRef] [Scilit] [PubMed]
- Hedges, J.C.; Oxhorn, B.C.; Carty, M.; Adam, L.P.; Yamboliev, I.A.; Gerthoffer, W.T. Phosphorylation of caldesmon by ERK MAP kinases in smooth muscle. Am. J. Physiol. Cell Physiol. 2000, 278, C718–C726. [Google Scholar] [CrossRef] [Scilit] [PubMed]
- Kouhara, H.; Hadari, Y.R.; Spivak-Kroizman, T.; Schilling, J.; Bar-Sagi, D.; Lax, I.; Schlessinger, J. A lipid-anchored Grb2-binding protein that links FGF-receptor activation to the Ras/MAPK signaling pathway. Cell 1997, 89, 693–702. [Google Scholar] [CrossRef] [Scilit] [PubMed]
- Bi, X.; Niu, J.; Ding, W.; Zhang, M.; Yang, M.; Gu, Y. Angiopoietin-1 attenuates angiotensin II-induced ER stress in glomerular endothelial cells via a Tie2 receptor/ERK1/2-p38 MAPK-dependent mechanism. Mol. Cell. Endocrinol. 2016, 428, 118–132. [Google Scholar] [CrossRef] [Scilit] [PubMed]
- Schuler, C.B.; Sayre, A.B.; Zakaria, L.; Tassone, S.; Rinehart, A.; Harris, R. Energy allocation resilience and endocrine integration. Int. J. Mol. Sci. 2026, 27, 1345. [Google Scholar] [CrossRef] [Scilit] [PubMed]
- Chandel, N.S. Carbohydrate Metabolism. Cold Spring Harb. Perspect. Biol. 2021, 13, a040568. [Google Scholar] [CrossRef] [Scilit] [PubMed]
- Stanley, S.A. Neural regulation of blood glucose in acute stress: A report on research supported by pathway to stop diabetes. Diabetes 2026, 75, 5–16. [Google Scholar] [CrossRef] [Scilit] [PubMed]
- Kaneko, K.; Lin, H.Y.; Fu, Y.; Saha, P.K.; De la Puente-Gomez, A.B.; Xu, Y.; Ohinata, K.; Chen, P.; Morozov, A.; Fukuda, M. Rap1 in the VMH regulates glucose homeostasis. JCI Insight 2021, 6, e142545. [Google Scholar] [CrossRef] [Scilit] [PubMed]
- Terayama, K.; Furuzono, S.; Fer, N.; Yan, W.; Young, L.C.; Czyzyk, D.J.; Goldstein de Salazar, R.; Sasaki, M.; Uozumi, A.; Konishi, M.; et al. Molecular glues that facilitate RAS binding to PI3Kα promote glucose uptake without insulin. Science 2025, 389, 402–408. [Google Scholar] [CrossRef] [Scilit] [PubMed]
- Skorobogatko, Y.; Dragan, M.; Cordon, C.; Reilly, S.M.; Hung, C.W.; Xia, W.; Zhao, P.; Wallace, M.; Lackey, D.E.; Chen, X.W.; et al. RalA controls glucose homeostasis by regulating glucose uptake in brown fat. Proc. Natl. Acad. Sci. USA 2018, 115, 7819–7824. [Google Scholar] [CrossRef] [Scilit] [PubMed]

Disclaimer/Publisher’s Note: The statements, opinions and data contained in all publications are solely those of the individual author(s) and contributor(s) and not of MDPI and/or the editor(s). MDPI and/or the editor(s) disclaim responsibility for any injury to people or property resulting from any ideas, methods, instructions or products referred to in the content. |
© 2026 by the authors. Licensee MDPI, Basel, Switzerland. This article is an open access article distributed under the terms and conditions of the Creative Commons Attribution (CC BY) license.