


Abstract
A systematic characterisation of halide-free vanadium-doped zircon as a cyan ceramic pigment was carried out, focusing on its behaviour in glazes and under conditions of successive (accumulative) or direct firing, in comparison with a halide-mineralised sample. In accumulative firing at 1000 °C, the mineralised powder reaches more than 93% zircon, whereas the non-mineralised powder reaches only 70%. However, at low temperatures under direct firing, the reactivity of the mineralised sample is very low, with only around 7–8% zircon being formed, compared with the halide-free sample. The mineralised powder produces colourless powders at low temperatures and an intense blue colour at 1000 °C. In contrast, the halide-free samples change from yellow to green. However, their UV–Vis–NIR diffuse reflectance spectra show the same absorption bands. In glazing tests using different zirconia-free glazes, the highest blue b* values were obtained for the halide-free vanadium-doped zircon in both the alkali and ZnO–boron monoporosa glazes. Therefore, despite their yellow-green colouration as powders, halide-free vanadium-doped zircon pigments can be successfully used as turquoise ceramic pigments.
1. Introduction
C. A. Seabright patented the first ceramic pigments of the zircon family in 1947 [1], the vanadium-doped zircon, describing a green and a blue powder. According to the patent, “the green variety may be produced by heating together suitable proportions of zirconium dioxide, silica and vanadium pentoxide, or other compounds capable of yielding these oxides. The novel blue pigments may be produced in the same way by adding an alkali to the batch. It is preferable that a source of fluorine be added also, although it is not absolutely essential.” Using the stoichiometry of zirconium silicate (ZrO2·SiO2) and adding a vanadium precursor, such as V2O5 or other compounds capable of yielding these oxides, Seabright reported that the X-ray diffraction pattern of the resulting pigment was identical to that of zirconium silicate. In the case of the green material produced as described above, the X-ray diffraction pattern also showed diffraction lines corresponding to zirconium oxide, silica, and zirconium silicate.
The Dry Colour Manufacturers Association classifies pigments into three categories, A, B, and C, according to their thermal stability and chemical resistance to attack by the matrix [2,3]. Category A comprises “ceramic pigments”, which can withstand attack by molten glass at temperatures ranging from 800 to 1300 °C. In contrast, Categories B and C withstand only the attack of polymers at 150–250 °C and pigment paints at room temperature, respectively.
The mineralisers generally employed are mixtures of two or more alkali halides, such as NaF, NaCl, and NH4Cl. Mineralisers are used in the preparation of these pigments primarily for two reasons. First, they help lower the calcination temperature required for zircon formation, an effect that can be understood in terms of a fluxing mechanism. Alkali halides have relatively high melting points (m.p. NaF = 992 °C; m.p. NaCl = 800.4 °C); therefore, eutectic mixtures of these compounds are typically used. For example, a NaF–NaCl mixture with an NaCl ratio of 2:1 exhibits a eutectic at 688 °C. In this study, a weight percentage (5% NaF and 3% NaCl) corresponds to the molar composition (69.9% NaF and 31.1% NaCl), which has a melting point of 875.1 °C according to the NaF–NaCl phase diagram [4]. One temperature was selected well below the liquidus temperature of the mixture (750 °C), another close to it (850 °C), and a third well above it.
The second reason, which also appears to be highly significant, is that these mineralising agents facilitate the incorporation of vanadium into the zircon structure. Consequently, mineralisers are considered to play a crucial structural role. In this regard, several authors in early studies [3,5,6,7,8,9] suggested that NaF, although no mention was made of NaCl, becomes incorporated into the zircon lattice through a solid-solution mechanism. This hypothesis was supported by the detection of both Na+ and F− ions in analyses of turquoise-blue pigment samples. Furthermore, in calcined samples from the NaF–V2O5–SiO2–ZrO2 system, which exhibit a characteristic turquoise-blue colour, a noticeable decrease in the zircon unit-cell dimensions was observed compared with fluoride-free samples. This decrease was attributed to the substitution of O2− by F− ions in the zircon lattice, thereby generating cation vacancies to maintain electrical charge neutrality.
Both green (non-mineralised) and turquoise (halide-mineralised) powders produce turquoise shades in glazes. Therefore, both green and blue samples can be used as ceramic pigments, since the colour of a pigment powder is not necessarily reproduced in the glaze. However, in both ceramic practice and academic research, the use and characterisation of green V–ZrSiO4 solid solutions have generally been avoided because using a green powder to produce blue shades in glazes is not considered aesthetically desirable.
The crystal structure of zircon (ZrSiO4; space group I41/amd) consists of chains of alternating edge-sharing SiO4 tetrahedra and ZrO8 triangular dodecahedra running parallel to the c-axis. Although there is broad agreement that the presence of V4+ in solid solution is responsible for the blue colour, the origin of the green colour remains under debate. Several authors have proposed that V5+ may also enter the zircon structure in solid solution [3,5].
The addition of fluorides is considered critical for the preparation of a stable turquoise pigment powder. In the literature, the role of fluorides is often overlooked [5]. The controversy over the location of vanadium ions in the zircon lattice largely persists, with several hypotheses having been proposed: (1) substitution of V4+ at the Zr dodecahedral site, 4a (point symmetry −4m2), based on absorption spectra [6] and lattice-energy calculations [10,11]; (2) substitution of Si by V4+ at the Si tetrahedral site, 4b (point symmetry −4m2), supported by electron spin resonance (ESR) spectra of single crystals and Raman spectroscopy [12,13]; (3) simultaneous occupation of the Zr and Si sites, based on optical absorption and electron paramagnetic resonance (EPR) spectra of V4+, which provide information on the local crystal-field environment and electronic states of the impurity ion [14]; or (4) occupation of the interstitial 16g site (point symmetry 2), where V4+ can be accommodated, with lattice electroneutrality maintained through the formation of a Si vacancy. The latter model is supported by polarised electronic absorption spectra of a blue vanadium-doped zircon single crystal [6,15,16].
EPR studies were performed by Monrós et al. [17] on the three specimens described in [3], which were synthesised by a polymeric sol–gel method. Three different signals were observed, corresponding to isolated V4+ ions at the surface of the solid, isolated V4+ ions within the solid, and a third signal associated with V4+ clusters with interionic distances of less than 8 Å, which were not homogeneously distributed throughout the solid. Clustering was the only signal observed in both the soft-blue and green fluoride-free powders. In contrast, all three signals were detected in the turquoise mineralised powder, indicating that fluorine inhibits the formation of V4+ clusters and promotes the preservation of vanadium in isolated sites. Likewise, other controversies remain regarding the mechanism by which vanadium is reduced from its pentavalent state in the raw mixture to the tetravalent state, the role of halides in pigment synthesis [6,15], and the differences in pigment stability in different glazes [5,18].
Recently, two studies have reported the low-temperature synthesis of fluoride-free vanadium blue from a mixture of precursors: one explores microwave-assisted synthesis in comparison with conventional electric-furnace calcination [19], and the other uses fluoride-free precursor salts (Na2SiO3·9H2O, Na3VO4, and ZrOCl2·8H2O), which generate “in situ” two moles of NaCl per mole of ZrSiO4 as a mineralizer [20]. In conventional syntheses, the halide content rarely exceeds 0.5 moles per mole of zircon, whereas in the present study, this ratio is 0.31.
In this study, both halide-free and halide-mineralised vanadium-doped zircon powders (V0.1Zr0.9SiO4) were synthesised using typical industrial compositions and temperature ranges. The main objectives were:
(a) to compare the evolution of the stoichiometry and reactivity of the powders as a function of temperature under successive firing treatments and by direct firing at the target temperature;
(b) to follow the evolution of the zircon unit-cell parameters as a function of temperature;
(c) to compare the evolution of the powder colour with temperature;
(d) to analyse the different behaviour of both halide-free and mineralised powders in three glaze systems: an alkali- and lead-free glaze for double firing, a lead bisilicato glaze for double firing, and a lead-free glaze for monoporosa single firing.
To the best of our knowledge, no previous systematic study has investigated the halide-free vanadium-doped zircon as a cyan ceramic pigment in comparison with a halide-mineralised sample, focusing on its behaviour in glazes and under conditions of successive (cumulative) or direct firing.
2. Materials and Methods
2.1. Powder Synthesis
Pigments with the nominal composition (Zr0.9V0.1)SiO4, without halide addition (samples S), and mineralised with halides (5 wt% NaF and 3 wt% NaCl, corresponding approximately to the eutectic composition, with a melting point of around 700 °C; samples C) were synthesised by a solid-state method using oxide powders as precursors: ZrO2, quartz SiO2, and NH4VO3, with NaF and NaCl added to the mineralised compositions. The oxide precursors had an average particle size of 0.3–5 µm and a purity of 99 wt% and were supplied by QUIMIALMEL S.A. (Castellón de la Plana, Spain). NH4VO3, NaF, and NaCl, with a purity of 99.8%, were supplied by Aldrich S.A. (Madrid, Spain).
The precursors were homogenised in an electric grinder operating at 20,000 rpm for 5 min and subsequently calcined at 750, 850, and 1000 °C for 3 h in a conventional electric kiln. The calcination temperatures were selected to be above the melting point of the mineralizer mixture.
2.2. Methods of Characterisation
X-ray diffraction (XRD) patterns were recorded using a Siemens D5000 diffractometer (Munich, Germany) with Cu Kα radiation over the 10–70° 2θ range, at a step size of 0.03° 2θ and a counting time of 5 s per step, under operating conditions of 40 kV and 20 mA. For the precise determination of the unit-cell parameters, samples containing 30 wt% α-Al2O3 as an internal standard were also analysed by XRD over the 10–70° 2θ range, using a step size of 0.02° 2θ and a counting time of 10 s per step, at 40 kV and 20 mA. The peak positions, corrected using α-Al2O3 as an internal standard, were refined by a least-squares fitting procedure and used to calculate the lattice parameters of the corresponding pigments. The crystallite size of the pigments was estimated using the Debye–Scherrer method [21], with α-Al2O3 as the internal standard.
The L*, a*, and b* colour parameters of the samples were measured according to the CIELAB system (Commission Internationale de l’Éclairage) [22] using an X-Rite SP60 spectrometer (X-Rite Inc., Kentwood, MI, USA) under standard D65 illumination and a 10° standard observer. In this system, L* represents lightness (0 = black, 100 = white), whereas a* and b* represent the chromatic coordinates (−a* = green, +a* = red; −b* = blue, +b* = yellow).
The C* (chroma), h* (hue), and colour difference ΔE* values were calculated from the L*, a*, and b* parameters using Equations (1) and (2), respectively:
C* = (a*2 + b*2)1/2
h* = arctan (b*/a*)
UV–Vis–NIR diffuse reflectance spectra of the samples were recorded using a Jasco V-670 spectrometer (Tokyo, Japan). The spectra were collected over the 350–2500 nm wavelength range for the optimised pigments.
The glazed samples were measured directly in the integrating-sphere chamber of the spectrometer. The powder samples were first manually ground in an agate mortar, sieved to a particle size of <100 µm, and finally pressed into pellets using a manual hydraulic press at 4 kg·cm−2 [23].
2.3. Evaluation as Ceramic Pigments
Molten glazes interact with pigment particles through dissolution and/or chemical reactions, potentially leading to pigment degradation or colour alteration. The aggressiveness of the glaze is influenced by both its maturation temperature and chemical composition.
In this study, the performance of the pigments was evaluated in different glaze compositions to investigate the effect of the glaze on pigment stability. For each glaze, 5 wt% pigment was added to the following conventional commercial glazes:
Glaze I: alkali glaze, free of lead and ZnO, with low alumina content for double firing at 1000 °C.
Glaze II: lead bisilicato for double firing at 1000 °C.
Glaze III: lead-free with ZnO and B2O3 for single firing at 1080 °C.
The glazed pieces were prepared by manually mixing the frit, pigment, and water in a weight ratio of 100:5:40 using an agate mortar. The resulting suspensions were applied by the Doctor Blade method to obtain a glaze layer approximately 1 mm thick on a white ceramic tile.
2.4. Microstructure Characterisation
Optical microscopy was performed using an Olympus IXplore IX85 microscope (Tokyo, Japan), while scanning electron microscopy coupled with energy-dispersive X-ray spectroscopy (SEM–EDS) was performed using a JEOL 7001 instrument (Tokyo, Japan) to analyse the microstructure of the powders and glazed surfaces.
3. Results and Discussion
3.1. Halide-Free Powders
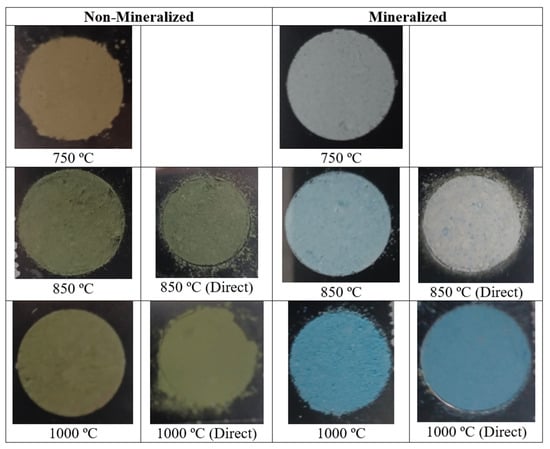
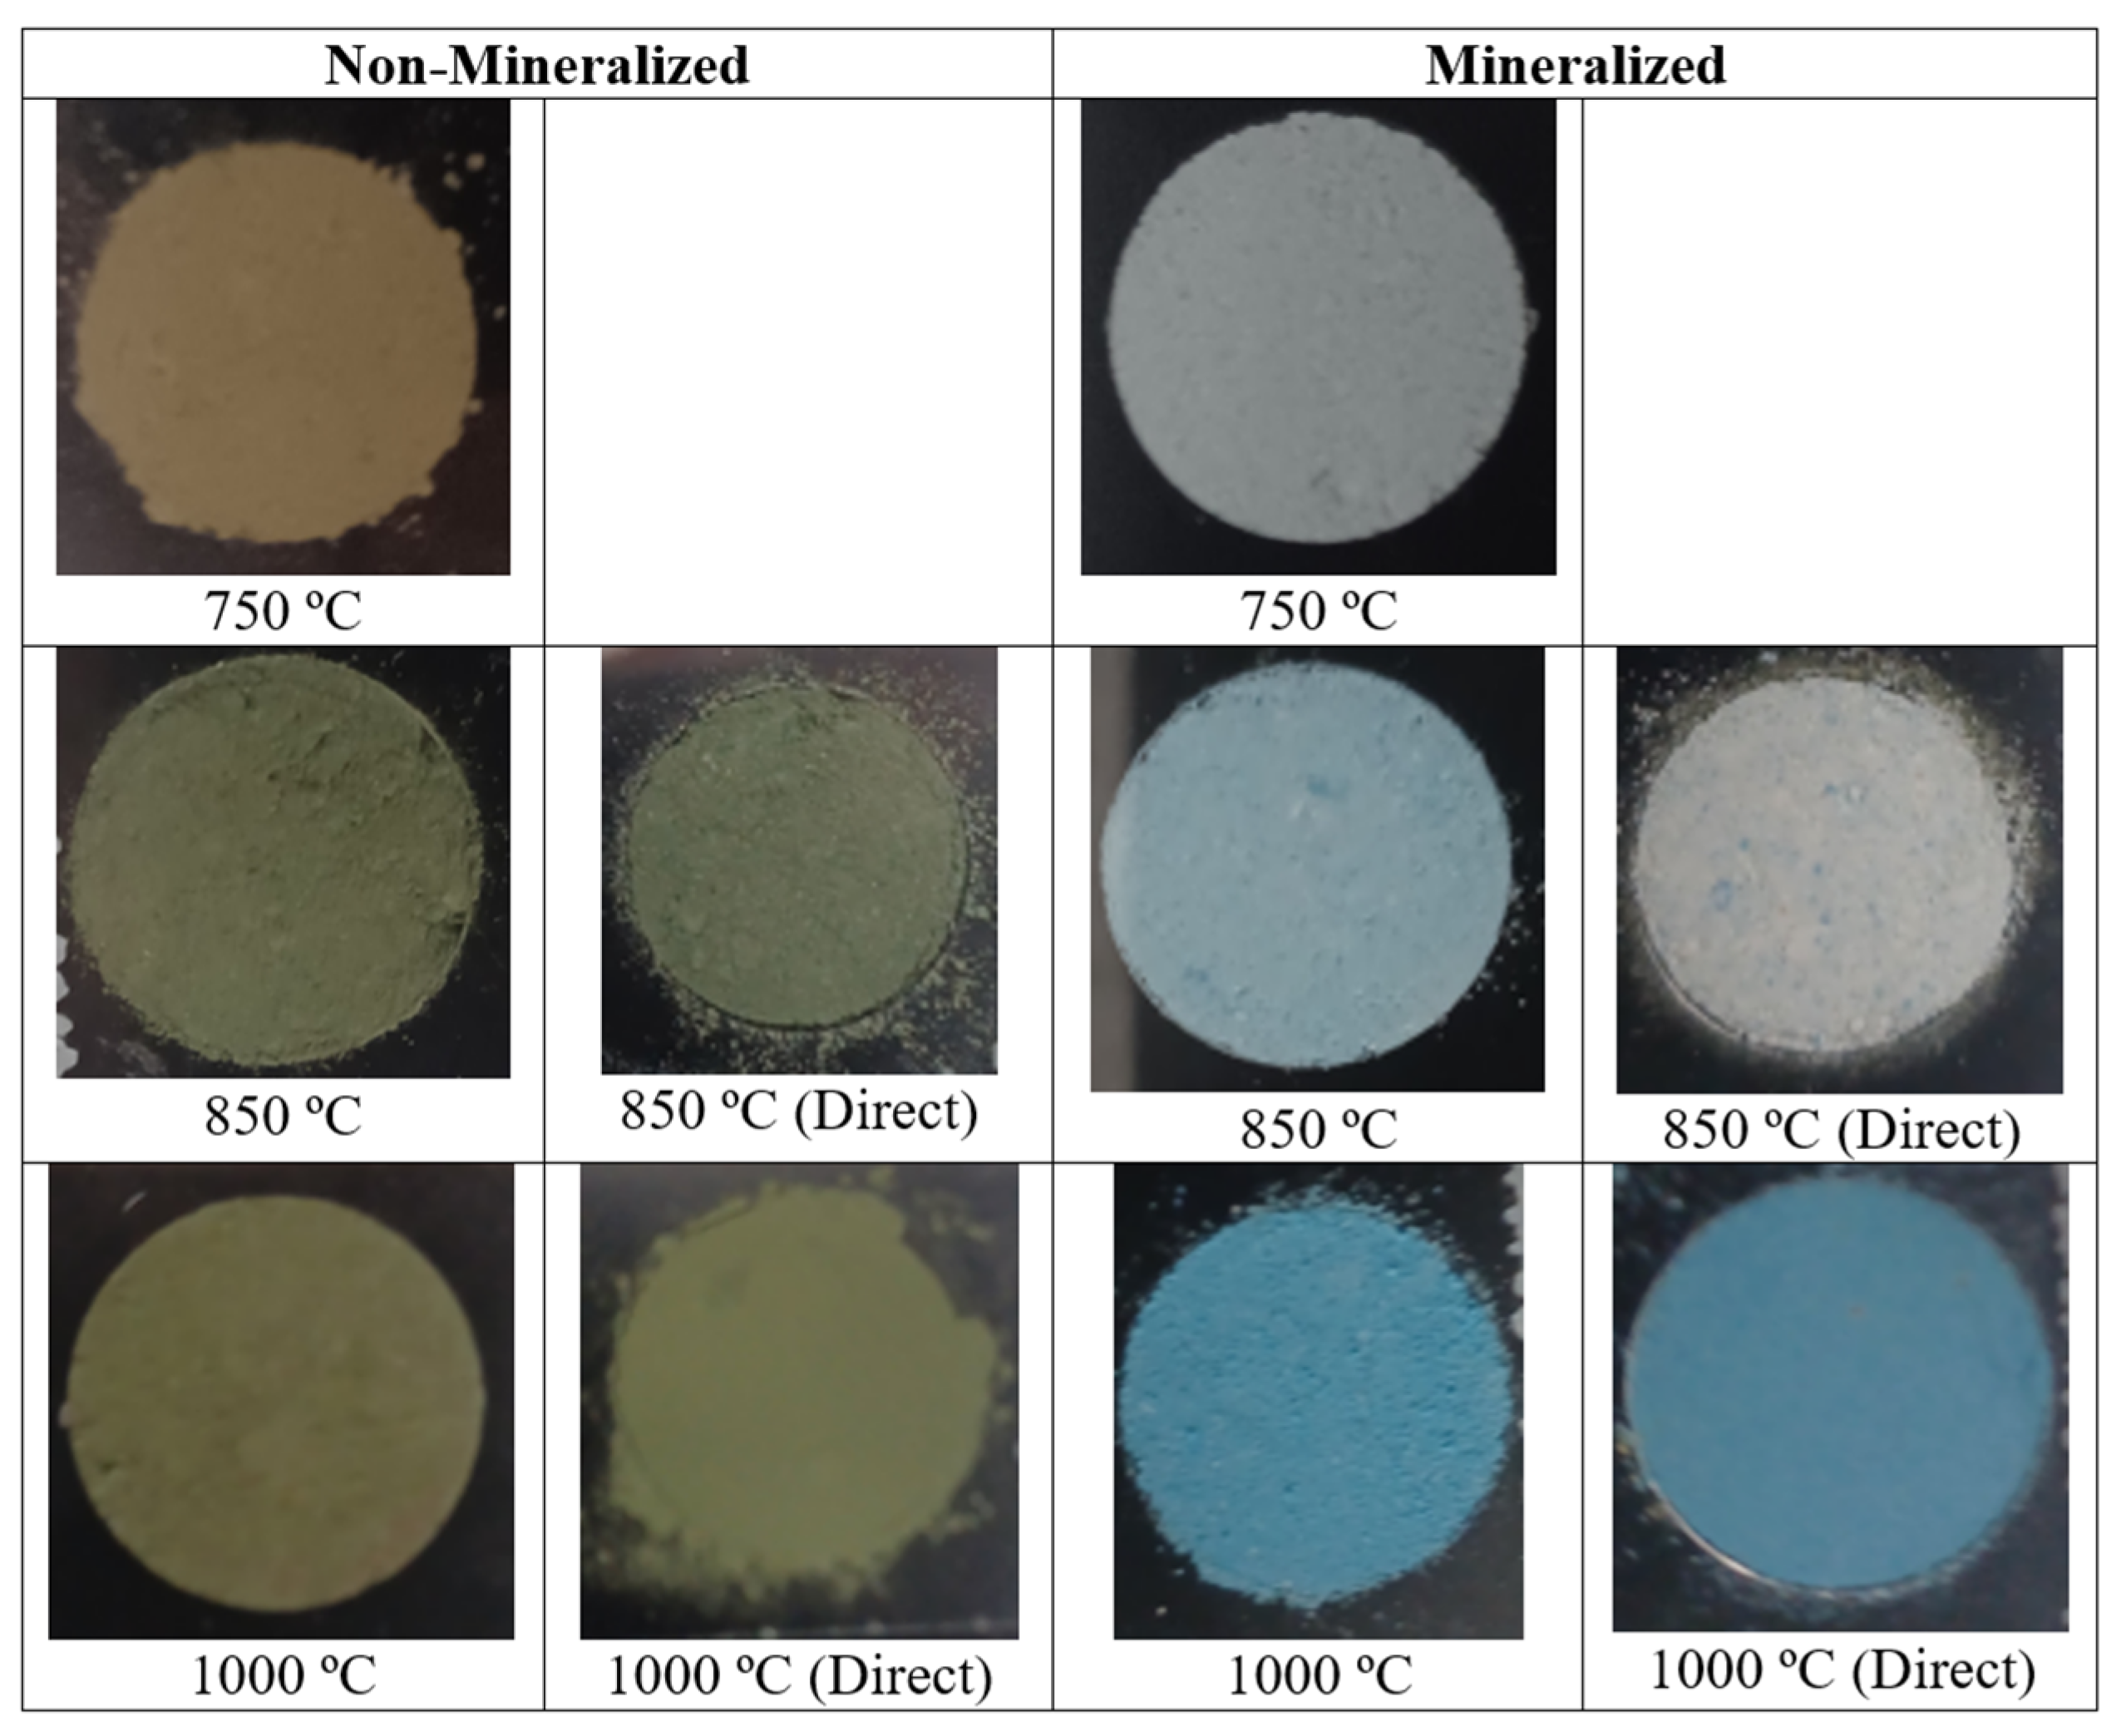
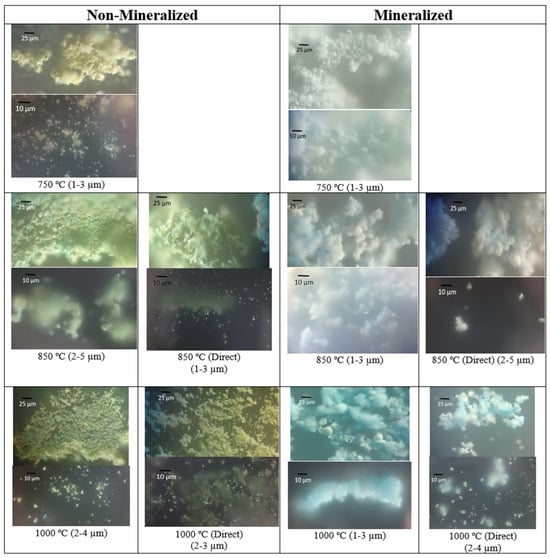
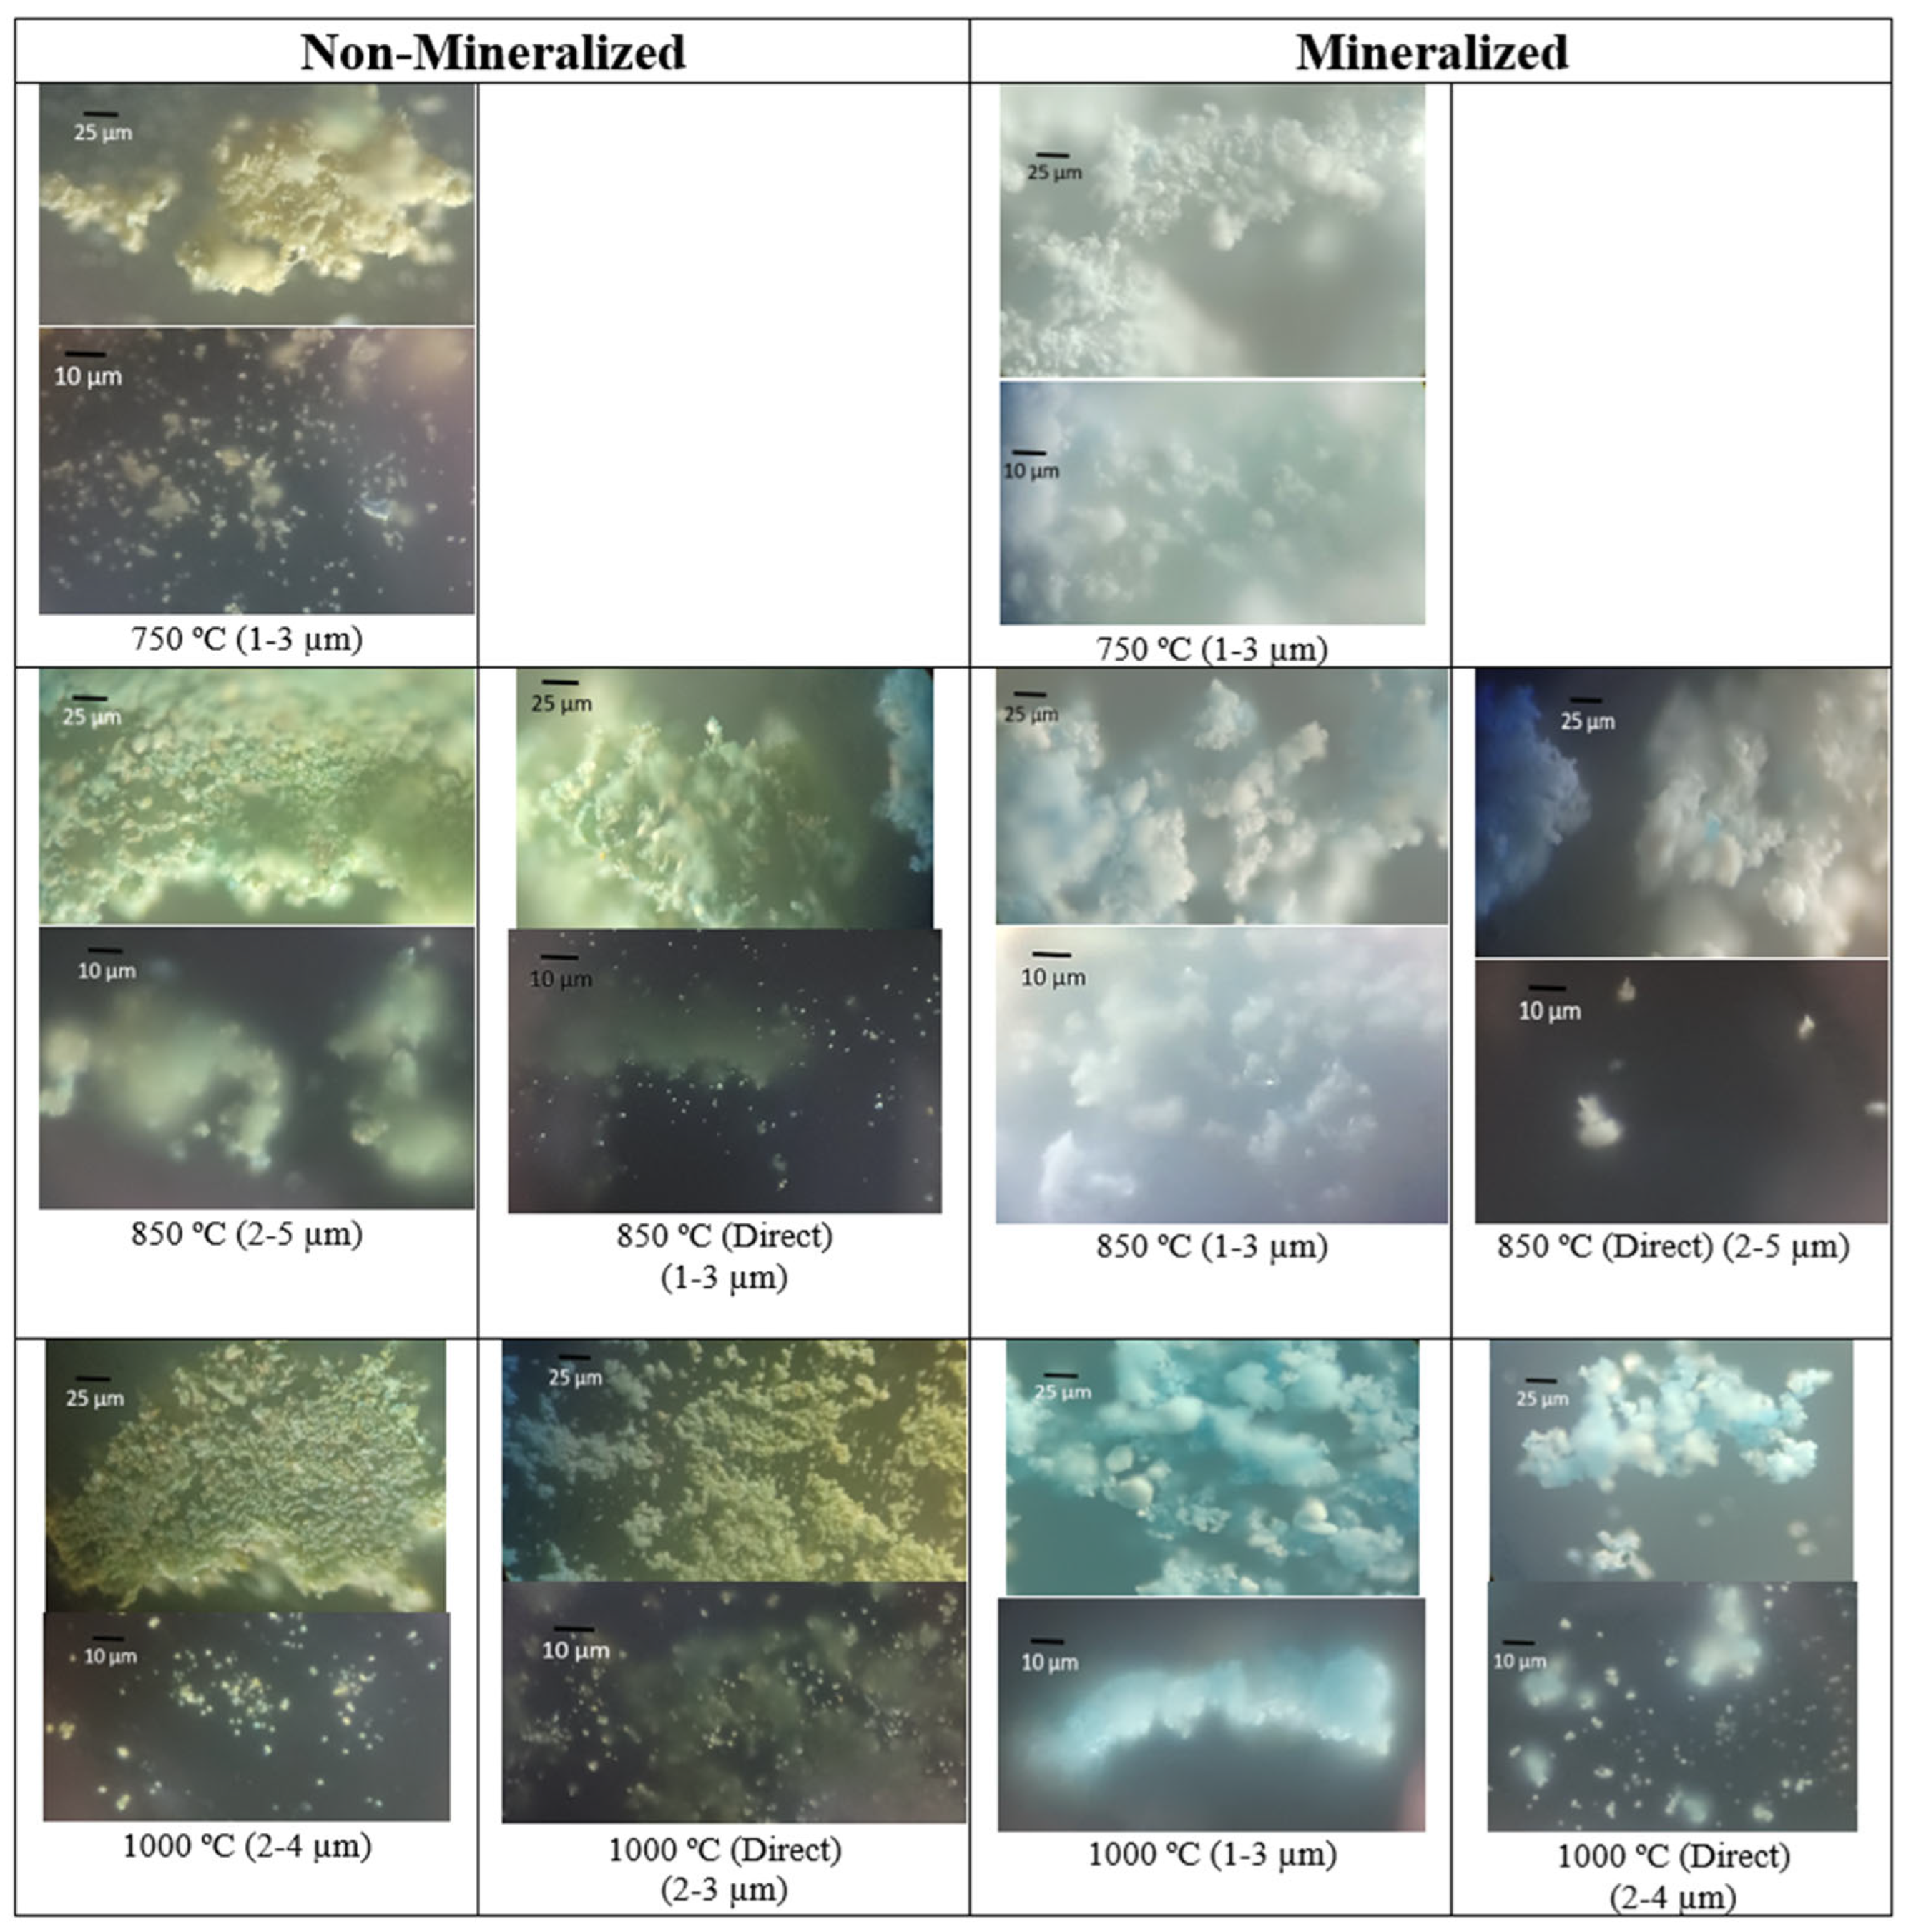
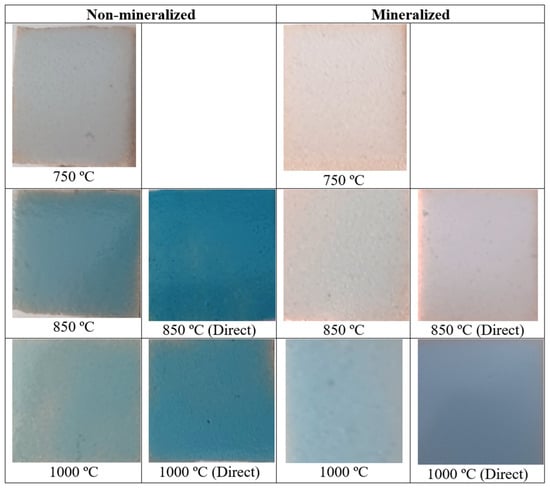
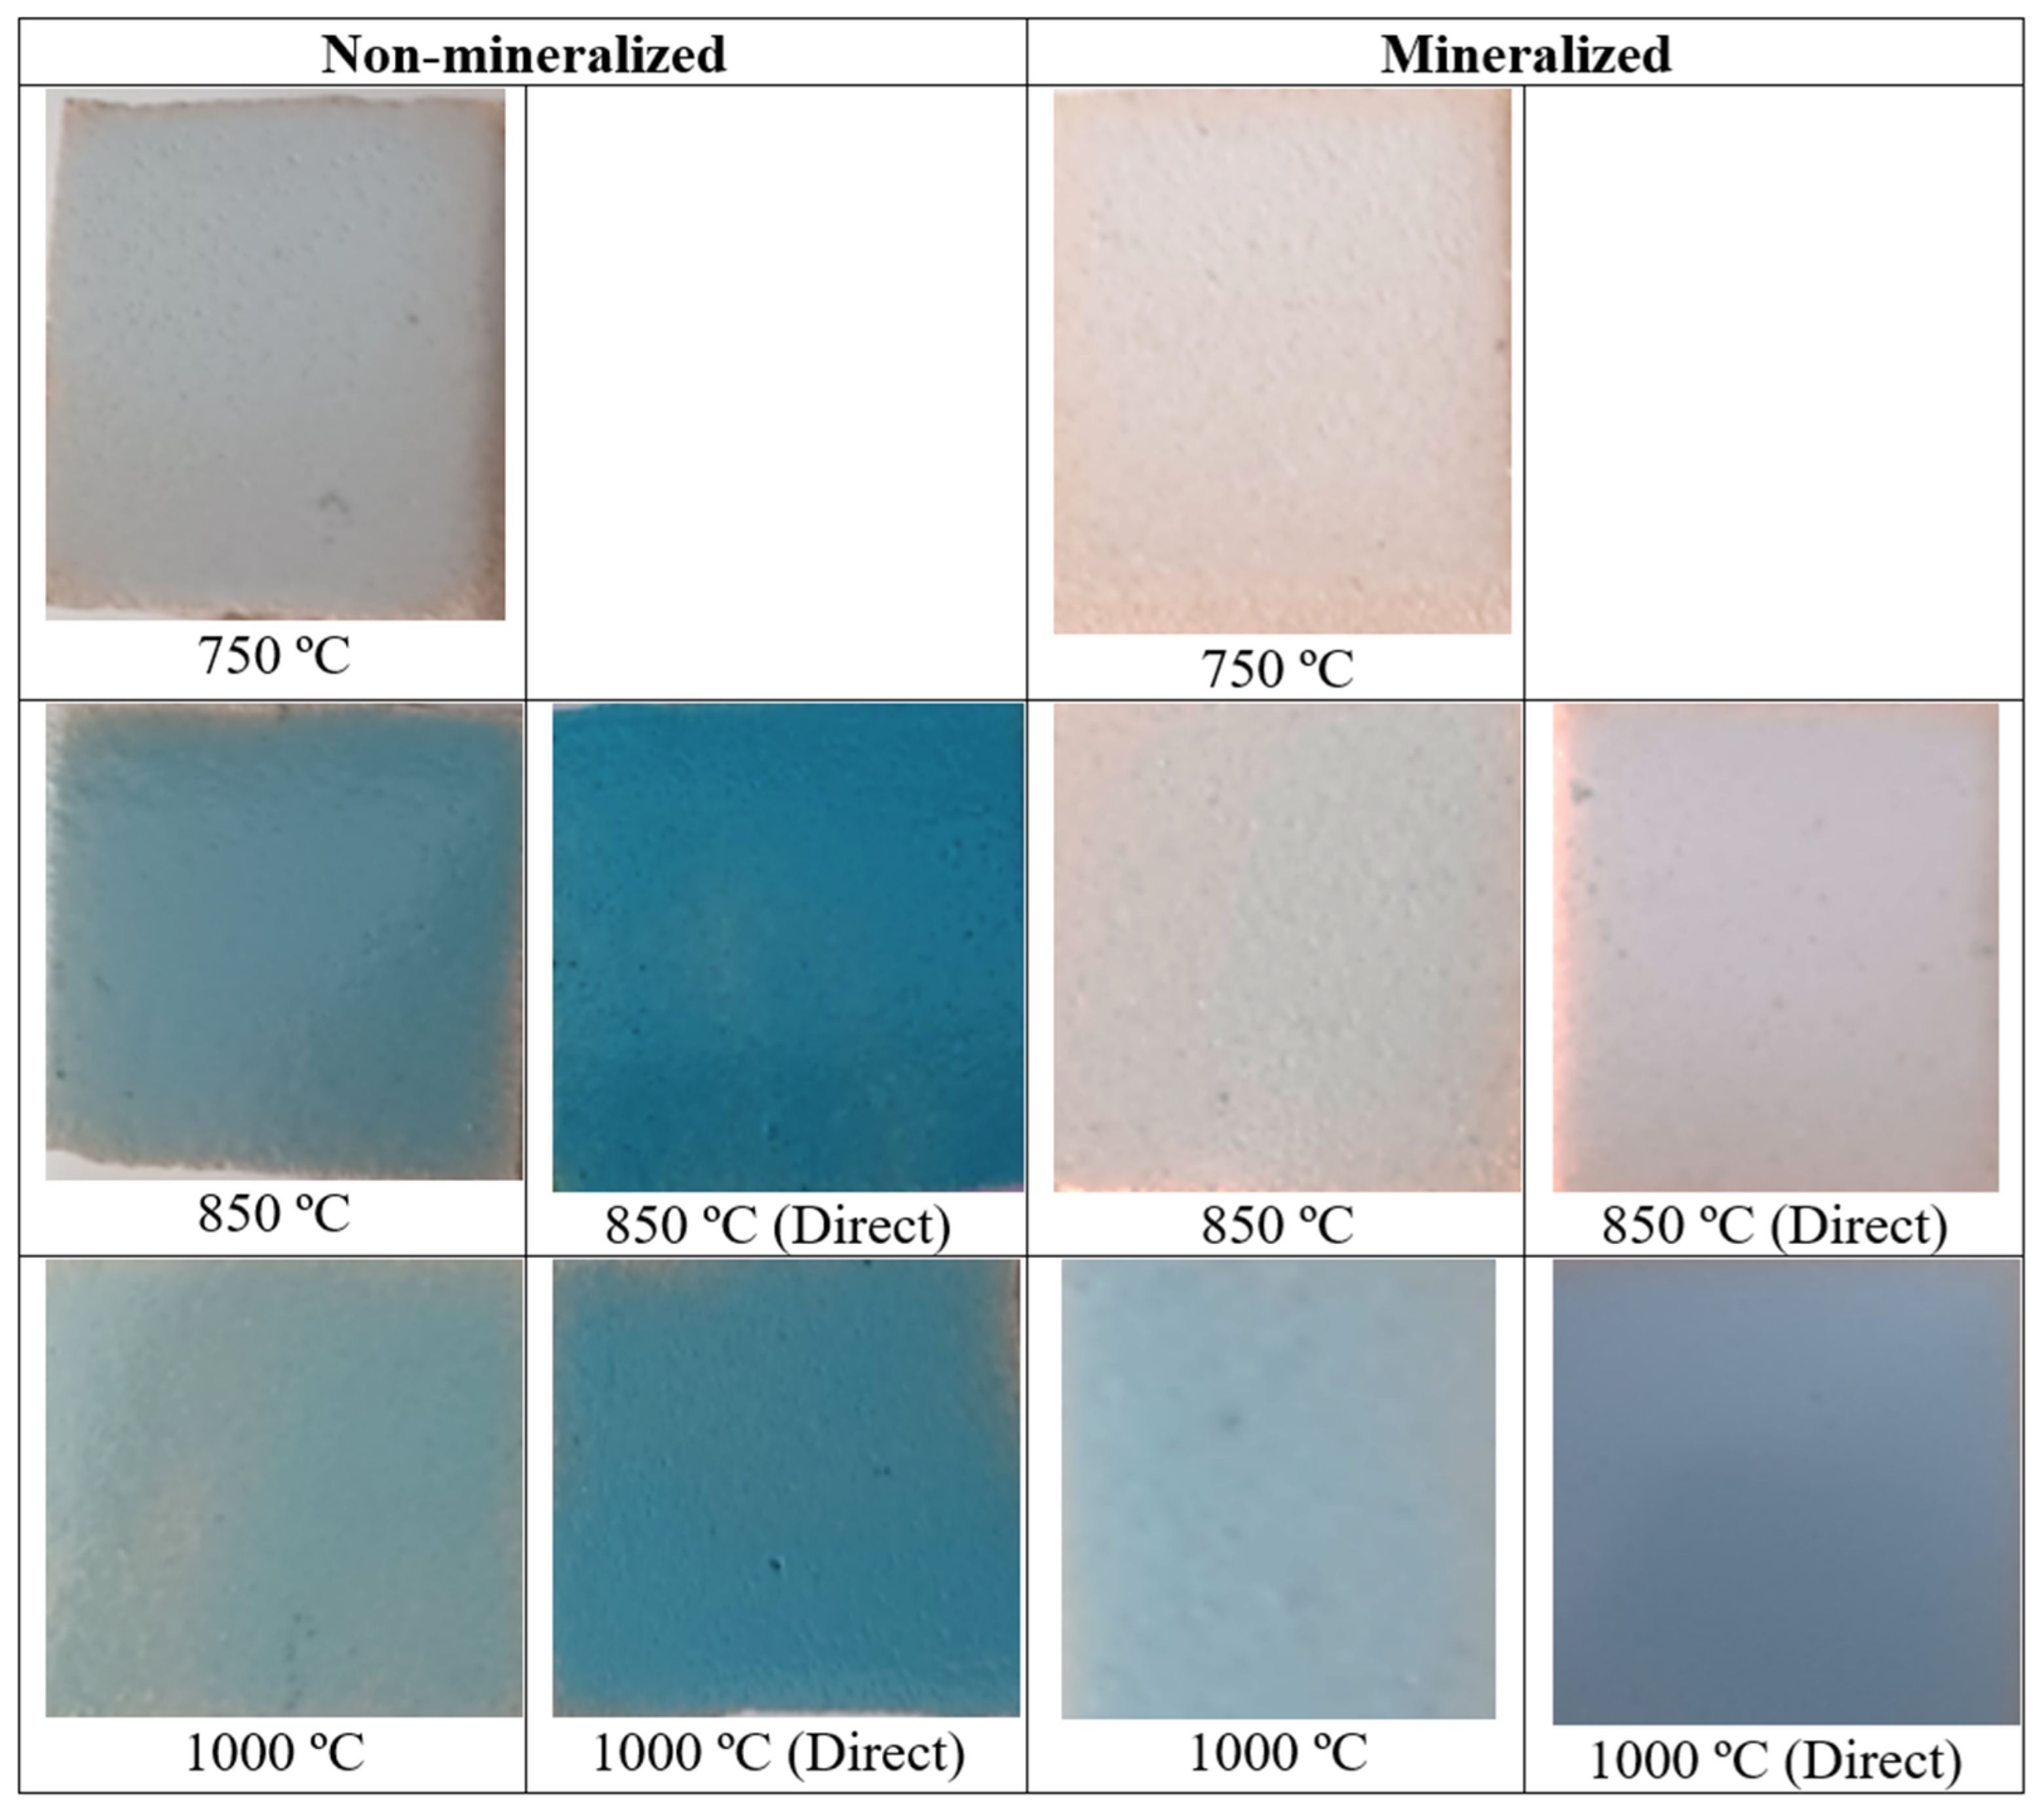
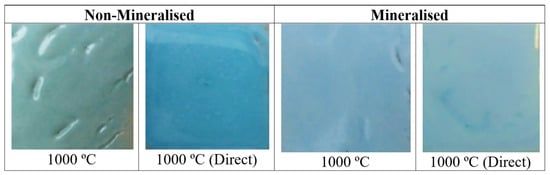
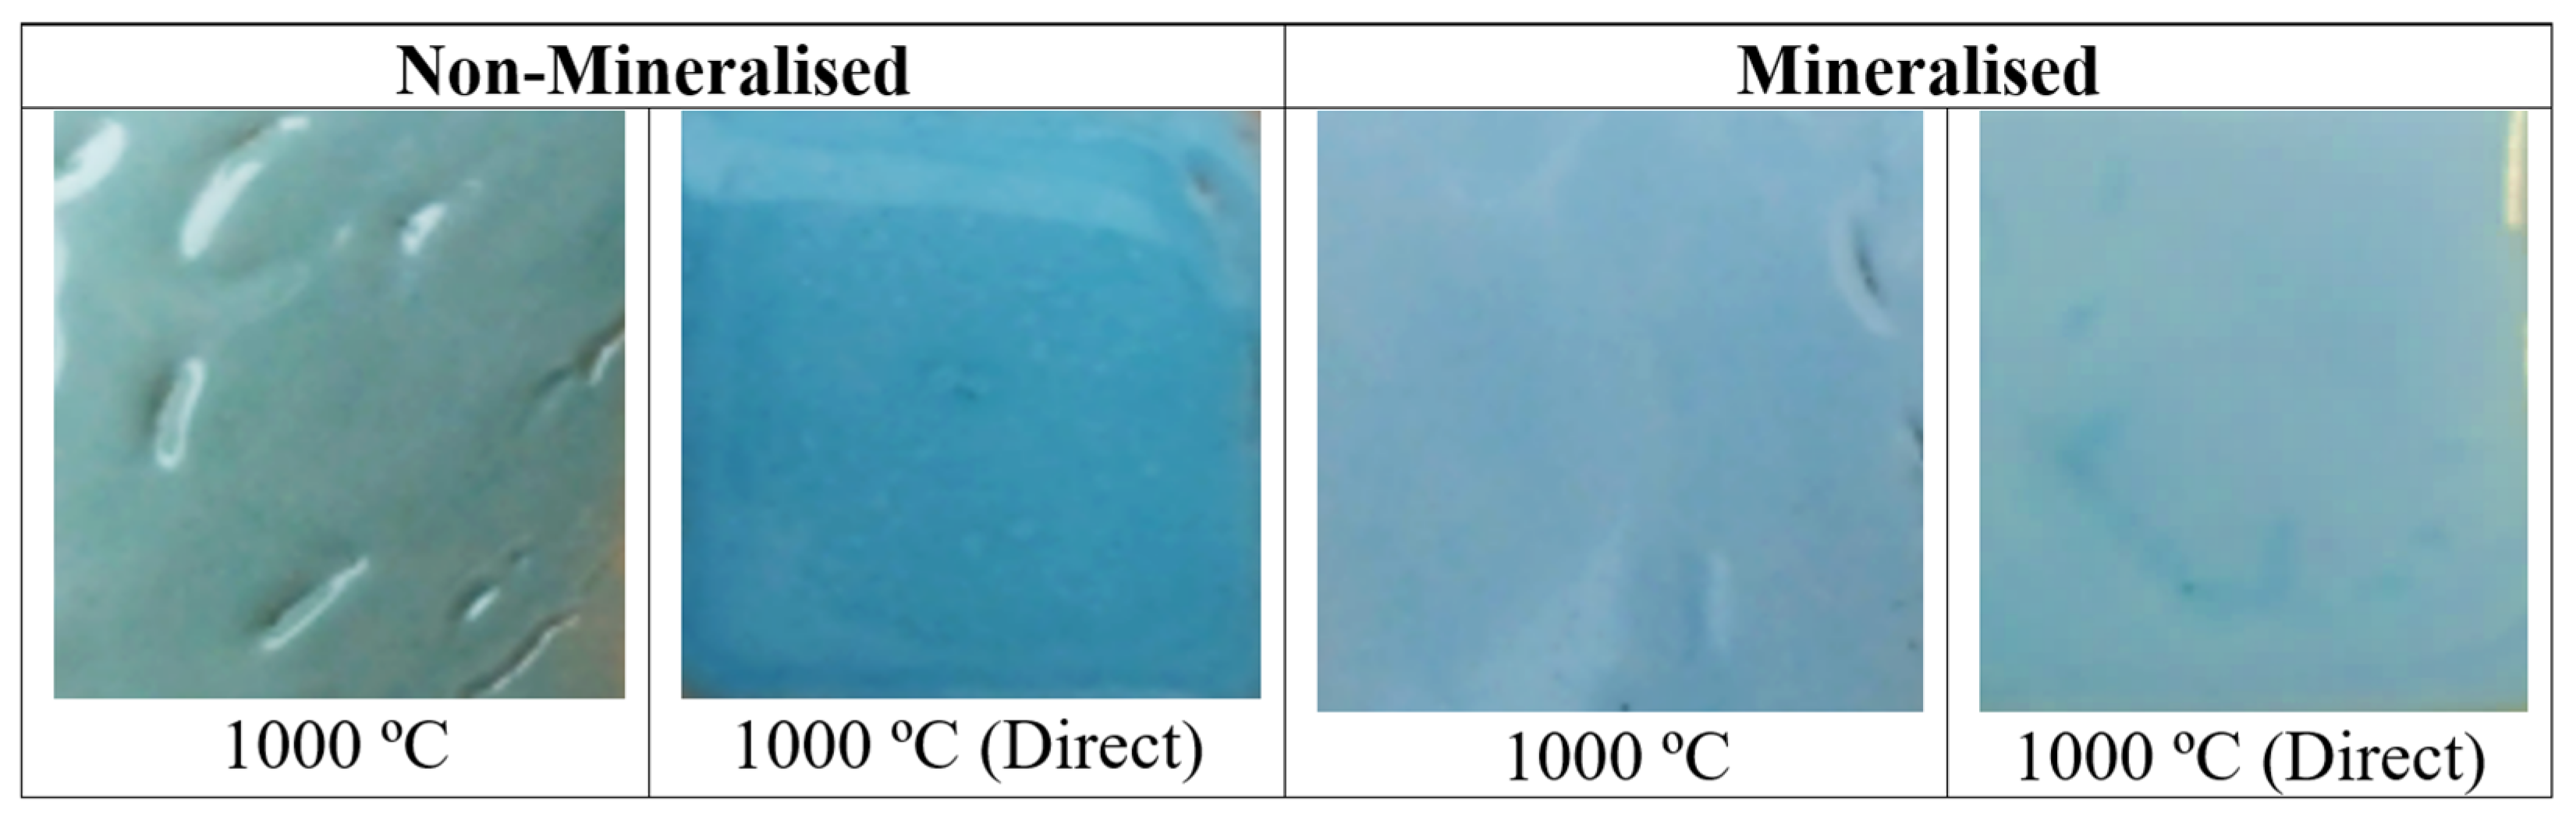
Figure 1 and Figure 2 show the direct and optical microscopy images of the non-mineralised and mineralised powders successively fired at 750, 850, and 1000 °C for 3 h. The particle sizes estimated from the images and the L*, a*, and b* colour parameters are reported in Table 1.
Figure 1.
Image of powders.
Figure 2.
Optical images of powders.
Table 1.
Non-mineralised samples.
The halide-free powder exhibits a yellow colour at 750 °C (L*a*b* = 66.67/1.83/23.90 in Table 2) that becomes greener with successive firing at 850 °C and 1000 °C (L*a*b* = 49.24/−5.93/12.78 and 47.03/−4.00/13.98, respectively). However, blue particles can also be observed in the powders fired at 850 and 1000 °C. This observation is consistent with the formation of a pale-blue material reported by Monrós et al. [17] using highly homogeneous synthesis routes such as the sol–gel method, a low vanadium concentration, and a relatively high firing temperature (sample Ib: V0.02Zr0.96SiO4, 1200 °C/12 h in [17]).
Table 2.
Mineralised samples.
A mixture of yellow particles with a small proportion of blue particles is observed. This may indicate that the blue particles correspond to regions with a higher concentration of V4+, whereas the remaining vanadium-rich material may form the yellow phase. The particle size estimated from the optical microscopy images (Table 1) increases slightly with increasing firing temperature.
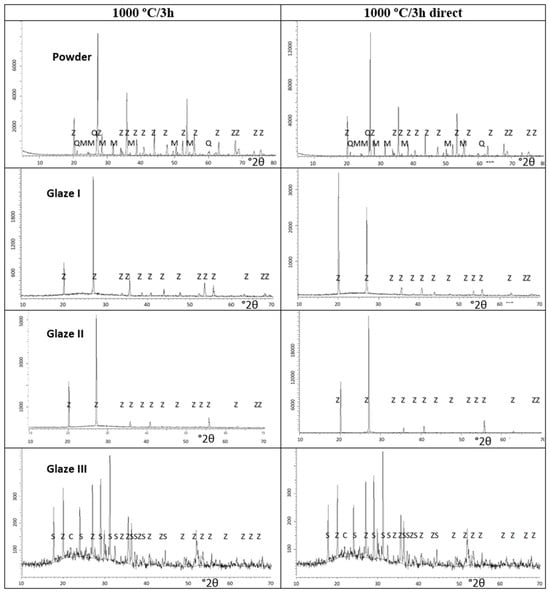
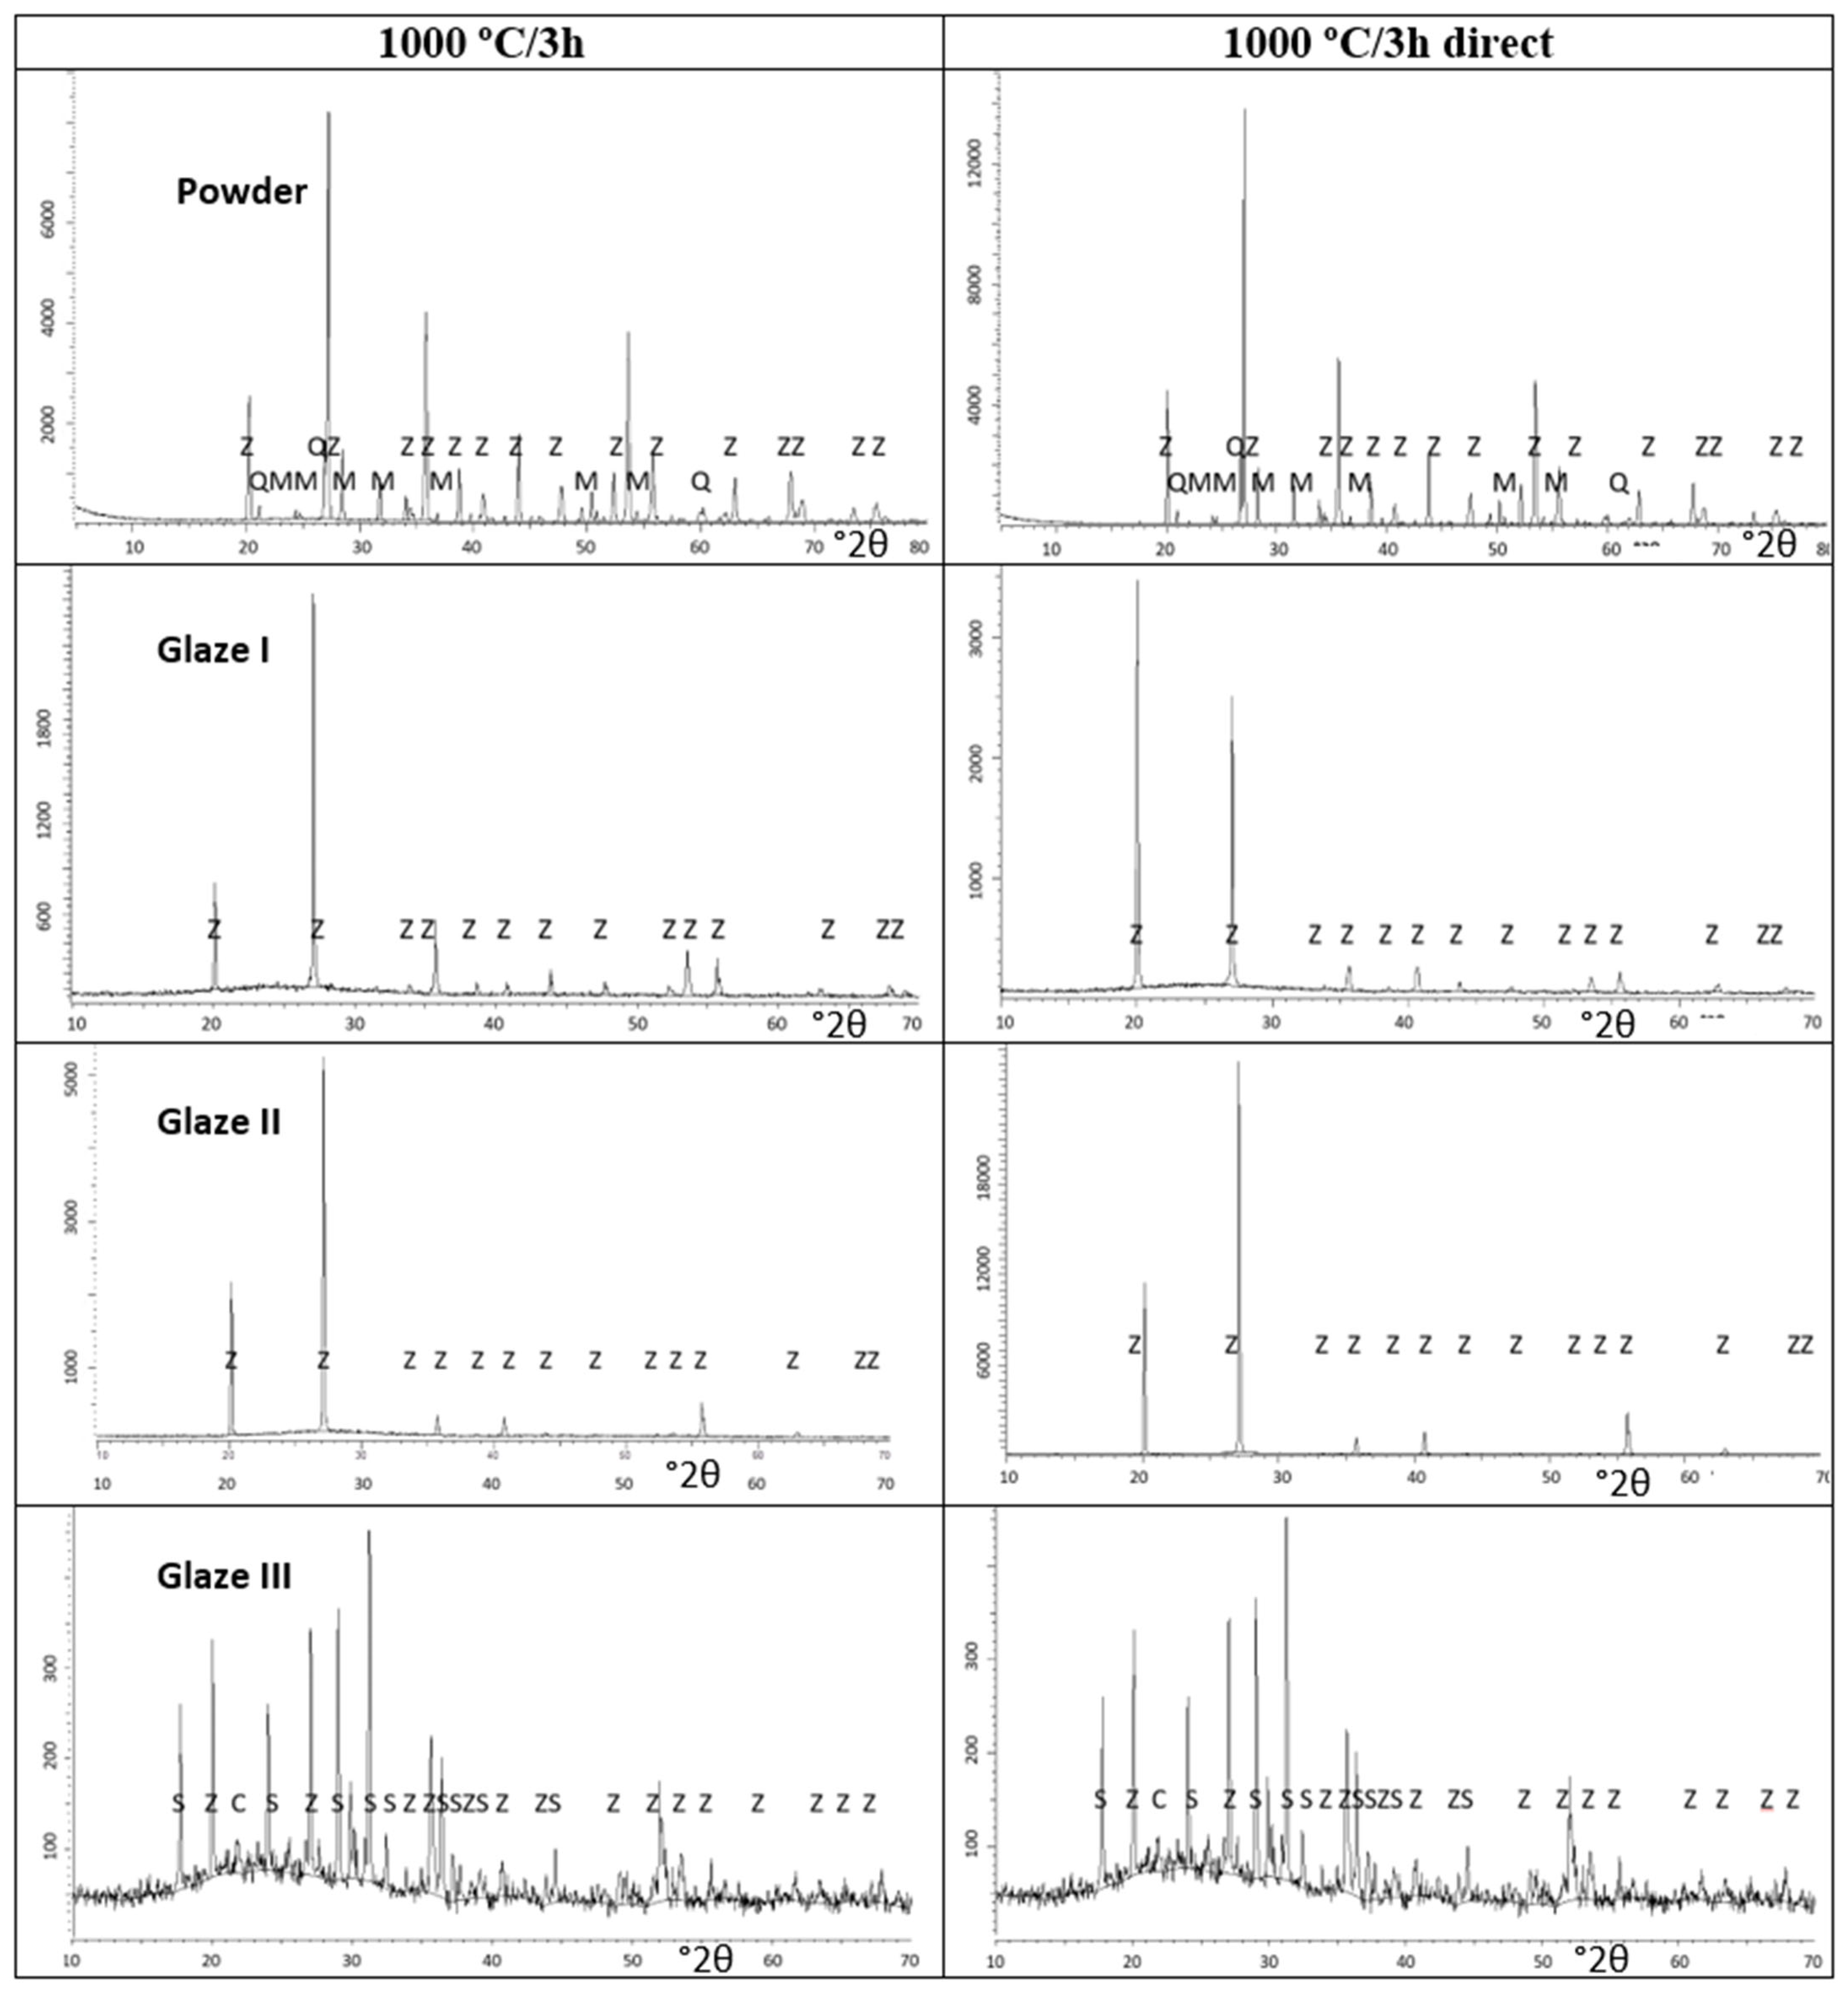
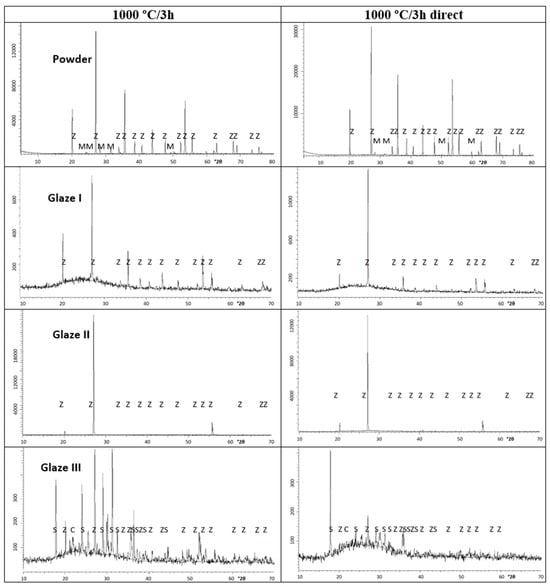
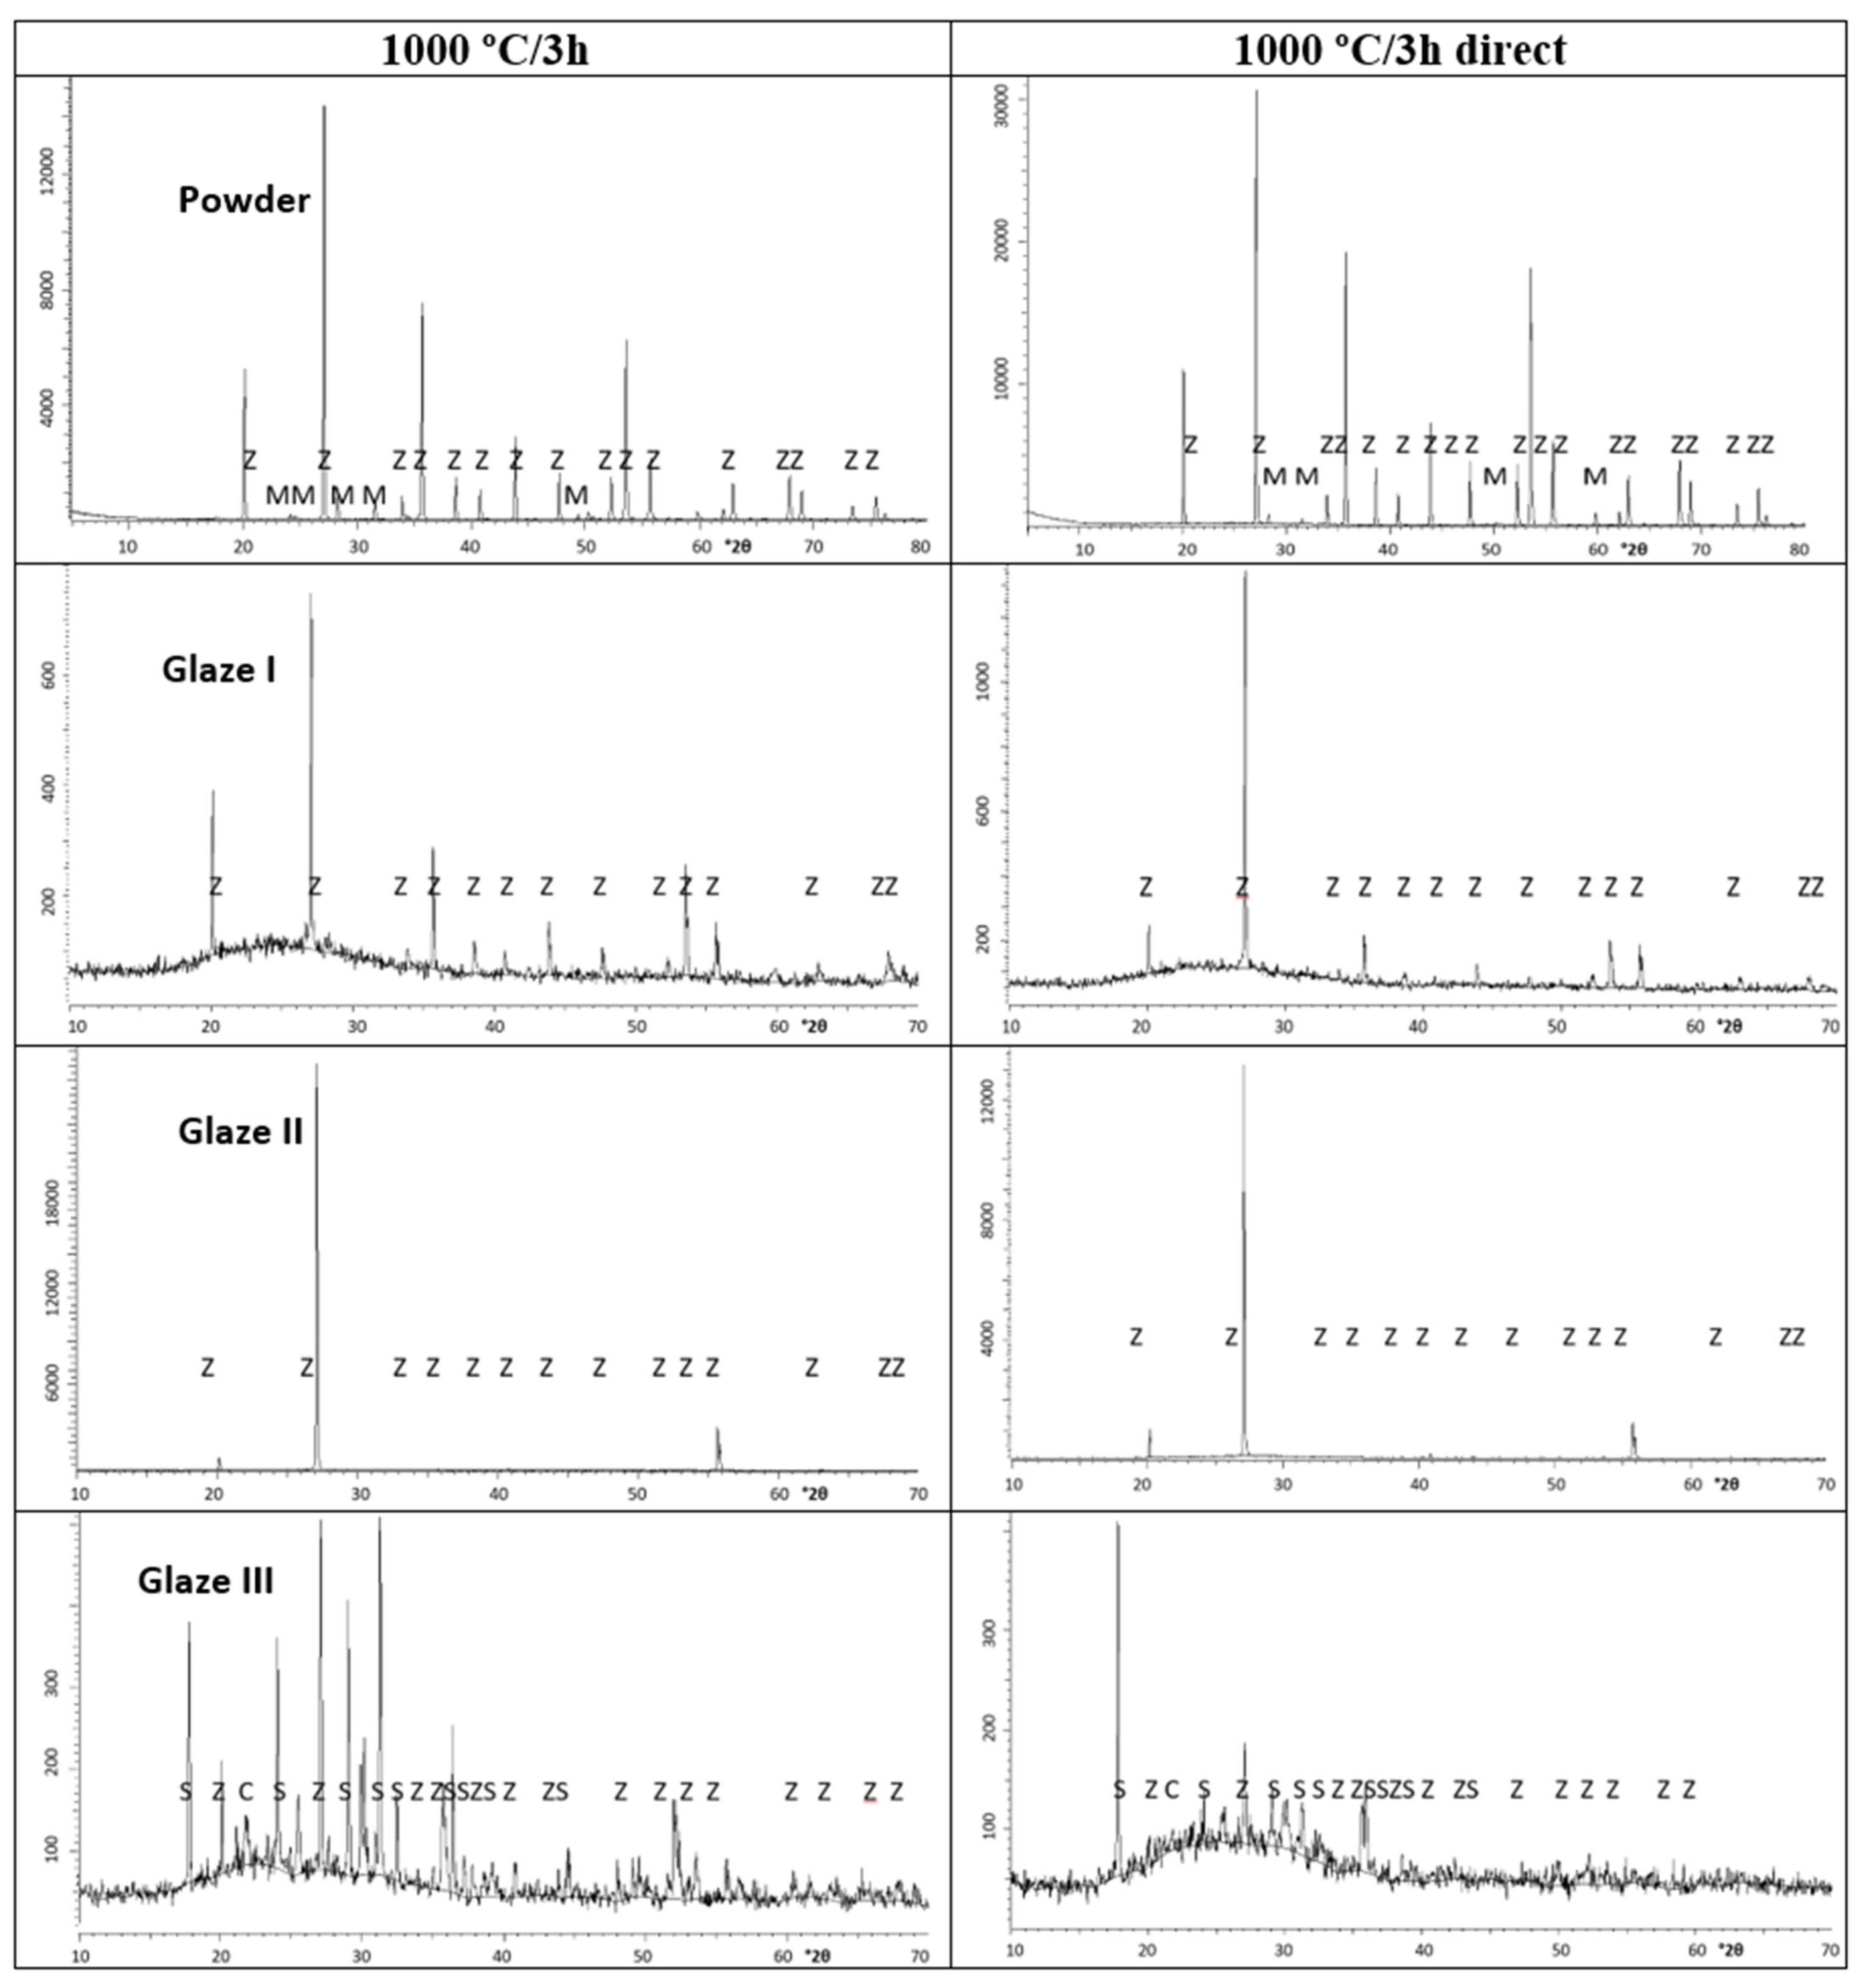
Figure 3 and Figure 4 presents the XRD patterns of the powders fired at 1000 °C for non-mineralised and mineraslised samples, respectively, while Table 3 reports the semiquantitative estimation of the mineralogical composition of the samples obtained using the matrix-flushing method for quantitative multicomponent analysis of X-ray diffraction patterns of mixtures [24].
Figure 3.
XRD of Non-mineralised samples. CRYSTALLINE PHASES: Z (Zircon ZrSiO4), M (m-ZrO2), Q (Quartz SiO2), C (Cristobalite), S (Zn-doped anorthite Ca2Al(SiAl)O7 ICDD 77-114).
Figure 4.
XRD of Mineralised samples. CRYSTALLINE PHASES: Z (Zircon ZrSiO4), M (m-ZrO2), Q (Quartz SiO2), C (Cristobalite), S (Zn-doped anorthite Ca2Al(SiAl)O7 ICDD 77-114).
Table 3.
Mineralogical composition of powders and crystallite size using hkl = [332].
At 750 °C, only a small amount of zircon (7%) is estimated to be present in the powder. This proportion increases to 55.2% at 850 °C and to 73.4% at 1000 °C. These results are consistent with the “self-mineralisation” of vanadium oxides formed in situ through the decomposition of NH4VO3 into NH3, NOx, and vanadium oxides such as V2O5, which melts at 690 °C. In the absence of these mineralising effects, the direct reaction between ZrO2 and SiO2 to form zircon requires temperatures above 1400 °C. The mineralising action lowers this temperature, allowing the reaction to begin with the formation of liquid phases resulting from the melting of the mineralising agents. These results are also consistent with the patent reported by Seabright [1], which indicates that, in the absence of a mineraliser, monoclinic zirconia and quartz are consistently detected in green samples. The lattice parameters of the powders (a = b and c, in Å) and the corresponding volume of the unit cell (V = a b c, in Å3) (Table 4) indicate an expanded unit cell, with an increase of approximately 6 Å3 relative to the ICDD reference data for undoped zircon (PDF 83-1374) at 750 °C. This expansion decreases with increasing temperature, reaching approximately 1.6 Å3 at 1000 °C.
Table 4.
Lattice parameters (a = b and c) and volume V of samples.
To explain this unit-cell expansion, only the simple incorporation of V4+ at the Zr site can be ruled out, considering that the ionic radii of Zr4+ and V4+ in eightfold coordination are 0.98 and 0.86 Å, respectively [25]. Two alternative possibilities may therefore be considered: (i) the simultaneous incorporation of V5+ at the Zr dodecahedral site, a possibility rarely reported in the literature but consistent with an extrapolation of the trends in Shannon’s ionic radii, which gives an estimated value of approximately 0.66 Å for V5+ in this coordination environment; or (ii) the substitution of Si4+ (0.40 Å in tetrahedral coordination) by V4+ (0.56 Å in tetrahedral coordination). In the first case, Zr vacancies would be expected to maintain charge balance, potentially resulting in unreacted zirconia. In the second case, the substitution would be expected to produce unreacted silica. Both possibilities remain plausible for the halide-free samples because unreacted zirconia and quartz are consistently detected. In effect, the formation of cation vacancies in a lattice generally leads to unit-cell expansion. When a cation is removed, the neighbouring anions lose part of the electrostatic attraction exerted by the missing positive charge, allowing anion–anion electrostatic repulsion to become relatively more significant and promoting their displacement away from the vacant site. In addition, the local charge imbalance modifies the electronic structure and induces relaxation of the surrounding chemical bonds, which can result in an outward relaxation of the neighbouring lattice and, consequently, an expansion of the unit cell [26].
In the case of non-mineralised powders fired directly at 850 °C and 1000 °C, the results are very similar to those obtained by accumulative firing. A mixture of yellow and scarce blue particles is observed in the optical images, with particle sizes very similar to those obtained after successive firing (Figure 1 and Figure 2; particle size and Lab* values in Table 1). Similar amounts of reacted zircon are also observed in the powders (Table 3), which also exhibit an expanded unit cell (Table 4). The thermal decomposition of ammonium metavanadate into various vanadium oxides, including vanadium pentoxide (V2O5), which melts at a relatively low temperature (681 °C), wetting the crucible walls and acting as an internal mineralizer, likely determines the reactivity and colour of the powders [27].
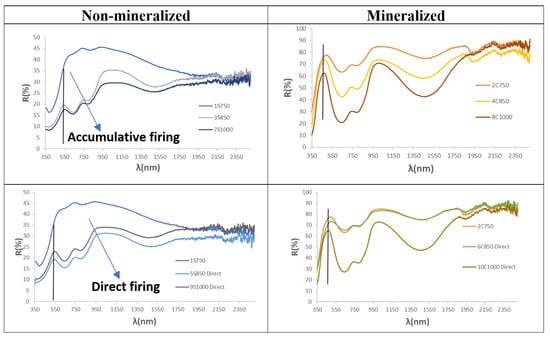
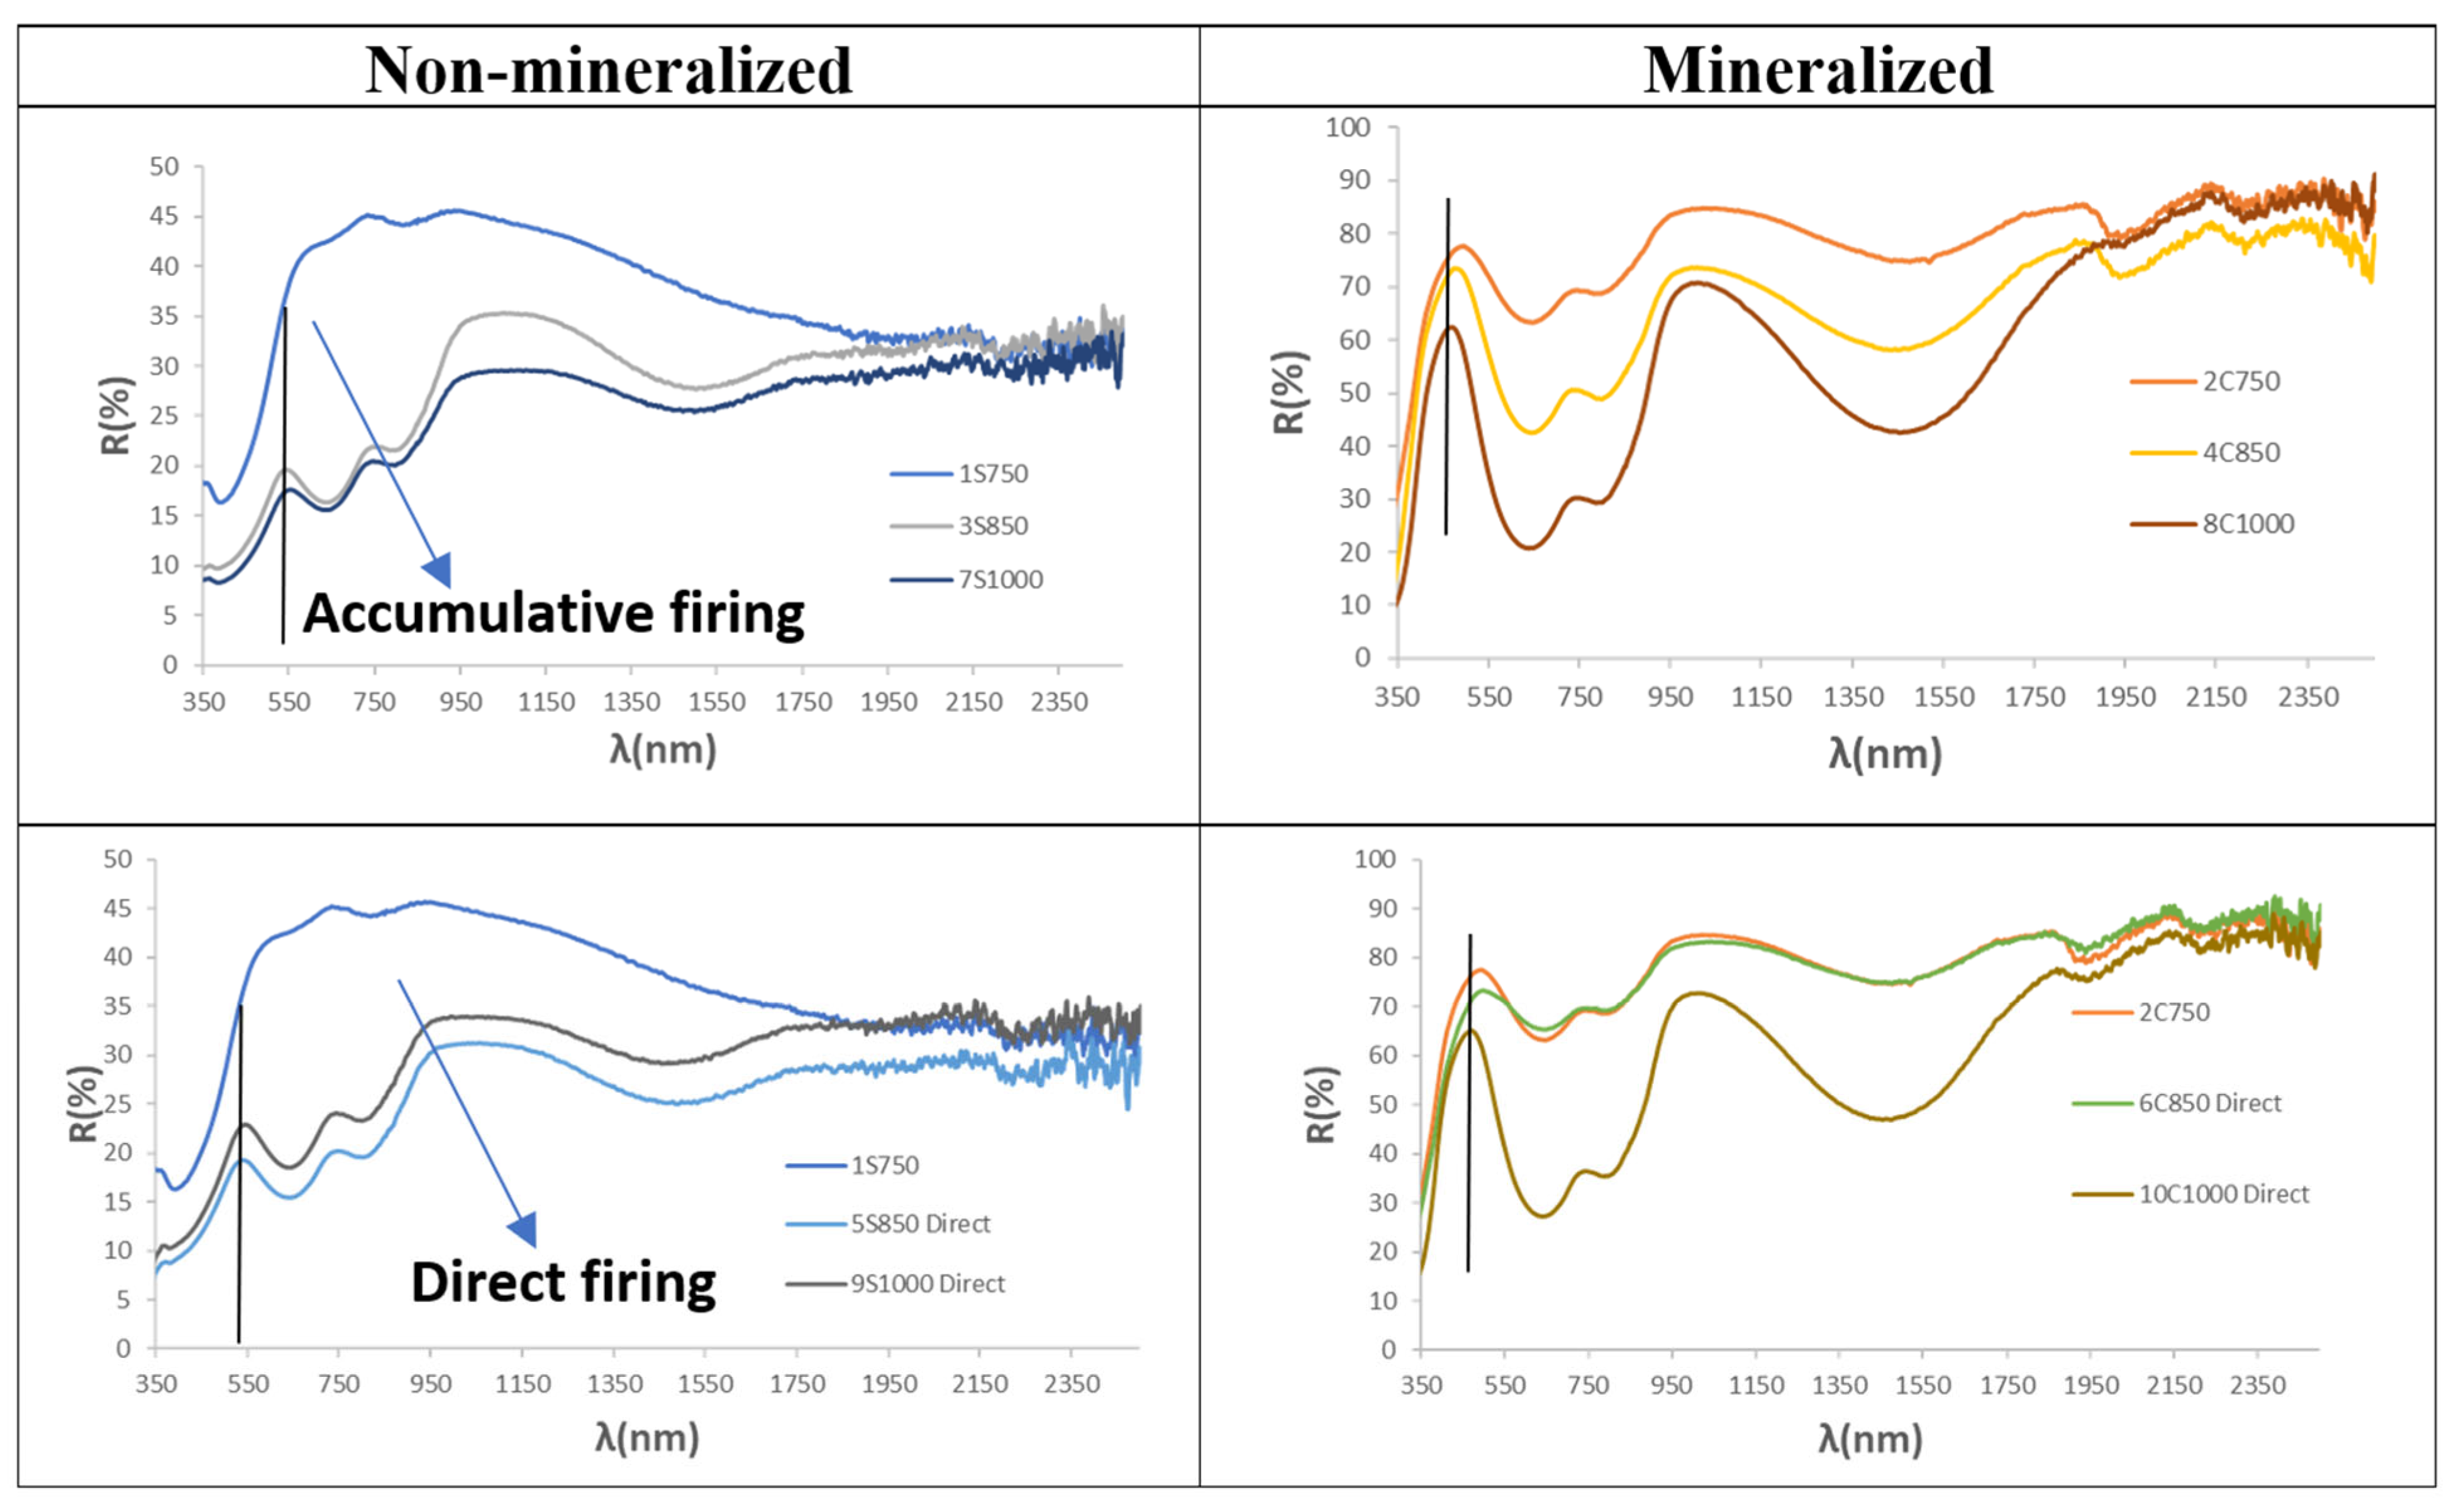
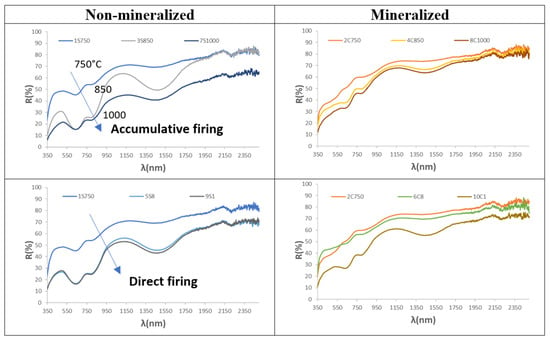
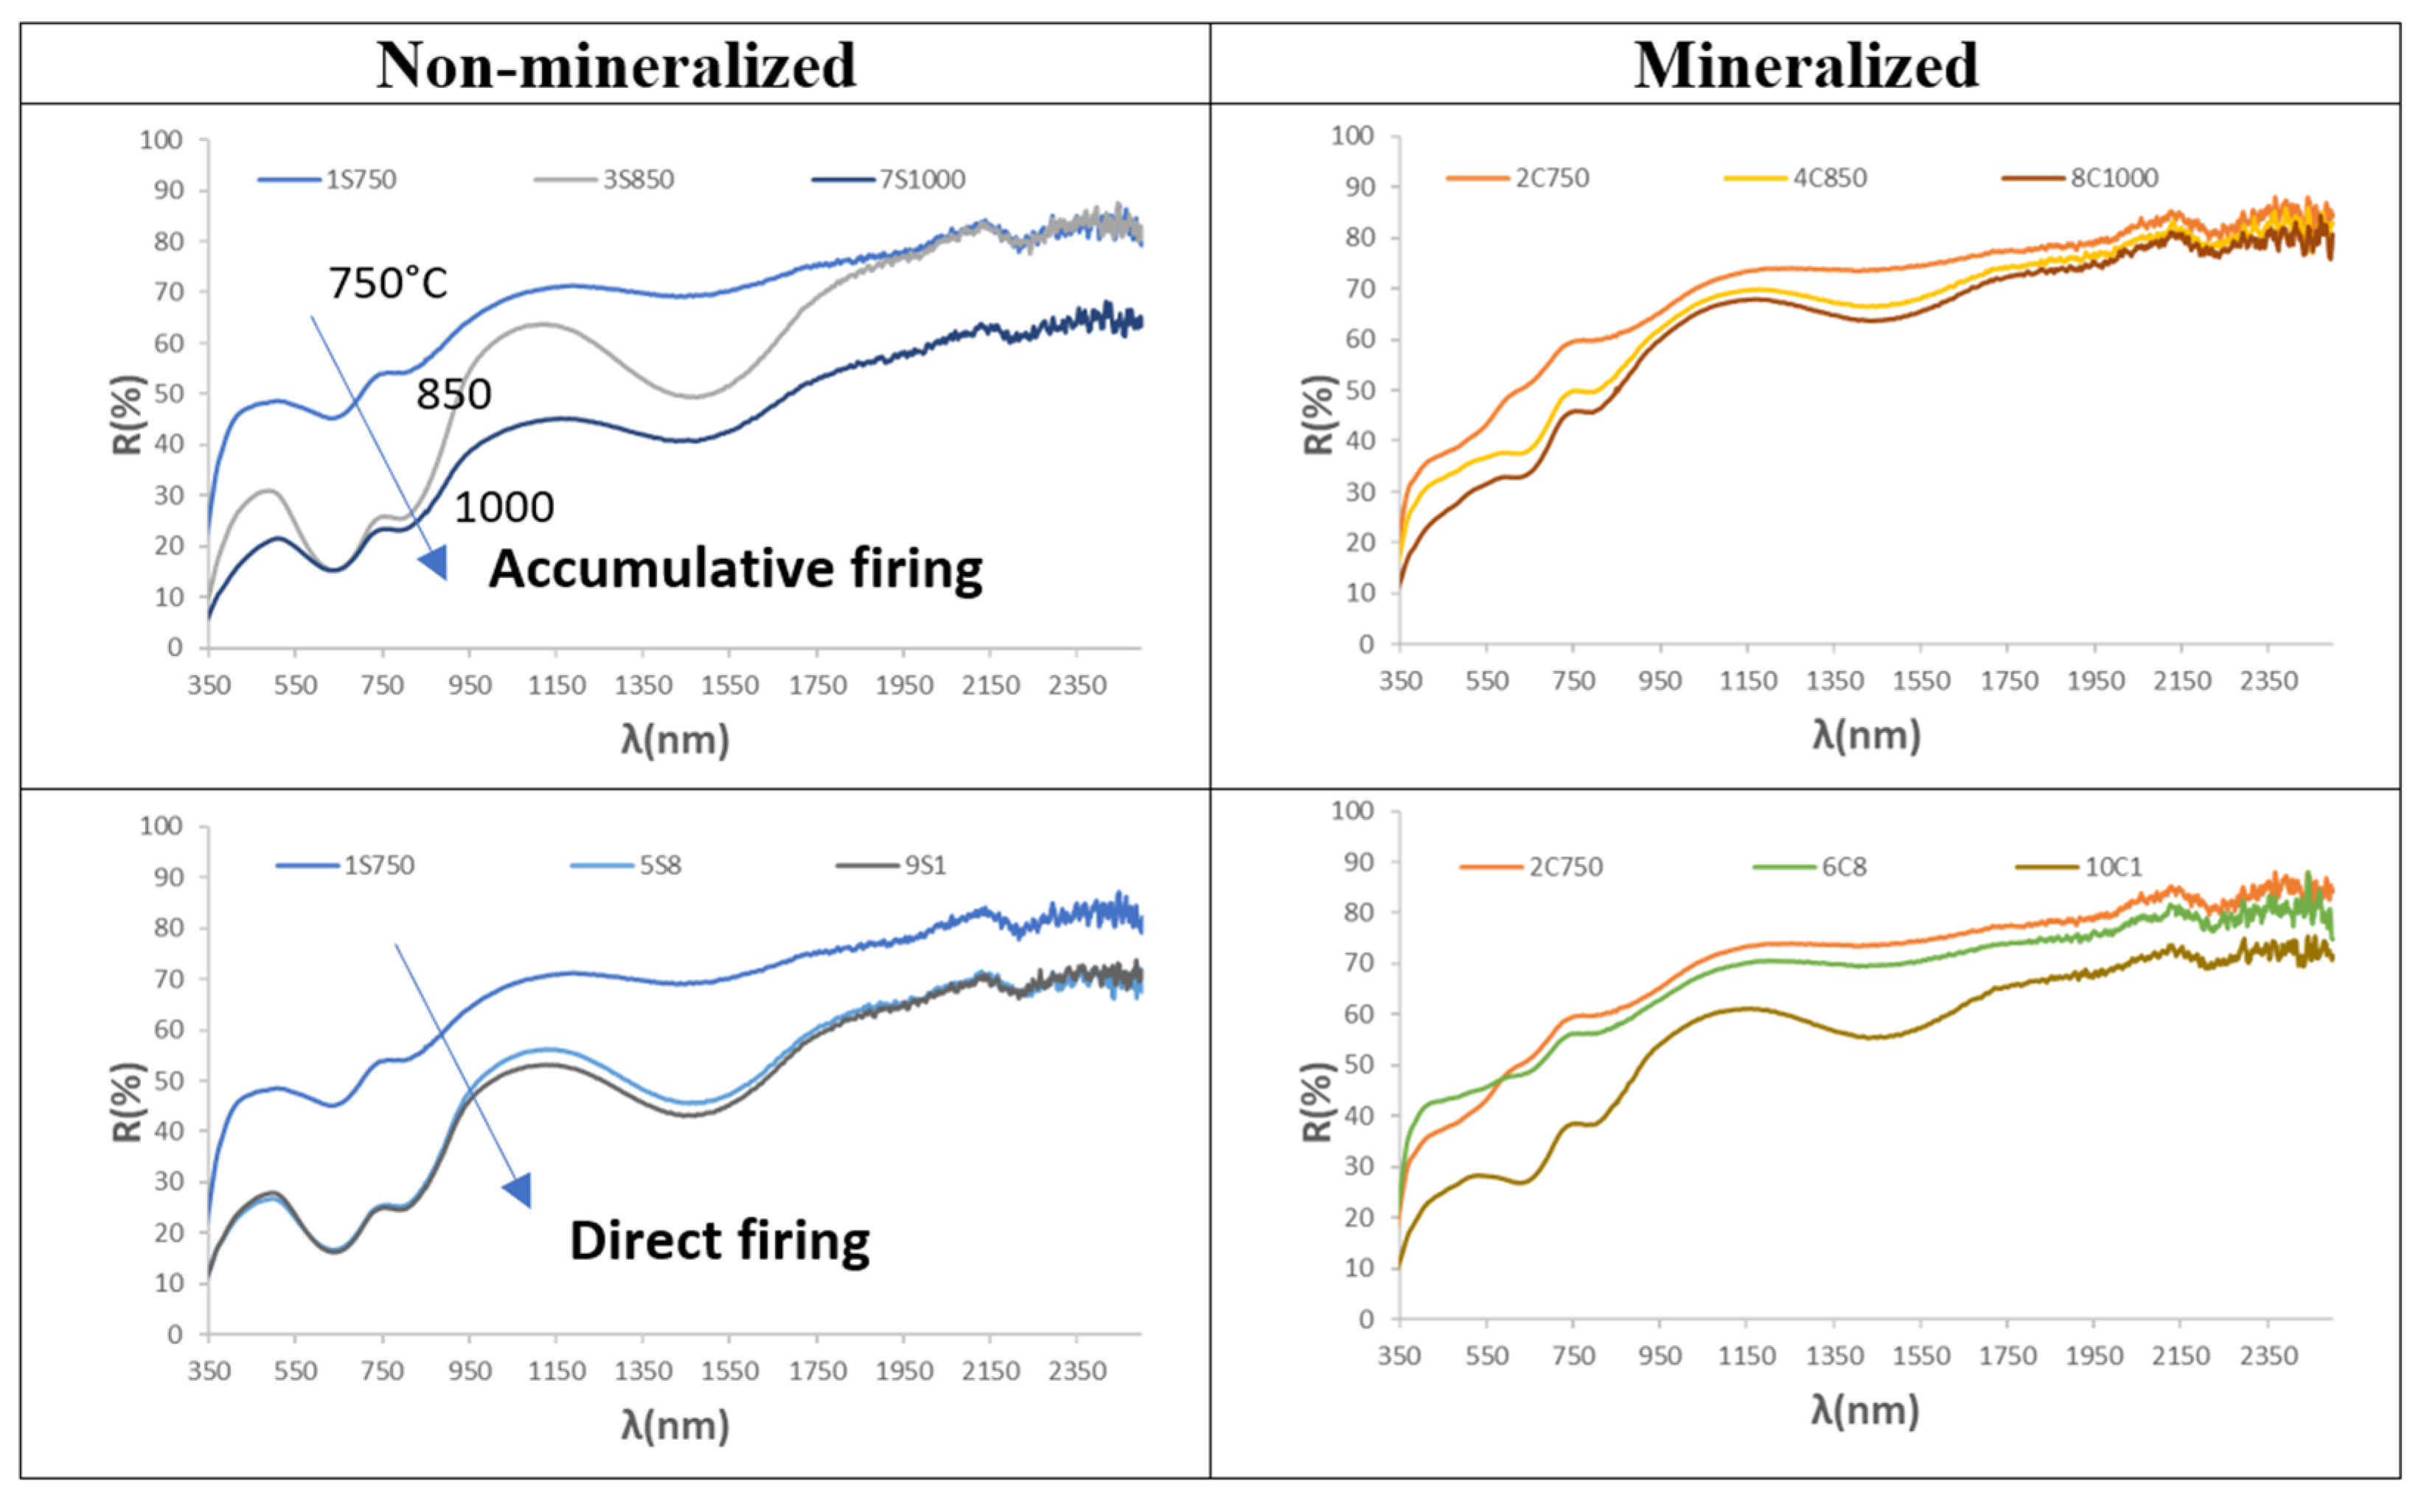
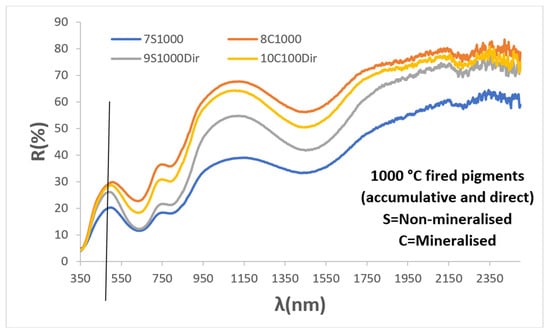
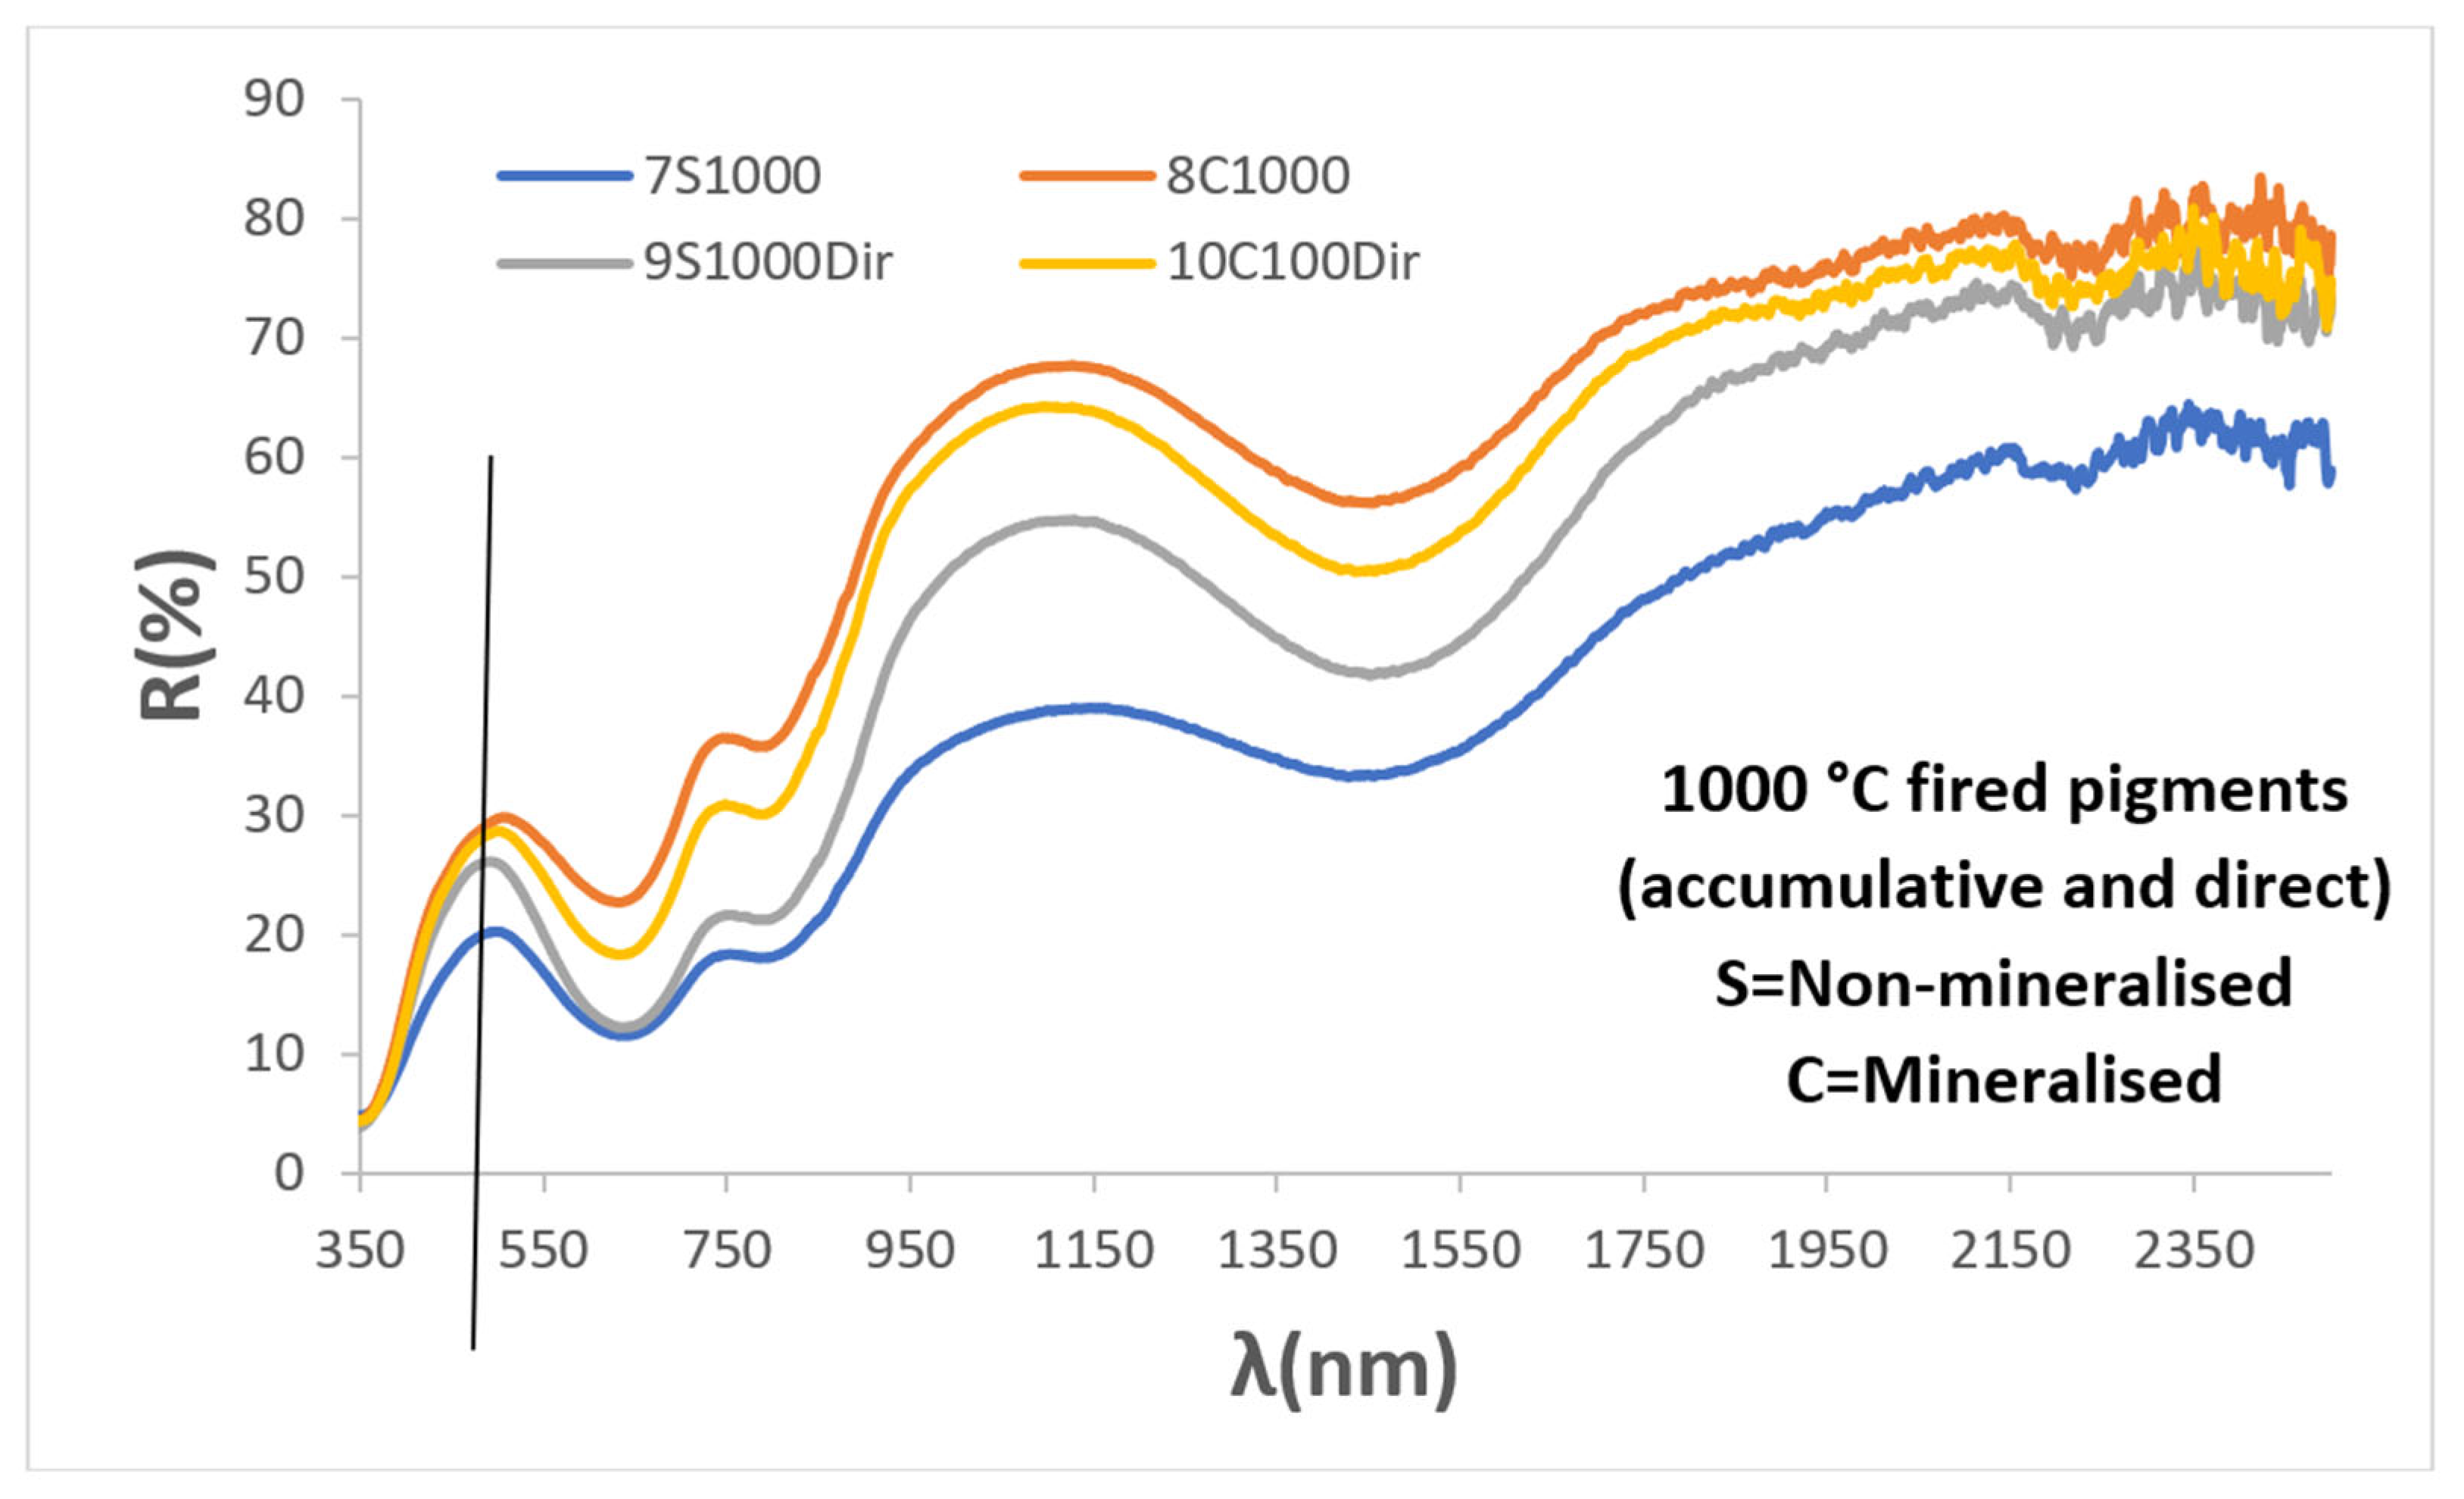
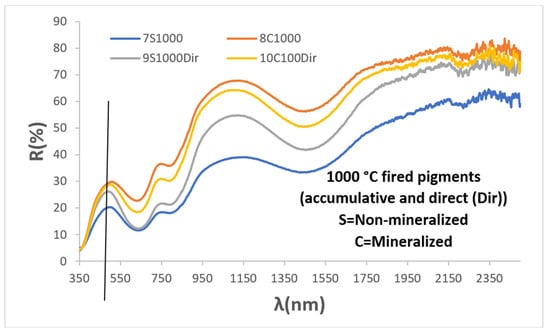
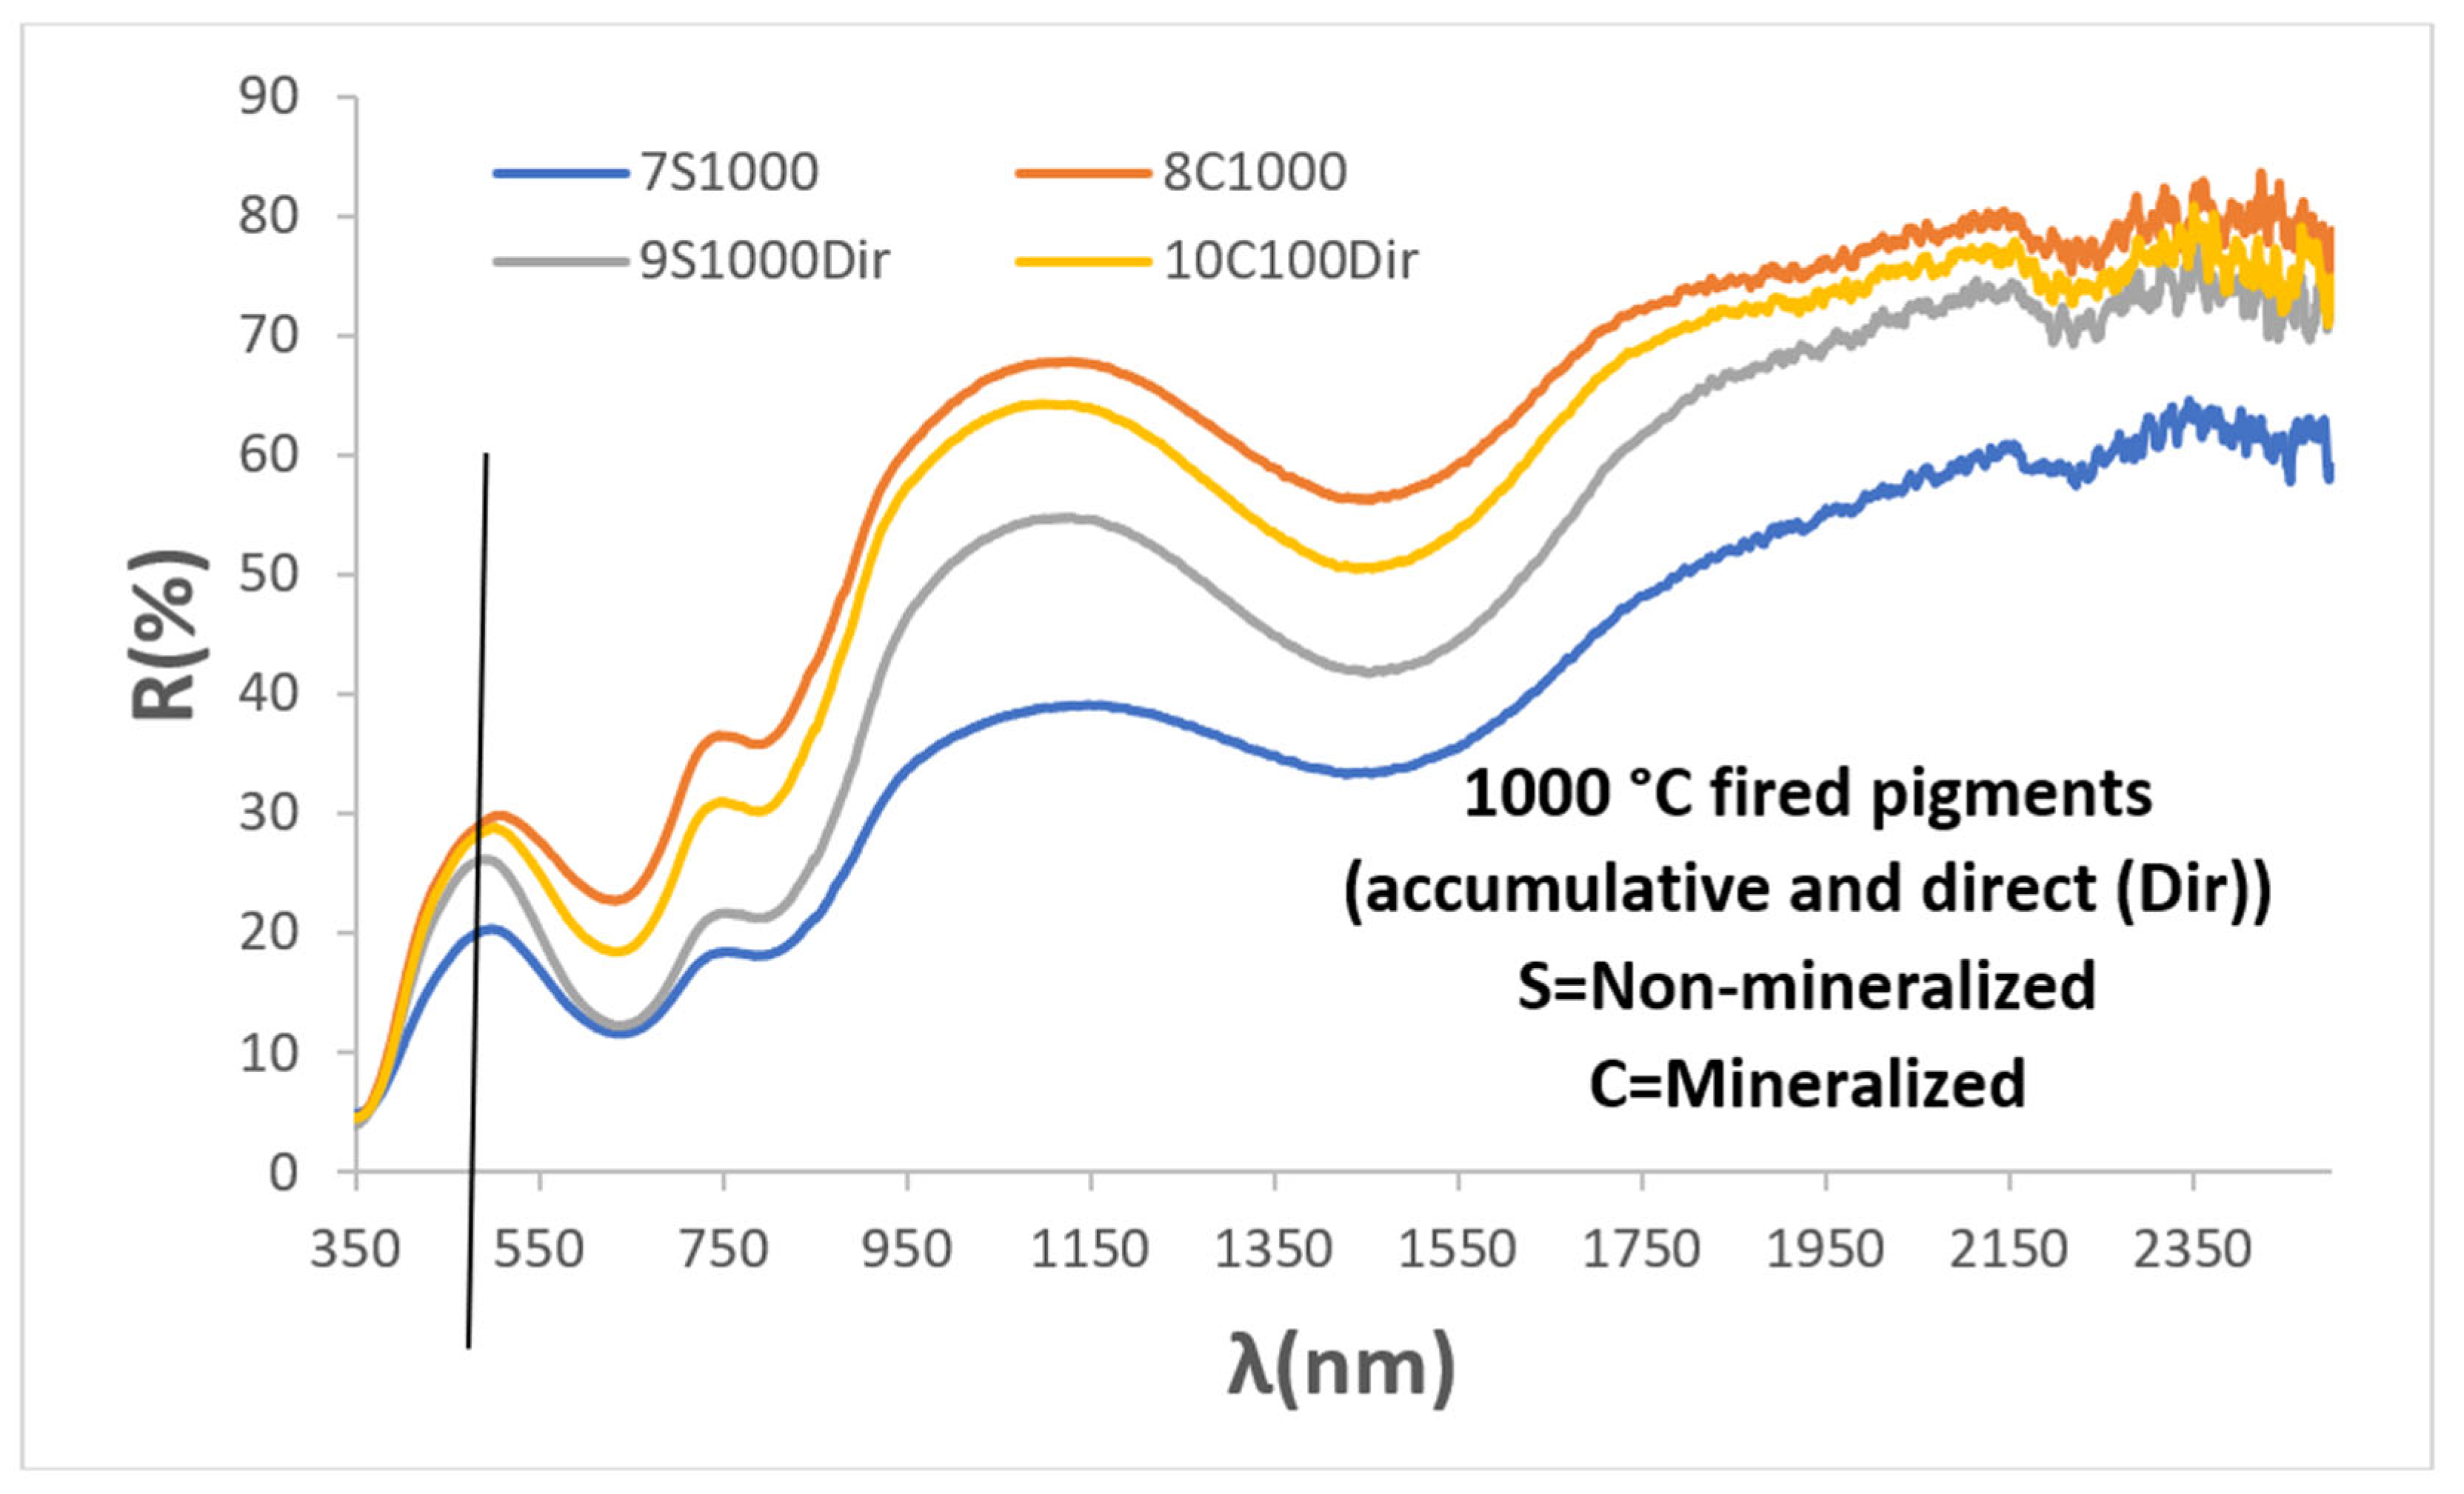
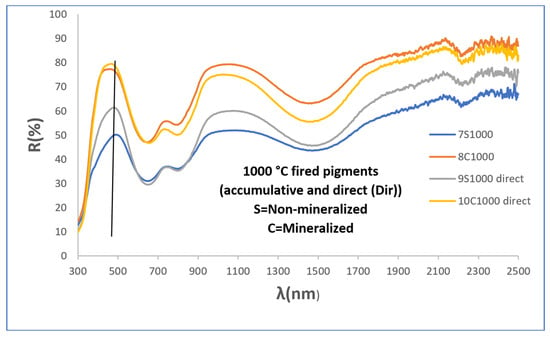
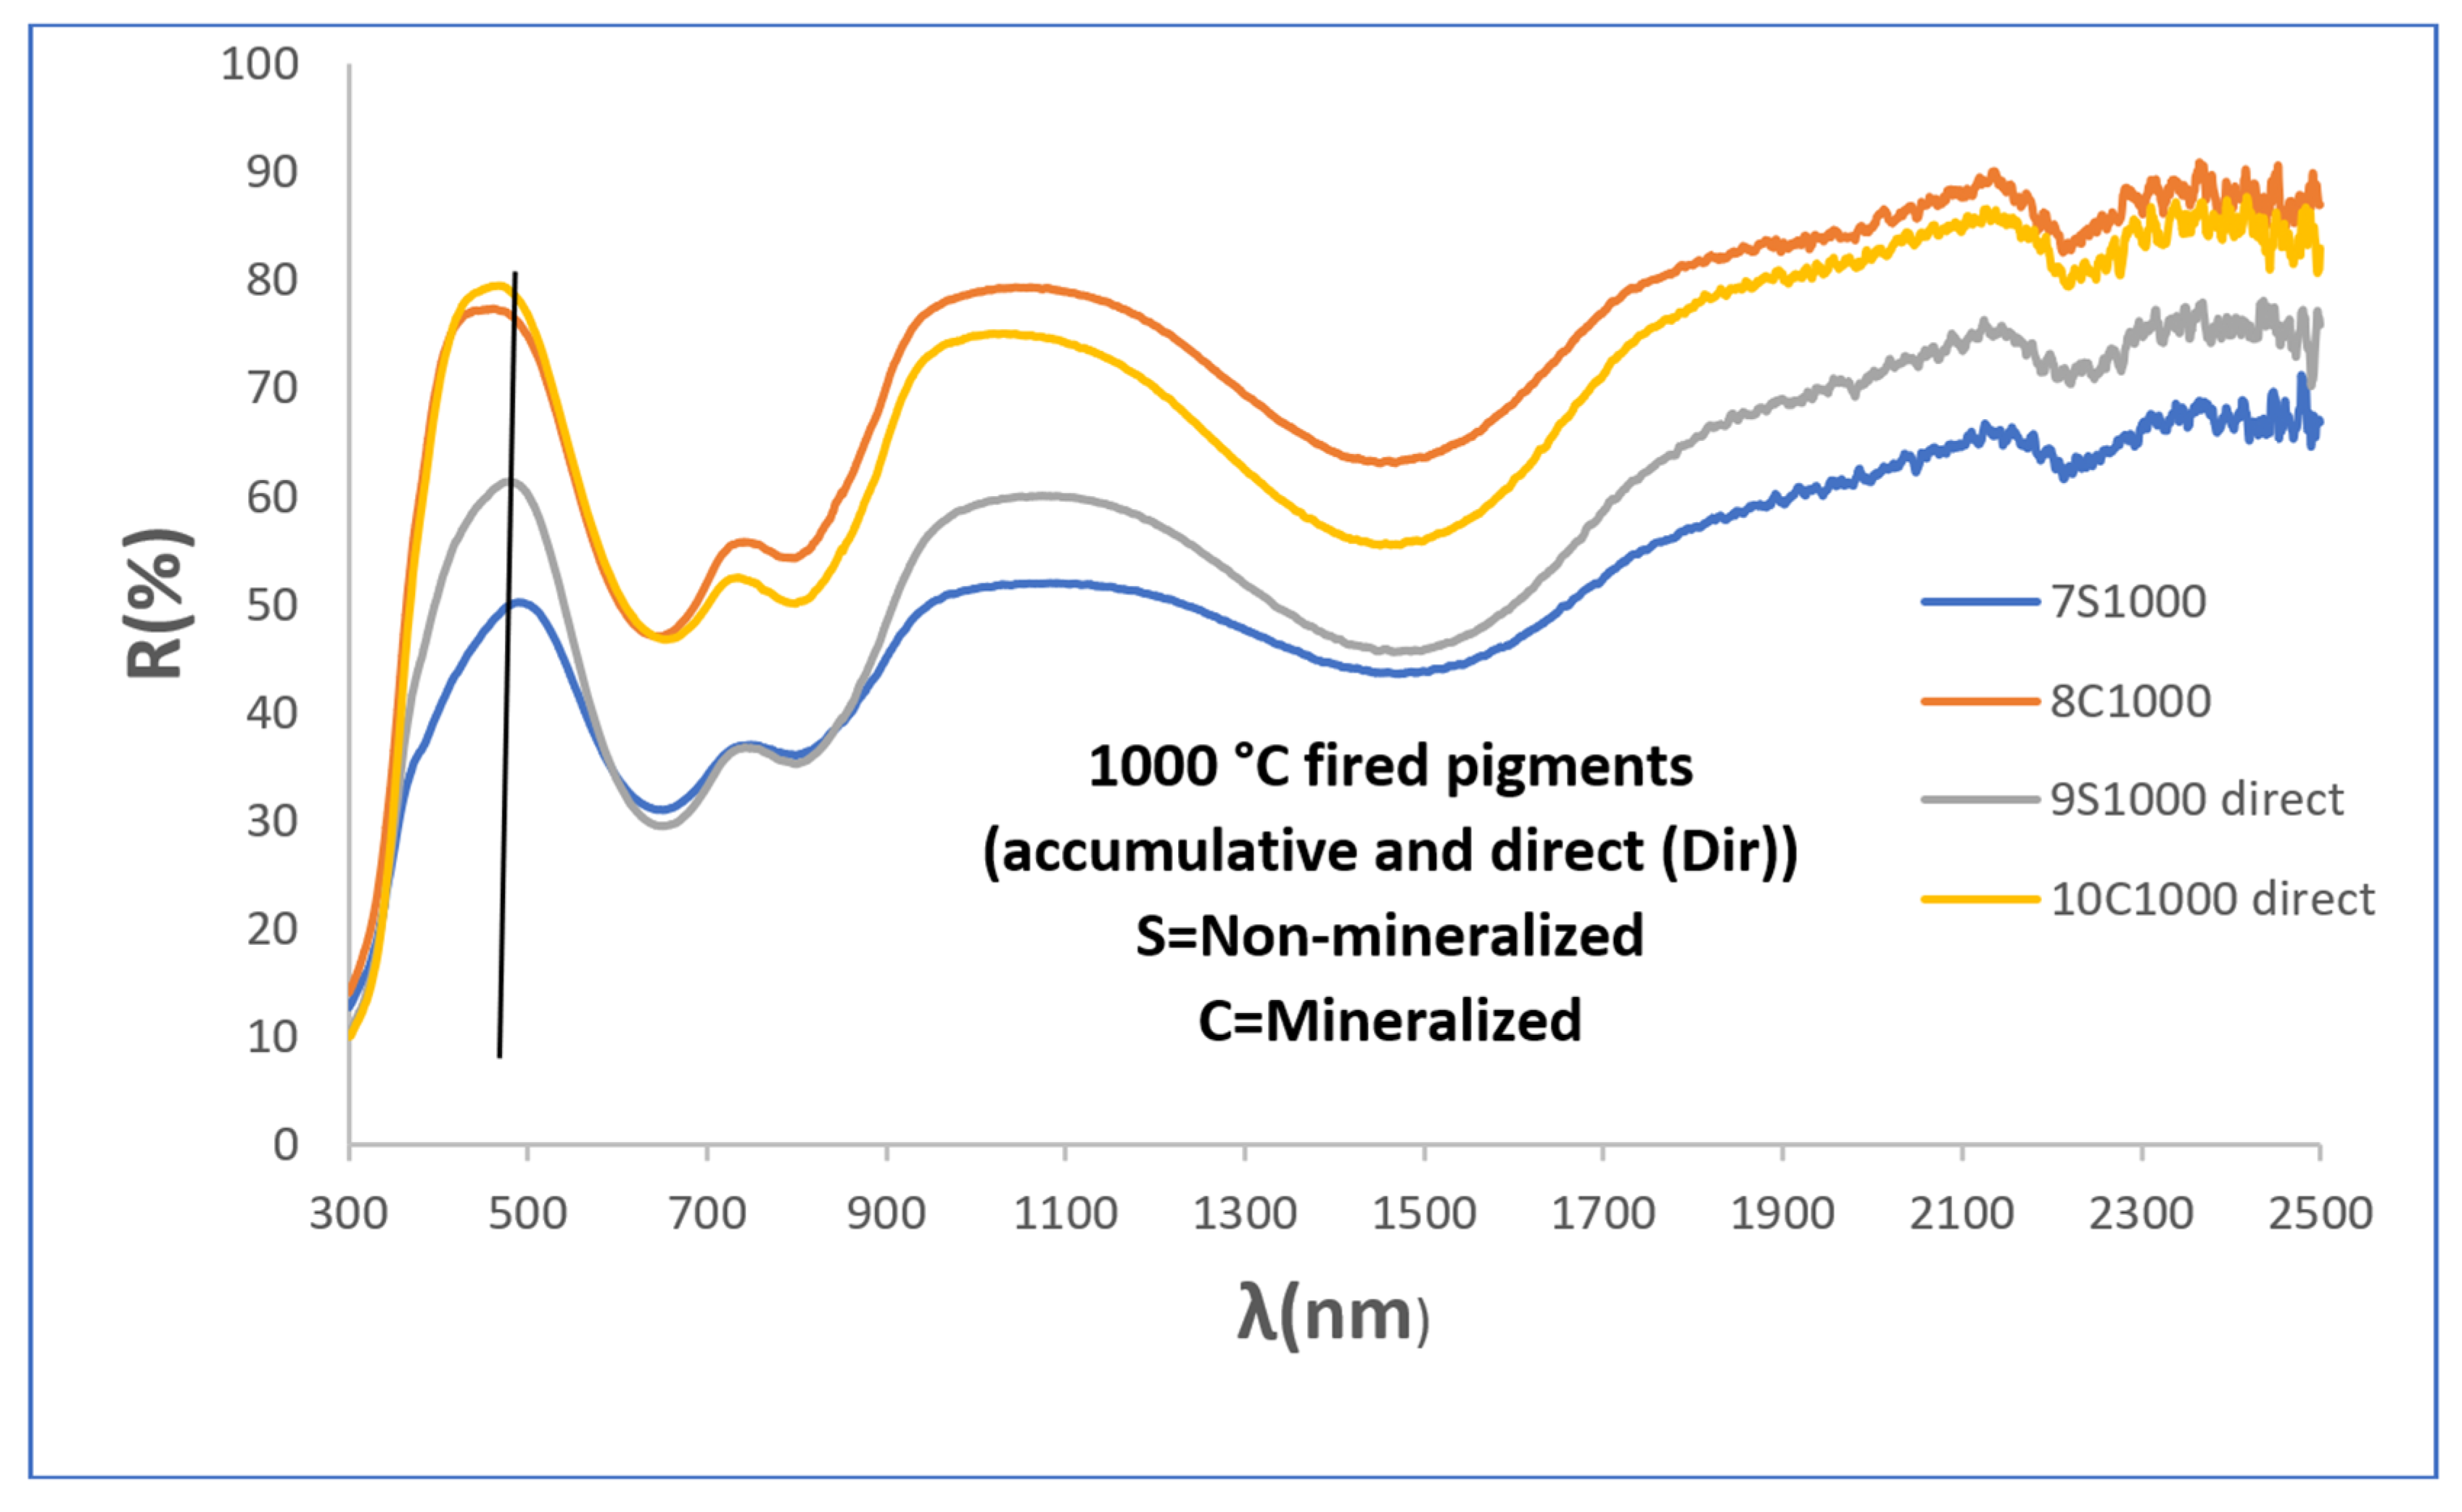
Figure 5 shows the UV-Vis-NIR diffuse reflectance spectra of the powders, which are similar to those of the accumulative-firing samples, with absorption bands (minima in reflectance) centred at 302, 645, 800 (shoulder), and 1470 nm. However, the low-reacted yellow sample fired at 750 °C shows a broad reflectance band between 550 and 1200 nm, although the absorption bands at 302, 645, and 800 nm can still be observed. The band centred in the UV region at around 302 nm is attributed to a charge-transfer transition between vanadium ions and oxygen anions. The bands in the visible region at 645 and 800 nm and the NIR band at 1470 nm have been associated in the literature with d–d transitions of V4+, although different transitions have been proposed depending on the coordination environment [7,8,9,10,11,12,13,14,15,16,17,18]. The intensity and resolution of the reflectance bands decrease with increasing temperature, while the wavelength of the reflectance band responsible for the powder colour (indicated by the vertical line in all UV-Vis-NIR figures), located around 540 nm, shifts towards higher wavelengths at 1000 °C (Figure 6), thereby decreasing the green component of the powder colour.
Figure 5.
UV-Vis-NIR diffuse reflectance spectra of powders.
Figure 6.
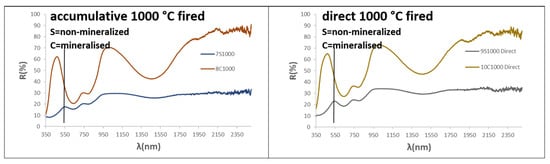
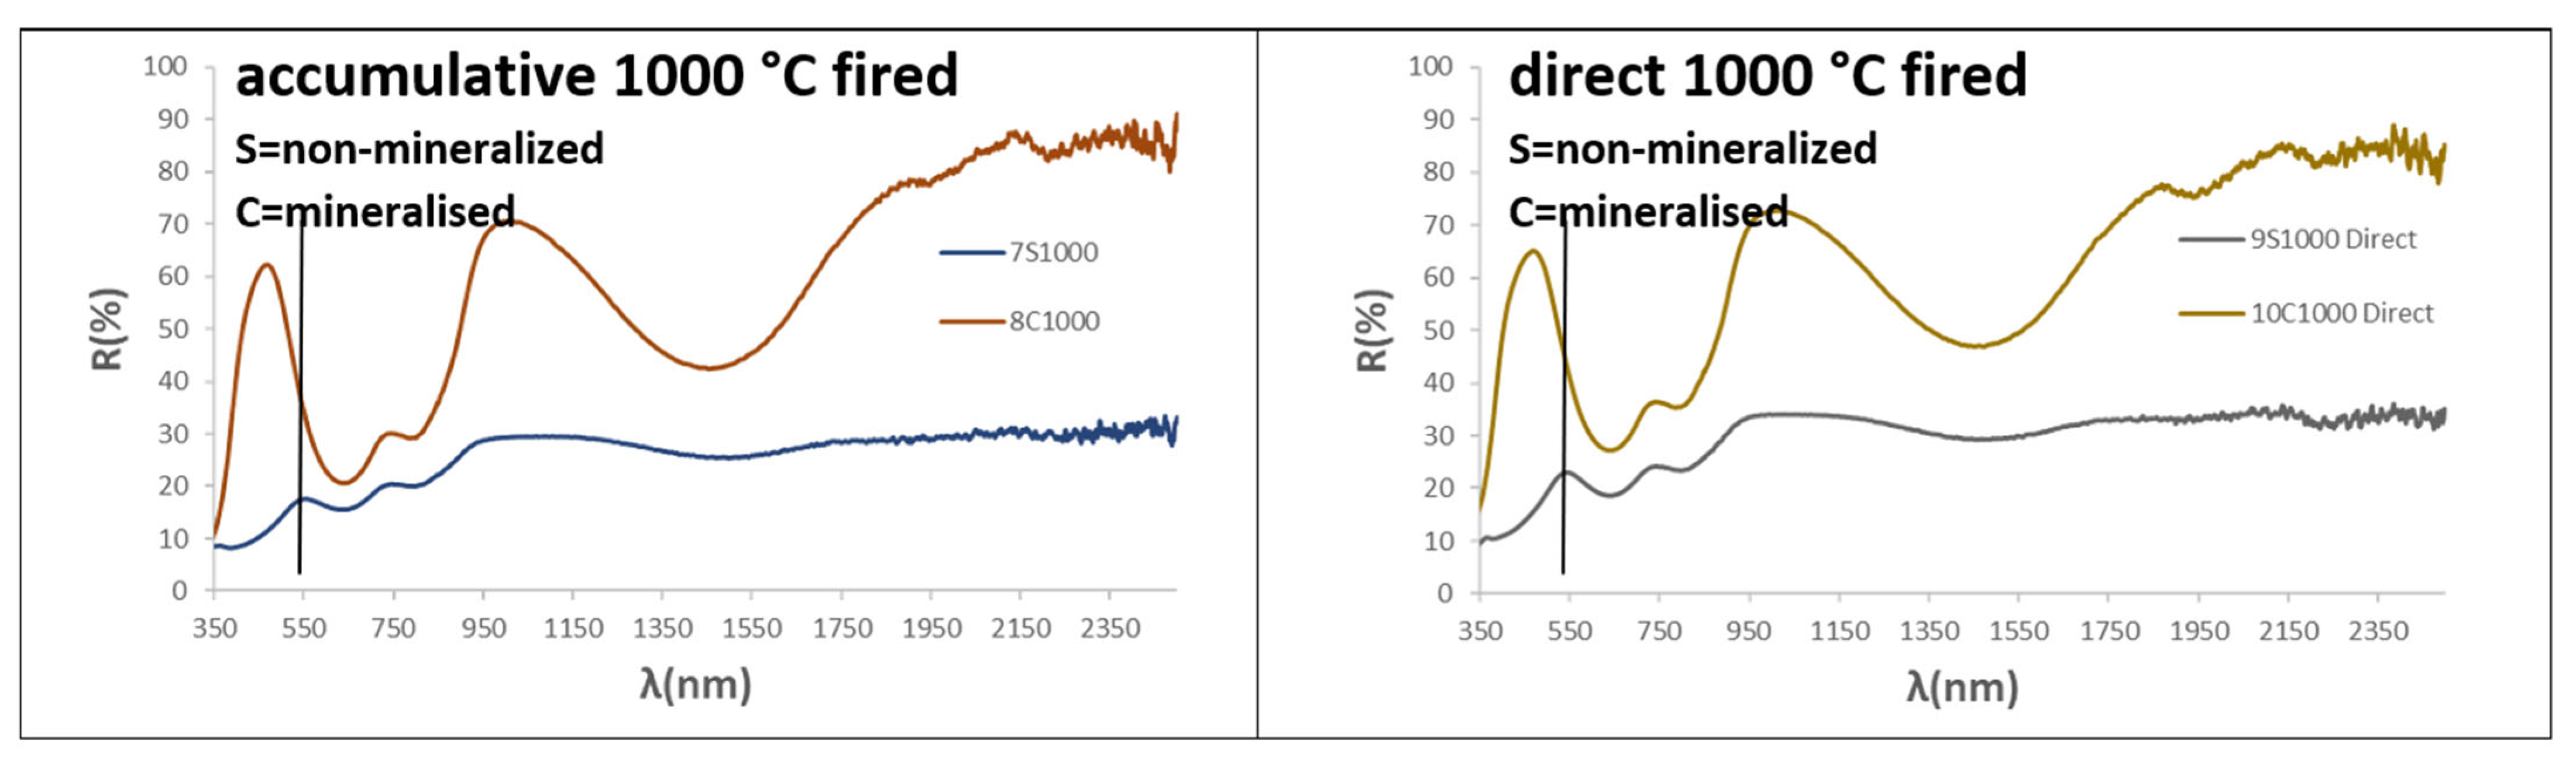
UV-Vis-NIR diffuse reflectance spectra of both cumulative firing and direct firing at 1000 °C.
3.2. Halide Mineralised Powders
Figure 1 and Figure 2 show direct and optical images of the mineralised powders fired successively at 750, 850, and 1000 °C for three hours. Their particle sizes, estimated from the images, and their L*a*b* colour parameters are shown in Table 2. Figure 3 presents the XRD patterns of the powders fired at 1000 °C, while Table 3 provides the semiquantitative estimation of the mineralogical composition of the samples.
At 750 °C, only 9% zircon is estimated in the bluish powder (L*a*b* = 74.40/−2.05/−0.01 in Table 2), increasing to 42.3% at 850 °C and to 93.3% at 1000 °C, Å with only monoclinic zirconia detected as a residual phase. This phase evolution produces an intense blue colour (L*a*b* = 80.53/−11.59/−10.94 and 67.25/−14.64/−24.11, respectively, in Table 2), while a similar particle size (1–3 µm) is observed in the optical images (Figure 1 and Figure 2). This phase evolution is also consistent with the mineralising action of the halide mixture used, which melts at around 875.1 °C. This effect is clearly observed at 1000 °C, is likely to occur at 850 °C, and would not be expected at 750 °C. At this lower temperature, the vanadium oxides would instead act as mineralising agents.
In contrast to the non-mineralised samples, the lattice parameters of the powders (Table 4) show a unit cell that is only very slightly expanded at 750 °C (by just 0.1 Å3 compared to that recorded in ICDD entry 83-1374 for undoped zircon), followed by an expansion with increasing temperature (approximately 1.5 Å3 larger at both 850 and 1000 °C). As discussed above, to explain this expansion, the incorporation of V4+ into the zirconium site should be ruled out, considering the smaller ionic radius of V4+ in eightfold coordination (0.86 Å versus 0.98 Å for Zr4+) [25].
Among the alternatives considered above to explain the lattice expansion, the simultaneous aliovalent incorporation of V5+ (0.66 Å for this ion in the corresponding coordination environment) into the dodecahedral Zr site can be considered plausible. This substitution would introduce a charge imbalance that could be compensated by the formation of Zr vacancies, thereby accounting for the observed lattice expansion. It would also be expected to result in residual unreacted zirconia, consistent with its detection by XRD at 1000 °C. In contrast, the substitution of Si4+ (0.40 Å in tetrahedral coordination) by V4+ (0.56 Å in tetrahedral coordination), or the incorporation of V4+ into the distorted tetrahedral interstitial 16 g site (point symmetry 2), appears less plausible. In both cases, charge compensation would be expected to involve the formation of Si vacancies, which should result in residual unreacted silica being detected by XRD, particularly for the zirconia-deficient starting composition (Zr0.9V0.1)SiO4.
Therefore, if the incorporation of vanadium in its higher oxidation state (V5+) is ruled out, it is difficult to reconcile the expansion of the unit cell with the absence of silica in samples that have undergone a high degree of reaction. Nevertheless, Llusar et al. [3,4] proposed that, in these halide-mineralized powders, the aliovalent substitution of O2− (1.22 Å in threefold coordination in zircon) by the smaller F− anion (1.16 Å in threefold coordination) or the larger Cl− anion (assuming a reduction of approximately 7–9% in the ionic radius of Cl−, based on the behaviour of fluorine, the radius of Cl− would be approximately 1.50 Å) could lead to the formation of Zr4+ vacancies rather than silicon vacancies. According to this proposed mechanism, the resulting Zr4+ vacancies would facilitate the reaction of Zr4+ species with Si4+ species generated by the isovalent substitution of Si4+ by V4+, ultimately resulting in a net concentration of Zr vacancies and the formation of a stoichiometric residual ZrO2 phase. This interpretation is also consistent with the decrease in the expansion of the zircon unit cell observed by Llusar et al. [3,4] as the halide content in the starting composition increases, although the unit cell remains expanded relative to that of undoped zircon.
In the case of the mineralised powders fired directly at 850 °C and 1000 °C, respectively, the results differ from those obtained by accumulative firing. At 850 °C, only a small amount of zircon (7%) is formed, and the powder remains white (L*a*b* = 87.00/−5.00/2.22; Table 2), although a few blue particles can be observed in the optical images in Figure 1 and Figure 2. This behaviour is similar to that of the sample fired at 750 °C, but contrasts with the accumulatively fired sample at 850 °C, which exhibits a blue shade (Lab* = 80.53/−11.59/−10.94) and a zircon content of 42.3% (Table 3). The sample directly fired at 1000 °C contains 97.3% zircon, with monoclinic zirconia as the residual phase, and exhibits an intense blue colour (Lab* = 71.58/−13.09/−19.76), similar to, but less intense than, that of the corresponding sample subjected to cumulative firing at 1000 °C. The zircon unit cell shows an expansion relative to undoped zircon; however, the increase in unit-cell volume (approximately 0.3–0.4 Å3) is smaller than that observed for the corresponding sample subjected to cumulative firing and for the non-mineralised samples.
Figure 5 shows the UV–Vis–NIR diffuse reflectance spectra of the mineralised powders. The spectra exhibit the same absorption bands described for the non-mineralised samples, centred at 302, 645, 800 (shoulder), and 1470 nm [28]. However, the overall spectral intensity decreases with increasing temperature for both the accumulative and direct firing procedures, with low absorption observed for the sample fired at 750 °C and for the sample directly fired at 850 °C, in agreement with their white colour. In the non-mineralised samples, the relatively narrow reflectance band responsible for the powder colour, centred at approximately 540 nm, shifts to around 450 nm at 1000 °C in the mineralised sample, where it becomes an intense and broad band extending from approximately 360 to 500 nm and covering the violet–blue region of the spectrum. This spectral behaviour is consistent with the intense blue colour observed at 1000 °C. Ultimately, in contrast to the non-mineralised samples, the reflectance band shifts towards shorter wavelengths with increasing temperature, accompanied by an increase in the blue component in the mineralised sample.
Figure 6 shows the UV–Vis–NIR diffuse reflectance spectra of the samples subjected to both accumulative and direct firing at 1000 °C. All samples exhibit the same absorption bands discussed above; however, the reflectance is clearly higher for the mineralised samples, in agreement with the lower darkness of these samples compared with the non-mineralised (L* ≈ 70 and ≈50, respectively).
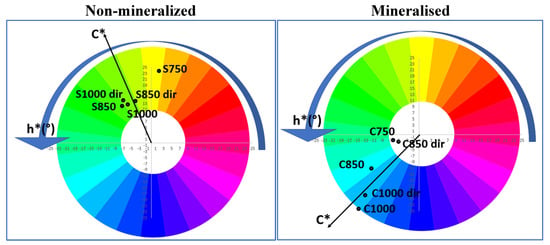
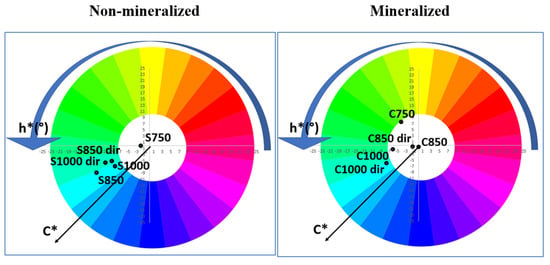
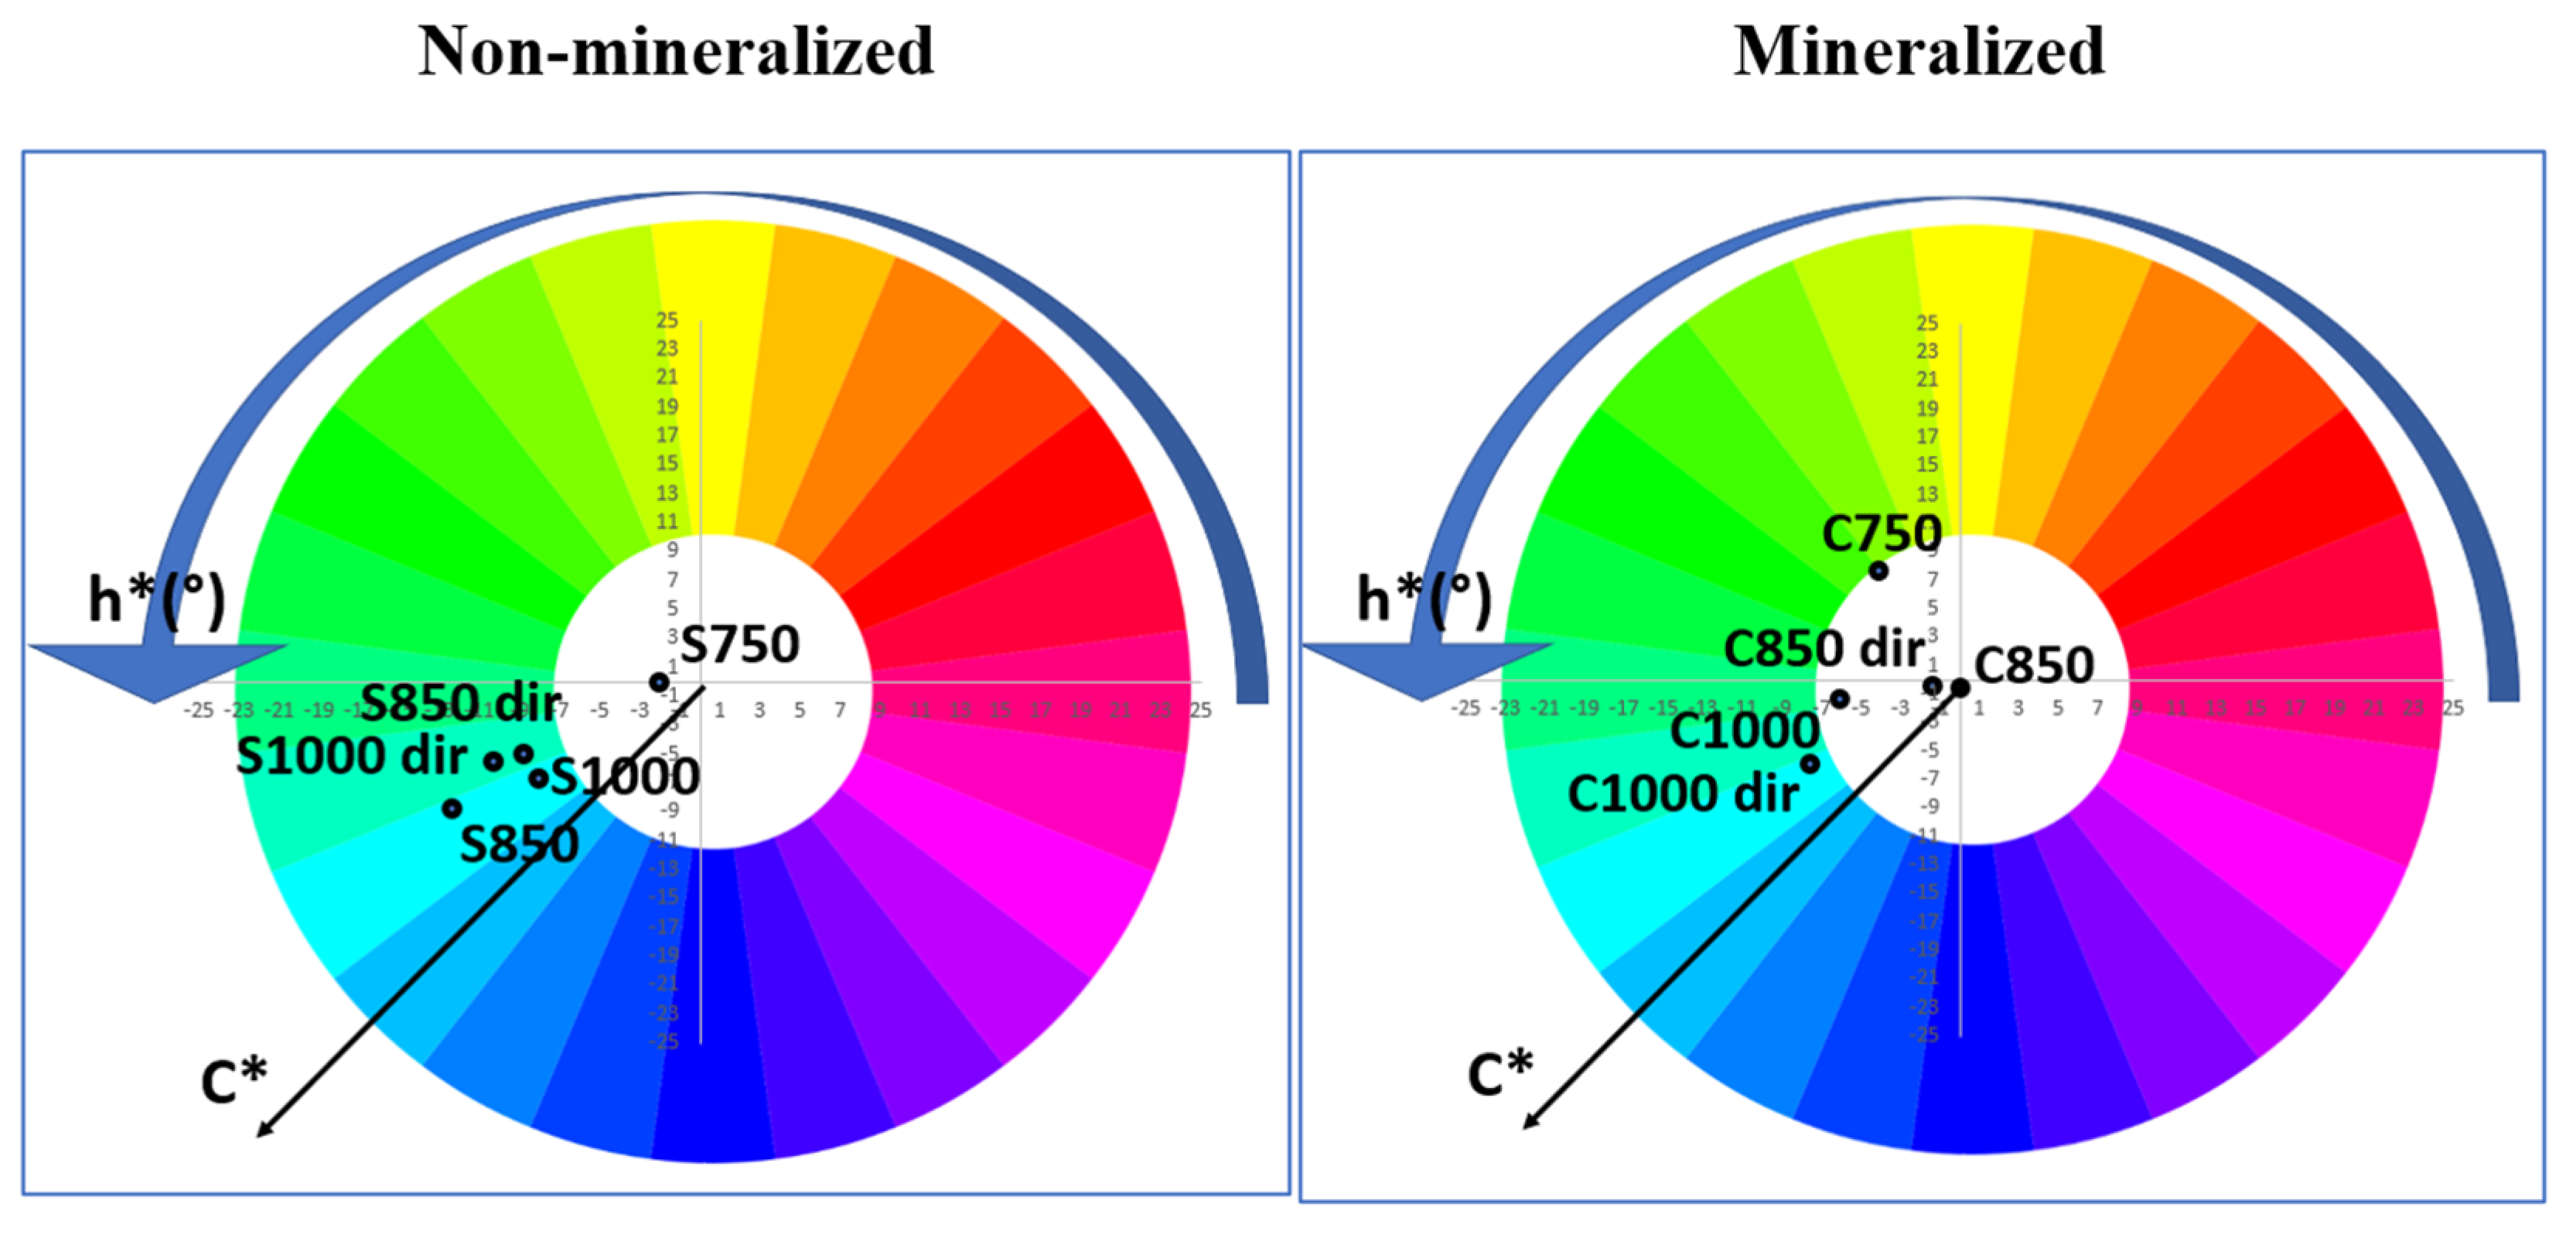
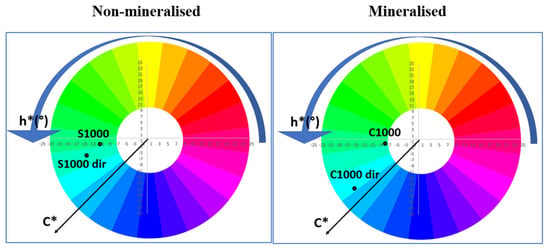
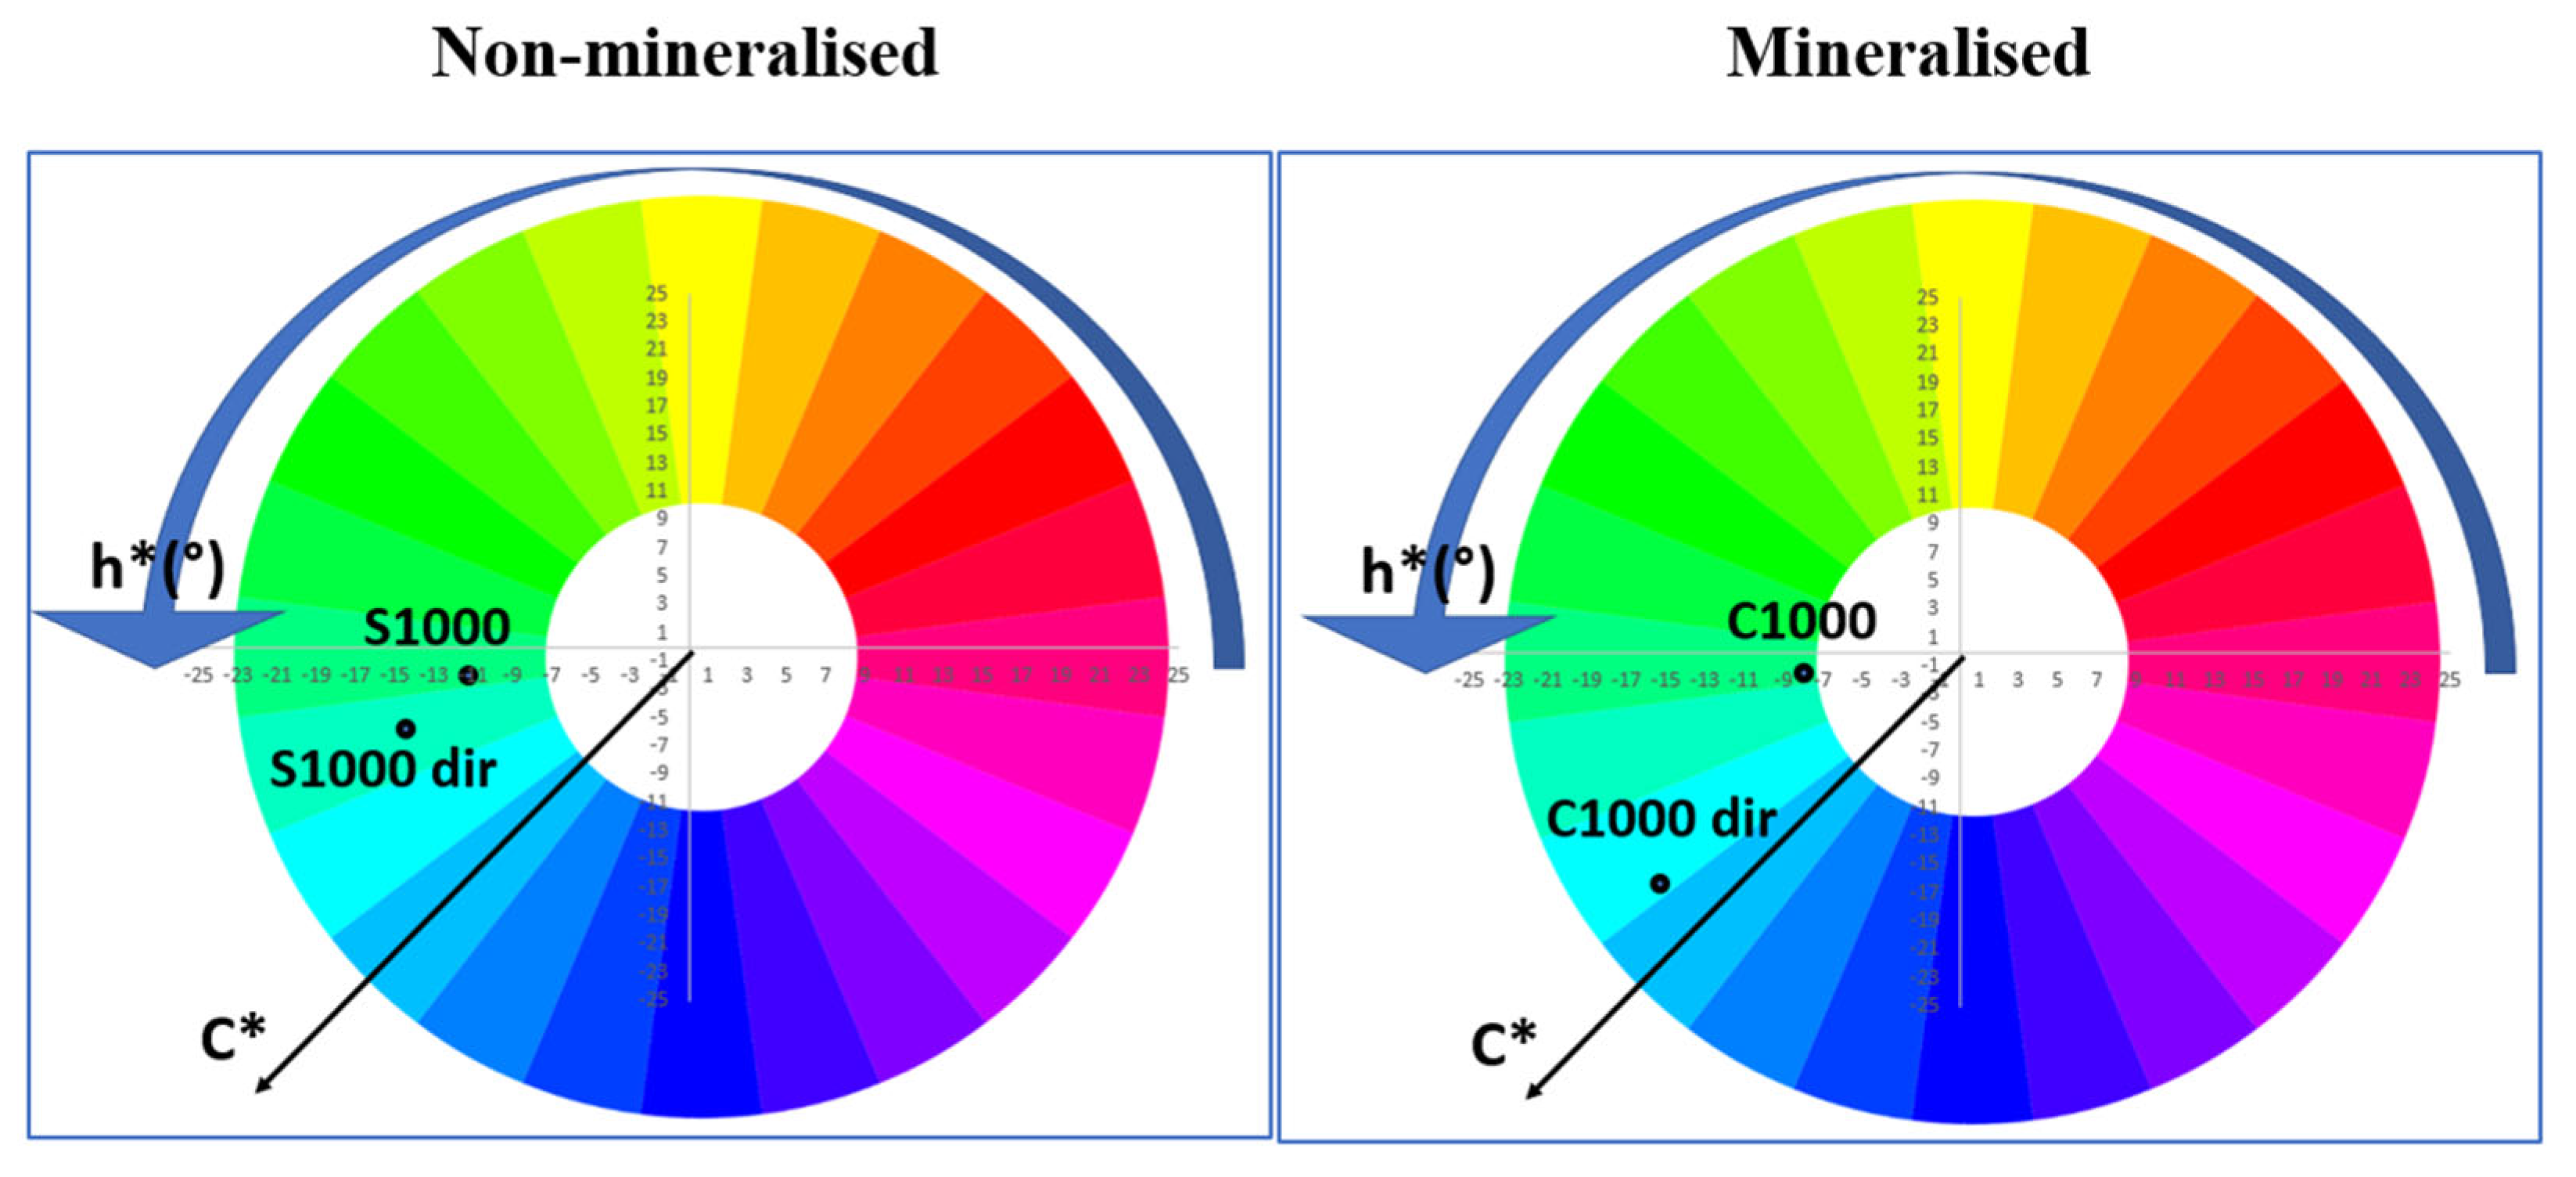
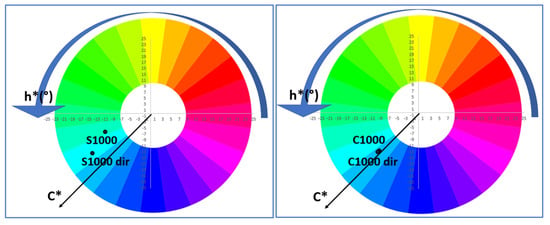
Figure 7 compares the colour coordinates of the non-mineralised and mineralised powders using the colour wheel. In agreement with the colour evolution discussed above, the non-mineralised powders fall within the yellow region for the samples fired at 750 °C and directly fired at 850 °C, whereas the remaining samples fall within the green region. In contrast, the mineralised samples fall within the blue region, except for the white samples fired at 750 °C and directly fired at 850 °C.
Figure 7.
Colour Wheel of powders.
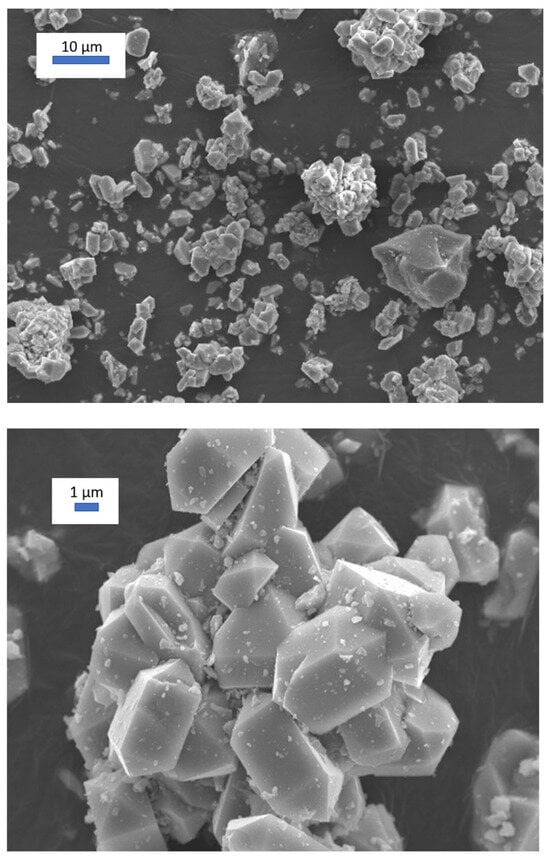
Figure 8 shows an SEM image of the best turquoise powder, C1000, corresponding to the mineralised sample subjected to cumulative firing at 1000 °C for 3 h (Lab* = 67.25/−14.64/−24.11). Well-formed crystals, approximately 2–4 µm in size, can be observed. The crystals consist of a central prismatic body that develops into a four-sided square-prism face ([100] or [110]), with the basal ends terminated by four- or eight-sided pyramidal faces ([101] or [211]) that taper to sharp points. Doubly terminated crystals, in which both basal ends feature pointed pyramids, are frequently observed, together with crystal agglomerates [29].
Figure 8.
SEM image of the best turquoise powder C1000 (mineralised sample, cumulative firing at 1000 °C for 3 h (L*a*b* = 67.25/−14.64/−24.11)).
In accordance with the above discussion, it is pointed out that V4+ is the only chromophore detected in both the non-mineralised and halide-mineralised samples, as all samples exhibit identical absorption-band positions, although their colours differ due to changes in the background reflectance of the radiation. Therefore, the presence of a chromophore with no d electrons that modifies the colour should also be considered; the conventional candidate is yellowish V5+.
The stoichiometric analysis of the reaction indicates the presence of residual zirconia in highly reacted mineralised samples, whereas no residual silica is detected. This rules out a simple reaction mechanism based on the isovalent substitution of Si4+ by V4+ at tetrahedral sites in the zircon structure.
The lattice is always expanded relative to undoped zircon; however, its thermal evolution differs between the two systems. In the non-mineralised samples, lattice expansion is pronounced at low temperatures and decreases upon heat treatment. Conversely, in the mineralised samples, lattice expansion is relatively small and increases with temperature, eventually converging toward values similar to those of the non-mineralised samples. The observed lattice expansion rules out the simple aliovalent substitution of Zr5+ by the smaller V4+ ion. In the halide-containing samples, the reaction breaks down at low temperatures due to the formation of vanadium halide phases, resulting in sample decolourisation.
A possible model for these observations and apparent contradictions can be proposed for both non-mineralised and halide mineralised systems:
(a) In the non-mineralised samples, the reaction proceeds through a mechanism involving the aliovalent incorporation of yellowish V5+ (or the simultaneous isovalent incorporation of V4+ at Zr4+ sites). The incorporation of V5+ would generate a yellowish colour and a large number of Zr vacancies, thereby expanding the lattice. As the temperature increases, these vacancies may progressively be eliminated while increasing the isovalent substitution of Si4+ by V4+ (at tetrahedral 4b or at the interstitial 16 g site), which produces a blue colouration. The combination of the yellow colour associated with V5+ and the blue colour associated with V4+ would account for the greenish hues observed at high temperatures, while the lattice expansion would decrease significantly.
(b) In the halide-mineralised samples, the reaction breaks down at low temperatures due to the formation of vanadium halide phases. This process decolourises the samples and produces zircon with a relatively weakly expanded lattice. As the temperature increases, the vanadium halides decompose, and F− and Cl− ions substitute for oxygen in the zircon lattice through an aliovalent substitution mechanism, generating Zr vacancies that expand the lattice. This expansion is partially compensated by the isovalent substitution of Si4+ by the smaller V4+ ion, which produces the characteristic blue colouration and generates silicon vacancies. These vacancies release Si, which reacts partially with the Zr released during halide incorporation, resulting in a net formation of zirconia, which is detected by XRD.
The optical transparency of V5+, F−, and Cl− to diffuse reflectance spectroscopy, EPR, and XPS has prevented these species from being tracked in the literature. Alternative techniques beyond those used in the present study would therefore need to be developed to enable their detection and monitoring. However, this falls outside the scope of the present work.
3.3. The Performance as Ceramic Pigments
As discussed above, a ceramic pigment should withstand attack by molten glass over a temperature range of approximately 800–1300 °C and therefore belongs to Category A of the CPMA classification [3]. However, the characteristics of the glaze and the firing temperature of the glazed sample are also important factors that can significantly affect colour development. A given pigment may therefore develop different colours depending on both the firing temperature and the chemical composition of the glaze [30,31]. Ceramic frits and glazes are commonly characterised using the Seger formula, also known as the Unity Molecular Formula (UMF), a standardised method in ceramic chemistry developed by Hermann Seger to express glaze composition in terms of molecular oxide ratios rather than raw-material weights. In the UMF, the total content of fluxing oxides (Na2O, K2O, CaO, SrO, BaO, PbO, and ZnO) is normalised to unity (1.0), while the stabilising (amphoteric) oxide Al2O3 and glass-forming (acid) oxides such as SiO2, B2O3, and GeO2 are expressed relative to this value [32].
Zircon-based pigments are highly stable ceramic pigments in glazes at temperatures of up to 1200 °C [31] and are widely used as reference pigments for turquoise shades. Molinari et al. [33] suggested that the colour originates from the above-mentioned V4+ clusters [16], which may account for the well-known difficulties in controlling and reproducing the synthesis. In addition, it has not yet been used in inkjet applications because its tinctorial strength is considerably reduced by micronisation.
However, Earl et al. [34] emphasise that, in experimental whiteware coatings comprising zircon pigment and multi-oxide silicate glass frits, the absence of ZrO2 results in significant pigment dissolution and unstable crystallisation of calcium-based silicates, thereby adversely affecting gloss and colour consistency as the temperature increases from 1000 °C to 1100 °C. In opaque frits containing ZrO2, the quantity, size, and morphology of the zircon precipitated during firing were mainly dependent on the ZnO, SrO, and Al2O3-to-alkali levels. In these frits, little or no zircon pigment dissolution occurred, and zircon crystallisation was nearly complete at 1000 °C. ZnO incorporated into the frits promoted zircon crystallisation and resulted in high opacity. Replacing ZnO with SrO in the same frits prevented zircon precipitation and resulted in transparent coatings. The Al2O3-to-alkali ratio (Al2O3) governed the size, quantity, and spherical morphology of the precipitated zircon particles.
In this work, the behaviour of both halide-free and mineralised powders was studied after glazing with three types of transparent, ZrO2-free glazes, whose Seger formulas are presented in Table 5. Glaze I is an alkali glaze, lead-free, ZnO-free, and low in alumina. Glaze II is the conventional lead bisilicato glaze, also applied by double firing at 1000 °C. Glaze III is a lead-free glaze containing ZnO and CaO, applied by single firing at 1080 °C.
Table 5.
Serger’s formula of glazes.
3.3.1. Glaze I: Alkali Glaze, Free of Lead, and ZnO with Low Alumina Content for Double Firing at 1000 °C
This glaze is a traditional alkaline glaze, characterised by high gloss but a tendency to develop crazing because alkali elements have high thermal expansion coefficients and undergo substantial contraction during cooling. It also exhibits poor adhesion to the clay body. In this context, the microstructure of the pigment within the traditional alkaline glaze has been investigated [35].
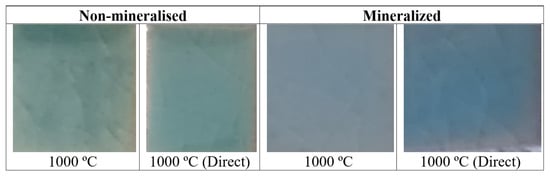
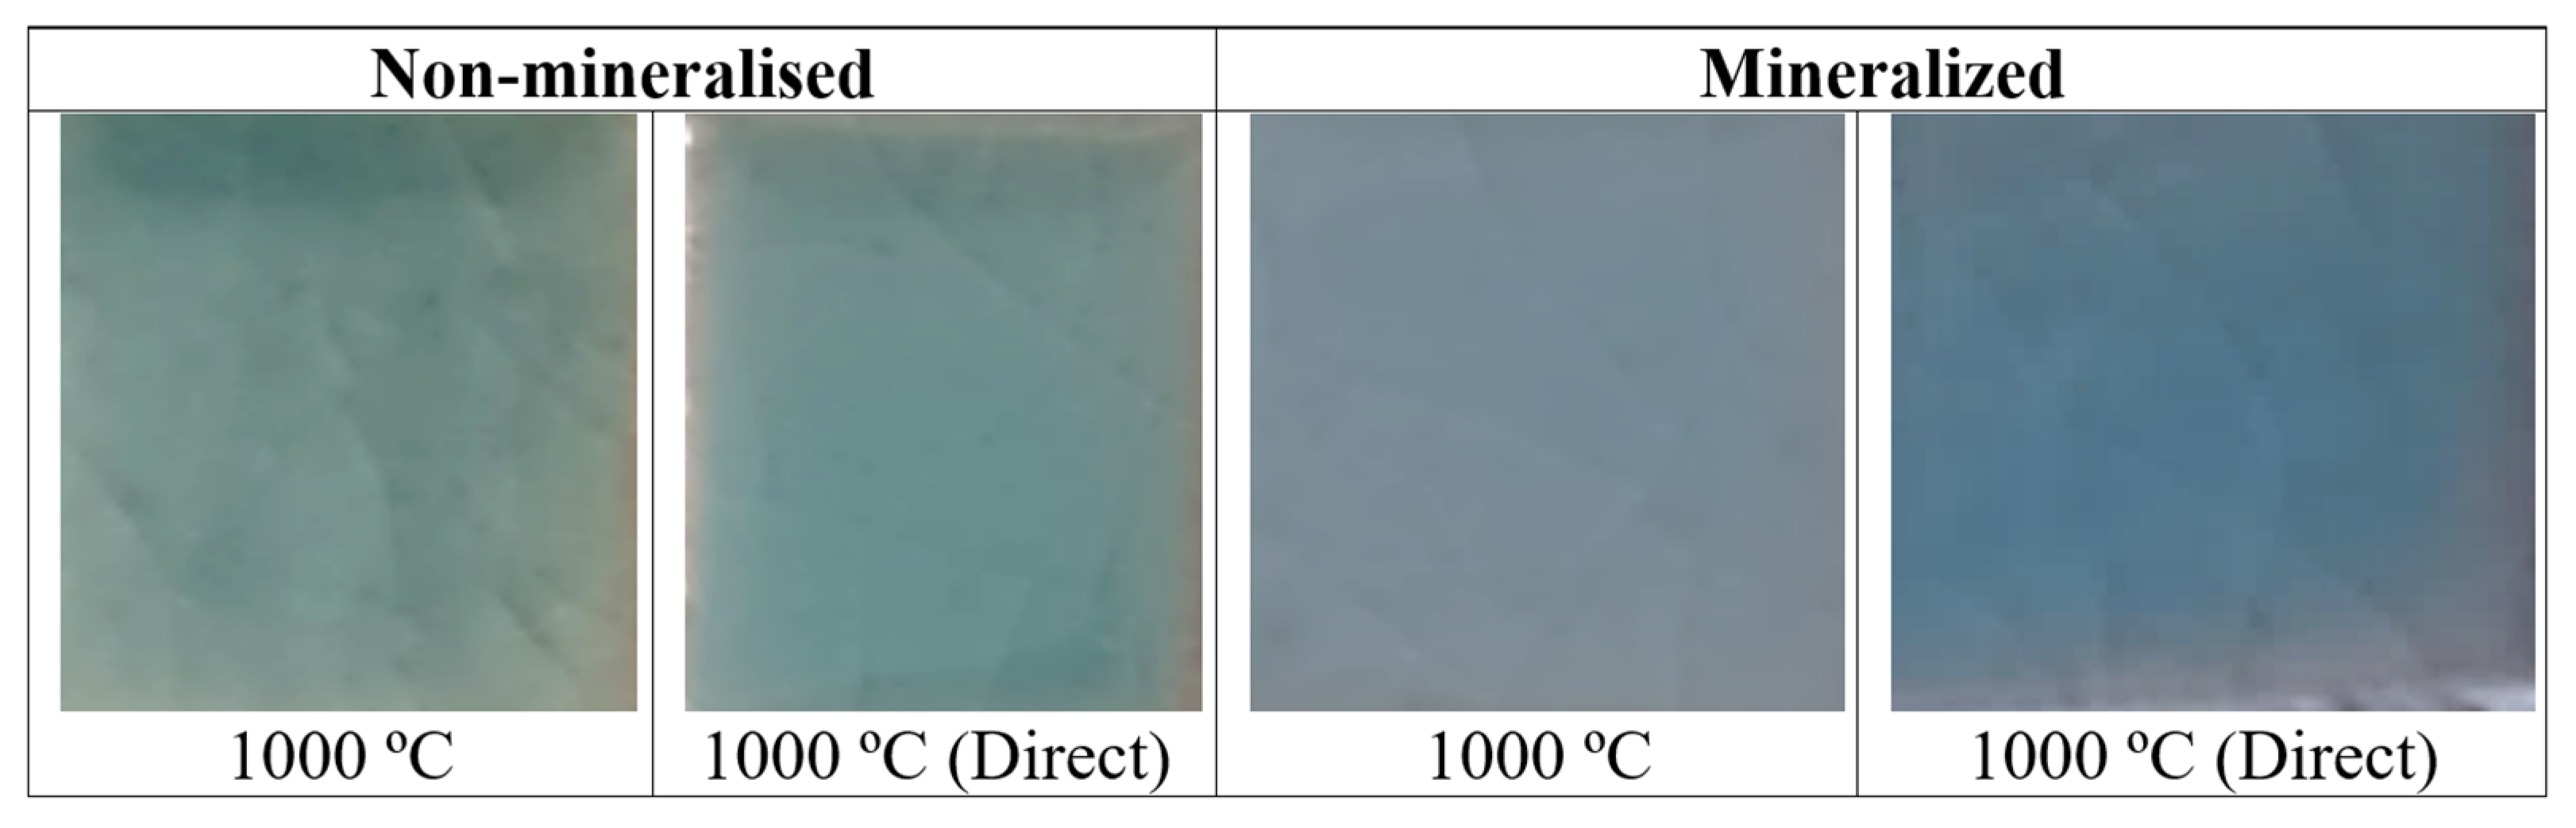
Figure 3 and Figure 4 show the XRD patterns of the powders glazed at 5 wt% in GLAZE I. Figure 9 shows the corresponding images, Figure 10 and Figure 11 present the UV-Vis-NIR diffuse reflectance spectra, and Figure 12 shows the Colour Wheel.
Figure 9.
5 wt% glazed samples in GLAZE I.
Figure 10.
UV-Vis-NIR diffuse reflectance spectra of samples glazed in GLAZE I.
Figure 11.
UV-Vis-NIR diffuse reflectance spectra of samples glazed in GLAZE I fired at 1000 °C for 3 h.
Figure 12.
Colour Wheel of powders and 5 wt% glazed samples in GLAZE I.
Surprisingly, all halide-free glazed samples exhibit a blue shade, which is very weak at 750 °C (b* = −0.01), whereas the other samples show b* values between −4.5 and −8.5. The direct-fired powders stand out because of their higher colour intensity (lower L*). The XRD patterns of the halide-free glazed samples (Figure 3) only show the crystallisation of zircon, with a preferred crystal orientation along the [101] plane (20° 2θ). Monoclinic zirconia and quartz detected in the powders appear to dissolve in the glaze.
Conversely, the mineralised samples exhibit a white colour at 750 °C and a weak blue shade at 850 °C (b* ≈ −0.5). A clearly blue colour is only obtained at 1000 °C, with b* = −3.78 for the direct-fired powder. The XRD patterns (Figure 4) show a preferred crystal orientation along the [211] plane (27° 2θ). The peak intensities are lower, whereas the crystallite size calculated using the Scherrer equation is higher than that of the non-mineralised glazed samples.
The UV-Vis-NIR diffuse reflectance spectra of the glazed samples (Figure 10) show the absorption bands (i.e., minima in reflectance) previously described for the powders, except for the non-mineralised sample fired at 750 °C and the mineralised samples fired at 750 and 850 °C. In agreement with their low zircon reactivity, these samples exhibit very weak absorption bands. As observed for the powders, the non-mineralised glazed sample fired at 1000 °C (Figure 11) exhibits lower reflectance than the corresponding mineralised sample, in agreement with its higher colour intensity (lower L*). However, the difference in reflectance between the two samples is relatively small. The mineralised sample exhibits a slightly higher and broader reflectance band around 470 nm, indicating a higher reflectance in the blue region of the spectrum. Nevertheless, in the Colour Wheel shown in Figure 12, the colour locations are very similar for both coloured samples fired at 1000 °C.
Therefore, the halide-free powders give the more intense blue shade in this glaze (L*a*b* = 52.08/−10.29/−5.37 for powder fired directly at 1000 °C for 3 h). The best-performing turquoise powder, C1000 (mineralised sample subjected to cumulative firing at 1000 °C for 3 h; L*a*b* = 67.25/−14.64/−24.11), when glazed at 5 wt% in GLAZE I, only shows a moderate blue shade (L*a*b* = 65.10/−7.65/−3.78).
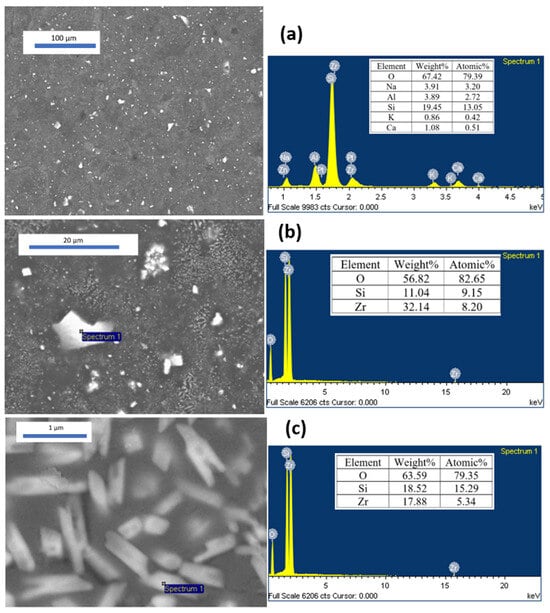
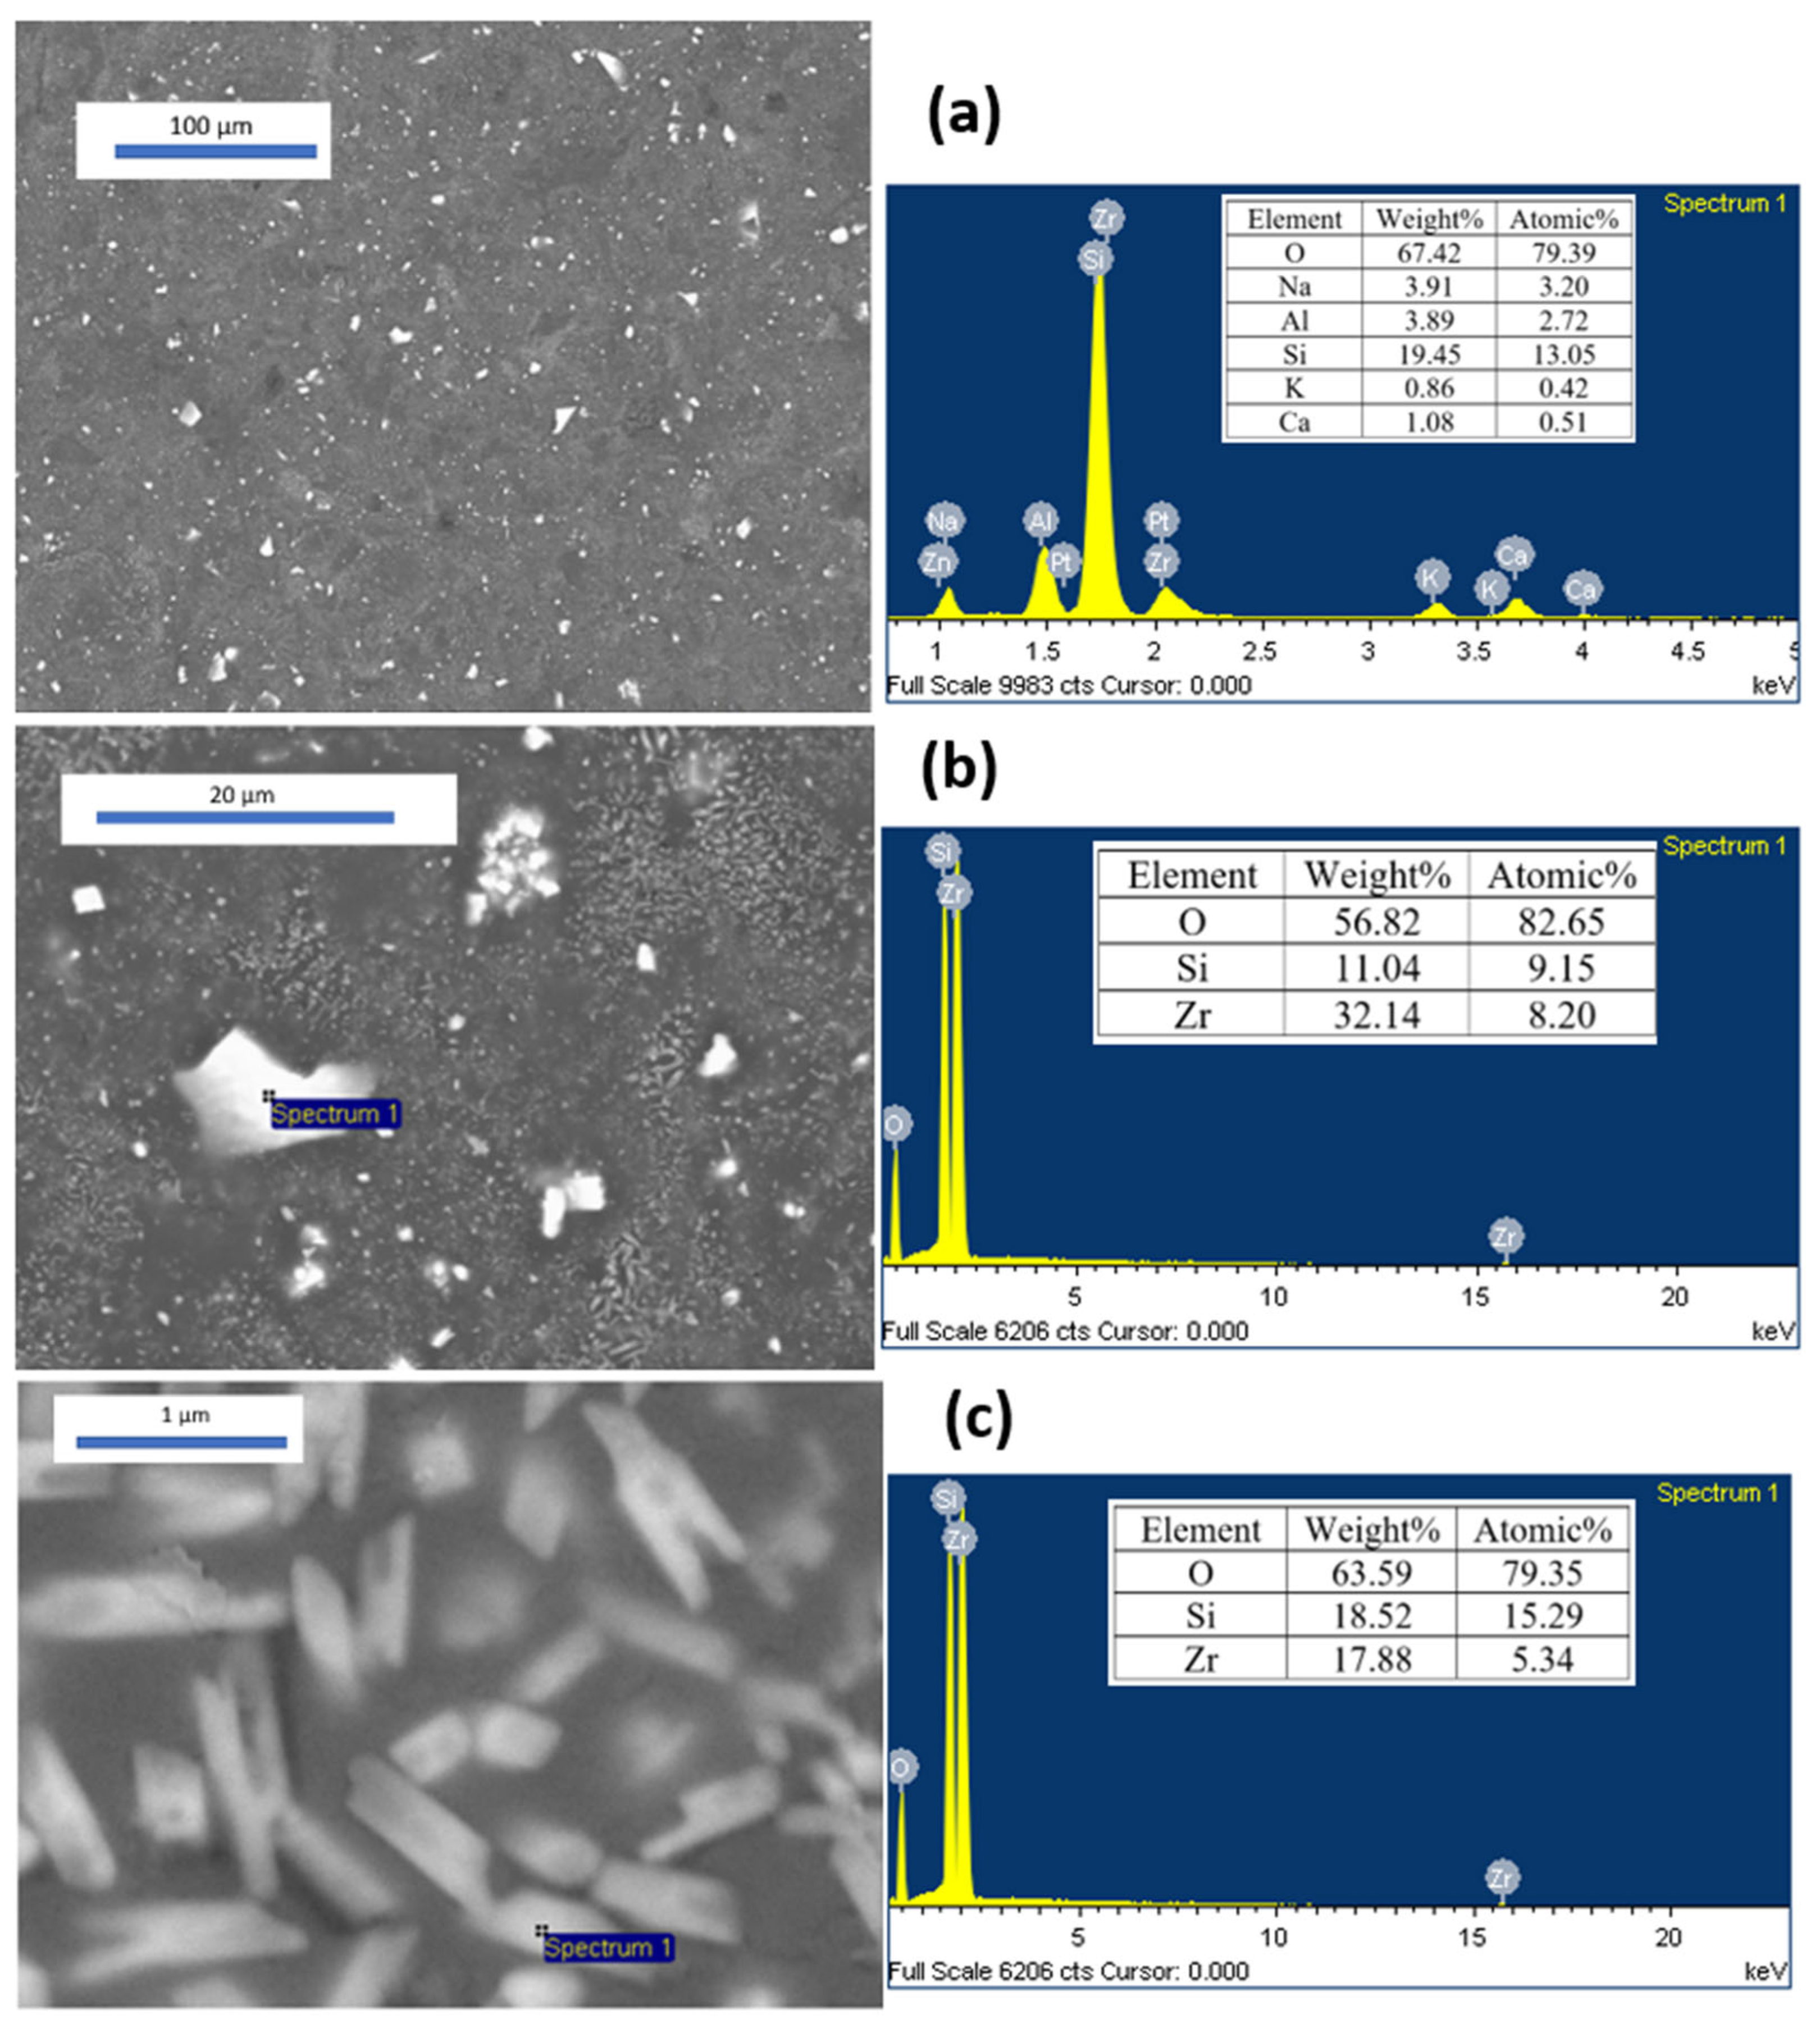
In agreement with the findings of Earl et al. [26], significant dissolution of the zircon pigment occurs in this ZrO2-free glaze. Figure 13 shows representative SEM images of the best blue powder-glazed sample mentioned above in GLAZE I, together with the corresponding SEM-EDS analyses. In the low-magnification image (Figure 13a), the global EDS analysis indicates approximately 3 wt% Zr, together with relatively large crystals measuring approximately 1–5 µm and a diffuse crystallisation phase embedded in the glaze. The local spectrum of the larger crystals (Figure 13b) shows an EDS composition consistent with zircon (32 wt% Zr), similar to that obtained for the smaller crystals (<1 µm) shown in Figure 13c, which are also embedded in the glaze. The former can be attributed to undissolved ceramic pigment particles responsible for the blue colour, whereas the latter, consisting of a large number of microparticles with low crystallinity, is associated with the devitrification of zircon previously dissolved in the molten glaze, a phenomenon commonly observed in zircon-opacified glazes [35,36].
Figure 13.
SEM images of the best turquoise powder C1000 (mineralised sample, cumulative firing at 1000 °C for 3 h (L*a*b* = 67.25/−14.64/−24.11) in GLAZE I and the corresponding SEM-EDS analysis.
The higher stability of the halide-free powders and the marked change in colour observed when the powders are incorporated into the glaze, resulting in blue shades, are likely related to their chemical composition and, in particular, to the presence of zirconia (approximately 10% in the samples fired at 1000 °C). Zirconia reacts rapidly with the glaze, promoting the formation of devitrified zircon, which, in agreement with the findings of Earl et al. [34], appears to hinder further dissolution of the pigment.
3.3.2. Glaze II: Lead Bisilicato for Double Firing at 1000 °C
This glaze is a traditional lead bisilicato frit, which provides a higher gloss and a smoother surface than alternatives based on boron or zinc can readily achieve. Lead acts as a highly effective flux over a broad melting range, making the firing process more tolerant and reducing glaze defects such as pinholes and crawling. By contrast, lead-free glaze formulations often rely on high concentrations of boron or alkali oxides (sodium and potassium) to lower the melting temperature. However, these components substantially reduce the viscosity of the molten glass and can act as aggressive solvents, attacking and dissolving the crystalline structure of the pigments.
An optimised lead–silica frit with a molar ratio of 1:2.48 was used. If the Thorpe Average or Oxygen Average (OA) of a glaze is considered [37] (Equation (3)):
where B is the sum of the moles of basic oxides and alumina, and A is the moles of acidic oxides. Seger [38] demonstrated that when the oxygen ratio is below 2 (1.60 in this case, according to the Seger formula given in Table 5), the use of a lead–silica frit reduces lead solubility by approximately two orders of magnitude and, consequently, decreases its toxicity in the workshop environment. Its melting point ranges from 725 to 775 °C.
OA = 233 B/60 A
Figure 3 and Figure 4 show the XRD patterns of the powders glazed at 5 wt% in GLAZE II. Figure 14 shows the corresponding images. Figure 15 presents the UV-Vis-NIR diffuse reflectance spectra, and Figure 16 shows the Colour Wheel of the samples.
Figure 14.
5 wt% glazed samples in GLAZE II.
Figure 15.
UV-Vis-NIR diffuse reflectance spectra of samples fired at 1000 °C in GLAZE II.
Figure 16.
Colour Wheel of 5 wt% glazed samples in GLAZE II.
All halide-free glazed samples exhibit a turquoise shade (L*a*b* = 47.63/−11.30/−1.87 and 51.55/−14.44/−5.70 for the accumulative and direct firing conditions at 1000 °C for 3 h, respectively), with the accumulatively fired powder standing out because of its higher colour intensity (lower L*). The XRD patterns of the non-mineralised glazed samples (Figure 3) only show the crystallisation of zircon. The mineralised samples exhibit a blue colour (L*a*b* = 58.93/−8.03/−1.39 and 52.23/−15.29/−16.20 for the accumulative and direct firing conditions, respectively). The XRD patterns show a preferred crystal orientation along the [211] plane (27° 2θ) (Figure 4), with peak intensities of zircon similar to those observed for the non-mineralised glazed samples.
The UV-Vis-NIR diffuse reflectance spectra of the glazed samples fired at 1000 °C (Figure 15) show the same absorption bands (i.e., minima in reflectance) previously described for the powders. As observed for the powders, the non-mineralised glazed samples fired at 1000 °C exhibit lower reflectance than the mineralised samples, in agreement with their higher colour intensity (lower L*). However, the difference is relatively small, as also observed for the samples glazed in GLAZE I. The mineralised samples exhibit a slightly higher and broader reflectance band around 470 nm, indicating higher reflectance in the blue region of the spectrum. In the Colour Wheel shown in Figure 16, the colour locations are very similar for the powders subjected to cumulative firing at 1000 °C. The mineralised sample subjected to direct firing at 1000 °C stands out because of its higher blue chroma (C*).
The stability of the halide-free powders in this lead-bisilicato Glaze II is similar to or lower than that of the mineralised powders. However, as observed for Glaze I, the surprising change in colour observed when the powders are incorporated into the glaze, resulting in turquoise shades, indicates the capacity of halide-free powders as cyan pigments in glazes. In contrast to Glaze I, the presence of zirconia (approximately 10% in the samples fired at 1000 °C) does not appear to inhibit further pigment dissolution in this glaze. In effect, the classic lead bisilicato frit produces a viscous molten mass at lower temperatures and stays viscous; stable refractory crystal structures (such as spinels or encapsulated zircon/silicate systems) remain largely insoluble in the melt. Lead-free substitute glazes often rely on high concentrations of boron or alkali oxides (sodium, potassium) to lower the melting point; however, these elements drastically reduce the viscosity of the molten glass and act as aggressive solvents that attack, dissolve, and destroy the pigment’s crystalline structure [35,39].
3.3.3. Glaze III: Lead Free with ZnO and B2O3 for Single Firing at 1080 °C
This glaze is a frit designed for single firing on porous ceramic bodies. Its formulation contains approximately 0.4 mol of boron oxide per mole of fluxing oxides, and it is typically fired at 1080 °C using rapid firing cycles of approximately 60 min. These glazes must seal at a temperature above the thermal decomposition temperature of the carbonates to prevent deterioration of the glaze layer and bubble formation. Consequently, they must also mature within a narrow temperature interval. These requirements are met by incorporating alkaline-earth oxides (CaO and MgO) and ZnO while maintaining a balanced proportion of alkali-based fluxes and boron oxide [40].
Figure 3 and Figure 4 show the XRD of 5 wt% glazed powders in GLAZE III; Figure 17 shows images; Figure 18 shows the UV-Vis-NIR diffuse reflectance spectra; and Figure 19 shows the Colour Wheel of glazed samples.
Figure 17.
5 wt% glazed samples in GLAZE III.
Figure 18.
UV-Vis-NIR diffuse reflectance spectra of samples glazed in GLAZE III.
Figure 19.
Colour Wheel of powders 5 wt% glazed samples in GLAZE III.
All halide-free glazed samples show an opaque turquoise shade (b* = −6.10 and −13.27 for accumulative and direct firing, respectively), with high lightness (L* around 70) compared with the values obtained for the double-fired glazes discussed above. The XRD patterns of these non-mineralised glazed samples (Figure 3) reveal the crystallisation of zircon and profuse devitrification of Zn-doped anorthite, Ca2Al(SiAl)O8. Likewise, mineralised samples show an opaque blue colour (b* = −12.51 and −12.85 for accumulative and direct firing, respectively) and higher lightness than the non-mineralised samples (L* around 82). The XRD patterns show the presence of zircon and profuse crystallisation of anorthite (Figure 4). The extensive devitrification of anorthite induces glaze opacification, resulting in high L* values, particularly in the mineralised samples.
The UV-Vis-NIR diffuse reflectance spectra of the glazed samples fired at 1000 °C (Figure 18) show the same absorption bands (reflectance minima) previously described for the powders. As observed for the powders, the non-mineralised glazed samples fired at 1000 °C show lower reflectance than the mineralised samples, in agreement with their higher colour intensity (lower L* values). The mineralised samples exhibit a slightly higher and broader reflectance band around 470 nm, indicating more efficient reflection in the blue region of the visible spectrum. In the colour wheel shown in Figure 19, the colours of the non-mineralised samples are located towards the greener region. The stability of the halide-free powders in this glaze is very similar to that of the mineralised powders in Glaze III, where the profuse crystallisation of anorthite causes a marked opacification of the glaze.
As observed for the other glazes studied, the pronounced colour change from the powders to the glazed samples demonstrates a cyan pigment capability comparable to mineralised powders, despite the yellow-green colour of the powders. In effect, the blue parameter b* among the studied glazed samples corresponds to halide-free pigments in the case of the more aggressive glazes I and III (alkali glaze and ZnO-boron monoporosa glaze), only in classic non-aggressive glaze II (lead bisilicato glaze) the halide mineralised produces the best results. The alkali glaze (GLAZE I) dissolves the vanadium-doped zircon of the highly reacted mineralised powders (around 96% of zircon) that devitrifies into a profuse microcrystal of zircon, although the halide-free pigment (around 73% of zircon and 11% of unreacted ZrO2) dissolves the zirconia that prevents the dissolution of the pigmenting particles. The ZnO-boron monoporosa glaze (GLAZE III) interacts with the zircon particles and devitrifies anorthite that opacifies the glaze; this interaction is higher with halide-mineralised particles. Finally, the non-aggressive lead-bisilicato glaze (GLAZE II) maintains the main characteristics of the powders.
4. Conclusions
A systematic study was conducted on the synthesis, characterisation, and application of both halide-free and halide-mineralised vanadium-doped zircon ceramic pigments to evaluate their behaviour under successive (accumulative) and direct firing treatments, with particular emphasis on their performance in different glazes.
At low firing temperatures (750 and 850 °C), the mineralised samples produced white or colourless powders, whereas the halide-free samples appeared yellowish. The latter colouration was associated with the decomposition of ammonium metavanadate, which acts as an internal mineralizer. In contrast, the unexpected white colour of the mineralised powders may be attributed to interactions between the molten halides and vanadium, which inhibit the mineralising activity of vanadium at these temperatures.
The reactivity of the powders also depended strongly on the firing conditions. During accumulative firing, the mineralised powders formed more than 90% zircon at 1000 °C, compared with approximately 70% for the non-mineralised powders. However, under direct firing at low temperatures, the mineralised samples exhibited considerably lower zircon formation (7–8%). Although the powders differed visually, their UV–Vis–NIR spectra showed similar absorption bands associated with V4+. At 1000 °C, the halide-free powders were darker and exhibited a narrow reflection band around 540 nm, resulting in yellow-green hues, whereas the mineralised powders showed stronger reflection around 450 nm, resulting in intense blue colouration.
In the glazes, halide-free vanadium-doped zircon produced turquoise colours comparable to those obtained with the mineralised blue pigments. The interaction between the pigment and the glaze was found to control both the colour and its stability after firing. In the alkali glaze (GLAZE I), the highly reacted mineralised pigment, containing approximately 96% zircon, was attacked and partially dissolved, followed by devitrification and the formation of abundant zircon microcrystals. In contrast, the halide-free pigment, containing approximately 73% zircon and 11% unreacted ZrO2, underwent dissolution of the zirconia phase, which limited the dissolution of the pigmenting particles. The ZnO–boron monoporosa glaze (GLAZE III) interacted with the zircon particles and promoted anorthite devitrification, which contributed to glaze opacification; this interaction was more pronounced for the halide-mineralised particles. Finally, the non-aggressive lead-bisilicato glaze (GLAZE II) preserved the main characteristics of the starting powders. The highest blue b* values were obtained for the halide-free vanadium-doped zircon in both the alkali and ZnO–boron monoporosa glazes. Therefore, despite their yellow-green colouration as powders, halide-free vanadium-doped zircon pigments can be successfully used as turquoise ceramic pigments.
Author Contributions
The individual contributions are provided by the following statements: Conceptualisation, G.M.-A. and G.M.; methodology, G.M., V.E. and G.M.-A.; software, J.B., G.M. and G.M.-A.; validation, G.M. and G.M.-A.; formal analysis, G.M.; investigation, J.B., G.M. and M.L.; resources, J.B. and G.M.; writing—original draft preparation, G.M.-A. and G.M.; writing—review and editing, G.M. visualisation, J.B., V.E. and G.M.; supervision, G.M.; project administration, G.M.; funding acquisition, J.B., G.M. and M.L. All authors have read and agreed to the published version of the manuscript.
Funding
This research was funded by Universitat Jaume I. The authors gratefully acknowledge the financial support of Universitat Jaume I (UJI-B2021-73 project) and the MEFD Spain (PID2024-158224NB-I00 funded by MCIN/AEI//10.13039/501100011033 and ERDF/EU).
Institutional Review Board Statement
Not applicable.
Informed Consent Statement
Not applicable.
Data Availability Statement
Data of the reported results are available from the Inorganic Chemistry Laboratory at Jaume I University (UJI) and the Servei Central d’Instrumentació Científica (SCIC) (UJI), The original contributions presented in this study are included in the article material. Further inquiries can be directed to the corresponding author(s).
Acknowledgments
The authors acknowledge the technical support of the Servei Central d’Instrumentació Científica (SCIC) (UJI).
Conflicts of Interest
The authors declare no conflicts of interest.
References
- Seabright, C.A. Ceramic Pigments, the Harshaw Chemical CO. U.S. Patent 2,441,407, 1947. [Google Scholar]
- CPMA. CPMA Classification and Chemical Description of the Complex Inorganic Color Pigments, 4th ed.; Dry Color Manufaturers Association: Alexandria, VA, USA, 2010. [Google Scholar]
- Monrós, G.; Carda, J.; Tena, M.A.; Escribano, P.; Sales, M.; Alarcón, J. Different kinds of solid solutions in the V2O5-ZrSiO4-NaF system by sol-gel processes and their characterization. J. Eur. Ceram. Soc. 1993, 11, 77–86. [Google Scholar] [CrossRef] [Scilit]
- Grjotheim, K.; Halvorsen, V.; Holm, J.L. The Phase Diagram of the System NaF-NaCl* and Thermodynamic Properties of Fused Mixtures. Acta Chem. Scand. 1967, 21, 2300–2301. [Google Scholar] [CrossRef] [Scilit]
- Llusar, M.; Vicent, J.B.; Badenes, J.; Tena, M.A.; Monros, G. Environmental optimization of blue vanadium zircon ceramic pigment. J. Eur. Ceram. Soc. 1999, 19, 2647. [Google Scholar] [CrossRef] [Scilit]
- Ardit, M.; Cruciani, G.; Di Benedetto, F.; Sorace, L.; Dondi, M. New spectroscopic and diffraction data to solve the vanadium-doped zircon pigment conundrum. J. Eur. Ceram. Soc. 2018, 38, 5234–5245. [Google Scholar] [CrossRef] [Scilit]
- Demiray, T.; Nath, D.K.; Hummel, F.A. Zircon-vanadium blue pigment. J. Am. Ceram. Soc. 1970, 5, 1–4. [Google Scholar] [CrossRef] [Scilit]
- Marchesini, L.; Ramous, E. Sulla Struttura dei Pigmenti Verdi e Bleu Turchese Contenenti Vanadio. Vetro Silic. 1964, 45, 5. [Google Scholar]
- Di Gregorio, S.; Greenblatt, M.; Pifer, J.H.; Sturge, M.D. An ESR and optical study of V4+ in zircon-type crystals. J. Chem. Phys. 1982, 76, 2931–2937. [Google Scholar] [CrossRef] [Scilit]
- Beltrán, A.; Bohm, S.; Flores-Riveros, A.; Igualada, J.; Monrós, G.; Andrés, J. Ab initio cluster-in-the-lattice description of vanadium-doped zircon: Analysis of the impurity centers in vanadium(4+)-doped zircon (ZrSiO4). J. Phys. Chem. 1993, 97, 2555–2559. [Google Scholar] [CrossRef] [Scilit]
- Andrés, J.; Beltrán, A.; Carda, J.; Monrós, G. V4 + doping into SiO2, ZrO2 and ZrSiO4 structures. An Ab initio perturbed ion study. Int. J. Quantum Chem. 1993, 48, 175–186. [Google Scholar]
- Belgin, T. V-ZrSiO4 ceramic pigments synthesis from m-ZrO2 and different amorphous silica sources. J. Aust. Ceram. Soc. 2021, 57, 1351–1357. [Google Scholar] [CrossRef] [Scilit]
- de Waal, D.; Heyns, A.M.; Pretorius, G.; Clark, R.J.H. Raman Spectroscopic Investigations of ZrSiO4:V4+, the Blue Zircon Vanadium Pigment. J. Raman Spectrosc. 1996, 27, 657–662. [Google Scholar] [CrossRef] [Scilit]
- Xiaoyu, H.; Gui-Ru, B.; Ming-Guang, Z. The study of the optical and the EPR spectra of V4+ in zircon-type crystals. J. Phys. Chem. Solids 1985, 46, 719–720. [Google Scholar] [CrossRef] [Scilit]
- Niesert, A.; Hanrath, M.; Siggel, A.; Jansen, M.; Langer, K. Theoretical study of the polarized electronic absorption spectra of vanadium-doped zircon. J. Solid State Chem. 2002, 169, 6–12. [Google Scholar] [CrossRef] [Scilit]
- Zheng, J.; Ni, R.; Khayatnezhad, M. The design of vanadium–titanium co-doped zircon pigments and color mechanism. Sci. Rep. 2026, 16, 1728. [Google Scholar] [CrossRef] [Scilit] [PubMed]
- Monrós, G.; Carda, J.; Tena, M.A.; Escribano, P.; Ribot, F.; Sanchez, C. Vanadium clusters in doped ZrO2-SiO2 toughened ceramic composites obtained from alkoxides. Solid State Ion. 1993, 63–65, 218–225. [Google Scholar] [CrossRef] [Scilit]
- Ardizzone, S.; Cappelletti, C.; Fermo, P.; Oliva, C.; Scavini, M.; Scime, F. Structural and Spectroscopic Investigations of Blue, Vanadium-Doped ZrSiO4 Pigments, Prepared by a Sol-Gel Route. J. Phys. Chem. B 2005, 109, 22112–22119. [Google Scholar] [CrossRef] [Scilit] [PubMed]
- Monrós, G.; Badenes, J.; Llusar, M.; Esteve, V.; Monrós-Andreu, G. Effect of Microwave Synthesis on a CMY Palette of Cool Ceramic Pigments. Ceramics 2026, 9, 90. [Google Scholar] [CrossRef] [Scilit]
- Wang, T.; Liu, J.; Jiang, W.; Jiang, F.; Feng, G.; Miao, L.; Zhang, Q.; Wu, Q.; Lao, X. Fluorine-free synthesis and characterization of vanadium-zircon (V–ZrSiO4) turquoise ceramic pigment by a low temperature solid state reaction route. Ceram. Int. 2022, 48, 24044–24055. [Google Scholar] [CrossRef] [Scilit]
- Patterson, A. The Scherrer Formula for X-Ray Particle Size Determination. Phys. Rev. 1939, 56, 978–982. [Google Scholar] [CrossRef] [Scilit]
- CIE Comission International de l´Eclairage. Recommendations on Uniform Color Spaces, Colour Difference Equations, Psychometrics Colour Terms; Suplement nº2 of CIE Pub. Nº15 (E1-1.31), 1971; Bureau Central de la CIE: Paris, France, 1978. [Google Scholar]
- Miyamoto, M.; Arai, T.; Komatsu, M.; Yamamoto, V.; Mikouchi, T. Evaluation of a curve-fitting method for diffuse reflectance spectra in the UV-Visible-NIR wavelength region. Polar Sci. 2009, 3, 110–116. [Google Scholar] [CrossRef] [Scilit]
- Chung, F.H. Quantitative interpretation of X-ray diffraction patterns of mixtures. I: Matrix-flushing method for quantitative multicomponent analysis. J. Appl. Cryst. 1974, 7, 519–525. [Google Scholar] [CrossRef] [Scilit]
- Shannon, R.D. Revised effective ionic radii and systematic studies of interatomic distances in halides and chalcogenides. Acta Cryst. 1976, 32, 751–767. [Google Scholar] [CrossRef] [Scilit]
- Ubic, R.; Tolman, K.; Talley, K.R. Binay Joshi, Lattice-Constant Prediction and Effect of Vacancies in Aliovalently Doped Perovskites. J. Alloys Compd. 2015, 644, 982–995. [Google Scholar] [CrossRef] [Scilit]
- Lampe-Önnerud, C.; Thomas, J.O. Mechanisms for the thermal decomposition of NH4VO3 into V6O13, V3O7 and V2O5. J. Mater. Chem. 1995, 5, 1075–1080. [Google Scholar] [CrossRef] [Scilit]
- Chernyshov, M.V.; Polovov, I.B.; Volkovich, V.A.; Vasin, B.D.; Rebrin, O.I.; Vinogradov, K.V.; Griffiths, T.R. Electronic Absorption Spectra of Vanadium Species in Halide Melts. ECS-Electrochem. Soc. ECS Trans. 2010, 33, 7. [Google Scholar] [CrossRef] [Scilit]
- Brites, H.C.; Simoes, P.P.; Abreu, J. Zircon crystal morphology and internal structures as a tool for constraining magma sources: Examples from northern Portugal Variscan biotite-rich granite plutons. Comptes Rendus Geosci. 2014, 346, 233–243. [Google Scholar] [CrossRef] [Scilit]
- Blonski, R.P. Higher-Chroma Zircon Colors for Glaze Applications. Ceram. Eng. Sci. Proc. 1994, 15, 266–280. [Google Scholar] [CrossRef] [Scilit]
- Schabbach, L.M.; Bondioli, V.; Ferrari, A.M.; Manfredini, T.; Petter, C.O.; Fredel, M.C. Influence of firing temperature on the color developed by a (Zr,V)SiO4 pigmented opaque ceramic glaze. J. Eur. Ceram. Soc. 2007, 27, 179–184. [Google Scholar] [CrossRef] [Scilit]
- Seger, H.A. The Collected Writings of Hermann August Seger; Hecht, H.; Cramer, E., Translators; Chemical Publishing Company: Easton, PA, USA, 1902; Volume II, pp. 591–645. [Google Scholar]
- Molinari, C.; Conte, S.; Zanelli, C.; Ardit, M.; Cruciani, C.; Dondi, M. Ceramic pigments and dyes beyond the inkjet revolution: From technological requirements to constraints in colorant design. Ceram. Int. 2020, 46, 21839–21872. [Google Scholar] [CrossRef] [Scilit]
- Earl, D.A.; Clark, D.E. Effects of glazes frit oxides on crystallization and zircon pigment dissolution in whiteware coatings. J. Am. Ceram. Soc. 2000, 83, 2170–2176. [Google Scholar] [CrossRef] [Scilit]
- Murdoch, S.H.; Eppler, R.A. The Interaction of Ceramic Pigments with Glazes; Wachtman, J.B., Jr., Ed.; Book Series: Ceramic Engineering and Science Proceedings; John Wiley & Sons: Hoboken, NJ, USA, 1989. [Google Scholar] [CrossRef] [Scilit]
- Monrós, G.; Delgado, C.; Badenes, J.A.; Monrós-Andreu, G.; Llusar, M. Metallized Sol–Gel coatings on ceramic glazes with photocatalytic activity. Acad. Mater. Sci. 2024, 1, 1–22. [Google Scholar] [CrossRef] [Scilit]
- Hammond, P.W. Thorpe, Sir Thomas Edward (1845–1925), Oxford Dictionary of National, Biography; Oxford University Press: Oxford, UK, 2004. [Google Scholar] [CrossRef]
- Seger, H.A. Defects in Enamels and Their Causes; Bleininger, A.V., Ed.; Chemical Publishing Company: Easton, PA, USA, 1902. [Google Scholar]
- Tite, M.S.; Freestone, I.; Mason, R.B.; Molera, J.; Vendrell, M.; Wood, N. Lead Glazes in Antiquity—Methods of Production and Reasons for Use. Archaeometry 2007, 40, 241–260. [Google Scholar] [CrossRef] [Scilit]
- Cavalcante, P.M.T.; Dondi, M.; Guarini, G.; Raimondo, M.; Baldi, G. Colour Performance of Ceramic Nano-pigments. Dye. Pigment. 2009, 80, 226–232. [Google Scholar] [CrossRef] [Scilit]

Disclaimer/Publisher’s Note: The statements, opinions and data contained in all publications are solely those of the individual author(s) and contributor(s) and not of MDPI and/or the editor(s). MDPI and/or the editor(s) disclaim responsibility for any injury to people or property resulting from any ideas, methods, instructions or products referred to in the content. |
© 2026 by the authors. Licensee MDPI, Basel, Switzerland. This article is an open access article distributed under the terms and conditions of the Creative Commons Attribution (CC BY) license.