


Abstract
Natural lignocellulosic fibers are potential reinforcements for lightweight polymer composites, but their geometrical heterogeneity complicates mechanical characterization and material selection. This study investigated the influence of fiber diameter on the tensile behavior of commercial Typha fibers through integrated geometrical, morphological, chemical, thermal, mechanical, and statistical analyses. The fibers exhibited an apparent geometrical density of approximately 0.71 g/cm3, a moisture-related mass loss of 10.62%, and a main thermal degradation onset at 278.61 °C. Tensile properties varied markedly among diameter classes: mean tensile strength decreased from 438.85 MPa for fibers measuring 0.06–0.16 mm to 37.31 MPa for fibers measuring 0.50–0.80 mm, while Young’s modulus decreased from 7.49 to 1.43 GPa. An empirical power-law model described the relationship between class-averaged tensile strength and diameter (R2 = 0.983). Weibull moduli ranged from 2.71 to 8.30 within individual diameter classes but decreased to 1.25 when the classes were pooled. These findings indicate that combining dimensionally distinct fiber populations can substantially broaden the apparent strength distribution. Although the influence of cross-sectional geometry and intrinsic structural variability could not be separated, the results demonstrate the importance of diameter-aware characterization for reliable mechanical-property reporting and preliminary reinforcement selection. Further composite-level investigations are required to establish the practical implications of these findings.
1. Introduction
Natural lignocellulosic fibers have attracted increasing attention as potential reinforcements for polymer composites due to their renewable origin, relatively low density, widespread availability, and potential for the development of lightweight materials with reduced dependence on conventional synthetic reinforcements. In addition to their technological relevance, the use of plant-derived fibers is consistent with the growing demand for more resource-efficient material systems. Nevertheless, their incorporation into engineering applications remains challenging because their properties are influenced by biological origin, growing conditions, chemical composition, moisture content, microstructural defects, extraction procedures, and fiber geometry [1,2,3].
The development of renewable reinforcement materials is also aligned with the United Nations Sustainable Development Goals (SDGs), particularly SDG 9 (Industry, Innovation and Infrastructure) and SDG 12 (Responsible Consumption and Production) [4]. Research on lignocellulosic fibers may support these objectives by promoting innovation in material technologies, encouraging the valorization of renewable biomass, and expanding the range of resources available for composite manufacturing. In this context, the characterization of underutilized plant fibers represents an important step toward identifying alternative reinforcement materials and supporting more efficient use of biological resources. However, the sustainability of fiber-based products cannot be established solely from their renewable origin, as extraction, processing, service life, and end-of-life management must also be considered [1,2].
Natural fibers exhibit a hierarchical structure primarily composed of cellulose, hemicellulose, lignin, and minor constituents. The relative proportions and organization of these components influence technologically relevant characteristics, including stiffness, strength, moisture affinity, thermal stability, and fiber–matrix interactions. In particular, the organization of cellulose into crystalline and less ordered regions contributes to the mechanical response of lignocellulosic fibers, whereas hemicellulose, lignin, extractives, and moisture affect their physicochemical and thermal behavior. Consequently, a comprehensive evaluation of natural fibers requires complementary morphological, chemical, thermal, and mechanical characterization techniques to establish the relationships between their structural characteristics and engineering performance [1,5,6,7].
Among the available lignocellulosic resources, plants belonging to the genus Typha (family Typhaceae), commonly known as cattails and referred to as taboa in Brazil, represent a promising source of renewable biomass. The genus includes species such as Typha latifolia L. and Typha angustifolia L., which are commonly associated with wetland environments. Cattail biomass has been investigated for applications involving fibrous products, insulation materials, sorbents, and engineered bioproducts, including polymer composite reinforcements. Its availability, lignocellulosic composition, and potential for conversion into value-added materials have motivated growing scientific interest in the utilization of Typha-derived fibers [8,9].
Previous investigations have demonstrated the potential of cattail fibers for composite applications while revealing considerable variability in their properties. Shadhin et al. [9] investigated cattail-derived fibers and their use as reinforcement in polymer composites, highlighting opportunities for converting wetland biomass into engineered materials. Hossain et al. [10] evaluated the tensile behavior of cattail fibers collected at different phenological development stages, demonstrating that the mechanical response of these fibers is influenced by their biological characteristics. Manimaran et al. [11] investigated the extraction and characterization of fibers from Typha angustata, providing further evidence of their potential as lignocellulosic reinforcement materials. More broadly, the review by Parvin et al. [8] summarized developments in cattail biomass utilization, fiber production, and engineered bioproducts. Although these studies have advanced the understanding of Typha-based materials, differences in botanical origin, extraction conditions, fiber dimensions, and testing procedures complicate direct comparisons of their mechanical properties. Nevertheless, the combined assessment of diameter-dependent mechanical behavior and statistical tensile-strength distributions remains insufficiently explored, particularly for commercially available Typha fibers. This represents an important research gap, as dimensional heterogeneity may substantially influence both the measured mechanical properties and their apparent statistical variability. Addressing this limitation is essential for improving the reliability of mechanical characterization and supporting more consistent fiber selection for engineering applications.
Despite their potential advantages, natural lignocellulosic fibers exhibit several limitations that can restrict their use in engineering composites. Their hydrophilic character promotes moisture absorption and may lead to dimensional instability, changes in mechanical response, and reduced compatibility with hydrophobic polymer matrices. Their thermal sensitivity also limits the processing-temperature range available for composite manufacturing, particularly when degradation of lignocellulosic constituents may occur. In addition, variations in chemical composition, morphology, extraction history, and structural defects contribute to significant scatter in mechanical properties, which can affect reproducibility and complicate material selection [1,2,7]. These challenges are particularly relevant when fibers are intended for applications requiring predictable mechanical performance and consistent processing conditions.
An additional limitation arises from the irregular cross-sectional geometry of natural fibers. Unlike industrially manufactured reinforcements with highly controlled dimensions, lignocellulosic fibers frequently exhibit substantial geometrical and microstructural heterogeneity. Consequently, tensile strength and Young’s modulus calculated using nominal cross-sectional areas may depend strongly on the dimensions and morphology of the tested fibers. Variations in external geometry, internal structure, elementary-fiber arrangement, and the distribution of defects may contribute to differences in the apparent mechanical properties of fibers with distinct diameters. Therefore, reporting only an overall average tensile strength or elastic modulus may conceal important differences among fiber populations and lead to an incomplete assessment of their reinforcing potential [12,13].
Statistical approaches are particularly important in this context because fracture in natural fibers is influenced by structural heterogeneity and the distribution of strength-limiting defects. Inferential statistical methods can establish whether mechanical-property differences among diameter classes are statistically significant, while effect-size measures help quantify the magnitude of the observed associations. Correlation and regression analyses can describe the relationship between fiber dimensions and mechanical response, whereas Weibull statistics provide a complementary framework for characterizing tensile-strength distributions and their variability. Previous studies involving cattail, jute, and bamboo fibers have demonstrated the relevance of statistical approaches for evaluating the mechanical behavior of heterogeneous lignocellulosic materials [10,13,14].
Addressing these challenges requires an integrated experimental approach capable of relating fiber geometry, physicochemical characteristics, and mechanical behavior. Geometrical measurements and apparent-density determination provide information on dimensional heterogeneity and the relationship between external fiber dimensions and estimated material volume. Scanning electron microscopy (SEM) enables the examination of surface morphology and structural irregularities, while energy-dispersive X-ray spectroscopy (EDS) provides complementary information on detectable surface elements. Fourier-transform infrared spectroscopy (FTIR) allows the identification of functional groups associated with lignocellulosic constituents. Thermogravimetric analysis (TG), derivative thermogravimetry (DTG), differential thermal analysis (DTA), and differential scanning calorimetry (DSC) provide information on moisture-related thermal events, thermal stability, and degradation behavior, which are relevant to the selection of composite-processing conditions [15,16,17,18]. Single-fiber tensile testing, combined with systematic diameter classification, enables the investigation of geometrical effects on tensile strength, Young’s modulus, and strain at failure. The subsequent application of inferential statistics, regression analysis, and Weibull analysis allows the magnitude and variability of these effects to be assessed quantitatively [10,13,14].
Therefore, the present study provides an integrated geometrical, morphological, chemical, thermal, mechanical, and statistical characterization of commercially available Typha fibers, with particular emphasis on diameter-dependent tensile behavior. The fibers are classified into five diameter intervals to investigate the relationships between representative diameter, apparent tensile strength, Young’s modulus, and strain at failure. Statistical comparisons, effect-size analysis, empirical regression models, and Weibull statistics are employed to distinguish systematic dimensional effects from the variability observed within and across fiber populations. The main objective is to determine whether fiber diameter represents a significant parameter associated with the apparent mechanical performance and tensile-strength distribution of commercial Typha fibers. By addressing this question, the study seeks to provide a more reliable experimental basis for comparing natural-fiber populations and informing their potential selection as polymer composite reinforcements, while contributing to the broader development of renewable material technologies.
2. Materials and Methods
2.1. Raw Material
Commercially available Typha fibers were acquired from a Brazilian online supplier and used as received for experimental characterization. Since the fibers were obtained as a commercial product, detailed information regarding their geographical origin, plant growth conditions, harvesting period, and extraction procedures was unavailable. Furthermore, the botanical species could not be independently confirmed; therefore, the material was identified as Typha fibers without assigning it to a specific species. No chemical or surface treatment was applied prior to characterization, allowing the investigation of the material in its commercially supplied condition.
The experimental workflow adopted in this study is illustrated in Figure 1. Initially, 100 individual fibers were randomly selected for geometrical characterization and apparent-density determination. Based on their representative diameters, the fibers were classified into five intervals: INT01 (0.06–0.16 mm), INT02 (0.17–0.27 mm), INT03 (0.28–0.38 mm), INT04 (0.39–0.49 mm), and INT05 (0.50–0.80 mm). Approximately ten specimens from each diameter interval were subsequently selected for single-fiber tensile testing to investigate the influence of fiber diameter on tensile strength, Young’s modulus, and strain at failure.
Figure 1.
Schematic representation of the experimental workflow for commercial Typha fibers, including geometrical characterization and apparent-density determination, classification into five diameter intervals (INT01–INT05), morphological, elemental, chemical, and thermal analyses, single-fiber tensile testing, and subsequent statistical evaluation.
Complementary samples were subjected to morphological, elemental, chemical, and thermal characterization using scanning electron microscopy (SEM), energy-dispersive X-ray spectroscopy (EDS), Fourier-transform infrared spectroscopy (FTIR), thermogravimetric analysis and derivative thermogravimetry (TG/DTG), differential thermal analysis (DTA), and differential scanning calorimetry (DSC). These techniques were employed to investigate the structural and physicochemical characteristics of the commercially available fibers. Finally, the mechanical results were evaluated using descriptive and inferential statistics, regression analysis, and Weibull statistics to assess diameter-dependent behavior and tensile-strength variability. The experimental procedures and operating conditions adopted for each characterization technique are described in the following subsections.
2.2. Geometrical Characterization
A total of 100 individual filaments were randomly selected for geometrical characterization. Considering the irregular morphology of natural lignocellulosic fibers, their cross-sectional geometry was approximated as elliptical. This approximation provides a practical basis for estimating the apparent cross-sectional area, although it does not fully represent internal voids or local deviations from an ideal elliptical shape.
The dimensions of each filament were measured at five different positions along its length and in two mutually perpendicular orientations, corresponding to 0° and 90°. Measurements were performed using an MSZ5000-T-IL-TL stereoscopic microscope (A. KRÜSS Optronic GmbH, Hamburg, Germany) equipped with a 1/1.18″ camera and an MK12 C-Mount adapter.
The apparent cross-sectional area was estimated using Equation (1):
where d0 and d90 are the mean diameters measured in the two mutually perpendicular orientations.
A representative diameter was subsequently determined from the orthogonal dimensions of each filament and used for diameter-dependent classification.
The investigated fibers were divided into five diameter intervals: INT01 (0.06–0.16 mm), INT02 (0.17–0.27 mm), INT03 (0.28–0.38 mm), INT04 (0.39–0.49 mm), and INT05 (0.50–0.80 mm).
The adoption of multiple measurement positions and orthogonal orientations was intended to reduce the influence of local geometrical irregularities on cross-sectional-area estimation. This methodological consideration is supported by Thomason et al. [12], who demonstrated the importance of cross-sectional variability when determining the mechanical properties of natural fibers. Diameter-dependent mechanical behavior has also been investigated for other lignocellulosic fibers, including jute [10].
2.3. Apparent Geometrical Density
The mass of each fiber was determined using a Chyo JK analytical balance (Chyo Balance Corporation, Tokyo, Japan) with a resolution of 0.0001 g. Apparent geometrical density was calculated from the measured fiber mass, length, and estimated elliptical cross-sectional area.
The apparent geometrical density was calculated according to Equation (2):
where m is the fiber mass, A is the estimated cross-sectional area, and L is the fiber length.
This parameter is referred to as apparent geometrical density because the calculated volume is based on the external dimensions of the filament. Consequently, the resulting value may be influenced by internal cavities, porosity, and the irregular organization of elementary fibers.
The approach provides a geometrical estimate suitable for comparing the investigated fiber population but should not be interpreted as a direct measurement of the intrinsic density of the cell-wall material. The relevance of geometrical variability to the characterization of natural fibers has been discussed by Thomason et al. [12].
2.4. Scanning Electron Microscopy (SEM)
The surface morphology of the Typha fibers was investigated by scanning electron microscopy (SEM) using a Quanta FEG 250 field-emission scanning electron microscope (FEI, Hillsboro, OR, USA).
Before SEM observation, the fiber samples were coated with a thin layer of gold under vacuum to improve surface conductivity and facilitate electron imaging.
Micrographs were acquired at magnifications ranging from approximately 150× to 3000×, using an accelerating voltage of 10 kV. Different magnifications were employed to examine both the general morphology and finer structural features of the fibers.
SEM characterization was used to identify surface irregularities, morphological heterogeneity, and structural features potentially relevant to the mechanical behavior of the investigated filaments.
Previous investigations involving natural lignocellulosic fibers have demonstrated the usefulness of SEM for examining surface characteristics and structural organization. In particular, Manimaran et al. [11] employed morphological characterization to investigate fibers obtained from Typha angustata, while Silva et al. [3] investigated the structural characteristics of another natural lignocellulosic reinforcement.
2.5. Energy-Dispersive X-Ray Spectroscopy (EDS)
Energy-dispersive X-ray spectroscopy (EDS) was employed as a complementary technique to investigate the detectable elemental composition of selected regions of the Typha fiber surfaces.
EDS measurements were performed using the electron microscopy system at an accelerating voltage of 10 kV and a working distance of approximately 4.8 mm.
Elemental mapping was also conducted to investigate the spatial distribution of the detected elements over the analyzed regions.
The results were interpreted as information concerning the elemental signals detected under the adopted experimental conditions. Because the samples were coated with gold prior to electron microscopy, the possible contribution of the conductive coating must be considered when interpreting the spectra.
ASTM E1508 [19] provides guidance on quantitative EDS analysis. However, the present procedure is described as a complementary surface-element characterization, and no claim of full compliance with quantitative EDS standard requirements is made.
2.6. Fourier-Transform Infrared Spectroscopy (FTIR)
Fourier-transform infrared spectroscopy (FTIR) was performed to investigate the functional groups associated with the principal chemical constituents of the Typha fibers.
Measurements were conducted using a Spectrum Two FTIR spectrometer (PerkinElmer, Waltham, MA, USA). Before analysis, the fibers were ground into a fine powder and prepared as potassium bromide (KBr) pellets.
The infrared spectra were acquired over the wavenumber range of 4000–525 cm−1. The resulting absorption bands were examined to identify functional groups associated with the lignocellulosic structure, including chemical features related to cellulose, hemicellulose, and lignin.
The use of FTIR for the chemical characterization of natural fibers is supported by previous studies involving lignocellulosic materials, including the investigations reported by Silva et al. [3] and Manimaran et al. [11].
ASTM E1252 [20] provides general guidance for obtaining infrared spectra for qualitative analysis. In the present study, FTIR was employed for qualitative identification and interpretation of characteristic absorption bands, rather than for quantitative determination of individual lignocellulosic constituents.
2.7. Thermogravimetric Analysis (TG) and Derivative Thermogravimetry (DTG)
The thermal stability and degradation behavior of the Typha fibers were evaluated using thermogravimetric analysis (TG) and derivative thermogravimetry (DTG).
Measurements were performed using a DTG-60H thermal analyzer (Shimadzu Corp., Kyoto, Japan). Approximately 7.212 mg of fiber was placed in a platinum crucible and heated from approximately room temperature to 800 °C under a nitrogen atmosphere, at a constant gas flow rate of 50 mL min−1 and a heating rate of 10 °C min−1.
The TG curve was used to evaluate changes in sample mass during heating, whereas the DTG curve was examined to identify the temperature regions associated with the highest rates of mass loss. The simultaneously recorded differential thermal analysis (DTA) signal was also evaluated to provide complementary information on the thermal events occurring during the heating process.
This combined approach allows moisture-related mass loss and the main thermal-degradation stages of lignocellulosic materials to be investigated. Previous studies have emphasized the importance of thermogravimetric characterization for understanding the thermal behavior and processing limitations of natural fibers [16,17,18].
ASTM E1131 [21] provides a methodological reference for compositional analysis by thermogravimetry. Nevertheless, the experimental procedure adopted in the present study is reported using its actual operating conditions, without assuming complete compliance with all requirements of that standard.
The integral procedural decomposition temperature (IPDT) was calculated from the experimental TG data using the area-based approach attributed to Doyle. The sample mass was normalized to its initial value, and the areas defined by the thermogravimetric curve and the final residual-mass level were determined by numerical integration using the trapezoidal rule. The IPDT was calculated as Equations (3) and (4):
where Ti and Tf are the initial and final temperatures of the analysis, respectively. Here, S1 is the area between the normalized TG curve and the final residual-mass level, S2 is the rectangular area associated with the final residual mass, and S3 is the area between the normalized TG curve and the initial mass level. The resulting IPDT was used as an integrated indicator of the thermal decomposition behavior of the investigated fiber.
IPDT = A*K*(Tf − Ti) + Ti
2.8. Differential Thermal Analysis (DTA)
Differential thermal analysis (DTA) was employed to complement the thermogravimetric characterization of the Typha fibers.
The DTA signal was recorded simultaneously with the thermogravimetric (TG) measurements using a DTG-60H thermal analyzer (Shimadzu Corp., Kyoto, Japan). The analysis was performed under a nitrogen atmosphere at a gas flow rate of 50 mL min−1 and a heating rate of 10 °C min−1, from approximately room temperature to 800 °C.
The resulting thermal signal was evaluated to identify thermal events associated with transformations occurring during heating.
DTA results were interpreted together with the TG and DTG curves to support the identification of temperature regions associated with moisture release and the thermal degradation of lignocellulosic constituents.
The complementary use of thermal analysis techniques is consistent with previous investigations concerning the thermal characterization of natural fibers and their composites [17,18].
2.9. Differential Scanning Calorimetry (DSC)
Differential scanning calorimetry (DSC) was performed to complement the thermal characterization of the Typha fibers using a DSC-60A Plus differential scanning calorimeter (Shimadzu Corp., Kyoto, Japan).
The measurements were conducted under a nitrogen atmosphere at a heating rate of 5 °C min−1 and a gas flow rate of 20 mL min−1.
Approximately 15 mg of fiber was placed in a platinum crucible and analyzed over the temperature range of approximately 20–250 °C.
Thermal events were evaluated from the DSC curves, and the onset, peak, and endset temperatures were determined. The corresponding specific enthalpy was obtained by integrating the area associated with the investigated thermal event.
DSC was employed to complement the mass-loss information obtained by TG/DTG, providing additional information concerning thermal events within the investigated temperature interval.
The importance of complementary thermal characterization techniques for natural-fiber-based materials has been discussed by Neto et al. [18]. The interpretation of the thermal response also considered the broader behavior of lignocellulosic constituents reported in previous studies [16,17].
2.10. Single-Fiber Tensile Testing
The tensile behavior of individual Typha fibers was investigated using a procedure based on the general specimen-mounting and tensile-testing principles described in ASTM C1557-20 [22], with adaptations associated with the dimensional characteristics of the investigated fibers.
Individual filaments were mounted on 90 g/m2 paper frames and fixed using an epoxy adhesive to facilitate specimen handling and alignment during testing.
The tests were conducted using an iM-50 electromechanical universal testing machine (Intermetric, Mogi das Cruzes, São Paulo, Brazil) equipped with a 5 kN load cell. A gauge length of 15 mm and a crosshead displacement rate of 0.5 mm min−1 were adopted. The laboratory temperature recorded in the testing report was 25 °C.
For the investigation of diameter-dependent mechanical behavior, fibers from the previously characterized population were classified into five diameter intervals: INT01 (0.06–0.16 mm), INT02 (0.17–0.27 mm), INT03 (0.28–0.38 mm), INT04 (0.39–0.49 mm), and INT05 (0.50–0.80 mm).
Approximately ten specimens were selected from each interval, providing similarly sized groups for comparing the mechanical response as a function of fiber diameter.
Tensile strength, Young’s modulus, and strain at failure were determined for each specimen. The initial cross-sectional area used for calculating tensile stress was obtained from the geometrical characterization, considering the elliptical approximation described in Section 2.2 and expressed in Equation (5). The nominal tensile stress and ultimate tensile strength were calculated using Equations (6) and (7), respectively. Engineering strain was determined using Equation (8), considering the initial gauge length of 15 mm, while Young’s modulus was obtained from the slope of the approximately linear region of the stress–strain curve, as expressed in Equation (9).
The initial nominal cross-sectional area (A0) was calculated using the elliptical approximation, where d1 and d2 represent the two mutually perpendicular transverse dimensions measured for each fiber. The nominal tensile stress (σ) was obtained by dividing the applied force (F) by the initial cross-sectional area (A0), while the ultimate tensile strength (σu) was calculated from the maximum recorded force (Fmax).
Engineering strain (ε) was determined from the measured axial displacement (ΔL) relative to the initial gauge length (L0 = 15 mm). Young’s modulus (E) was calculated from the slope of the approximately linear region of the nominal stress–strain curve. As the calculations were based on the estimated external cross-sectional area and displacement measurements, the resulting mechanical properties were interpreted as apparent values.
Accordingly, the calculated tensile strength and Young’s modulus represent apparent mechanical properties based on the estimated external cross-sectional area.
The influence of fiber dimensions on tensile properties has previously been investigated in natural lignocellulosic materials. Bevitori et al. [13] evaluated the diameter dependence of jute-fiber tensile strength, while Hossain et al. [10] examined the tensile properties of cattail fibers at different phenological development stages. These studies support the importance of accounting for biological and dimensional variability when interpreting single-fiber tensile-test results.
2.11. Descriptive and Inferential Statistical Analysis
The mechanical properties were statistically analyzed according to the five previously defined fiber-diameter intervals.
Approximately ten specimens were considered per interval, with the final number of valid observations ranging from 9 to 10 depending on the mechanical property evaluated.
Descriptive statistics were calculated for tensile strength, Young’s modulus, and strain at failure, including mean, standard deviation, median, standard error, 95% confidence interval, coefficient of variation, and minimum and maximum values.
The normality of the data within each diameter interval was assessed using the Shapiro–Wilk test, whereas homogeneity of variances was evaluated using Levene’s test.
Differences among the diameter groups were assessed using analysis of variance. The statistical procedure was selected according to the variance structure of each mechanical property: Welch’s analysis of variance (Welch’s ANOVA) was adopted when the assumption of homogeneous variances was not satisfied, whereas conventional one-way ANOVA was used when homoscedasticity was supported.
Appropriate post hoc multiple-comparison procedures were subsequently applied to identify statistically significant differences among diameter intervals. Statistical significance was established at p < 0.05.
In addition to significance testing, omega-squared (ω2) was calculated as a measure of effect size to quantify the magnitude of the association between diameter classification and the investigated mechanical properties.
This statistical approach was intended to distinguish differences among diameter classes from the variability observed within each class. The need for statistical evaluation is particularly relevant for natural fibers because their mechanical behavior is influenced by geometrical heterogeneity and the distribution of structural defects [9,10,11,12].
2.12. Regression Analysis
The relationship between representative fiber diameter and mean tensile strength was investigated using linear, logarithmic, exponential, and power-law regression models.
The coefficient of determination (R2) was employed to compare the goodness of fit of the evaluated models.
The regression analysis was restricted to the investigated diameter range, and the resulting relationships were interpreted as empirical descriptions of the observed diameter-dependent behavior.
Because the regression models were fitted to the mean tensile-strength values of the five diameter intervals, the resulting coefficients of determination describe the agreement between the models and these grouped observations rather than the variability of all individual specimens.
This approach complements the inferential statistical analysis by describing the overall trend in the relationship between fiber diameter and tensile strength. Previous investigations of natural fibers have demonstrated the relevance of diameter-dependent analyses for interpreting mechanical-property variations [10].
2.13. Weibull Statistical Analysis
Tensile-strength variability was additionally evaluated using a two-parameter Weibull distribution. The cumulative probability of failure was expressed as Equation (10):
where Pf is the cumulative probability of failure, σ is the tensile stress, m is the Weibull modulus, and σ0 is the characteristic tensile strength corresponding to a cumulative failure probability of approximately 63.2%.
The Weibull analysis was employed to investigate the distribution of tensile strength and the variability associated with the investigated fiber populations.
The Weibull modulus was interpreted as a parameter associated with the dispersion of tensile-strength values, whereas the characteristic strength was used to describe the scale of the corresponding strength distribution.
The use of Weibull statistics for natural fibers is supported by previous studies involving jute and bamboo fibers [13,14]. These investigations demonstrate the relevance of statistical strength-distribution models for materials whose failure behavior is influenced by structural heterogeneity and defect populations.
In the present study, Weibull analysis was used as a complementary approach to the descriptive and inferential statistical procedures, providing additional information on tensile-strength variability within and across the investigated diameter classes.
3. Results and Discussion
3.1. Geometrical Characteristics and Apparent Density
The geometrical characterization revealed considerable dimensional variability among the investigated Typha fibers (Figure 2). The mean fiber diameter was approximately 0.31 mm, while the analyzed population covered a broad dimensional range. For subsequent evaluation, the fibers were distributed into five diameter intervals, from INT01 (0.06–0.16 mm) to INT05 (0.50–0.80 mm). The relative frequency distribution showed that a larger proportion of the analyzed fibers was concentrated within the intermediate diameter intervals, particularly between 0.17–0.27 and 0.28–0.38 mm.
Figure 2.
Geometrical characteristics of Typha fibers: (a) relative frequency distribution of fiber diameter and (b) apparent geometrical density according to diameter interval.
The broad distribution of fiber diameters reflects the geometrical heterogeneity characteristic of natural lignocellulosic fibers. Unlike manufactured reinforcing fibers, natural fibers exhibit dimensional variations associated with their hierarchical biological structure and the separation of fiber bundles into individual filaments. Thomason et al. [12] demonstrated that cross-sectional irregularities can introduce substantial differences between geometrically estimated and directly measured cross-sectional areas, affecting the interpretation of mechanical properties. In the present study, two mutually perpendicular transverse dimensions were used to approximate an elliptical cross-section, thereby accounting for part of the geometrical irregularity. Nevertheless, this approximation does not fully represent local variations in fiber geometry or internal structure. The observed diameter distribution therefore reinforces the importance of evaluating the mechanical behavior of the investigated Typha fibers according to dimensional classes rather than treating the population as geometrically homogeneous.
In addition to dimensional variability, the Typha fibers exhibited a mean apparent geometrical density of approximately 0.71 g/cm3, calculated from fiber mass, length, and the two orthogonal dimensions used to estimate the elliptical cross-sectional area. This value is lower than the densities reported by Shadhin et al. [9] for cattail fibers (1.39 ± 0.005 g/cm3) and Manimaran et al. [11] for Typha angustata fibers (1.015 g/cm3). These differences highlight the variability of reported density values among Typha-derived materials. However, direct comparison requires caution because botanical origin, fiber extraction and preparation, moisture content, and the methods used to determine fiber volume may differ among studies. In particular, the density reported here represents an apparent geometrical value based on the estimated external fiber volume, rather than the intrinsic density of the solid cell-wall constituents.
The relatively low apparent density observed in the present study is relevant when considering Typha fibers as potential reinforcements for lightweight composite materials. Nevertheless, the comparison with the literature values does not establish that the investigated fibers necessarily possess a greater internal void fraction, since differences in specimen preparation and density measurement procedures may also contribute to the observed variation.
An inverse tendency between fiber diameter and apparent geometrical density was observed, with thinner fibers generally exhibiting higher apparent density than thicker fibers. Considering the geometrical method employed, this trend suggests that increasing external fiber dimensions may not correspond to a proportional increase in solid material within the measured volume. Such behavior may be associated with the heterogeneous internal organization of lignocellulosic fibers, including the possible presence of lumens, voids, or less compact regions.
This observation is particularly relevant to the subsequent mechanical characterization because the external cross-sectional area of a natural fiber does not necessarily correspond to its effective load-bearing area. The findings of Thomason et al. [12] reinforce the importance of this distinction when evaluating mechanical properties from geometrical measurements. However, the present characterization does not provide direct evidence of internal porosity or its variation with fiber diameter. Therefore, the relationship between decreasing apparent density and increasing diameter should be interpreted as an experimentally observed geometrical trend, while explanations involving internal voids or structural discontinuities remain hypotheses requiring additional cross-sectional or three-dimensional characterization.
3.2. Morphological and Elemental Characterization
The morphology of the Typha fibers was examined by scanning electron microscopy (SEM) at different magnifications to investigate the general surface characteristics and microstructural features of the fibers, as shown in Figure 3.
Figure 3.
SEM micrographs of the surface morphology of Typha fibers at different magnifications: (a) 150×, (b) 600×, (c) 1000×, and (d) 3000×.
The SEM observations revealed a heterogeneous surface morphology, consistent with the hierarchical organization characteristic of natural lignocellulosic fibers. At lower magnification, the fiber exhibited a non-uniform surface along its longitudinal direction. At higher magnifications, irregular surface features and longitudinal structures became more evident, suggesting variations in the organization of the fibrous constituents. These observations are consistent with the general morphological complexity of natural fibers discussed by Faruk et al. [1], who emphasized the influence of biological structure and fiber characteristics on their potential use as composite reinforcements.
The morphological heterogeneity observed in the present study is also relevant to the geometrical characterization discussed in Section 3.1. Thomason et al. [12] demonstrated that irregular cross-sectional geometries can affect the estimation of natural-fiber mechanical properties, highlighting the importance of considering geometrical variability when interpreting tensile-test results. Although the present SEM observations primarily characterize the external surface, they reinforce the interpretation that Typha fibers should not be treated as perfectly homogeneous reinforcing filaments. Nevertheless, these micrographs do not establish whether larger-diameter fibers contain a greater concentration of internal defects or voids. Such conclusions would require cross-sectional imaging or complementary three-dimensional characterization.
The elemental composition of a selected region of the Typha fiber was further investigated by energy-dispersive X-ray spectroscopy. The corresponding SEM image, elemental maps, and EDS spectrum are presented in Figure 4.
Figure 4.
Scanning electron microscopy (SEM) micrograph, energy-dispersive X-ray spectroscopy (EDS) elemental maps showing the spatial distribution of carbon (C), oxygen (O), sodium (Na), potassium (K), and chlorine (Cl), and corresponding EDS spectrum obtained from a selected surface region of a Typha fiber.
The EDS spectrum indicated that carbon (C) and oxygen (O) were the predominant detectable elements in the investigated region, while signals associated with sodium (Na), potassium (K), and chlorine (Cl) were also identified. The elemental maps provided complementary information regarding the spatial distribution of these elements across the analyzed surface.
The predominance of carbon and oxygen is consistent with the lignocellulosic nature of the investigated material and agrees with the general chemical characteristics of plant-based reinforcing fibers discussed by Fuqua et al. [6]. However, this agreement should be interpreted at the elemental level, since EDS cannot distinguish among cellulose, hemicellulose, and lignin or quantify their respective proportions. Therefore, the present EDS findings support the identification of an organic, carbon- and oxygen-rich surface but do not independently establish the detailed chemical composition of the fiber.
The detection of Na, K, and Cl suggests the presence of minor inorganic constituents within the analyzed surface region. However, the specific origin of these elements remains uncertain because the fibers were commercially obtained and information regarding cultivation conditions, extraction, washing, and processing prior to commercialization was unavailable. Their presence may be associated with naturally occurring mineral constituents or residues introduced during the material’s previous handling and processing. Consequently, no specific biological or processing origin is assigned to these signals.
Taken together, the SEM and EDS results demonstrate the morphological heterogeneity and elemental characteristics of the investigated Typha fiber surface. These findings are compatible with the general structural and compositional features reported for lignocellulosic materials, while also highlighting the limitations of surface-based characterization. Since SEM/EDS does not provide direct identification of the organic functional groups, FTIR spectroscopy was subsequently employed to complement the chemical characterization of the fibers.
3.3. Chemical Characterization by FTIR
The chemical characteristics of the Typha fiber were investigated by FTIR spectroscopy, and the corresponding spectrum is presented in Figure 5. The experimental spectrum exhibited several absorption bands within the fingerprint and C–H stretching regions, with marked signals at approximately 2924, 2853, 1644, 1563, 1460, 1308, 1247, 969, and 916 cm−1. Additional signals were observed at approximately 2368 and 2335 cm−1; because absorption in this region can arise from atmospheric CO2, these bands were not used for compositional interpretation.
Figure 5.
FTIR spectrum of untreated commercial Typha fiber, showing the main absorption bands identified within the investigated spectral range. The horizontal axis represents wavenumber (cm−1), while the vertical axis represents the recorded spectral intensity in arbitrary units (a.u.). The labeled values indicate the positions of the principal spectral features.
The absorption bands at approximately 2924 and 2853 cm−1 are predominantly associated with asymmetric and symmetric C–H/CH2 stretching vibrations, respectively. Similar bands near 2914–2920 and 2850 cm−1 have been reported for cattail-derived cellulose and other lignocellulosic fibers [14]. The agreement between these spectral regions indicates the presence of aliphatic groups characteristic of carbohydrate and lignin-containing structures. However, these absorptions are not exclusive to individual lignocellulosic constituents and therefore cannot be used independently to quantify their relative proportions.
The absorption observed at approximately 1644 cm−1 requires careful interpretation because this spectral region may contain overlapping contributions. In natural lignocellulosic materials, bands near 1640–1650 cm−1 are frequently associated with H–O–H bending vibrations of absorbed water, although contributions from conjugated or aromatic structures may also occur depending on the material composition [14,15]. Considering the untreated and hydrophilic nature of the investigated fiber, absorbed moisture is a plausible contributor to this signal. This interpretation is further supported by the low-temperature mass-loss event identified by thermogravimetric analysis and the corresponding thermal event observed by DSC, as discussed in Section 3.4. Thus, the FTIR and thermal results provide complementary evidence of moisture retention in the commercial Typha fiber.
The band at approximately 1563 cm−1 occurs within a region commonly associated with aromatic skeletal vibrations of lignin. Previous investigations of lignocellulosic fibers have reported lignin-related absorptions between approximately 1500 and 1600 cm−1 [15]. Although the position of the present band is compatible with these observations, its assignment should be regarded as indicative rather than definitive because overlapping contributions and variations in lignin structure may influence the spectral response. Consequently, the absorption supports the presence of lignin-related aromatic structures but does not permit quantitative determination of lignin content.
The absorption at approximately 1460 cm−1 may be attributed to deformation vibrations involving C–H and CH2 groups in both lignin and carbohydrate constituents. Similar absorptions have been described for untreated lignocellulosic fibers, indicating that this region reflects contributions from multiple structural components rather than a single chemical constituent. Together with the bands observed at higher wavenumbers, this feature is consistent with the chemically heterogeneous character of the investigated material.
In the lower-wavenumber region, the band at approximately 1308 cm−1 is compatible with cellulose-related C–H and O–H deformation vibrations, whereas the absorption at approximately 1247 cm−1 may include C–O stretching contributions from lignin and hemicellulosic or other polysaccharide structures. Comparable bands near 1240–1245 cm−1 have been reported for natural lignocellulosic fibers. In particular, Manimaran et al. [11], investigating Typha angustata fibers, reported absorption in this region associated with lignin-containing structures. The proximity between the reported spectral feature and the band observed at 1247 cm−1 in the present study supports a broadly similar lignocellulosic chemical signature. Nevertheless, this agreement does not establish equivalent constituent concentrations or identical chemical structures between the investigated fibers.
The absorptions at approximately 969 and 916 cm−1 occur within the carbohydrate fingerprint region. Cellulose-containing fibers commonly exhibit characteristic vibrations associated with glycosidic structures near 895–900 cm−1 [14,15]. The band identified at 916 cm−1 in the present spectrum is shifted relative to this commonly reported region. Therefore, it is more appropriate to associate this signal with cellulose- or carbohydrate-related vibrations rather than assign it unequivocally to a specific β-glycosidic vibrational mode. Similarly, the absorption at 969 cm−1 is interpreted as a contribution from polysaccharide-related vibrations without assigning it exclusively to an individual constituent.
Overall, the FTIR spectrum exhibits features compatible with the presence of cellulose, hemicellulose, lignin, and absorbed moisture, in agreement with the general chemical characteristics reported for Typha and other lignocellulosic fibers [12,14,15]. The comparisons with previous studies indicate similarities in the main absorption regions while also highlighting differences in individual band positions and the limitations associated with overlapping vibrational contributions. Accordingly, the present FTIR results provide qualitative evidence of the principal chemical functionalities of the fiber but do not establish the relative concentrations of its lignocellulosic constituents. The main absorption bands and their proposed assignments are summarized in Table 1.
Table 1.
Main FTIR absorption bands identified for the untreated commercial Typha fiber and their proposed assignments.
3.4. Thermal Behavior
The thermal behavior of the Typha fiber was investigated by combining thermogravimetry (TG), derivative thermogravimetry (DTG), differential thermal analysis (DTA), and differential scanning calorimetry (DSC). The combined interpretation of these techniques provides complementary information regarding moisture release, thermal degradation, residual mass formation, and the energetic events associated with heating. The results were interpreted in relation to the thermal behavior generally reported for lignocellulosic fibers, considering the influence of chemical composition and experimental conditions.
3.4.1. TG/DTG and DTA Analyses
The TG, DTG, and DTA curves of the Typha fiber are presented in Figure 6. The thermogravimetric profile revealed two main mass-loss regions under a nitrogen atmosphere.
Figure 6.
Thermal behavior of Typha fiber under a nitrogen atmosphere: (a) thermogravimetric (TG, black curve) and derivative thermogravimetric (DTG, magenta curve) profiles, showing the remaining sample mass (%) and the corresponding mass-change rate, respectively; and (b) differential thermal analysis (DTA, blue curve), showing the differential thermal signal (µV). Temperature is expressed in °C on the horizontal axes. Dashed vertical lines indicate selected temperatures associated with the observed thermal events.
The first mass-loss event extended from approximately 22 to 102 °C, corresponding to a mass reduction of 10.62% (0.766 mg), with an onset temperature of approximately 53.09 °C. This event is predominantly attributed to the release of physically adsorbed moisture and potentially other low-volatility species retained within the hydrophilic lignocellulosic structure. Similar low-temperature mass-loss processes have been widely discussed in studies of natural fibers and are associated with their affinity for moisture [16,18]. The relatively pronounced mass reduction observed in the present study indicates that moisture-related contributions should be considered when evaluating the thermal response of the commercial Typha fibers.
This interpretation is supported by the FTIR absorption at approximately 1644 cm−1, which may include a contribution from H–O–H bending vibrations, and by the low-temperature thermal event independently identified by DSC. The agreement among these characterization techniques strengthens the interpretation of the initial TG event as predominantly moisture-related, although the individual contributions of water and other volatile species cannot be quantified separately from the available measurements.
Following the initial mass loss, the TG curve exhibited a comparatively more stable region before the onset of substantial thermal degradation. The principal mass-loss process extended from approximately 211.68 to 503.33 °C, with an onset temperature of 278.61 °C and a mass reduction of approximately 78.04% (5.628 mg). This broad degradation interval indicates that most of the organic fraction decomposed during this stage.
The occurrence of a broad, multistage degradation process is consistent with the thermal behavior of chemically heterogeneous lignocellulosic materials. Previous studies have associated overlapping mass-loss processes with the thermal decomposition of hemicellulosic constituents, cellulose, and lignin, whose degradation ranges are influenced by their structural characteristics and interactions [16]. In the present study, the DTG profile indicates changes in the mass-loss rate throughout the principal degradation interval, supporting the occurrence of overlapping thermal processes rather than a single isolated reaction. Nevertheless, individual mass-loss contributions cannot be assigned quantitatively to cellulose, hemicellulose, or lignin without additional compositional or evolved-gas analyses.
The DTA curve provides complementary information regarding the energetic events associated with heating. In addition to the low-temperature event, pronounced features were observed at approximately 332 and 462 °C. Both temperatures lie within the principal mass-loss interval identified by TG/DTG. The event near 332 °C coincides with the region of intense thermal degradation, whereas the event near 462 °C occurs during the later stages of decomposition and may involve secondary reactions and transformations of the remaining organic material and its degradation products.
These observations are compatible with the overlapping thermal processes generally described for lignocellulosic fibers [16]. However, the DTA signal was not calibrated to provide quantitative enthalpy values, and the available results do not permit unambiguous identification of the reactions responsible for each event. Accordingly, the DTA features are interpreted in conjunction with the corresponding mass-loss behavior rather than assigned to individual chemical constituents.
At the upper end of the investigated temperature range, approximately 6.0% of the initial sample mass remained. Because the analysis was performed under nitrogen, this fraction is interpreted as a combination of carbonaceous residue formed during pyrolysis and inorganic constituents. It should not be described as ash content, since the experiment did not include an oxidative stage to remove the carbonaceous fraction. The formation of a residual fraction is consistent with the carbonization processes associated with lignocellulosic thermal degradation, although its precise composition cannot be determined from TG/DTA alone.
To complement the conventional TG/DTG interpretation, the integral procedural decomposition temperature (IPDT) was calculated from the experimental thermogravimetric data, yielding a value of approximately 407.82 °C. The corresponding dimensionless parameters were A* = 0.42484 and K* = 1.16446. This integrated index accounts for the progressive mass loss throughout the investigated temperature interval and the residual fraction remaining at the end of the analysis, providing a complementary measure of the overall thermal response of the Typha fiber. Importantly, the IPDT does not represent the onset of thermal degradation or a maximum allowable processing temperature. Rather, it provides a comparative indicator of thermal stability, particularly when evaluated against other lignocellulosic materials under equivalent experimental conditions and calculation procedures.
Although the integral procedural decomposition temperature (IPDT) could be determined from the TG data, the integral procedural decomposition enthalpy (IPDH) was not calculated due to limitations of the available thermal measurements. Specifically, the DTA signal was recorded in microvolts (µV) without the calibration required for quantitative enthalpy determination. Furthermore, the DSC measurements covered only the temperature interval from 20 to 250 °C, which does not encompass the principal thermal degradation region identified by TG/DTG (211.68–503.33 °C). Consequently, the available data do not support a reliable determination of the IPDH. Reporting an estimated value under these conditions could introduce substantial uncertainty and potentially misleading interpretations. Therefore, the thermal analysis was restricted to the experimentally supported IPDT and the qualitative interpretation of the DTA and DSC results.
The main thermogravimetric events identified for the Typha fibers are summarized in Table 2, including the corresponding temperature ranges, onset temperatures, and mass-loss percentages.
Table 2.
Thermogravimetric characteristics and main mass-loss stages of untreated commercial Typha fibers under a nitrogen atmosphere.
The initial stage, occurring between approximately 22.21 and 102.01 °C, accounted for a mass loss of 10.62%, predominantly associated with moisture and low-volatility release. The principal degradation stage extended from 211.68 to 503.33 °C, with an onset temperature of 278.61 °C and a mass loss of 78.04%, reflecting the decomposition of the major lignocellulosic constituents. At approximately 800 °C, a residual fraction of 6.00% remained under the nitrogen atmosphere, comprising carbonaceous and inorganic residues. These results highlight the multistage thermal degradation behavior of the investigated fibers.
3.4.2. DSC Analysis
The DSC curve of the Typha fiber is presented in Figure 7. A broad low-temperature thermal event was observed, extending from an onset temperature of approximately 40.74 °C to an endset temperature of 115.88 °C, with a peak at 86.22 °C. Integration of the event yielded a specific enthalpy of approximately −196.46 J/g, according to the sign convention of the instrument output.
Figure 7.
Differential scanning calorimetry (DSC) thermogram of untreated commercial Typha fiber. The horizontal axis represents temperature (°C), and the vertical axis represents the measured heat flow (mW). The highlighted region indicates the integrated low-temperature thermal event, with onset, peak, and endset temperatures of 40.74, 86.22, and 115.88 °C, respectively. The enthalpy values displayed in the figure correspond to the integration shown in the original thermogram.
The broad character of this event and its occurrence below approximately 120 °C are consistent with the removal of moisture associated with the hydrophilic structure of the fiber. Similar moisture-related thermal behavior is expected in lignocellulosic materials because their polar functional groups facilitate interactions with water molecules [16,18]. In the present study, this interpretation is particularly supported by the overlap between the DSC event and the first TG mass-loss region, which extended to approximately 102 °C and accounted for 10.62% of the initial sample mass.
The correspondence between the DSC and TG results suggests that the observed calorimetric event is predominantly associated with moisture release rather than a discrete intrinsic transition of the lignocellulosic structure. Nevertheless, the enthalpy measured by DSC should not be interpreted as a direct quantitative measure of moisture content, because the thermal response may include overlapping contributions and depends on the experimental conditions.
This behavior is relevant to the potential incorporation of Typha fibers into polymer composites. Moisture retained within natural fibers may influence dimensional stability, fiber–matrix interactions, and processing behavior, particularly when elevated temperatures are employed [17]. Therefore, the present results reinforce the importance of considering fiber drying and moisture conditioning when evaluating the material for composite applications.
It should also be emphasized that the DSC analysis was limited to 250 °C and therefore did not encompass the complete principal degradation interval identified by TG/DTG. Consequently, the DSC results are used primarily to interpret the low-temperature thermal event and are not considered sufficient for quantifying the energetic contributions associated with the full thermal decomposition process.
3.4.3. Integrated Thermal Behavior
The combined thermal analyses reveal three main characteristics of the investigated Typha fibers. First, a measurable moisture-related fraction was identified through the initial TG mass loss of 10.62%, the DSC event centered at 86.22 °C, and the FTIR absorption near 1644 cm−1. Second, the material exhibited a comparatively more stable intermediate temperature region before the onset of substantial thermal decomposition. Third, the principal degradation process occurred over a broad interval, with an onset temperature of approximately 278.61 °C and the majority of the organic mass lost before approximately 503 °C.
These observations are broadly consistent with the multistage thermal behavior described for lignocellulosic materials [16,17,18]. However, differences in botanical origin, chemical composition, moisture content, sample preparation, heating rate, and atmosphere may affect the temperatures and magnitudes of the reported events. Therefore, the thermal response of the investigated commercial Typha fibers should be interpreted in the context of the specific experimental conditions employed.
From an application perspective, the results indicate that moisture management is relevant even at relatively low processing temperatures, while the onset of substantial thermal degradation imposes an additional consideration for processes involving prolonged exposure to elevated temperatures. Nevertheless, the dynamic TG onset should not be interpreted as a definitive maximum processing temperature, since actual material degradation also depends on exposure time and the processing environment.
The main thermal events identified by TG/DTG, DTA, and DSC are summarized in Table 3.
Table 3.
Main thermal events identified for the Typha fiber by TG/DTG, DTA, and DSC analyses.
3.5. Diameter-Dependent Mechanical Behavior
The mechanical response of the Typha fibers exhibited a pronounced dependence on fiber diameter. Figure 8 presents the tensile strength, Young’s modulus, and strain at failure obtained for the five investigated diameter intervals, while Table 4 summarizes the corresponding mean values and statistical groupings. Overall, tensile strength and Young’s modulus decreased markedly with increasing fiber diameter, whereas strain at failure exhibited a non-monotonic response. These results demonstrate that fiber diameter is an important source of mechanical variability within the investigated Typha population.
Figure 8.
Mechanical properties of Typha fibers according to diameter interval: (a) tensile strength and (b) Young’s modulus and strain at failure. Different letters indicate statistically significant differences among diameter intervals (p < 0.05).
Table 4.
Tensile properties of Typha fibers according to diameter interval.
The importance of dimensional variability in natural-fiber mechanical characterization has also been highlighted in previous investigations. Shadhin et al. [9] reported a diameter-dependent mechanical response in cattail fibers, while Bevitori et al. [13] investigated the relationship between fiber diameter and tensile strength in jute fibers. These findings provide a relevant basis for interpreting the present results and indicate that the mechanical characterization of heterogeneous lignocellulosic fibers should consider their dimensional distribution rather than relying exclusively on population-averaged properties.
3.5.1. Tensile Strength
Fiber diameter exerted a particularly strong influence on tensile strength. The thinnest fibers, belonging to INT01 (0.06–0.16 mm), exhibited a mean tensile strength of 438.85 ± 86.62 MPa, whereas the thickest fibers, INT05 (0.50–0.80 mm), exhibited a substantially lower mean value of 37.31 ± 13.79 MPa. The intermediate diameter groups exhibited progressively lower strengths of 131.55 ± 16.54, 89.86 ± 22.57, and 50.29 ± 19.10 MPa for INT02, INT03, and INT04, respectively.
Accordingly, the mean tensile strength of INT01 was approximately 11.8 times greater than that of INT05. The statistical comparisons confirmed significant differences among most diameter classes. INT01 differed significantly from all other groups, while INT02 and INT03 also represented statistically distinct strength populations. Only INT04 and INT05 were statistically similar (p = 0.4374), indicating that the reduction in tensile strength became less pronounced between the two largest diameter intervals.
The inverse relationship between fiber diameter and tensile strength agrees qualitatively with previous investigations of natural lignocellulosic fibers. Shadhin et al. [9] reported a reduction in the mechanical properties of cattail fibers with increasing diameter, while Bevitori et al. [13] examined the diameter dependence of jute-fiber tensile strength using a statistical approach. The agreement in the direction of the relationship is particularly relevant because the present study involves substantially larger nominal fiber dimensions than those reported for the cattail fibers investigated by Shadhin et al. [9]. This suggests that diameter-related variability may be relevant across different dimensional ranges, although the underlying mechanisms cannot be assumed to be identical.
Quantitatively, Shadhin et al. [9] reported a mean tensile strength of 172.3 ± 99.3 MPa, with individual values ranging from approximately 9 to 365 MPa. In comparison, the present Typha fibers exhibited class-averaged strengths ranging from 37.31 to 438.85 MPa. The mean strength of the thinnest class therefore exceeded the upper value of the range reported by Shadhin et al., whereas the thicker classes exhibited considerably lower mean strengths. These differences reinforce the importance of considering fiber dimensions and experimental procedures when comparing mechanical properties across studies.
Higher tensile strength has also been reported for Typha angustata fibers by Manimaran et al. [11], who obtained approximately 665 ± 7 MPa. However, this value should not be interpreted as directly equivalent to the present class-averaged results because botanical origin, extraction conditions, fiber dimensions, gauge length, and cross-sectional area determination may differ. Hossain et al. [10] likewise documented substantial variability in the tensile behavior of cattail fibers, emphasizing the influence of material characteristics and biological development on the reported properties.
The observed diameter dependence may be interpreted considering both geometrical heterogeneity and the statistical nature of fracture. Natural fibers can exhibit irregular cross-sections, local variations in fibrillar organization, lumens, and other structural discontinuities. Consequently, the external dimensions used to calculate nominal tensile stress do not necessarily represent the effective load-bearing area. Thomason et al. [12] demonstrated the importance of cross-sectional geometry in natural-fiber mechanical characterization, supporting the need for caution when comparing nominal tensile strengths obtained using different area-estimation procedures.
A size-dependent contribution may also arise from the probability of encountering strength-limiting heterogeneities. In a heterogeneous material, increasing the amount of material subjected to tensile loading may increase the likelihood of encountering a critical discontinuity capable of initiating failure. This interpretation is compatible with the statistical approach adopted by Bevitori et al. [13] and provides a conceptual connection with the Weibull analysis presented in Section 3.8.
In the present study, the inverse relationship between tensile strength and diameter is additionally consistent with the reduction in apparent geometrical density observed for thicker fibers. Nevertheless, the SEM observations primarily characterize the external surface and do not demonstrate a systematic increase in internal voids or defects with diameter. Therefore, variations in effective load-bearing area and defect distribution remain plausible explanations rather than experimentally established mechanisms.
Thus, the tensile strength results demonstrate that the mechanical performance of the investigated Typha fibers cannot be adequately represented by a single population-averaged value. Diameter-based classification is essential for interpreting the observed strength distribution and for comparing the material with previously reported natural-fiber properties.
3.5.2. Young’s Modulus
Young’s modulus exhibited a diameter dependence similar to that observed for tensile strength. INT01 showed the highest mean modulus, 7.49 ± 2.10 GPa, followed by INT02 (3.97 ± 0.96 GPa) and INT03 (2.73 ± 1.07 GPa). The two largest diameter groups exhibited substantially lower values, with mean moduli of 1.51 ± 0.45 GPa for INT04 and 1.43 ± 0.38 GPa for INT05.
Thus, the mean Young’s modulus decreased by approximately 81% from INT01 to INT05. Statistical grouping further supported this trend: INT01 formed a distinct group (a), INT02 and INT03 were statistically similar (b), and INT04 and INT05 constituted the lowest-modulus group (c).
A comparable inverse relationship between fiber diameter and Young’s modulus was reported by Shadhin et al. [9] for cattail fibers. However, the absolute stiffness values differed substantially. Shadhin et al. reported a mean Young’s modulus of 19.1 ± 9.6 GPa, whereas the present study yielded class-averaged values between 1.43 and 7.49 GPa. Manimaran et al. [11] reported an even higher modulus of 27.45 ± 3.46 GPa for Typha angustata fibers. These comparisons indicate that the present commercial Typha fibers exhibited lower apparent tensile stiffness than the materials characterized in those studies.
The differences should not be attributed exclusively to botanical or structural characteristics. Young’s modulus calculated from nominal stress–strain curves depends on the cross-sectional area adopted for stress normalization, while the experimental determination of strain may also be affected by the measurement procedure, specimen alignment, and testing configuration. In particular, the present values were obtained using an elliptical approximation of the external fiber cross-section. Therefore, they should be interpreted as apparent Young’s moduli rather than intrinsic stiffness values of the solid cell-wall material.
The simultaneous decrease in tensile strength and Young’s modulus is particularly relevant because it indicates that the observed diameter dependence is not restricted to the final fracture event. Whereas tensile strength is strongly influenced by critical heterogeneities controlling failure, Young’s modulus reflects the initial tensile stiffness. The reduction in both properties with increasing diameter suggests that geometrical and structural heterogeneity may influence the effective fraction of the cross-section participating in load transfer.
This interpretation is consistent with the methodological considerations raised by Thomason et al. [12] regarding the influence of natural-fiber cross-sectional geometry on calculated mechanical properties. Nevertheless, the present results do not establish a unique microstructural mechanism responsible for the reduction in modulus. The elliptical approximation accounts for part of the external geometrical irregularity but does not resolve internal morphology or local variations along the gauge length.
From an application perspective, the pronounced variation in stiffness among diameter classes indicates that using a single Young’s modulus to represent a broadly distributed Typha fiber population may conceal substantial differences in reinforcement behavior. Accordingly, dimensional classification should be considered when selecting representative mechanical parameters for subsequent composite-material studies.
3.5.3. Strain at Failure
Unlike tensile strength and Young’s modulus, strain at failure did not exhibit a monotonic decrease with increasing fiber diameter. INT01 showed the lowest mean strain, approximately 0.05 ± 0.01 mm/mm, whereas INT02 and INT03 reached approximately 0.10 ± 0.02 and 0.10 ± 0.01 mm/mm, respectively. INT04 exhibited a comparable mean strain of 0.09 ± 0.02 mm/mm, followed by a reduction to 0.07 ± 0.01 mm/mm for INT05.
The statistical groupings reflected this non-monotonic response. INT02, INT03, and INT04 were statistically similar and formed group (a), whereas INT05 was assigned to group (b) and INT01 to group (c). Consequently, the relationship between diameter and deformation capacity differed substantially from the systematic inverse trends observed for tensile strength and Young’s modulus.
The distinction among mechanical properties is important when comparing the present results with previous studies. Although Shadhin et al. [9] and Bevitori et al. [13] provide relevant evidence of diameter-dependent mechanical behavior in natural fibers, the trends reported for strength or stiffness should not automatically be extended to strain at failure. The present findings indicate that deformation capacity may respond differently to dimensional variability, even when strength and modulus exhibit pronounced and statistically significant reductions.
The thinnest fibers combined the highest tensile strength and stiffness with the lowest strain at failure, whereas intermediate-diameter classes exhibited greater deformation before rupture despite their lower strength and modulus. This behavior suggests that the mechanical response cannot be explained solely by the geometrical normalization used to calculate tensile stress. Unlike nominal tensile strength and Young’s modulus, engineering strain is calculated from deformation relative to the initial gauge length and does not directly depend on the estimated cross-sectional area.
The observed strain response may therefore involve a combination of geometrical heterogeneity, local structural organization, deformation mechanisms, and the distribution of strength-limiting discontinuities. However, the present characterization does not provide sufficient evidence to identify the relative contributions of these factors. Furthermore, quantitative comparisons of strain at failure across studies require particular caution because differences in gauge length, strain measurement, specimen preparation, and testing configuration can influence the reported values.
Taken together, the results demonstrate that the influence of fiber diameter is property-specific. Tensile strength exhibits the strongest systematic reduction with increasing diameter, Young’s modulus follows a similar trend, and strain at failure shows a non-monotonic response. This distinction is further supported by the statistical effect-size analysis presented in Section 3.6 and reinforces the importance of considering dimensional variability when interpreting the mechanical behavior of natural-fiber populations.
3.6. Statistical Effect of Fiber Diameter
The statistical analysis confirmed that fiber diameter was strongly associated with the mechanical response of the investigated Typha fibers. Significant differences among diameter intervals were observed for tensile strength, Young’s modulus, and strain at failure (p < 0.001). However, statistical significance alone does not indicate the magnitude of these differences. Therefore, omega-squared (ω2) was additionally used to quantify the magnitude of the effect associated with diameter grouping. The results of the global statistical comparisons, Levene’s test, and effect-size analysis are summarized in Table 5.
Table 5.
Statistical significance and effect size of fiber diameter on the tensile properties of Typha fibers.
The strongest effect was observed for tensile strength, with ω2 = 0.926, followed by Young’s modulus (ω2 = 0.781) and strain at failure (ω2 = 0.594). This ranking is consistent with the mechanical trends described in Section 3.5. Tensile strength exhibited the most pronounced and systematic variation among diameter classes, decreasing substantially from INT01 to INT05. Young’s modulus followed a similar diameter-dependent trend, although with less pronounced separation among the intermediate and larger diameter groups. Strain at failure, despite exhibiting significant differences among classes, showed the lowest effect size and a non-monotonic relationship with diameter.
The difference in effect magnitude among the three properties demonstrates that dimensional variability is not equally associated with all aspects of the tensile response. The exceptionally large ω2 obtained for tensile strength indicates that a substantial proportion of the observed variance is statistically associated with diameter-group membership. The similarly large, although lower, effect observed for Young’s modulus indicates that this association extends beyond fracture strength to the apparent stiffness of the fibers. In contrast, the lower ω2 obtained for strain is consistent with its non-monotonic behavior and indicates a less systematic association with fiber diameter.
Levene’s test additionally indicated heterogeneity of variances for tensile strength and Young’s modulus (p < 0.001), whereas the assumption of variance homogeneity was not rejected for strain (p = 0.453). The heteroscedastic behavior of strength and modulus further reflects the diameter-dependent distribution of these properties and supports the use of statistical procedures that do not assume equal variances when comparing the corresponding diameter groups.
Taken together, the significance tests and effect-size analysis demonstrate that fiber diameter should not be treated merely as a secondary source of experimental scatter. Instead, diameter classification captures systematic differences in the mechanical response of the investigated fiber population, with the strongest influence observed for tensile strength. This result provides the statistical basis for the quantitative diameter–strength relationship examined in Section 3.7.
3.7. Diameter-Strength Relationship
The relationship between representative fiber diameter and class-averaged tensile strength was further investigated through regression analysis using the mean values of the five diameter classes. Linear, logarithmic, exponential, and power-law models were evaluated to determine which mathematical relationship best described the experimental trend (Figure 9). Among the investigated models, the power-law function provided the highest coefficient of determination, resulting in:
where σ is the mean tensile strength in MPa and d is the representative fiber diameter in mm. The negative exponent confirms the pronounced inverse and nonlinear relationship between fiber diameter and mean tensile strength within the investigated dimensional range. According to the fitted model, changes in diameter are associated with a particularly strong variation in tensile strength toward the lower end of the diameter distribution, whereas the reduction becomes progressively less pronounced as fiber diameter increases. This behavior is consistent with the experimental results presented in Section 3.5, in which the greatest differences in mean strength were observed among the thinner diameter classes, while INT04 and INT05 exhibited statistically similar tensile strengths.
σ = 18.032d−1.404
R2 = 0.983
Figure 9.
Relationship between representative fiber diameter and class-averaged tensile strength of Typha fibers. Data are presented as mean ± standard deviation, and the solid curve represents the fitted power-law model.
The power-law relationship is also compatible with the size-dependent behavior discussed previously. In heterogeneous natural fibers, an increase in external dimensions does not necessarily correspond to a proportional increase in effective load-bearing material. Variations in cross-sectional geometry, internal organization, and the distribution of structural heterogeneities may cause the nominal cross-sectional area to increasingly differ from the area effectively involved in axial load transfer. In addition, larger fiber dimensions may increase the probability of sampling strength-limiting heterogeneities along the tested material. These mechanisms provide plausible physical explanations for the systematic reduction in nominal tensile strength with increasing fiber diameter.
However, the exponent obtained from the power-law model should not be interpreted as a universal scaling parameter for Typha fibers. The present regression was derived from the representative mean values of only five diameter classes rather than from specimen-level observations across a continuous diameter distribution. Consequently, the high coefficient of determination primarily demonstrates that the power-law function provides an excellent empirical description of the class-averaged behavior observed in the present dataset. It does not, by itself, establish a fundamental scaling law or demonstrate a unique causal mechanism between diameter and tensile strength.
Furthermore, because tensile stress was calculated using the nominal cross-sectional area estimated from the measured external dimensions, part of the observed diameter dependence may reflect the increasing difference between nominal and effective load-bearing areas in geometrically heterogeneous fibers. Therefore, the fitted relationship should be interpreted as describing the dependence of the experimentally determined nominal tensile strength on the measured fiber diameter under the geometrical assumptions adopted in this study.
Despite these limitations, the regression analysis provides a useful quantitative representation of the strong dimensional dependence identified independently by the mechanical and statistical analyses. The power-law trend is consistent with the significant differences among diameter classes and the large effect size obtained for tensile strength. The Weibull analysis presented in Section 3.8 provides a complementary statistical perspective by evaluating how the separation of fibers according to diameter also affects the apparent strength distribution and its variability.
3.8. Weibull Analysis of Tensile Strength
The variability of the tensile strength of the Typha fibers was further investigated using a two-parameter Weibull distribution. This analysis is particularly relevant for natural fibers because their mechanical behavior is influenced by geometrical irregularities and structural heterogeneity, resulting in considerable specimen-to-specimen variability [14]. The Weibull parameters obtained for each diameter interval and for the overall fiber population are summarized in Table 6.
Table 6.
Two-parameter Weibull parameters for the tensile strength of Typha fibers according to diameter interval and for the overall fiber population.
The characteristic tensile strength, σ0, followed the same general diameter dependence observed for the mean tensile strength. The highest characteristic strength was obtained for INT01, reaching 474.97 MPa, followed by substantial decreases to 139.13, 98.80, 56.75, and 42.26 MPa for INT02, INT03, INT04, and INT05, respectively. Thus, the Weibull analysis reinforces the pronounced reduction in mechanical performance associated with increasing fiber diameter.
The Weibull modulus, m, which describes the dispersion of the strength distribution, varied considerably among the diameter classes. Values of 5.40, 8.30, 4.27, 2.76, and 2.71 were obtained for INT01 through INT05, respectively. Among the individual groups, INT02 exhibited the highest Weibull modulus (m = 8.30), indicating the lowest relative strength dispersion according to the fitted Weibull distribution. Conversely, INT05 exhibited the lowest Weibull modulus among the diameter-controlled groups (m = 2.71), indicating greater relative variability in tensile strength within this class [14].
It is important to note that a higher Weibull modulus does not necessarily correspond to higher tensile strength. INT01 exhibited by far the highest characteristic strength (σ0 = 474.97 MPa), whereas INT02 presented the highest Weibull modulus. Therefore, σ0 and m describe complementary but distinct aspects of the mechanical response: the former represents the characteristic strength level, while the latter reflects the dispersion and reliability of the strength distribution. The two-parameter Weibull distributions obtained for the individual diameter intervals and for the overall fiber population are presented in Figure 10.
Figure 10.
Two-parameter Weibull distributions of tensile strength for the five Typha fiber diameter intervals and the overall fiber population.
A particularly relevant result was obtained when fibers from all diameter intervals were considered as a single population. In this case, the Weibull modulus decreased to only 1.25, substantially below the values obtained for the individual diameter-controlled groups (2.71–8.30). The overall population exhibited a characteristic strength of 145.71 MPa, with a coefficient of determination of R2 = 0.880.
The pronounced decrease in Weibull modulus for the overall population demonstrates that combining fibers from dimensionally distinct classes substantially broadens the apparent tensile-strength distribution. This behavior is consistent with the strong diameter dependence identified by the mechanical comparisons and power-law regression. Because each diameter class exhibits a distinct characteristic strength level, their combination produces a heterogeneous strength population and consequently reduces the apparent Weibull modulus. Thus, part of the strength variability observed when the fibers are analyzed as a single population can be attributed to uncontrolled dimensional heterogeneity rather than exclusively to intrinsic specimen-to-specimen variability.
This finding has an important implication for the mechanical characterization of Typha fibers. The results indicate that uncontrolled diameter variation constitutes an important contributor to the apparent tensile-strength variability of the investigated fiber population. Consequently, reporting a single strength distribution without considering fiber dimensions may obscure systematic differences among diameter classes and may lead to an overly broad representation of the intrinsic mechanical variability of the material.
From an application perspective, fiber selection or classification according to diameter may therefore contribute to more consistent reinforcement properties. This consideration is particularly relevant for polymer composites, in which variations in fiber strength and stiffness can affect stress transfer and the reproducibility of composite performance. The present results suggest that controlling the dimensional distribution of Typha fibers could improve the consistency of their mechanical response, although the practical benefits of such classification during large-scale processing require further investigation.
3.9. Integrated Interpretation of Diameter-Dependent Behavior
The combined geometrical, mechanical, and statistical results demonstrate that fiber diameter is systematically associated with the measured mechanical response of the investigated commercial Typha fibers. The decrease in apparent geometrical density with increasing diameter, together with the heterogeneous morphology observed by SEM, indicates that the fibers cannot be regarded as geometrically homogeneous reinforcing elements. Because tensile stress and Young’s modulus were calculated using nominal cross-sectional dimensions, differences between nominal and effective load-bearing areas may contribute to the observed diameter dependence. However, the internal structural mechanisms responsible for this behavior cannot be established from the present surface-morphology observations alone.
The statistical analyses provide independent evidence of this dimensional dependence. Diameter grouping produced particularly large effects on tensile strength and Young’s modulus, while strain exhibited a weaker and non-monotonic response. In addition, class-averaged tensile strength followed a strong empirical power-law relationship with representative diameter within the investigated range. These results demonstrate that diameter is not merely a geometrical parameter used for stress normalization but is associated with systematic differences in the measured mechanical response.
The Weibull analysis further shows that dimensional heterogeneity contributes substantially to the apparent strength variability of the overall fiber population. Separating the fibers according to diameter resulted in Weibull moduli of 2.71–8.30, whereas combining all diameter classes reduced the modulus to 1.25. Therefore, mechanical properties of Typha fibers should be interpreted together with the dimensional distribution of the tested population. Diameter-based classification may provide a more representative basis for comparing fiber properties and selecting Typha fibers for composite reinforcement.
3.10. Comparison with the Literature and Implications for Natural-Fiber Characterization
The mechanical properties obtained in the present study are compared with the selected literature data for Typha/cattail and other lignocellulosic fibers in Table 7.
Table 7.
Comparison of the mechanical behavior of the investigated Typha fibers with selected Typha/cattail and lignocellulosic-fiber studies.
The mechanical properties obtained for the investigated commercial Typha fibers lie within the exceptionally broad property envelope reported for cattail fibers, but the comparison in Table 7 also shows that absolute values vary markedly among studies. Hossain et al. [10], summarizing previous cattail data, reported tensile strengths of approximately 30–1106 MPa and Young’s moduli of 3.0–74.7 GPa. Such dispersion indicates that a single literature value cannot adequately represent the mechanical behavior of Typha-derived fibers. Botanical origin, plant maturity, extraction and conditioning history, moisture state, fiber dimensions, gauge length, and especially the method used to define cross-sectional area can all affect the nominal properties obtained in single-fiber tensile tests.
A particularly relevant comparison is provided by Shadhin et al. [9], who reported a mean cattail-fiber diameter of 32.1 ± 8.6 µm, a tensile strength of 172.3 ± 99.3 MPa, and a tensile modulus of 19.1 ± 9.6 GPa. Their individual measurements covered approximately 9–365 MPa in strength and 3–40 GPa in modulus, and both properties decreased with increasing fiber diameter. The present results therefore reproduce the same qualitative diameter dependence in an independent commercial Typha population, although over a substantially broader dimensional range. Mean tensile strength decreased from 438.85 MPa in INT01 (0.06–0.16 mm) to 37.31 MPa in INT05 (0.50–0.80 mm), while Young’s modulus decreased from 7.49 to 1.43 GPa. The significance of the present data is therefore not simply the observation that thinner fibers exhibit higher nominal properties, but the quantitative demonstration that dimensional classification strongly reorganizes both the measured mechanical response and its statistical distribution.
Considerably higher mechanical properties have been reported for Typha angustata. Manimaran et al. [11] obtained a tensile strength of 665 ± 7 MPa and a Young’s modulus of 27.45 ± 3.46 GPa, together with a density of 1.015 g/cm3 and a cellulose content of 73.54 wt.%. These values exceed most of those measured for the commercial fibers investigated here. Nevertheless, direct ranking of the two materials would be inappropriate because species, extraction history, chemical composition, moisture condition, fiber geometry, and testing procedures differ. The contrast instead reinforces a central feature of natural-fiber characterization: reported mechanical properties are population- and method-dependent and should be interpreted together with the dimensional and experimental conditions under which they were obtained.
Cross-sectional-area determination is especially important when interpreting diameter-dependent tensile properties. Thomason et al. [12] demonstrated for flax and sisal that cross-sectional areas estimated from conventional diameter measurements could exceed values obtained from direct observation of the actual cross-sections by more than a factor of two. Because both tensile strength and Young’s modulus are normalized by cross-sectional area, such discrepancies propagate directly into the calculated properties. Moreover, the magnitude of the area-estimation error was shown to scale with measured fiber diameter, meaning that geometrical simplification can generate or amplify an apparent inverse relationship between diameter and mechanical properties.
This methodological issue is directly relevant to the present study. Measuring two mutually perpendicular dimensions and approximating the cross-section as elliptical provides a more representative geometrical description than a single-diameter circular assumption; however, it cannot fully reproduce irregular external boundaries, internal lumens, voids, or local cross-sectional variations. Consequently, the tensile strength and Young’s modulus reported here should be interpreted as apparent or nominal properties based on the measured external geometry. The observed diameter dependence may therefore incorporate both genuine structural size effects and geometrical normalization effects. The available measurements do not permit these contributions to be separated, and the trend should not be attributed exclusively to a higher defect population in thicker fibers without direct cross-sectional evidence.
The inverse strength–diameter relationship is not restricted to Typha. Bevitori et al. [13] used Weibull statistics to analyze jute fibers and confirmed an inverse dependence between tensile strength and fiber diameter. Together with the cattail results of Shadhin et al. [9], this evidence indicates that dimensional heterogeneity is a broader methodological and mechanical issue in lignocellulosic-fiber characterization. Accordingly, reporting only a global mean strength without describing the dimensional distribution of the tested population can obscure systematic differences among fiber subpopulations.
The statistical results of the present study provide an additional perspective on this problem. Diameter grouping produced very large effect sizes for tensile strength (ω2 = 0.926) and Young’s modulus (ω2 = 0.781), indicating that the predefined dimensional classes were strongly associated with the observed mechanical variation. In parallel, the class-averaged tensile strength followed an empirical power-law relationship with representative diameter (R2 = 0.983) within the investigated range. Although this regression is based on five class means and should not be interpreted as a universal scaling law, its consistency with the inferential analysis supports the conclusion that diameter acts as a systematic experimental variable rather than merely as uncontrolled scatter.
The Weibull analysis provides the most distinctive evidence for the effect of dimensional classification on apparent strength variability. Hossain et al. [10] demonstrated the applicability of two-parameter Weibull models to cattail fibers collected at different phenological stages and showed that Weibull statistics can effectively describe the broad scatter characteristic of these natural materials. In the present study, however, a clear contrast emerged between dimensionally controlled and pooled populations: the Weibull modulus ranged from 2.71 to 8.30 within the individual diameter classes but decreased to only 1.25 when all classes were combined. This reduction indicates that the broad distribution obtained for the overall population is not necessarily attributable solely to random intrinsic heterogeneity. Instead, the superposition of subpopulations having systematically different dimensions and characteristic strength levels can itself broaden the apparent strength distribution.
This distinction has direct implications for both material characterization and composite design. A low Weibull modulus obtained from an unclassified natural-fiber population may combine intrinsic material scatter with systematic dimensional heterogeneity. Diameter-aware sampling and reporting can therefore improve comparisons among fiber sources and provide more representative input data for reinforcement selection. This does not imply that thinner fibers will necessarily produce proportionally stronger composites, because composite performance additionally depends on fiber–matrix adhesion, aspect ratio, orientation, fiber volume fraction, processing-induced damage, and stress-transfer efficiency. Rather, dimensional control provides a more rigorous basis for separating one important source of variability before composite-level effects are considered.
From a sustainability perspective, the present findings may contribute to the development of renewable reinforcement materials in the context of SDG 9 and SDG 12 [4]. The relatively low apparent geometrical density of the investigated Typha fibers (approximately 0.71 g/cm3), together with the pronounced dependence of tensile properties on fiber diameter, highlights the importance of appropriate material characterization and selection for potential lightweight composite applications. The results indicate that dimensional classification can improve the interpretation of mechanical-property distributions and provide a more consistent basis for comparing heterogeneous fiber populations. Such knowledge may support the efficient utilization of lignocellulosic resources and the development of renewable material technologies. However, the present investigation was restricted to fiber-level characterization and did not include composite manufacturing, durability testing, or life-cycle assessment. Consequently, any environmental benefits associated with the use of Typha fibers remain to be demonstrated through further investigations addressing composite performance, processing efficiency, service life, and environmental impacts.
Thus, comparison with previous studies shows that the contribution of the present work extends beyond the determination of the physicochemical and mechanical properties of commercial Typha fibers. By integrating systematic diameter classification with tensile testing, inferential statistics, effect-size analysis, empirical regression, and Weibull statistics, this study provides evidence that dimensional heterogeneity is systematically associated with both the apparent mechanical response and the resulting strength distribution. The markedly higher Weibull moduli obtained for diameter-controlled groups compared with the unclassified population further indicate that pooling dimensionally distinct fibers can amplify apparent mechanical variability. These findings support diameter-aware characterization as an important methodological step toward more reliable comparison, selection, and engineering use of heterogeneous lignocellulosic fibers as composite reinforcements.
3.11. Potential Industrial Applications and Limitations
The experimental results indicate that commercial Typha fibers may be considered as potential reinforcements for lightweight polymer composites, particularly in non-structural or low-load-bearing applications. Possible examples include interior panels, decorative components, furniture elements, and non-load-bearing coverings. These applications are proposed as prospective areas of investigation rather than demonstrated end uses, since the present study characterized individual fibers and did not evaluate manufactured composite components.
The relatively low apparent geometrical density of approximately 0.71 g/cm3 is potentially advantageous for applications in which component mass is an important design consideration. Furthermore, the thinnest diameter class (INT01) exhibited a mean tensile strength of 438.85 ± 86.62 MPa and a Young’s modulus of 7.49 ± 2.10 GPa, suggesting that diameter-controlled fiber selection may provide an opportunity to improve the consistency of reinforcement properties. However, these single-fiber results cannot be directly translated into composite strength or stiffness without accounting for fiber orientation, volume fraction, aspect ratio, fiber–matrix adhesion, and processing-induced damage.
From an industrial perspective, one of the main limitations is the substantial variability in fiber diameter and mechanical response. The marked differences observed among diameter classes indicate that uncontrolled mixing of fibers may result in heterogeneous reinforcement batches. Accordingly, industrial implementation would require appropriate fiber selection, dimensional classification, and quality-control procedures. The feasibility and economic implications of these operations would need to be evaluated at a larger production scale.
Moisture sensitivity represents another important consideration. The initial TG mass loss of approximately 10.62%, together with the low-temperature DSC event, indicates that moisture management is relevant to the investigated commercial fibers. In composite manufacturing, residual moisture may affect processing and fiber–matrix interactions. Therefore, drying procedures, storage conditions, and moisture-conditioning protocols would need to be established and validated before industrial application.
Thermal processing conditions also require attention. The principal thermogravimetric degradation stage exhibited an onset temperature of approximately 278.61 °C under nitrogen at a heating rate of 10 °C/min. Although this result provides useful information for preliminary material selection, it does not define a universally safe processing temperature. Thermal degradation depends on exposure time, atmosphere, and processing conditions. Consequently, the compatibility of Typha fibers with specific polymer matrices and manufacturing processes must be verified experimentally.
Additional limitations include the absence of direct measurements of fiber–matrix interfacial adhesion, composite mechanical performance, long-term durability, water absorption, and environmental resistance. Moreover, the botanical species and prior processing history of the commercially supplied fibers were not independently established. These factors may affect material consistency, traceability, and reproducibility in industrial supply chains.
Therefore, the present findings support the potential of diameter-classified Typha fibers as candidates for lightweight polymer reinforcement, while emphasizing that industrial implementation remains dependent on further validation. Future investigations should address composite fabrication, fiber surface treatments, interfacial characterization, moisture conditioning, durability, and the technical and economic feasibility of large-scale fiber classification and processing.
4. Conclusions
This study investigated the diameter-dependent mechanical behavior of commercial Typha fibers through an integrated approach combining physicochemical characterization, tensile testing, and statistical analysis. The results demonstrated that fiber diameter is strongly associated with the apparent tensile properties of the investigated material, highlighting the importance of dimensional heterogeneity in natural-fiber characterization.
The principal findings are summarized as follows:
- The fibers exhibited considerable geometrical heterogeneity and an apparent geometrical density of approximately 0.71 g/cm3. Thermal analysis revealed a moisture-related mass loss of 10.62% and a main degradation onset at 278.61 °C, indicating that moisture conditioning and thermal exposure should be considered in subsequent processing studies.
- Mean tensile strength decreased from 438.85 MPa in the smallest diameter class (0.06–0.16 mm) to 37.31 MPa in the largest class (0.50–0.80 mm). Young’s modulus similarly decreased from 7.49 to 1.43 GPa. Statistical effect-size analysis confirmed a strong association between diameter classification and these mechanical properties.
- The relationship between class-averaged tensile strength and diameter was described by an empirical power-law model (R2 = 0.983). However, this relationship was established using five diameter-class means and should not be interpreted as a universal material law.
- Weibull moduli ranged from 2.71 to 8.30 for individual diameter classes but decreased to 1.25 for the pooled population. This contrast indicates that combining dimensionally distinct fiber groups can increase apparent strength variability and complicate the interpretation of fiber reliability.
Overall, the main contribution of this work is demonstrating that diameter classification is essential for interpreting the mechanical behavior and statistical strength distributions of the investigated Typha fibers. Nevertheless, the reported tensile properties are based on nominal cross-sectional areas, and the relative contributions of intrinsic structural variability and geometrical effects remain unresolved. Future research should examine actual load-bearing cross-sections, fiber–matrix interactions, composite performance, and long-term durability before the industrial suitability of these fibers can be established.
Author Contributions
Conceptualization, methodology, investigation, data curation, and writing—original draft preparation, D.S.S.; formal analysis, D.S.S., R.F.P.J., D.d.C.B.N., A.M.d.A. and B.Z.M.; writing—review and editing, S.N.M. and P.H.P.M.d.S.; supervision, S.N.M. and P.H.P.M.d.S.; resources and funding acquisition, S.N.M. All authors have read and agreed to the published version of the manuscript.
Funding
This study was financed in part by the National Council for Scientific and Technological Development—Brazil (CNPq), number code: 150581/2025-4.
Data Availability Statement
The original contributions presented in the study are included in the article; further inquiries can be directed to the corresponding author.
Acknowledgments
The authors thank the following Brazilian agencies for their support for this investigation: CNPq, CAPES and FAPERJ.
Conflicts of Interest
The authors declare no conflicts of interest.
References
- Faruk, O.; Bledzki, A.K.; Fink, H.-P.; Sain, M. Biocomposites reinforced with natural fibers: 2000–2010. Prog. Polym. Sci. 2012, 37, 1552–1596. [Google Scholar] [CrossRef] [Scilit]
- Temesgen, A.G.; Kaufmann, J.; Cebulla, H. Mechanical performance of natural fiber reinforced polymer composites with critical assessment of recent advances and future perspectives. Discov. Mater. 2026, 6, 205. [Google Scholar] [CrossRef] [Scilit]
- Silva, D.S.; Pereira Junio, R.F.; Neuba, L.M.; Aguilera, L.S.; Monteiro, S.N.; Prado da Silva, M.H. Thermochemical and structural characterization of raffia fiber fabric (Raphia vinifera) from the Amazon region. J. Mater. Res. Technol. 2024, 30, 5069–5079. [Google Scholar] [CrossRef] [Scilit]
- United Nations General Assembly. Transforming Our World: The 2030 Agenda for Sustainable Development; Resolution A/RES/70/1; United Nations: New York, NY, USA, 2015; Available online: https://sdgs.un.org/2030agenda (accessed on 16 October 2026).
- Silva, D.S.; Pereira Junio, R.F.; Cêa, B.S.A.; Figueiredo, A.B.-H.S.; Monteiro, S.N.; Prado da Silva, M.H. Ballistic, thermal and chemical characterization of raffia fiber fabric (Raphia vinifera) reinforced epoxy matrix composites. J. Mater. Res. Technol. 2025, 36, 2700–2717. [Google Scholar] [CrossRef] [Scilit]
- Freires, A.M.; Corrêa, A.C.; Ribeiro, M.M.; Cardoso, S.M.; Rodrigues, J.S.; Silva, D.S.; Pereira Junio, R.F.; Monteiro, S.N. Mechanical properties and statistical analysis of polyester composite reinforced with miriti fibers braided using crochet technique. J. Mater. Res. Technol. 2024, 28, 4392–4400. [Google Scholar] [CrossRef] [Scilit]
- Fuqua, M.A.; Huo, S.; Ulven, C.A. Natural fiber reinforced composites. Polym. Rev. 2012, 52, 259–320. [Google Scholar] [CrossRef] [Scilit]
- Parvin, M.; Shadhin, M.; Dulal, M.; Rahman, M. Harnessing cattail biomass for sustainable fibers and engineered bioproducts: A review. Glob. Chall. 2025, 9, 2400183. [Google Scholar] [CrossRef] [Scilit] [PubMed]
- Shadhin, M.; Rahman, M.; Jayaraman, R.; Mann, D. Novel cattail fiber composites: Converting waste biomass into reinforcement for composites. Bioresour. Bioprocess. 2021, 8, 101. [Google Scholar] [CrossRef] [Scilit] [PubMed]
- Hossain, M.S.; Rahman, M.; Cicek, N. Tensile properties of cattail fibres at various phenological development stages. Polymers 2024, 16, 2692. [Google Scholar] [CrossRef] [Scilit] [PubMed]
- Manimaran, P.; Vignesh, V.; Khan, A.; Pillai, G.P.; Nagarajan, K.J.; Prithiviraj, M.; Al-Romaizan, A.N.; Hussein, M.A.; Puttegowda, M.; Asiri, A.M. Extraction and characterization of natural lignocellulosic fibres from Typha angustata grass. Int. J. Biol. Macromol. 2022, 222, 1840–1851. [Google Scholar] [CrossRef] [Scilit] [PubMed]
- Thomason, J.L.; Carruthers, J.; Kelly, J.; Johnston, G. Fibre cross-section determination and variability in sisal and flax and its effects on fibre performance characterisation. Compos. Sci. Technol. 2011, 71, 1008–1015. [Google Scholar] [CrossRef] [Scilit]
- Bevitori, A.B.; da Silva, I.L.A.; Lopes, F.P.D.; Monteiro, S.N. Diameter dependence of tensile strength by Weibull analysis: Part II jute fiber. Matéria 2010, 15, 117–123. [Google Scholar] [CrossRef] [Scilit]
- Wang, F.; Shao, J. Modified Weibull distribution for analyzing the tensile strength of bamboo fibers. Polymers 2014, 6, 3005–3018. [Google Scholar] [CrossRef] [Scilit]
- Kampeerapappun, P.; Desclaux, S.; Rattanapinyopituk, K.; Srisuk, T.; Hemstapat, R. Natural cellulose fibers derived from Dracaena angolensis (Welw. ex Carrière) Byng & Christenh. demonstrate potential as a non-absorbable surgical suture biomaterial. Sci. Rep. 2025, 15, 1291. [Google Scholar] [CrossRef] [Scilit] [PubMed]
- Nurazzi, N.M.; Asyraf, M.R.M.; Rayung, M.; Norrrahim, M.N.F.; Shazleen, S.S.; Rani, M.S.A.; Shafi, A.R.; Aisyah, H.A.; Radzi, M.H.M.; Sabaruddin, F.A.; et al. Thermogravimetric analysis properties of cellulosic natural fiber polymer composites: A review on influence of chemical treatments. Polymers 2021, 13, 2710. [Google Scholar] [CrossRef] [Scilit] [PubMed]
- Monteiro, S.N.; Calado, V.; Margem, F.M.; Rodriguez, R.J.S. Thermogravimetric stability behavior of less common lignocellulosic fibers—A review. J. Mater. Res. Technol. 2012, 1, 189–199. [Google Scholar] [CrossRef] [Scilit]
- Neto, J.S.S.; de Queiroz, H.F.M.; Aguiar, R.A.A.; Banea, M.D. A review on the thermal characterisation of natural and hybrid fiber composites. Polymers 2021, 13, 4425. [Google Scholar] [CrossRef] [Scilit] [PubMed]
- ASTM E1508-12a(2019); Standard Guide for Quantitative Analysis by Energy-Dispersive Spectroscopy. ASTM International: West Conshohocken, PA, USA, 2019. [Google Scholar] [CrossRef] [Scilit]
- ASTM E1252-98(2021); Standard Practice for General Techniques for Obtaining Infrared Spectra for Qualitative Analysis. ASTM International: West Conshohocken, PA, USA, 2021. [Google Scholar] [CrossRef] [Scilit]
- ASTM E1131-25; Standard Test Method for Compositional Analysis by Thermogravimetry. ASTM International: West Conshohocken, PA, USA, 2025. [Google Scholar] [CrossRef] [Scilit]
- ASTM C1557-20; Standard Test Method for Tensile Strength and Young’s Modulus of Fibers. ASTM International: West Conshohocken, PA, USA, 2020. [Google Scholar] [CrossRef] [Scilit]
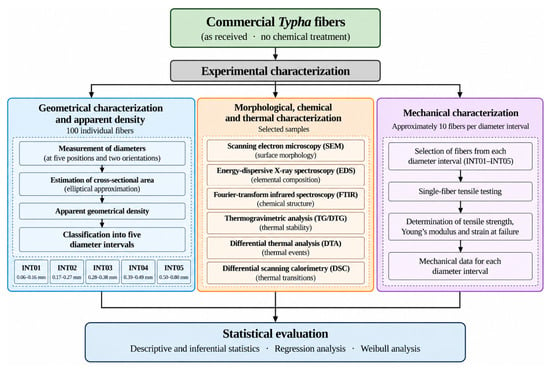
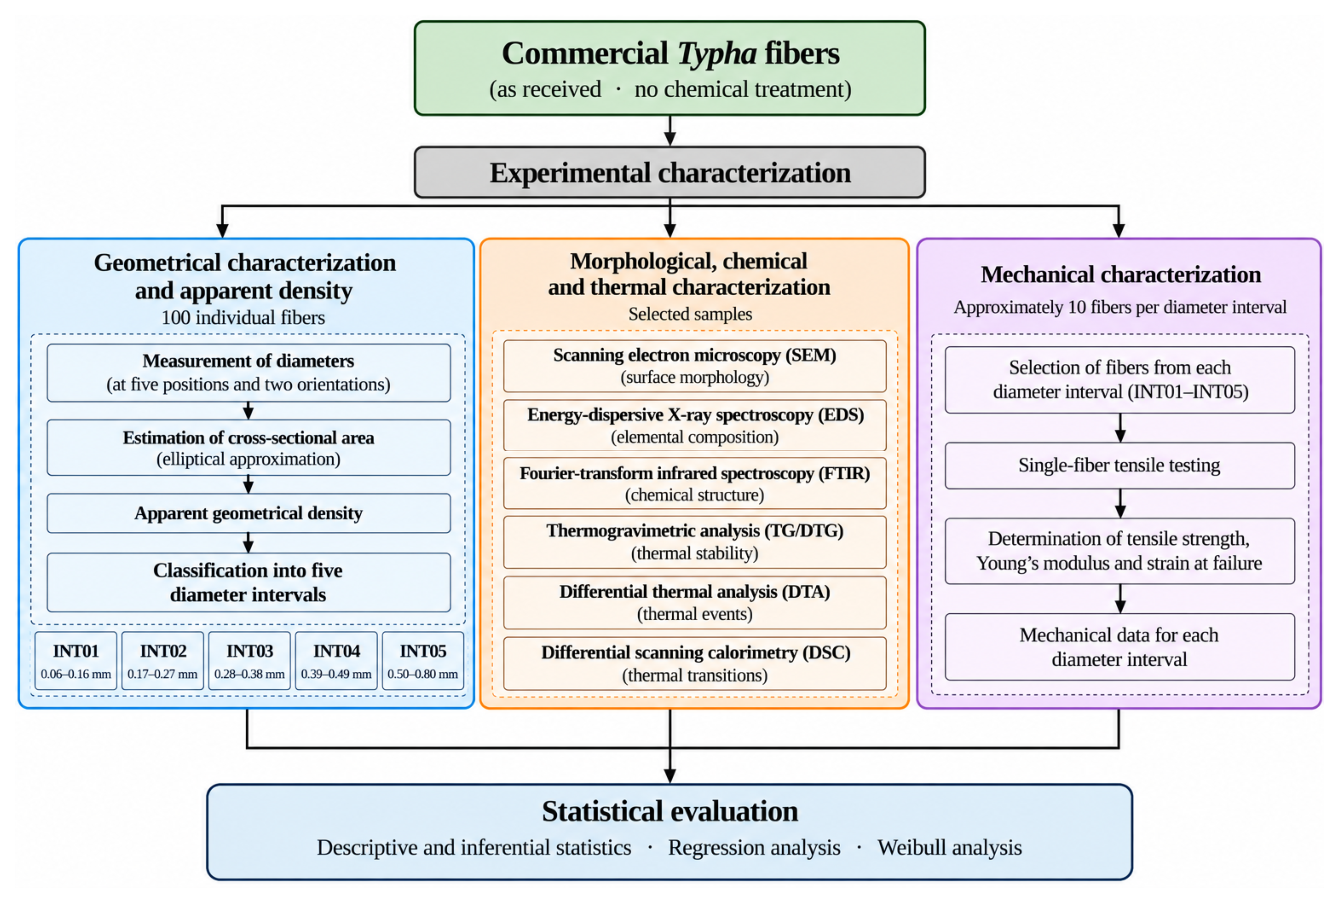
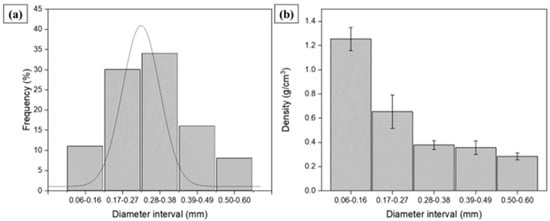
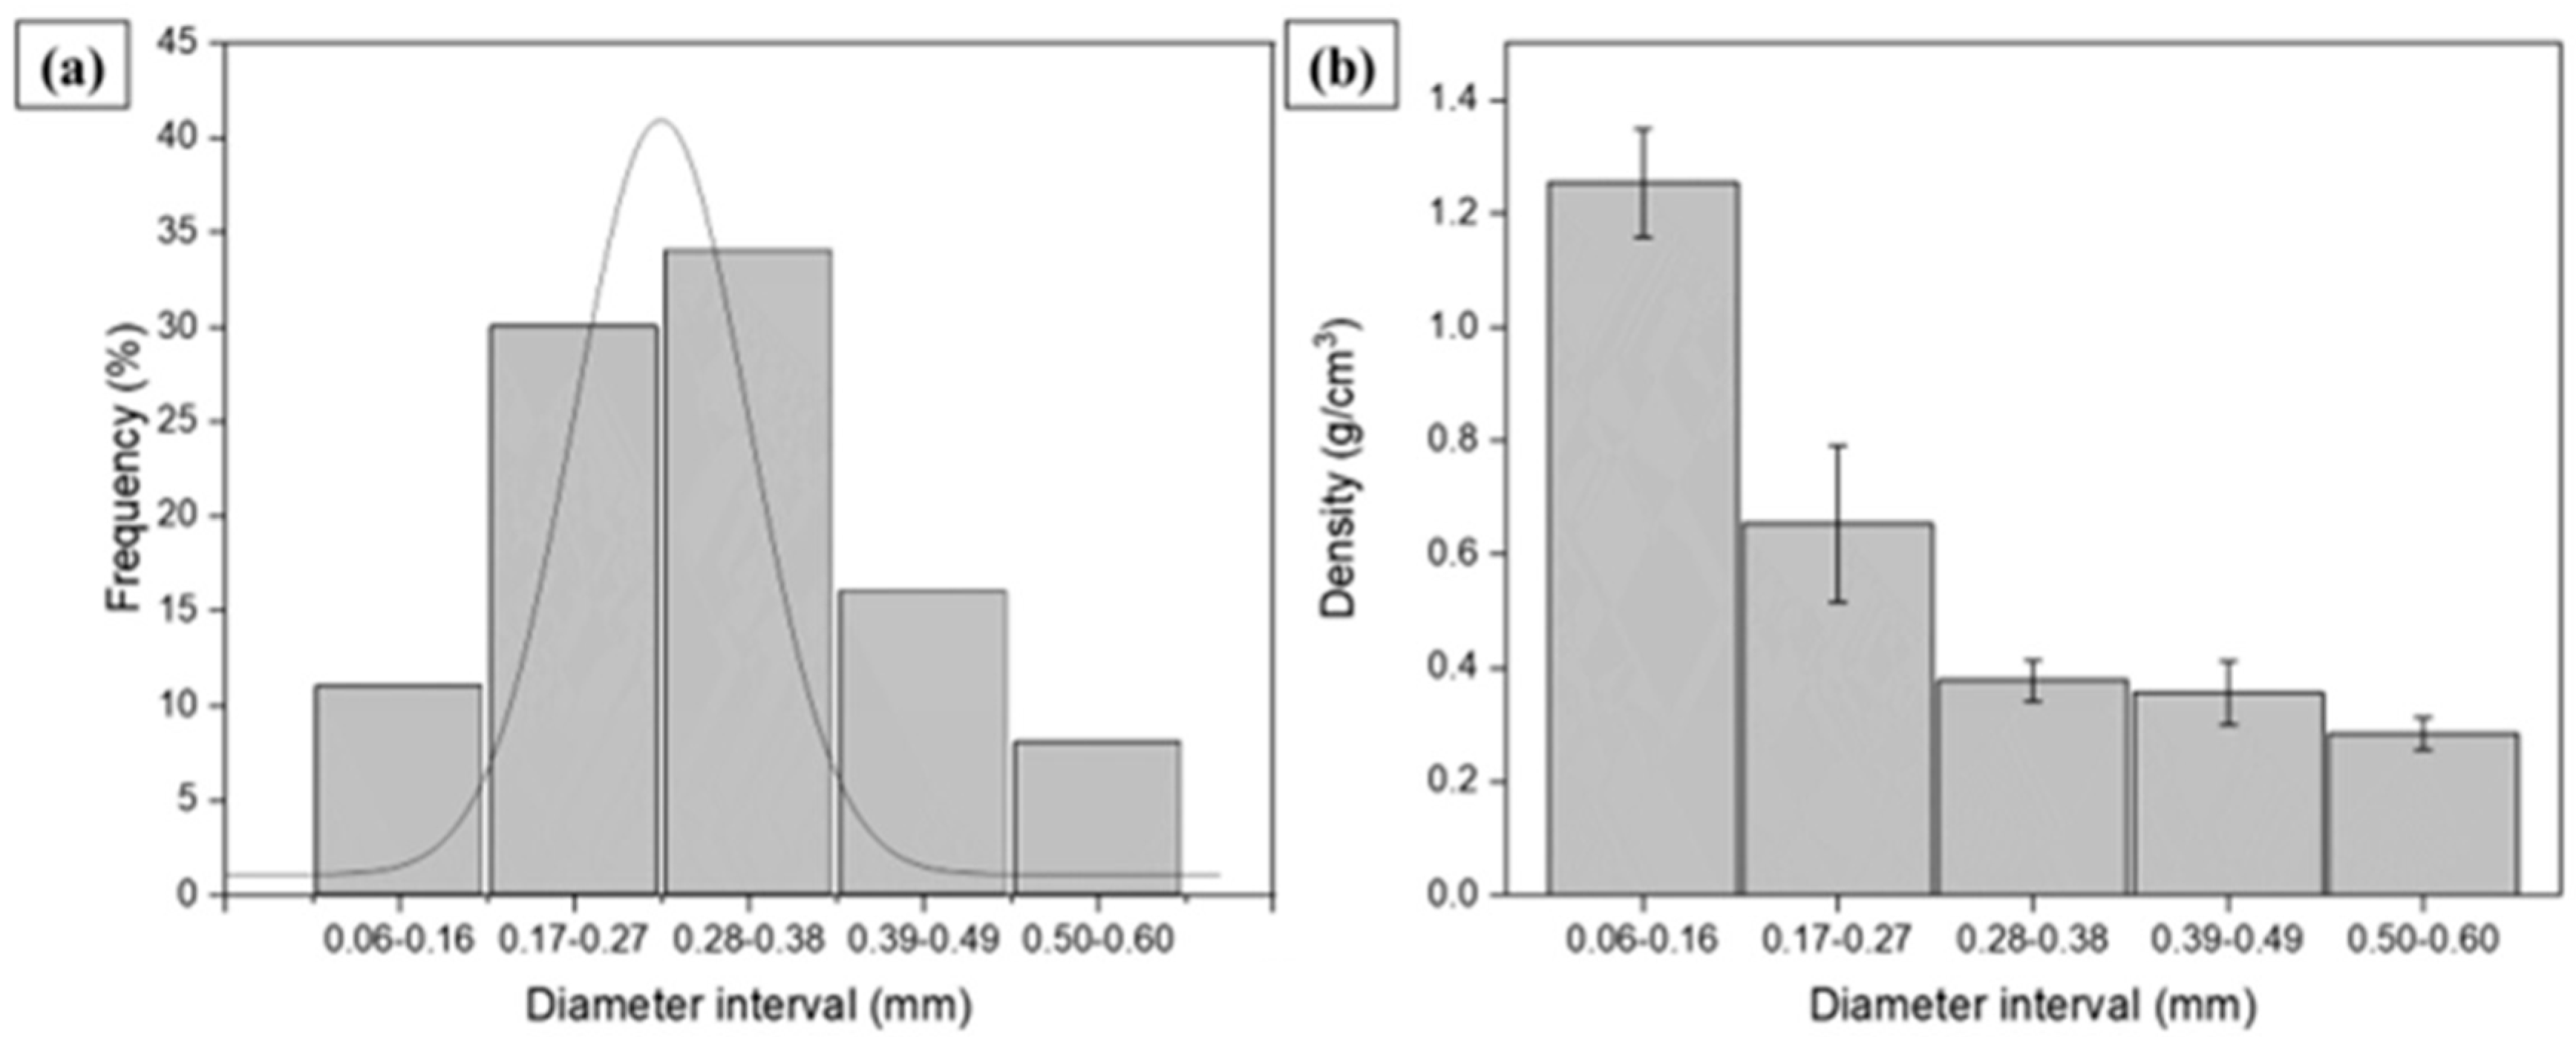
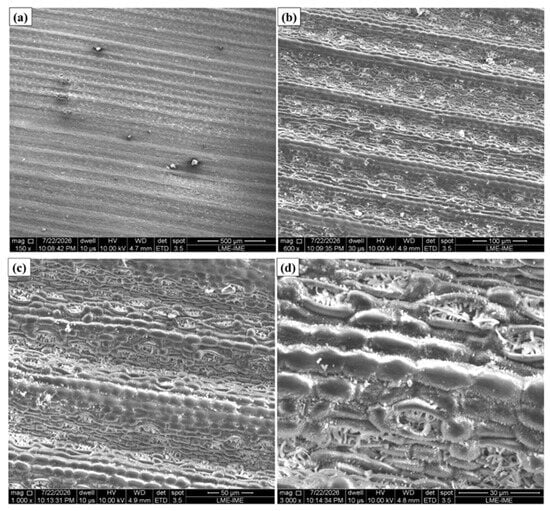
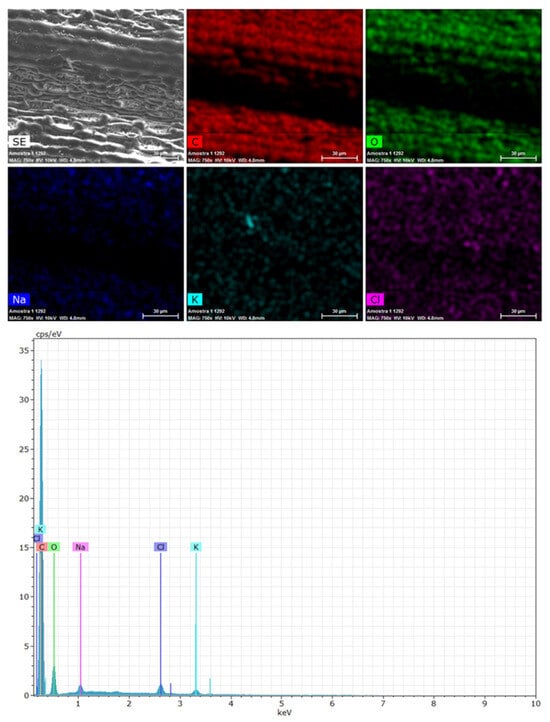
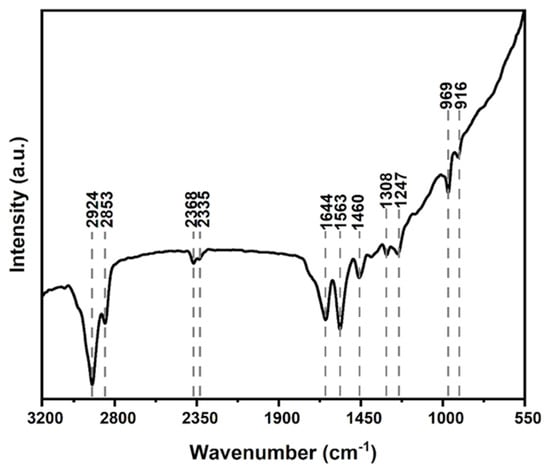
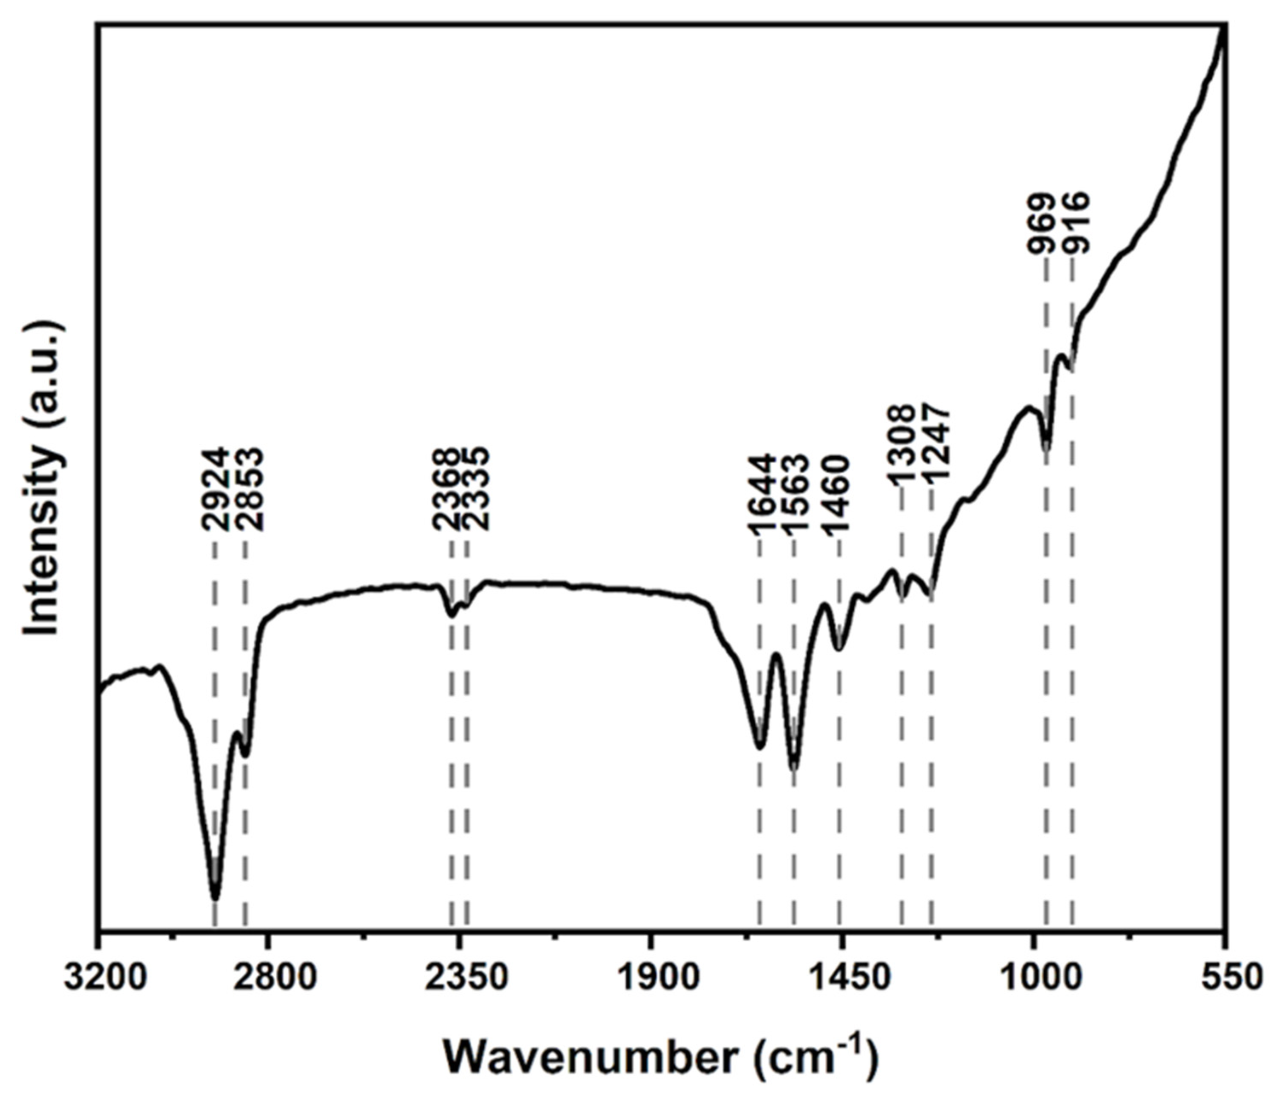
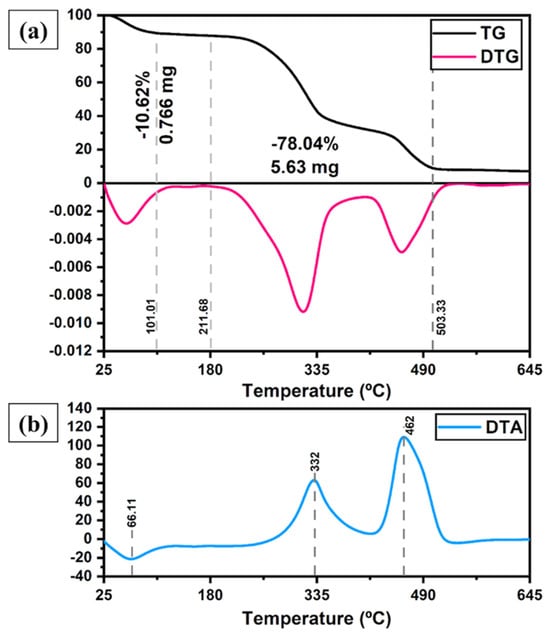
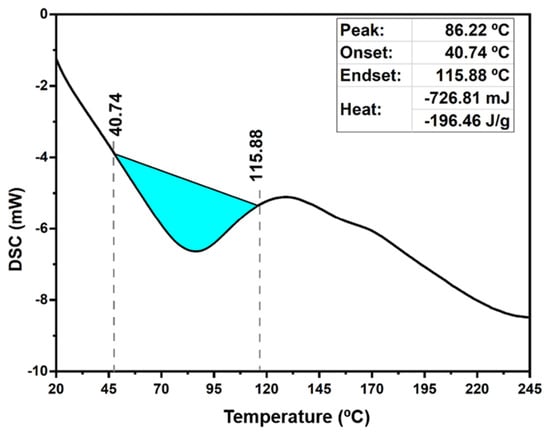
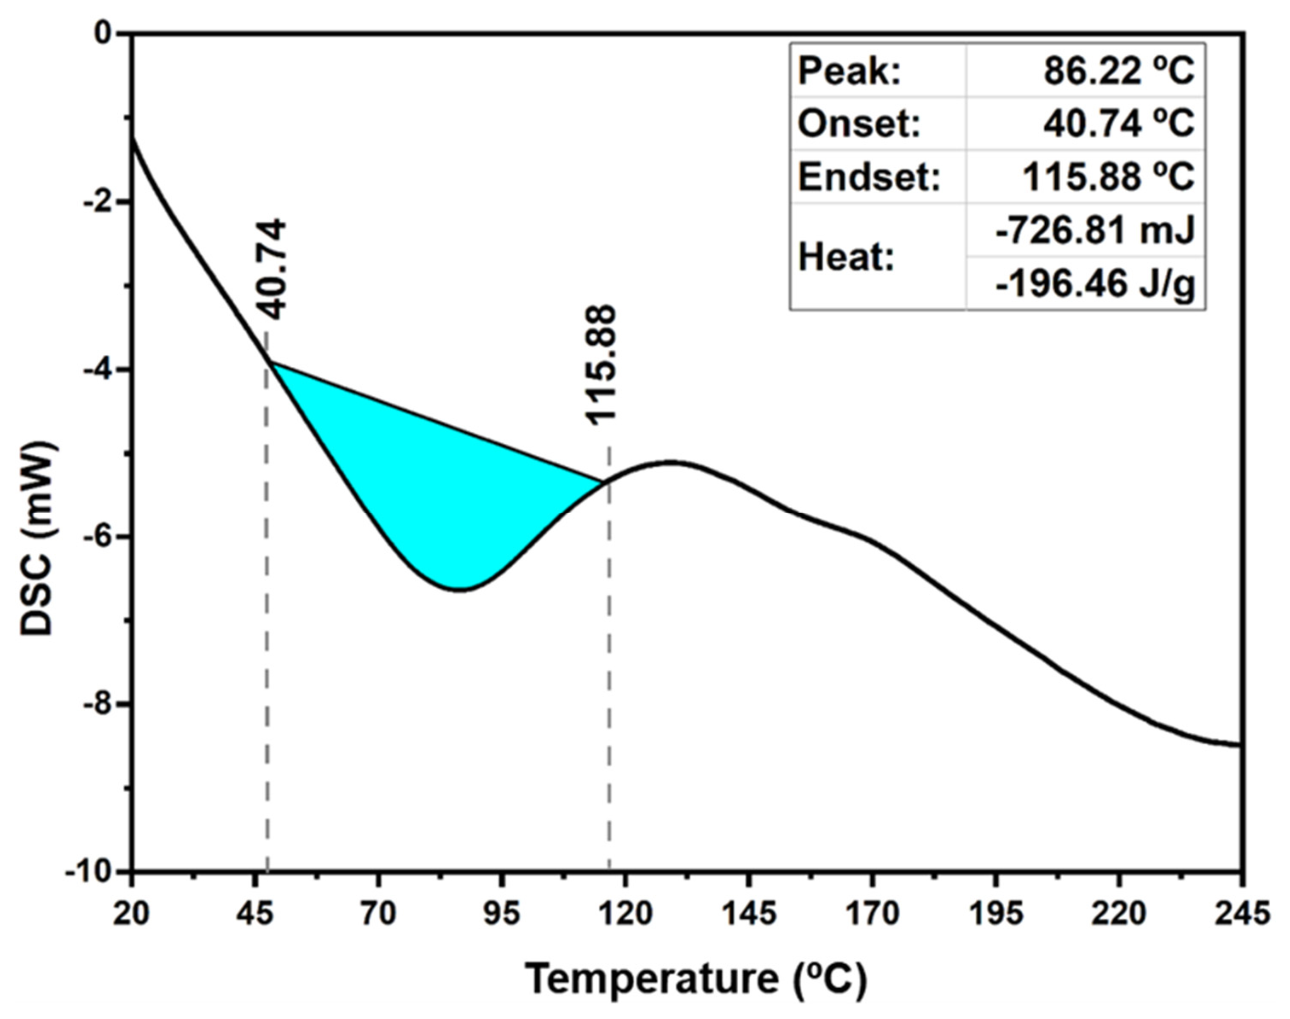
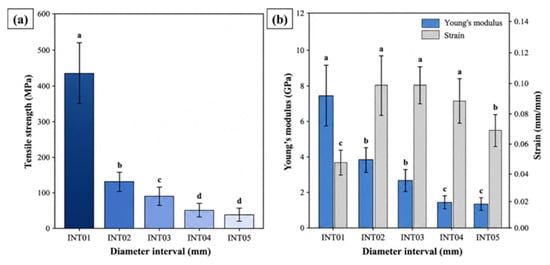
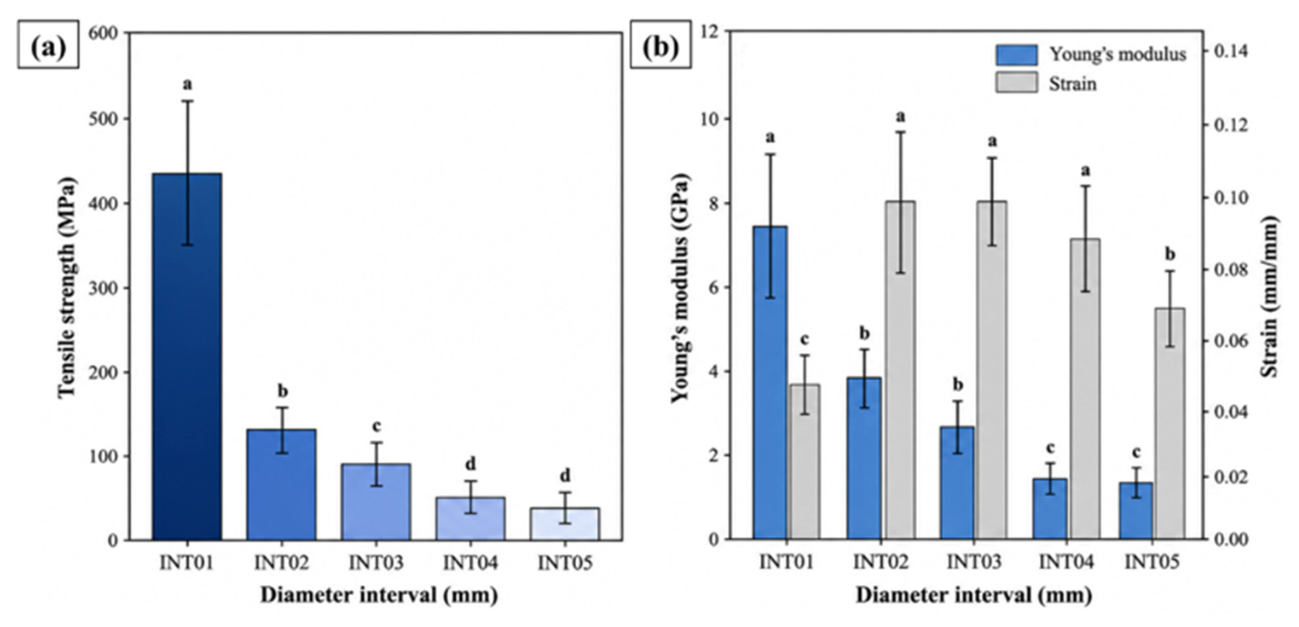
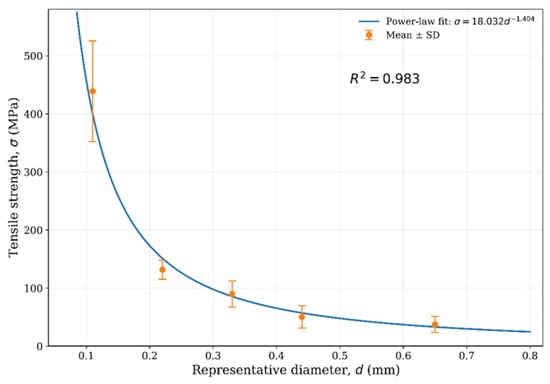
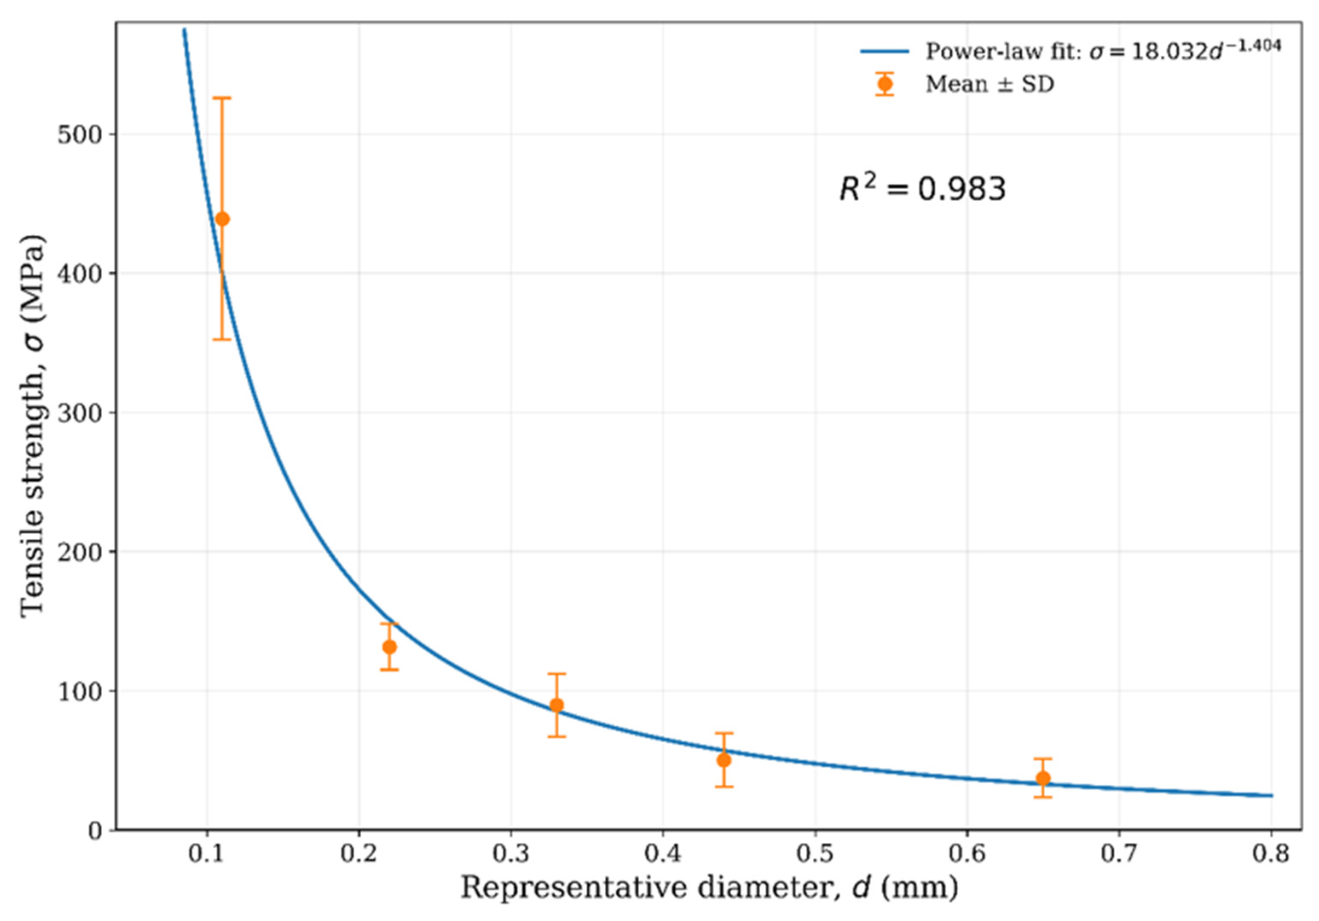
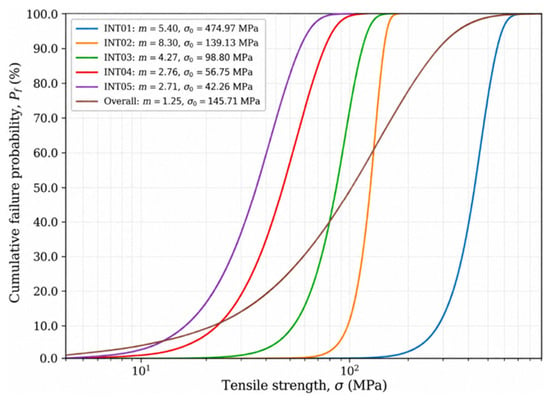
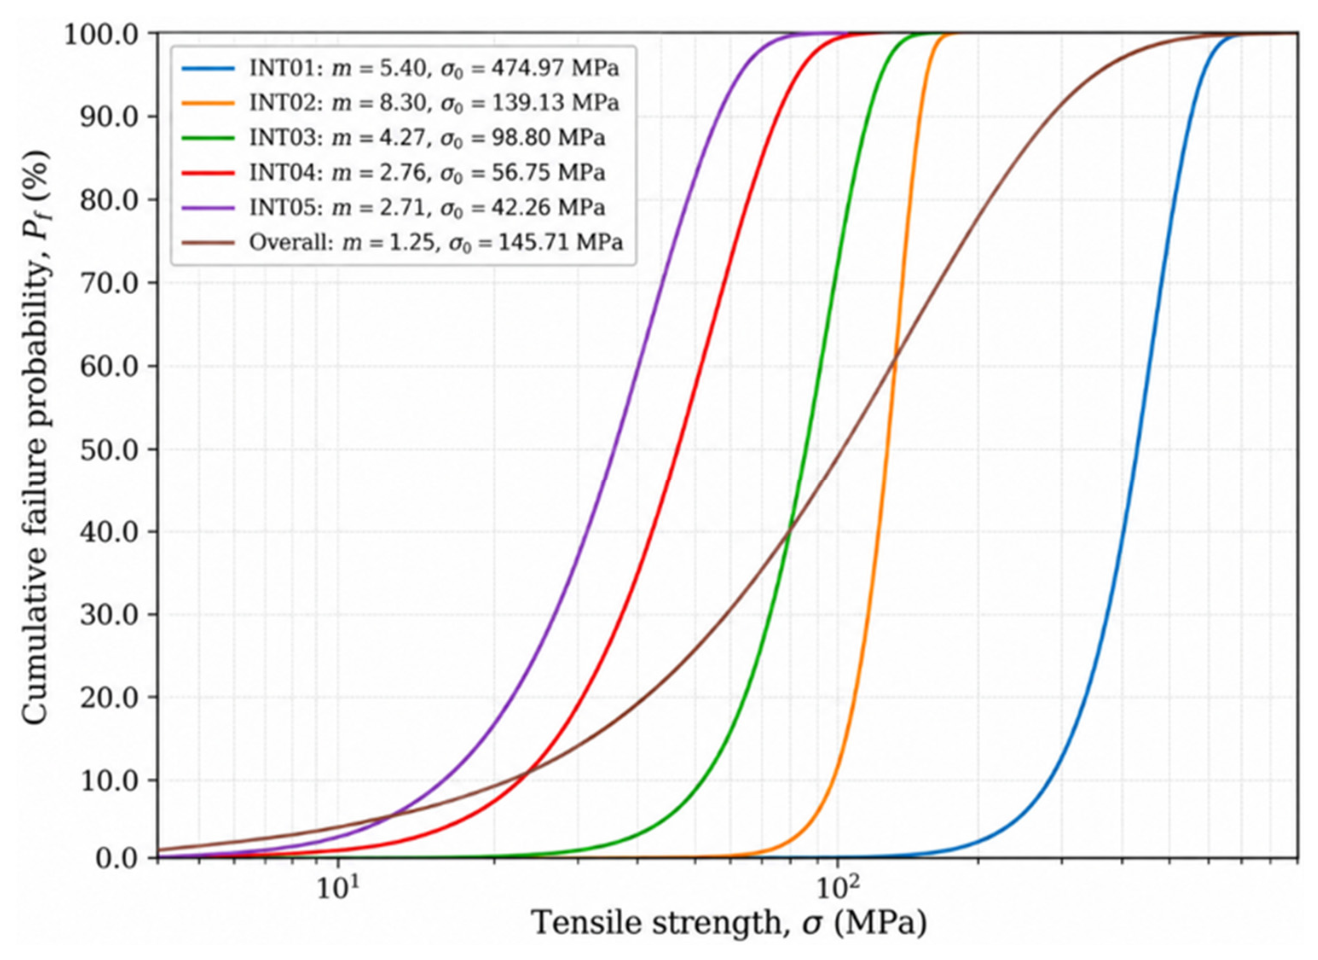

Disclaimer/Publisher’s Note: The statements, opinions and data contained in all publications are solely those of the individual author(s) and contributor(s) and not of MDPI and/or the editor(s). MDPI and/or the editor(s) disclaim responsibility for any injury to people or property resulting from any ideas, methods, instructions or products referred to in the content. |
© 2026 by the authors. Licensee MDPI, Basel, Switzerland. This article is an open access article distributed under the terms and conditions of the Creative Commons Attribution (CC BY) license.