


Abstract
This paper proposes a method for simulating freeze–thaw damage in water-rich sandstone using PFC3D (Particle Flow Code in three dimensions). Water-rich sandstone is idealized as a composite system consisting of rock particles, water particles, and three types of contact surface: rock–rock, rock–water, and water–water. The volume change in water particles is governed by temperature, unfrozen water content, and porosity. During thawing, the volume change in water particles is realized by increasing the porosity after each cycle because the expansion of water particles is reflected by pore enlargement and the accumulation of externally supplied water. The proposed approach is intended for saturated or highly water-rich sandstone under laboratory freeze–thaw conditions with external water replenishment. It represents freeze–thaw damage associated with pore water freezing expansion and porosity-controlled equivalent water replenishment, whereas ice segregation, cryogenic suction, moisture migration, and a moving freezing front are not explicitly considered. A comparison between simulation results and laboratory tests indicates that the proposed method can effectively reproduce the freeze–thaw cycling process in water-rich sandstone. The results show that the mechanical behavior of sandstone after freeze–thaw cycles, including uniaxial compressive strength and elastic modulus, deteriorates significantly. The failure mode changes from shear failure to splitting failure. Freeze–thaw cycling and subsequent uniaxial compression are dominated by tensile damage, with tensile cracks accounting for approximately 90% of the total cracks. The tensile damage rate, Rt, increases exponentially. Crack development induced by freeze–thaw cycling follows an S-shaped trend and can be divided into three stages: slow crack growth from 0 to 10 cycles, rapid crack growth from 10 to 32 cycles, and a reduced growth rate after 32 cycles. The results provide a reference for the freeze–thaw damage analysis of rocks in cold regions and numerical simulations of freeze–thaw cycling processes.
1. Introduction
With the introduction of China’s “the Belt and Road” development strategy, infrastructure construction has developed rapidly, with a significant portion located in cold regions. In cold region engineering, freeze–thaw cycles are a primary cause of strength deterioration in rock and soil masses, leading to instability in tunnels, slopes, and roadbeds. For rock engineering materials exposed to cold-region environments, repeated freezing and thawing not only reduce mechanical strength but also accelerate material degradation through pore enlargement, microcrack propagation, surface scaling, particle detachment, and a progressive loss of durability. These degradation processes directly affect the long-term serviceability of tunnel surrounding rocks, slope rock masses, roadbed foundations, and other engineering structures. Rocks are porous materials containing defects that form pathways for water penetration [1,2,3]. Repeated temperature fluctuations lead to ice–water phase transitions of pore and fracture water within the granular skeletal units of the rock mass [4]. The freezing-induced expansion forces resulting from volume changes during the ice–water phase transition damage the rock granules, ultimately affecting the mechanical properties of the rock framework and the safety and stability of structures [5]. Therefore, investigating the fine-scale characteristics and damage behavior of rocks subjected to freeze–thaw cycles caused by ice–water phase transitions is of great practical importance for engineering construction in cold regions.
In recent years, the study of the effects of freeze–thaw cycles on the fine-scale properties of rock damage and damage behavior has attracted much attention. Corresponding studies have shown that freeze–thaw cycling can significantly affect the macroscopic mechanical properties and damage morphology of rocks [6,7,8]. The development of defects and pores in rocks under the action of freeze–thaw cycles is an important cause of macroscopic weathering and engineering material deterioration in cold regions [9]. However, it is often difficult to illuminate such fine-scale changes at the macroscopic level. Therefore, many scientists have focused on studying the changes in the fine-scale properties of rocks under the influence of freeze–thaw cycles. Nuclear magnetic resonance (NMR) [10,11,12], scanning electron microscopy (SEM) [13], computed tomography (CT) [14,15], and acoustic emission (AE) [16] methods are usually used to investigate structural changes in rocks during freeze–thaw weathering. These methods have achieved fruitful results in studying the microscopic features of rock damage caused by frost weathering, but NMR, SEM, and CT can only study the changes in the microscopic features of the rock before and after frost weathering; it is difficult to study the changes in microscopic features during the process of frost weathering. M. Vikram and B.M. Julian [16,17,18] used AE to observe the changes in rock microstructure during freeze–thaw weathering. However, the experimental conditions for AE are relatively harsh, and it is still difficult to accurately record the changes in microscopic features during freeze–thaw weathering. Therefore, a mesoscopic method capable of linking pore-scale damage evolution with macroscopic mechanical degradation is necessary for understanding the durability loss of sandstone materials under cyclic freezing and thawing.
With the development of computer technology, numerical simulation has provided answers to the problem of monitoring the fine-scale properties of rocks during freeze–thaw weathering. Cheng [19] used the discrete element method (DEM) to create a model for water-rich sandstone and an improved elastoplastic model. The numerical simulation results showed that the uniaxial compressive strength and elastic modulus of the sample deteriorated under the action of freeze–thaw cycles, and that the damage to the contact between the rock particles indirectly reflected the formation and distribution of microfractures in the rock under the action of freeze–thaw cycles. In addition, Yuanyuan et al. [20] modeled a three-dimensional water-rich rock using Particle Flow Code in three dimensions (PFC3D) and introduced a one-dimensional heat conduction equation to successfully demonstrate that the ice particles undergo volumetric expansion at the freezing point to break the contact between the rock particles, and the results showed that 80% of the frost cracks occurred in the annular region near the sample axis. On the other hand, Yan-Hua et al. [21] modeled two precast fractured sandstones with PFC3D and analyzed the evolutionary behavior of spatial cracks under compressive loading. In addition, Tantan et al. [22] proposed a simulation method for freeze–thaw damage in water-rich rocks based on the DEM. The results showed that the relationship between temperature and unfrozen water content determines the volume change characteristics of ice particles, and the simulation results were in good agreement with the experimental results. Although the phase transition between ice and water caused by the freeze–thaw weathering of rock has been considered in numerical simulations, most of these studies do not consider the replenishment process of saturated rock [19,20] or whether the volume of recharge increases infinitely with the number of freeze–thaw events [23], which is inconsistent with the fact that the porosity of rocks cannot increase infinitely due to the limited volume of the rock body itself in real situations. In addition, previous numerical studies have mainly focused on the reduction in mechanical parameters, whereas the relationship between freeze–thaw-induced mesoscopic damage, material degradation, and engineering durability has not been sufficiently clarified.
Therefore, this study develops a discrete element model for water-rich sandstone to simulate freeze–thaw damage at the mesoscale. The model incorporates the ice–water phase transition of pore water in saturated sandstone and considers pore evolution during freeze–thaw cycling through an experimentally constrained parameterization. Specifically, the damage induced by frost heaving is represented by controlling the volumetric expansion of equivalent water particles at low temperatures, while the initial volume of these particles is updated after each cycle to reflect the replenishment of pore water associated with porosity evolution. Based on this framework, the evolution of microcracks and the displacement field of rock particles during freeze–thaw cycling are investigated. In addition, the stress–strain response, failure mode, and crack evolution during subsequent uniaxial compression are analyzed and compared with laboratory results to evaluate the applicability of the proposed model. The proposed method provides a mesoscopic tool for evaluating the progressive deterioration of saturated sandstone materials under freeze–thaw cycling and for understanding how pore-scale damage contributes to strength loss, stiffness degradation, and changes in the macroscopic failure mode. These results can support the durability assessment and protective design for cold-region engineering structures, especially where water-rich sandstone is exposed to cyclic freezing, thawing, and external water replenishment. It should be noted that this work is intended as a DEM-based mesoscopic simulation approach rather than a fully coupled thermo-hydro-mechanical model.
2. Laboratory Tests
2.1. Test Equipment and Methods
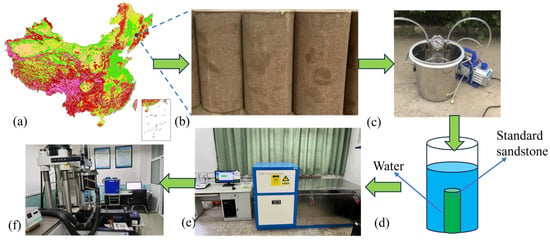
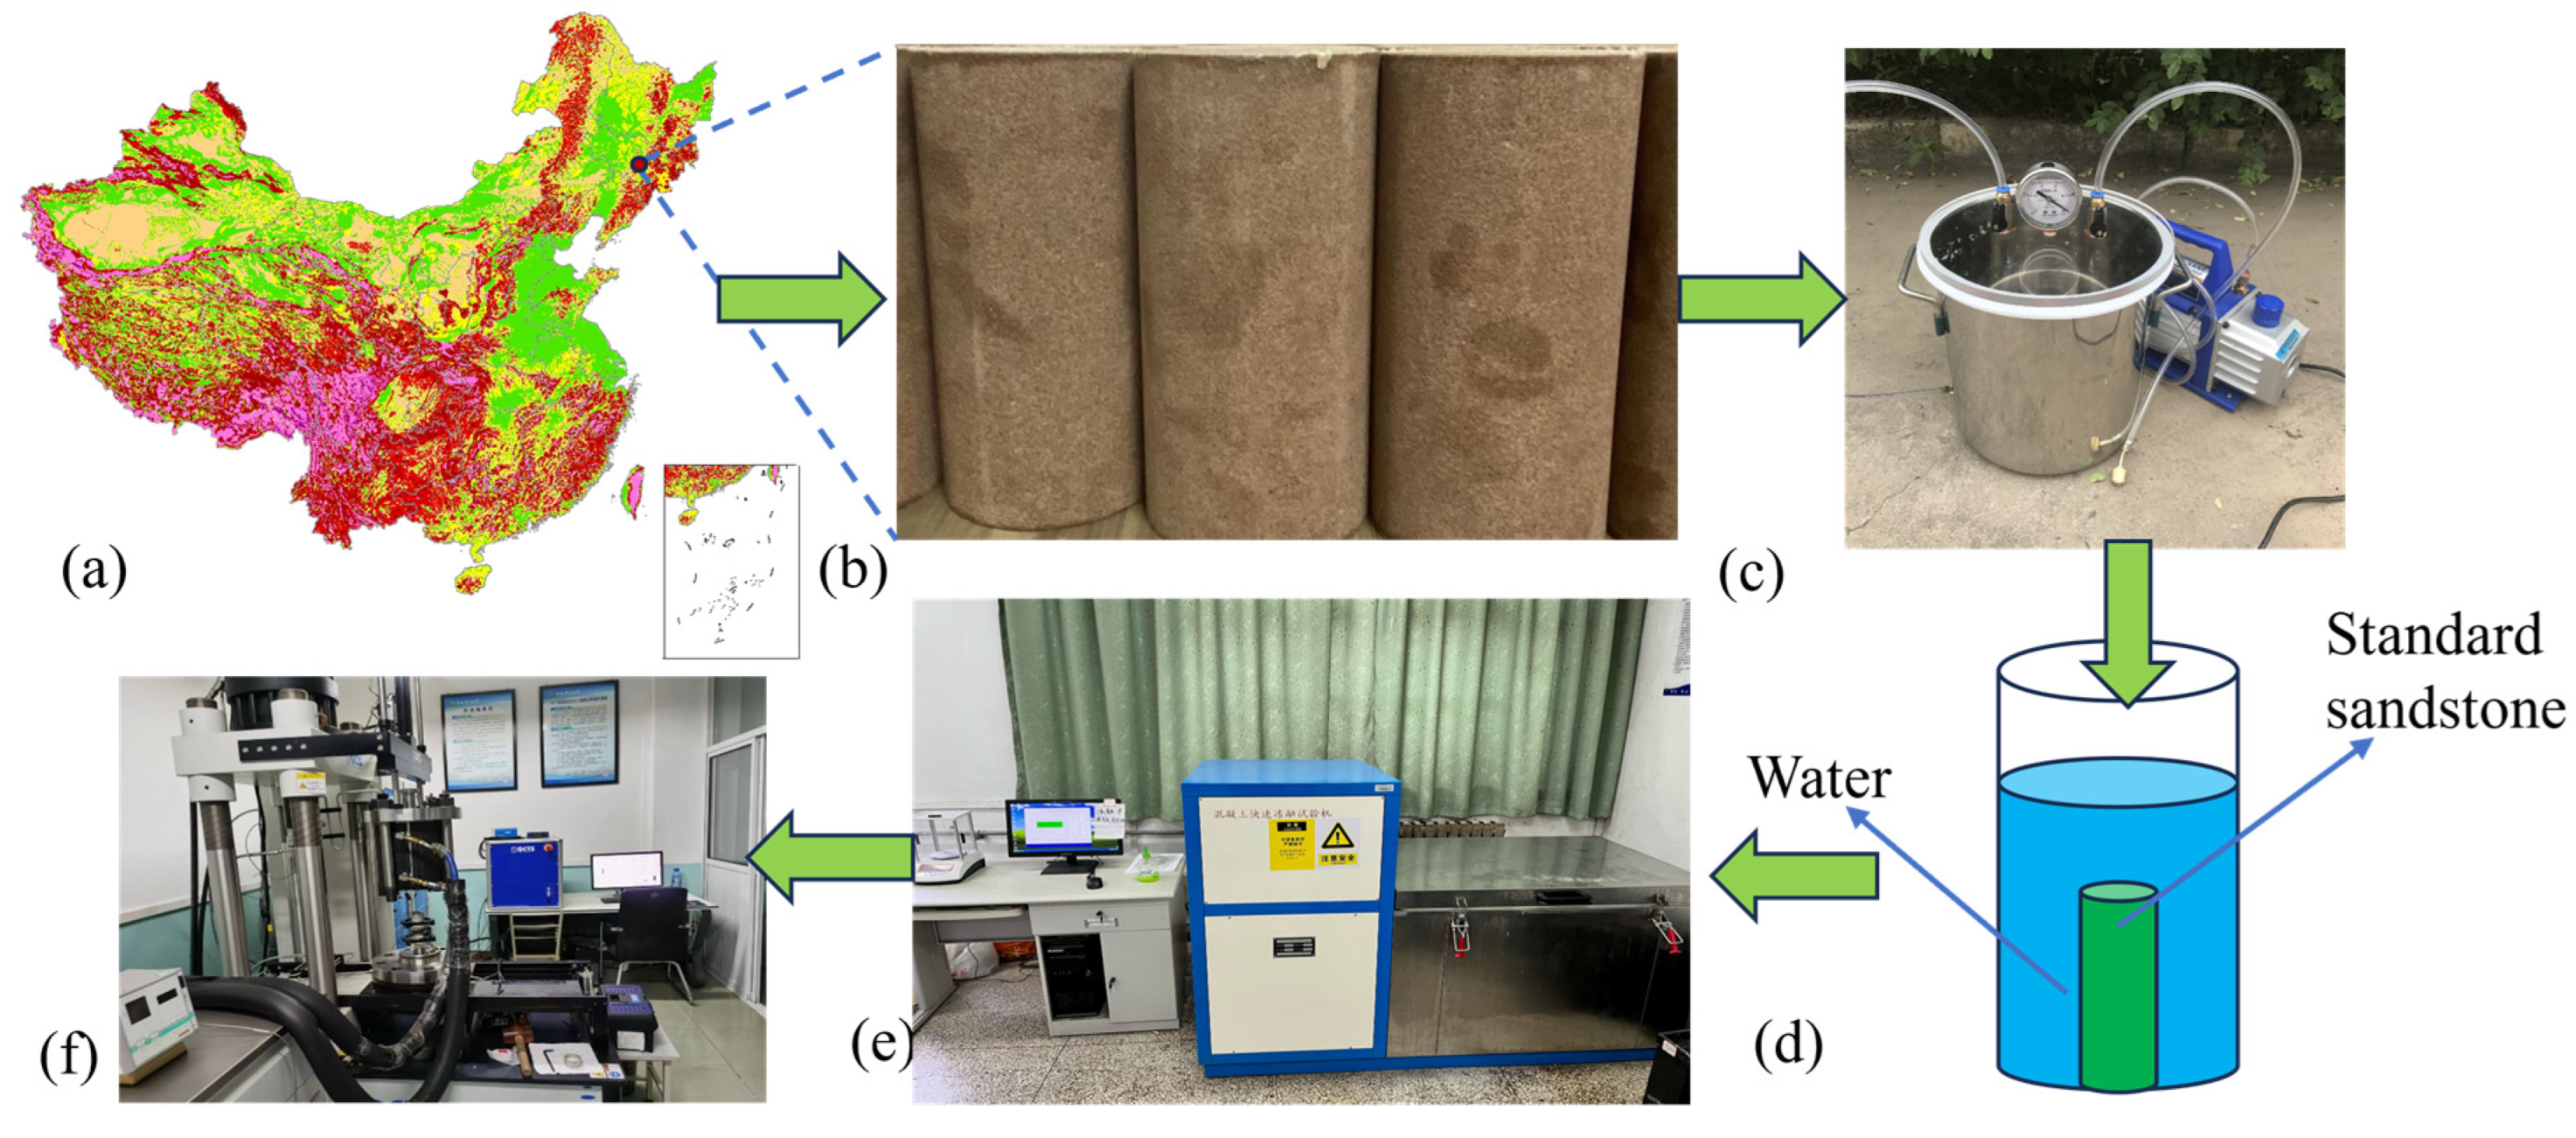
Mechanical tests were conducted in the laboratory, and the test results served as a control experiment for the numerical simulation results. The sandstone specimens were collected from a mine in northeastern China at a burial depth of 300 m. The rock is classified as medium-grained feldspathic quartz sandstone of Jurassic age. The main mineral composition comprises quartz (65%–72%), feldspar (15%–20%), and lithic fragments (8%–12%). The cementing material is a siliceous–calcareous mixed cement, with pore-type cementation. The grains are moderately sorted and sub-rounded, with an average grain size of 0.3–0.5 mm. The measured average porosity is 8.7% (effective porosity), the saturated water content is 5.60%, the average density is 2.45 g/cm3, and the average P-wave velocity is 2.96 km/s. The uniaxial compressive strength under intact conditions is of moderate magnitude (53.9 MPa). According to the requirements of the “International Society for Rock Mechanics and Engineering (ISRM) Test Procedures” [24], cylindrical specimens were prepared with a height-to-diameter ratio of 2:1 (φ50 mm × 100 mm). Specimens with no visible external damage were selected from this batch and then screened using an RSM-SY6(C) non-metallic ultrasonic probe. Specimens with similar P-wave velocities were selected as test samples. Three independent specimens were prepared for each target freeze–thaw condition, namely 0, 20, and 40 cycles, resulting in a total of nine specimens for the uniaxial compression tests. Density, P-wave velocity, and saturated water content measurements were conducted on the test samples. The reported density, P-wave velocity, and saturated water content were arithmetic mean values of the tested specimens. The average density was 2.45 g/cm3, the average P-wave velocity was 2.96 km/s, and the saturated water content was 5.60%. The saturated water content reported in this study refers to the gravimetric water content, calculated as the ratio of the mass of absorbed water to the oven-dried mass of the specimen after saturation. The experimental procedure is illustrated in Figure 1.
Figure 1.
Laboratory test process: (a) sampling point, (b) standard sandstone samples, (c) negative pressure saturation meter, (d) water container, (e) rapid freeze–thaw testing machine, and (f) low-temperature and high-pressure rock–soil triaxial test system.
(a) The test specimens were saturated using a negative-pressure/vacuum saturation apparatus. The vacuum pressure was 1 MPa, and the saturation duration was 12 h. To simulate the moisture replenishment process during freeze–thaw cycling, the saturated samples were immersed in water-filled containers and placed together with the freeze–thaw test apparatus inside a rapid freezing chamber. The freeze–thaw cycle test was conducted within a temperature range of 253.15–293.15 K. This temperature range was selected because it covered the water–ice phase transition around 273.15 K and represented a typical laboratory temperature window for simulating cold-region freeze–thaw action, with 253.15 K representing subzero freezing and 293.15 K representing thawing at room temperature. The number of freeze–thaw cycles was set to 0, 20, and 40 cycles. Porosity measurements were performed every 5 cycles to monitor the evolution of pore structure during the freeze–thaw process. Each freeze–thaw cycle consisted of cooling from 293.15 K to 253.15 K at a rate of 10 K/h, holding at 253.15 K for 4 h, heating from 253.15 K to 293.15 K at a rate of 10 K/h, and holding at 293.15 K for 4 h. The total duration of one freeze–thaw cycle was 16 h.
(b) Uniaxial compression test: Sandstone specimens that had undergone the specified number of freeze–thaw cycles were subjected to uniaxial compression tests using the GCTS low-temperature and high-pressure geotechnical uniaxial testing system.
2.2. Test Results
The water contents of specimens subjected to 0, 20, and 40 freeze–thaw cycles were 5.60%, 5.98%, and 6.45%, respectively. With increasing freeze–thaw cycles, rock porosity exhibited an increasing trend, accompanied by a gradual rise in water content. Consequently, moisture replenishment during the freeze–thaw process exerted a significant influence on the experimental results.
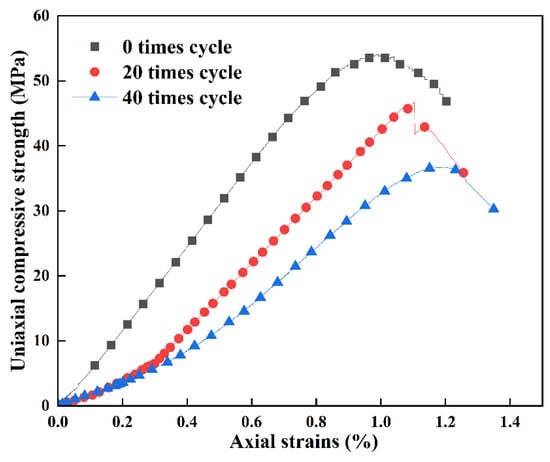
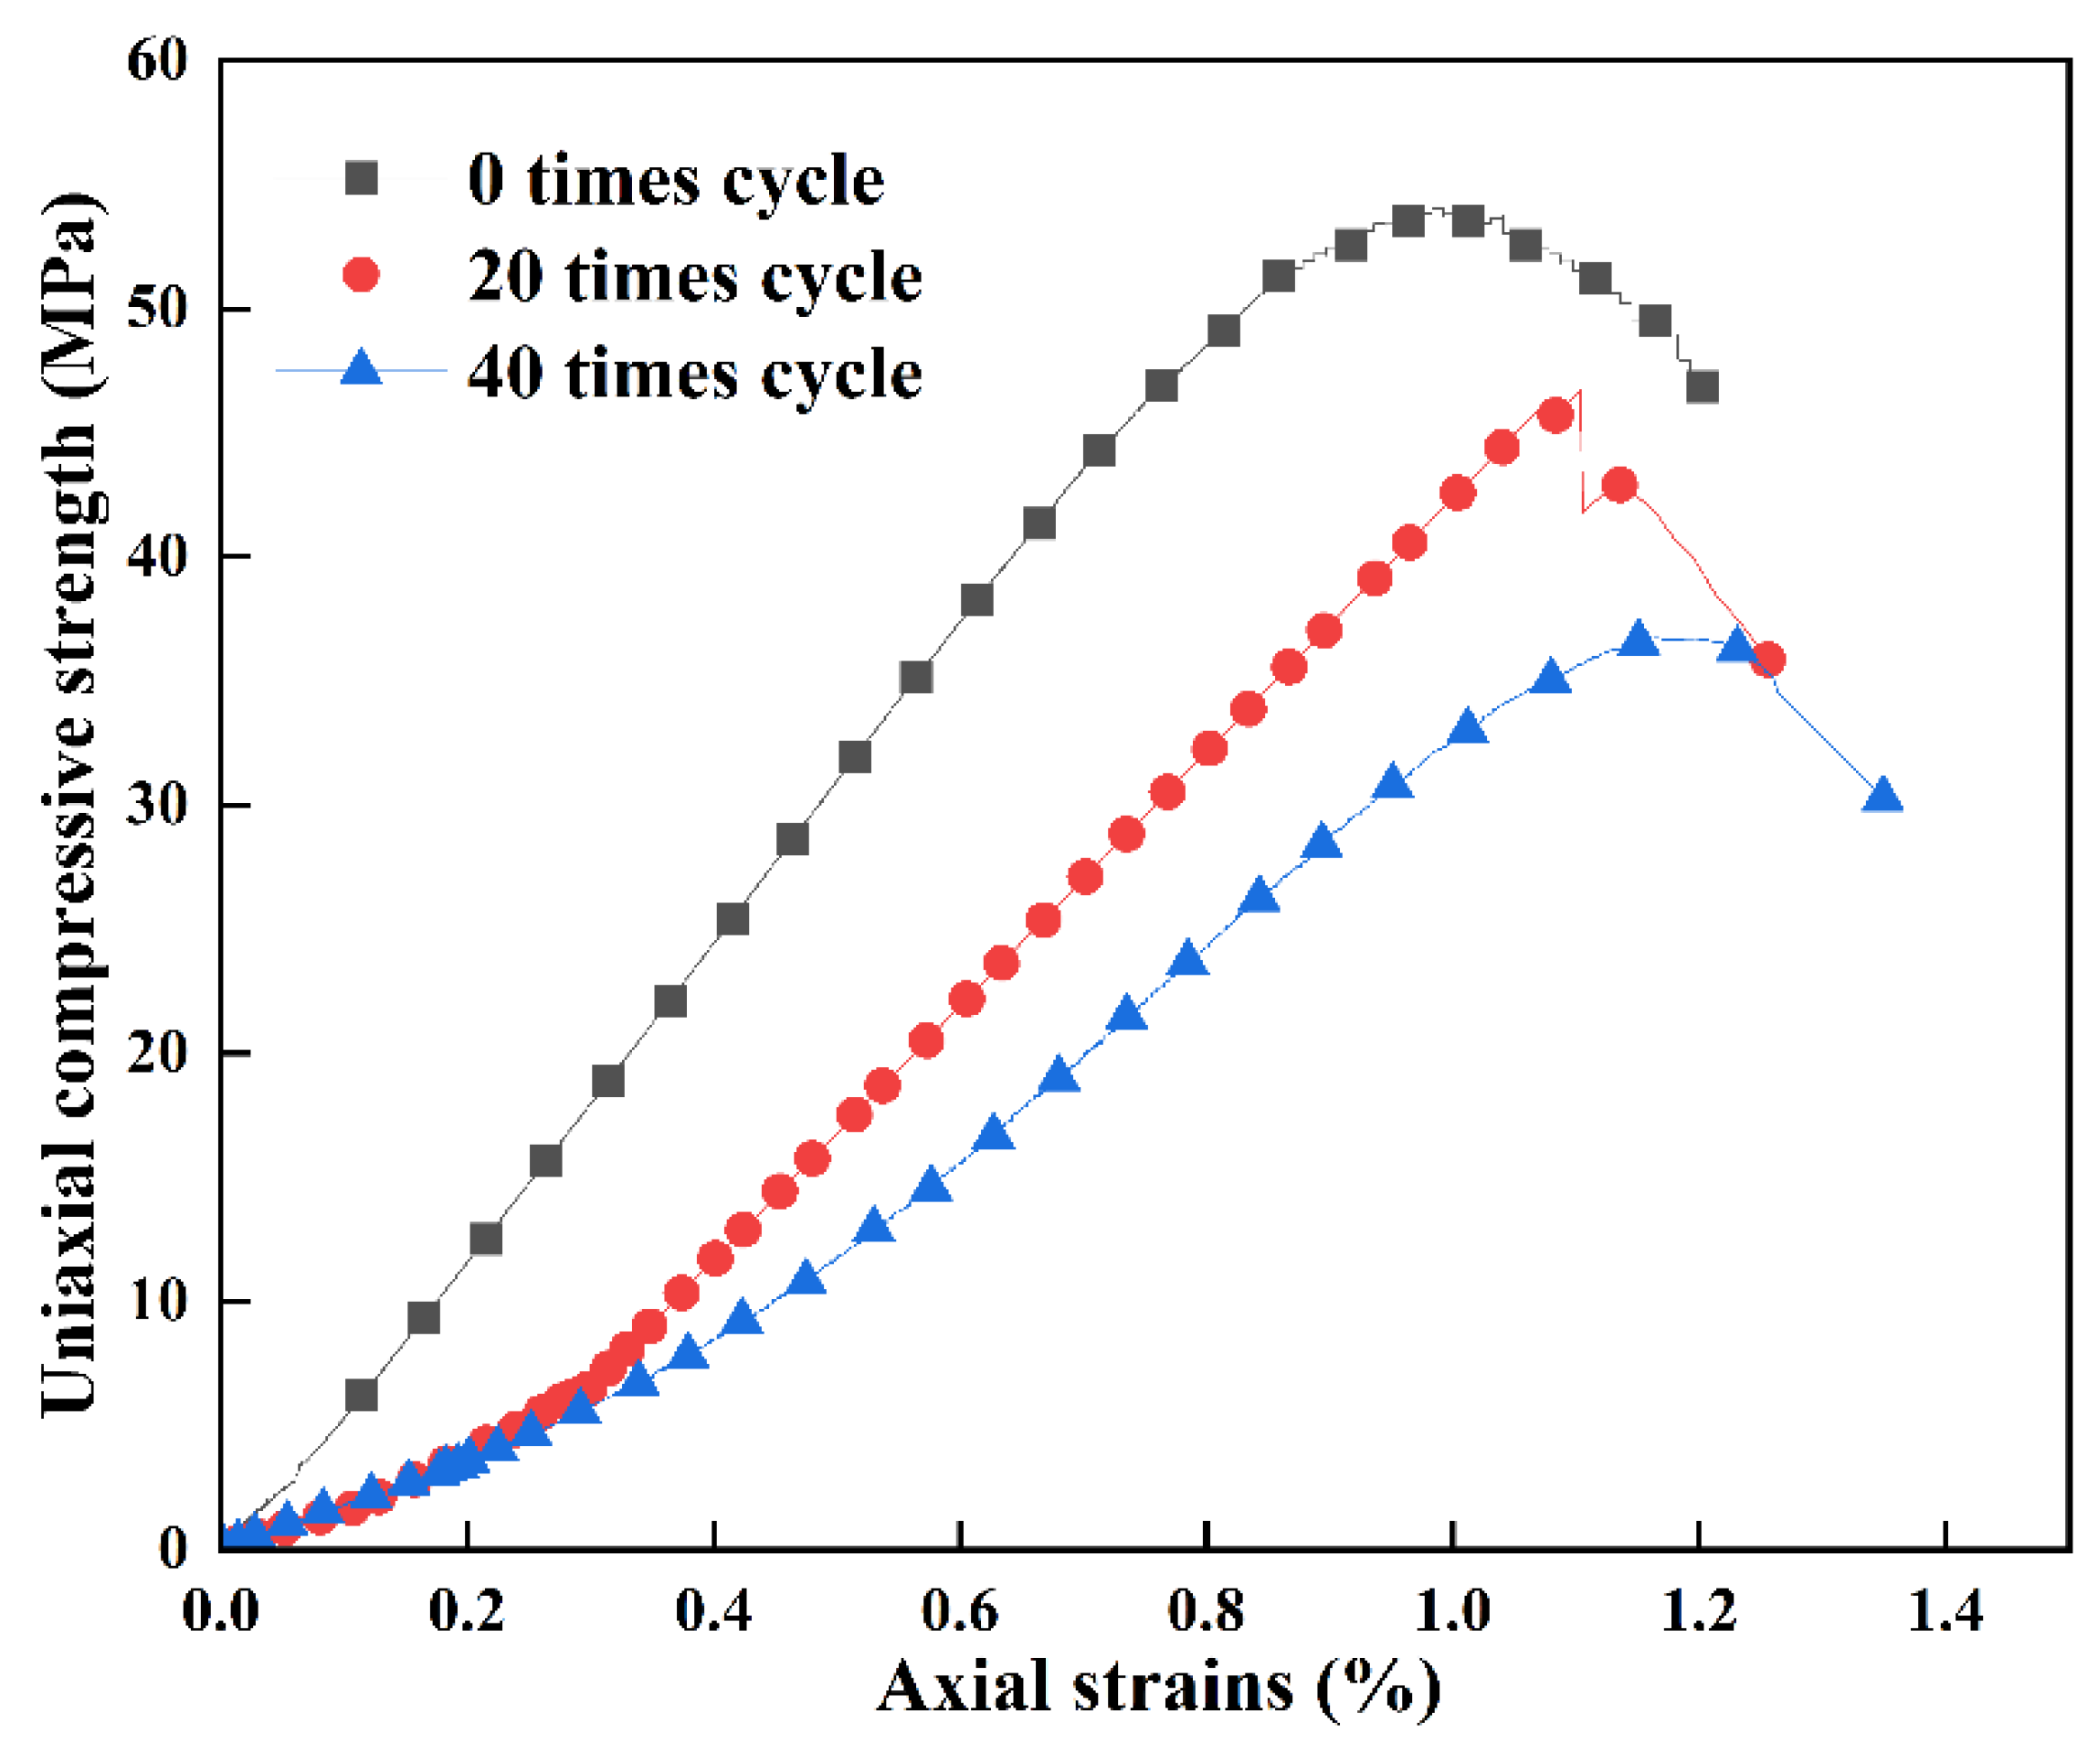
Figure 2 presents the results of uniaxial compression tests conducted on saturated sandstone subjected to various freeze–thaw cycles. The test results indicate that as the number of freeze–thaw cycles increases, the uniaxial peak strength and stiffness of the sandstone decrease. The peak strength decreased by 31.53%, from 53.9 MPa to 36.9 MPa, while the elastic modulus decreased by 43.96%, from 7.87 GPa to 4.41 GPa. Freeze–thaw damage significantly reduced the load-bearing capacity and stiffness of the sandstone specimens. However, it is challenging to reflect the damage process of sandstone microstructures caused by freeze–thaw cycles, and the subsequent fracture formation and expansion under uniaxial compression at the macroscopic scale. Therefore, numerical modeling was performed to study the damage to the sandstone grain skeleton caused by the ice–water phase transition, aiming to gain a more effective understanding of the damage development process.
Figure 2.
Uniaxial compressive stress–strain curves.
3. PFC3D Rock Freeze–Thaw Model
3.1. PFC3D Mechanical Model
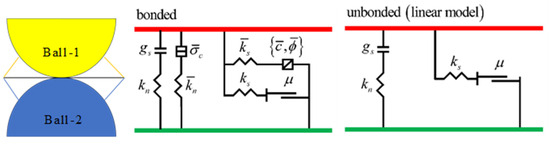
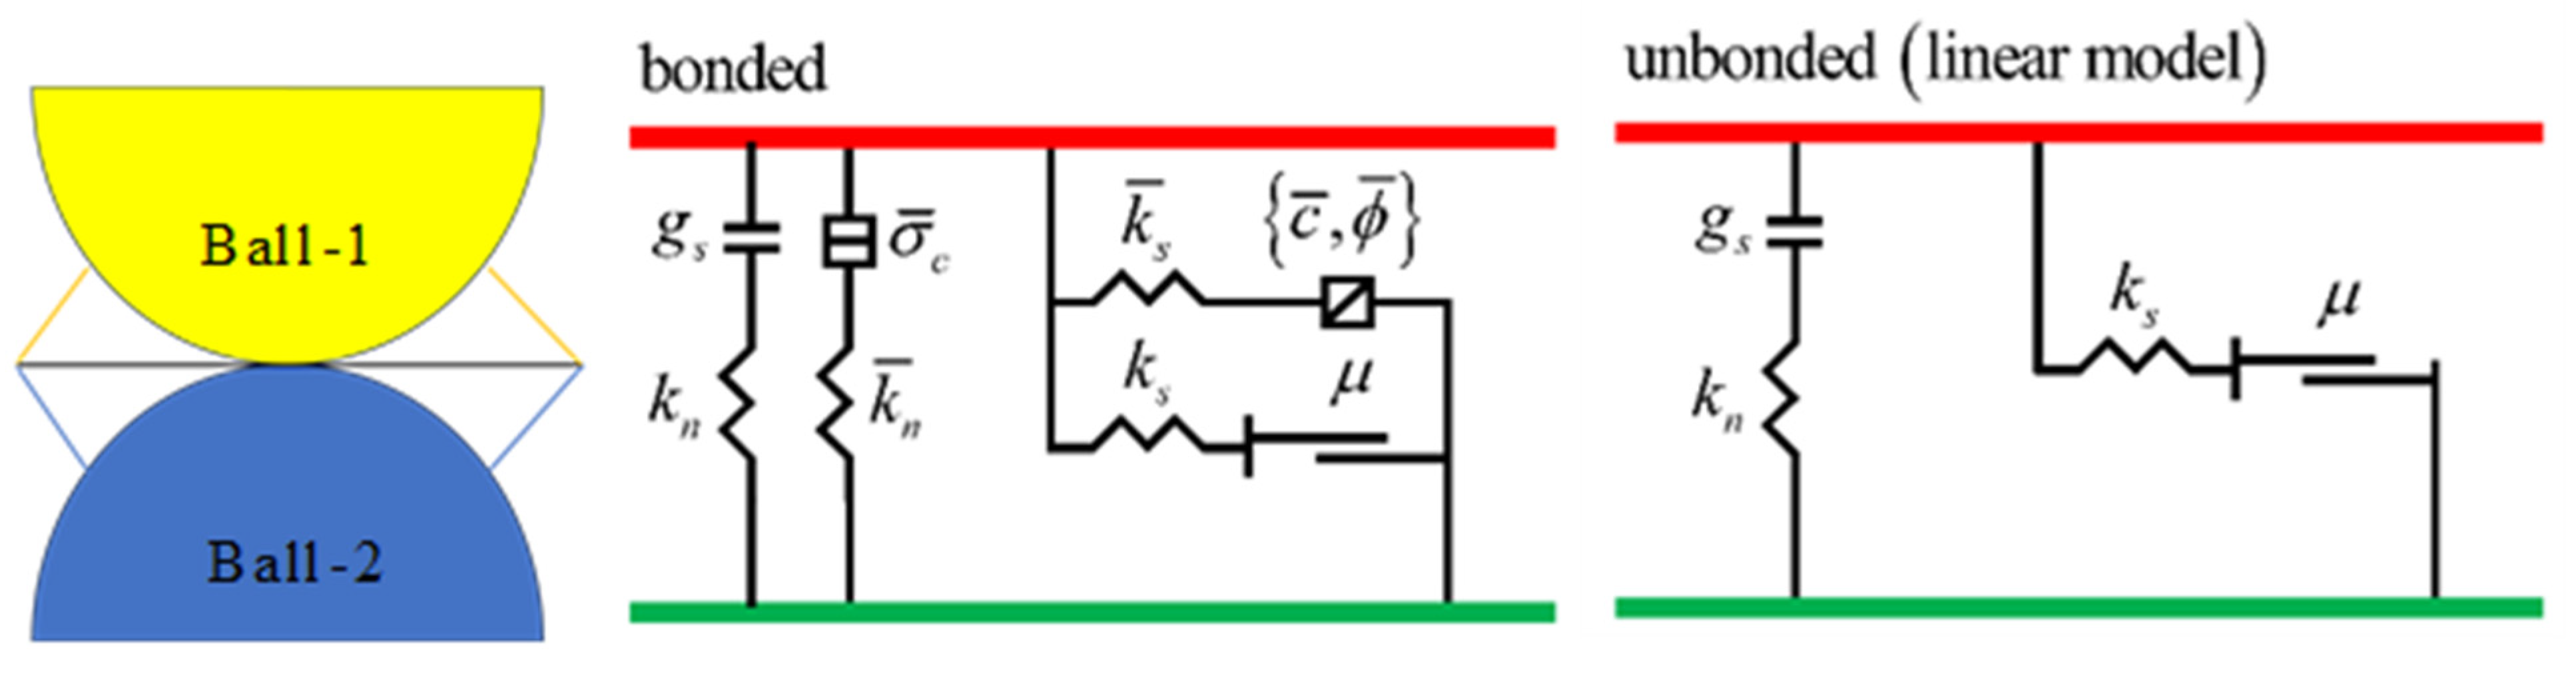
PFC 3D incorporates several built-in particle mechanics models, including the null model, linear model, linear contact bond model, and linear parallel bond model. This study utilizes the built-in linear parallel bond model (PBM) in PFC3D, as depicted in Figure 3. The model is derived from the bonded-particle model (BPM) established by Potyondy and Cundall in 2004 [25]. The PBM simulates rock damage by breaking the force links between particles, allowing it to replicate various rock characteristics, such as elasticity, rupture, post-peak softening, and acoustic emission (AE). The model has two states: a cemented state with parallel and linear bonds that transmit forces and moments between particles, and a non-cemented state when either the maximum normal stress or shear stress exceeds the bond strength, leaving only linear bonds to transmit forces between particles.
Figure 3.
Linear parallel bond model (from PFC documentation [26]).
3.2. PFC3D Freeze–Thaw Simulation
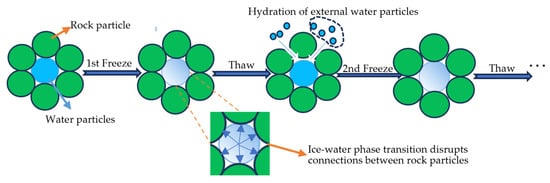
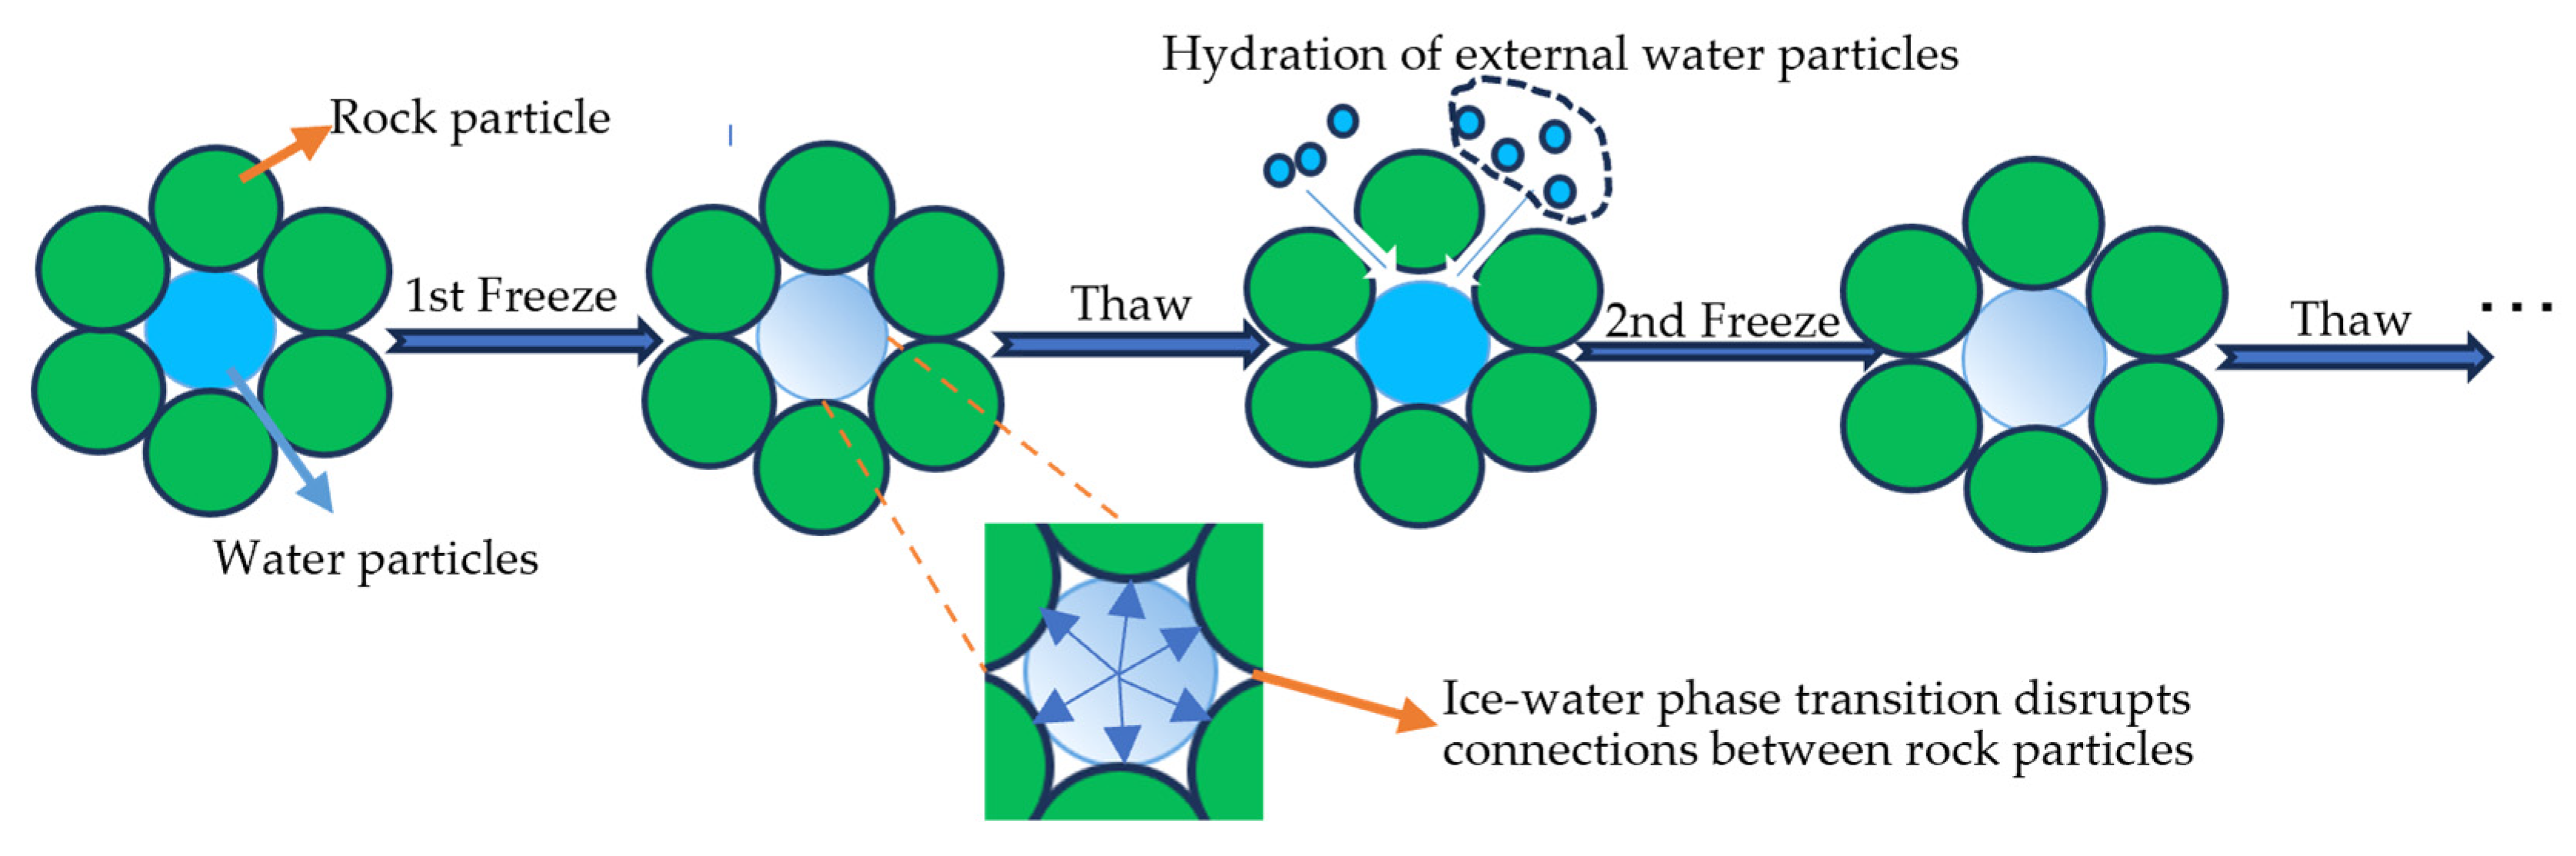
Several studies [9,27,28] have shown that volume expansion during the phase change from water to ice is the main factor leading to the freeze–thaw weathering of rocks with high water content. Figure 4 illustrates the main weathering processes. When the temperature drops to the freezing point of water, the remaining unfrozen water turns into ice in the pores. This ice expands, generating forces that compress nearby rock particles, breaking the connections between them and enlarging the pores. During external recharge, as the ice thaws, external water enters the enlarged pore space and further compresses the rock particles during subsequent freezing, resulting in an increase in pore volume. Therefore, with each freeze–thaw cycle, the rock porosity increases and its load-bearing capacity decreases as a result of this repeated process.
Figure 4.
Schematic illustration of freeze–thaw damage to rocks and the external water recharge process during thawing.
A model of water-rich sandstone grains was created in PFC 3D to analyze the ice–water phase transition process that damages the rock. The model controls the interaction between rock and water particles using the PBM. The FISH function is used to control the volume expansion of water particles during the freezing process when the temperature drops below 273.15 K, simulating the ice–water phase transition. This expansion weakens the bonds between rock particles, leading to damage from freeze–thaw cycles. The following assumptions are made in the modeling process:
- (1)
- All minerals in sandstone are represented by rock particles, and saturated sandstone is composed solely of rock particles and equivalent pore water units, simplifying the model by establishing these as the fundamental components.
- (2)
- Temperature affects the volume of water particles but not the volume of rock particles, allowing a direct correlation between temperature change and the volume expansion of water particles.
- (3)
- The irreversible volume expansion of pores caused by freeze–thaw cycles is compensated by the volume expansion of equivalent pore water units to simulate the influx of water from the external environment in the experiments. This assumption replicates the water recharge process and enables the study of freeze–thaw effects on rocks.
- (4)
- The bearing capacity of sandstone is attributed solely to the rock particle skeleton, which simplifies the model and allows for a more focused analysis of the mechanical behavior of the rock particle skeleton.
The original volume of individual equivalent pore water units before each freezing event in a rock sample is:
where is the volume of the initial equivalent pore water unit and r(N−1) is the initial radius of the equivalent pore water unit.
The volume of the equivalent pore water unit after undergoing a freeze–thaw recharge is:
where is the change in the volume of the equivalent pore water unit at the end of the freeze–thaw cycle.
The change in sandstone porosity is caused by the irrecoverable deformation resulting from the volume shift during the ice–water phase transition. During freezing, the equivalent pore water units expand because of the water-to-ice phase transition, thereby generating frost-heaving pressure on the surrounding rock skeleton. Therefore, the relationship between the alteration in sandstone porosity and the modification in water particle volume can be observed to some extent. During thawing, the ice melts, and external water can enter the enlarged pore space. In the numerical model, this process is represented by updating the initial volume of the equivalent pore water units according to the measured porosity evolution after each cycle. Thus, we posit that the law governing the replenishment of equivalent pore water units during cycling aligns with the law governing changes in sandstone porosity. Accordingly, volume expansion is attributed to the freezing stage, whereas thawing represents water replenishment into the irreversibly enlarged pores. Yuanyuan et al. [20] established a correlation between sandstone porosity alteration and the frequency of freeze–thaw cycles as follows:
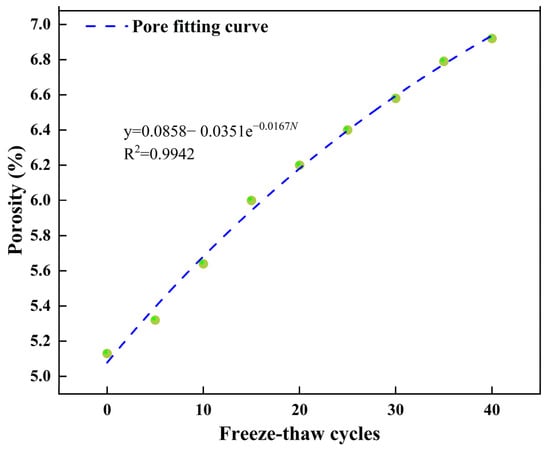
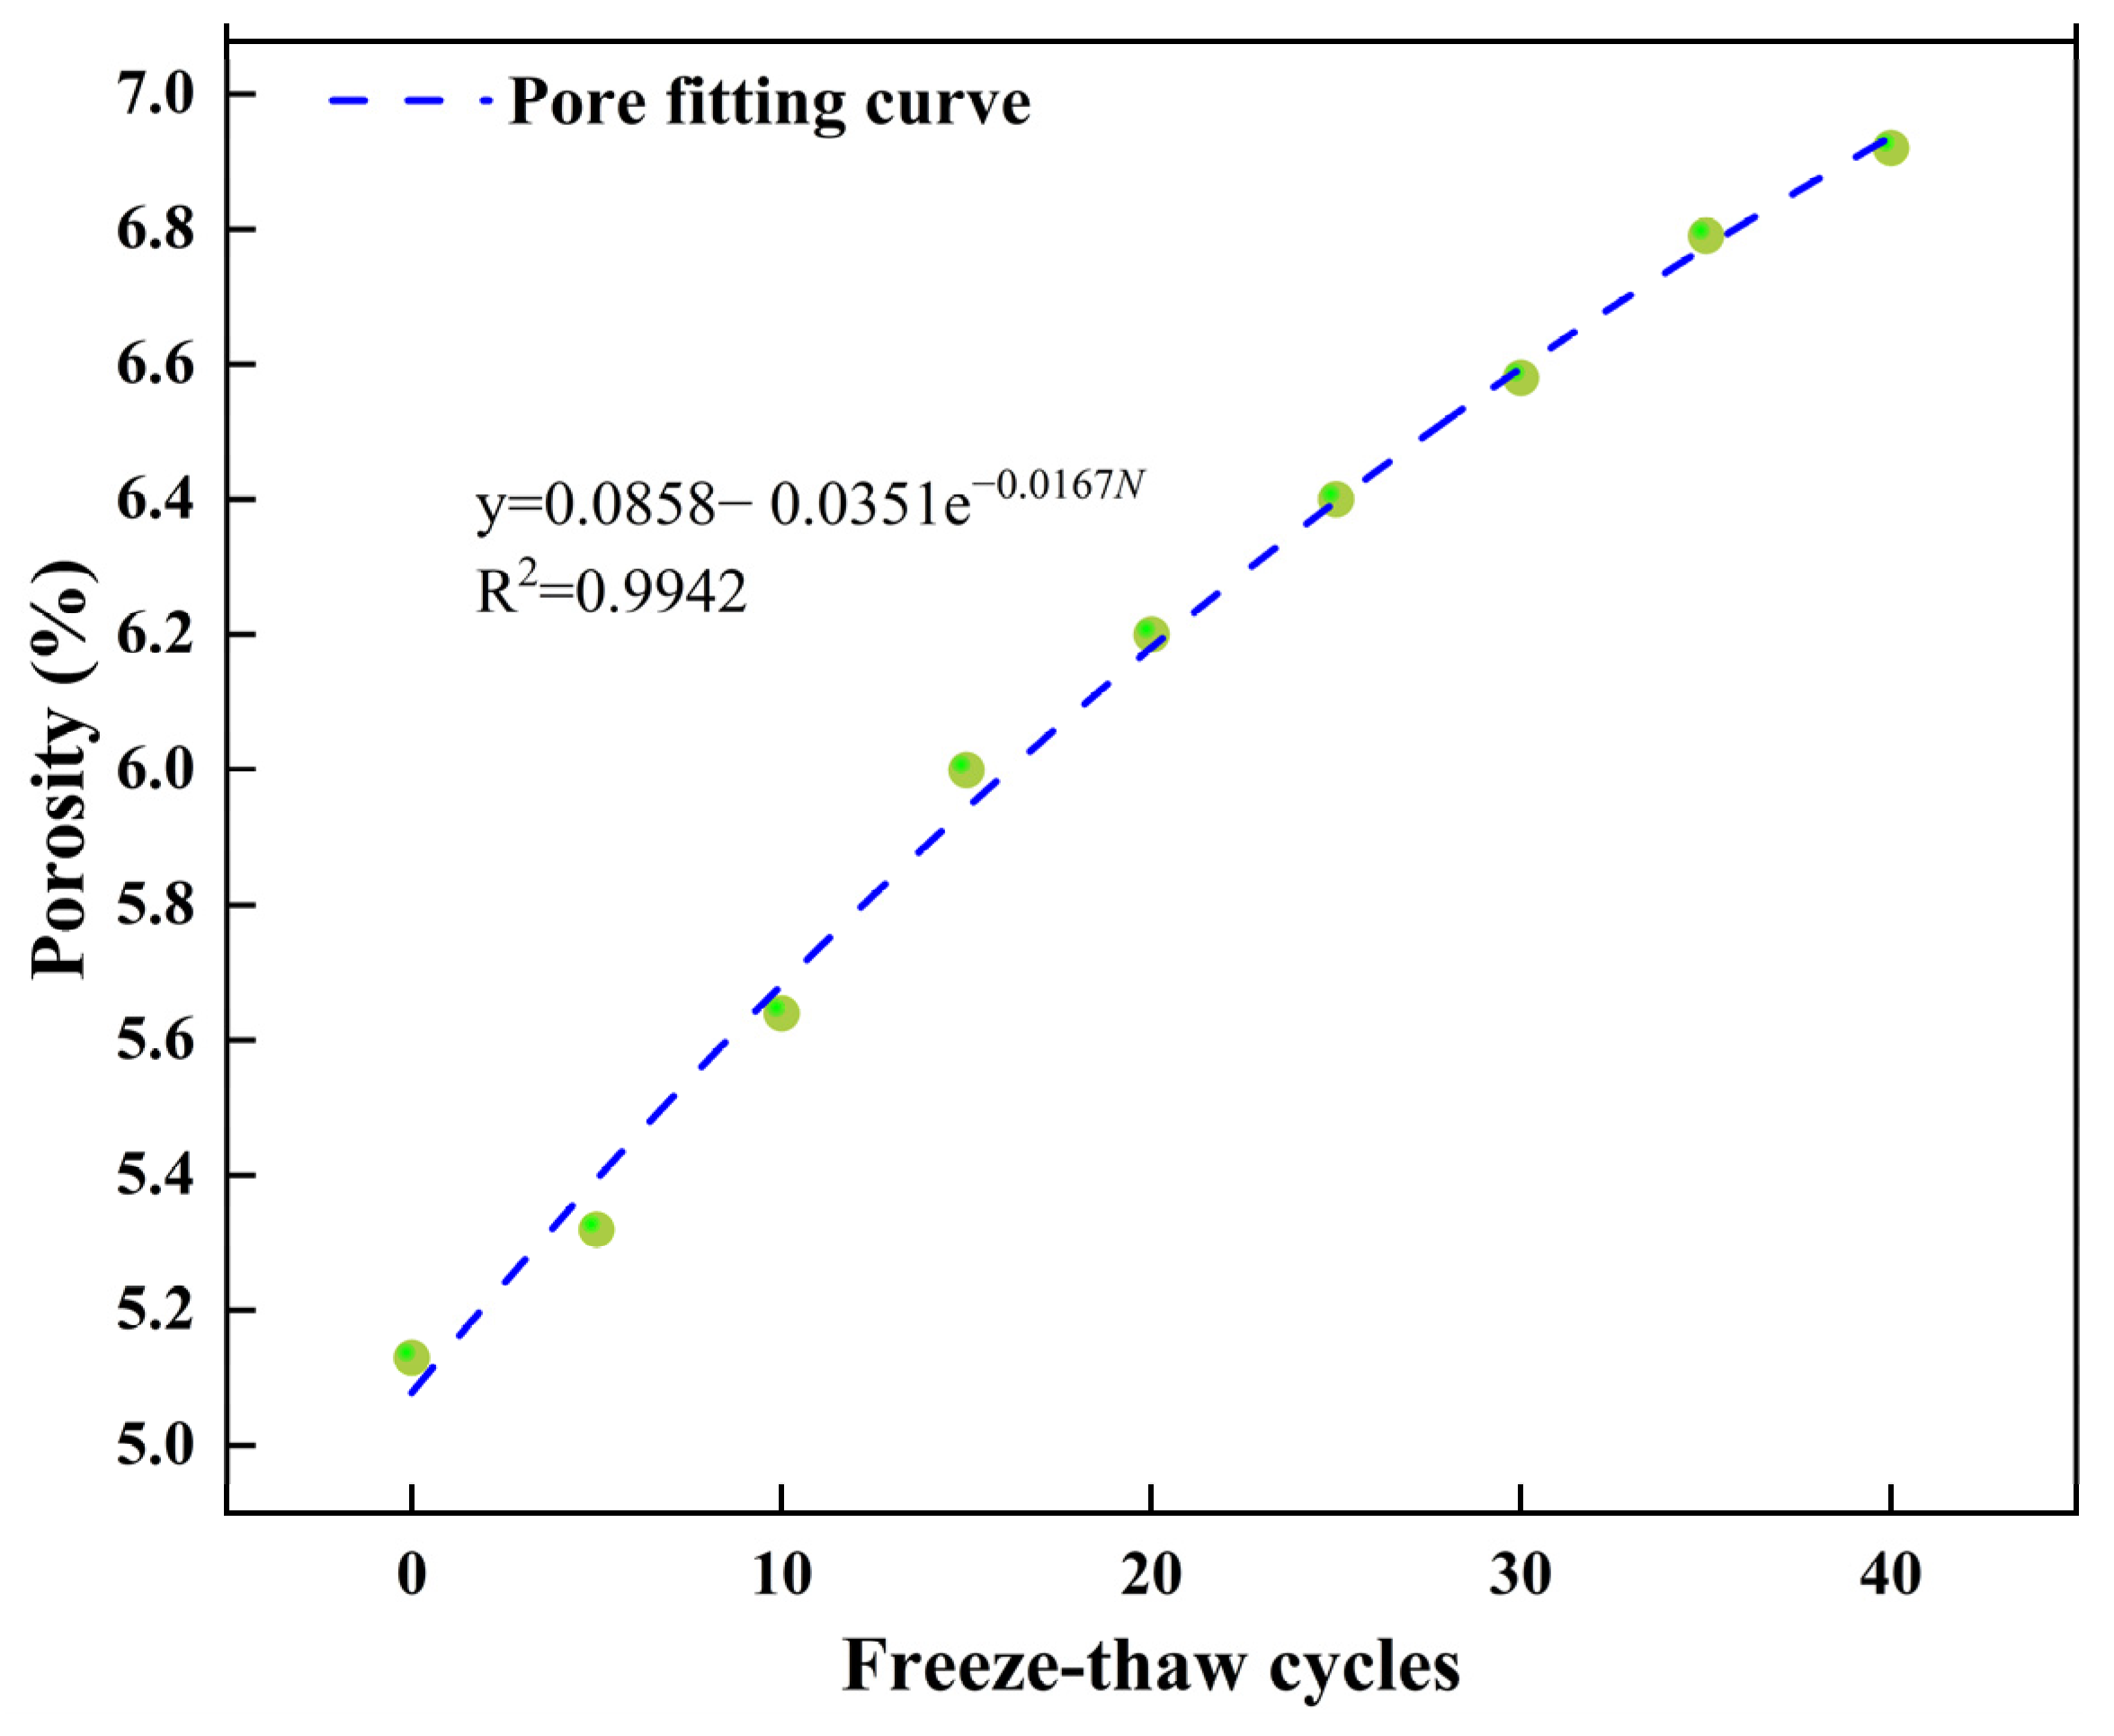
From the above formula, it can be seen that as the number of freeze–thaw cycles increases, the porosity of sandstone tends to stabilize, indicating that the volume of the rock sample and the pore volume do not increase indefinitely. This also demonstrates that the volume of the equivalent pore water unit cannot infinitely increase when simulating the water replenishment process. Combined with the above method, the relationship between the porosity of sandstone and the number of freeze–thaw cycles is fitted. The results are shown in Figure 5:
Figure 5.
Changes in porosity with the number of freeze–thaw cycles.
The increase in porosity for each cycle is determined as follows:
The relationship between changes in rock porosity and changes in pore water volume is controlled by changes in pore size, which regulate water particle recharge. The amount of replenishment after each freeze–thaw cycle and the volume of the equivalent pore water unit after replenishment can be expressed as follows:
Managing the volume expansion of the equivalent pore water unit below 273.15 K disrupts the mechanical bonds between rock particles and is crucial for simulating the freeze–thaw process of rocks. When the temperature drops below 273.15 K, liquid water remains inside the rock instead of freezing instantly. Quansheng et al. [27] described the correlation between unfrozen water in rock and temperature.
where is the freezing point at standard atmospheric pressure, denoted by a value of 273.15 K, and T is the specific temperature at the rock location. The coefficient 0.139 in Equation (7) is adopted following Quansheng et al. [29] for sandstone, as opposed to 0.116 which was calibrated for tuffaceous rocks. Given that the present study investigates water-rich sandstone, the coefficient 0.139 is the appropriate choice.
The article also states that the change in radius during an ice–water phase transition can be described as:
where and are the elastic modulus of the rock matrix and Poisson’s ratio, and are the elastic modulus of the pore ice and Poisson’s ratio, respectively, which are 9 GPa and 0.35, n is the rock porosity, and is the rock pore ice pressure.
By combining Equations (2), (6) and (7), the volume expansion of the equivalent pore water unit at each freezing cycle can be determined.
The relationship between temperature and time is described by the cosine formula, with the frequency of temperature updates considered to be 100 during the numerical simulation, as stated by Yong-jun et al. [21].
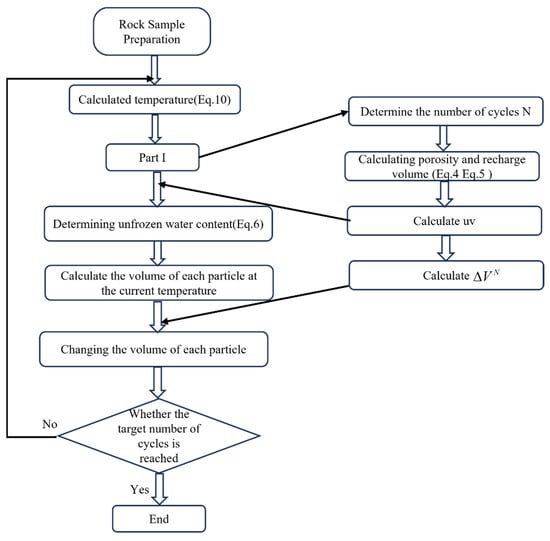
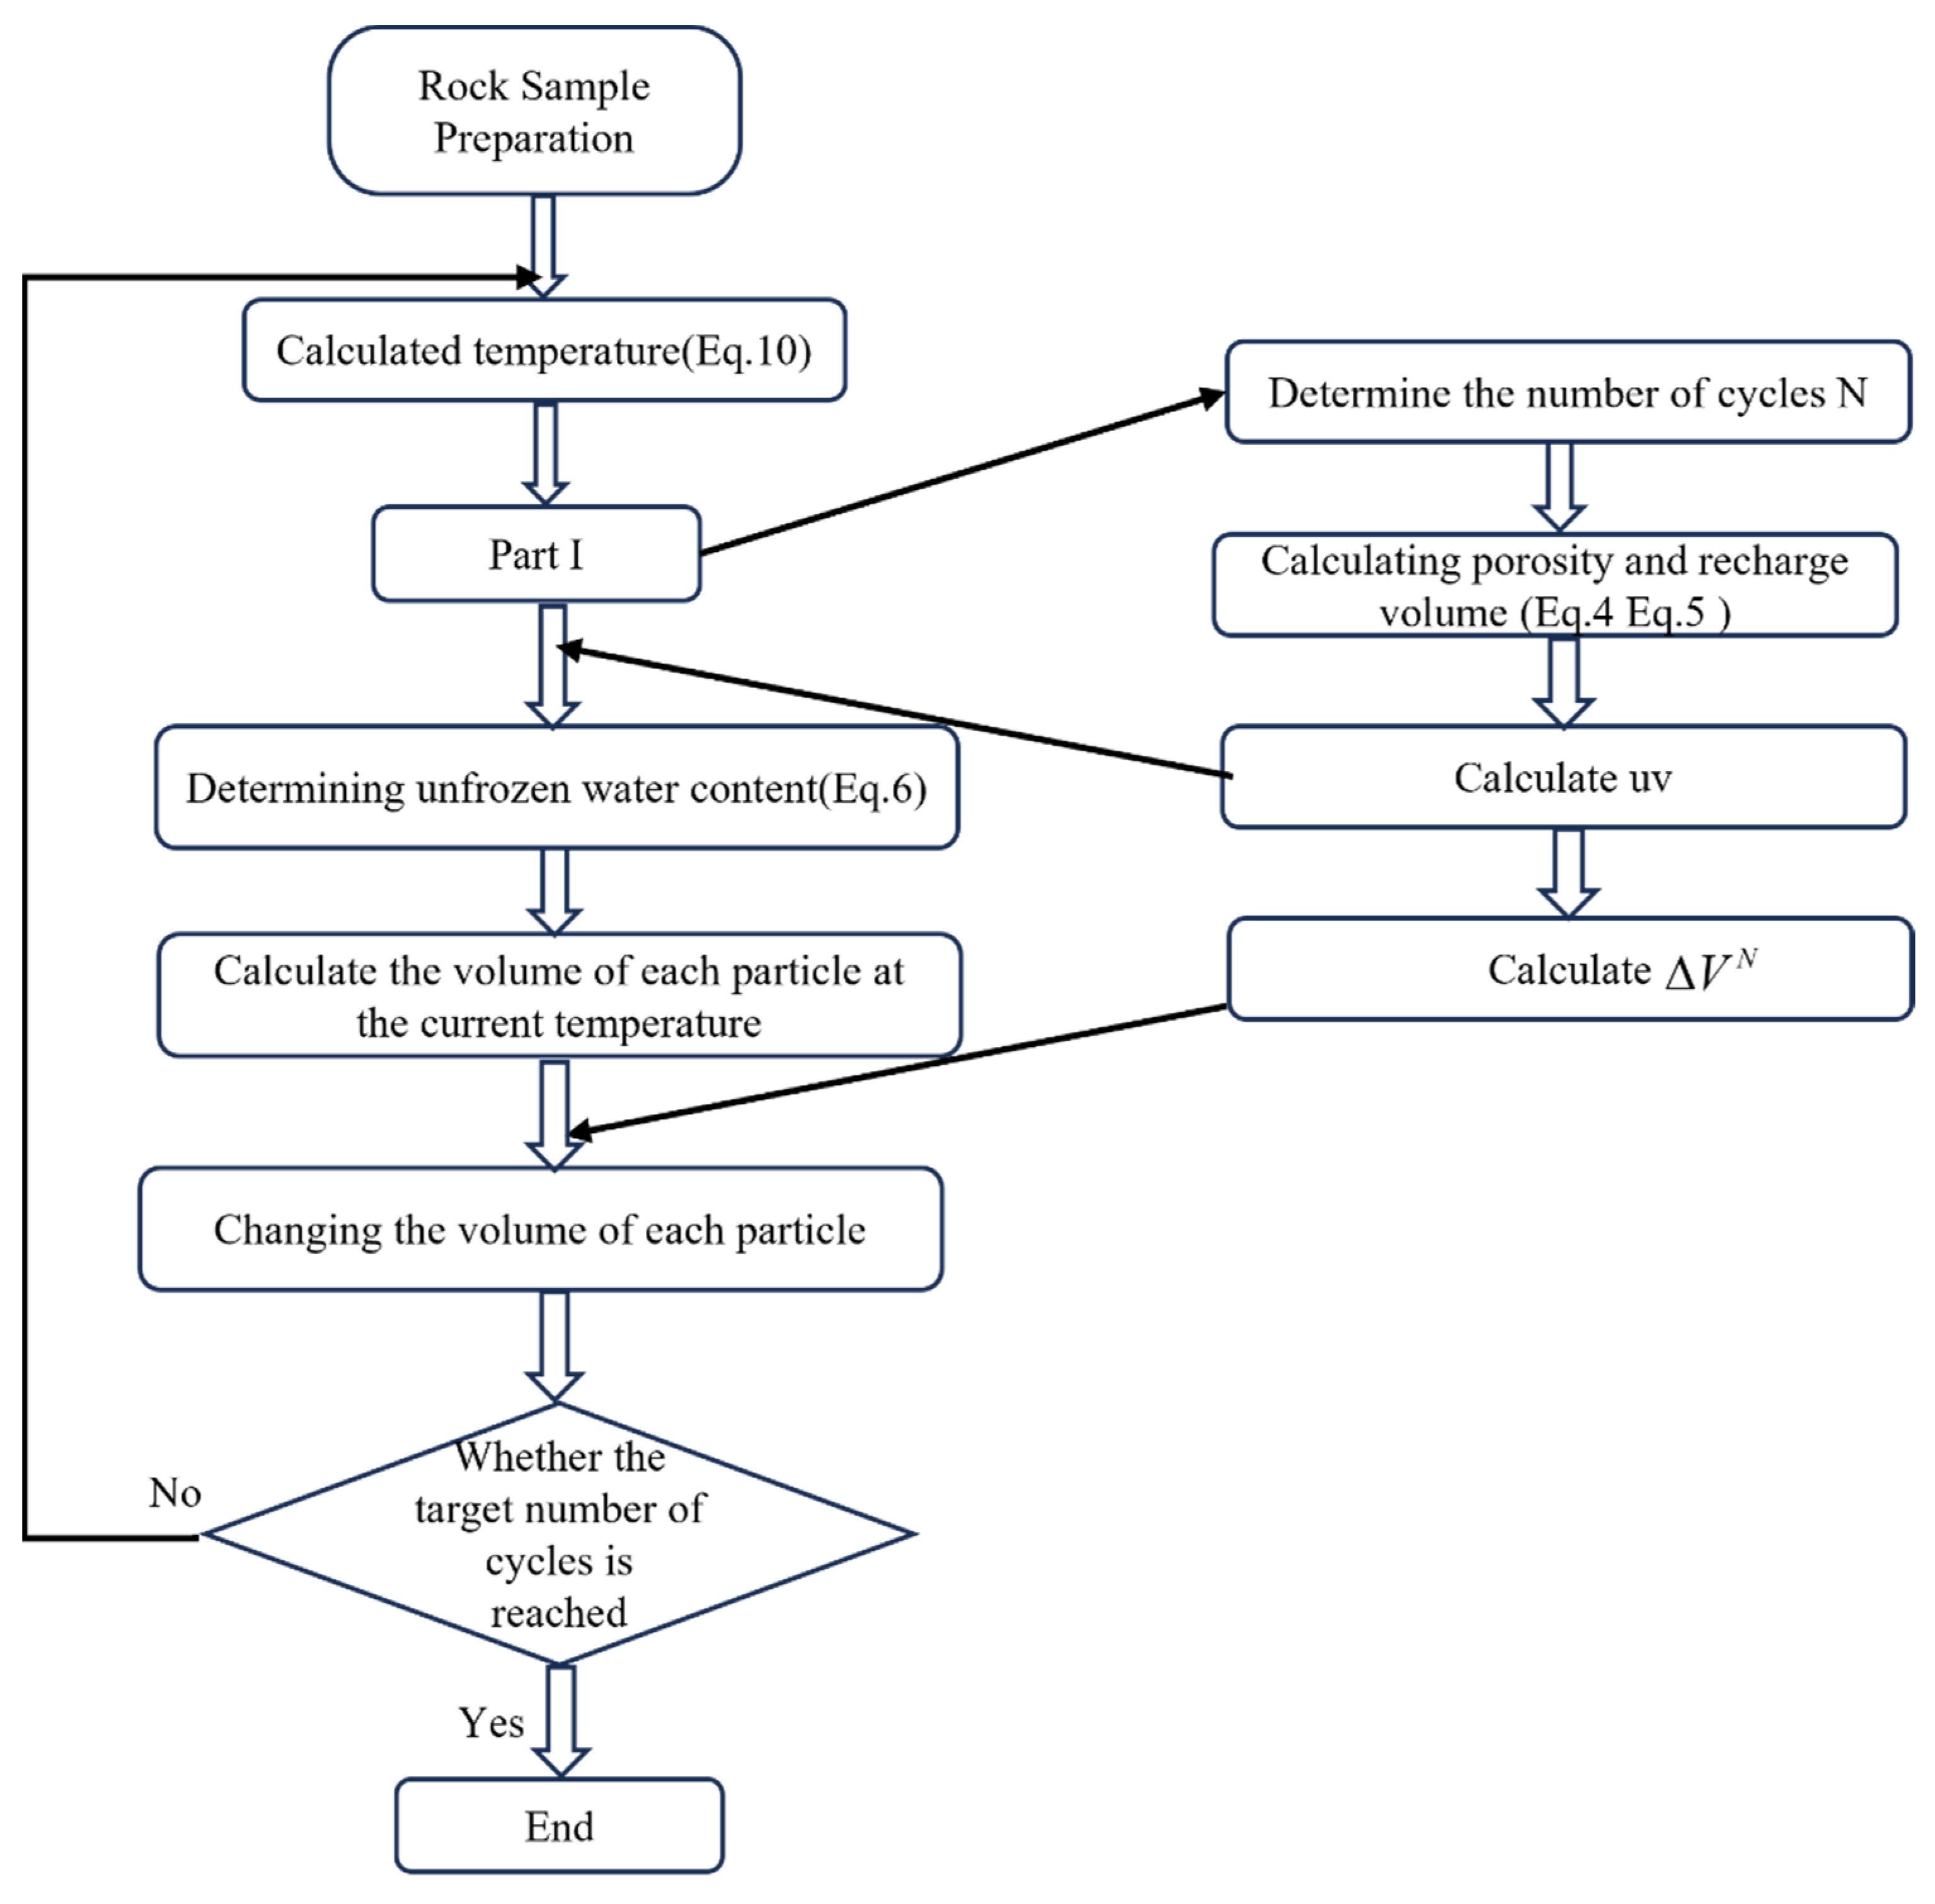
This is an example of a water particle phase change process. To control the entire rock sample, software for controlling fish language must be developed. Figure 6 demonstrates the flow control process.
Figure 6.
Flow chart of freeze–thaw cycle control.
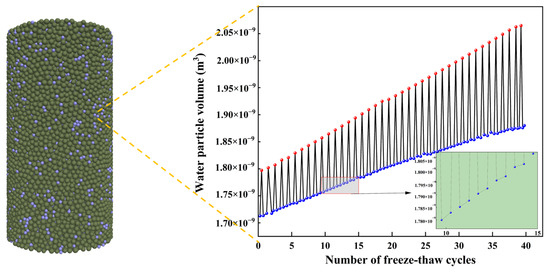
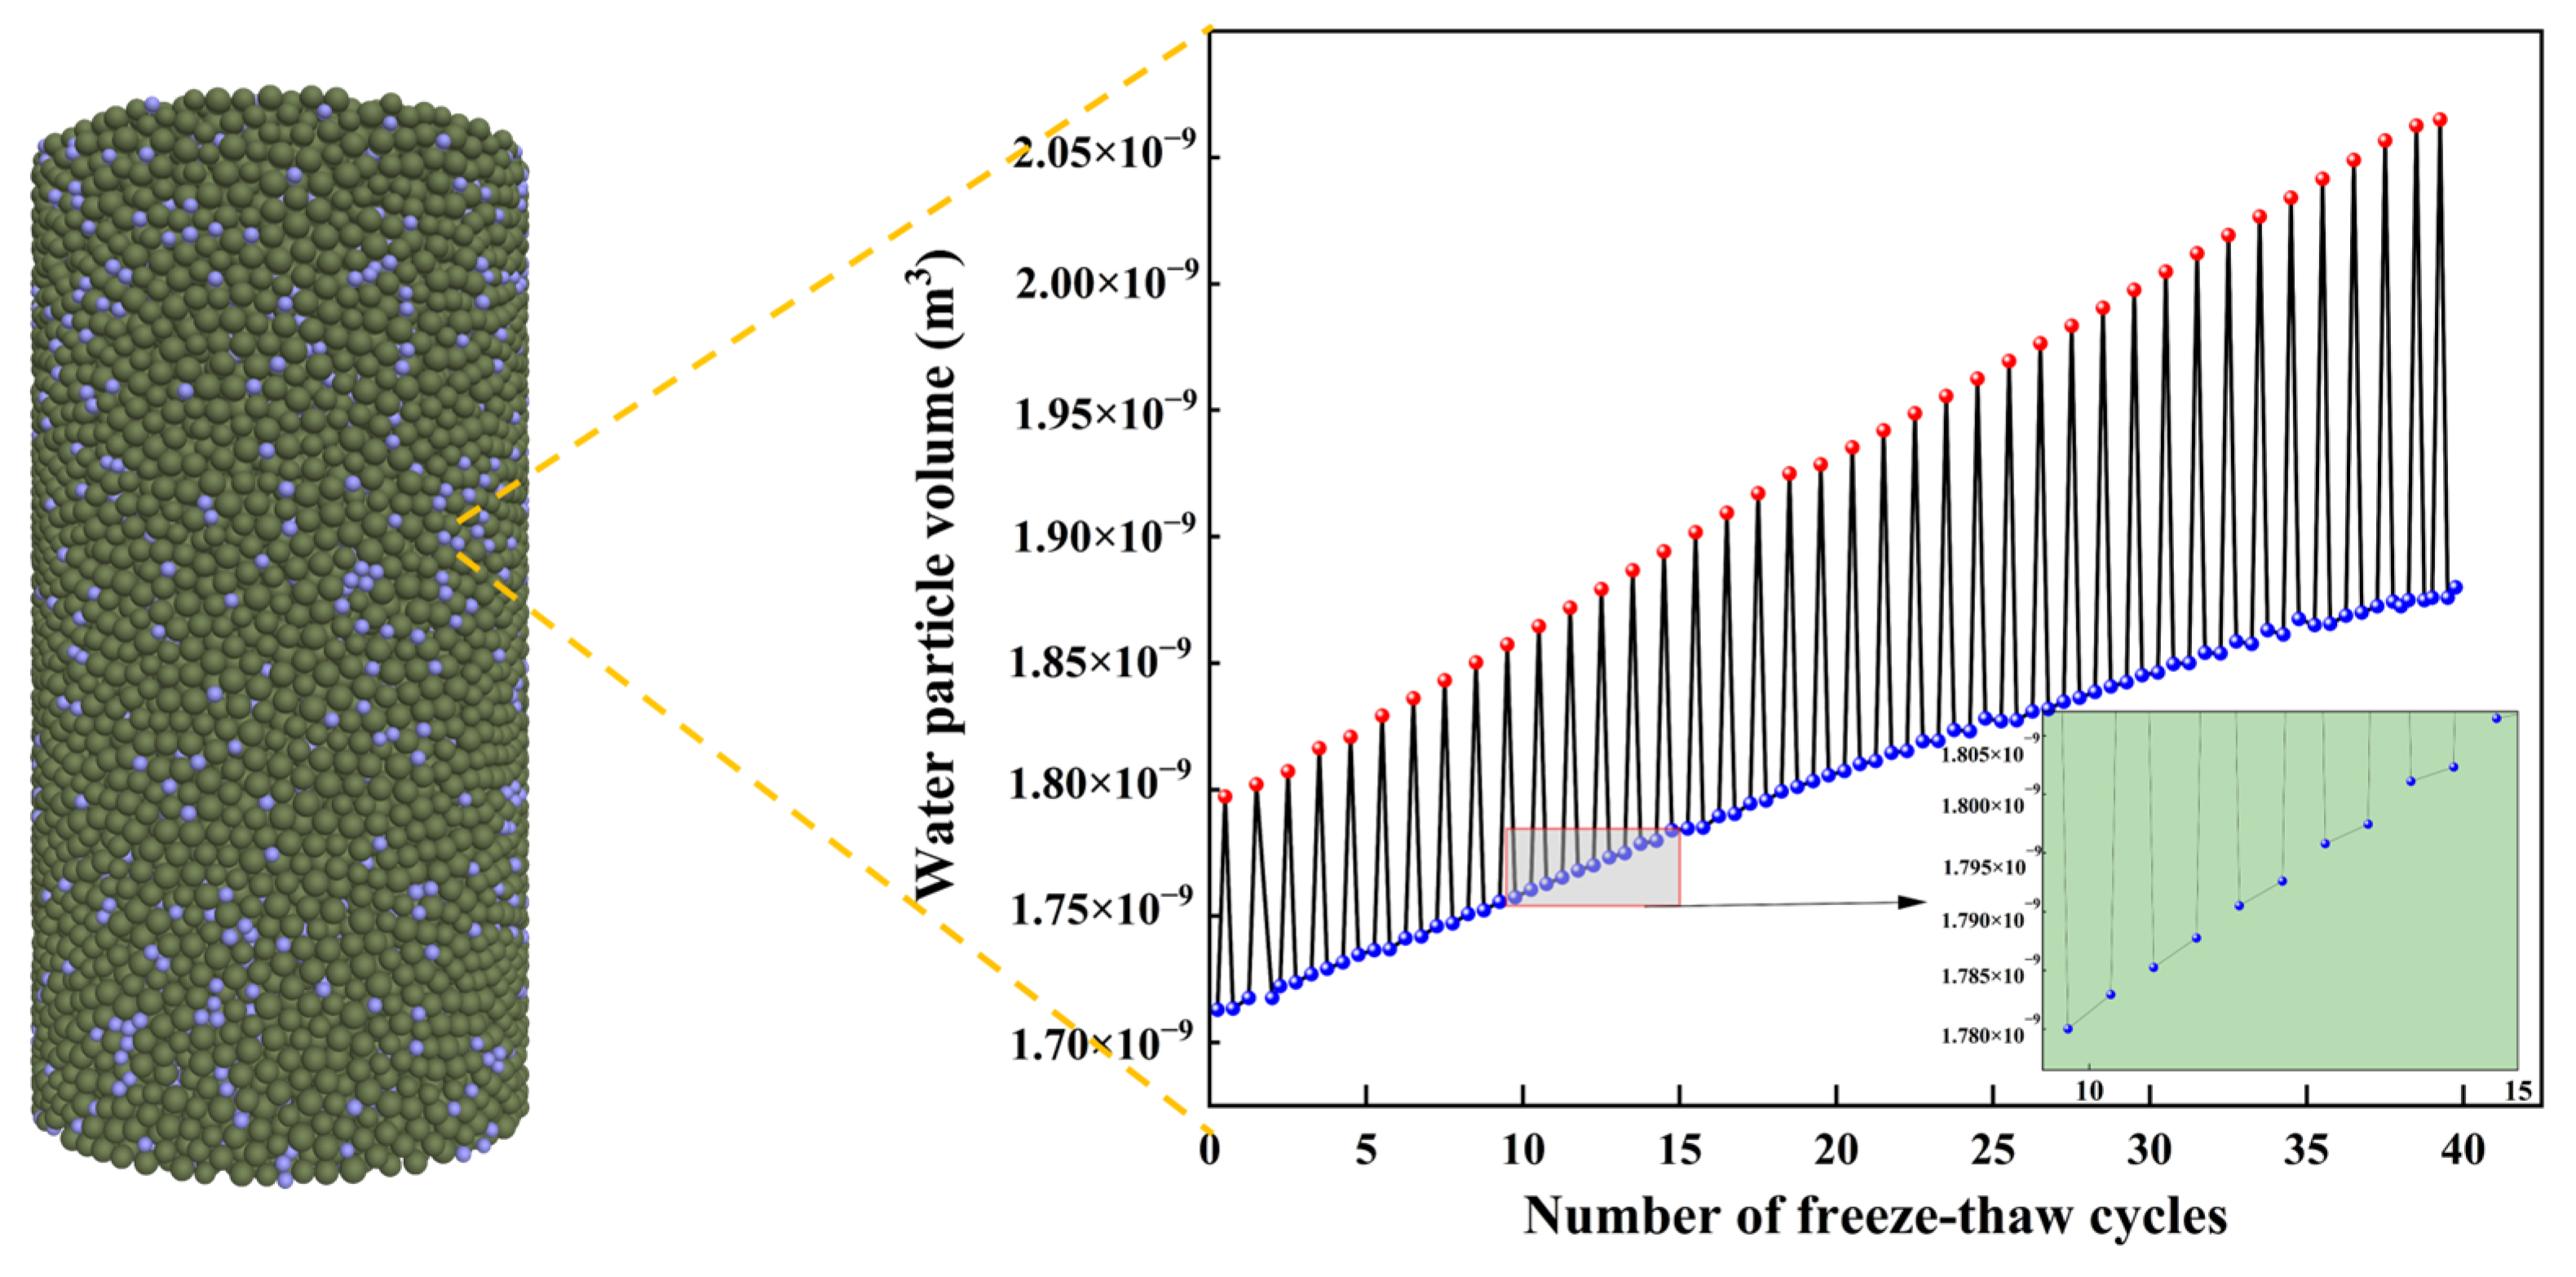
The main reason for freeze–thaw damage to rock samples is the volume expansion that occurs during the phase transition from water to ice. This paper achieves freeze–thaw cycling by controlling the volume expansion of the equivalent pore water unit to damage the interparticle connections of rock particles using a custom fish language program. A function was added to the control software to track the volume change in a randomly selected water particle. Figure 7 illustrates the relationship between the volume of the equivalent pore water unit and the frequency of freezing and thawing cycles.
Figure 7.
Volume change in equivalent pore water unit.
After each freezing phase, the volume of the equivalent pore water unit slightly increases, accurately reflecting the change in pore water volume under recharging conditions during the test. The volume of the equivalent pore water unit increased from 1.737 × 10⁻⁹ m3 to 1.905 × 10⁻⁹ m3, showing a 9.7% increase in volume. The largest volume of the equivalent pore water unit during freezing was 2.099 × 10⁻⁹ m3. It is crucial to note that the volume change during freezing is more significant than the change in water particle volume after thawing. As the frequency of freeze–thaw cycles increases, the volume difference between freezing and thawing also increases.
3.3. Building and Calibrating PFC3D Models
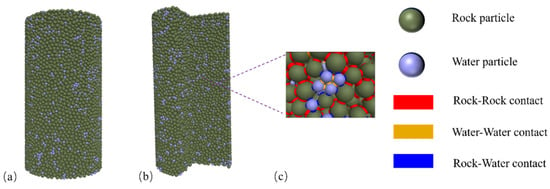
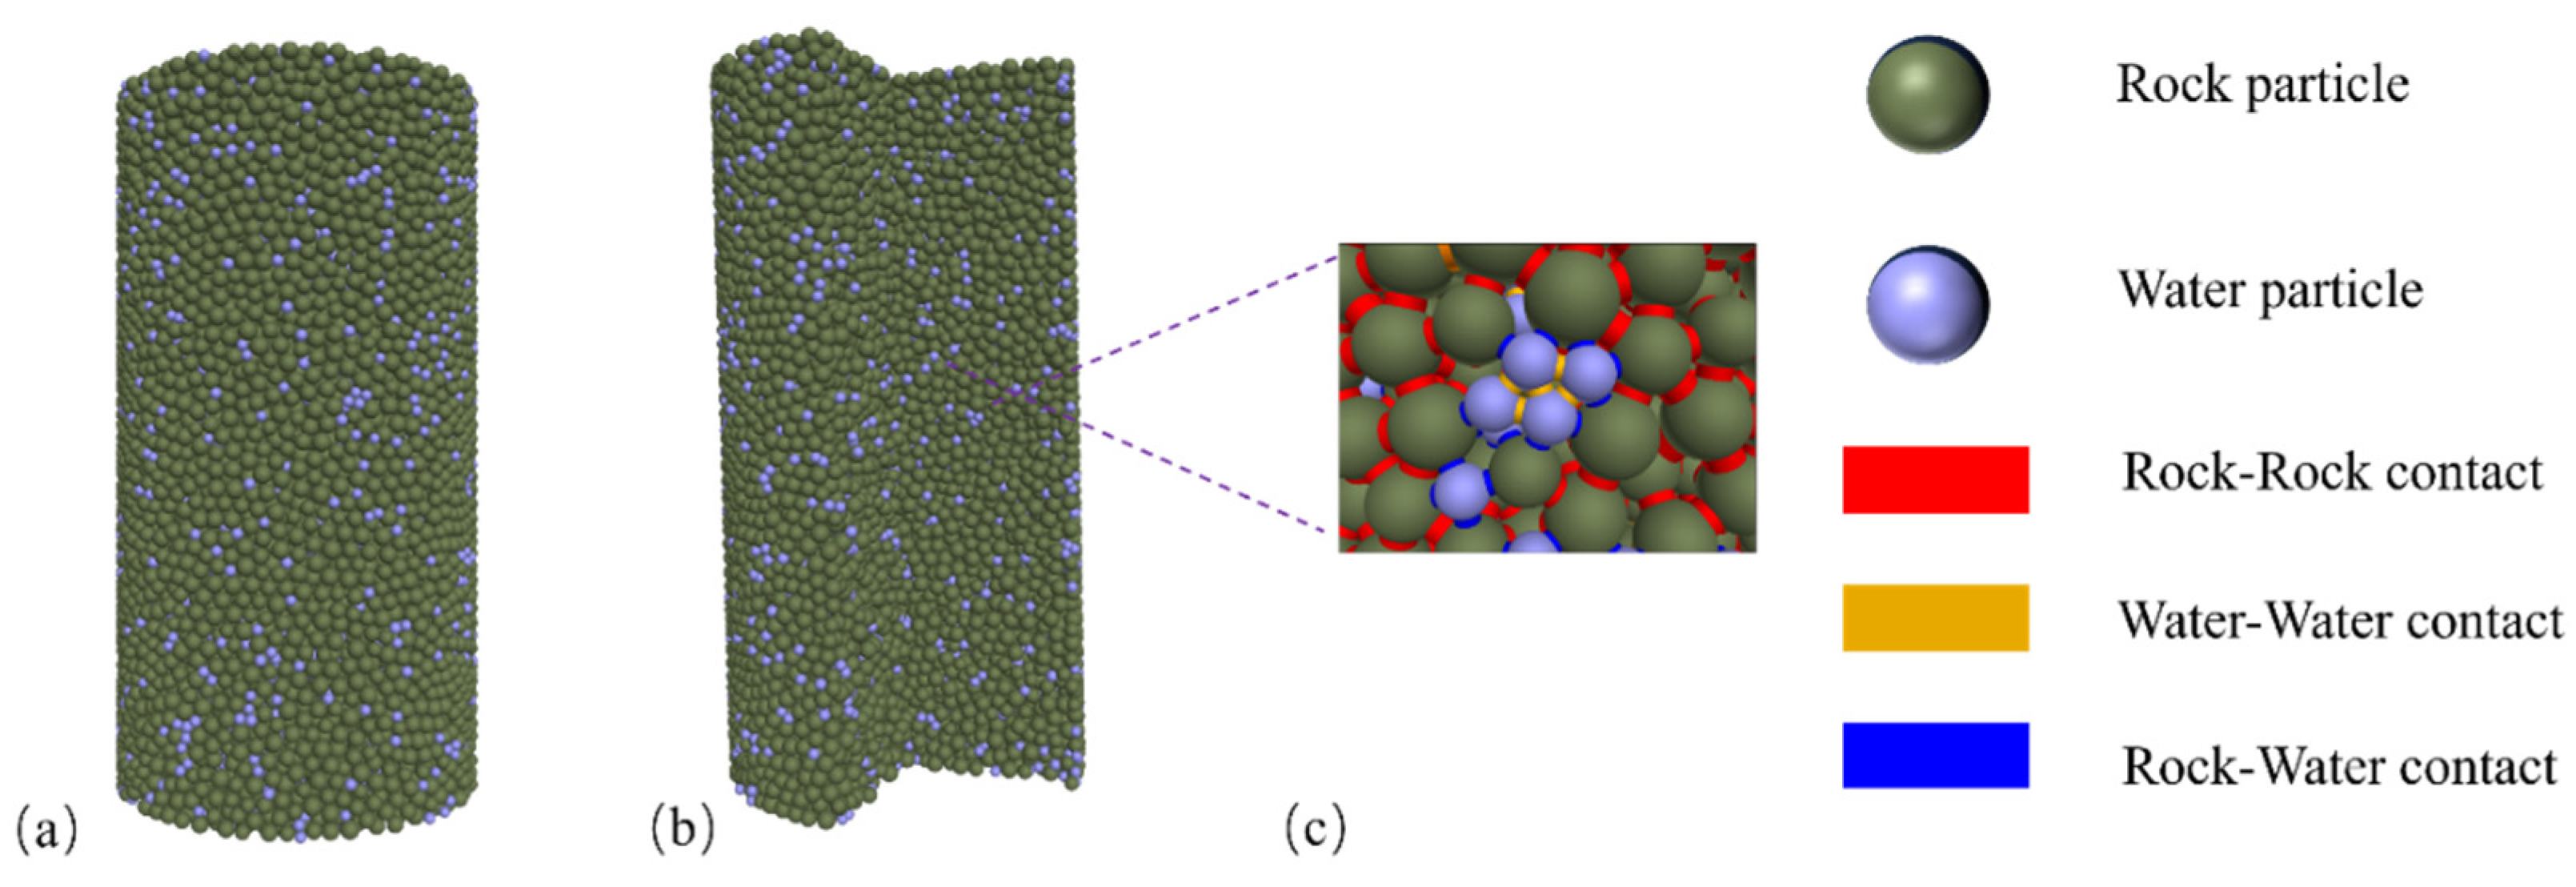
The water-rich sandstone was simplified in the modeling process to consist of rock particles and equivalent pore water units. A linear parallel bond model (PBM) is employed to replicate the interaction between rock particles and the equivalent pore water units. The specific model is depicted in Figure 8, and the detailed properties of the particles are described in Table 1. There are three types of interactions between model particles: rock–rock interactions, water–water interactions, and rock–water contacts.
Figure 8.
Numerical modeling of water-rich sandstones in PFC3D: (a) rock model, (b) internal cross section of a rock sample, and (c) particle-mechanical contact modeling micrographs.
Table 1.
Model calculations of fine-scale parameters.
PFC software is used to identify fine-scale parameters that correspond to the macroscopic material properties, achieving simulation results consistent with the macroscopic mechanical properties. Guo Yan et al. [28] converted the macroscopic mechanical parameters of sandstone into corresponding values through empirical formulas. The empirical formula is as follows:
where E is the modulus of elasticity (GPa); Ec is the elastic modulus (GPa); kn/ks is the stiffness ratio; a = 1.652; b = −0.395.
where v is Poisson’s ratio, c = 0.209, and d = 0.111.
where σc is the compressive strength (MPa); for the parallel bond normal connection strength, (MPa); for the parallel bond tangential connection strength, (MPa); a = −0.965; b = 2.292; and c = 1.327.
where σt is the tensile strength (MPa); d = −0.174; e = 0.463; f = 0.289.
Table 2 presents the macroscopic properties of saturated sandstone. The contact parameters among the rock particles were determined through parameter inversion using Equations (11)–(14). According to Yuanyuan et al. and Yong-jun et al. [19,23], the intergranular strength parameters for rock–water and water–water should be sufficiently high to induce intergranular fractures in rock when the water volume expands. Table 3 shows the various interparticle contact parameters.
Table 2.
Macromechanical parameters of sandstone.
Table 3.
Model cementation fine view parameters.
4. Simulation Results
4.1. Mechanical Behavior Evolution
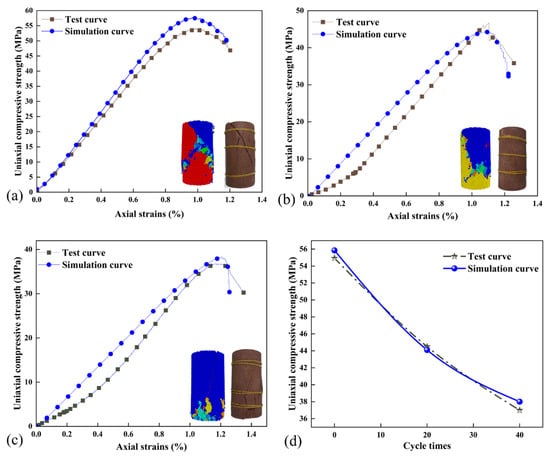
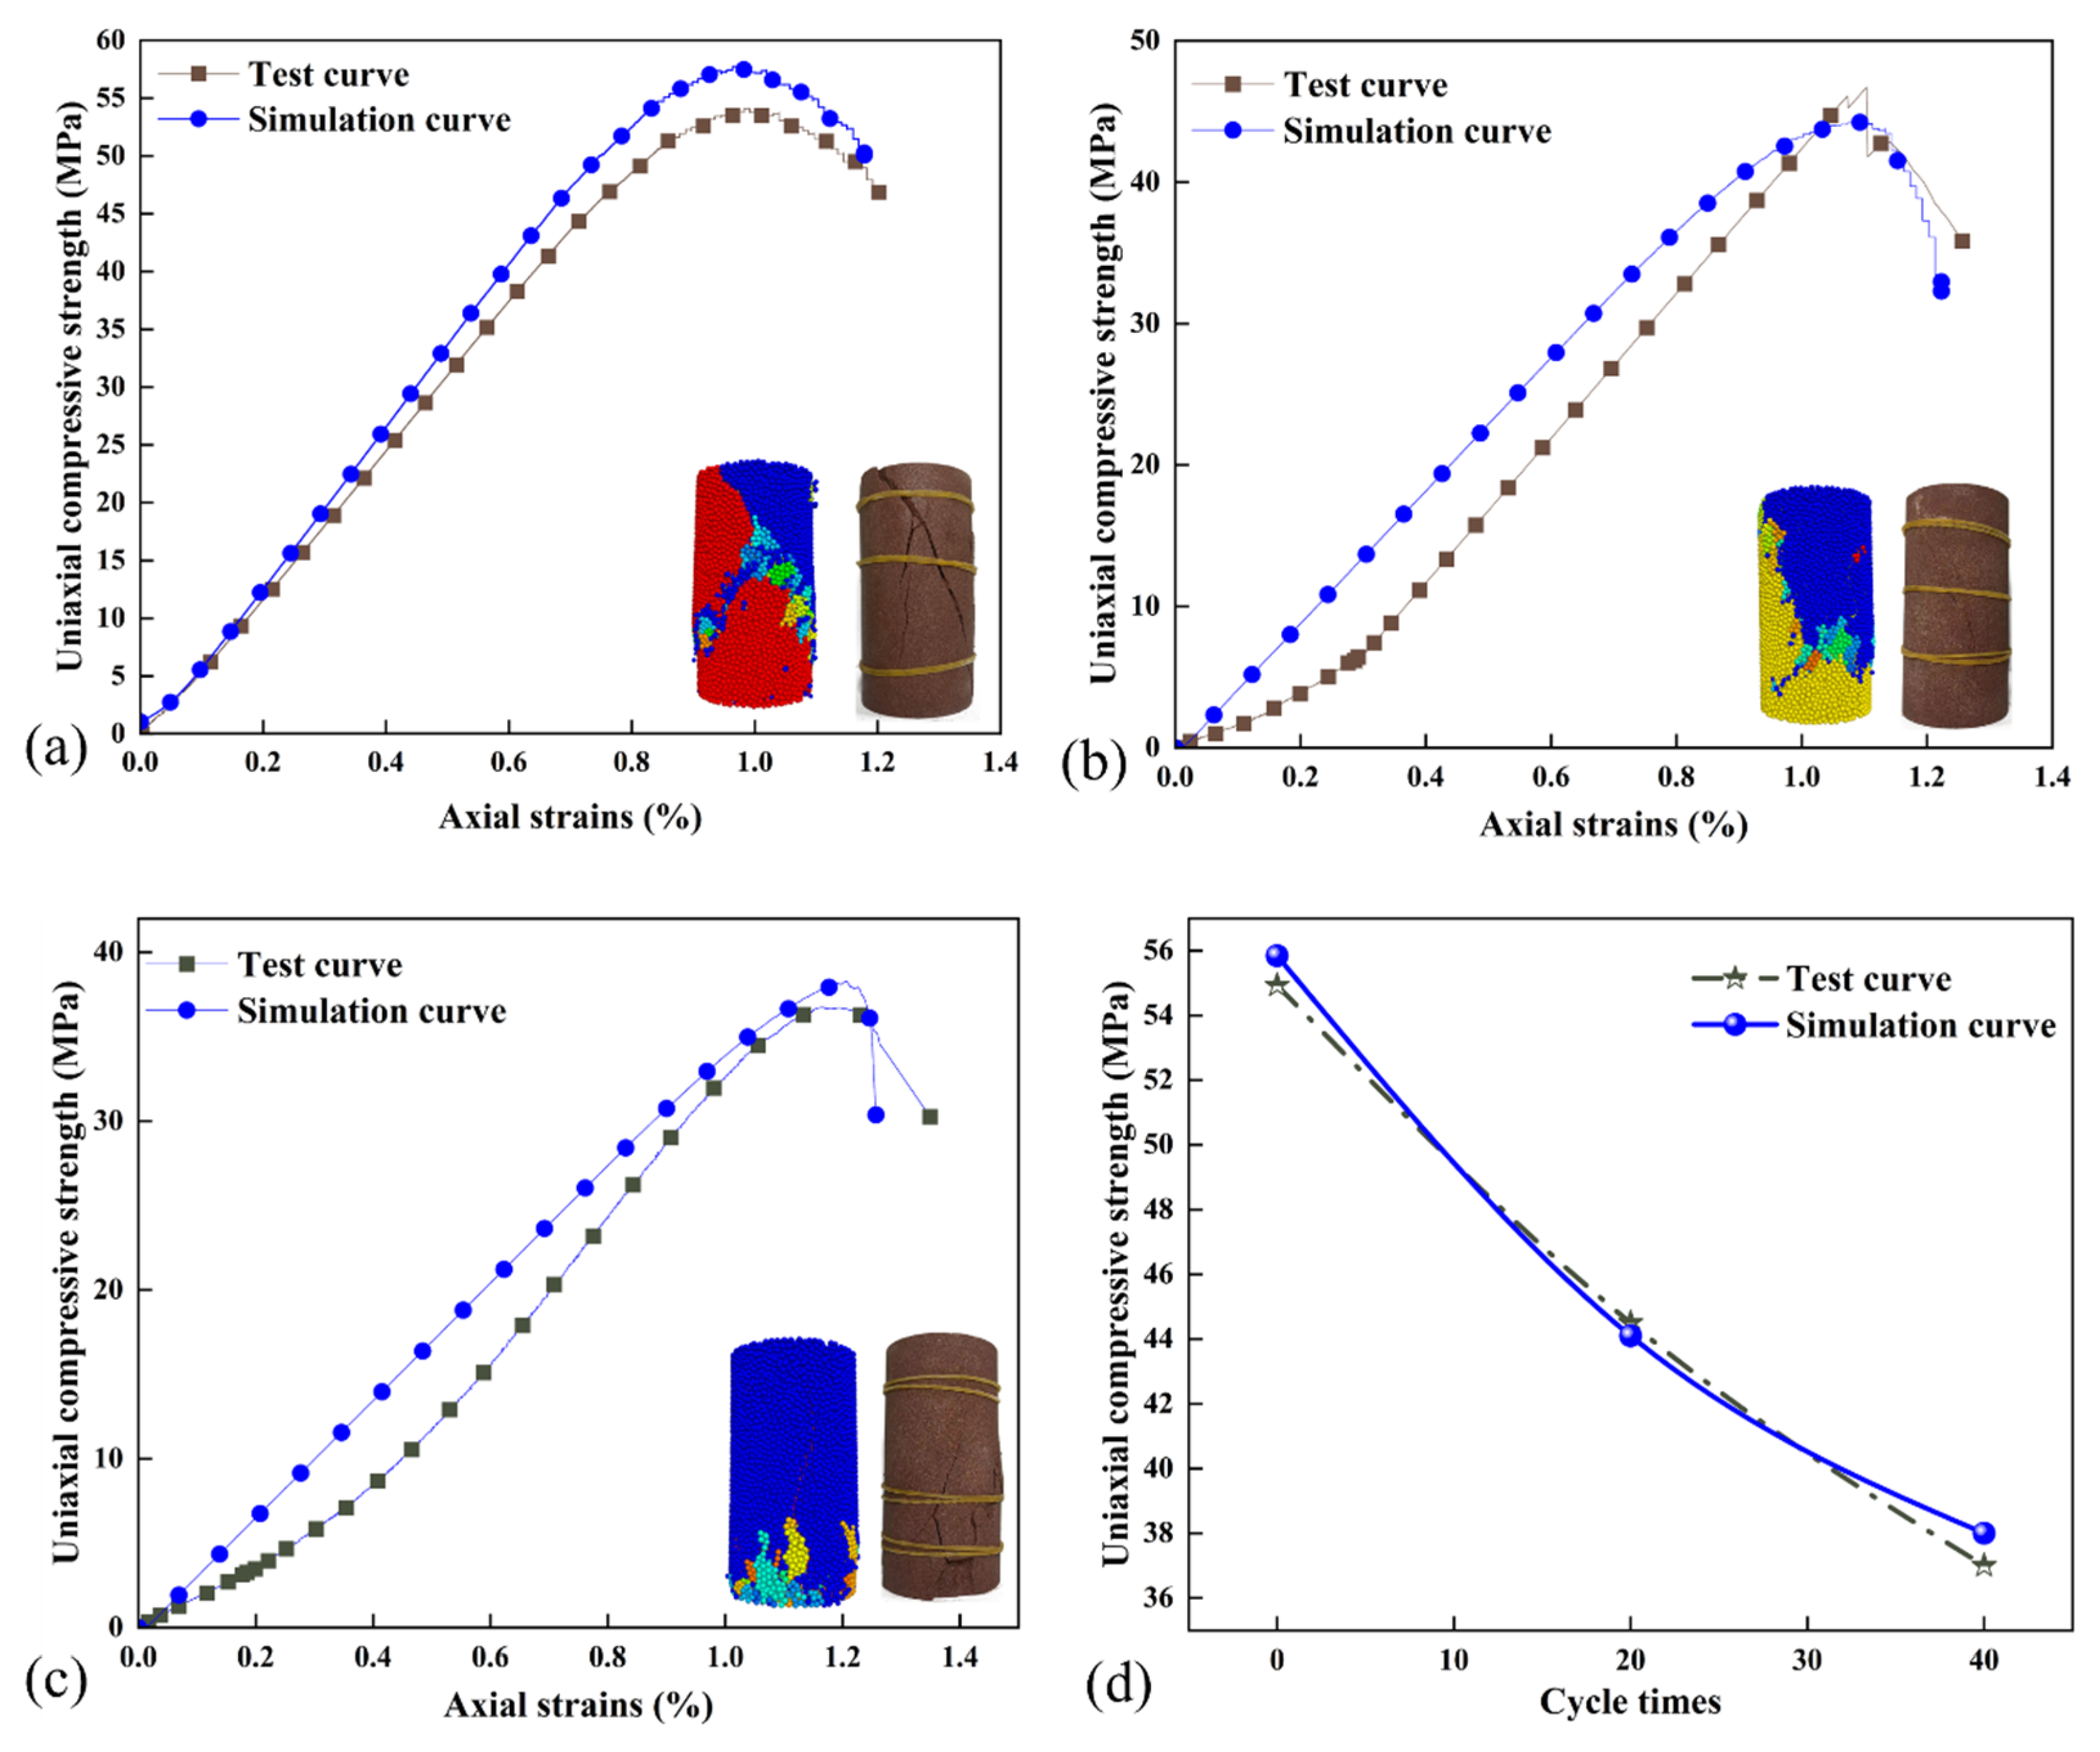
After simulating freeze–thaw cycles in PFC 3D with the calibrated parameters, equivalent pore water units were deleted to ensure that the model’s load-bearing capacity is solely provided by the rock particle skeleton. The numerical specimens were then subjected to uniaxial compression tests at a constant displacement rate of 0.02 m/s. The simulation results were compared with laboratory test data, as shown in Figure 9.
Figure 9.
Stress–strain and damage pattern comparison: (a) 0 cycles, (b) 20 cycles, (c) 40 cycles, and (d) uniaxial compressive strength.
As illustrated in Figure 9, the stress–strain curves obtained from PFC simulations lack the initial nonlinear compaction stage commonly observed in laboratory tests. This is because the discrete element method cannot inherently replicate the closure of pre-existing microcracks and pores under low stress levels. Nevertheless, with increasing freeze–thaw cycles, both the simulation and the experiment show a consistent decrease in peak strength and an increase in peak strain. The failure mode gradually transitions from shear-dominated failure to splitting failure.
Figure 9d plots the uniaxial compressive strength as a function of the number of freeze–thaw cycles. The volumetric expansion of pore water upon freezing exerts pressure on surrounding rock grains, promoting crack initiation and propagation, which ultimately leads to strength degradation. The deviation between simulated and experimental strengths remains within 5%, which is acceptable for numerical simulations.
Overall, the PFC 3D model successfully captures the deterioration trend of saturated sandstone under freeze–thaw cycles. The FISH-based control of water particle expansion enables realistic simulation of freeze–thaw damage and provides a valuable tool for analyzing the mechanical and microstructural evolution of rocks subjected to cyclic freezing and thawing.
4.2. Analysis of Damage Patterns and Microcrack Formation
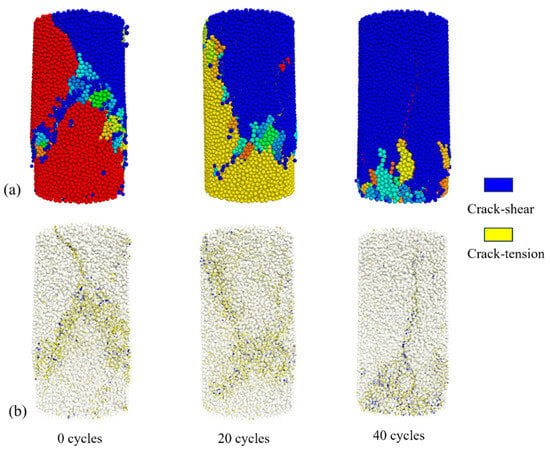
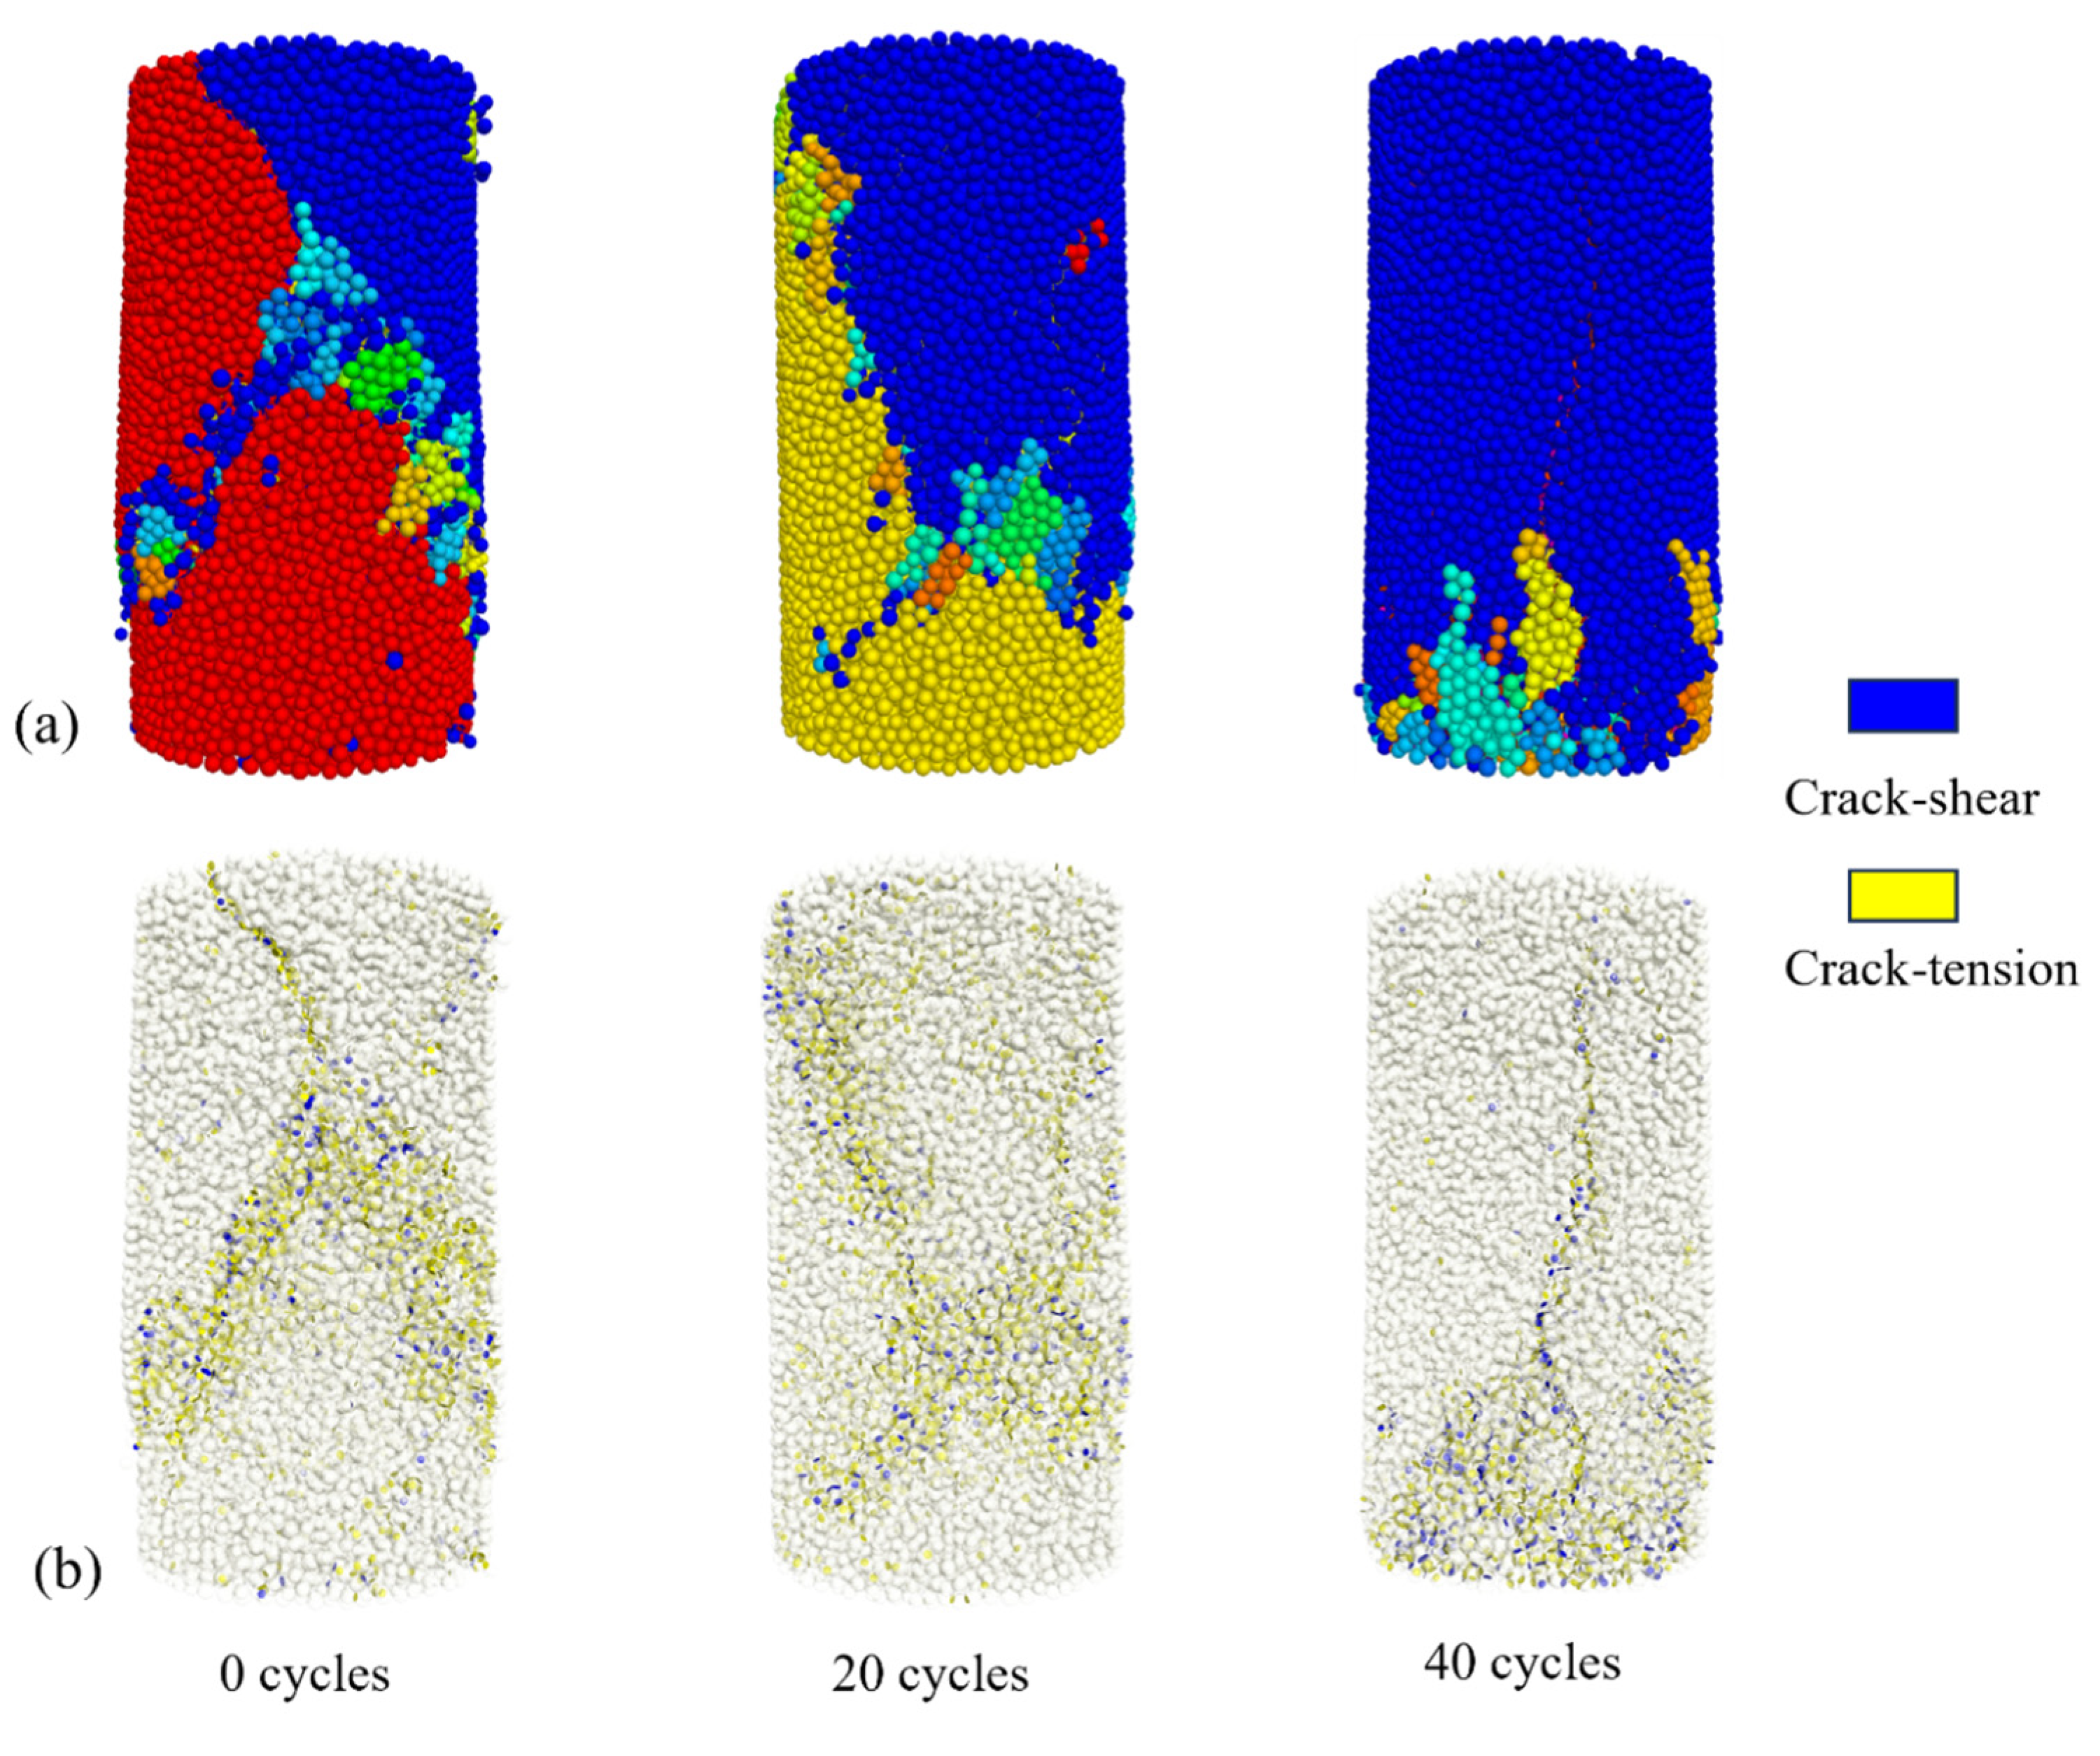
The distribution of cracks resulting from the damage caused by the freeze–thaw cycle on the sandstone specimens is shown in Figure 10. The fracture distribution observed through numerical simulation is consistent with the damage simulation and the actual damage situation of the test specimens. This result is consistent with the bonded-particle model proposed by Zhao et al. [30], which suggests that rock failure is closely related to the degradation of inter-particle bonding. When the number of freeze–thaw cycles is 0, the rock exhibits two distinct shear damage cracks. However, when the number of freeze–thaw cycles increases to 40, the rock failure transitions from shear damage to joint damage, and the sandstone shows characteristics of cleavage damage, with vertical tensile cracks appearing at the bottom. This indicates that as the number of freeze–thaw cycles increases, the rock fragmentation transitions from shear damage to cleavage damage, leading to a significant increase in the number of cracks.
Figure 10.
Distribution of damage cracks with different numbers of cycles. (a) Simulated damage forms, (b) Crack distribution after damage.
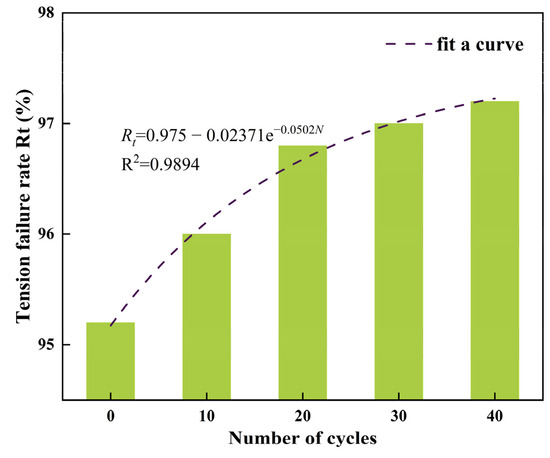
To analyze the change in the damage shape of sandstone after freeze–thaw cycles, the percentage of tensile and shear cracks following uniaxial compression was quantified. The tensile damage rate, Rt, was employed to describe the damage of the rock samples as per Yuanyuan et al. [20]. The Rt curve during uniaxial compression is shown in Figure 11, focusing solely on the cracks resulting from this process.
where Nt represents the quantity of tension cracks and Nz denotes the overall number of cracks.
Figure 11.
Changes in the tensile failure rate under uniaxial compression.
As can be seen from the above figure, 90% of the damage to the sandstone is caused by tension cracks, which is consistent with previous studies by Yuanyuan et al., Tantan et al., and Yong-jun et al. [19,22,23]. This indicates that rock destruction in uniaxial compression results from tensile damage. As the number of freeze–thaw cycles increases, Rt steadily increases, and curve fitting using Equation (17) shows that it eventually stabilizes at a constant value. Under uniaxial compression, the rock will exhibit overall tensile damage and localized shear damage due to the significant difference between its tensile strength and shear strength. Additionally, F-T cycles will enhance the tensile damage of the rock. Therefore, as depicted in Figure 9, the uniaxial compressive strength of sandstone decreases macroscopically as the frequency of freezing and thawing cycles increases, leading to a shift in the failure mode toward cleavage damage.
5. Fine-Scale Characterization of Sandstone by F–T Cycles
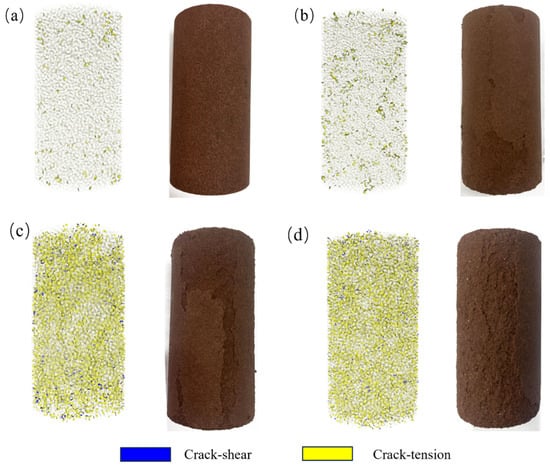
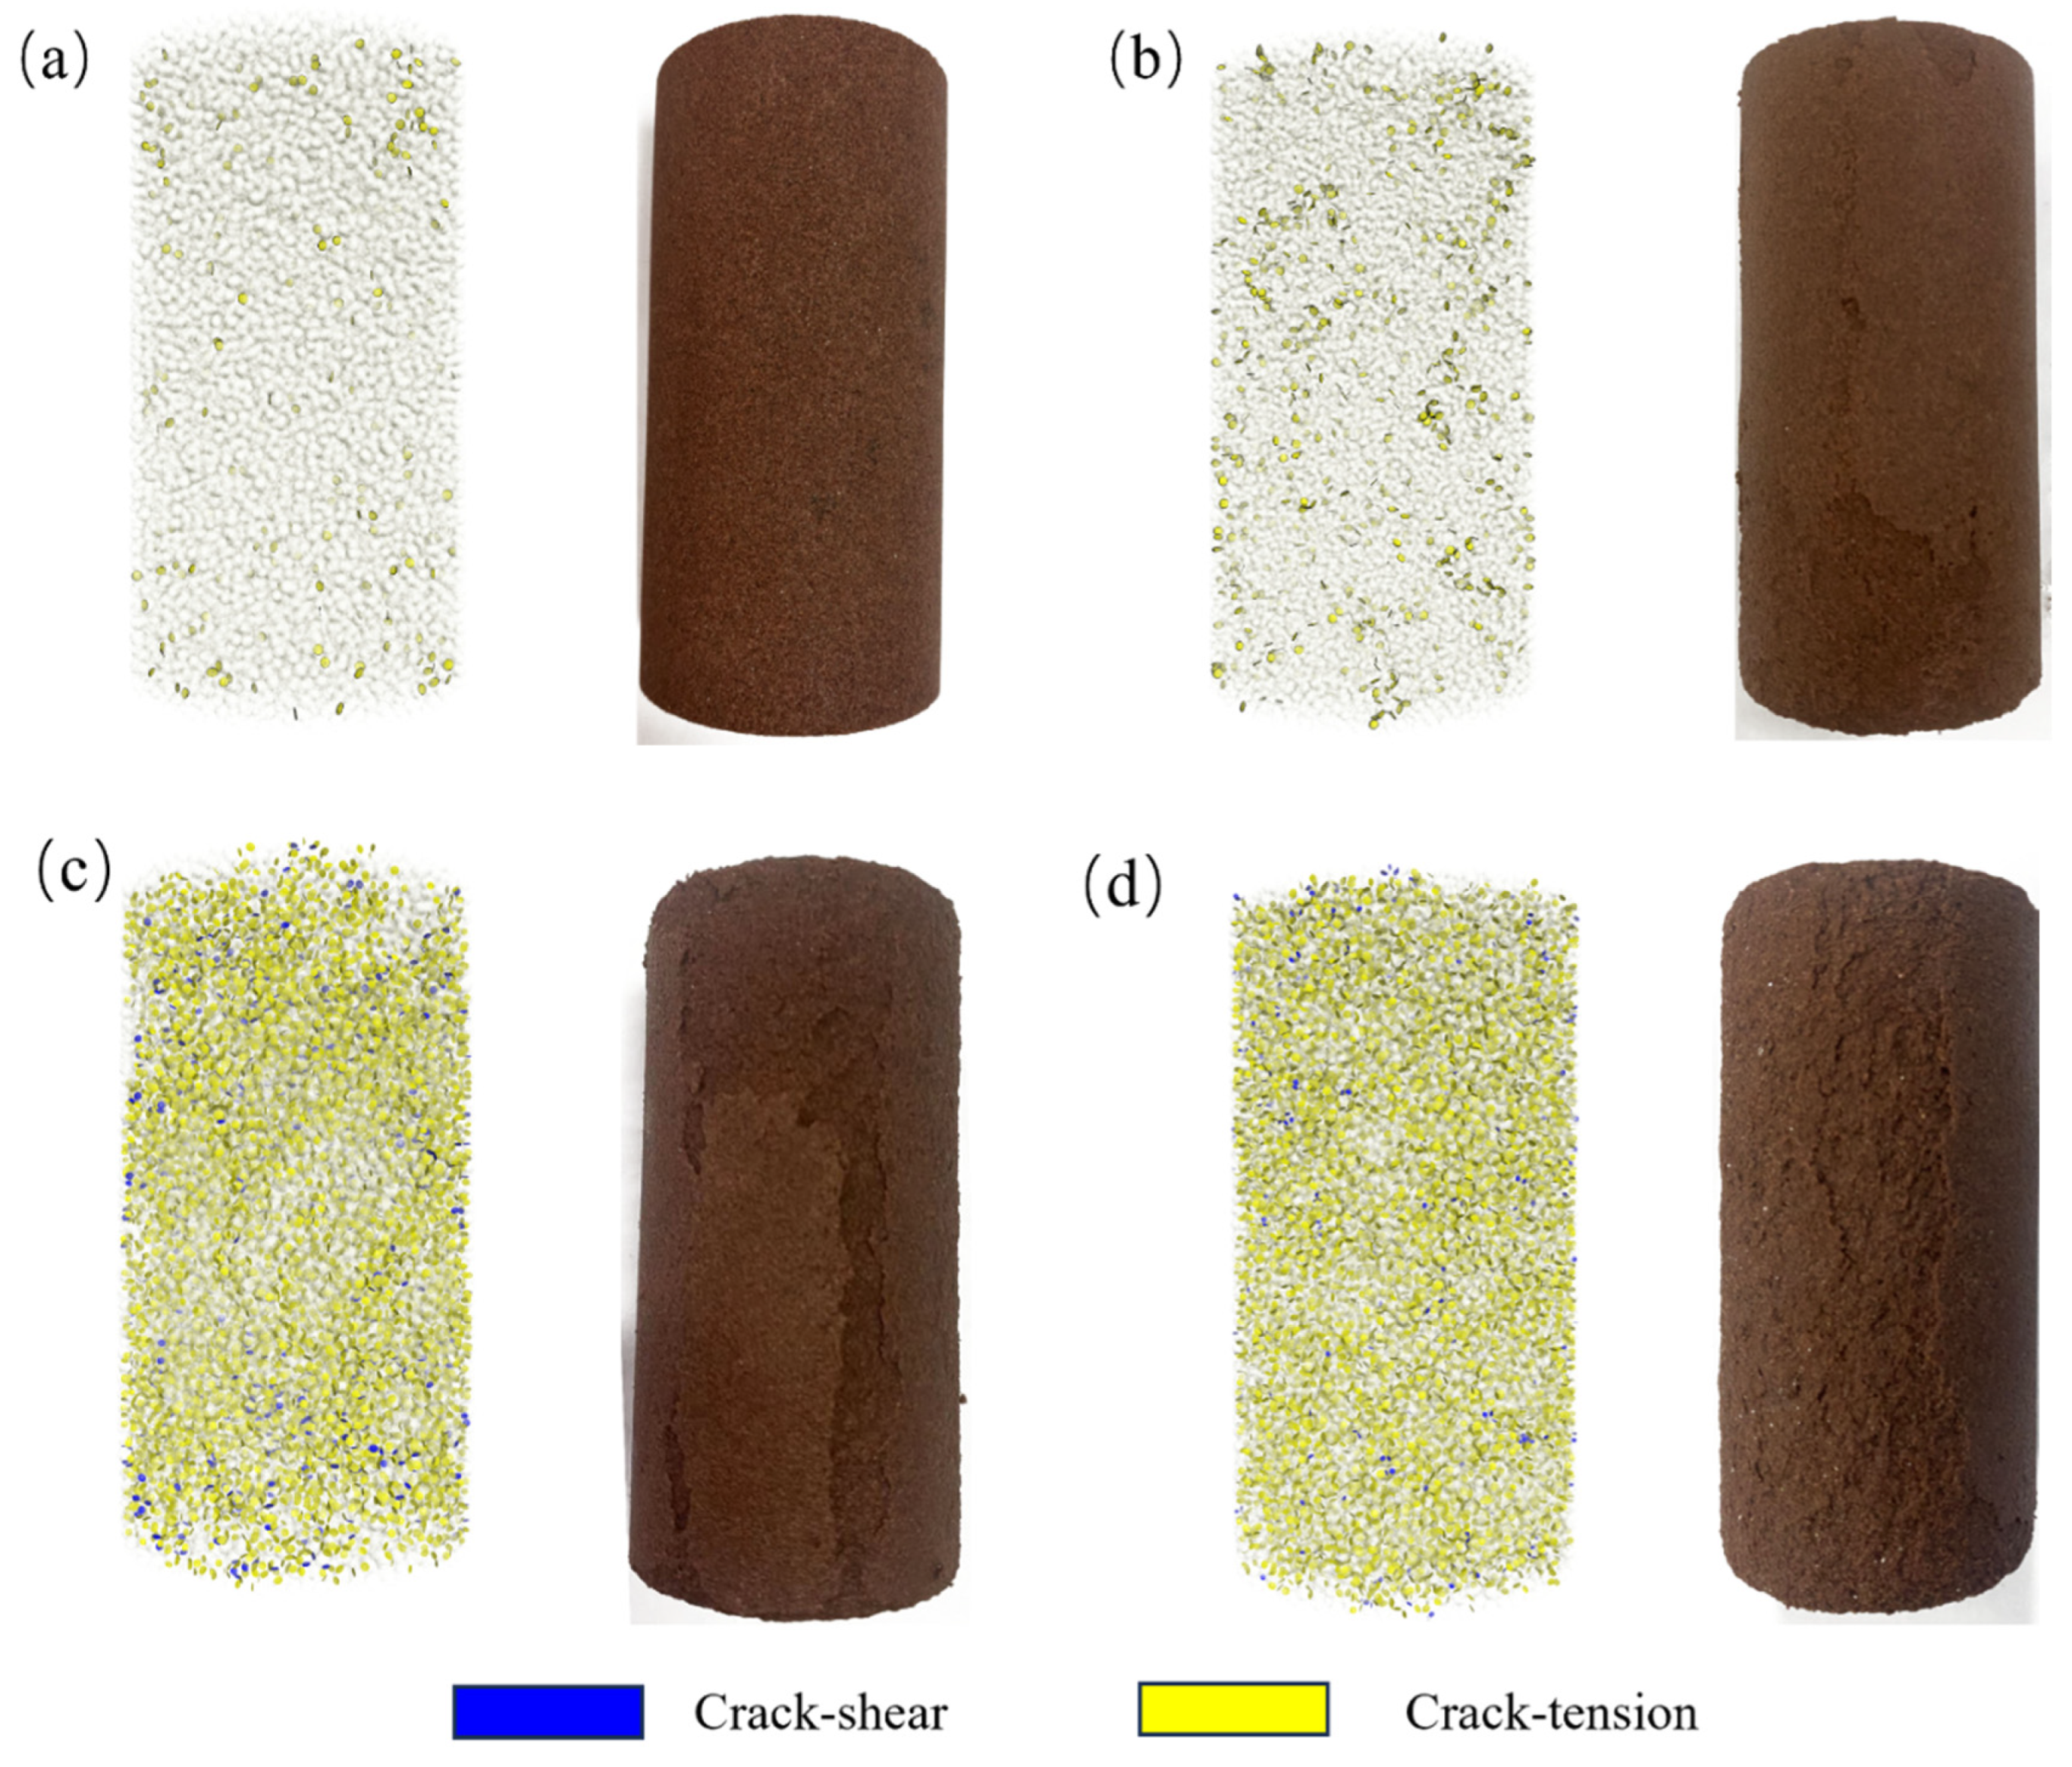
The microcracks and damage caused by the freeze–thaw cycle in saturated sandstone are illustrated in Figure 12. The examination of four distinct freeze–thaw cycles reveals that the cracks resulting from freeze–thaw action consist primarily of tensile cracks and some localized shear cracks. This suggests that the damage incurred during freeze–thaw cycles is predominantly due to tensile damage, aligning with Winkler’s experimental findings [31]. At a freeze–thaw number of 10, cracks in the sandstone were localized on the surface because the surface is more prone to cracking due to fewer grain restrictions compared to the core of the sandstone.
Figure 12.
Distribution of damage cracks with different numbers of cycles. (a) 10 cycles, (b) 20 cycles, (c) 30 cycles, (d) 40 cycles.
At a freeze–thaw number of 20, cracks started to form on the interior of the specimen, with the majority still present on the exterior. The internal cracks were somewhat clustered. Increasing the number of freeze–thaw cycles from 30 to 40 results in a noticeable decrease in the crack expansion rate. This finding aligns with the observed changes in the sandstone pores, where the rate of change in the pore space decreases after 25–40 cycles. This suggests that controlling the rehydration effect of the simulation process by monitoring the pore space change rate is viable. The new cracks are primarily located near the initial damage zone, which is more prone to developing new cracks because of the disturbance of the mechanical interactions between the damaged particles and the decrease in particle binding in the damaged area. As the number of freezing and thawing cycles increases, the number of cracks at the ends of the rock samples is substantially greater than that in the middle, which aligns with the observation that the ends are the first to spall and detach during testing.
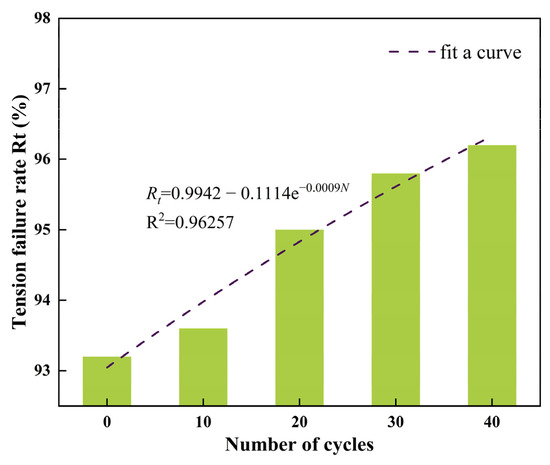
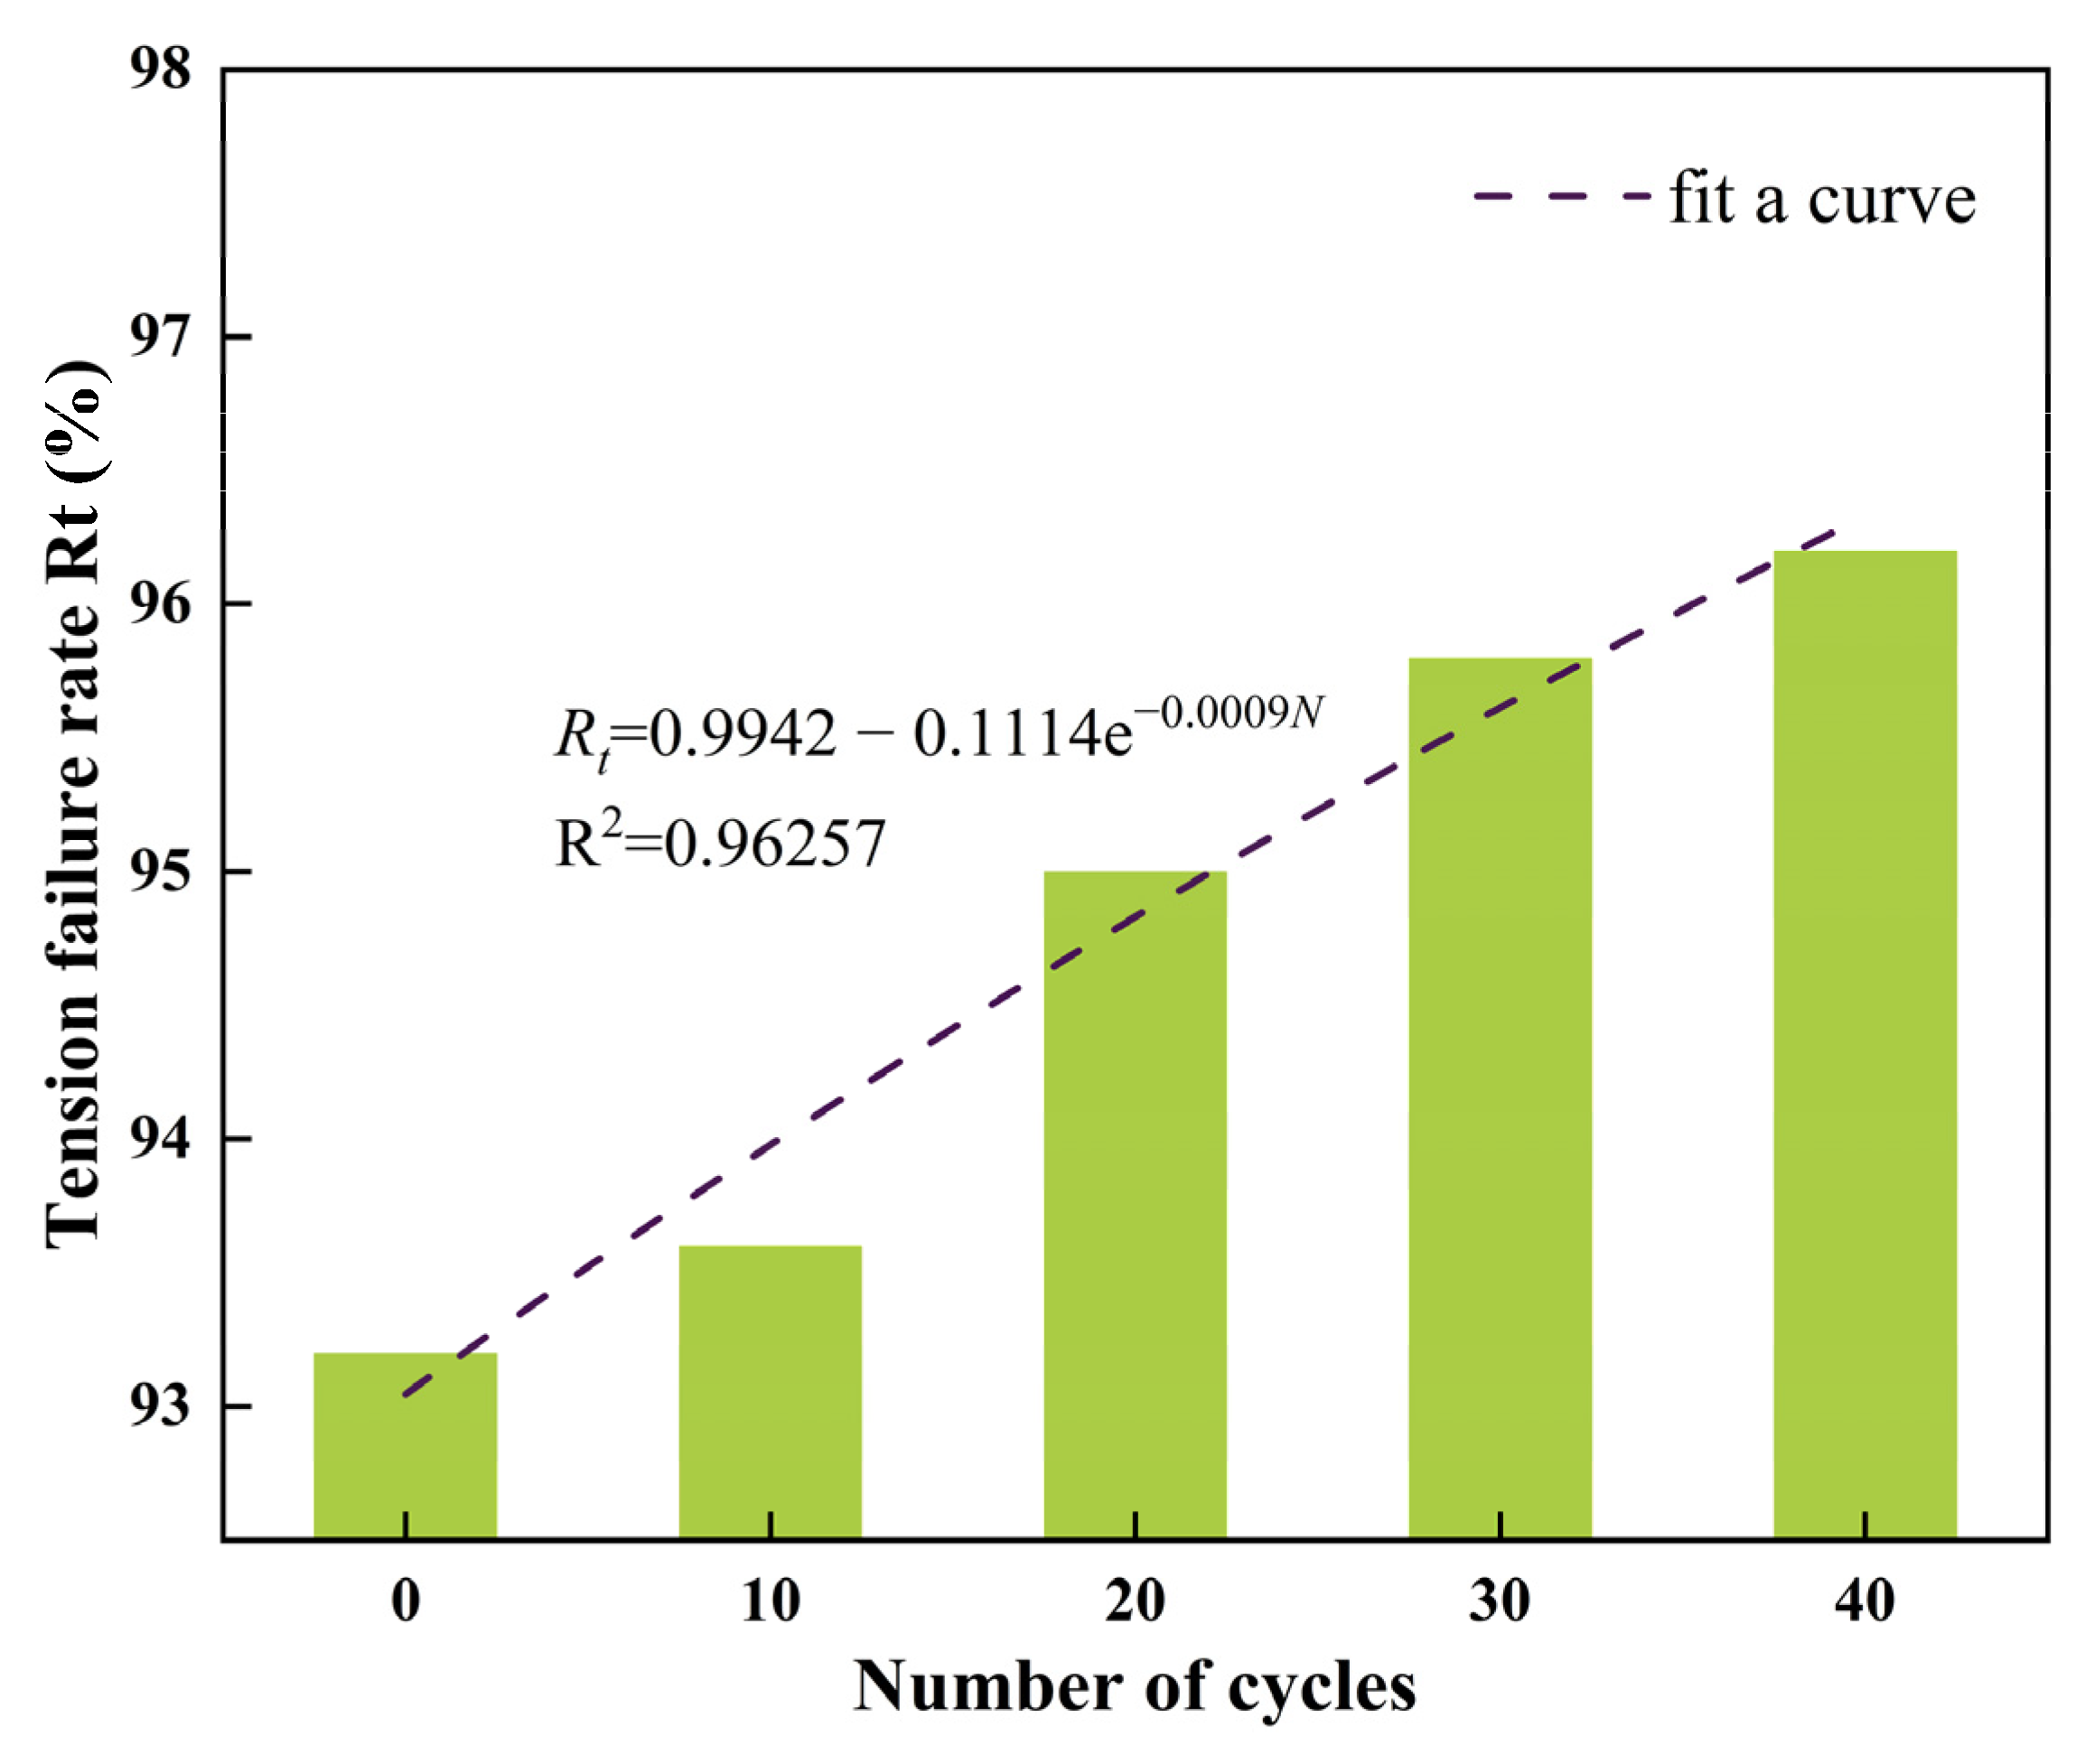
As shown in Figure 13, the tensile damage rate, Rt, resulting from freeze–thaw weathering of sandstone with different numbers of cycles was measured using the method depicted in Figure 11. As can be seen from Figure 13, more than 95% of the cracks during freeze–thaw cycling are tensile cracks, suggesting that the damage caused by this process in sandstone primarily involves tensile damage within the material. This finding aligns with previous studies by Winkler and Tantan et al. [22,31]. Compared with Figure 9, the tensile damage rate Rt is notably greater during freeze–thaw cycles than during uniaxial compression. The tensile damage rate, Rt, increased with the number of freeze–thaw cycles and stabilized at a constant value when Equation (18) was derived by correlating Rt with the number of freeze–thaw cycles.
Figure 13.
Changes in the tensile failure rate during the F–T cycles.
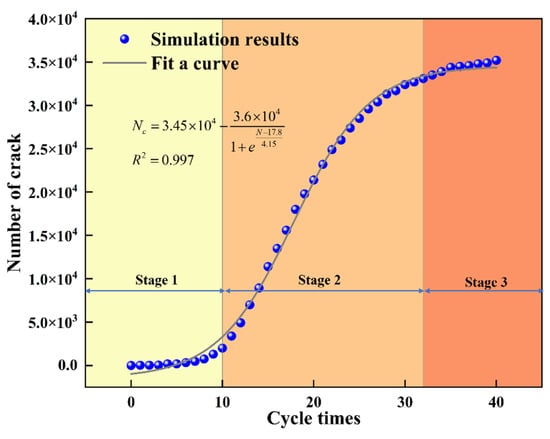
Figure 14 shows the evolution of the total number of cracks with increasing freeze–thaw cycles. The crack growth curve exhibits a typical S-shaped pattern, which can be well fitted by the S-growth function in Equation (19). The fitted asymptotic limit is L = 34,500, while the simulated crack count at N = 40 cycles reaches 35,123. The slight deviation of approximately 1.8% arises from inherent DEM stochasticity and boundary-region spalling effects (see Section 5), which is within the acceptable variability of discrete element simulations. In the present model, this S-shaped evolution is closely related to the coupled effects of freezing expansion of the equivalent pore water units and porosity-controlled water replenishment after thawing. During each freeze–thaw cycle, the equivalent water particles expand at low temperatures and exert frost-heaving forces on the surrounding rock skeleton. After thawing, the initial volume of the equivalent pore water units is updated according to the porosity evolution, representing the replenishment of pore water from the external environment. As a result, the freezing-induced expansion effect is gradually amplified with increasing cycle numbers, which directly controls the accumulation and propagation of cracks.
Figure 14.
Freeze–thaw fissure evolution law.
The crack evolution process can be divided into three stages under the present test and model conditions. In the first stage (N < 10), crack growth is relatively slow because the porosity increase and the corresponding water replenishment are still limited, so the expansion of the equivalent pore water units mainly causes local deformation and only a small amount of dispersed tensile cracking. In the second stage (10 ≤ N ≤ 32), crack growth accelerates markedly. At this stage, the increase in porosity leads to a larger initial volume of replenished pore water, and the subsequent freezing expansion produces stronger local tensile disturbance on the rock skeleton. This promotes the interaction, coalescence, and rapid accumulation of microcracks, giving rise to the steep segment of the S-shaped curve. In the third stage (N > 32), the crack growth rate decreases again. This is because a considerable portion of the specimen has already experienced intensive damage, and newly induced expansion is more likely to extend or offset existing damaged zones than to generate completely new cracks uniformly throughout the sample. Meanwhile, porosity growth becomes slower at this stage, which weakens the increment of water replenishment and further reduces the rate of new crack generation.
It should be noted that the transition points around 10 and 32 cycles are not universal physical thresholds but stage boundaries identified from the current simulations and fitting results under the specific rock type, temperature range, and parameter settings used in this study. Therefore, they should be interpreted as model- and condition-dependent indicators of crack evolution rather than fixed critical values. Combined with the increase in tensile damage rate during subsequent uniaxial compression, these results further indicate that freeze–thaw-induced tensile microcracks progressively alter the internal damage state of the rock and promote the macroscopic transition of the failure mode from shear-dominated to cleavage-dominated behavior.
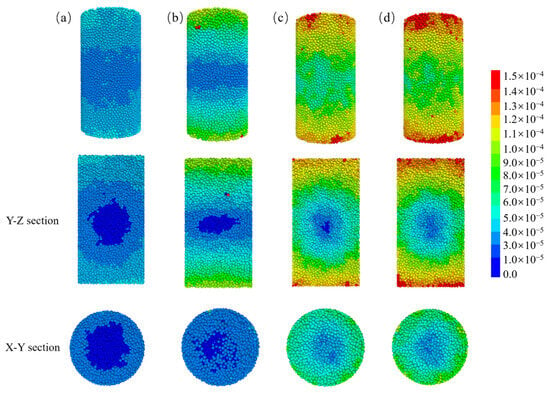
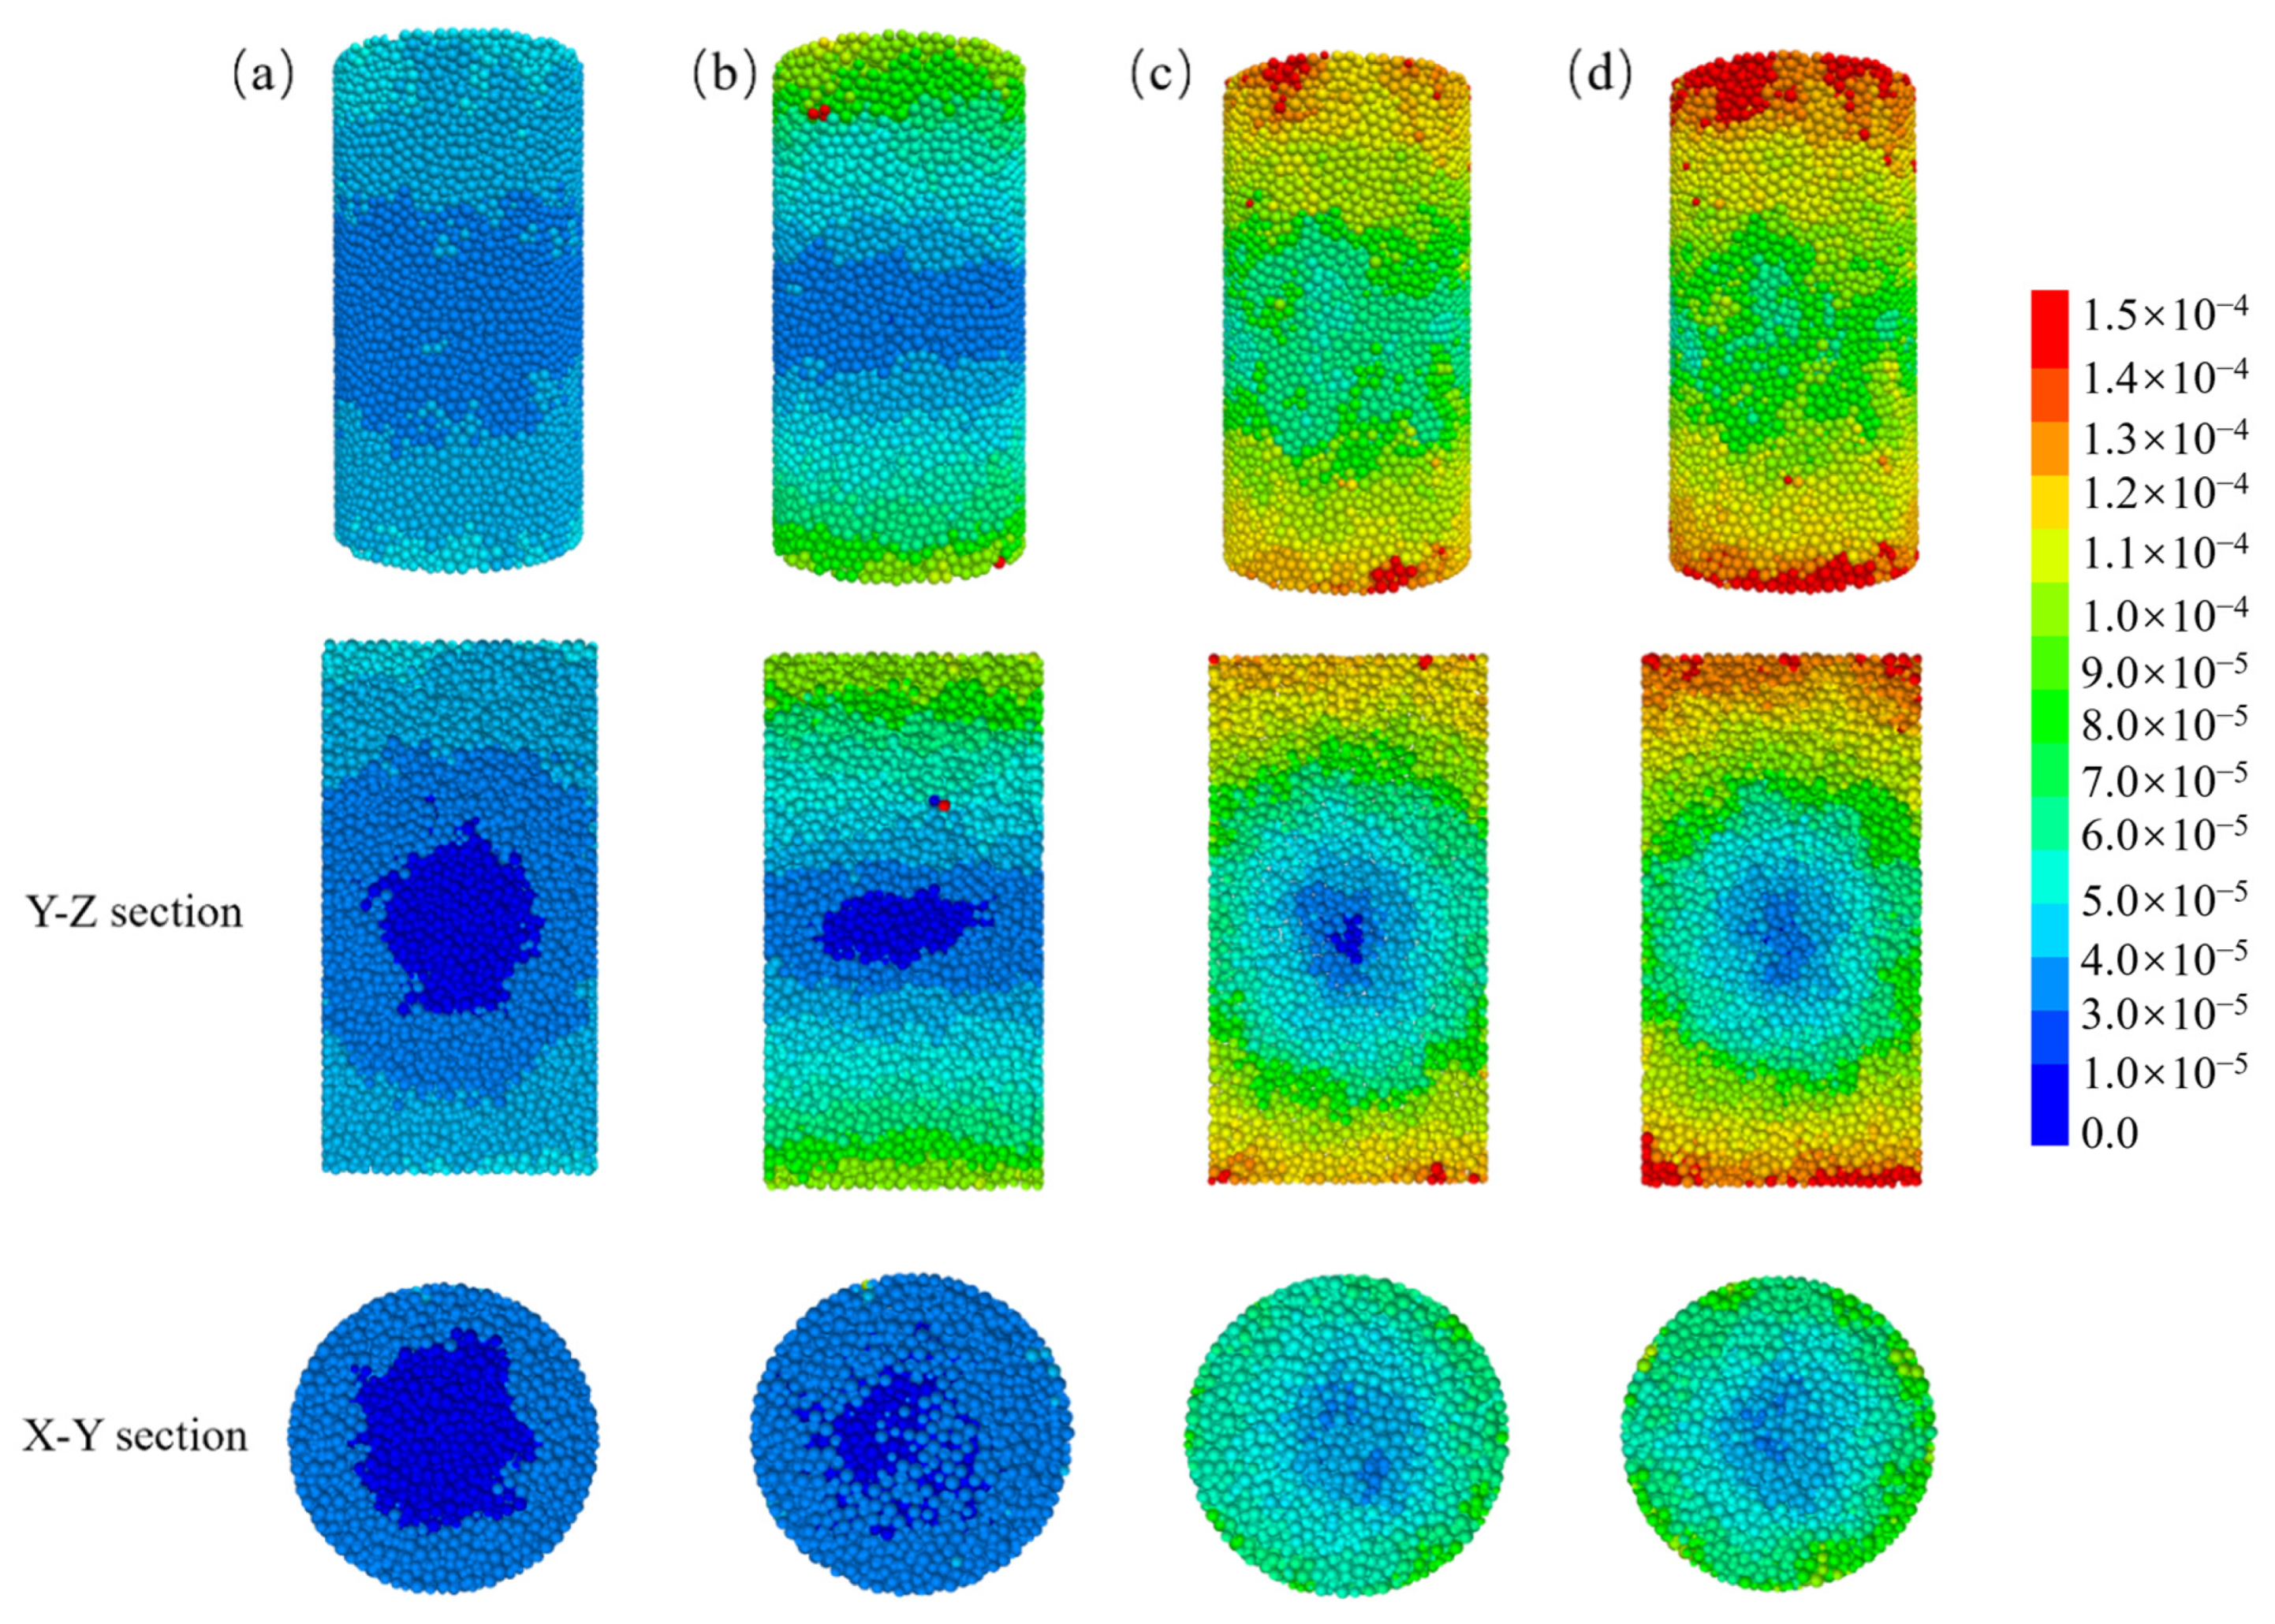
Figure 15 displays the particle displacement cloud for various cycle numbers. Figure 15a shows that during the initial freezing and thawing phase, only some of the sandstone particles experience displacement, with a maximum displacement of 4 × 10⁻⁵ m. The displacement is mainly concentrated in the periphery of the sandstone, while the center remains largely unaffected, as observed in the Y-Z and X-Y sections. As the number of freeze–thaw cycles increased, the point of maximum displacement initially occurred at the ends of the specimen, aligning with the early occurrence of falling and spalling at the ends during laboratory tests. The overall maximum displacement of the sample is 1.5 × 10⁻⁴ m.
Figure 15.
Displacement maps for different numbers of cycles. (a) 10 cycles, (b) 20 cycles, (c) 30 cycles, (d) 40 cycles.
6. Discussion
When the temperature is low, water in the pores of saturated sandstone freezes and expands in volume. The phase change volume expansion of pore water causes tensile stresses in the sandstone, which, when paired with the rock’s low tensile strength, lead to tensile cracking within the sandstone. This causes macroscopic damage to the sample surface as well as a decrease in uniaxial strength and a shift in the pattern of damage. Winkler [31] emphasized the importance of considering the tensile strength during F-T cycles. Hence, the freeze–thaw damage process in sandstone can be effectively executed by exploiting the expansion of equivalent pore water unit at low temperatures to disrupt the mechanical cementation between rock particles. It should be noted that this mechanism is mainly applicable to saturated or highly water-rich sandstone under laboratory freeze–thaw conditions, where pore water is sufficient and volumetric expansion during the water-to-ice phase transition can be regarded as a major damage-driving mechanism. The present model should therefore be interpreted as a mesoscopic representation of freezing-induced volumetric expansion and external water replenishment, rather than a complete description of all frost-weathering mechanisms in natural rock masses. Quansheng et al. [29] discovered, however, that not all pore water solidifies instantly at temperatures below 253.15 K; a fraction of the water remains liquid. Consequently, the relationship between the volume of pore water during freezing and its unfrozen state can be determined using Equation (9).
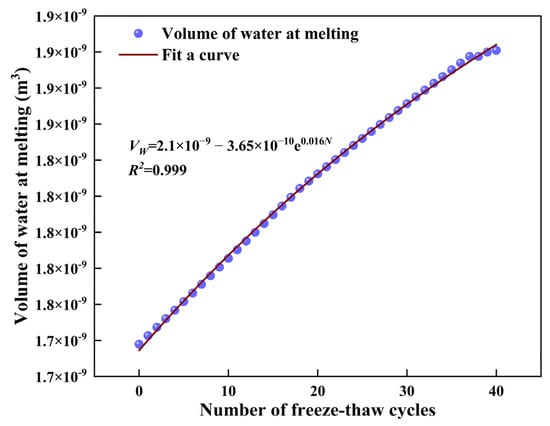
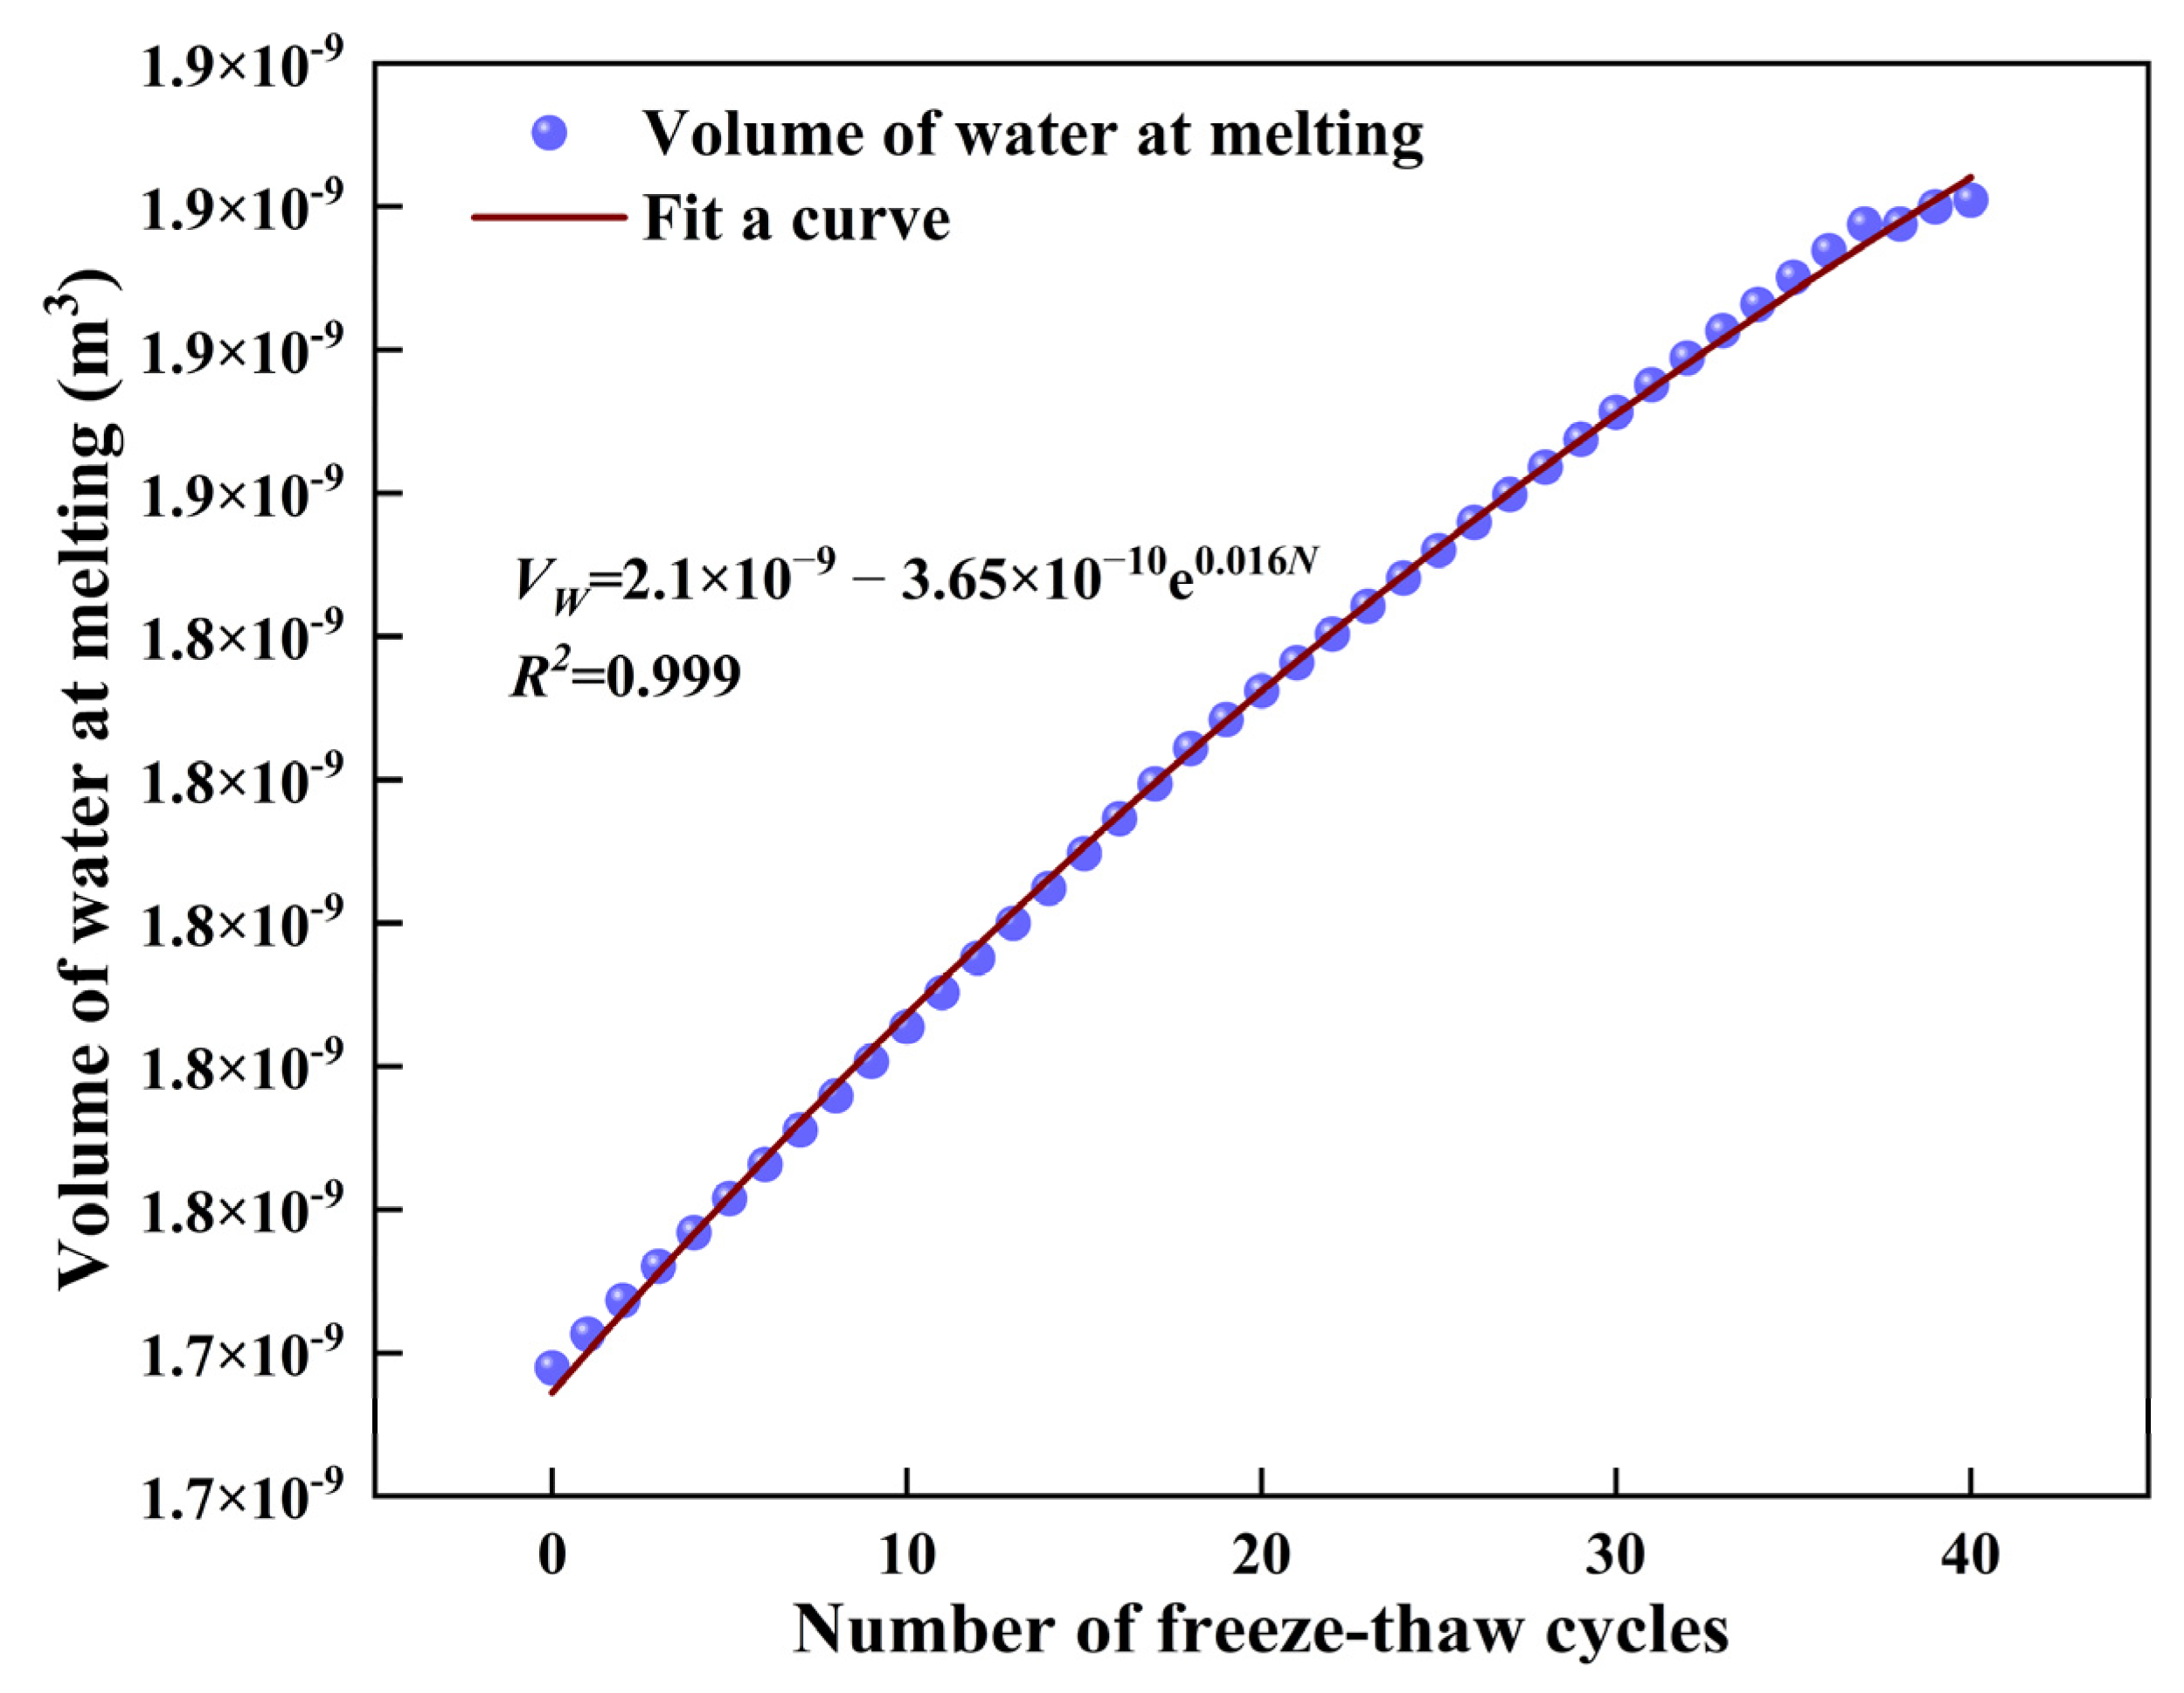
After the sample is frozen, the phase change of water in the pores causes adjacent rock particles to exert pressure, leading to the expansion of the pore space. When water from the external environment begins to replenish, it re-enters the pores during the thawing process, resulting in pore filling. This indicates that the volume of pore water increases with the number of freeze–thaw cycles. This causes the volume of pore water to increase with each cycle. In contrast, Yuanyuan et al. [18] discovered that the recharge volume of the equivalent pore water unit does not increase indefinitely. This limitation is attributed to the finite volume of the rock sample, which renders infinite growth in the volume of the pores unattainable. After undergoing freeze–thaw cycles, the damage process of the sample is manifested at both the micro and macro levels. At the micro level, the water–ice phase transition leads to the expansion of pore volume. At the macro level, the sample exhibits an increase in porosity. This work uses the growth in porosity per cycle from the pore fitting curve to regulate the percentage increase in the volume of the equivalent pore water unit. Figure 16 illustrates the procedure for varying the initial volume of the equivalent pore water unit. The simulation results of the mechanical behavior are essentially similar to those of the indoor tests, and both the change in the equivalent pore water unit and the change in the pore space exhibit exponential functions. This suggests that using the increase in porosity to control the change in water particle volume can reflect the recharge observed in laboratory tests.
Figure 16.
Water particle volume at melting.
In this study, we demonstrate that the rock peak stress and elastic modulus in the PFC simulation are dramatically reduced by freeze–thaw cycles. Alterations in these mechanical properties have been verified via laboratory experiments [6,7,32].
The study revealed that the cracks formed during the freeze–thaw process were primarily tensile cracks, following an S-shaped growth curve with three distinct phases. This finding aligns with previous studies [22,31], emphasizing the importance of the tensile strength of rocks in resisting freeze–thaw weathering. The rock underwent uniaxial compression, resulting in tensile cracks causing an increase in the tensile damage rate, Rt, as the number of freeze–thaw cycles increased. Both simulations and tests demonstrate that the rock damage pattern transitions from shear damage to cleavage damage as the number of freezing and thawing cycles increases. This shift indicates that the formation of cracks from the freezing and thawing process impacts the macroscopic damage pattern of the rock.
This study controlled the volume expansion of the equivalent pore water unit to achieve freeze–thaw cycles with a FISH program, which can reproduce the laboratory freeze–thaw process of saturated sandstone under the assumption that the volumetric expansion of pore water is the dominant damage source. The equivalent pore water units freeze randomly within the rock samples, but in reality, freezing and thawing should follow temperature conduction from the outside to the inside. This aspect has not been considered in the current method and requires further research. Moreover, under natural field conditions, rocks are not always fully saturated, and frost damage may be strongly affected by ice segregation, ice-lens growth, cryogenic suction, and moisture migration toward the freezing front. These processes can become dominant in partially saturated porous rocks and are not explicitly incorporated into the present DEM framework. In particular, the model does not simulate a migrating freezing front, the hydraulic redistribution of unfrozen water, or the suction-driven growth of segregated ice. Therefore, the proposed method is most suitable for saturated or high-water-content sandstone with an external water supply, and its direct application to unsaturated natural rock slopes, tunnels, or roadbed environments should be made with caution.
The present study has several limitations. First, the model cannot reproduce the initial compaction stage observed in laboratory stress–strain curves because the simplified bonded-particle framework does not explicitly capture the closure of pre-existing pores and microcracks at low stress levels. This may affect the evaluation of early-stage freeze–thaw damage, particularly the interpretation of initial stiffness evolution and crack initiation. Second, the contact strength between rock particles and water particles was set to 150 MPa as an equivalent numerical parameter rather than a directly measurable physical interface property. Although this parameter enables the model to reproduce the overall trends of mechanical deterioration and failure evolution, its empirical nature may influence the quantitative prediction of crack development. In addition, the porosity evolution relation used to update pore water replenishment during freeze–thaw cycling is also an empirical and condition-dependent expression. In the present study, it is calibrated for the sandstone samples and freeze–thaw conditions considered here, and therefore should not be regarded as a universally applicable relation for all rock types or testing conditions. Since porosity evolution may vary with lithology, initial pore structure, grain size distribution, saturation state, and freeze–thaw regime, applying this relation beyond the present conditions may introduce systematic deviations. It should be emphasized that the present model describes a laboratory-scale saturated or highly water-rich condition, in which pore water volumetric expansion during freezing and subsequent water replenishment after thawing are the main processes represented in the DEM framework. Under natural partially saturated conditions, frost weathering may be governed by ice segregation, ice-lens growth, cryogenic suction, and moisture migration. These mechanisms are outside the scope of the present model. Therefore, the proposed method should be applied only within the boundary conditions of saturated/high-water-content sandstone and should be recalibrated before being extended to unsaturated field-scale rock masses. Furthermore, because ice segregation, moisture migration, and the evolution of a spatial freezing front are not included, the present model cannot fully represent freeze–thaw damage in partially saturated rocks or in field conditions where thermal and hydraulic gradients control water transport. This limitation defines the boundary of the model: it is a DEM-based mesoscopic volumetric-expansion model for saturated or highly water-rich sandstone, not a fully coupled thermo-hydro-mechanical model of natural frost weathering. Nevertheless, these limitations do not change the main conclusions regarding the reduction in peak stress and elastic modulus, the tensile-dominated crack evolution, and the transition of the failure mode from shear to cleavage with increasing freeze–thaw cycles. Future work should incorporate initial microfracture distributions, more realistic pore structures, refined nonlinear contact constitutive laws, systematic sensitivity analysis, and recalibration of the porosity evolution relation for different rock types and testing conditions, and further extend the framework toward coupled thermo-hydro-mechanical analysis and more complex multi-scale conditions. In particular, future studies should introduce temperature-gradient-controlled freezing fronts, water migration driven by cryogenic suction, and ice-segregation mechanisms so that the model can be extended from saturated laboratory specimens to more realistic unsaturated field-scale rock masses.
7. Conclusions
Under low-temperature conditions, pore water inside the rock freezes and expands, exerting pressure on the surrounding rock particles. This freezing-induced expansion generates microcracks within the rock and is one of the main causes of freeze–thaw weathering. In this study, a DEM model for water-rich sandstone was established in PFC3D, in which the rock skeleton and the equivalent pore water units were connected using the parallel bond model (PBM). The mesoscopic parameters of the PBM between rock particles were determined based on empirical relationships, while those at the rock–water and water–water contacts were assigned with reference to previous studies. Within the range of the sandstone samples and freeze–thaw conditions considered in this study, the proposed model shows good applicability for reproducing the mesoscopic crack evolution and the deterioration of macroscopic mechanical properties. However, its applicability to other rock types, grain structures, or testing conditions still requires further calibration and validation.
- A program was written in the FISH language to control the change in water particle volume with temperature changes, simulating the procedure of rock freeze–thaw cycling. The actual porosity change function was used to control volume changes when the equivalent pore water unit melted in the simulation, simulating the rehydration process of external water enlarging the pore space of the rock samples due to freeze–thaw damage. The ability of the proposed method to predict the effect of freeze–thaw cycles on the mechanical behavior of saturated sandstone specimens was validated, and the simulation results were consistent with the laboratory test results. The results show that the method can accurately predict the evolution of the mechanical behavior of saturated sandstone under freeze–thaw cycles.
- The results of both the tests and the simulations show that the mechanical behavior of sandstone, including its uniaxial bearing capacity and modulus of elasticity, decreases with the process of freeze–thaw cycling, and the damage mode of sandstone transitions from shear damage to cleavage damage.
- With an increase in freeze–thaw cycles, the number of cracks in sandstone specimens shows an S-shaped function increase. Cracks are relatively concentrated on the surface of rock samples in the early stages of freeze–thaw action, and the distribution of cracks is more uniform in the late stages. Moreover, the percentage of tensile cracks produced during both the freezing and thawing cycles and uniaxial compression cycles exceeded 90%, and the Rt rate of tensile damage increased exponentially during both freezing and thawing periods.
Author Contributions
Investigation, Y.W., Z.Y.,W.F.,J.F. and H.W.; resources, Z.Y.; data curation, Y.W.; writing—original draft preparation, Y.W.; writing—review and editing, Y.W. All authors have read and agreed to the published version of the manuscript.
Funding
This research was funded by the Guangxi Natural Science Foundation (2025GXNSFBA069371).
Institutional Review Board Statement
Not applicable.
Informed Consent Statement
Not applicable.
Data Availability Statement
The data that support the findings of this study are available from the corresponding author upon reasonable request.
Conflicts of Interest
Authors Jia Fang and Hao Wang were employed by China Railway 22nd Bureau Group Fifth Engineering Co., Ltd., Chongqing, China during the conduct of this study. The funders had no role in the design of the study, the collection, analysis, or interpretation of data, the writing of the manuscript, or the decision to publish the results.
References
- Bayram, F. Predicting mechanical strength loss of natural stones after freeze–thaw in cold regions. Cold Reg. Sci. Technol. 2012, 83–84, 98–102. [Google Scholar] [CrossRef] [Scilit]
- Shang, J.L.; Hencher, S.; West, L.J. Tensile Strength of Geological Discontinuities Including Incipient Bedding, Rock Joints and Mineral Veins. Rock Mech. Rock Eng. 2016, 49, 4213–4225. [Google Scholar] [CrossRef] [Scilit]
- Brantut, N.; Baker, M.; Hansen, L.S.; Baud, P. Microstructural Control of Physical Properties During Deformation of Porous Limestone. J. Geophys. Res. Solid Earth 2018, 123, 4751–4764. [Google Scholar] [CrossRef] [Scilit]
- Xiao, Y.G.; Deng, H.W.; Tian, G.L.; Yu, S.T. Analysis of Microscopic Pore Characteristics and Macroscopic Energy Evolution of Rock Materials under Freeze–Thaw Cycle Conditions. Mathematics 2023, 11, 710. [Google Scholar] [CrossRef] [Scilit]
- Al-Omari, A.; Beck, K.; Brunetaud, X.; Török, Á.; Al-Mukhtar, M. Critical degree of saturation: A control factor of freeze–thaw damage of porous limestones at Castle of Chambord, France. Eng. Geol. 2015, 185, 71–80. [Google Scholar] [CrossRef] [Scilit]
- Tan, H.C.; Song, Y.; Yang, H.M.; Che, Y.X. Energy Evolution and Strain Localization in Fractured Sandstone Under Freeze–Thaw Cycling and Uniaxial Loading–Unloading. Int. J. Rock Mech. Min. Sci. 2023, 177, 105746. [Google Scholar] [CrossRef] [Scilit]
- Liu, N.F.; Li, N.; Wang, S.J.; Li, G.F.; Song, Z.P. A fully coupled thermohydromechanical model for fractured rock masses in cold regions. Cold Reg. Sci. Technol. 2023, 205, 103707. [Google Scholar] [CrossRef] [Scilit]
- Wang, Y.; Zhu, C.; Song, Z.Y.; Mao, T.Q. On the effect of freeze–thaw on fracture and instability of hole-fissure-contained granite under uniaxial variable frequency-amplitude cyclic loads. Cold Reg. Sci. Technol. 2022, 198, 103554. [Google Scholar] [CrossRef] [Scilit]
- Chen, Y.L.; Peng, W.; Yu, Q.; Xu, G. Effects of Freezing and Thawing Cycle on Mechanical Properties and Stability of Soft Rock Slope. Adv. Mater. Sci. Eng. 2017, 2017, 3173659. [Google Scholar] [CrossRef] [Scilit]
- Niu, C.Y.; Zhu, Z.M.; Zhou, L.; Li, X.H.; Ying, P.; Dong, Y.Q.; Deng, S.W. Study on the microscopic damage evolution and dynamic fracture properties of sandstone under freeze–thaw cycles. Cold Reg. Sci. Technol. 2021, 19, 103328. [Google Scholar] [CrossRef] [Scilit]
- Zhou, L.; Jiang, Y.C.; Zhu, Z.M.; Bao, F.; Chen, J.X.; Wang, H.H. Scrutiny of freeze–thaw cycles effect on physical and dynamic fracture characteristics of cracked sandstone. Cold Reg. Sci. Technol. 2023, 210, 103837. [Google Scholar] [CrossRef] [Scilit]
- Martínez-Martínez, J.; Benavente, D.; Gómez-Heras, M.; Marco-Castaño, L.; García-del-Cura, M.A. Non-linear decay of building stones during freeze–thaw weathering processes. Constr. Build. Mater. 2013, 38, 443–454. [Google Scholar] [CrossRef] [Scilit]
- Zanyar, S.; Mousavi, S.; Tavakoli, H.; Moarefvand, P.; Rezaei, M. Microstructural, petro-graphical and mechanical studies of schist rocks under the freezing-thawing cycles. Cold Reg. Sci. Technol. 2020, 174, 103039. [Google Scholar] [CrossRef] [Scilit]
- Feng, Q.; Hou, S.J.; Liu, W.W.; Zhang, S.; Li, W.S.; Tian, M.L. Study on the simulation method and mesoscopic characteristics of rock freeze–thaw damage. Comput. Geotech. 2023, 153, 105038. [Google Scholar] [CrossRef] [Scilit]
- Wang, Y.; Feng, W.L.; Wang, H.J.; Li, C.H.; Hou, Z.Q. Rock bridge fracturing characteristics in granite induced by freeze–thaw and uniaxial deformation revealed by AE monitoring and posttest CT scanning. Cold Reg. Sci. Technol. 2020, 177, 103115. [Google Scholar] [CrossRef] [Scilit]
- Maji, V.; Murton, J.B. Experimental Observations and Statistical Modeling of Crack Propagation Dynamics in Limestone by Acoustic Emission Analysis During Freezing and Thawing. J. Geophys. Res. Earth Surf. 2021, 126, e2021JF006127. [Google Scholar] [CrossRef] [Scilit]
- Liu, X.Y.; Xu, D.P.; Jiang, Q.; Li, S.J.; Bian, K.; Qiu, S.L. Failure mechanisms of granite in deep underground caverns influenced by rock veins: Insights from DEM-FDM cross-scale coupling and moment tensor analysis. Comput. Geotech. 2025, 186, 107412. [Google Scholar] [CrossRef] [Scilit]
- Liu, X.Y.; Xu, D.P.; Jiang, Q.; Li, S.J.; Qiu, S.L.; Xia, Y. Multiscale fracture evolution in deep hard rock masses under strong excavation disturbances: Stress-mineral synergy unraveled through integrated 3D DEM–FDM modeling and borehole monitoring. Rock Mech. Rock Eng. 2026, 59, 4619–4642. [Google Scholar] [CrossRef] [Scilit]
- Huang, C.; Zhu, C.; Aluthgun Hewage, S.; Ma, Y.; Shi, X. Investigating Influence of Freeze-Thaw Cycles on the Degradation of Sandstone Through Discrete Method Modeling. In Proceedings of the ARMA US Rock Mechanics/Geomechanics Symposium, Santa Fe, NM, USA, 26–29 June 2022; ARMA: Alexandria, VA, USA, 2022; p. ARMA-2022-0065. [Google Scholar] [CrossRef] [Scilit]
- Yu, J.; Zhang, Q.; Jia, C.; Lei, M.; Zhao, C.; Pang, R.; Li, Z.; Zeng, T. Experimental and DEM simulations of the mechanical properties of rock under freeze–thaw cycles. Cold Reg. Sci. Technol. 2023, 211, 103866. [Google Scholar] [CrossRef] [Scilit]
- Huang, Y.H.; Yang, S.Q.; Chen, G.Q.; Meng, B. Fracture behavior of cylindrical sandstone specimens with two preexisting flaws: Experimental investigation and PFC3D simulation. Geosci. J. 2021, 26, 151–165. [Google Scholar] [CrossRef] [Scilit]
- Zhu, T.T.; Chen, J.X.; Huang, D.; Luo, Y.B.; Li, Y.; Xu, L.F. A DEM-Based Approach for Modeling the Damage of Rock Under Freeze–Thaw Cycles. Rock Mech. Rock Eng. 2021, 54, 2843–2858. [Google Scholar] [CrossRef] [Scilit]
- Song, Y.; Sun, Y.; Li, C.; Yang, H.; Zhang, L.; Xie, L. Study on meso-fracture evolution characteristics of sandstone after freeze–thaw cycles based on discrete element method simulation. Rock Soil Mech. 2023, 44, 3602–3616. (In Chinese) [Google Scholar]
- M.I.G. Inc. ITASCACONSULTING GROUP INC.PFC 6.0-Documentation; M.I.G. Inc.: Minneapolis, MN, USA, 2009. [Google Scholar]
- Potyondy, D.O.; Cundall, P.A. A bonded-particle model for rock. Int. J. Rock Mech. Min. Sci. 2004, 41, 1329–1364. [Google Scholar] [CrossRef] [Scilit]
- Hatheway, A.W. The Complete ISRM Suggested Methods for Rock Characterization, Testing and Monitoring; 1974–2006. Environ. Eng. Geosci. 2009, 15, 47–48. [Google Scholar] [CrossRef] [Scilit]
- Mu, J.Q.; Pei, X.J.; Huang, R.Q.; Rengers, N.; Zou, X.Q. Degradation characteristics of shear strength of joints in three rock types due to cyclic freezing and thawing. Cold Reg. Sci. Technol. 2017, 138, 91–97. [Google Scholar] [CrossRef] [Scilit]
- Anderson, R.S.; Anderson, S.P.; Tucker, G.E. Rock damage and regolith transport by frost: An example of climate modulation of the geomorphology of the critical zone. Earth Surf. Process. Landf. 2012, 38, 299–316. [Google Scholar] [CrossRef] [Scilit]
- Quansheng, L.; Shibing, H.; Yongshui, K.; Yucong, P. Study of unfrozen water content and frost heave model for saturated rock under low temperature. Chin. J. Rock Mech. Eng. 2016, 35, 2000–2012. (In Chinese) [Google Scholar]
- Guoyan, Z.; Bing, D.; Chi, M. Study of effects of microparameters on macroproperties for parallel bonded model. Chin. J. Rock Mech. Eng. 2012, 31, 1491–1498. (In Chinese) [Google Scholar]
- Winkler, E.M.J.E.G. Frost damage to stone and concrete: Geological considerations. Eng. Geol. 1968, 2, 315–323. [Google Scholar] [CrossRef] [Scilit]
- Liu, C.J.; Deng, J.R.; Yu, S.T.; Li, P.; Lin, Y. Effect of Freezing and Thawing on Microstructure Damage and Dynamic Flexural Tension of Granite. Rock Mech. Rock Eng. 2020, 53, 3853–3858. [Google Scholar] [CrossRef] [Scilit]

Disclaimer/Publisher’s Note: The statements, opinions and data contained in all publications are solely those of the individual author(s) and contributor(s) and not of MDPI and/or the editor(s). MDPI and/or the editor(s) disclaim responsibility for any injury to people or property resulting from any ideas, methods, instructions or products referred to in the content. |
© 2026 by the authors. Licensee MDPI, Basel, Switzerland. This article is an open access article distributed under the terms and conditions of the Creative Commons Attribution (CC BY) license.