


Abstract
This study introduces a modular approach to the validation of non-invasive coating inspection. It involves RGB imaging, visible and near-infrared spectroscopy, measurements of the physical parameters of the coating, and 3D Gaussian Splatting. As publicly available datasets containing these different types of information for the same coating samples are rare, each module was considered separately. The study also defines the type of paired data required for future data-fusion experiments. During the analysis of the painted-metal image dataset, exact-file hashing identified 68 duplicate images shared between the training and test sets. After removing these images and the duplicates within the test set, the best fixed image classifier achieved an accuracy of 78.49% and a balanced accuracy of 78.99% on 93 distinct test images. In addition, an additional sensitivity analysis was conducted using an ImageNet-pretrained EfficientNetB0 model with images. This model achieved an accuracy of 66.67%. This result shows that higher-resolution images and a pretrained model do not directly improve performance on a small and domain-specific dataset. Coated-wood defect localization, controlled steel-defect detector comparison, duplicate-grouped ship-coating spectroscopy, public gloss, roughness, scanning-electron-microscopy workbooks, and reflective-scene reconstruction were recomputed as separate validation blocks. The reflective-scene reconstruction achieved a peak signal-to-noise ratio of , a structural similarity index of , and a learned perceptual image patch similarity value of . However, camera distortion and unidirectional geometry limitations restrict this module to feasibility analysis. Our framework provides reproducible baselines and defines the paired-data requirements for future calibrated coating-monitoring systems.
1. Introduction
Coating systems are measured through variations in appearance, localized defects, spectral behavior, gloss, surface roughness, thickness, and geometry. These features apply to industrial assets and conservatory surfaces since coating deterioration can be indicated by gloss reduction, chalking, cracking, flaking, staining due to moisture ingress, and substrate exposure [1,2,3]. Non-destructive imaging and spectroscopy will minimize invasive sampling, but model performance is credible only when the evaluation split, physical reference, and provenance of each numerical result are explicit.
Red–green–blue (RGB) inspection and visible/near-infrared (Vis/NIR) spectroscopy are established routes for non-destructive coating assessment [4,5]. Multi-view reconstruction adds a geometric layer: 3D Gaussian Splatting (3DGS) represents scenes using anisotropic primitives with view-dependent radiance and can reproduce reflective appearance more flexibly than a purely Lambertian model [6,7,8,9,10]. However, successful novel-view synthesis on a reflective object is not equivalent to calibrated coating metrology. A physical gloss or roughness claim requires co-registered instrument measurements on the same reconstructed surface.
The availability of a public dataset for the coatings is another form of less obvious threat, since there exists the possibility of duplication either of images or of the measurements in the train/test splits and cross-validation process. The exact duplicates will make it look like the two are independent but will enable the model to view the same data point in training and testing. No public source identified for this study simultaneously provides coating-specific multi-view images, camera calibration, repeated weathering states, glossmeter readings, profilometry, atomic force microscopy (AFM), scanning electron microscopy (SEM) annotations, and a laser-grade 3D reference for the same surface regions. The resulting framework therefore combines independently validated analyses of painted-metal image classification [11]; coated-wood defect localization and controlled industrial detector comparison [12,13]; ship-coating Vis/NIR classification [14]; physical coating measurements from public instrument workbooks [15,16]; and reflective-scene COLMAP (structure-from-motion) and 3DGS reconstruction using NeRFBK Industrial_A [17].
The contributions are:
- An exact-duplicate audit and leakage-filtered reassessment of a public painted-metal train/test split.
- Duplicate-grouped validation of repeated ship-coating spectra, together with leakage-controlled coated-surface detection analyses.
- Traceable recomputation of public glossmeter, profilometer, and SEM measurements as physical-reference targets.
- A real reflective-object COLMAP/3DGS reconstruction analysis with held-out image metrics and scale-normalized laser-reference geometry diagnostics.
The contribution of our study is methodological, and rather than proposing a new sensor, coating instrument, or reconstruction algorithm, our study integrates multiple non-invasive validation modules, explicitly addresses data leakage, and defines specimen-level paired data required for reliable calibration across imaging, spectral, physical, and three-dimensional measurements.
2. Materials and Methods
2.1. Study Design and Calibration Requirements
The proposed system design is composed of three levels. First, multi-view appearance information can be acquired using illuminated surface patches. Second, a 3DGS reconstruction will produce a spatially aligned radiance field and an initial 3D model. Third, a supervised spatial interpretation can be used to determine the local surface state, including coating presence and coating defects such as cracks, peel, bare patch, and wet patch, given labeled 3D pairs.
Since the existing public datasets do not combine the three layers into one coated item, the evaluation of each of the measurable layers is done individually using public data: appearance information in RGB space for paint-defect detection, coated surface defect localization at object level, Vis/NIR reflectance information of the portable nature for coating condition classification, and gloss/roughness/SEM data from a coating characterization dataset, as well as the COLMAP 4.0.4-based 3DGS reconstruction of a reflective object using the laser scanner ground truth.
These separate analyses reveal the strengths and weaknesses of each modality in question with respect to the currently available public datasets. But for a robust multimodal fusion, all these measurements should be obtained from the same samples using a unified acquisition and calibration procedure. The following section will outline the minimum required data structure for such an experiment.
A complete coating-monitoring dataset would photograph the same specimens from calibrated viewpoints, preferably with parallel- and cross-polarized pairs, and would repeat acquisition before coating and after controlled exposure intervals. Sample metadata would include substrate, coating chemistry, application protocol, curing time, and exposure conditions. Glossmeter, profilometry or AFM, microscopy, and thickness measurements would be spatially registered to the image and 3D coordinate systems.
3DGS describes an image using anisotropic Gaussian shapes, opacity, and viewing-dependant radiance coefficients [6]. While the learned values of such parameters might possess useful appearance or geometric information, neither the energy of spherical harmonics nor anisotropy of the Gaussian covariances represent a physical measurement of gloss or roughness in themselves. Hence, no gloss or roughness index is computed based on 3DGS parameters in this work. Physical gloss or roughness index calculation demands a descriptor defined independently of the test data and calibration through co-registered instrument measurements for grouped samples. Defects visible or spectral prediction from the calibrated images can be mapped to a reconstructed shape and combined spatially. This, however, requires synchronized acquisition and a common specimen identifier that are not available in the publicly available databases used in this work.
2.2. Dataset Mapping and Cross-Modal Gaps
The associations of datasets and their roles in analysis, together with the missing cross-modal connections and the associated validation process, are summarized in Table 1. Notably, none of the publicly available data sources have a comprehensive paired dataset with multi-view imaging, physical measurements, degradation markers, and 3DGS data on the same samples. Public data source names are listed in the Data Availability Statement, and local downloads are validated using hash values from the repositories when available. MD5 and SHA-256 denote the Message-Digest Algorithm 5 and Secure Hash Algorithm 256-bit cryptographic hash functions, respectively, which were used to identify file duplicates and validate the integrity of local copies. They do not carry any information regarding coating chemistry or imagery content. YOLO refers to the You Only Look Once (YOLO) object detection annotation scheme and algorithms used in detector experiments.
Table 1.
Dataset-to-analysis mapping for the multimodal coating study.
The painted metal sheets database was provided by Josimar Hendrio through Mendeley Data and is linked to Instituto Federal de Educação, Ciência e Tecnologia do Piauí and Instituto Federal de Educação, Ciência e Tecnologia do Maranhão, Brazil; there is no information regarding the type of camera used for capturing the images on the source page. The images of the water-based coating on wood samples were captured in the production workshop of Baijiawang Co., Ltd. in Jiangshan City, China, using industrial high-resolution cameras; however, the brand and the model of the camera is not stated publicly. The spectra of ship coatings were captured at Galangan Jakarta II shipyard of PT Dok dan Perkapalan Kodja Bahari, Indonesia, using the portable AS7265X multispectral sensor; the AS7265X sensor family is produced by ams-OSRAM AG, Premstätten, Austria. The physical dataset of Romani et al. [15,16] includes the Multi-gloss 268A glossmeter (Konica Minolta, Tokyo, Japan), UBM laser profilometer (UBM Messtechnik GmbH, Ettlingen, Germany) and EVO 50 EP scanning electron microscope (Carl Zeiss S.p.A., Milan, Italy). The physical dataset NeRFBK Industrial_A consists of Huawei P20 Pro images (Huawei Technologies Co., Ltd., Shenzhen, China) and a triangulation laser-scanner reference model; the public NeRFBK table does not specify the laser-scanner brand or model.
The performance metrics used in this study are defined as follows. Accuracy is the proportion of correctly classified samples among all evaluated samples. Balanced accuracy is the arithmetic mean of the class-wise recall values and is particularly useful when class frequencies are imbalanced. The macro-F1 score is the unweighted arithmetic mean of the class-wise F1 scores, where the F1 score is the harmonic mean of precision and recall. Precision is the proportion of true-positive predictions among all positive predictions, whereas recall is the proportion of true-positive predictions among all actual positive samples. For object-detection tasks, mAP@0.50 denotes the mean class-wise average precision calculated at an intersection-over-union (IoU) threshold of 0.50. mAP@0.50:0.95 averages the mean average precision over IoU thresholds ranging from 0.50 to 0.95 in increments of 0.05. PSNR, SSIM, and LPIPS quantify held-out image-rendering quality, with higher PSNR and SSIM values and lower LPIPS values indicating better performance. RMSE, the 95th percentile (P95), and the inlier-95 mean and RMSE quantify source-to-STL geometric distances after similarity alignment. The inlier-95 metrics are calculated after excluding the largest 5% of the source-to-STL distances.
2.3. Image Based Paint-Condition Classification
The dataset with painted-metal-sheet images includes 1779 training repository images and 179 testing repository images. Also, its integrity was confirmed by comparison with the repository-provided SHA-256 checksum. The class labels have been mapped from the source folders into conforming and nonconforming. Prior to performing model evaluation, all images had been hashed. There were 68 duplicate test files that matched the byte-for-byte training files. After excluding those duplicates, there were 111 test files left; deduplicating the test set based on hash values resulted in 93 unique images (53 conforming and 40 nonconforming). The training set contained 1779 unique hashes and was retained unchanged. This leakage-filtered set, rather than the nominal test folder, is the primary evaluation set.
Each image was transformed to be in size with features being defined by RGB color code, 16-bin histogram for each channel, and 90 statistics from gray-scale images that form a grid, resulting in 7050 features in total. Scikit-learn classifier algorithms were applied for the dataset in five versions of fixed classifier types: Principal Component Analysis (PCA) + Logistic Regression (LR), PCA + Linear Support Vector Machines (SVM), PCA + RBF SVM, Extra Trees, and Random Forest (RF) [18,19,20]. The accuracy, balanced accuracy, and F1-macro score were calculated on the test data with and without overlapping.
To assess whether 48 × 48 resizing might eliminate coating-related micro-texture, another sensitivity analysis was run with a higher resolution transfer feature extraction. The same audited duplicate train/test masks were used again, but now each image was resized to 224 × 224 pixels and run through the pre-trained ImageNet EfficientNetB0 model [21], with the classifier layer stripped out. The resulting 1280-dimensional global average pooled convolutional feature vector was then analyzed using the same fixed logistic regression and SVM classifiers. This sensitivity analysis was not used for tuning the main test set, but rather for testing whether higher resolution and deep convolutional features would change the result.
2.4. Water-Based Coated Wood Defect Localization
Zenodo water-based coated wood dataset contains 13,400 RGB images of waterborne-paint surface defects on wood products with YOLO-format labels for holes, blisters, cracks, and scratches [12]. All downloaded archive MD5 hashes matched Zenodo metadata. To avoid augmentation leakage, the dataset was used to define the split before adding any transformed images. The 335 original labelled images were partitioned with seed = 42 into 234 training images, 50 validation images, and 51 held-out test images. The original split contained 829 annotated boxes.
Only training IDs were expanded using public brightness-variation, Gaussian-transform, and peppercorn-transform augmentation archives. This produced 1170 training images and 2985 training boxes, while validation and test remained original unaugmented images. The detector was a Faster R-CNN MobileNet-V3-320-FPN model fine-tuned from Common Objects in Context (COCO)-pretrained weights [22,23]. Training used Compute Unified Device Architecture (CUDA), batch size 4, stochastic gradient descent (SGD) learning rate 0.002, momentum 0.9, weight decay 0.0005, and 15 epochs. The best checkpoint was selected by validation mAP@0.50 and evaluated once on the held-out original test split. A random-initialized control on the same augmented training split remained weak, with 0.027 test mAP@0.50, so the reported result uses the pretrained fine-tuning protocol.
The coated wood experiment tests for defect localization under a leakage control and transfer learning experiment. Nonetheless, the experiment does not offer a comparison between various detector architectures. In order to conduct a comparison between recent YOLO architectures, another controlled experiment was performed using standardized data from steel surfaces.
In order to conduct the comparison in a controlled manner, the NEU-DET dataset from the Northeastern University surface defect dataset was employed [13]. This dataset includes 1800 actual images of hot-rolled steel surface with a spatial resolution of pixels. Detection annotations are included for six different types of defects: crazing, inclusion, patches, pitted surface, rolled-in scale, and scratches. Dataset integrity was checked with SHA-256 checksum. Pascal VOC XML annotations were first converted to YOLO format prior to model training. A total of 4189 bounding boxes were counted through the annotation audit process, comprising of 689 crazing, 1011 inclusion, 881 patches, 432 pitted surface, 628 rolled-in scale, and 548 scratches.
A stratified primary-class split with seed 42 was performed. The split included 1260 training images, 270 validation images and 270 test images according to the primary defect class ratio of 70/15/15. The split kept the same number of primary-class images: 210 per class in the training and 45 per class in validation and test splits. Eight Ultralytics object detection checkpoints were trained using the same procedure [24]: YOLOv8n, YOLOv8s, YOLO11n, YOLO11s, YOLO12n, YOLO12s, YOLO26n and YOLO26s. The reason for this comparison is that YOLO-family detectors are popular for real-time detection and recent NEU-DET research keeps using a YOLO-family based detector for industrial steel surface defect detection [25,26,27]. All models were trained using image size 640, batch size 16, the AdamW optimization method, learning rate 0.001, seed 42, 30 requested epochs and best-checkpoint by validation. A selected checkpoint of each model was tested on the held-out test split only once.
Ship coating spectra consist of 148 measured sample points analyzed using 18 spectral bands at wavelengths of 410, 435, 460, 485, 510, 535, 560, 585, 610, 645, 680, 705, 730, 760, 810, 860, 900, and 940 nm.
Our workbook had 112 unique 18-band spectral signatures and 36 duplicate entries. The performance of logistic regression, RBF-SVM, and random forest classification models was investigated by applying shuffled stratified group five-fold cross-validation. Identical spectral signatures were assigned to the same folds to avoid any direct duplication leakage between training and validation sets. Accuracy, balanced accuracy, and macro-F1 score were used as model performance metrics, whereas the overall confusion matrix was generated based on grouped out-of-fold predictions. Since information about vessel identifiers and inspection point identifiers was not available, grouping of identical signatures helped reduce duplication leakage but did not guarantee independence of repeated measurements acquired at the same point. The literature on near-infrared and hyperspectral analysis of coatings indicates that spectral machine learning algorithms can be applied for non-destructive inspection, but highlights the role of measured reference labels and calibration [4,5].
Spectral classification analysis checks whether the coating condition can be distinguished through reflectance signature but does not reveal anything about the physical characteristics of the surface. In order to make up for the deficiency of this indirect analysis technique, another dataset of characterization of coatings, which uses measurements of gloss, roughness, and coating thickness, was studied.
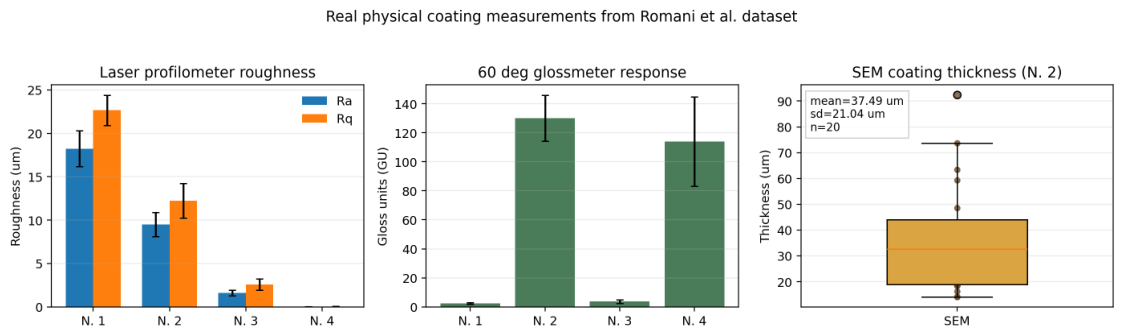
The Romani et al. [15,16] dataset was used as an independent source for the physical characterization of coated samples. The dataset consists of four groups of ultraviolet (UV)-assisted 3D-printed recycled glass-fiber-reinforced polymer (GFRP) samples subjected to different sanding and physical vapor deposition (PVD) treatments: N. 1, non-sanded and without a PVD coating; N. 2, non-sanded with a PVD chromium coating; N. 3, sanded and without a PVD coating; and N. 4, sanded with a PVD chromium coating. The public repository contains three separate workbooks providing glossmeter, surface-roughness, and coating-thickness data. The gloss workbook contains five replicate measurements for each glossmeter angle, the roughness workbook provides line-based laser-profilometry measurements of arithmetic average roughness () and root-mean-square roughness (), and the SEM workbook contains 20 coating-thickness measurements obtained from two cross-sections of sample group N. 2.
Physical characterization produces measurement data that serve as references to the values of gloss, roughness, and coating thickness, but there is no imaging involved. To evaluate the geometric and appearance reconstruction part of the process being discussed, another reflective object dataset needed to be analyzed. The purpose of this additional experiment is to assess the possibility and restrictions of COLMAP/3DGS reconstruction based on multi-view imaging and laser-scanner measurements. The NeRFBK Industrial dataset was used as a real-world case study for multi-view reconstruction. It contains 295 images acquired with a Huawei P20 Pro smartphone at a resolution of pixels, together with a triangulation laser-scanned STL reference model of the same object. These data were used to evaluate the image-reconstruction performance and geometric consistency of the COLMAP/3DGS pipeline against an independent three-dimensional reference.
COLMAP was configured with GPU-based feature extraction, an OpenCV camera model, a maximum image size of 1600 pixels, sequential matching with an overlap of 15, guided matching, and sparse reconstruction [28]. The resulting model registered all 295 images, generated 157,512 sparse points, and achieved a mean reprojection error of 0.855 pixels. This sparse reconstruction was then used to initialize the gsplat 3DGS models. Following the default repository split, every eighth image was reserved for validation, resulting in 258 training images and 37 validation images. Three models were trained for 1000 steps using native resolution and downsampling factors of 4 and 8, while an additional native-resolution model was trained for 3000 steps. All experiments used structure-from-motion (SfM) initialization, a batch size of 1, default densification, and PSNR, SSIM, and LPIPS-Alex for evaluation [29,30]. Because COLMAP retained radial and tangential distortion parameters while the gsplat renderer used a pinhole camera model, the reported results are interpreted as feasibility indicators rather than distortion-corrected measurements. More accurate evaluation would require image undistortion before training or the use of a distortion-aware renderer.
Geometry was evaluated using the real laser-scanner STL model rather than a simulated reference surface. For both the COLMAP sparse point cloud and the trained 3DGS Gaussian centers, the source points were aligned with a sampled STL vertex cloud using PCA-based initialization over multiple axis and sign configurations, followed by a trimmed point-to-point similarity iterative closest point (ICP) procedure. Nearest-neighbor distances from the source points to the STL reference were then calculated in STL coordinate units. For the 3DGS evaluation, Gaussian centers with sigmoid opacity values below 0.01 were excluded before sampling. This metric is reported as a unidirectional geometric diagnostic because Gaussian centers do not form a watertight mesh and sparse SfM points do not represent a dense surface reconstruction. Therefore, the metric measures source-to-STL proximity but does not assess surface completeness. A more comprehensive geometric evaluation should include bidirectional Chamfer distance, STL-to-source coverage, and robust Hausdorff or percentile-based Hausdorff measures after distortion-corrected reconstruction.
While the geometry analysis offers a quantification against the laser scanner standard, its applicability is restricted to the reconstruction only and does not provide coating property information. The next section will discuss how the NeRFBK method fits into the multimodal methodology in general, and what more is needed for coating metrology. NeRFBK analysis evaluates the COLMAP/3DGS workflow on a real reflective multi-view scene with laser-scanner geometry. Coating-specific metrology additionally requires synchronized multi-view images, camera calibration, repeated time points, coating and substrate metadata, co-registered instrument measurements, and specimen-level grouping. The reconstruction results are therefore interpreted as reflective-scene image and geometry diagnostics.
2.5. Physical Calibration Requirements for 3DGS-Derived Descriptors
Physical interpretation of 3DGS-derived descriptors requires paired reference measurements. The Romani et al. [15,16] dataset demonstrates that real glossmeter, profilometer, and SEM coating measurements are available and can be recomputed from public files, but those files are not spatially paired with multi-view 3DGS reconstructions. Gloss should be measured at appropriate geometries, commonly 20, 60, and 85 degrees, while the same surface locations should be measured using stylus profilometry or AFM. Any 3DGS-derived appearance or geometry descriptor must be registered to the physical measurement footprint and validated on held-out specimens before it can be interpreted in gloss units or micrometers.
The performance of calibration must be described using proper regression analysis metrics and measures of uncertainty, which include coefficient of determination, root mean square error, confidence intervals, residual analysis, and leave-one-sample-out validation. If there are several substrates or coating chemistry systems used in the experiment, then calibration must also be analyzed by stratifying results based on substrate and coating type. The correlation coefficient might be deceptive if it mostly depends on differences in material groups.
Public datasets provide useful pieces of the calibration problem, including measured roughness, multi-view non-Lambertian imagery, material appearance, and laser-referenced geometry [31,32,33,34,35]. None of the sources reviewed for this study combines those elements with coating chemistry, repeated degradation states, co-registered glossmeter/profilometry measurements, and coating-failure labels on the same specimens. As a result, the actual coating measurements on the physical surface and the actual 3DGS measurements can be reported independently, as in this case, but they cannot be combined to make a calibrated property statement about the coating. The future calibration procedure should use one set of data per specimen and should retain intact specimens for testing.
2.6. Statistical Reporting and Reproducibility
The painted-metal result uses a duplicate-filtered version of the repository test folder and reports a Wilson 95% interval for the highest fixed-classifier accuracy. The coated-wood detector uses seed 42, train-only augmentations, validation-based checkpoint selection, and one final evaluation on original test images. NEU-DET comparison uses the same 70/15/15 split, optimizer, image size, requested epochs, and held-out evaluation for every checkpoint. The reflectance experiment uses duplicate-grouped stratified five-fold validation; the absence of vessel IDs is stated as a limitation.
Public datasets were cited using persistent identifiers, and downloaded files were verified using repository-provided cryptographic hashes where available. All figures were generated from the accompanying analysis scripts. The YOLO experiments were conducted using Python 3.10.20, PyTorch 2.11.0, CUDA 12.8, and Ultralytics 8.4.60, while COLMAP 4.0.4 was used for structure-from-motion reconstruction. The high-resolution EfficientNetB0 sensitivity analysis was performed using Python 3.13.11, TensorFlow 2.20.0 (Google LLC, Mountain View, CA, USA), and scikit-learn 1.8.0. GPU-accelerated experiments were executed on an NVIDIA GeForce RTX 5070 Laptop GPU (NVIDIA Corporation, Santa Clara, CA, USA) with approximately 8 GB of available CUDA memory. Ultralytics YOLO, COLMAP, and scikit-learn are open-source software packages and are therefore reported by project name and version rather than by conventional equipment manufacturer information.
The combined coating and monitoring investigation needs to be performed in such a way that data are collected concurrently from visual, physical, geometric, and environmental perspectives. Such data need to be correlated at the sample level for accurate calibration and to prevent any incorrect comparison of uncorrelated data. The data needed for correlation has been listed in Table 2.
Table 2.
Minimum real dataset required for integrated coating-monitoring validation.
As a result, coating datasets often contain repeated measurements, copied files, adjacent video frames, or several observations from the same physical part. Random record-level splitting can therefore produce optimistic metrics. This study performs exact-file hashing for the painted-metal archive, keeps all augmented coated-wood variants within the training partition of their original image, and groups identical Vis/NIR signatures within cross-validation folds. These controls do not remove all dependence: the spectral dataset lacks vessel and inspection-point identifiers, and the NEU-DET split cannot be grouped by physical steel specimen because such metadata are unavailable.
3. Results
3.1. Real Image-Based Paint-Defect Classification
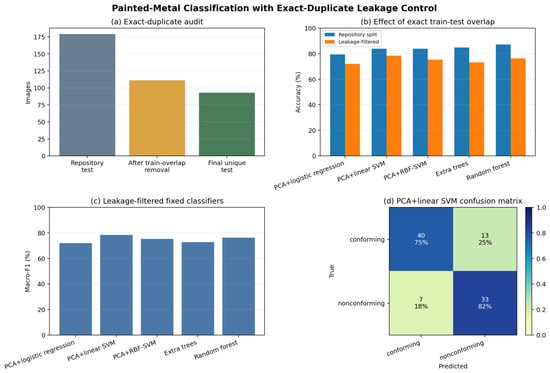
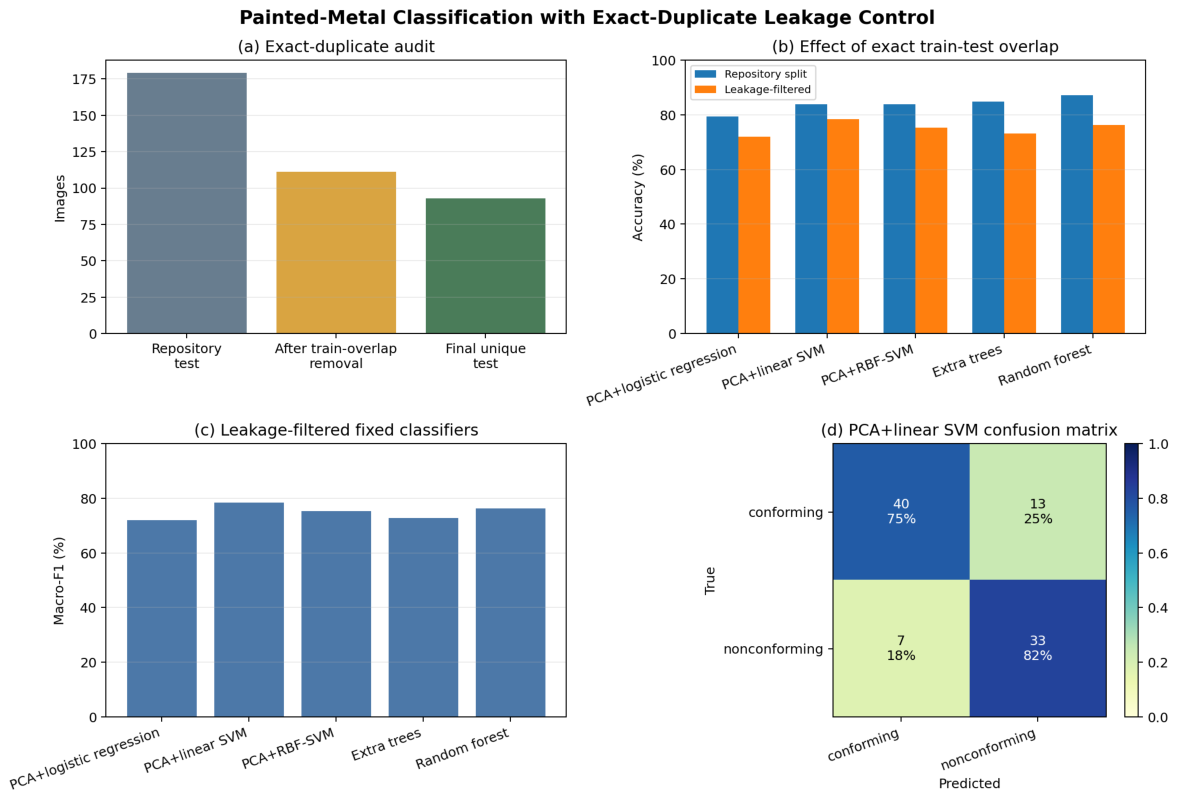
Figure 1 and Table 3 summarize the duplicate audit and the leakage-filtered results. The nominal repository split is not an independent test because 68 of its 179 records occur byte-for-byte in training. After removing cross-split overlap and 18 additional duplicate records within the remaining test set, 93 unique images remained. Across the five fixed 48 × 48 classifiers, leakage-filtered accuracy ranged from 72.04% to 78.49%. PCA+linear SVM had the highest accuracy at 78.49% (95% Wilson interval: 69.10%–85.63%), with 78.99% balanced accuracy and 78.37% macro-F1. Its confusion matrix contained 40 correctly classified conforming images, 13 conforming images predicted as nonconforming, 7 nonconforming images predicted as conforming, and 33 correctly classified nonconforming images. The nominal random-forest accuracy of 87.15% is retained only in Figure 1 to show the inflation associated with the overlapping split; it is not used as the primary result. The added 224 × 224 EfficientNetB0 transfer-feature sensitivity analysis did not improve the leakage-filtered result: both the logistic-regression and linear-SVM heads achieved 66.67% accuracy, 70.75% balanced accuracy, and 65.37% macro-F1. The deep-feature models detected all 40 nonconforming test images but misclassified 31 of 53 conforming images, indicating that general ImageNet features at higher resolution are not automatically sufficient for this small, binary, coating-specific dataset.
Figure 1.
Painted-metal exact-duplicate audit and leakage-filtered classification results. Panel (a) shows how the nominal 179-image repository test set is reduced after removing exact train–test overlap and within-test duplicates. Panel (b) compares nominal repository accuracy with leakage-filtered accuracy, showing that exact overlap inflated apparent performance for all fixed classifiers. Panel (c) reports macro-F1 on the final 93-image leakage-filtered hold-out repository test set, and panel (d) gives the row-normalized confusion matrix for the strongest 48-by-48 baseline, PCA plus linear support-vector machine.
Table 3.
Performance on the 93-image leakage-filtered painted-metal test set.
3.2. Real Coated Wood Defect Localization
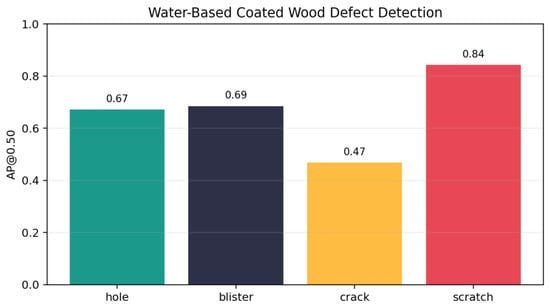
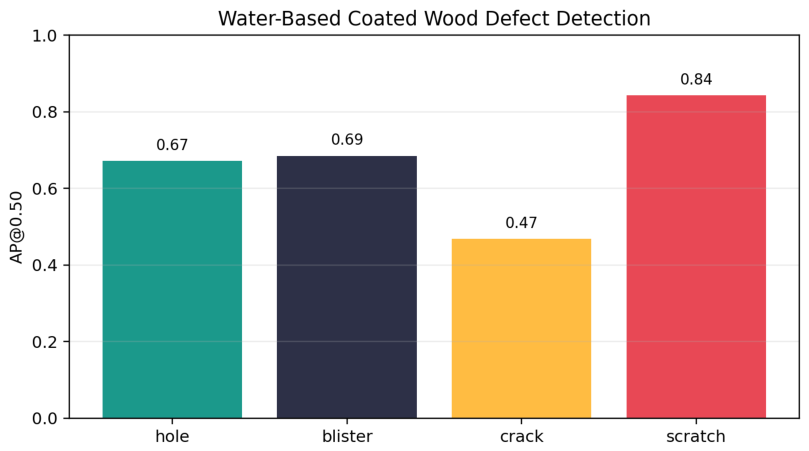
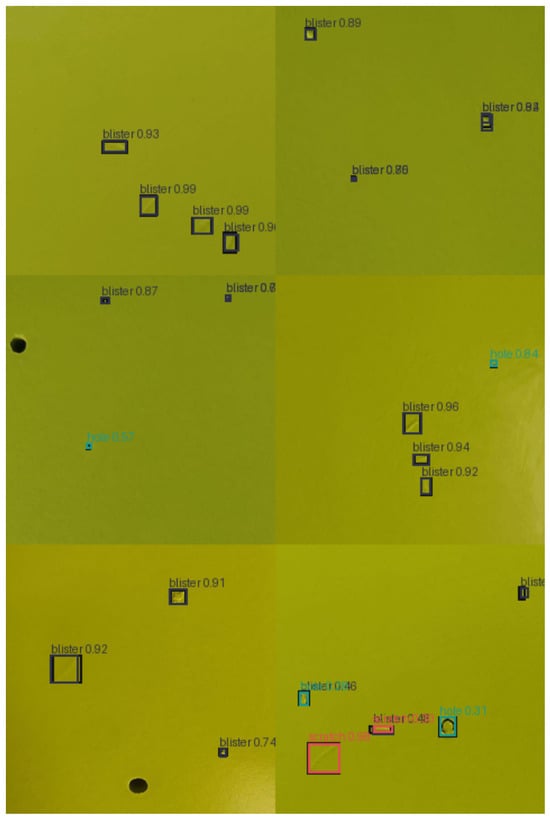
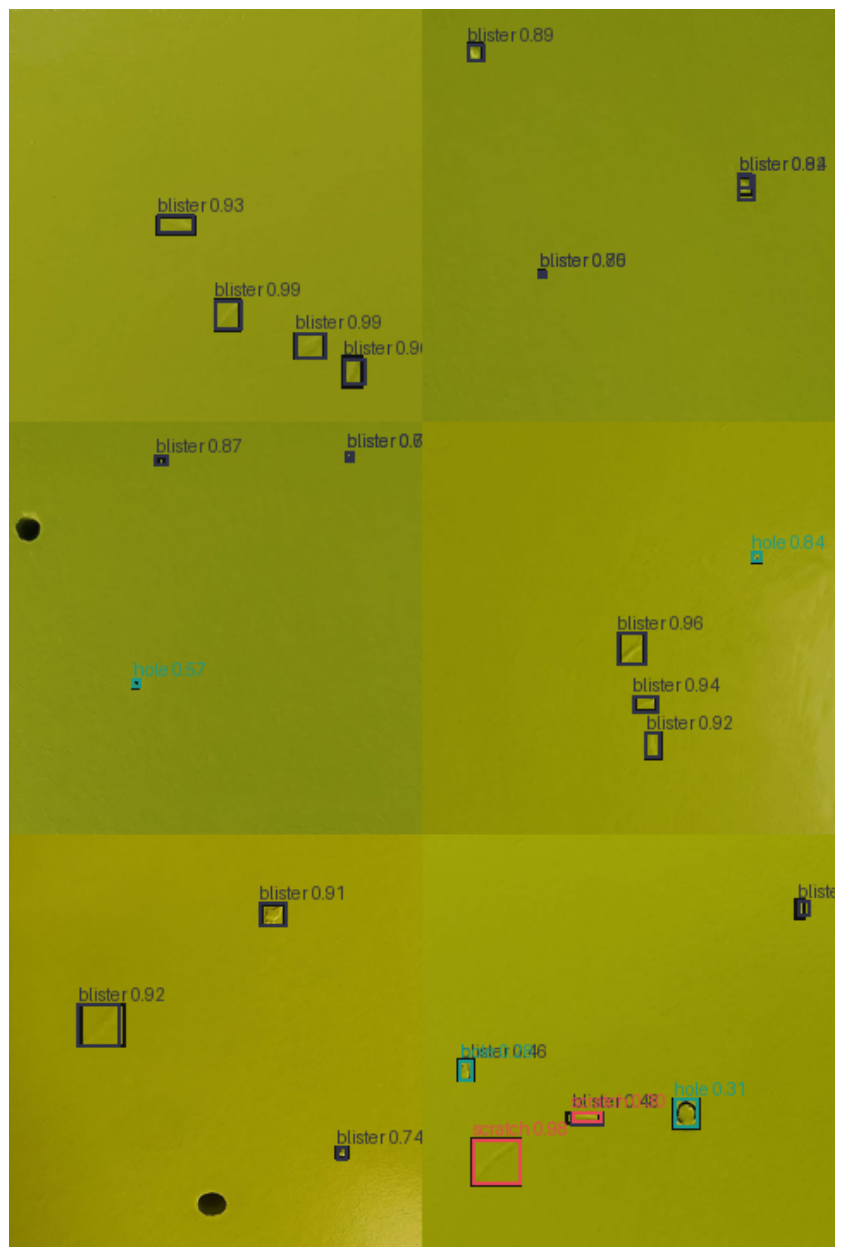
The water-based coated wood detector was evaluated on 51 original held-out test images containing 121 annotated defect boxes. Figure 2 and Table 4 document the original-test detection metrics, while Figure 3 provides qualitative held-out predictions for visual error checking. The COCO-pretrained Faster R-CNN model achieved 0.667 mAP@0.50, 0.347 mAP@0.75, and 0.331 mAP@0.50:0.95. At a score threshold of 0.25 and an IoU threshold of 0.50, micro precision was 0.565, micro recall was 0.719, and micro-F1 was 0.633. The easiest class was scratch, with AP@0.50 of 0.843, while crack was the hardest class, with AP@0.50 of 0.468.
Figure 2.
Coated-wood defect detection on original held-out test images.
Table 4.
Held-out coated-wood object-detection performance.
Figure 3.
Qualitative held-out coated-wood defect predictions. The black circular regions are hole-type surface features present in the original coated-wood images, not added graphical markers.
Figure 2 and Table 4 need thus to be read in conjunction. The bar chart emphasizes the class-specific localization challenge: scratches are high-contrast and elongated objects and have accordingly the best AP@0.50 and F1, whereas cracks are thin, irregular objects that can be mistaken for background, leading to the worst AP@0.50 and F1. Holes and blisters have intermediate scores: both reach AP@0.50 values above 0.67, although their precision values are lower than their recall values, suggesting that while the number of true positive (TP) is large, number of false positive (FP) is even larger. This is the correct trade-off in the case of screening-oriented inspection when a missing defect is more costly than having an extra candidate that will be checked manually or via another model.
3.3. Controlled NEU-DET YOLO Architecture Comparison
NEU-DET experiment provides a controlled real-image comparison of YOLO detection checkpoints on a balanced industrial surface-defect split. Table 5 reports the held-out test results. The strongest mAP@0.50 result was obtained by YOLOv8s, with 0.773 mAP@0.50, 0.406 mAP@0.50:0.95, 0.718 precision, and 0.744 recall. The strongest stricter localization result was obtained by YOLO11n, with 0.419 mAP@0.50:0.95 and 0.766 mAP@0.50. YOLO12s was also competitive, reaching 0.771 mAP@0.50 and 0.416 mAP@0.50:0.95. Since every row uses the same real dataset, split, training budget, and held-out test protocol, comparison isolates architecture choice more effectively than separate tuning experiments. The table also shows that larger or newer checkpoints do not automatically dominate on 200 × 200 surface-defect imagery. For example, YOLO26n and YOLO26s were weaker than the YOLOv8, YOLO11, and YOLO12 candidates under this protocol. The result provides empirical guidance for detector selection on real surface-defect images.
Table 5.
YOLO detector comparison on the real NEU-DET held-out split.
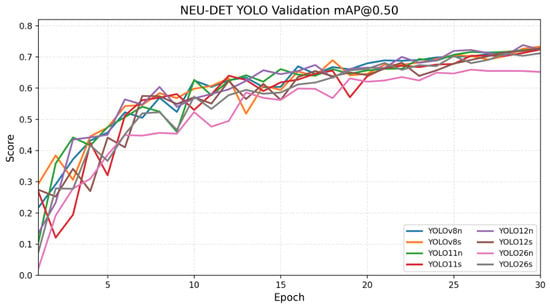
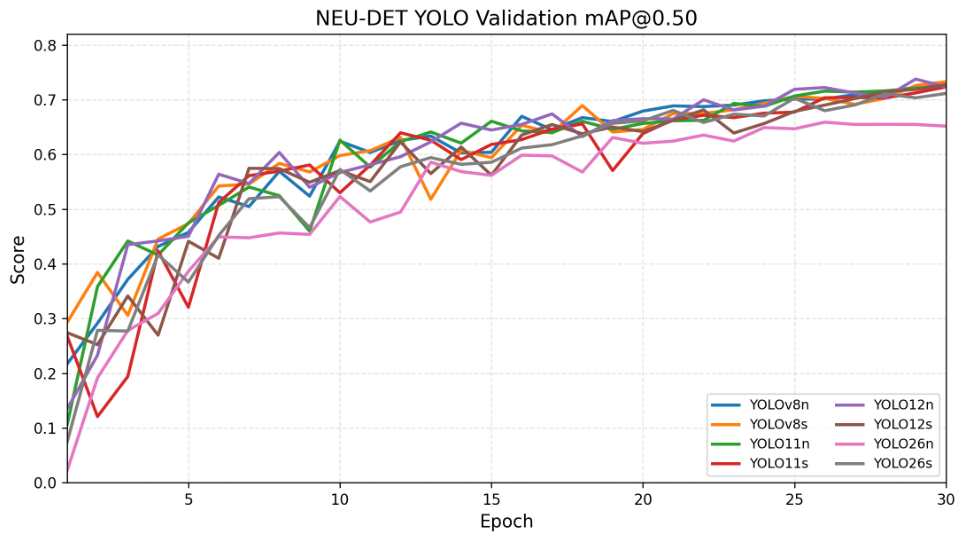
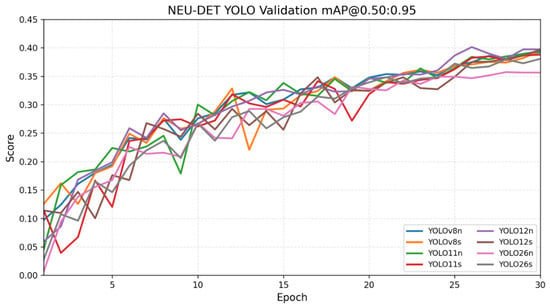
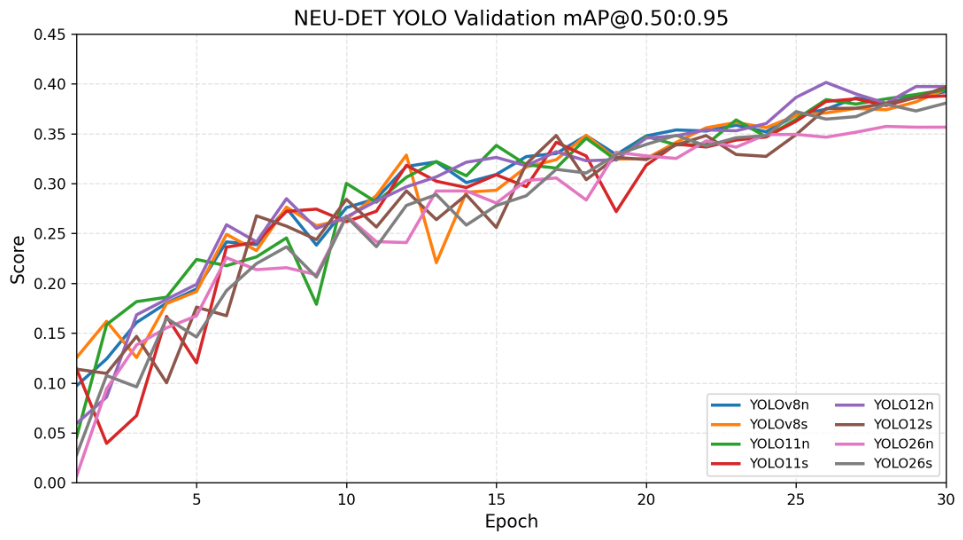
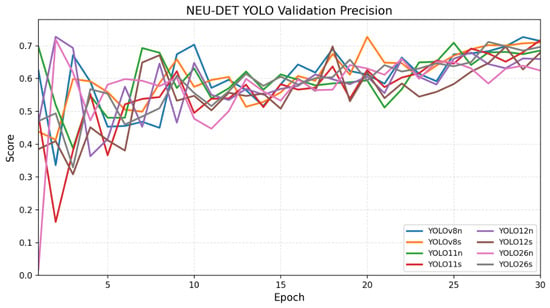
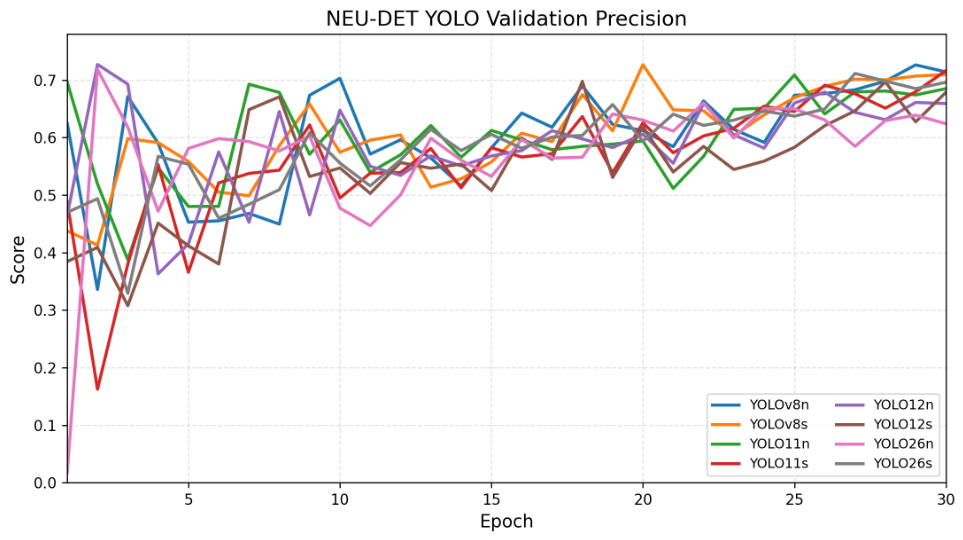
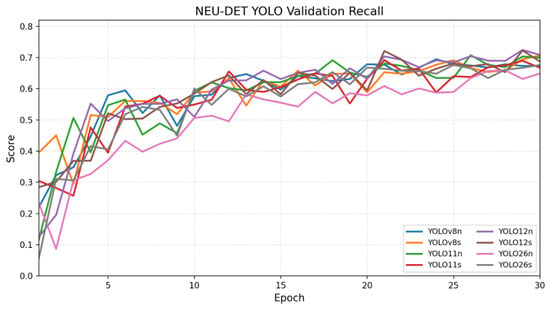
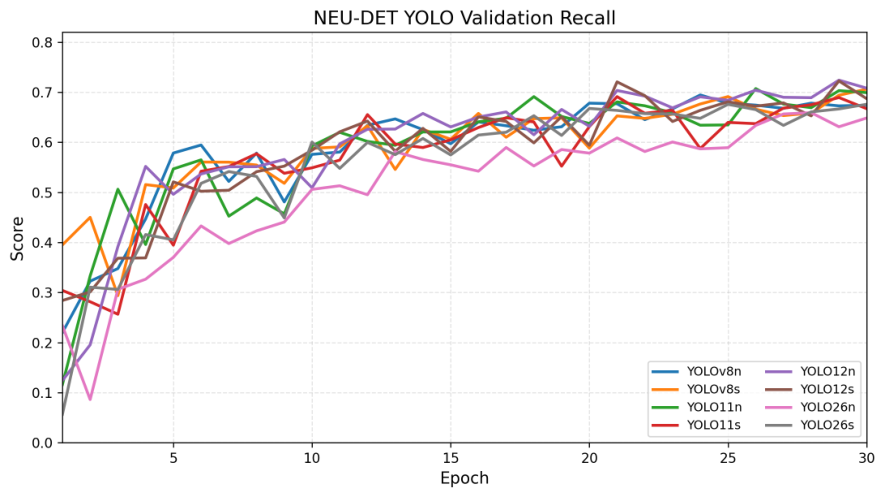
The validation curves in Figure 4, Figure 5, Figure 6 and Figure 7 evidence the training stability and model-selection behavior under the same NEU-DET split and training budget. The mAP and precision/recall curves show that the detector ranking is consistent with the observed validation dynamics, and not just determined by a single final checkpoint.
Figure 4.
NEU-DET validation mAP@0.50 curves. Each line shows a YOLO checkpoint family trained under the same split and budget; higher curves indicate better validation detection at a 50% box-overlap threshold, and the early rise followed by plateau indicates convergence behavior.
Figure 5.
NEU-DET validation mAP@0.50:0.95 curves. This stricter metric averages detection quality across overlap thresholds from 0.50 to 0.95, so lower values relative to mAP@0.50 indicate that precise box placement is more difficult than coarse defect recognition.
Figure 6.
NEU-DET validation precision curves. Precision measures the share of predicted boxes that are correct; oscillations in early epochs reflect changing confidence thresholds and class localization behavior before the models stabilize.
Figure 7.
NEU-DET validation recall curves. Recall measures the share of annotated defects recovered by the detector; the final curves show whether a model misses defects even when its precision is high.
More specifically, Figure 4 shows rapid improvement during approximately the first 10 epochs, followed by gradual convergence for most checkpoints between epochs 20 and 30. The top models finish in a narrow validation band, whereas YOLO26n remains visibly lower, matching its weaker held-out test mAP@0.50. Figure 5 is stricter because it averages localization quality across multiple IoU thresholds; the lower absolute values in this curve indicate that precise box placement, not only defect recognition, remains a limiting factor on the small NEU-DET images. Figure 6 and Figure 7 further show that early epochs have noisy precision–recall tradeoffs, while the later epochs stabilize near the range used for final model selection. This explains why the final comparison table reports both precision/recall and mAP values rather than relying on a single curve.
3.4. Real Vis/NIR Coating-Condition Classification
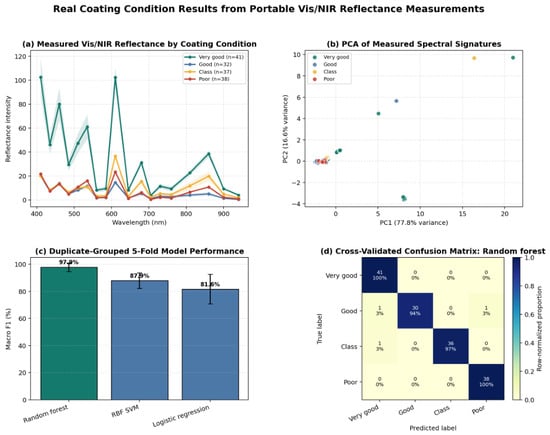
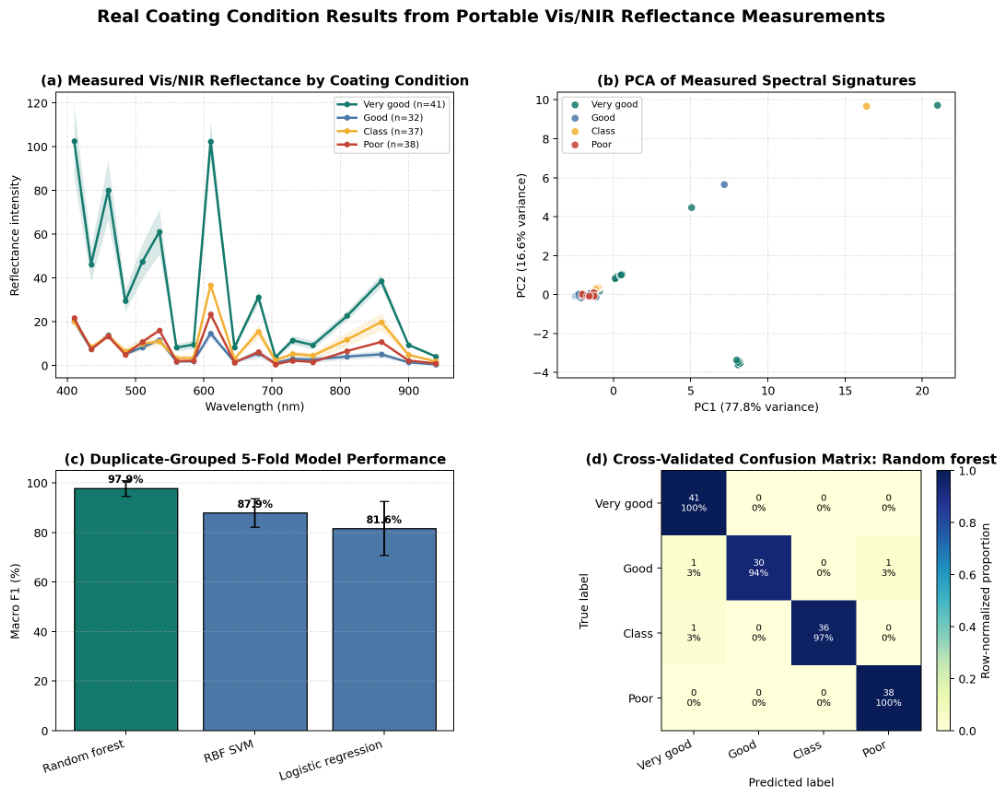
Figure 8 and Table 6 summarize the reflectance dataset. The mean spectral curves show class-dependent differences, especially for the very good condition. With identical spectra constrained to the same fold, the random forest achieved accuracy, balanced accuracy, and macro-F1. Across 148 grouped out-of-fold predictions, three rows were misclassified. Because the source provides repeated measurements but no vessel or inspection-point identifiers, this remains evidence of within-dataset spectral separability rather than guaranteed generalization to unseen vessels or coating systems.
Figure 8.
Ship-coating visible/near-infrared reflectance classification summary. Panel (a) plots mean sensor intensity across the 18 AS7265X wavelength channels for each coating-condition label, with shaded bands indicating class variability. Panel (b) projects the measured spectral signatures onto the first two principal components, illustrating class separation and repeated-measurement structure. Panel (c) compares duplicate-grouped five-fold macro-F1 values for the three fixed classifiers; error bars show fold-to-fold standard deviation. Panel (d) gives the row-normalized random-forest confusion matrix, where the diagonal cells indicate correct condition predictions.
Table 6.
Measured Vis/NIR coating-condition classification performance.
3.5. Real Physical Gloss, Roughness, and SEM Coating Measurements
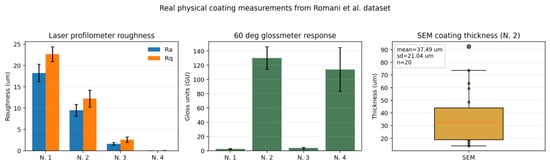
The Romani et al. [15,16] dataset provides the physical measurement block of the study. Figure 9 and Table 7 report the recomputed 60° glossmeter response, laser-profilometer roughness values, and SEM coating-thickness measurements. The non-sanded PVD comparison, N. 1 to N. 2, reduced from μm to μm and increased 60° gloss from gloss units (GU) to GU. The sanded PVD comparison, N. 3 to N. 4, reduced from μm to μm and increased 60° gloss from GU to GU. Across the full process from N. 1 to N. 4, the reduction was 99.81% and the reduction was 99.79%. The SEM workbook gave a batch-N. 2 coating-thickness mean of μm over 20 measurements.
Figure 9.
Romani et al. [15,16] coating gloss, roughness, and scanning-electron-microscopy summaries. The left panel compares laser-profilometer roughness average () and root-mean-square roughness () for batches N. 1–N. 4; lower roughness indicates a smoother coated surface. The middle panel reports 60 degree glossmeter response in gloss units, where higher values indicate stronger specular reflection. The right panel shows the batch-N. 2 coating-thickness distribution from scanning electron microscopy; the orange line in the boxplot represents the median value, and the box and individual points show local cross-section variability rather than a single uniform-film thickness.
Table 7.
Real physical coating measurements recomputed from the public Romani et al. [15,16] dataset. Values are mean ± standard deviation.
Here, R/G denotes the roughness/gloss replicate counts, respectively.
The relatively large SEM coating-thickness deviation in Figure 9 should be interpreted as measured local heterogeneity of the batch-N. 2 cross-sections rather than as a uniform-film thickness. The 20 SEM measurements ranged from 14.173 to 92.466 μm, and several high local values increased the standard deviation to 21.04 μm. Plausible contributors include non-uniform PVD deposition over the unsanded GFRP surface, local asperities or pores in the recycled composite substrate, cross-section preparation and image-orientation effects, and the fact that only two local cross-sections were sampled. For this reason, the SEM result is reported as a physical reference distribution and is not used as evidence that a single 3DGS-derived descriptor can predict coating thickness.
These physical measurements serve a different purpose from the NeRFBK reconstruction metrics. They demonstrate that gloss, roughness, and SEM-based coating-thickness values can be obtained from a public coating-characterization dataset; however, they do not establish a predictive relationship between 3DGS parameters and these physical properties. Such a relationship can only be evaluated using spatially co-registered data in which the same surface regions are represented by both multi-view 3DGS reconstructions and instrument-based measurements.
3.6. Real COLMAP/3DGS Reconstruction and Geometry Results
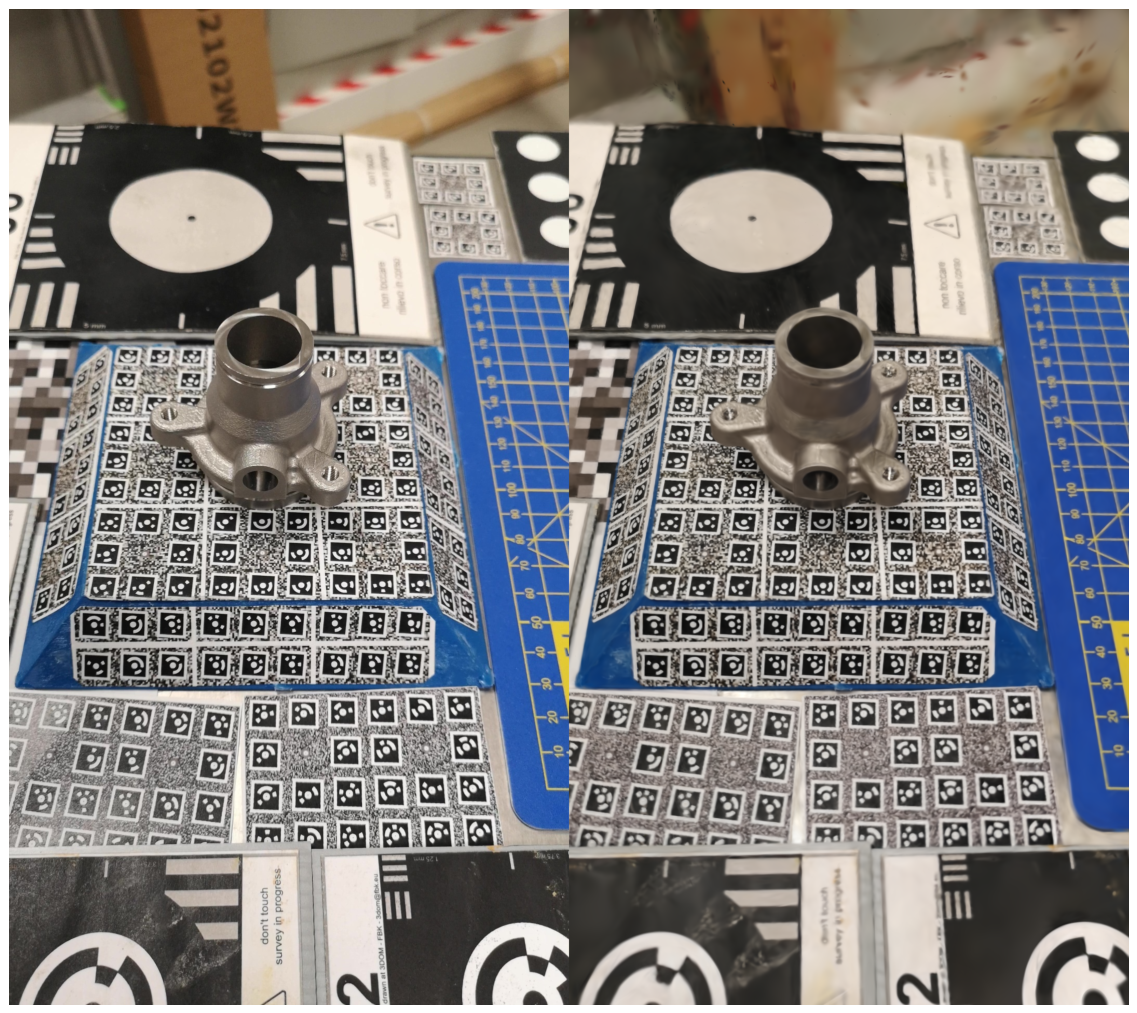
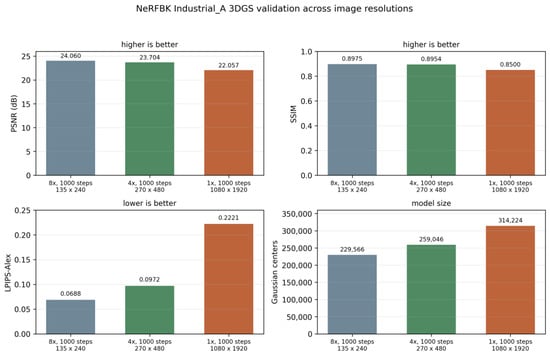
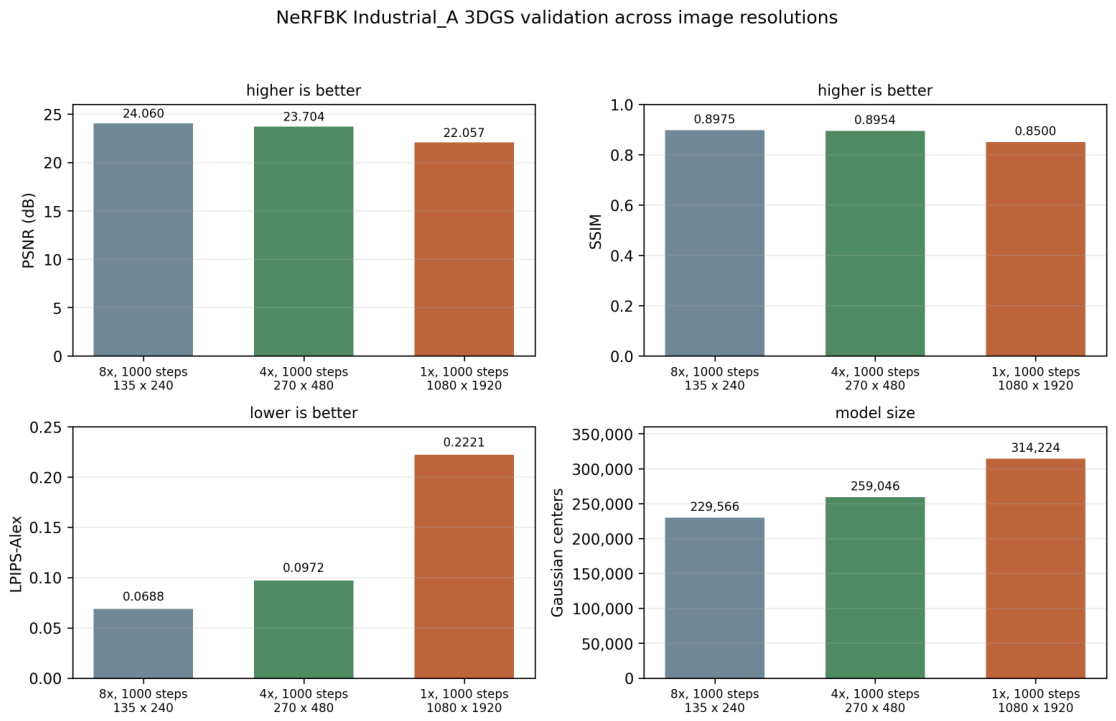
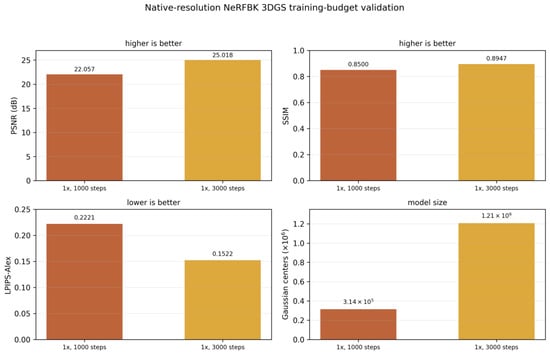
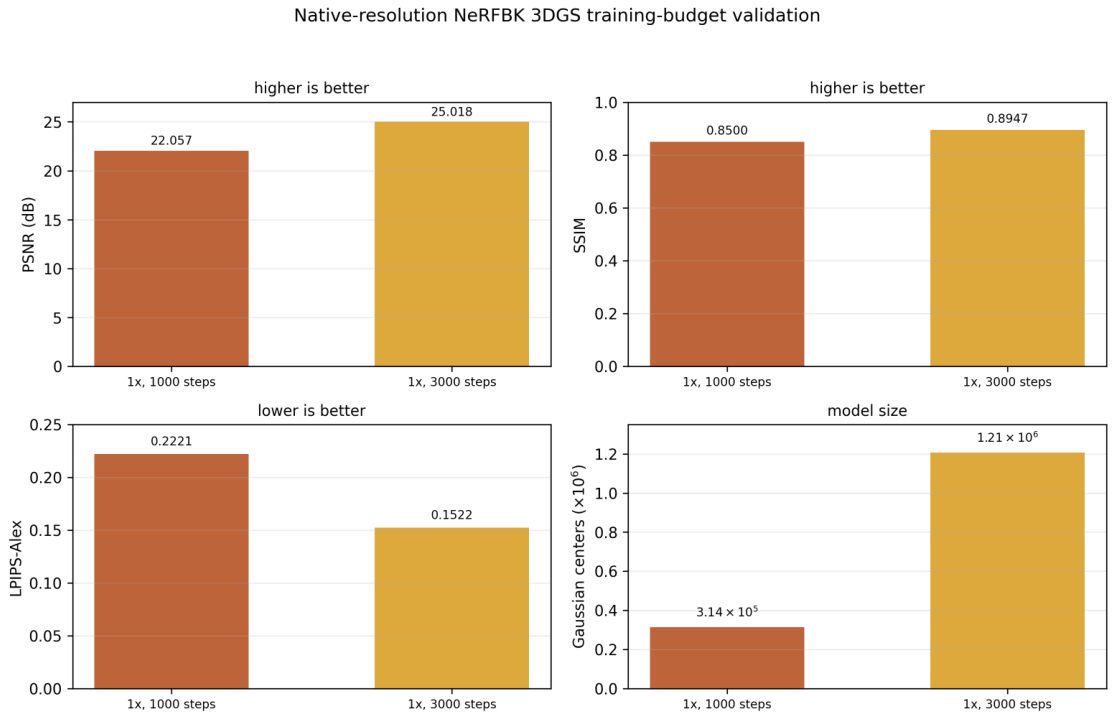
The NeRFBK Industrial_A experiment produced a complete real-data multi-view reconstruction pipeline. COLMAP registered all 295 images and generated 157,512 sparse points with 2,426,974 observations, mean track length 15.41, 8227.03 mean observations per image, and 0.855 px mean reprojection error. The 3DGS stage was then evaluated at three image resolutions and two native-resolution training budgets. Figure 10 provides the held-out native-resolution validation pair, while Figure 11 and Table 8 report the resolution ablation. The native 1000-step run used the original photographs and reached 314,224 Gaussian centers. On 37 hold-out validation, it achieved 22.057 dB PSNR, 0.8500 SSIM, and 0.2221 LPIPS. Extending native run to 3000 steps increased the model to 1,206,955 Gaussian centers and improved the held-out image metrics to 25.018 dB PSNR, 0.8947 SSIM, and 0.1522 LPIPS. Figure 12 and Table 9 document this budget comparison. The 4× and 8× runs are not separate datasets; they are downsampled ablations of the same real photographs, included to show the speed–resolution tradeoff.
Figure 10.
NeRFBK Industrial_A held-out native-resolution validation pair. The left image is the real Huawei P20 Pro validation photograph and the right image is the corresponding three-dimensional Gaussian Splatting render after 3000 native-resolution optimization steps. The side-by-side view highlights that the reconstructed object geometry and calibration markers are visually recognizable, while reflective highlights, background blur, and fine high-frequency details are not reproduced exactly.
Figure 11.
NeRFBK Industrial_A resolution sensitivity. The four panels compare peak signal-to-noise ratio, structural similarity, learned perceptual image patch similarity with AlexNet features, and Gaussian-center count for 8 by, 4 by, and native 1 by image-resolution settings at 1000 optimization steps. Higher values are better for peak signal-to-noise ratio and structural similarity, lower values are better for learned perceptual image patch similarity, and the Gaussian-center count indicates model size rather than physical coating thickness.
Table 8.
Real 3DGS novel-view metrics computed on NeRFBK Industrial_A across image resolutions.
Figure 12.
NeRFBK Industrial_A native-resolution training-budget comparison. The panels compare 1000 and 3000 optimization steps at the original 1080 by 1920 image size. Increasing the budget improves peak signal-to-noise ratio, structural similarity, and learned perceptual image patch similarity, but also increases the number of Gaussian centers, so the improvement is accompanied by a larger rendering representation.
Table 9.
NeRFBK Industrial_A native-resolution training-budget metrics.
Native resolution metrics are lower than downsampled metrics because the comparison at validation is more strict at full resolution: fine details in the image, differences in exposure, reflective highlights and blur are taken into account instead of being averaged out by resizing. This is why the downsampled runs should be thought of as computational ablations, and the 1× run is the direct original image result.
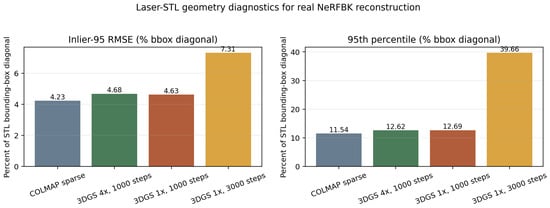
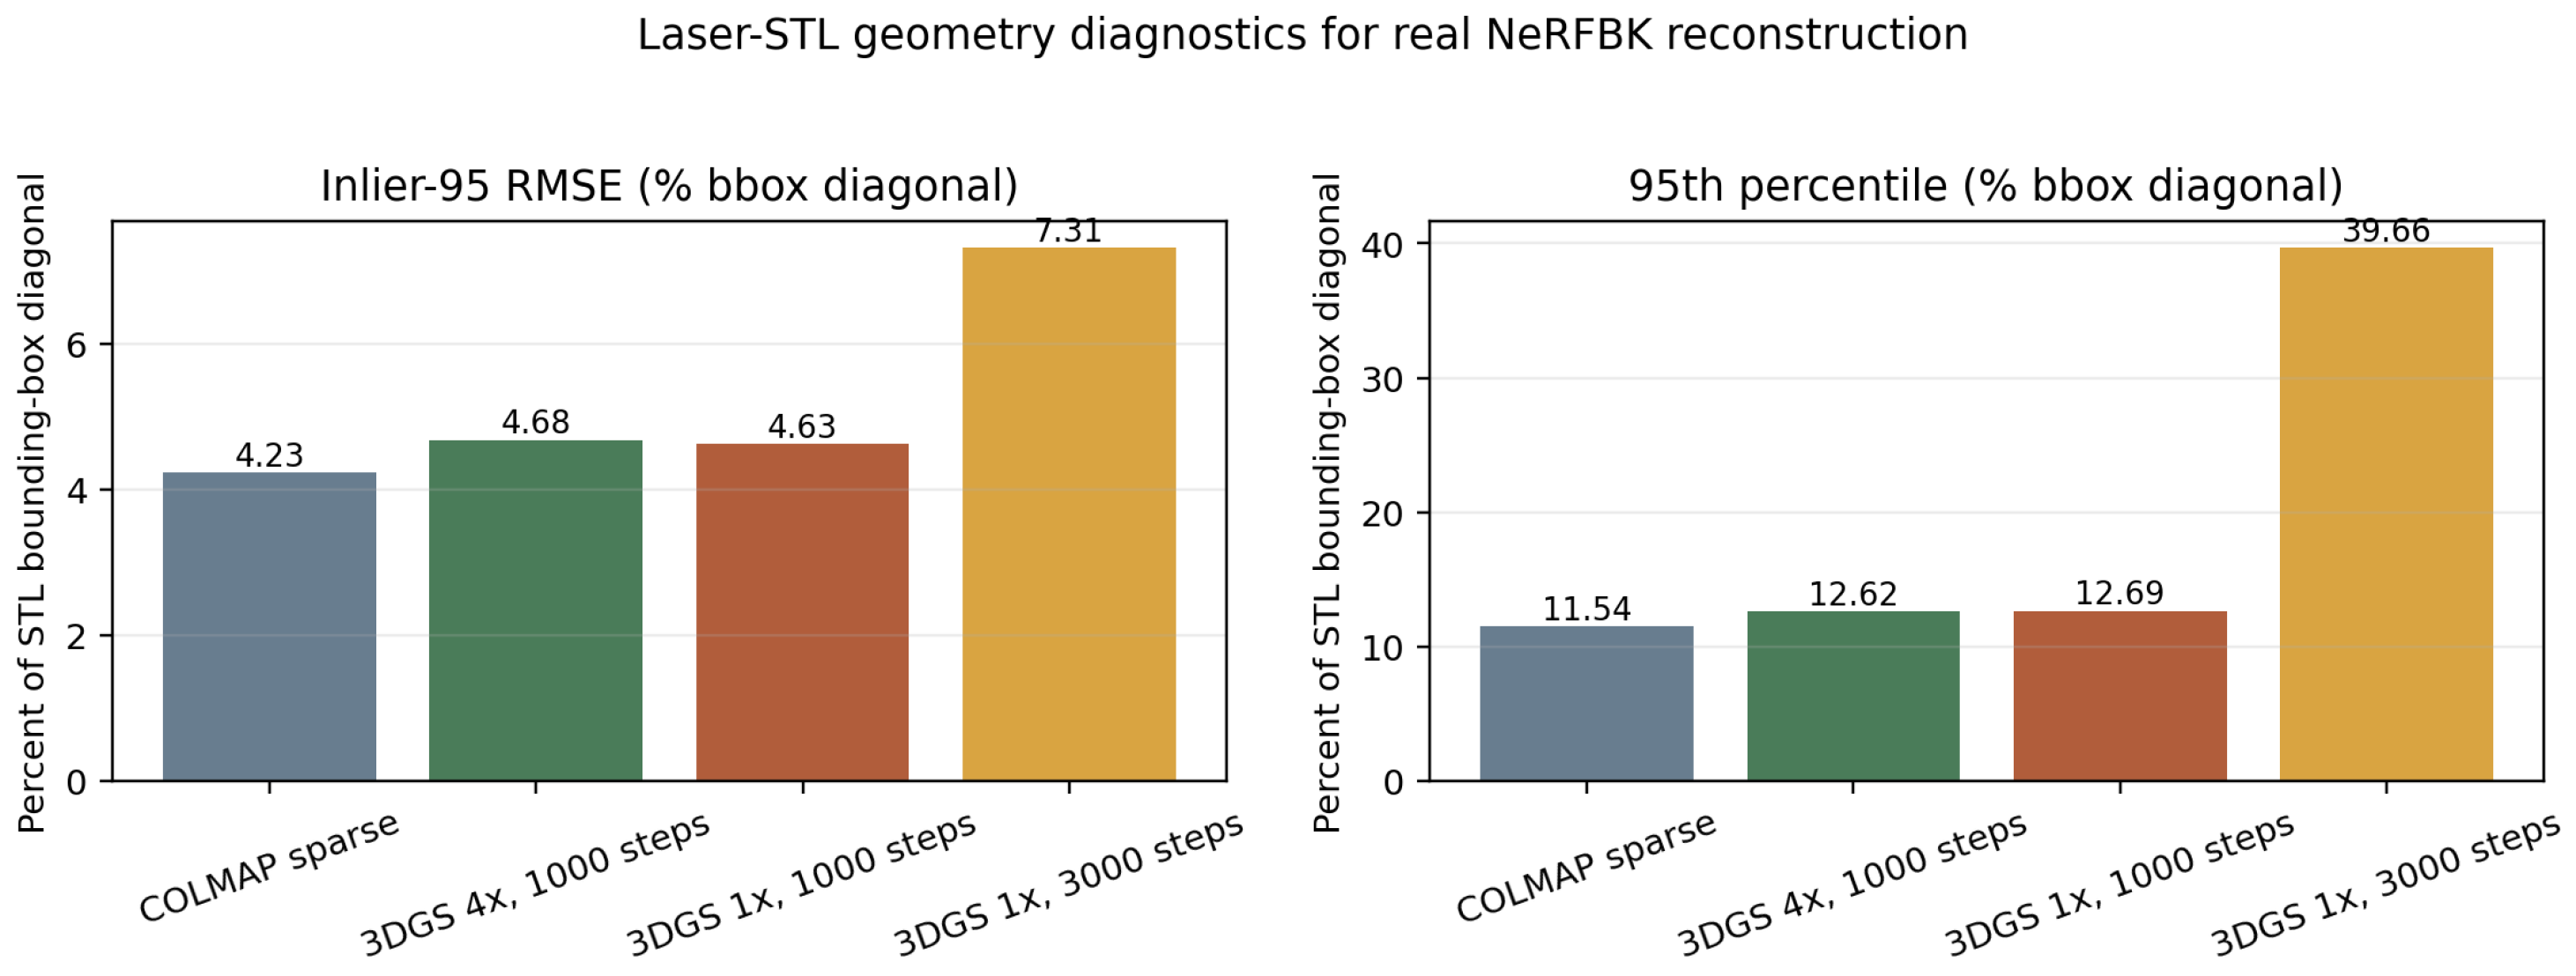
Table 10 and Figure 13 report the source-to-STL distances after similarity alignment, normalized as percentages of the STL bounding-box diagonal. The inlier-95 statistics were calculated after excluding the largest 5% of distances to reduce the influence of outlying sparse points and Gaussian primitives. The COLMAP point cloud represents image regions that could be matched during structure-from-motion reconstruction, whereas the 3DGS Gaussian centers are rendering primitives rather than samples of a complete meshed surface. The 3000-step model improved image-reconstruction quality and reduced the mean distance, median distance, and global RMSE. However, it also produced a heavier outlier tail, resulting in higher P95 and inlier-95 RMSE values. The training pipeline used a pinhole renderer, whereas the COLMAP reconstruction retained an OpenCV camera model with radial and tangential distortion parameters, as indicated by the gsplat parser warning. A more accurate assessment would therefore require either image undistortion before 3DGS training or the use of a distortion-aware renderer. The geometric evaluation confirms that the reconstructed points are spatially anchored to the laser-scanned reference object. However, bidirectional evaluation is required to assess both reconstruction accuracy and surface completeness for metrological interpretation. Therefore, the reported metric should not be interpreted as bidirectional surface accuracy, because unreconstructed regions of the STL model are not penalized.
Table 10.
Unidirectional geometry diagnostics normalized by the NeRFBK Industrial_A STL bounding-box diagonal.
Figure 13.
NeRFBK Industrial_A laser-STL geometry diagnostics. The left panel reports inlier-95 root-mean-square source-to-STL distance after excluding the largest 5% of distances; the right panel reports the 95th percentile distance. Both quantities are normalized by the STL bounding-box diagonal, so the percentages are scale-normalized geometry diagnostics. The large 95th percentile for the 3000-step run indicates a heavier outlier tail even though its image-rendering metrics improved.
3.7. Validation Scope and Relationship 2D-3D Mapping
Table 11 summarizes the validation status of each analysis and the data required for cross-modal integration. The evaluated modules cover leakage-aware RGB and spectral modeling, coated-surface defect localization, public physical-reference summaries, and reflective-scene COLMAP/3DGS reconstruction.
Table 11.
Validation scope across multimodal coating-monitoring analyses.
The coated-wood detector and NEU-DET analysis operate in 2D image space. With calibrated views of the same asset, detections could be projected onto a reconstructed surface and fused across viewpoints. Repeated observations at one 3D location could increase confidence, while disagreement could expose occlusion or view-dependent appearance. The current detection datasets do not contain the required multi-view camera metadata, so they validate visual recognizability and localization independently of 3D fusion or temporal progression.
4. Discussion
4.1. Interpretation of the Leakage-Aware Results
The duplicate-file analysis substantially changes the interpretation of the painted-metal-sheet experiment. The original test partition included 68 images that were also present in the training set. After removing these overlapping files and 18 additional duplicates within the test partition, the evaluation set was reduced from 179 records to 93 unique images. On this revised test set, the best fixed classifier achieved an accuracy of 78.49%, compared with the 87.15% accuracy obtained by the random forest on the original repository split. The result obtained from the non-overlapping test images provides a more reliable estimate of model performance and shows that the original train–test split produced an overly optimistic evaluation. However, file hashing can identify only identical files and cannot detect visually similar images created by cropping, recompression, or repeated acquisition. Therefore, the corrected performance estimate should still be interpreted with caution. Moreover, the experiment involving EfficientNetB0 with resolution shows that neither higher image resolution nor pre-trained features can offset the issues caused by the inadequacies in the design of the dataset. In future coating datasets, it is important to keep the high-resolution images, annotate local defect areas like blistering, pinholes, corrosion, and micro-cracking, and also to split the training and testing samples.
The above-mentioned experiments serve different purposes in validating the models. Coated Wood was used to validate defect localization on a smaller subset of the data, while NEU-DET was used to conduct a controlled comparison of detection architectures over six classes of industrial surface defects. The results obtained for mAP cannot be compared directly since the datasets are different in size, defect types, image features, and validation settings. Also, none of the experiments show the generalization capabilities of the models to unseen data. A total of 112 distinct signatures were found from 148 samples through spectral analysis, and samples with the same spectra were placed in the same group for cross-validation in order to avoid having the exact spectra in both training and validation sets. The random forest classification was found to have an average accuracy of using this grouping method for five folds. But since the names of the vessels and inspection points were not available, it implies that the classes can be well-separated.
4.2. 3DGS Feasibility Versus Coating Metrology
The NeRFBK experiment demonstrates that the documented COLMAP/3DGS workflow can reconstruct and render a real reflective scene. At native resolution and 3000 optimization steps, the model reached 25.018 dB PSNR, 0.8947 SSIM, and 0.1522 LPIPS. The associated geometry errors were normalized by the reference STL bounding-box diagonal because the dataset does not provide a coating-relevant physical unit. The 5.65% mean and 15.59% RMSE, together with a 39.66% 95th percentile, indicate a substantial long error tail. Gaussian centers are rendering primitives rather than a watertight measured surface, so these distances are reconstruction diagnostics rather than coating-thickness or roughness measurements.
One additional implementation limitation is that the supplied COLMAP camera model includes OPENCV distortion parameters, whereas the evaluated Gaussian-splatting configuration used a pinhole projection. This mismatch may affect image-space and geometric error. It prevents the reported novel-view and source-to-STL metrics from being interpreted as distortion-corrected precision estimates. A stronger geometric evaluation requires undistorting the raw images using COLMAP calibration before 3DGS training, or using a 3DGS renderer that explicitly supports the OPENCV distortion model.
The glossmeter, profilometry, and SEM workbooks establish the physical quantities that a future multimodal model could predict, but they were acquired from different specimens than the 3DGS scene. Consequently, this study does not calibrate radiance, opacity, covariance, or any other Gaussian parameter to gloss, roughness, or coating thickness. Such calibration requires measurements and image footprints co-registered on the same surface patches. A synthetic cross-modal control in Blender or a similar physically based renderer could usefully test projection mathematics under known geometry, coating thickness, roughness, and degradation labels before a fully paired real dataset is available. Such a synthetic control would be complementary to, not a substitute for, the real-data leakage audits reported in our work.
Collectively, the above experiments demonstrate a multimodal approach for coating inspection that includes a leakage audit. RGB data serves as a source of condition classification and visible defect location, while Vis/NIR spectral data offers the capability for within-dataset discrimination of the states of coatings. Physical workbooks serve as sources of measured reference quantities, whereas 3DGS offers a candidate spatial representation. Integration of all the modalities into one system demands acquisition of all these modalities on the same coated samples, their alignment with the reconstructed geometry, and, most importantly, sample separation from other objects for testing.
4.3. Limitations
PMS images form a binary class dataset at an image level, which reduces to 93 unique test images after exact duplicate filtering. This filter does not disqualify perceptual duplicates. Although sensitivity analysis for transfer features using 224 × 224 EfficientNetB0 was included, the study still lacks end-to-end fine-tuning on high-resolution defect-coated images. Coated-wood holdout set consists of just 51 images and the NEU-DET dataset has generic steel defects, not coated-specific field observations. The spectral set of data is relatively small and does not have vessel ID, specimen ID, and inspection point ID, so group-based duplication cannot replace vessel-level external validation. Physical and reconstructed measurements are not paired. 3DGS evaluation includes just one scene and one run per condition, with no run-to-run uncertainty, and camera model discrepancy. Its geometry diagnostic is unidirectional and therefore does not quantify surface completeness; future work should use bidirectional Chamfer, coverage, and robust Hausdorff metrics after distortion correction. No experiment evaluates temporal degradation, coating-thickness prediction, cross-site transfer, or co-registered multimodal fusion.
5. Conclusions
The controlled NEU-DET results are consistent with recent studies showing that YOLO-based architectures can provide effective surface-defect localization on industrial steel imagery [25,26,27]. However, direct numerical ranking against these studies would be inappropriate because the reported results are based on different train–test partitions, preprocessing procedures, training budgets, augmentation strategies, and model-selection criteria. Within the common protocol used in the present study, YOLOv8s achieved the highest mAP@0.50, whereas YOLO11n provided the strongest mAP@0.50:0.95, indicating that newer or larger architectures do not necessarily dominate when the image resolution, dataset size, and optimization budget are fixed. The Vis/NIR findings similarly agree with previous coating-inspection studies showing that spectral signatures can discriminate material condition and degradation states [4,5]. Nevertheless, the high duplicate-grouped performance observed here should be interpreted as within-dataset spectral separability rather than evidence of generalization across vessels, coating chemistries, instruments, or acquisition environments.
The reflective-scene reconstruction results also align with prior work showing that view-dependent appearance remains difficult for conventional radiance-field and three-dimensional reconstruction methods. Ref-NeRF explicitly models reflected radiance, NeRO separates geometry and material-related components for reflective objects, and GaussianShader introduces shading-aware representations to improve the reconstruction of specular surfaces [8,9,10]. In contrast, the standard 3DGS pipeline used in this study represents view-dependent appearance through learned spherical-harmonic coefficients without explicitly recovering physical reflectance, surface roughness, or illumination. This distinction helps explain the residual errors around highlights, fine edges, and high-frequency reflective details, despite the improvement in PSNR, SSIM, and LPIPS with a larger training budget. Accordingly, successful novel-view synthesis should not be interpreted as physical coating metrology without distortion-aware reconstruction and spatially co-registered gloss, roughness, and thickness measurements.
This study involved the assessment of various non-destructive coating inspection modules based on image, spectroscopic, and physical measurement, and multi-view reconstruction datasets that were freely available. The findings indicate that performance evaluation is not only dependent on the selection of models but is also contingent on duplication controls and specimen separation, as well as the availability of paired reference data.
The main conclusions of the study are summarized as follows:
- A leakage-audited RGB evaluation changed the interpretation of the painted-metal-sheet dataset: after exact train-to-test overlap removal and within-test deduplication, the strongest fixed 48 × 48 classifier achieved 78.49% accuracy on 93 unique test images, while a 224 × 224 EfficientNetB0 transfer-feature sensitivity analysis achieved 66.67% accuracy.
- Coated-surface defect localization was feasible but class-dependent. The coated-wood detector reached 0.667 mAP@0.50, with scratches detected most reliably and cracks remaining the most difficult class.
- The controlled NEU-DET comparison showed that model selection depends on the metric used: YOLOv8s achieved the strongest mAP@0.50, whereas YOLO11n achieved the strongest mAP@0.50:0.95 under the common training protocol.
- Duplicate-grouped Vis/NIR validation supported strong within-dataset coating-condition separability, with random-forest accuracy of , but the absence of vessel or inspection-point identifiers limits claims about external generalization.
- Public gloss, roughness, and SEM workbooks provide useful physical reference distributions, including heterogeneous SEM thickness values, but they are not spatially paired with the 3DGS scene and therefore cannot calibrate 3DGS parameters to coating thickness or roughness.
- The reflective-scene 3DGS experiment reached 25.018 dB PSNR, 0.8947 SSIM, and 0.1522 LPIPS after native-resolution training; however, normalized geometry errors, unidirectional geometry scoring, and the OPENCV-to-pinhole camera-model mismatch show that rendering quality alone is insufficient for coating metrology.
- Future physically calibrated coating-monitoring systems require specimen-level paired data in which multi-view images, spectra, instrument measurements, annotations, and reconstructed surface regions refer to the same coated specimens and are split by specimen or site.
Future research should therefore prioritize a single paired coating dataset acquired with calibrated cameras, documented illumination, repeated degradation states, physical gloss/roughness/thickness measurements on the same surface patches, and bidirectional geometry metrics after lens-distortion correction.
Author Contributions
Conceptualization, B.A.; methodology, B.A. and K.A.; software, B.A.; validation, B.A.; formal analysis, B.A. and K.A.; data curation, B.A.; writing—original draft preparation, B.A. and K.A.; writing—review and editing, B.A. and K.A.; visualization, B.A.; supervision, K.A.; project administration, B.A. All authors have read and agreed to the published version of the manuscript.
Funding
The article processing charge (APC) was supported by Istanbul Topkapi University.
Institutional Review Board Statement
Not applicable.
Informed Consent Statement
Not applicable.
Data Availability Statement
The painted-metal-sheet image dataset is available from Mendeley Data at https://doi.org/10.17632/446vz2thw3.1. The water-based coated-wood dataset is available from Zenodo at https://doi.org/10.5281/zenodo.15679291. NEU-DET is described by the Northeastern University surface-defect database at http://faculty.neu.edu.cn/songkechen/zh_CN/zdylm/263270/list/index.htm (accessed on 7 July 2026). The ship-coating reflectance dataset is available from Mendeley Data at https://doi.org/10.17632/pvg4x2p624.2. The physical coating-characterization workbooks are available from https://github.com/piuLAB-official/Dataset_A.Romani_2022_Materials (accessed on 7 July 2026). The NeRFBK dataset is available through https://github.com/3DOM-FBK/NeRFBK (accessed on 7 July 2026).
Acknowledgments
During the preparation of this manuscript, the authors used Gemini 3.1 Pro solely for English language editing and proofreading to improve the writing style and readability of the text. The authors reviewed and edited all outputs and take full responsibility for the content of this publication.
Conflicts of Interest
The authors declare no conflicts of interest.
Abbreviations
The following abbreviations are used in this manuscript:
| 3DGS | 3D Gaussian Splatting |
| AFM | Atomic Force Microscopy |
| AP | Average Precision |
| AS7265X | Portable 18-channel visible/near-infrared spectral sensor |
| COCO | Common Objects in Context |
| COLMAP | Structure-from-motion and multi-view stereo reconstruction software |
| CUDA | Compute Unified Device Architecture |
| GPU | Graphics Processing Unit |
| GFRP | Glass-fiber-reinforced polymer |
| GU | Gloss Unit |
| ICP | Iterative Closest Point |
| IoU | Intersection over Union |
| LPIPS | Learned Perceptual Image Patch Similarity |
| mAP | Mean Average Precision |
| MD5 | Message-Digest Algorithm 5 |
| NIR | Near-infrared |
| OPENCV | Open Source Computer Vision camera model |
| PCA | Principal Component Analysis |
| PP/CP | Parallel-polarized/cross-polarized |
| PVD | Physical Vapor Deposition |
| P95 | 95th percentile |
| PSNR | Peak Signal-to-Noise Ratio |
| Roughness average |
| RBF | Radial Basis Function |
| RF | Random Forest |
| RGB | Red–green–blue |
| RMSE | Root-mean-square error |
| Root-mean-square roughness | |
| SEM | Scanning Electron Microscopy |
| SGD | Stochastic gradient descent |
| SHA-256 | Secure Hash Algorithm 256-bit |
| SfM | Structure from motion |
| SSIM | Structural Similarity Index Measure |
| STL | Stereolithography mesh format |
| SVM | Support Vector Machine |
| UV | Ultraviolet |
| Vis/NIR | Visible/Near-Infrared |
| VOC | Visual Object Classes annotation format |
| YOLO | You Only Look Once object-detection format |
References
- Molina, M.T.; Cano, E.; Ramírez-Barat, B. Protective Coatings for Metallic Heritage Conservation: A Review. J. Cult. Herit. 2023, 62, 99–113. [Google Scholar] [CrossRef] [Scilit]
- Silva, N.C.; Castro, D.; Neto, C.; Madureira, A.R.; Pintado, M.; Moreira, P.R. Antimicrobial Chitosan/TPP-Based Coatings for the Prevention of Biodeterioration of Outdoor Stone Sculptures. Prog. Org. Coat. 2024, 189, 108246. [Google Scholar] [CrossRef] [Scilit]
- Hein, K.S.; Wang, Y.-Q.; Li, Y.; Liu, Q.-F.; Chen, K.-Y.; Chen, Y.; Chen, J.-J.; Jin, W.-L.; Wu, R.-J.; Xia, J. A Holistic Approach to Evaluating Techniques for Monitoring Coated Steel Degradation: Integrating Techniques and Applications. Prog. Org. Coat. 2025, 200, 109067. [Google Scholar] [CrossRef] [Scilit]
- Chen, M.; Lu, G.; Wang, G. Discrimination of Steel Coatings with Different Degradation Levels by Near-Infrared (NIR) Spectroscopy and Deep Learning. Coatings 2022, 12, 1721. [Google Scholar] [CrossRef] [Scilit]
- Al-Sakkaf, M.; Mustapha, S.; Zaraket, H.; Dawy, Z. Thickness Evaluation and Degradation Assessment of Paint Coating Using Remote Short-Wave Infrared Hyperspectral Imaging. Measurement 2026, 276, 121256. [Google Scholar] [CrossRef] [Scilit]
- Kerbl, B.; Kopanas, G.; Leimkühler, T.; Drettakis, G. 3D Gaussian Splatting for Real-Time Radiance Field Rendering. ACM Trans. Graph. 2023, 42, 1–14. [Google Scholar] [CrossRef] [Scilit]
- Mildenhall, B.; Srinivasan, P.P.; Tancik, M.; Barron, J.T.; Ramamoorthi, R.; Ng, R. NeRF: Representing Scenes as Neural Radiance Fields for View Synthesis. In Proceedings of the 16th European Conference on Computer Vision, Glasgow, UK, 23–28 August 2020; Springer: Cham, Switzerland, 2020; pp. 405–421. [Google Scholar] [CrossRef] [Scilit]
- Verbin, D.; Hedman, P.; Mildenhall, B.; Zickler, T.; Barron, J.T.; Srinivasan, P.P. Ref-NeRF: Structured View-Dependent Appearance for Neural Radiance Fields. In Proceedings of the IEEE/CVF Conference on Computer Vision and Pattern Recognition, New Orleans, LA, USA, 18–24 June 2022; pp. 5481–5490. [Google Scholar] [CrossRef] [Scilit]
- Liu, Y.; Wang, P.; Lin, C.; Long, X.; Wang, J.; Liu, L.; Komura, T.; Wang, W. NeRO: Neural Geometry and BRDF Reconstruction of Reflective Objects from Multiview Images. ACM Trans. Graph. 2023, 42, 1–22. [Google Scholar] [CrossRef] [Scilit]
- Jiang, Y.; Tu, J.; Liu, Y.; Gao, X.; Long, X.; Wang, W.; Ma, Y. GaussianShader: 3D Gaussian Splatting with Shading Functions for Reflective Surfaces. In Proceedings of the IEEE/CVF Conference on Computer Vision and Pattern Recognition, Seattle, WA, USA, 16–22 June 2024; pp. 5322–5332. [Google Scholar] [CrossRef] [Scilit]
- Hendrio, J. Chapas Metalicas—Defeitos na Pintura; Mendeley Data, V1, 2025. Available online: https://data.mendeley.com/datasets/446vz2thw3/1 (accessed on 7 July 2026).
- Jia, N.; Chen, K.; Liu, C.; Wang, N.C. A Public Image Dataset for Surface Defect Detection of Water-Based Coated Wood Products; Zenodo: Geneva, Switzerland, 2025. [Google Scholar] [CrossRef]
- Song, K.; Yan, Y. NEU Surface Defect Database; Northeastern University: Shenyang, China, 2013; Available online: http://faculty.neu.edu.cn/songkechen/zh_CN/zdylm/263270/list/index.htm (accessed on 7 July 2026).
- Khumaidi, A.; Raafi’udin, R. Reflectance Spectral Dataset for Ship Coating Condition Classification Using Portable Vis/NIR Spectroscopy; Mendeley Data, V2, 2026. Available online: https://data.mendeley.com/datasets/pvg4x2p624/2 (accessed on 7 July 2026).
- Romani, A.; Tralli, P.; Levi, M.; Turri, S.; Suriano, R. Metallization of Recycled Glass Fiber-Reinforced Polymers Processed by UV-Assisted 3D Printing. Materials 2022, 15, 6242. [Google Scholar] [CrossRef] [Scilit] [PubMed]
- Romani, A.; Suriano, R.; Tralli, P.; Levi, M.; Turri, S. Dataset_A.Romani_2022_Materials; GitHub Repository. 2022. Available online: https://github.com/piuLAB-official/Dataset_A.Romani_2022_Materials (accessed on 7 July 2026).
- Yan, Z.; Mazzacca, G.; Rigon, S.; Farella, E.M.; Trybala, P.; Remondino, F. NeRFBK: A Holistic Dataset for Benchmarking NeRF-Based 3D Reconstruction. Int. Arch. Photogramm. Remote Sens. Spat. Inf. Sci. 2023, XLVIII-1/W3-2023, 219–226. [Google Scholar] [CrossRef] [Scilit]
- Pedregosa, F.; Varoquaux, G.; Gramfort, A.; Michel, V.; Thirion, B.; Grisel, O.; Blondel, M.; Prettenhofer, P.; Weiss, R.; Dubourg, V.; et al. Scikit-learn: Machine Learning in Python. J. Mach. Learn. Res. 2011, 12, 2825–2830. [Google Scholar]
- Cortes, C.; Vapnik, V. Support-Vector Networks. Mach. Learn. 1995, 20, 273–297. [Google Scholar] [CrossRef] [Scilit]
- Breiman, L. Random Forests. Mach. Learn. 2001, 45, 5–32. [Google Scholar] [CrossRef] [Scilit]
- Tan, M.; Le, Q. EfficientNet: Rethinking Model Scaling for Convolutional Neural Networks. In Proceedings of the 36th International Conference on Machine Learning, Long Beach, CA, USA, 9–15 June 2019; PMLR. Volume 97, pp. 6105–6114. [Google Scholar]
- Ren, S.; He, K.; Girshick, R.; Sun, J. Faster R-CNN: Towards Real-Time Object Detection with Region Proposal Networks. IEEE Trans. Pattern Anal. Mach. Intell. 2017, 39, 1137–1149. [Google Scholar] [CrossRef] [Scilit] [PubMed]
- Lin, T.-Y.; Maire, M.; Belongie, S.; Hays, J.; Perona, P.; Ramanan, D.; Dollár, P.; Zitnick, C.L. Microsoft COCO: Common Objects in Context. In Proceedings of the 13th European Conference on Computer Vision, Zurich, Switzerland, 6–12 September 2014; Springer: Cham, Switzerland, 2014; pp. 740–755. [Google Scholar] [CrossRef] [Scilit]
- Jocher, G.; Qiu, J.; Chaurasia, A. Ultralytics YOLO, version 8.4.60; Zenodo: Geneva, Switzerland, 2026. [CrossRef]
- Wang, C.-Y.; Bochkovskiy, A.; Liao, H.-Y.M. YOLOv7: Trainable Bag-of-Freebies Sets New State-of-the-Art for Real-Time Object Detectors. In Proceedings of the IEEE/CVF Conference on Computer Vision and Pattern Recognition, Vancouver, BC, Canada, 17–24 June 2023; pp. 7464–7475. [Google Scholar] [CrossRef] [Scilit]
- Tian, Y.; Ye, Q.; Doermann, D. YOLOv12: Attention-Centric Real-Time Object Detectors. arXiv 2025, arXiv:2502.12524. [Google Scholar] [CrossRef] [Scilit]
- Lu, M.; Sheng, W.; Zou, Y.; Chen, Y.; Chen, Z. WSS-YOLO: An Improved Industrial Defect Detection Network for Steel Surface Defects. Measurement 2024, 236, 115060. [Google Scholar] [CrossRef] [Scilit]
- Schönberger, J.L.; Frahm, J.-M. Structure-from-Motion Revisited. In Proceedings of the IEEE Conference on Computer Vision and Pattern Recognition, Las Vegas, NV, USA, 27–30 June 2016; pp. 4104–4113. [Google Scholar] [CrossRef] [Scilit]
- Wang, Z.; Bovik, A.C.; Sheikh, H.R.; Simoncelli, E.P. Image Quality Assessment: From Error Visibility to Structural Similarity. IEEE Trans. Image Process. 2004, 13, 600–612. [Google Scholar] [CrossRef] [Scilit] [PubMed]
- Zhang, R.; Isola, P.; Efros, A.A.; Shechtman, E.; Wang, O. The Unreasonable Effectiveness of Deep Features as a Perceptual Metric. In Proceedings of the IEEE Conference on Computer Vision and Pattern Recognition, Salt Lake City, UT, USA, 18–23 June 2018; pp. 586–595. [Google Scholar] [CrossRef] [Scilit]
- Guo, H.; Ren, J.; Wang, F.; Ren, M.; Shi, B.; Matsushita, Y. DiLiGenRT: A Photometric Stereo Dataset with Quantified Roughness and Translucency. In Proceedings of the IEEE/CVF Conference on Computer Vision and Pattern Recognition, Seattle, WA, USA, 16–22 June 2024; pp. 11810–11820. [Google Scholar] [CrossRef] [Scilit]
- Li, M.; Zhou, Z.; Wu, Z.; Shi, B.; Diao, C.; Tan, P. Multi-View Photometric Stereo: A Robust Solution and Benchmark Dataset for Spatially Varying Isotropic Materials. IEEE Trans. Image Process. 2020, 29, 4159–4173. [Google Scholar] [CrossRef] [Scilit] [PubMed]
- Yamashita, K.; Enyo, Y.; Nobuhara, S.; Nishino, K. nLMVS-Net: Deep Non-Lambertian Multi-View Stereo. In Proceedings of the IEEE/CVF Winter Conference on Applications of Computer Vision, Waikoloa, HI, USA, 2–7 January 2023; pp. 3036–3045. [Google Scholar] [CrossRef] [Scilit]
- Ma, X.; Xu, X.; Zhang, L.; Zhou, K.; Wu, H. OpenSVBRDF: A Database of Measured Spatially-Varying Reflectance. ACM Trans. Graph. 2023, 42, 1–14. [Google Scholar] [CrossRef] [Scilit]
- Voynov, O.; Bobrovskikh, G.; Karpyshev, P.; Galochkin, S.; Ardelean, A.T.; Bozhenko, A.; Karmanova, E.; Kopanev, P.; Labutin-Rymsho, Y.; Rakhimov, R.; et al. Multi-Sensor Large-Scale Dataset for Multi-View 3D Reconstruction. In Proceedings of the IEEE/CVF Conference on Computer Vision and Pattern Recognition, Vancouver, BC, Canada, 17–24 June 2023; pp. 21392–21403. [Google Scholar] [CrossRef] [Scilit]

Disclaimer/Publisher’s Note: The statements, opinions and data contained in all publications are solely those of the individual author(s) and contributor(s) and not of MDPI and/or the editor(s). MDPI and/or the editor(s) disclaim responsibility for any injury to people or property resulting from any ideas, methods, instructions or products referred to in the content. |
© 2026 by the authors. Licensee MDPI, Basel, Switzerland. This article is an open access article distributed under the terms and conditions of the Creative Commons Attribution (CC BY) license.