


Highlights
- •
- Interface damage modes dominate failure evolution under lateral impact.
- •
- Graded-aperture honeycomb sandwich structures exhibit enhanced crashworthiness performance.
- •
- Topology-dependent deformation significantly influences energy absorption efficiency.
- •
- Triangular graded honeycombs achieve superior SEA under axial and lateral loading.
- •
- Aperture gradient G2 improves load transfer and impact resistance.
Abstract
Structural failure of the lead-carbon battery casing under external loads poses a serious threat to the safety of its energy storage function. To overcome the limitations of traditional protective casings regarding specific energy absorption (SEA) and crush force efficiency (CFE), this study proposes a novel thin-walled protective structure utilizing graded aperture honeycomb sandwich panels fabricated via additive manufacturing (AM). Finite element (FE) models were established using HyperMesh and validated against experimental data. Subsequently, the impact resistance and energy absorption characteristics of four distinct cellular topologies were systematically investigated under varying pore-size gradients, impact directions, and velocities. Experimental and numerical simulation results indicate that, among the investigated configurations, the triangular honeycomb structure exhibits superior impact resistance and energy absorption capability under both axial and lateral loading conditions. Furthermore, the synergistic enhancement mechanism based on topological configuration and gradient design effectively optimizes the progressive crushing mode, thereby reducing the initial peak crushing force transmitted to the battery and resulting in a pronounced advantage in impact performance. This research provides a novel design approach for optimizing next-generation high-performance, lightweight protection systems for energy storage devices.
1. Introduction
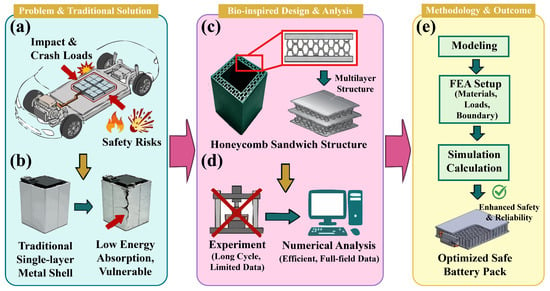
Driven by the global transition toward sustainable energy and the rigorous pursuit of “Carbon Peaking and Carbon Neutrality” strategic objectives, high-performance electrochemical energy storage systems have emerged as a cornerstone for the development of electric vehicles, renewable energy storage, and the aerospace industry. Lead-carbon batteries (LCBs), characterized by their exceptional cycle life and high-power density, have seen increasingly widespread implementation across the energy storage landscape [1,2,3]. However, as illustrated in Figure 1a,b, the diversification of application scenarios exposes LCBs to heightened mechanical safety risks. Specifically, impact threats arising from collisions, crushing, or accidental drops can lead to structural compromise, triggering electrolyte leakage that results in chemical contamination or, more critically, catastrophic electrical failure [4,5,6]. Traditional battery protection architectures, which predominantly utilize homogeneous metallic materials or single-phase composites, often exhibit a performance bottleneck in the collaborative optimization of specific energy absorption (SEA) and crush force efficiency (CFE). This limitation makes it exceedingly difficult to strike an optimal balance between structural lightweighting and high-level safety requirements [7,8,9].
Figure 1.
Safety protection design and analysis process for battery honeycomb sandwich thin-walled structures: (a) challenges faced by batteries under complex impact loading threats such as collision and dropping; (b) traditional battery protective casing structure and external loading conditions; (c) design application of the honeycomb sandwich thin-walled structure within the battery pack casing; (d) comparison between traditional experimental and numerical analysis methods; (e) numerical analysis process workflow.
To circumvent these limitations, recent research has gravitated toward honeycomb sandwich structures, as depicted in Figure 1c. Renowned for their superior impact resistance, cushioning capabilities, and significant design flexibility, these structures have become a focal point in the field of structural protection [10,11,12]. Nevertheless, conventional single-layer honeycombs with uniform pore sizes often suffer from inherent drawbacks under impact loading, such as an excessive initial peak crushing force (PCF) and pronounced stress fluctuations within the plateau region. Such phenomena may induce internal short circuits or electrical failure in LCBs even before the protective structure itself reaches total collapse [13,14,15]. A study by Jefferson et al. [16] indicated that the application of gradation parameters in honeycomb cell designs significantly improves the energy absorption and impact resistance of the structures. Concurrently, in a study focused on the impact protection of battery packs, Al Ali et al. [17] emphasized that increasing the core and shell numbers through the panel thickness, combined with the multi-layer coupling of high-strength metallic face-sheets and honeycomb buffer cores, significantly improves both SEA and impact resistance.
The rapid advancement of additive manufacturing (AM) technologies has recently provided the technical impetus for investigating honeycombs with complex topologies and graded pore characteristics [18,19,20]. In contrast to traditional subtractive manufacturing, 3D printing enables the high-precision control of cell wall thickness and pore-size gradients [21,22,23]. For instance, Liu et al. [24] demonstrated through experimentation that AM honeycombs with specific designs possess the ability to recover their shape following compressive loading, indicating excellent prospects for cyclic energy absorption. Notwithstanding these advantages, Tarfaoui et al. [25] pointed out that the mechanical performance of honeycomb structures remains highly sensitive to AM process parameters and the synergistic matching between topological configurations and intrinsic material properties. Furthermore, Liu et al. [26] proposed that functionally graded hierarchical honeycombs, which harness both the stability of conventional lattices and the enhancement effects of multi-scale deformation, represent a pivotal direction for the future of lightweight protective design. Building on this, Abd El-baky et al. [27] demonstrated that incorporating optimized filler structures into thin-walled designs creates a synergistic enhancement effect, significantly improving crashworthiness under complex loading conditions. Similarly, Albak et al. [28] investigated biomimetic-filled configurations mimicking natural hierarchical systems to enhance structural performance in terms of impact resistance and energy absorption characteristics.
In summary, while significant strides have been made in the design and characterization of graded structures, research gaps persist regarding the optimal synergy between pore-size gradients and topological configurations, particularly for the specific protection of LCBs under multi-directional impacts and variable-rate loading [29,30,31,32]. To address this void, the present study proposes a synergistic design framework that integrates multiple topological configurations including hexagonal, quadrilateral, triangular, and re-entrant auxetic structures with the G2 radial aperture gradient design, specifically tailored for the protection requirements of LCBs. Unlike conventional uniform or axially graded honeycombs, the specific novelty of this work lies in the utilization of the G2 radial gradient to achieve a controlled deformation sequence, enabling the structure to conform to the envelope dimensions of LCBs. By balancing the trade-off between mitigating transmitted peak forces and achieving high SEA, this approach advances beyond the existing literature to minimize impact-induced damage to LCBs. As illustrated in Figure 1d,e, by integrating finite element analysis (FEA) with experimental validation, this work systematically explores the influence of aperture gradients and topology on the protective efficacy for LCBs. Particular focus is placed on the potential advantages of the Tri-G2 structure in reducing the initial PCF while enhancing the SEA, with the ultimate goal of providing a theoretical framework and empirical data for the next generation of high-performance, lightweight energy storage protection systems.
2. Experimental Test
To systematically investigate the mechanical response of various topological configurations and establish a reliable accuracy for validating subsequent finite element (FE) models, experimental characterization was performed on single-layer honeycomb sandwich structures. Carbon fiber reinforced polyethylene terephthalate glycol (PETG-CF) was selected as the constituent material, owing to its pronounced mechanical anisotropy and superior impact resistance, with specimens fabricated using AM technology. To mitigate the adverse effects of moisture on material integrity, the filaments underwent a pre-conditioning dehydration process in a blast drying oven at 60 °C for 8 h. The printing system was equipped with a 0.4 mm diameter hardened steel nozzle to ensure consistency in the aperture size and precision during the fabrication of complex honeycomb architectures. Thermal management was achieved by setting the nozzle temperature to 250 °C and maintaining the heat bed at 80 °C, a configuration intended to suppress the accumulation of residual thermal stresses; concurrently, the printing speed was constrained below 200 mm/s to facilitate optimal interlaminar fusion [33,34].
Standardized specimens with an inner side length of 23 mm, an outer side length of 35 mm, and a height of 45 mm were fabricated using the fused deposition modeling (FDM) process. To ensure superior structural integrity and mechanical consistency, the specimens were printed with a layer height of 0.2 mm, a ±45° raster angle, and a 100% infill density. The print orientation was aligned with the honeycomb’s axial direction (Z-axis) to optimize vertical load-bearing capacity [35]. While inherent manufacturing variabilities in the FDM process, including localized thermal gradients and micro-voids, could potentially introduce stochastic deviations in the mechanical response, strict process control was implemented to mitigate these effects. Given the high manufacturing precision of the industrial-grade printer utilized, a representative specimen for each topology was tested to serve as the benchmark for numerical calibration. This approach focuses on validating the fidelity of the finite element models through experimental analysis, thereby ensuring the reliability of the derived design laws. These specimens were subjected to quasi-static axial and lateral impact loading tests on a UTM4304SLXY electronic universal testing machine, where the loading rate was set to 20 mm/min to eliminate inertial effects during the validation phase. To validate the fidelity of the FE models, representative specimens were fabricated and tested for each of the four archetypal configurations: hexagonal (Hex), quadrilateral (Qua), triangular (Tri), and re-entrant auxetic (Ren). Owing to the high manufacturing precision and geometric consistency characteristic of the AM process, these experimental tests served as the primary benchmark for calibrating the numerical parameters. Consequently, the experimental force–displacement curves were utilized to verify the numerical predictions, establishing a reliable foundation for the subsequent parametric study based on the validated FE models.
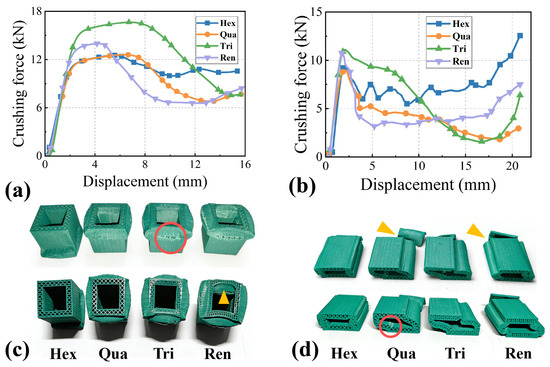
Under axial crushing conditions, as shown in Figure 2a, the crushing force–displacement curves of the four honeycomb structures exhibit a characteristic three-stage response consisting of a rapid linear increase, a yielding plateau, and a gradual decay. In the initial displacement stage, ranging from 0 to 3 mm, the structures display high initial stiffness, with the load capacity increasing linearly with displacement. The initial PCF of the Tri and Ren configurations exceeds 12,000 N, significantly higher than that of the Hex and Qua structures, whose initial PCFs are relatively lower and closely clustered. The Hex curve demonstrates less fluctuation, and its mean crushing load is higher than the other structures during the plateau stage. As shown in Figure 2b, the lateral crushing curves exhibit distinct differences, where the initial peak forces of the Tri and Ren configurations are higher, closely matching the PCFs of the Hex and Qua structures. In contrast, the load capacity shown by the Hex curve fluctuates more frequently and severely with displacement, indicating that the mechanical response during structural collapse under lateral loading is highly unstable. The lateral bending stiffness and load capacity are markedly weaker than under axial conditions.
Figure 2.
Illustration of the experimental validation results: (a) crushing force–displacement curves from axial crushing; (b) crushing force–displacement curves from lateral crushing; (c) structural failure modes after axial crushing; (d) structural failure modes after lateral crushing.
Following axial crushing, all configurations exhibited a plastic folding collapse mode: The top edges of the structures underwent regular inward or outward folding along the loading direction. Red circles indicate fractures to watch out for, and yellow triangles indicate folds. The crushing zone was concentrated in the upper part of the structure, as labeled in Figure 2c, demonstrating a high degree of collapse consistency and predictability. Although the Tri and Ren structures also collapsed via folding, their folding directions were more dispersed, resulting in irregular local deformation and a consequently scattered energy dissipation pattern. After lateral crushing, all structures transitioned to a plastic bending collapse mode: the structural sides exhibited pronounced plastic bending and twisting, with the crushing zone dispersedly distributed along the lateral direction. While the Hex and Qua structures showed relatively minor bending deformation, localized interface fractures were still observed, as indicated in Figure 2d. Specifically, the inner wall interface of the Qua structure fractured. The structural integrity degradation was more severe for the Qua and Ren configurations, evidenced by significant interface detachment deformation in the bottom connection region.
The experimental results indicate that the internal topological configuration directly governs the crushing mechanical performance and failure mode. The Hex and Qua structures dissipate energy through orderly folding collapse, exhibiting superior mean crushing load stability. Although the Tri and Ren configurations possess a higher initial load capacity, their dispersed deformation modes lead to significant fluctuations during the plateau stage. Concurrently, the lateral performance of all structures is markedly inferior to the axial performance, which is directly linked to insufficient lateral bending stiffness. Therefore, the Tri and Ren structures are advantageous in applications where maximizing the PCF is required; however, the Hex structure is more suitable for stable energy absorption scenarios predominantly involving axial pressure due to its high crushing stability and superior consistency in mean crushing load. For lateral loading scenarios, targeted optimization of the structural configuration is essential.
3. FE Model Setup and Numerical Methodology
3.1. Crashworthiness Evaluation Metrics
This study evaluates the crashworthiness of the honeycomb sandwich thin-walled structures by numerical simulation. The research aims to optimize the internal topological configuration of the sandwich panels to minimize damage induced by external impact loads, thereby providing effective protection for the internal battery. SEA serves as the core metric for quantifying the structure’s energy absorption capability. SEA is defined as the ratio of the total energy absorbed during structural deformation under external impact to the total mass of the structure [36,37]. The SEA is calculated using the following formula:
where M denotes the total mass of the colliding structure, and EA represents the total energy absorbed by the structure during deformation under impact loading. EA is a dynamic variable, typically determined through the integral expression of the crushing force–displacement curve [38]. EA is outlined by the following equation:
Within this integration interval, the displacement x of the rigid impact wall varies from 0 to the maximum compression distance d, a parameter that delineates the effective crushing stroke of the structure under impact loading. Here, F(x) represents the instantaneous crushing force experienced by the structure at any given displacement x. As a critical metric for evaluating the uniformity of impact resistance, the CFE is derived from the synergistic relationship between the PCF, which is identified as the initial prominent peak on the crushing force–displacement curve, and the mean crushing force (MCF), the latter of which quantifies the average load-bearing capacity throughout the entire deformation stroke [39,40]. By synthesizing these variables, as defined in the formulas below, a more nuanced understanding of the energy absorption patterns inherent in the actual crushing behavior can be achieved.
3.2. Geometric Model Construction and Parameter Definition
Numerical analysis of the crashworthiness of battery honeycomb sandwich thin-walled structures is a critical step for thoroughly understanding the structural mechanical response. The FEA is a widely used numerical analysis technique that discretizes continuous structures into FEs. By analyzing the mechanical properties of each element, the dynamic response of the entire structure under impact loading is subsequently determined. The numerical analysis approach enables efficient and accurate prediction of the structural response in a computational environment, providing crucial references for optimal structural design.
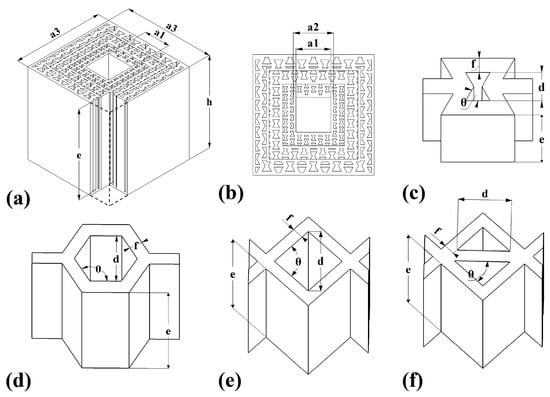
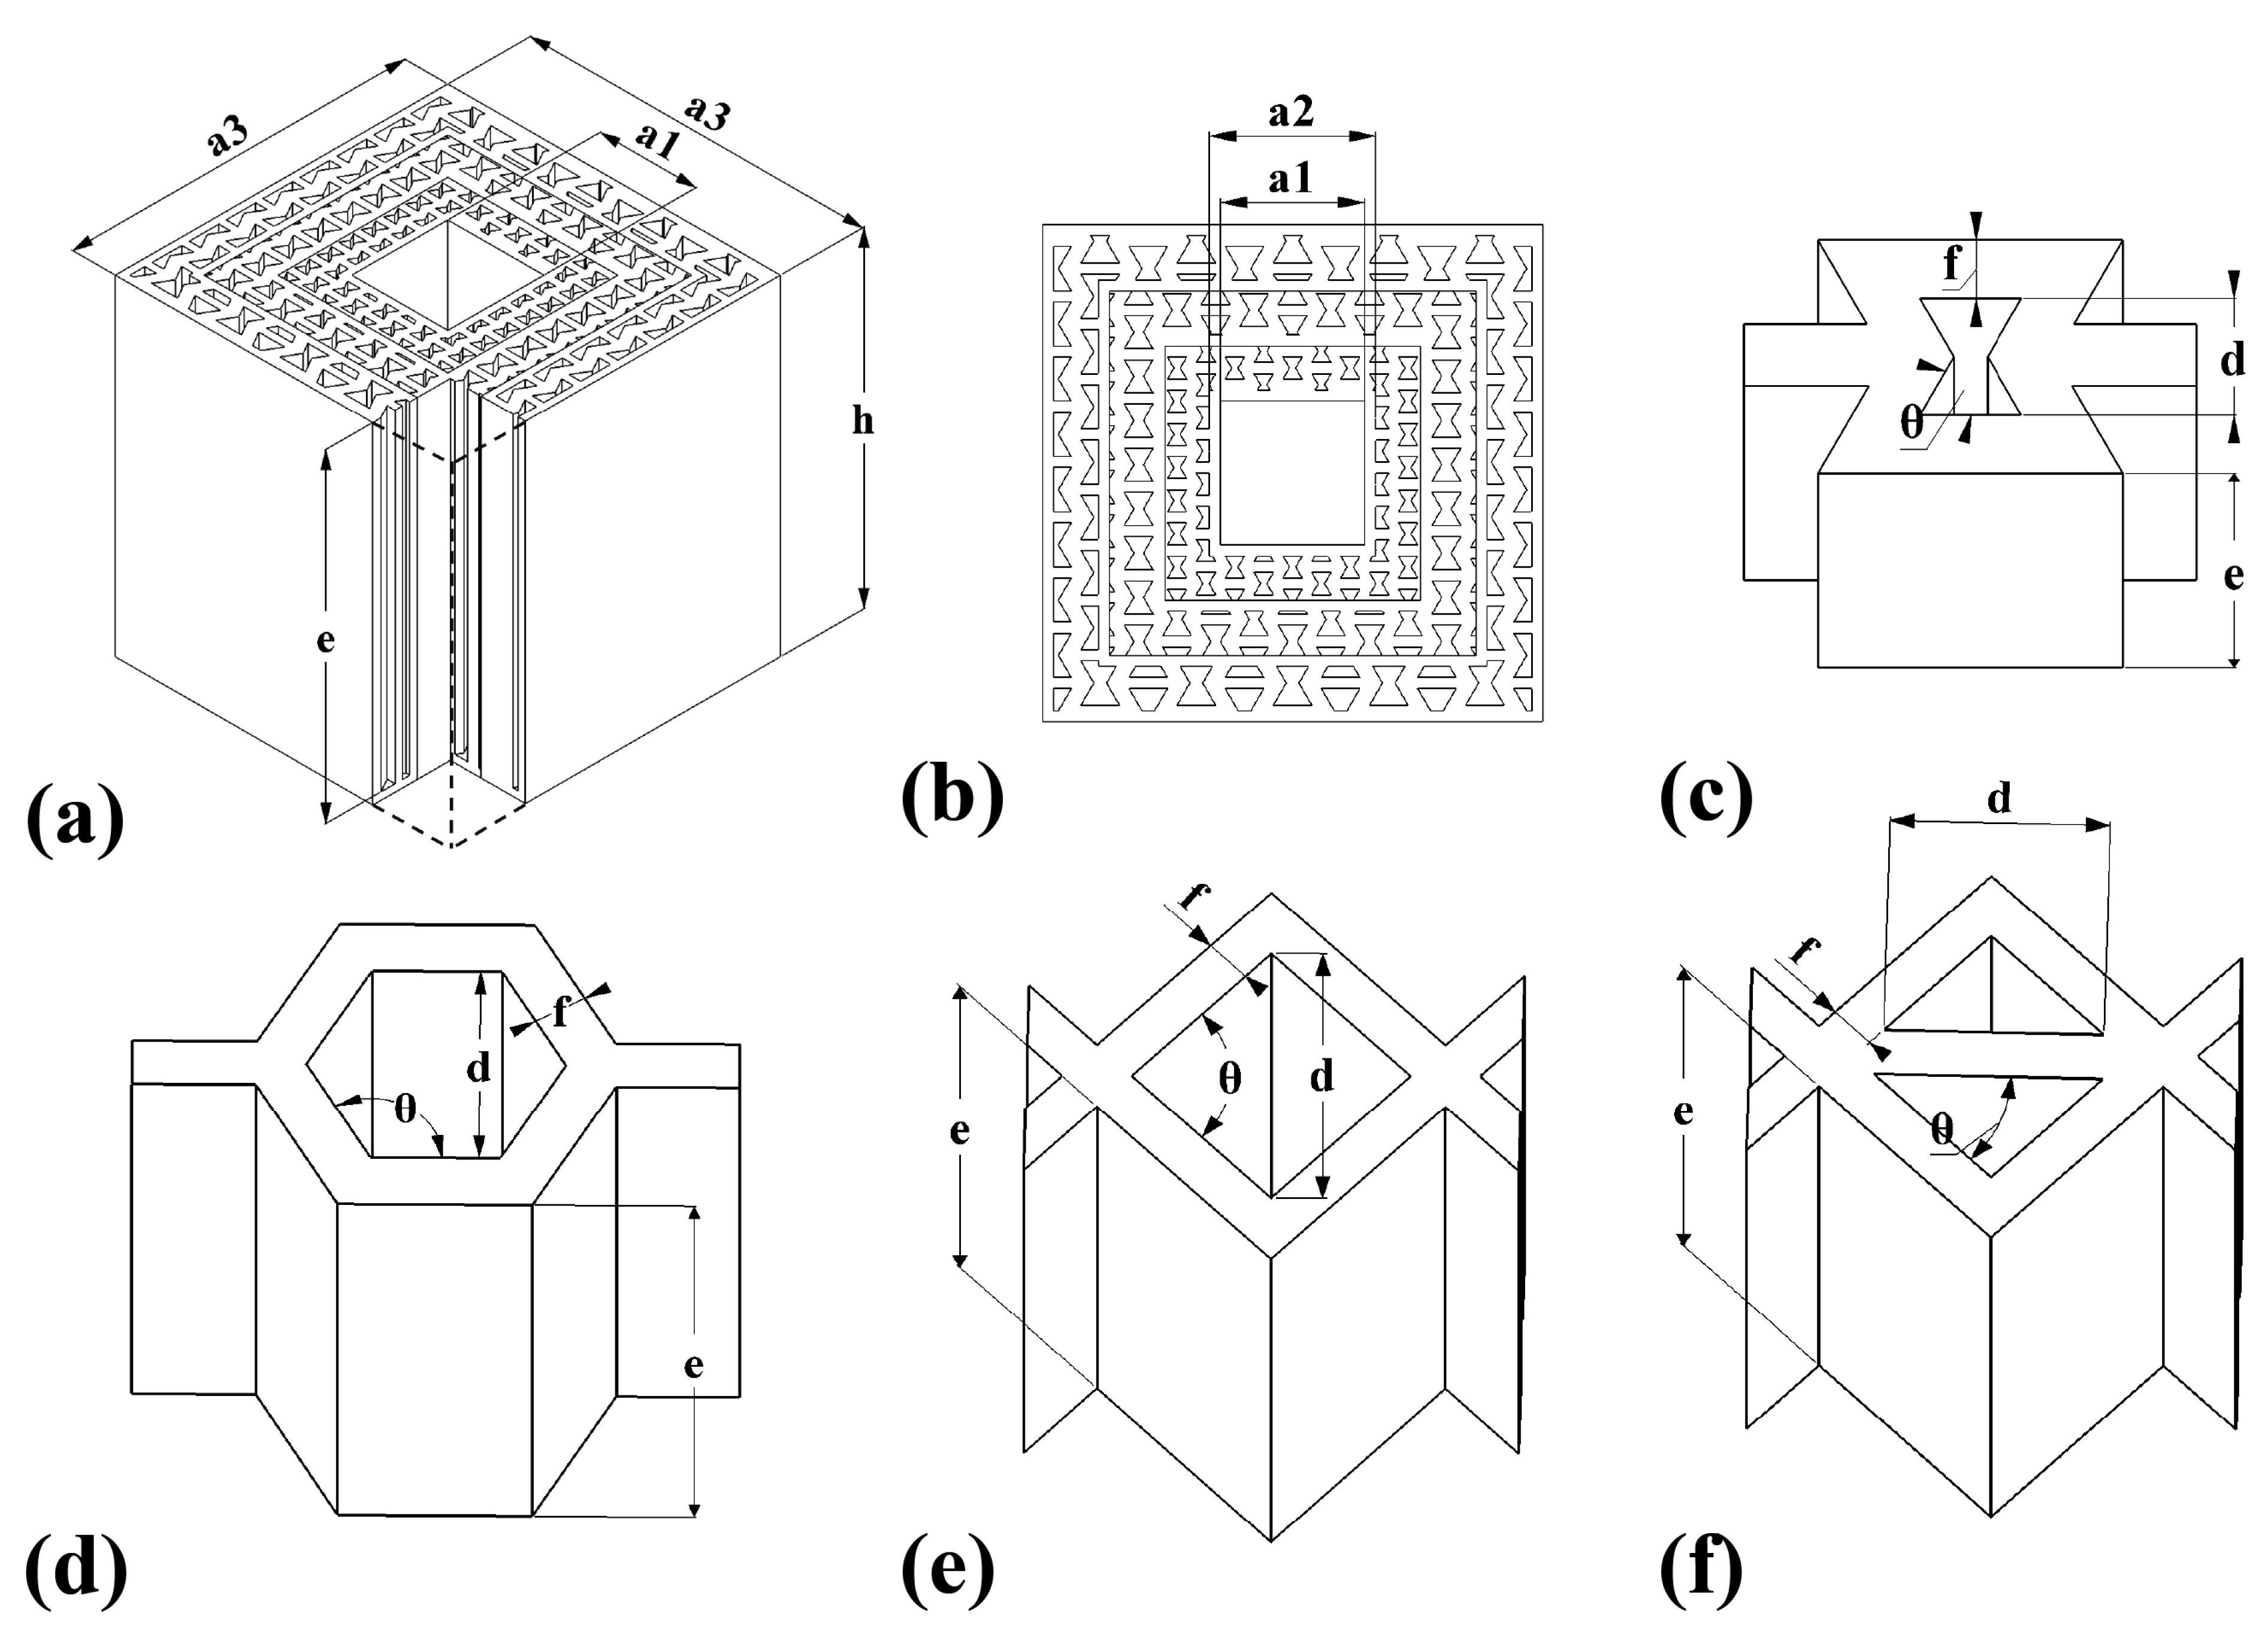
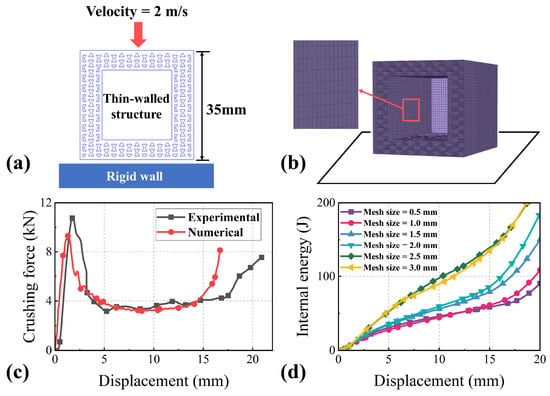
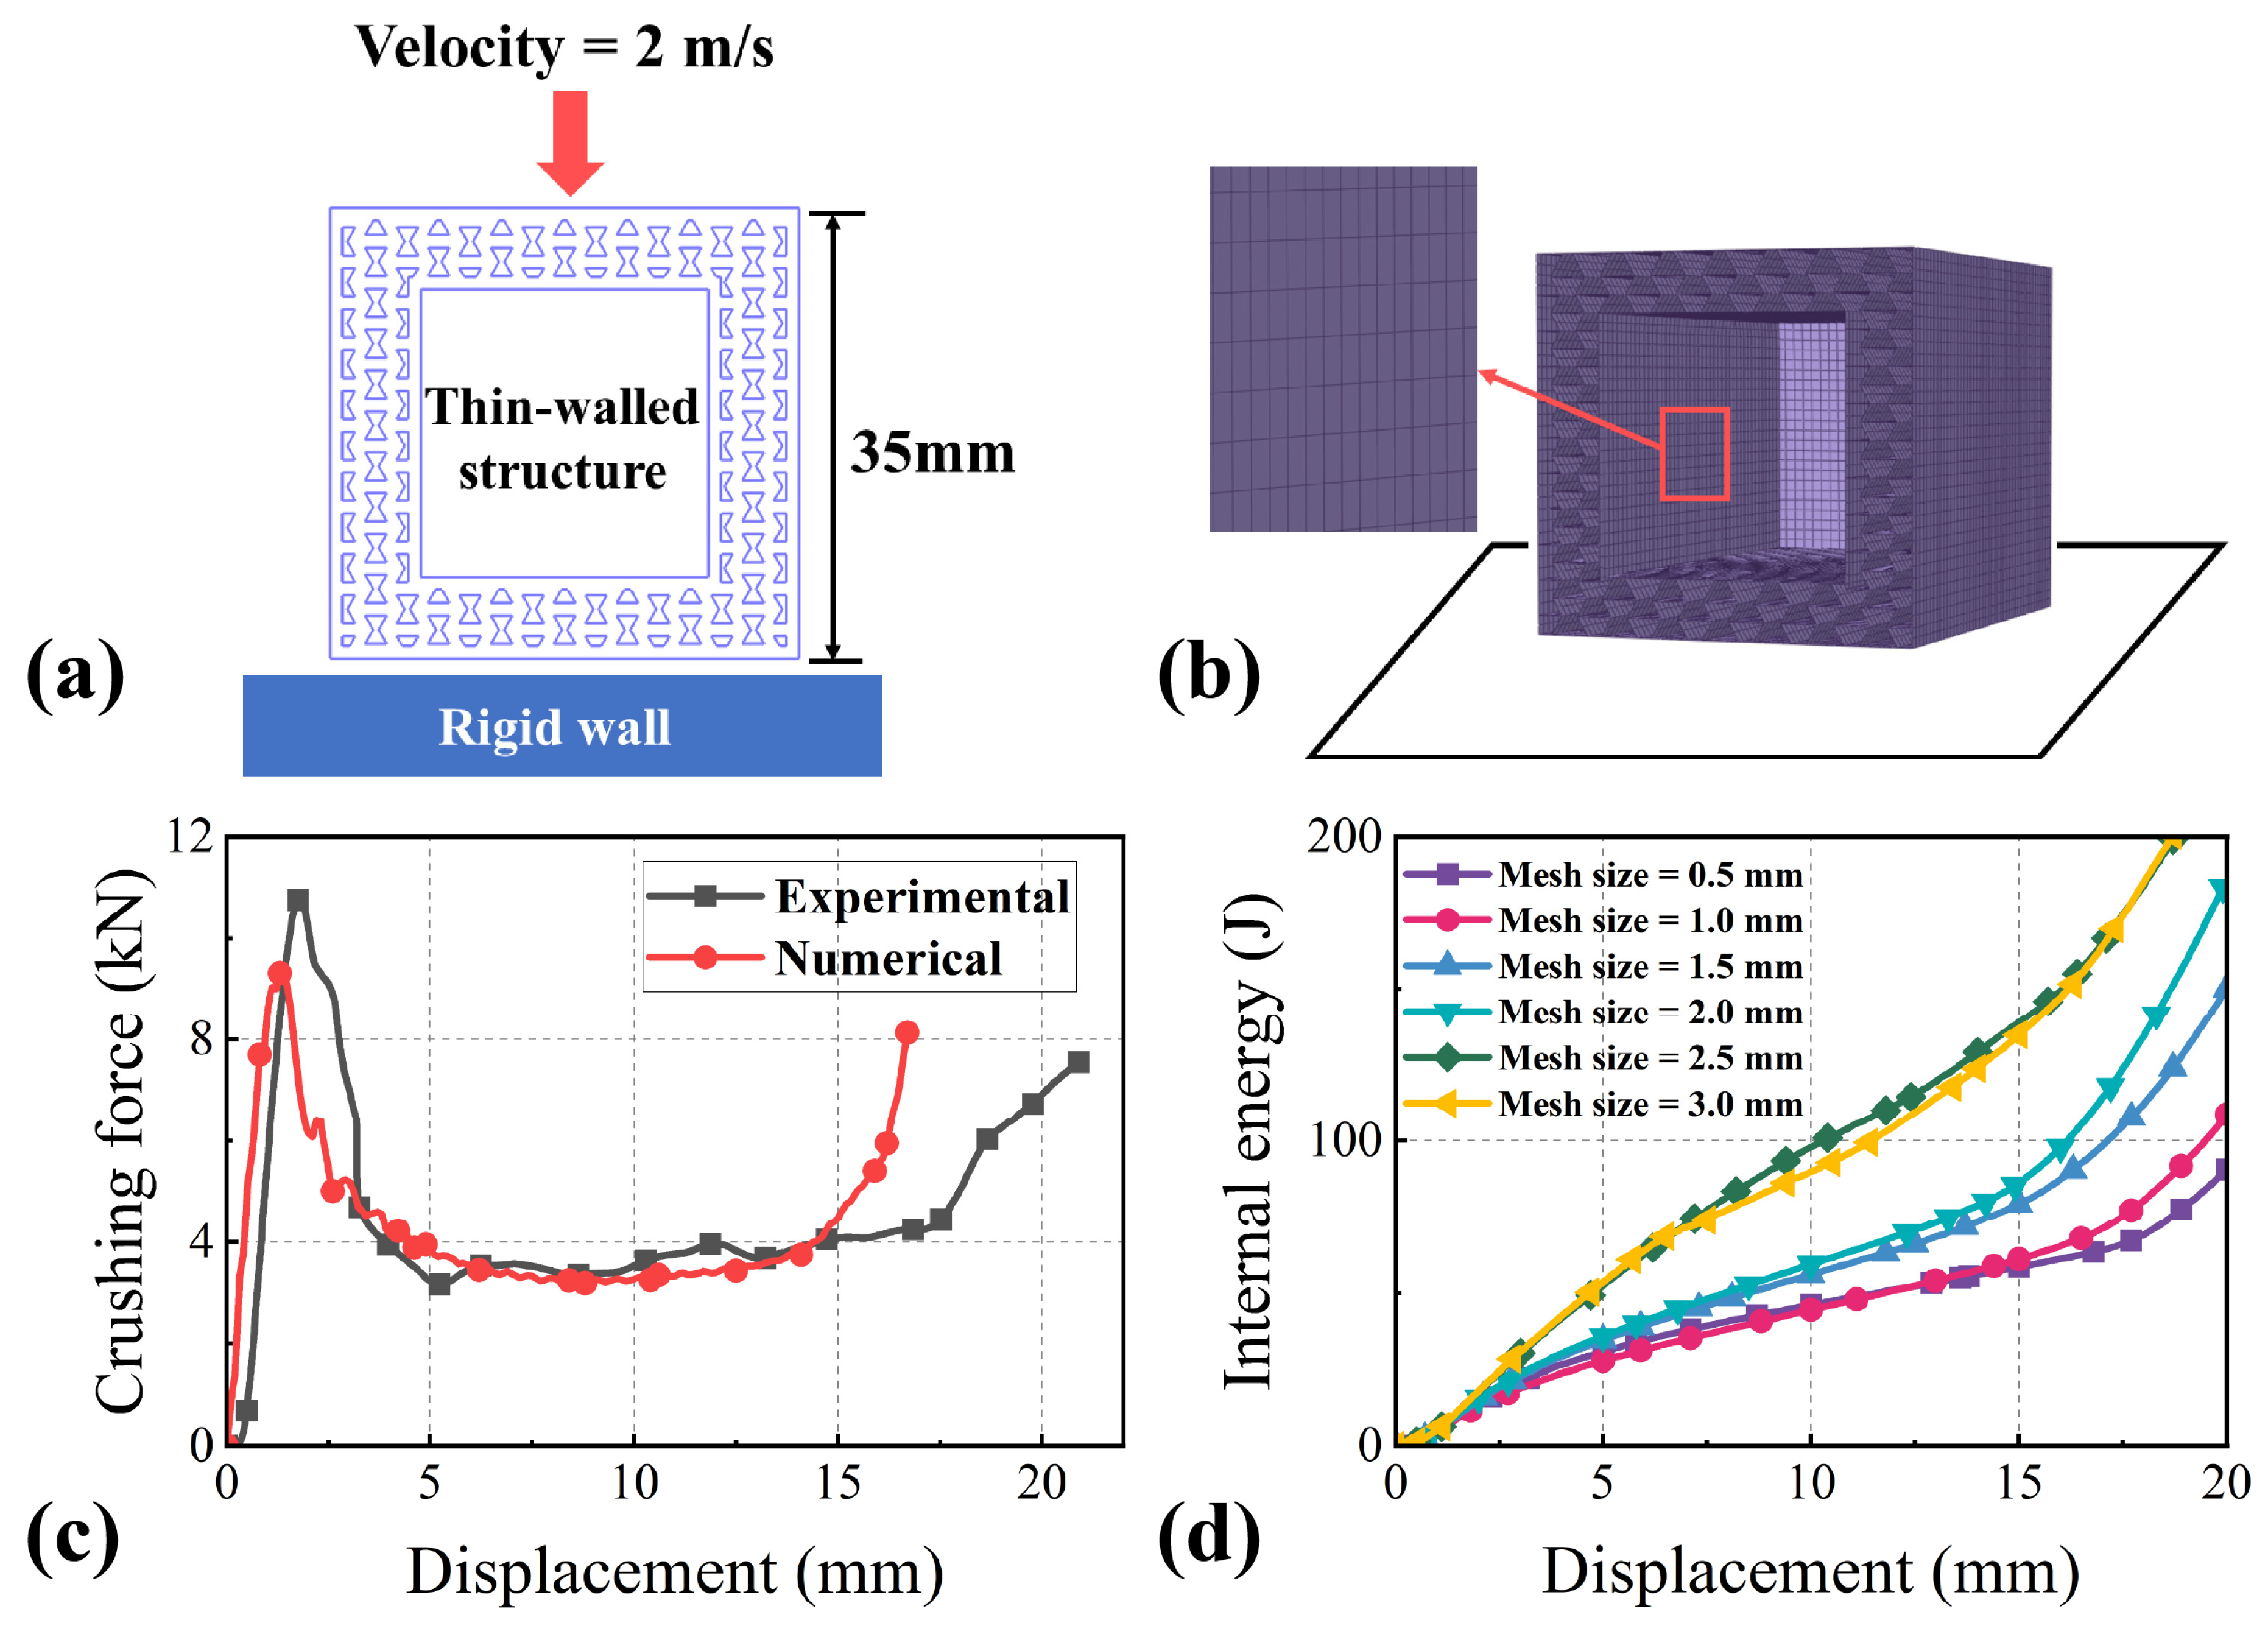
Based on traditional solid battery protection configurations, this study designed four different honeycomb sandwich topological configurations, including Hex, Qua, Tri, and Ren structures, whose unit cell geometries are illustrated in Figure 3c–f. To ensure a fair comparison among all topological structures, constant external envelope dimensions were maintained for structures within the same group. The single-layer honeycomb sandwich structures employed in the experiments featured an inner side length a1 of 23 mm, an outer side length a3 of 35 mm, a height h of 45 mm, and a wall thickness f of 1 mm. Consequently, a2 represents the sum of a1 and twice the wall thickness f, while e denotes the height of the unit cells. The local cell size for each topology is defined by its circumscribed circle diameter d, which was maintained at a constant 2 mm for the single-layer configurations, while other key parameters varied as summarized in Table 1. Given that the total structural mass varies according to the internal cell density of each design, SEA was utilized as the principal evaluation metric. As SEA represents the energy absorbed per unit mass, it effectively neutralizes the impact of mass variations and allows for an objective assessment of the crashworthiness across various structural designs. To comprehensively evaluate the structure’s performance under complex conditions, in addition to the axial impact model, a lateral crushing model was also established, as shown in Figure 4a, where an initial velocity of 2 m/s was applied to the rigid wall. The crashworthiness of the structure under impact loading was evaluated using explicit dynamic numerical simulation. As illustrated in Figure 4b, the geometric models were initially constructed in SolidWorks 2024 and subsequently discretized in HyperMesh using 1 mm × 1 mm shell elements, with appropriate material properties and boundary conditions assigned for the explicit dynamic analysis.
Figure 3.
Pore-size gradient honeycomb sandwich structure and unit cell structures: (a,b) honeycomb protective structure with a gradient pore-size design; (c–f) unit cell structures of Ren, Hex, Qua, and Tri.
Table 1.
Unit cell parameters of single-layer honeycomb structures.
Figure 4.
FE model establishment and key parameter analysis: (a) schematic illustration of the lateral collision between the thin-walled structure and the rigid wall; (b) meshed model in HyperMesh with a magnified view; (c) comparison of crushing force–displacement curves during experimental validation; (d) influence of different mesh sizes on the tnternal energy–displacement distribution of the thin-walled structure.
To verify the precision of the FE model and the reliability of the mechanical behavior, a single-layer honeycomb sandwich structure model was constructed with geometric features identical to those of the experimental specimens. The model strictly adhered to the geometric parameters listed in Table 1 and the dimensions defined in the previous section, ensuring consistency with the physical tests. During the pre-processing phase in HyperMesh, the mechanical properties of the PETG-CF composite were assigned to the thin-walled components, including core parameters such as a Young’s modulus of 1340 MPa, an initial yield strength of 40 MPa, and a Poisson’s ratio of 0.35 [41,42]. Within the Abaqus/Explicit framework, the material behavior was defined using the von Mises yield criterion with an isotropic hardening law. Although PETG-CF processed via FDM exhibits inherent orthotropy due to the layer-wise deposition process, the ±45° raster angle strategy and the random distribution of chopped carbon fibers within the matrix promote a quasi-isotropic macroscopic response under large-deformation crushing. This modeling simplification was adopted to maintain computational efficiency while capturing the primary energy dissipation mechanisms [35]. It should be noted, however, that the isotropic assumption might neglect localized interlaminar shear and delamination effects, which partially account for the minor discrepancies observed between the numerical predictions and experimental force–displacement curves. To account for the dynamic effects across the investigated velocity range of 0.2 to 4 m/s, strain-rate sensitivity was incorporated by defining rate-dependent hardening data. The Cowper-Symonds expansion was utilized to scale the yield stress, expressed as
, where parameters C = 3500 s−1 and P = 4 were adopted based on recent literature for similar carbon-fiber reinforced thermoplastics. This ensures that the potential elevation in PCF and SEA due to loading is accurately captured [43]. To authentically simulate the non-linear deformation characteristics during the structural crushing and failure process, an automatic contact setting was implemented for the internal interactions of the thin-walled structure. Concurrently, regarding the interfacial interaction between the rigid impactor and the thin-walled protective structure, a node-to-surface contact algorithm was introduced, with both dynamic and static friction coefficients defined as 0.2. This configuration ensures accurate calibration to achieve a high degree of correlation between the numerical simulations and experimental observations.
Figure 4c records the crushing force–displacement curve during the experimental validation stage. To verify the accuracy of the numerical simulation, the PCF and SEA were compared, as presented in Table 2. The simulation predicted a PCF of 9671.65 N, which deviates by approximately 10.15% from the experimental value of 10,764.71 N. Considering the complexity of impact dynamics, this discrepancy is acceptable and is likely attributed to inaccurate material parameters in the numerical model, as well as measurement errors or manufacturing imperfections inherent in the experiment. More importantly, the SEA, which serves as a critical indicator for energy storage protection, demonstrated high consistency. The numerical SEA at the selected mesh size was 8.51 kJ/kg, whereas the experimental result was 8.83 kJ/kg, representing a relative error of only 3.62%. These quantitative comparisons confirm that the finite element modeling methodology is reliable and suitable for subsequent crashworthiness evaluations.
Table 2.
Quantitative comparison of experimental and numerical results for the reference model.
To ensure the accuracy of computational results while balancing efficiency, a mesh convergence analysis was performed in this study. Figure 4d displays the displacement and energy absorption characteristics for six different mesh size models ranging from 0.5 mm to 3 mm. The sensitivity of PCF and SEA to mesh size was evaluated. When the mesh sizes were 1 mm × 1 mm and 0.5 mm × 0.5 mm, the calculated SEA values were 8.51 kJ/kg and 7.47 kJ/kg, respectively. Furthermore, the results from the 1 mm × 1 mm mesh were closer to the experimental data. Consequently, to reduce computational cost while ensuring sufficient computational accuracy, the 1 mm × 1 mm mesh size was ultimately selected for all subsequent analyses.
4. Numerical Results
4.1. Numerical Analysis of Crashworthiness Performance for Honeycomb Structures with Graded Cell Apertures
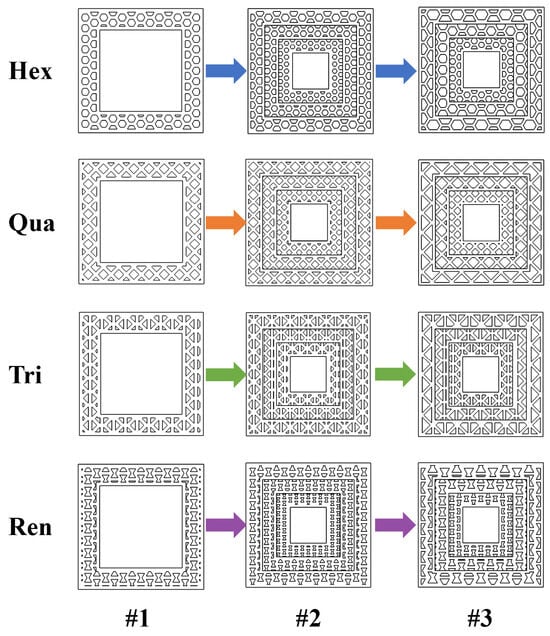
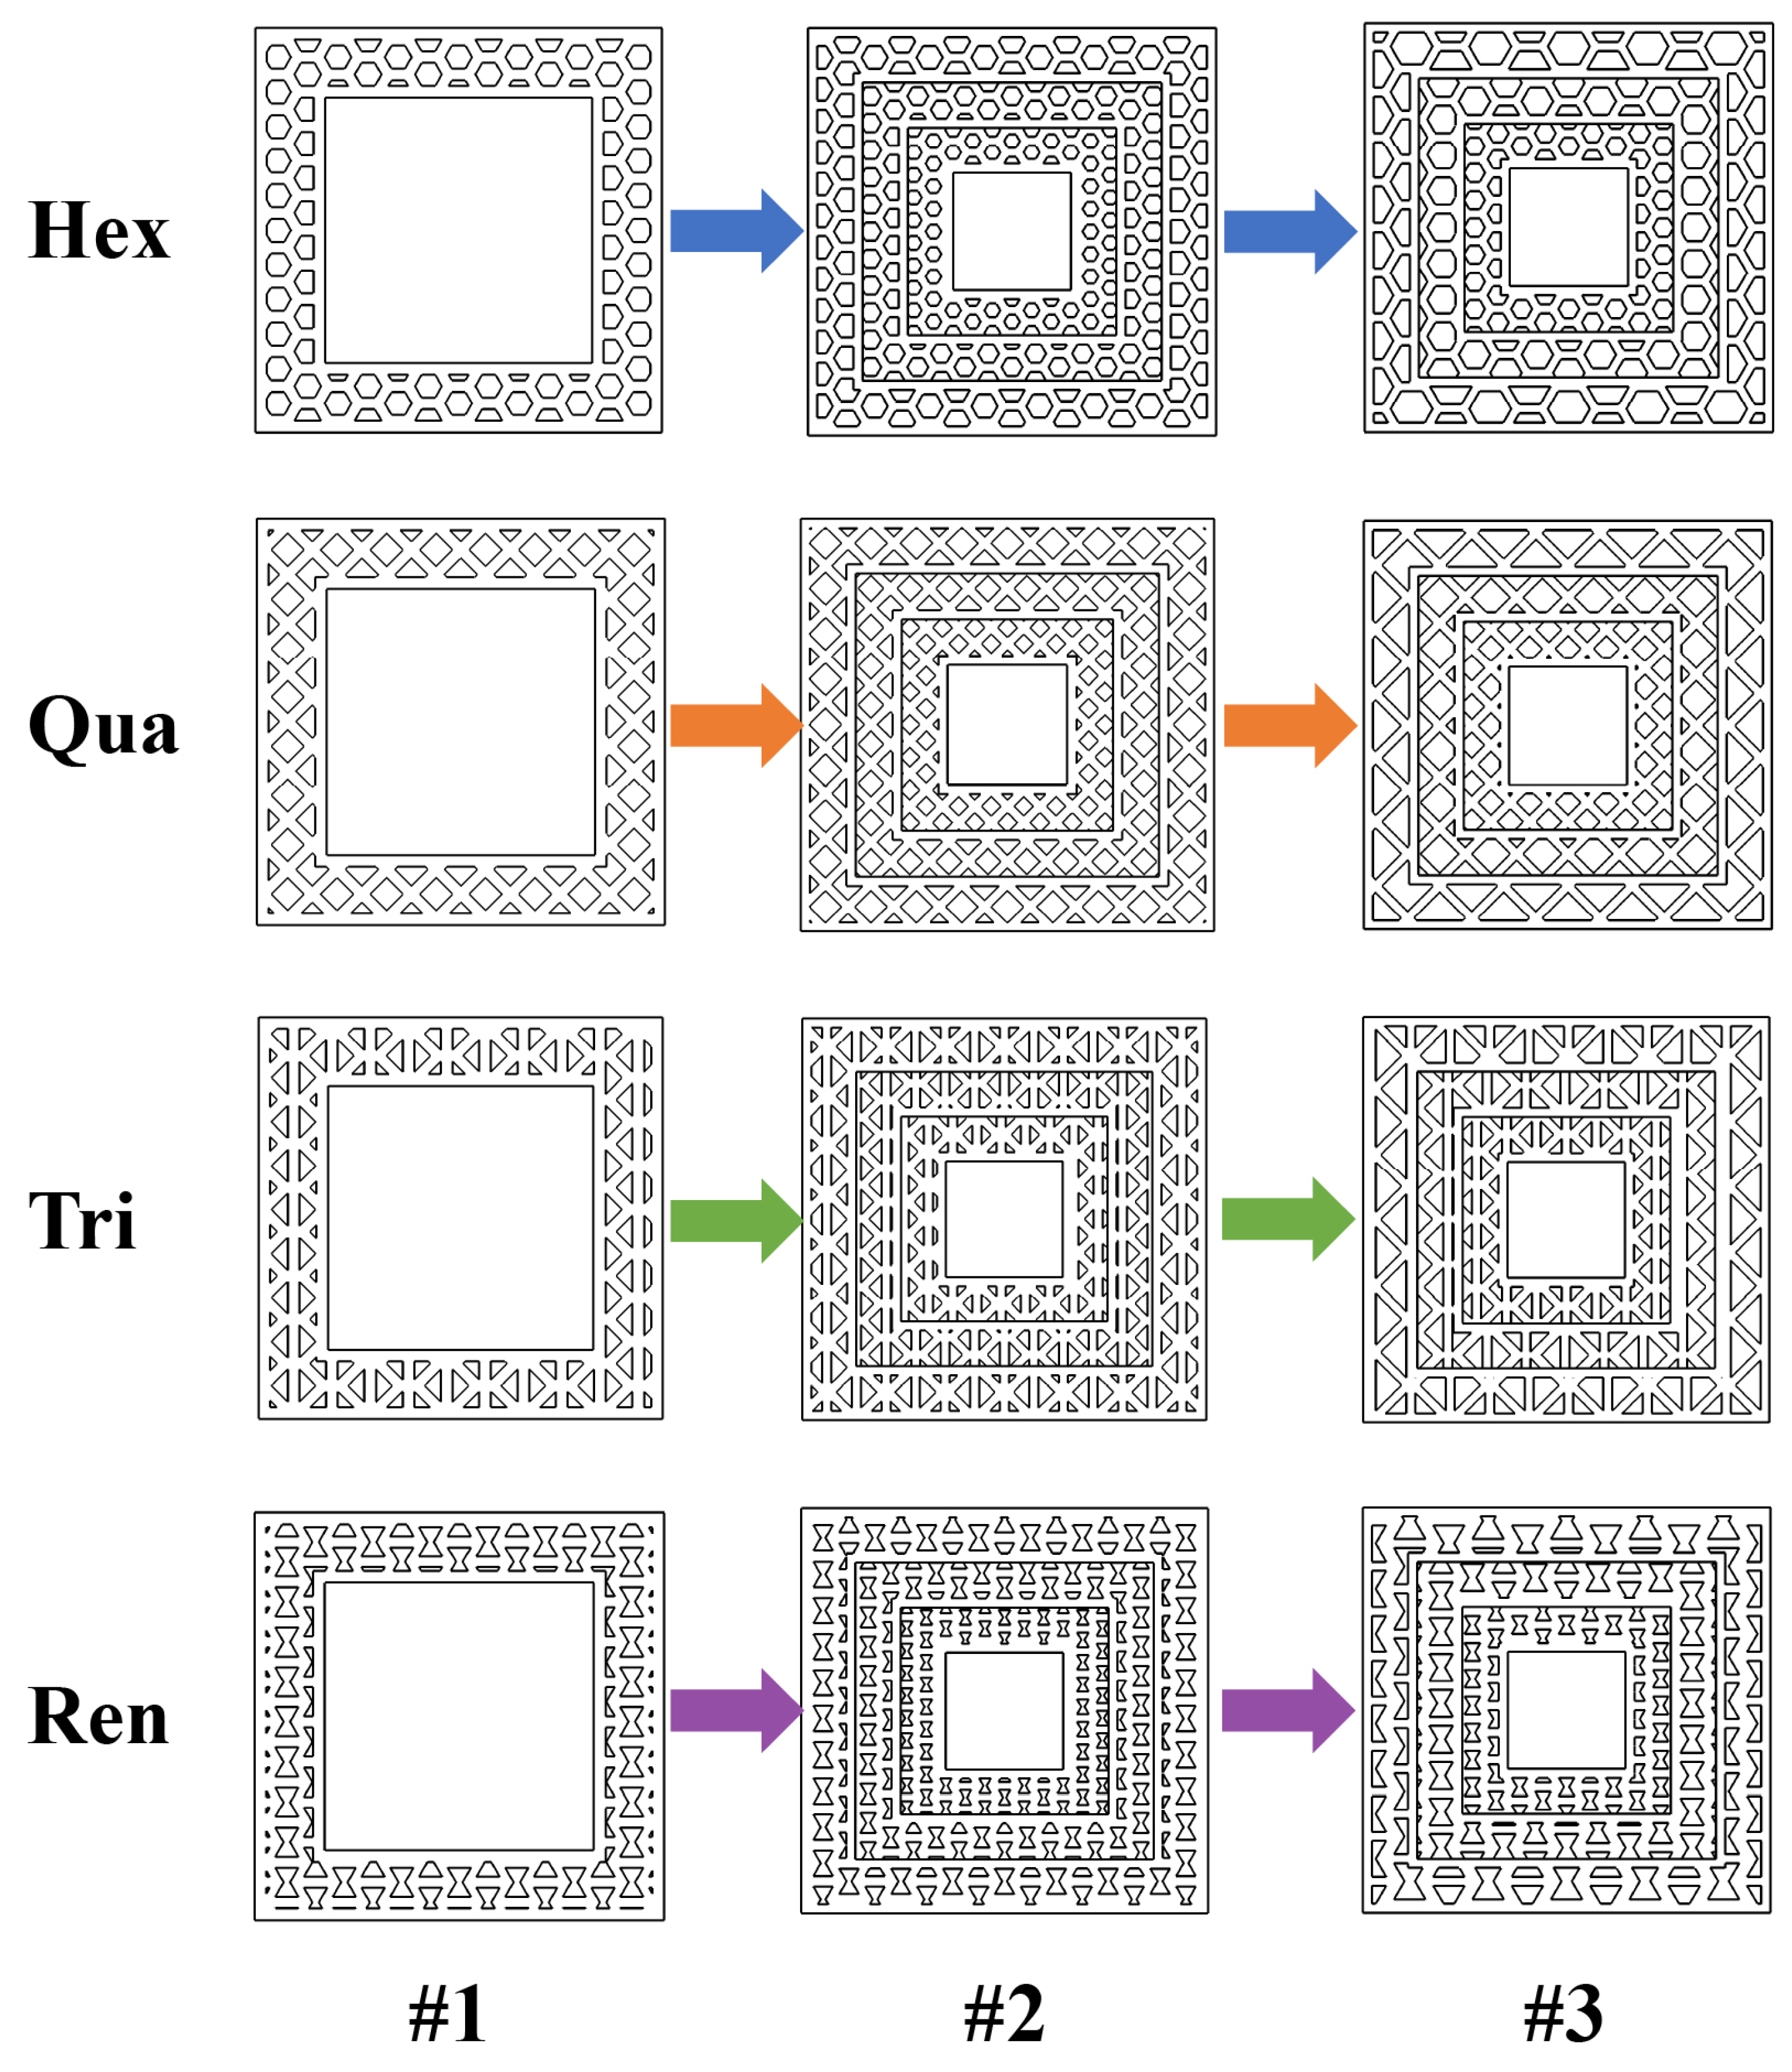
To investigate the dynamic impact characteristics of specific topological configurations under varied pore-size gradient distributions, this study designed four representative triple-layered thin-walled honeycomb structures: Hex, Qua, Tri, and Ren. These architectures are characterized by a hierarchical variation in the inscribed cell diameter d from the inner to the outer layers, denoted as d1, d2, and d3, respectively. All layers maintain a constant wall thickness f of 1 mm to ensure that the gradient effect originates from the variation in the structural pore-size gradient. Based on the specific evolution of the cell diameters across the sandwich layers, the pore-size gradients were categorized into three groups: a uniform single-layer structure G0 with a constant diameter d1 of 2 mm serving as the baseline; and gradient groups G1 and G2, with diameter sequences d1, d2, d3 of 1.5 mm, 2.0 mm, 2.5 mm and 2.0 mm, 3.0 mm, 4.0 mm, respectively, as detailed in Table 3.
Table 3.
Parameters of the gradient pore size structure.
By synthesizing diverse topological configurations with these gradient designs, the honeycomb sandwich protective structures developed in this study, along with their corresponding structural parameters, are detailed in Figure 5 and Table 4.
Figure 5.
Schematic of the graded-aperture honeycomb sandwich structures: model #1 with G0 gradient; model #2 with G1 gradient; model #3 with G2 gradient.
Table 4.
Parameters of the honeycomb structure.
Furthermore, to evaluate the performance enhancement of the gradient designs, a non-honeycomb-filled triple-layered thin-walled structure (labeled as “Control”) was introduced as a control group. All simulation models underwent pre-processing in HyperMesh and were subjected to numerical simulations at a constant impact velocity of 2 m/s.
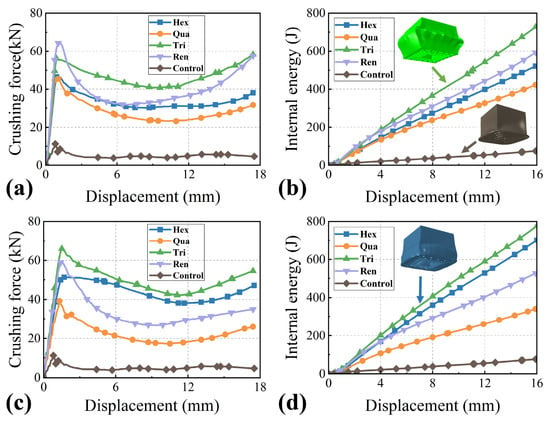
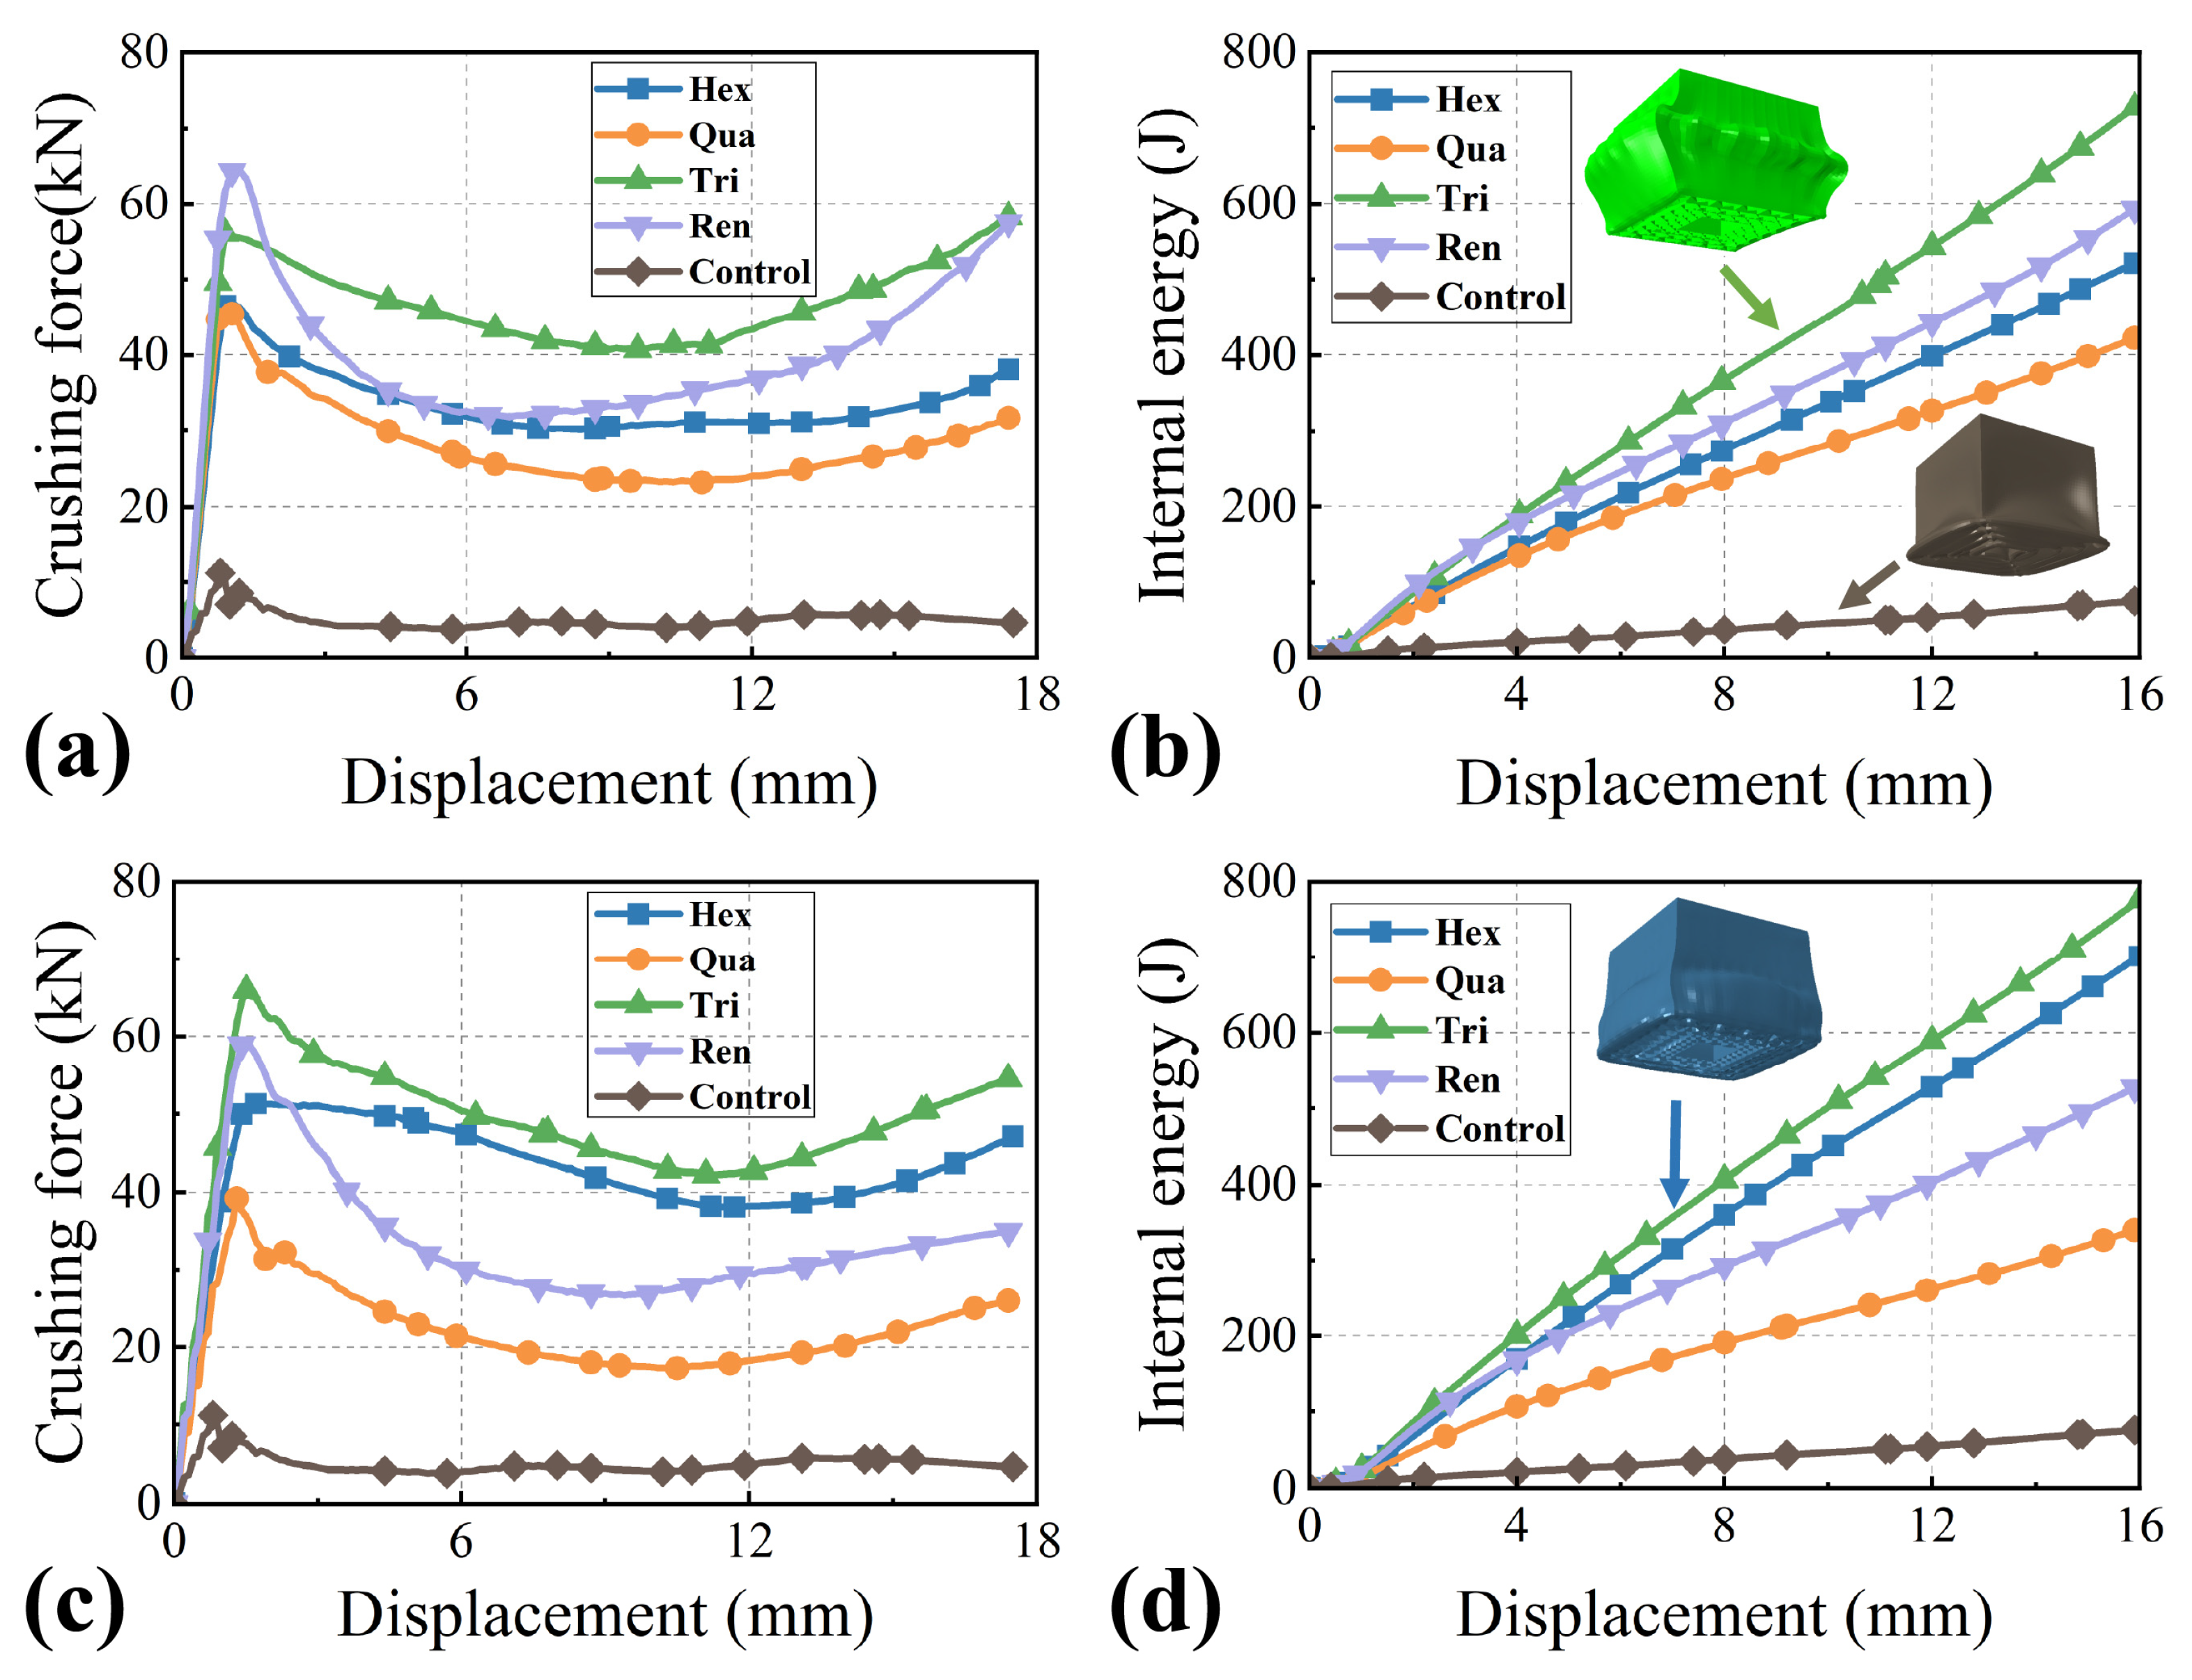
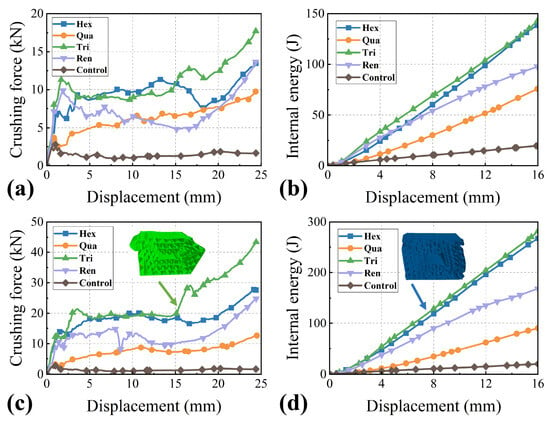
As shown in Figure 6a,b, during the progressive crushing of the G1 structure, the crushing load of the Control configuration rapidly decays to near 500 N in the initial impact phase. Correspondingly, its cumulative absorbed energy remains at an extremely low level, which clearly indicates that its axial load-bearing capacity and energy dissipation capability are extremely limited. In contrast, the crushing load of the Hex, Qua, Tri, and Ren configurations tends to stabilize after an initial fluctuation. Notably, the Tri configuration exhibits a significant load recovery trend in the later stages of displacement, and its internal energy growth rate is distinctly higher than that of the other configurations. This collectively demonstrates that the Tri configuration possesses superior load-bearing stability and energy absorption efficiency under axial crushing conditions.
Figure 6.
Comparison of mechanical response and energy absorption characteristics for different gradient-aperture structures under axial crushing: (a) Axial crushing force–displacement curves for the G1 structure; (b) axial internal energy–displacement curves for the G1 structure; (c) axial crushing force–displacement curves for the G2 structure; (d) axial internal energy–displacement curves for the G2 structure.
Similarly to the G1 observations, the crushing loads of the Hex, Qua, Tri, and Ren configurations in the G2 gradient exhibited an initial fluctuation followed by a sustained increase. Notably, the Tri configuration amplified its advantages under the G2 design, maintaining the highest crushing load peak and internal energy growth rate, as shown in Figure 6c,d.
Comparing the axial crushing results of the two gradient sizes, it is evident that in both categories, the Tri configuration significantly outperforms the Hex, Qua, and Ren configurations in terms of crushing force stability, late-stage load recovery capability, and internal energy accumulation efficiency. The control configuration consistently exhibits extremely weak load-bearing and energy absorption capabilities across both sizes. This regularity stems from the fundamental differences in the structural topology, in which the triangular cells of the Tri configuration possess inherently higher geometric stiffness, which effectively delays the onset of crushing failure and significantly promotes energy dissipation efficiency. In contrast, the single-sheet connection of the Control configuration struggles to provide continuous crushing support.
Turning to Figure 7a,b, the response of the G1 structure under lateral crushing is presented. When the displacement reaches 25 mm, the crushing force of the Control configuration consistently remains near 800 N, whereas the crushing loads of the other structures all show a pronounced upward fluctuating trend. Among them, the crushing load peak and magnitude of increase for the Tri configuration are notably higher than those of the other configurations. Concurrently, its internal energy growth rate is also at a leading level under the lateral crushing condition, which indicates that the Tri configuration possesses superior mechanical stability and energy absorption efficiency even in lateral crushing scenarios.
Figure 7.
Comparison of mechanical response and energy absorption characteristics for different gradient-aperture structures under lateral crushing: (a) lateral crushing force–displacement curves for the G1 structure; (b) lateral internal energy–displacement curves for the G1 structure; (c) lateral crushing force–displacement curves for the G2 structure; (d) lateral internal energy–displacement curves for the G2 structure.
Consistent with the trends observed in the G1 group, the lateral crushing behavior of G2 structures also demonstrated an initial load fluctuation succeeded by a phase of sustained load increase, as illustrated in Figure 7c,d. It is noteworthy that the triangular configuration sustained its superior performance, maintaining both the highest peak crushing load and the fastest energy accumulation rate even with the enhanced gradient parameters. Consistent with the trend observed in the smaller gradient structure, the Tri configuration maintains the highest peak crushing load and the greatest magnitude of load increase. Furthermore, its rate of absorbed energy accumulation continues to outperform the other configurations under this larger size gradient. These results further verify that the Tri configuration exhibits superior lateral crushing performance regardless of variations in the gradient parameters.
A comprehensive analysis of the axial and lateral crushing responses for G1 and G2 structures reveals that the G2 design, with its optimized density distribution, exhibits superior overall crashworthiness and energy absorption capabilities compared to G1. Notably, across both dimensional specifications, the Tri configuration demonstrates exceptional performance, consistently outperforming other structures in critical metrics such as load plateau stability, post-fluctuation load recovery, and energy accumulation efficiency under both loading directions. This robust performance is intrinsically linked to the inherent high geometric stiffness of the triangular unit cell, a topological feature that effectively mitigates lateral instability modes and significantly enhances the structure’s energy dissipation capacity. From the perspective of structural mechanics, the superior performance of the Tri configuration is attributed to its unique nodal connectivity. In the triangular configuration, the high density of nodal intersections provides rigid constraints that significantly reduce the effective buckling length of individual cell walls compared to the Hex or Ren designs. This elevation in the critical buckling threshold prevents sudden global bending and instead promotes high-energy localized folding. Furthermore, the G2 gradient design facilitates a programmed redistribution of internal forces, preventing premature stress localization. Although the interlaminar bonding inherent in the 3D-printing process is relatively weak, the triangular topology ensures a more uniform stress distribution across the nodes, thereby delaying the onset of interfacial delamination and maintaining structural integrity during impact. Consequently, guided by these numerical findings, subsequent experimental investigations will focus specifically on the mechanical response and energy absorption mechanisms of the triangular gradient honeycomb structure.
4.2. Influence Analysis of Impact Velocity on the Crashworthiness of Honeycomb Thin-Walled Structures
Based on the previous findings, the G2 structure exhibited a more significant advantage in crashworthiness and energy absorption performance compared to the G1 structure during lateral crushing at a velocity of 2 m/s, although the difference was less pronounced during axial crushing. Consequently, this study focuses on the G2 structure and proceeds with further analysis by varying the impact velocity. Numerical simulations were conducted on the four configurations, namely Hex, Qua, Tri, and Ren, at three distinct velocities: 4 m/s, 2 m/s, and 0.2 m/s.
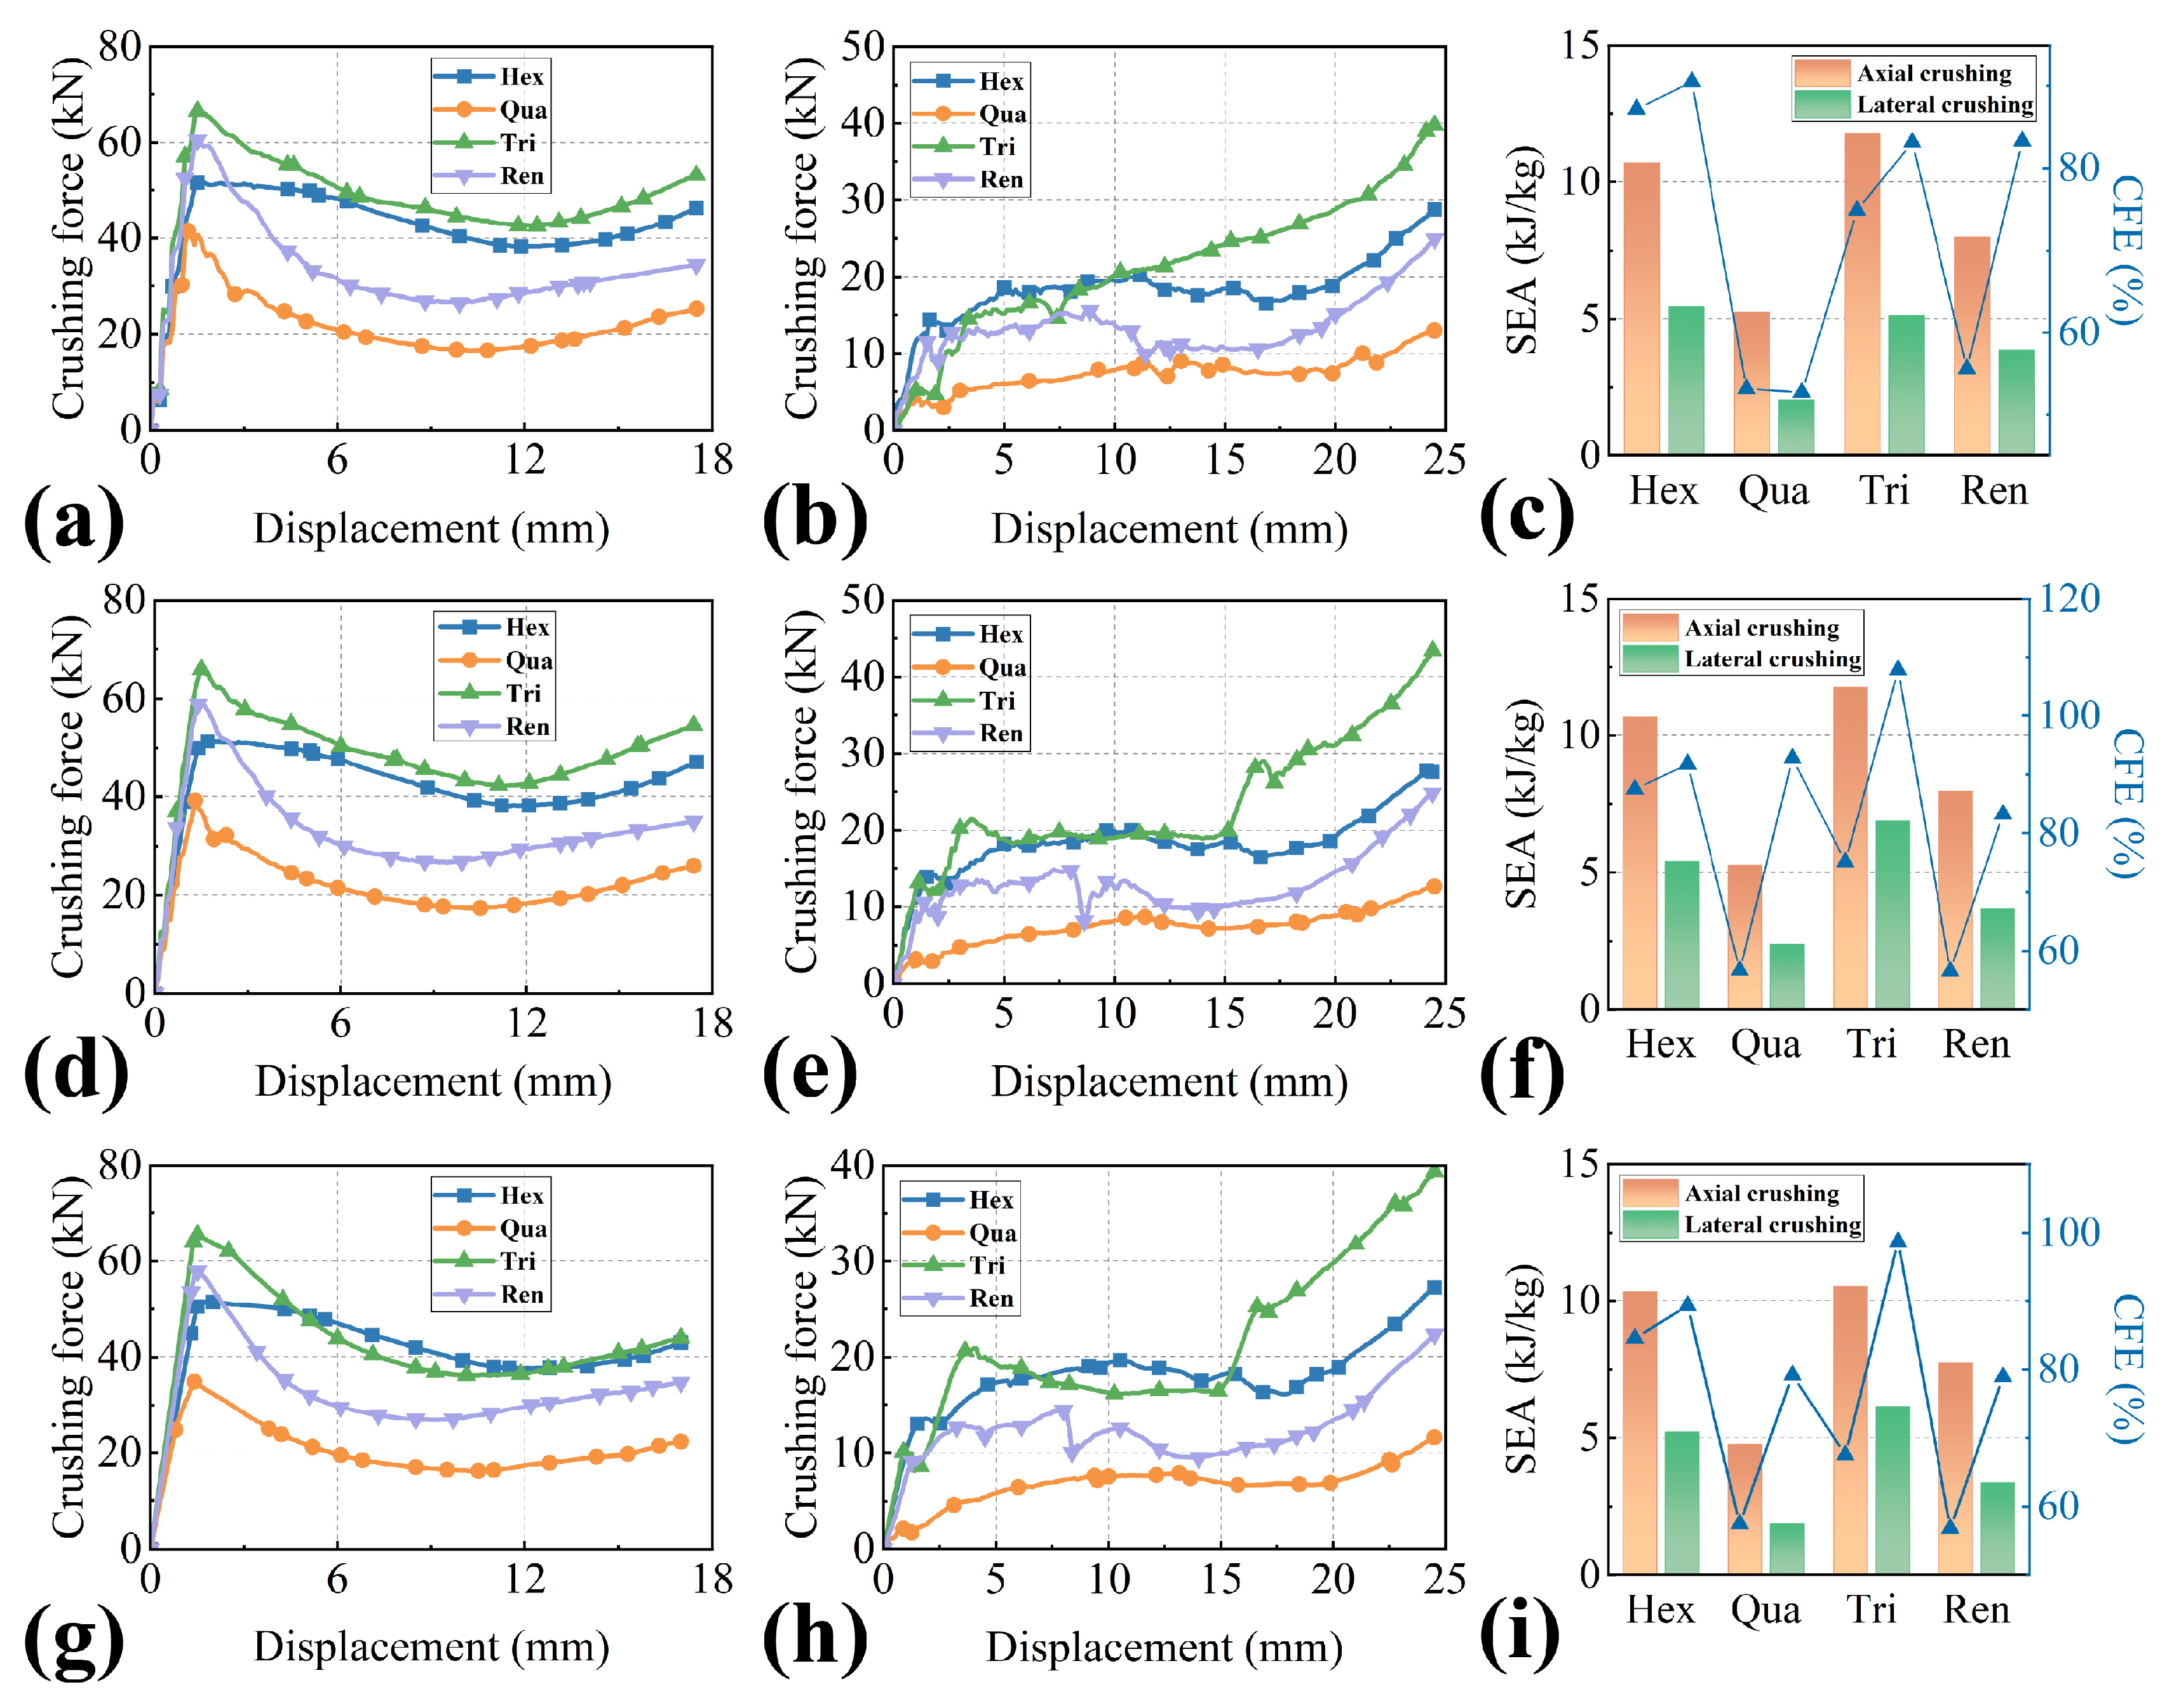
As illustrated in Figure 8a–c, under the high impact velocity of 4 m/s, the axial and lateral crushing force–displacement curves of the G2 structure exhibit distinct characteristic stages: the initial contact leads to an instantaneous peak in crushing force, followed by a descent phase due to material plastic yielding and cell structure collapse, and finally, an upward recovery trend as a result of cell wall stacking and frictional effects. It is observed that the Tri structure maintains the highest crushing force level across the entire displacement range, followed by the Hex and Ren structures, with the Qua structure showing the weakest crushing load performance. Regarding energy absorption performance, as shown in Figure 8c, the SEA values for the Hex and Tri structures are similar in both axial and lateral impacts, with the Hex structure performing optimally. In terms of CFE, the Hex structure demonstrates higher energy conversion efficiency. Conversely, the Qua structure’s SEA and CFE are the lowest among the four configurations, fully indicating its clear disadvantages in both energy absorption efficiency and load transfer characteristics.
Figure 8.
Crashworthiness and energy absorption characteristics of the G2 structure under various impact velocities: (a–c) 4 m/s; (d–f) 2 m/s; and (g–i) 0.2 m/s. For each velocity group, the three subfigures sequentially represent the axial crushing force–displacement curves, lateral crushing force–displacement curves, and energy absorption performance.
At the 2 m/s impact velocity, as shown in Figure 8d,e, the overall trend of the crushing force–displacement curves for all structures remains consistent with the 4 m/s case, but both the crushing load peak and the steady-state value exhibit a noticeable reduction, which confirms the direct influence of impact velocity on the structure’s dynamic mechanical response. As shown in Figure 8f, the SEA and CFE of all structures show varying degrees of decay as the velocity decreases, but the Tri structure still demonstrates a relative advantage in SEA. More notably, the CFE of the Tri structure successfully surpasses the Hex structure under axial impact. This suggests that the force efficiency characteristics of the triangular cell configuration are more readily and fully exerted under medium-to-low velocity loading conditions. Concurrently, the disadvantages of the Qua structure in energy absorption and force efficiency are further highlighted, with its axial SEA being less than 2 kJ/kg and its CFE dropping below 40%.
Under the low impact velocity of 0.2 m/s, as depicted in Figure 8g,h, the curves flatten with a further reduction in both the initial peak crushing load and the magnitude of dynamic variation across all structures. This clearly reflects that under near-quasi-static loading conditions, the structure’s deformation mode is dominated by progressive plastic collapse, rather than the instantaneous brittle failure observed at high velocities. The Tri structure maintains an absolute advantage in crushing load; its axial crushing load steady-state value is approximately 70,000 N, which is more than twice that of the Qua structure. As shown in Figure 8i, regarding energy absorption performance, the SEA and CFE of all structures are the lowest in this velocity range, with the axial SEA of the Qua structure decaying to an even lower level.
Synthesizing the numerical results across different velocities, a significant dynamic effect exists between the impact velocity and the cell configuration on the crashworthiness and energy absorption characteristics of the G2 structure. As the impact velocity decreases from 4 m/s to 0.2 m/s, the crushing force, SEA, and CFE of all structures show a decreasing trend, and the performance disparity among different configurations is particularly prominent under the condition of 4 m/s velocity. Overall, the Hex structure demonstrates a relatively balanced performance in crashworthiness and energy absorption across the entire velocity range, making it one of the preferred configurations for anti-impact energy absorption. The Tri structure exhibits excellent performance at medium and low velocities, suggesting potential for applications in scenarios demanding high load stability. The Qua structure is disadvantaged in terms of mechanical and energy absorption performance at all velocities; thus, it is not recommended for cell design in crashworthiness structures. The Ren structure shows some advantage in force efficiency at low speeds, positioning it as an alternative configuration for low-velocity conditions.
Regarding the trade-off between PCF and other protection objectives, although the Tri structure exhibits a higher initial peak force, it provides superior load-carrying capacity as well as excellent SEA and CFE, which are essential for the impact resistance of the protective structure and the safety of the battery. Furthermore, as the velocity decreases, the Tri structure maintains a stable crushing plateau and high CFE, suggesting that when the PCF remains within the allowable threshold of the battery, energy will be dissipated steadily. Therefore, for anti-intrusion prioritized high-energy impact scenarios, the combination of high SEA and robust load resistance makes the Tri structure a more effective protective barrier than configurations with lower PCF but insufficient energy dissipation.
Furthermore, the magnitude of performance decay under lateral impact is generally greater than that under axial impact, which reveals a distinct anisotropy in the structure’s crashworthiness and energy absorption characteristics. Therefore, axial configuration design should be prioritized as the focus for optimization.
4.3. Influence of Impact Angle on the Crashworthiness of Triangular Honeycomb Thin-Walled Structures
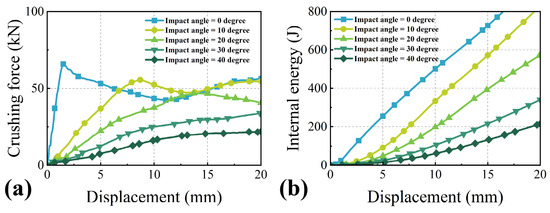
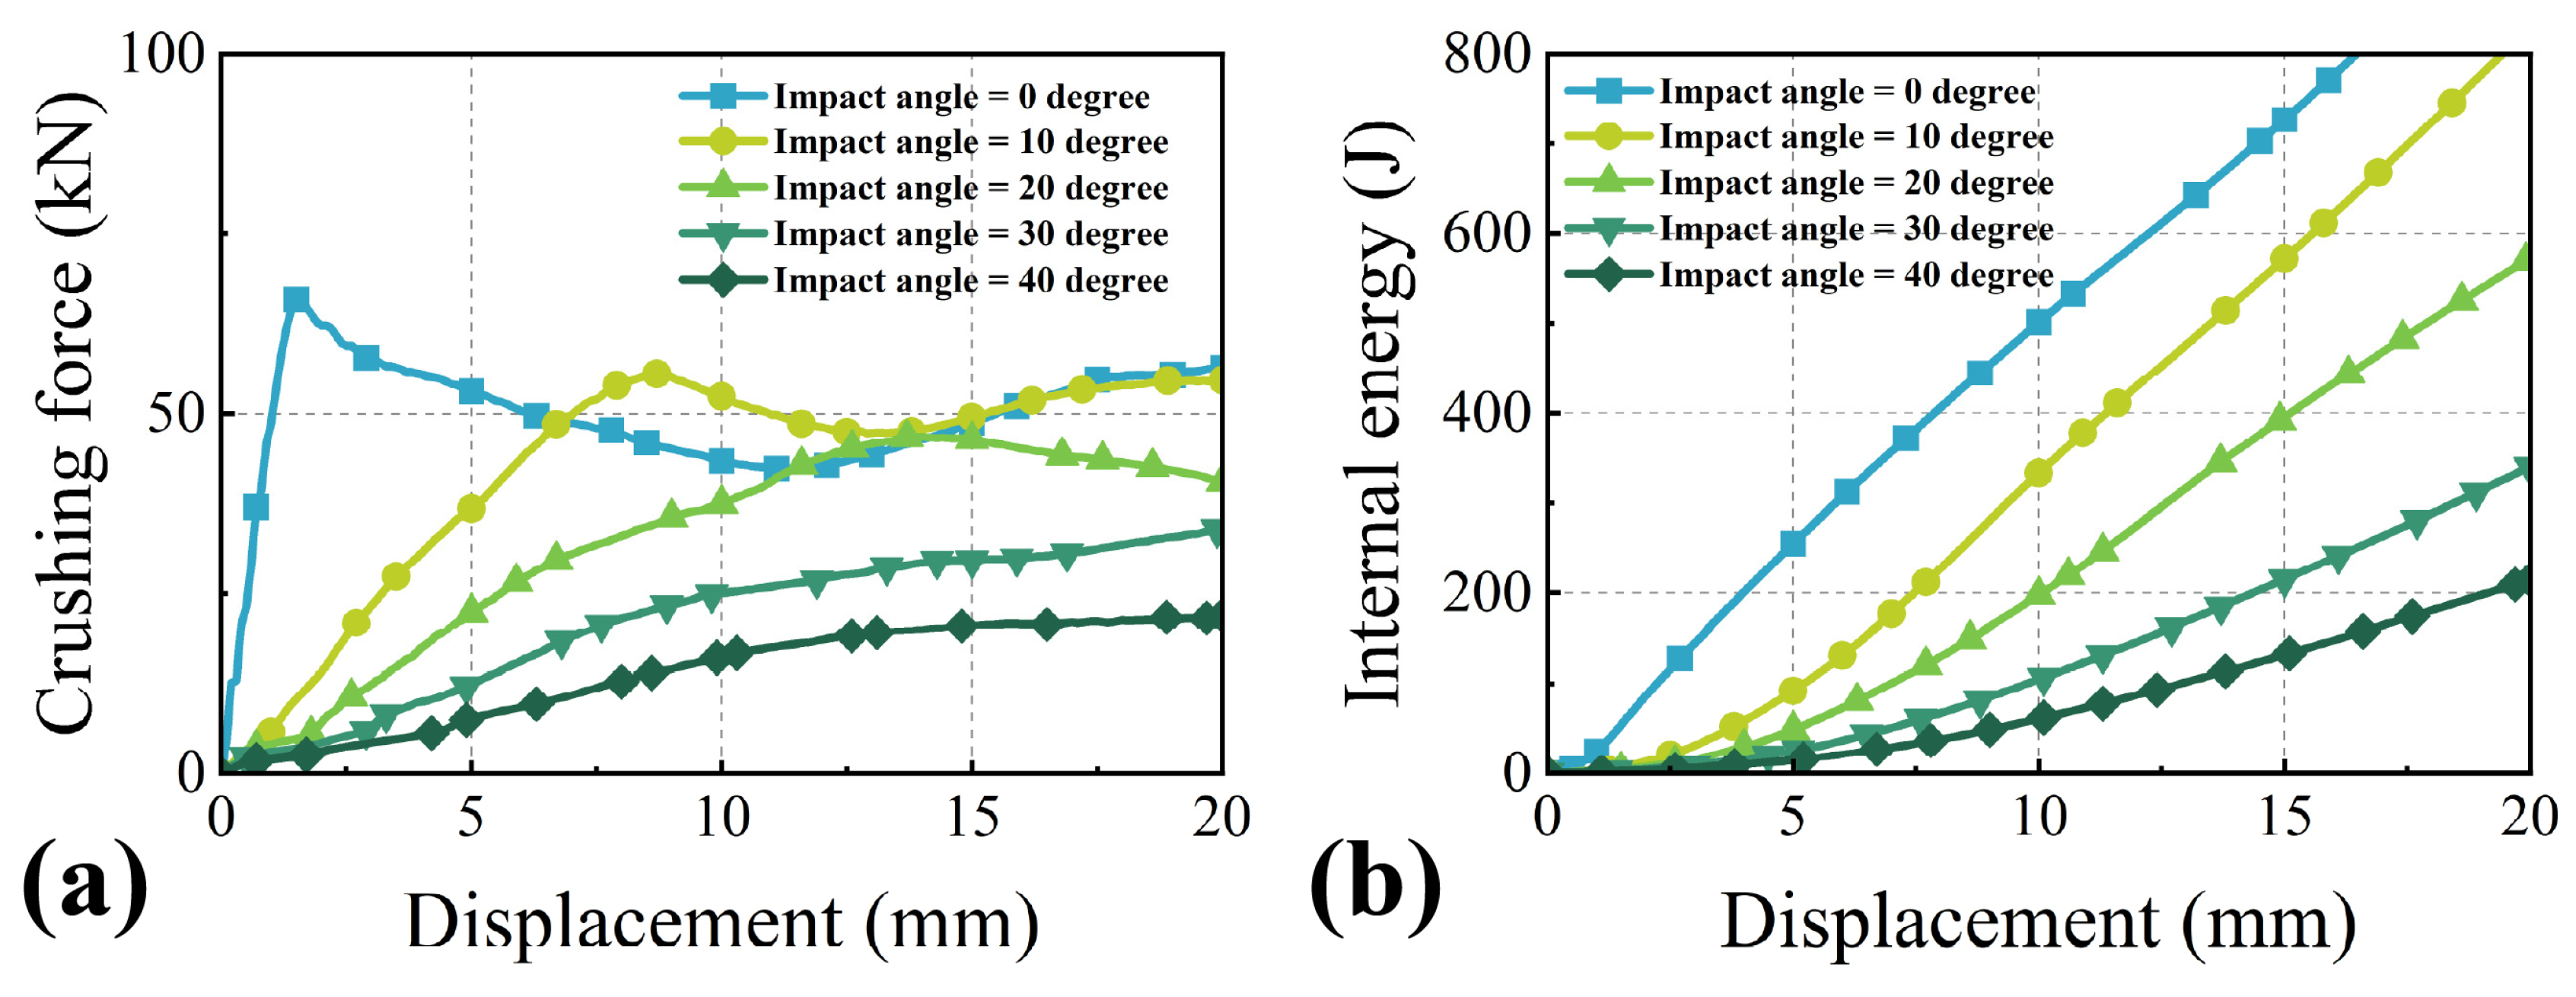
Based on the data obtained above, a further investigation is conducted into the crashworthiness and energy absorption characteristics of the G2 triangular honeycomb thin-walled structure under different off-axis impact angles at a velocity of 2 m/s, with the numerical simulation results shown in Figure 9. It can be clearly observed that as the impact angle increases by 10° increments from 0° to 40°, the structure’s crushing load-bearing capacity and energy absorption performance exhibit a continuous declining characteristic. The magnitude of mechanical performance degradation is most significant within the 0° to 20° impact angle range. Although the rate of performance decay slows down above a 20° impact angle, the downward trend persists. Hence, the present analysis prioritizes the structural response within the 0° to 20° impact angle range, where performance attenuation features are most distinct. To this end, the experimental scheme with 10° increments is implemented to delineate the evolving trends of crushing force and internal energy as functions of the impact angle.
Figure 9.
Comparison of mechanical response and energy absorption characteristics of the G2 triangular honeycomb structure under different axial impact angles: (a) crushing force–displacement curves at different impact angles; (b) internal energy–displacement curves at different impact angles.
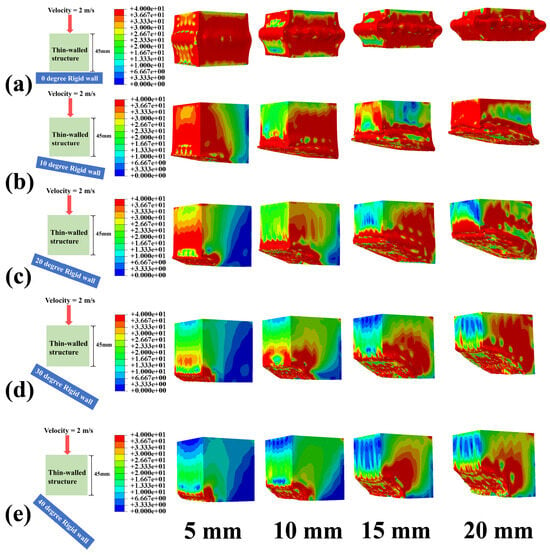
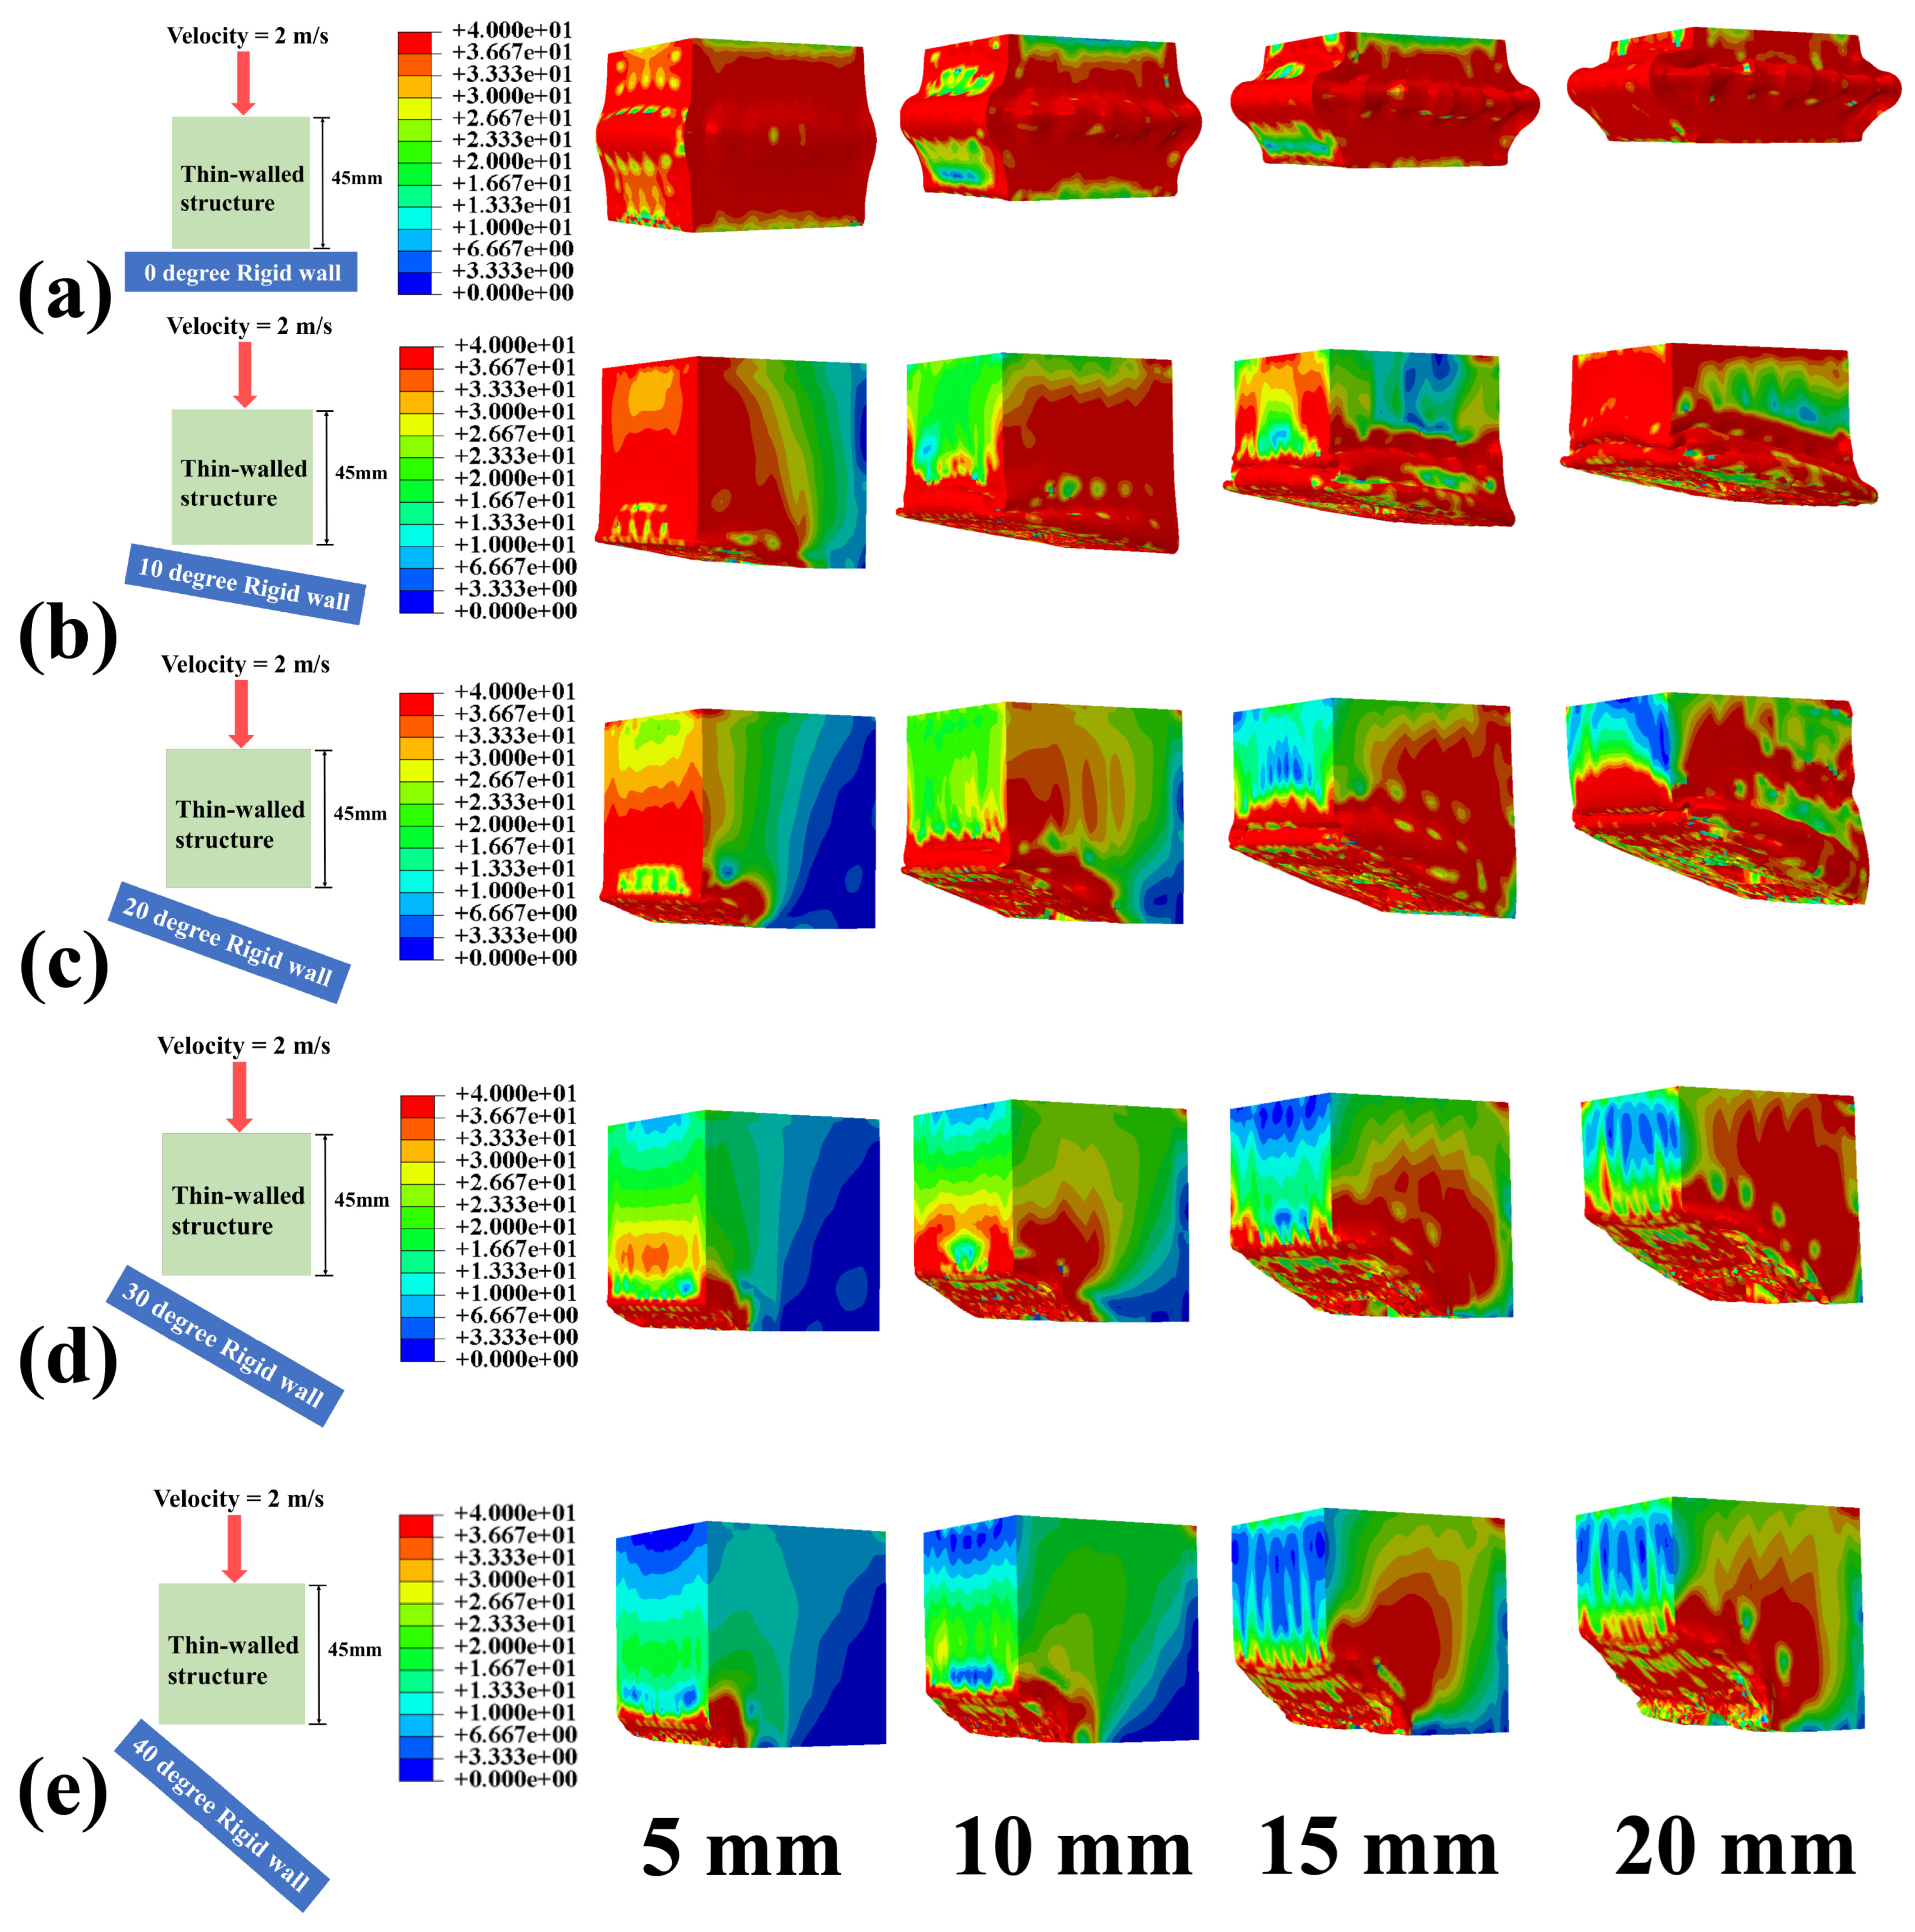
Further analysis of the resulting data indicates that as the impact angle increases from 0° to 10°, both the structure’s crushing force and internal energy undergo a significant reduction. Taking key displacement points as examples, at a displacement of 5 mm, the crushing load under 0° impact angle is 52,000 N, which drops to 48,000 N at 10°, representing a 7.7% decrease. At a displacement of 16 mm, the absorbed energy under 0° impact is 800 J, falling to 700 J at 10°, a 12.5% reduction. Subsequently, when the impact angle increases from 10° to 20°, the rate of decay for both crushing load and absorbed energy clearly accelerates. Specifically, the crushing load at a displacement of 5 mm for 20° impact is 24,000 N, representing a 50% drop compared to the 10° case. At a displacement of 16 mm, the absorbed energy under 20° impact is 420 J, a reduction of up to 25.7% compared to the 10° case. When the impact angle further increases to the 20° to 40° range, the structure’s crushing force–displacement and internal energy–displacement curves still show a declining trend, but the curve slope obviously tends to flatten. For instance, at a displacement of 20 mm, the absorbed energy under 30° and 40° impact is approximately 300 J and 200 J, respectively, corresponding to decreases of 50% and 66.67% compared to the 20° condition, and the spacing between the curves at different angles gradually narrows. This clearly indicates that within this angle range, although the sensitivity of the impact angle on performance persists, the differentiation in the structural mechanical response is significantly reduced. The stress contour plots corresponding to different axial crushing angles are presented in Figure 10.
Figure 10.
Final deformation modes of the G2 triangular honeycomb structure under different axial impact angles: (a) 0° impact angle; (b) 10° impact angle; (c) 20° impact angle; (d) 30° impact angle; (e) 40° impact angle.
5. Conclusions
Addressing the insufficient energy absorption and crashworthiness limitations of traditional battery enclosures under complex impact loads, this study systematically conducted a numerical analysis on the energy absorption and crashworthiness of novel battery honeycomb sandwich thin-walled structures. By establishing a robust FE model, the influence of key design parameters such as different honeycomb configurations, aperture gradients, impact velocities, and angles on the structural mechanical response and energy absorption characteristics was comprehensively evaluated. The research aims to deeply reveal the mechanical behavior and energy dissipation mechanism of these structures under impact loading, providing a theoretical basis and data support for the optimal design and engineering application of high-performance battery protection systems.
Based on the validated finite element models of four topological configurations (Hex, Qua, Tri, and Ren) with varying aperture gradients, the specific findings are summarized as follows:
1. Topological Configuration and Anisotropy: Owing to its superior geometric stiffness, the Tri topology outperforms both Hex and Qua configurations in crashworthiness and energy absorption across all tested conditions. The experimental evidence of mechanical anisotropy, where axial performance significantly exceeds lateral capacity, confirms a high sensitivity to loading direction and dictates that future optimizations must prioritize enhancing impact resistance and energy absorption capabilities under off-axis loads.
2. Aperture Gradient Effect: The aperture gradient effect is significant. The G2 structure showed markedly better lateral crashworthiness and energy absorption performance compared to the G1 structure, demonstrating that rational gradient design is a key method to enhance the structure’s protection capability under non-axial loads.
3. Coupling Effect of Velocity and Angle: The study highlights a significant dynamic coupling effect between impact velocity and angle on structural crashworthiness. As velocity decreases from 4 m/s to 0.2 m/s, the crushing force, SEA, and CFE of all configurations exhibit a monotonic decline, with elevated strain rates magnifying inter-configurational performance differentiation. Concurrently, increasing the impact angle from 0° to 40° induces progressive degradation in energy absorption, characterized by the most acute performance attenuation within the angle regime of 0° to 20°.
By systematically evaluating four honeycomb topologies across varying aperture gradients, impact velocities, and multi-angle loads, this study clarifies the potential of Tri configurations and G2 size settings in enhancing crashworthiness while revealing the failure mechanisms under complex conditions. Despite these innovations, the research remains constrained by idealized material models and boundary conditions, failing to fully account for factors such as strain rate, temperature, and other influencing factors within the battery, whereas long-term performance evaluations under multi-scale or fatigue loading require further investigation.
Future research can be carried out in the following aspects. On the one hand, the numerical analysis model can be further optimized to consider the influence of more practical factors, thereby improving the accuracy and reliability of the analysis results. On the other hand, more experimental research can be conducted to verify the effectiveness of the numerical analysis results and obtain more performance data about the structure under different working conditions. In addition, the application potential of the battery honeycomb sandwich thin-walled structure in more fields can be explored to expand its application scope. Through these studies, it is expected to further enhance the performance of the battery honeycomb sandwich thin-walled structure and promote its wide application in the engineering field.
Author Contributions
Methodology, J.D. (Jianxun Du), C.X. and Z.G.; Software, J.D. (Jin Dong), J.S. and J.X.; Validation, C.X. and J.X.; Formal analysis, J.D. (Jin Donng), W.Z. and J.X.; Investigation, J.D. (Jin Dong) and J.S.; Resources, C.X.; Writing — original draft, J.D. (Jin Dong); Writing — review & editing, J.X. and Z.G. All authors have read and agreed to the published version of the manuscript.
Funding
This research was funded by the National Natural Science Foundation of China (Grant No. 22473086) and the Caiyun Postdoctoral Talent Program of Yunnan Province.
Institutional Review Board Statement
Not applicable.
Informed Consent Statement
Not applicable.
Data Availability Statement
The original contributions presented in this study are included in the article. Further inquiries can be directed to the corresponding author.
Conflicts of Interest
Author Jin Dong, Jianxun Du and Zhongcheng Guo were employed by the company Kunming Hendera Science & Technology Company Limited. The remaining authors declare that the research was conducted in the absence of any commercial or financial relationships that could be construed as a potential conflict of interest.
References
- Taabodi, M.H.; Niknam, T.; Sharifhosseini, S.M.; Aghajari, H.A.; Shojaeiyan, S. Electrochemical storage systems for renewable energy integration: A comprehensive review of battery technologies and grid-scale applications. J. Power Sources 2025, 641, 236832. [Google Scholar] [CrossRef] [Scilit]
- Jafarizadeh, H.; Yamini, E.; Zolfaghari, S.M.; Esmaeilion, F.; Assad, M.E.H.; Soltani, M. Navigating challenges in large-scale renewable energy storage: Barriers, solutions, and innovations. Energy Rep. 2024, 12, 2179–2192. [Google Scholar] [CrossRef] [Scilit]
- Vangapally, N.; Penki, T.R.; Elias, Y.; Muduli, S.; Maddukuri, S.; Luski, S.; Aurbach, D.; Martha, S.K. Lead-acid batteries and lead–carbon hybrid systems: A review. J. Power Sources 2023, 579, 233312. [Google Scholar] [CrossRef] [Scilit]
- Kawsar, I.; Li, H.; Liu, B.; Zhang, Y.; Pan, Y. Enhancing mechanical reliability and safety performance of a battery pack system for electric vehicles: A review. eTransportation 2025, 26, 100469. [Google Scholar] [CrossRef] [Scilit]
- Wang, Z.; Tuo, X.; Zhou, J.; Xiao, G. Performance study of large capacity industrial lead-carbon battery for energy storage. J. Energy Storage 2022, 55, 105398. [Google Scholar] [CrossRef] [Scilit]
- Li, R.; Lu, G.; Shen, W.; Leontini, J. An integrated cell-to-pack design based on an origami sandwich structure to enhance cooling and mechanical performances of battery packs in electric vehicles. Appl. Therm. Eng. 2024, 248, 123197. [Google Scholar] [CrossRef] [Scilit]
- Nasrullah, A.I.H.; Muthohirin, B.F.; Humaidi, H.N.A. Optimization of thin-walled battery protector design for electric vehicles under ground impact conditions using genetic algorithm. J. Power Sources 2025, 638, 236610. [Google Scholar] [CrossRef] [Scilit]
- Li, R.; Zhao, Z.; Bao, H.; Pan, Y.; Wang, G.; Liu, B.; Liao, T.; Li, J. Bio-inspired honeycomb structures to improve the crashworthiness of a battery-pack system. Eng. Fail. Anal. 2024, 158, 108041. [Google Scholar] [CrossRef] [Scilit]
- Zhu, F.; Zhou, R.; Sypeck, D.; Deng, J.; Bae, C. Failure behavior of prismatic Li-ion battery cells under abuse loading condition—A combined experimental and computational study. J. Energy Storage 2022, 48, 103969. [Google Scholar] [CrossRef] [Scilit]
- Xia, H.; Sun, Q.; Wang, S. Influence of strain rate effect on energy absorption characteristics of bio-inspired honeycomb column thin-walled structure under impact loading. Case Stud. Constr. Mater. 2023, 18, e01761. [Google Scholar] [CrossRef] [Scilit]
- Ding, H.; Xie, S.; Wang, H.; Jing, K.; Zhang, J.; Yan, H.; Zhang, F.; He, G. In-plane energy absorption capacity of a novel locally enhanced re-entrant honeycomb metamaterial. Thin-Walled Struct. 2025, 210, 113062. [Google Scholar] [CrossRef] [Scilit]
- Li, Z.; Li, H.; Yang, Y.; Ren, C.; Zhang, H.; Wang, H.; Zhou, J.; Zhou, B.; Guan, Z. Investigation of impact and vibration behaviours of composite honeycomb sandwich shell panels with foam reinforcement. Mech. Syst. Signal Process. 2025, 232, 112676. [Google Scholar] [CrossRef] [Scilit]
- Wu, J.; Li, S.; Yu, L.; Jing, H.; Hu, L.; Zhang, B.; Liu, A.; Zhang, H.; Yin, Q. Enhanced dynamic strength and energy absorption in cement-based composites via 3D-printed honeycomb structures. Constr. Build. Mater. 2025, 498, 144027. [Google Scholar] [CrossRef] [Scilit]
- Gupta, V.; Kidane, A.; Sutton, M. Dynamic characteristics of density-graded cellular materials for impact mitigation. Int. J. Solids Struct. 2024, 296, 112816. [Google Scholar] [CrossRef] [Scilit]
- Zhi, M.; Liu, Q.; Xu, Q.; Pan, Z.; Sun, Q.; Su, B.; Zhao, H.; Cui, H.; He, Y. Review of prevention and mitigation technologies for thermal runaway in lithium-ion batteries. Aerosp. Traffic Saf. 2024, 1, 55–72. [Google Scholar] [CrossRef] [Scilit]
- Schneider, J.; Schiffer, A.; Hafeez, F.; Kumar, S. Dynamic crushing of tailored honeycombs realized via additive manufacturing. Int. J. Mech. Sci. 2022, 219, 107126. [Google Scholar]
- Al Ali, A.; Arhore, E.; Ghasemnejad, H.; Yasaee, M. Experimental and numerical investigation of multi-layered honeycomb sandwich composites for impact mechanics applications. Results Eng. 2024, 21, 101817. [Google Scholar] [CrossRef] [Scilit]
- Finck, N.S.; Fraga, M.A.A.; Correr, A.B.; Moreira, T.A.; Dalmaschio, C.J.; Ramagem, V.O.; Moraes, R.R. Comparative evaluation of mechanical and thermal properties of 3D-printed restorative polymers: Effects of resin type, printer technology, and post-curing time. J. Mech. Behav. Biomed. Mater. 2025, 172, 107166. [Google Scholar] [CrossRef] [Scilit]
- Zhou, H.; He, N.; Zhang, D.Z.; Zhao, M.; Zhang, T.; Ma, X. Mechanical properties of functionally graded rotating lattice structures fabricated with SLM process. Mater. Today Commun. 2022, 33, 104740. [Google Scholar] [CrossRef] [Scilit]
- Yang, K.; Li, Z.; Ge, D. Quasi-static and dynamic out-of-plane crashworthiness of 3D curved-walled mixed-phase honeycombs. Thin-Walled Struct. 2023, 182, 110305. [Google Scholar] [CrossRef] [Scilit]
- Benedetti, M.; Plessis, A.D.; Ritchie, R.O.; Dallago, M.; Razavi, N.; Berto, F. Architected cellular materials: A review on their mechanical properties towards fatigue-tolerant design and fabrication. Mater. Sci. Eng. R Rep. 2021, 144, 100606. [Google Scholar] [CrossRef] [Scilit]
- Wang, X.; Li, Z.; Sun, H.; Xie, Y.; Kang, Z.; Su, X. Enhancement of a dual-directional graded honeycomb under dynamic crushing velocity. Eur. J. Mech.-A/Solids 2025, 111, 105562. [Google Scholar] [CrossRef] [Scilit]
- Mallek, H.; Mellouli, H.; Allouch, M.; Wali, M.; Dammak, F. Energy absorption of 3D-printed PETG and PETG/CF sandwich structures with cellular cores subjected to low-velocity impact: Experimental and numerical analysis. Eng. Struct. 2025, 327, 119653. [Google Scholar] [CrossRef] [Scilit]
- Liu, Y.; Zhao, C.; Xu, C.; Ren, J. Shape recovery effect and energy absorption of reusable honeycomb structures. Compos. Struct. 2025, 352, 118708. [Google Scholar] [CrossRef] [Scilit]
- Tarfaoui, M.; Daly, M.; Kbaier, R.; Chihi, M. Investigation of 3D printed CF-PETG composites’ tensile behaviors: Synergizing simulative and real-world explorations. Compos. Sci. Technol. 2024, 247, 110385. [Google Scholar] [CrossRef] [Scilit]
- Liu, H.; Zhang, E.T.; Wang, G.; Ng, B.F. In-plane crushing behavior and energy absorption of a novel graded honeycomb from hierarchical architecture. Int. J. Mech. Sci. 2022, 221, 107202. [Google Scholar] [CrossRef] [Scilit]
- Abd El-baky, M.A.; Abd El-Halim, M.F.; Allah, M.M.A. Experimental investigation of material Synergy: Influence of 3D printing parameters on the lateral crash performance of cellular structures stuffed in aluminum tubes. Compos. Part B Eng. 2025, 307, 112902. [Google Scholar] [CrossRef] [Scilit]
- Albak, E.İ. Crashworthiness Performance of Bamboo-Inspired 3D-Printed Tubes: Effects of Infill Pattern, Infill Ratio, Wall Thickness, and Inner Diameter. Biomimetics 2025, 10, 702. [Google Scholar] [CrossRef] [Scilit]
- Du, W.; Ma, T.; Lu, L.; Song, H.; Liu, Y.; Yang, L.; Huang, C. Inverse multi-parameter analysis of oblique incidence laser interaction based on a multivariate thermal-mechanical response. Thin-Walled Struct. 2025, 210, 112970. [Google Scholar] [CrossRef] [Scilit]
- Bogahawaththa, M.; Mohotti, D.; Hazell, P.J.; Wang, H.; Wijesooriya, K.; Lee, C.K. Energy absorption and mechanical performance of 3D printed Menger fractal structures. Eng. Struct. 2024, 305, 117774. [Google Scholar] [CrossRef] [Scilit]
- He, Y.; Chen, C.; Sun, J.; Lu, M.-H.; Chen, Y.-F.; Li, X. Deformation and failure of 3D-Printed origami-inspired sandwich beam under blast loading. Int. J. Impact Eng. 2025, 206, 105471. [Google Scholar] [CrossRef] [Scilit]
- Xu, S.; Fu, Q.; Guang, X.; Huang, H.; Deng, X. Performance study of two-ways gradient octagonal hierarchical honeycomb with excellent energy absorption and crashworthiness properties. J. Ind. Inf. Integr. 2025, 47, 100925. [Google Scholar] [CrossRef] [Scilit]
- Alarifi, I.M. PETG/carbon fiber composites with different structures produced by 3D printing. Polym. Test. 2023, 120, 107949. [Google Scholar] [CrossRef] [Scilit]
- Dağlı, S. Mechanical Characterization and Interface Evaluation of Multi-Material Composites Manufactured by Hybrid Fused Deposition Modeling (HFDM). Polymers 2025, 17, 1631. [Google Scholar] [CrossRef] [Scilit] [PubMed]
- Dziewit, P.; Rajkowski, K.; Płatek, P. Effects of Building Orientation and Raster Angle on the Mechanical Properties of Selected Materials Used in FFF Techniques. Materials 2024, 17, 6076. [Google Scholar] [CrossRef] [Scilit]
- Chang, B.; Wang, Z.; Bi, G. Study on the Impact Resistance of the Honeycomb Composite Sandwich Structure by a Fragment Flight Angle. Appl. Sci. 2024, 14, 11218. [Google Scholar] [CrossRef] [Scilit]
- Mirzaei, J.; Zarei, H.R.; Khodamoradi, M.K. Experimental analysis of energy absorption characteristics in composite sandwich structures with 3D-printed honeycomb core under quasi-static compression. J. Thermoplast. Compos. Mater. 2025, 38, 3891–3914. [Google Scholar] [CrossRef] [Scilit]
- Ha, N.S.; Tran, T.T.; Lee, T.-U.; Giustozzi, F.; Xie, Y.M.; Xiang, X. Sustainable polycarbonate hierarchical square honeycomb structures for energy absorption. Thin-Walled Struct. 2025, 217, 113830. [Google Scholar] [CrossRef] [Scilit]
- Song, M.; Li, L.; Feng, J.; Zeng, X.; Wu, J. The structural mechanical analysis and test research on the ramp area of the composite honeycomb panel. J. Phys. Conf. Ser. 2025, 3098, 012004. [Google Scholar] [CrossRef] [Scilit]
- Qu, C.; Yan, Q.; Zou, X.; Gou, D.; Liu, X. Experimental Study on Modal Testing Methods for Typical Composite Honeycomb Sandwich Structures. Int. J. Front. Eng. Technol. 2024, 6, 13–24. [Google Scholar] [CrossRef] [Scilit]
- Ciolca, M.; Cormos, R.; Neagoe, C.A.; Hadar, A. A Comparative Study on the Finite Element Analysis of Multilayered Honeycomb Composite Materials for Aerospace Structures. Materials 2025, 18, 1744. [Google Scholar] [CrossRef] [Scilit] [PubMed]
- Britto, J.J.J.; Vasanthanathan, A.; Krishnasamy, S.; Amudhan, K. Mechanical property study of 3D printed honeycomb structures with carbon fiber reinforcement: A finite element analysis and experimental approach. Discov. Mater. 2025, 5, 104. [Google Scholar] [CrossRef] [Scilit]
- Chihi, M.; Tarfaoui, M.; Qureshi, Y.; Daly, M.; Bouraoui, C. Experimental investigation of the effect of infill parameters on dynamic compressive performance of 3D-Printed carbon fiber reinforced polyethylene terephthalate glycol composites. J. Thermoplast. Compos. Mater. 2024, 37, 3158–3184. [Google Scholar] [CrossRef] [Scilit]

Disclaimer/Publisher’s Note: The statements, opinions and data contained in all publications are solely those of the individual author(s) and contributor(s) and not of MDPI and/or the editor(s). MDPI and/or the editor(s) disclaim responsibility for any injury to people or property resulting from any ideas, methods, instructions or products referred to in the content. |
© 2026 by the authors. Licensee MDPI, Basel, Switzerland. This article is an open access article distributed under the terms and conditions of the Creative Commons Attribution (CC BY) license.