


Abstract
Atmospheric plasma-sprayed FeCrAl coatings possess heterogeneous lamellar structures whose characterization is important for interpreting friction and wear. This study compared four as-sprayed FeCrAl coatings produced at nominal powder feed rates of 25–40 g/min and a common stand-off distance of 150 mm. The objective was to compare their microstructural and surface characteristics with their room-temperature dry-sliding responses, particularly the correspondence between friction and wear rankings. The coatings were examined using SEM/EDS, X-ray diffraction, cross-sectional image analysis, surface profilometry, instrumented indentation, and ball-on-disk testing. Mean coating thicknesses ranged from 162 to 702 µm, while region-specific apparent porosity estimates ranged from 0.38 to 1.49%. The coatings exhibited heterogeneous lamellar microstructures and broadly similar diffraction patterns dominated by an α-Fe-type bcc matrix containing Cr, with additional reflections assigned to Fe3O4. The mean Ra values ranged from 22.83 ± 0.13 to 26.91 ± 0.36 µm (mean ± SD, n = 3), and individual indentations revealed substantial variation in local mechanical response. F3 exhibited the lowest measured specific wear rate of 1.051 × 10⁻⁴ mm3/(N·m) among the tested specimens. F4 showed the lowest approximate post-running-in friction coefficient of 0.77–0.80, whereas F1 exhibited the highest measured specific wear rate of 1.982 × 10⁻⁴ mm3/(N·m). Thus, the friction and wear rankings differed, and neither the measured roughness nor the region-specific apparent porosity alone accounted for the wear ranking. These findings characterize the tested specimens; one sliding test per coating and incomplete deposition records preclude establishing reproducibility or attributing the differences exclusively to powder feed rate.
1. Introduction
The demand for high-performance surface coatings has continued to increase in industrial applications experiencing harsh plasma, synergistic, corrosive, or mechanical conditions. One alloy system that has gained global interest in recent years is the Iron-Chromium-Aluminum (FeCrAl) alloy. The combination of chromium with aluminum in a ferrous matrix offers excellent high-temperature oxidation and corrosion resistance, as well as acceptable mechanical stability. Such properties make FeCrAl coatings highly promising candidates for protective coating applications in chemically aggressive environments. Iron–Chromium–Aluminum (FeCrAl) alloys have attracted sustained research interest as coating materials precisely because they satisfy this requirement through a well-understood protective mechanism. At elevated temperatures, selective oxidation of aluminum within the FeCrAl matrix produces a dense, adherent α-Al2O3 scale whose parabolic growth kinetics progressively slow oxygen ingress, providing a self-limiting diffusion barrier [1,2]. Chromium plays an equally important role: through the so-called third-element effect, it reduces the critical aluminum content needed to sustain a continuous alumina scale, enhances scale adhesion, and stabilizes the protective layer against spallation in steam-rich or cyclically heated atmospheres [2]. These features have established FeCrAl coatings as strong candidates for high-temperature applications including boiler tubes, heat exchangers, turbine blades, and nuclear fuel cladding [3,4,5].
Although FeCrAl coatings are considered for high-temperature protective applications, the present study does not reproduce the operating conditions of a specific industrial component. Such applications provide the broader motivation for investigating this coating system. The room-temperature dry-sliding tests were used to compare the responses of the as-sprayed coating surfaces under controlled laboratory conditions and establish baseline data before thermal exposure. Consequently, the test temperature, contact configuration, and counterbody should not be regarded as representative of all the high-temperature applications mentioned above. The laboratory assessment used a 100Cr6 steel ball sliding against the FeCrAl coating in air at 25.04–26.36 °C under a normal load of 6 N. This contact was not selected to reproduce a specified service contact pressure or material pair; therefore, the results provide a room-temperature comparison of the investigated coatings rather than a simulation of high-temperature operating conditions.
Among the deposition methods available for FeCrAl coatings, atmospheric plasma spraying (APS) has become one of the most widely adopted because of its high deposition efficiency, material versatility, and scalability to large industrial components [6]. In APS, a direct-current (DC) plasma torch ionizes the plasma-forming gas to generate a high-enthalpy jet that heats feedstock powder particles to molten or semi-molten states and propels them toward the substrate at velocities of 80–300 m/s [7]. When the molten or semi-molten particles strike the substrate, they spread rapidly and form thin, lamellar layers known as splats. These splats solidify within microseconds and gradually build the coating structure through successive deposition. Because the particles travel through the surrounding atmosphere, partial oxidation during flight is unavoidable. Oxygen can dissolve into the molten particles and react with Fe, Cr, and Al. This reaction promotes the formation of oxide phases, which become distributed between and within the individual splat layers [8]. The type and proportion of oxides that form depend strongly on local oxygen partial pressure, particle dwell time in the plasma, and cooling rate. During successive APS deposition, local thermal and oxidation conditions may vary as coating build-up proceeds. Recent modelling by Zhu, Becker, and Baeva examined bidirectional coupling between the plasma jet and injected particles, showing that particle loading can affect the jet temperature and velocity at high powder feed rates [9]. This highlights the importance of plasma–particle interactions when interpreting coating formation, although these interactions were not measured in the present study. In a related arc-discharge system, Saifutdinov and Timerkaev modelled an argon–methane plasma while accounting for electrode evaporation [10]. Although their study concerned nanostructure synthesis rather than APS coating deposition, it illustrates the coupling between electrode processes and plasma composition.
XRD analysis of plasma-sprayed coatings consistently reveals a multiphase structure that reflects the non-equilibrium conditions of the APS process. Kengesbekov et al. [8] deposited Fe–Cr–Al coatings by APS and reported XRD patterns containing metallic (Fe and Cr) solid solution along with iron oxide phases Fe3O4, FeO, and the spinel Fe2+Cr2O4. They found that partial in-flight oxidation is intrinsic to the process regardless of metallic powder composition. The higher Cr–Al composition (68Fe–26Cr–6Al) also resulted in the formation of α-Al2O3 and Cr2O3 phases. The formation of these oxide phases requires sufficient Cr and Al activity in the coating material. Their formation was further promoted by the higher plasma enthalpy and longer particle residence time in the plasma jet [8]. Lu et al. [11] reported similar lamellar microstructures in APS Fe-Cr-B-C coatings. Their coatings consisted of an α-Fe matrix together with hard secondary phases and XRD results showed that the spraying parameters strongly influenced the bonding strength but had a relatively limited effect on the phase composition. These findings suggest that phase formation is governed primarily by the material’s thermochemical characteristics and the oxidation environment during spraying. Mehmood et al. [12] identified mixed spinel oxide phases (AB2O4, where A = Fe/Co/Ni and B = Al/Cr) in as-sprayed NiCoCrAlFe high-entropy alloy coatings produced by APS. Their findings confirm that spinel formation occurs during APS. Moreover, this phenomenon is not limited to binary oxide systems but is generally observed in Fe–Cr–Al-containing alloys. Iron oxide phases including wüstite (FeO) and magnetite (Fe3O4) can be distinguished by their characteristic Fe2+ and Fe3+ oxidation states and corresponding X-ray photoelectron spectroscopy (XPS) signatures. The oxidation state of iron provides valuable information regarding oxide formation during plasma spraying [13,14].
Hardness in plasma-sprayed Fe-based coatings is mainly determined by the alloy composition, oxide formation, and rapid solidification during deposition. Lu et al. [11] reported microhardness values of approximately 820–860 HV0.1 for APS Fe–Cr–B–C coatings under different spraying conditions. The variations in spray current, gas flow rate, and spray distance produced only a limited change in hardness. This suggests that once the coating composition and microstructure are established, moderate changes in the processing parameters have a relatively small effect on the final hardness. Li et al. [6] also reported high hardness values for plasma-sprayed Cr/FeCrAl dual-layer coatings. They attributed the high hardness mainly to the dense lamellar microstructure formed during the APS process. Similarly, Zhong et al. [15] reported hardness values of approximately 1180 HV for plasma-sprayed FeCrMoSi amorphous coatings. The high hardness was primarily attributed to the large fraction of the amorphous phase and to additional oxide strengthening associated with the formation of Fe3O4, as identified by XRD.
The tribological behavior of plasma-sprayed coatings depends on several interconnected factors. These include surface roughness, coating density, porosity, microstructure, and phase composition. Surface roughness is especially important during the initial running-in stage. A rough surface produces more asperity interactions and higher local contact stresses. As sliding progresses, however, the phases present in the coating become increasingly important. Hard and brittle oxides, such as Cr2O3 and Al2O3, can fracture under repeated contact. The resulting fragments may remain in the contact zone as loose debris. These particles can act as third-body abrasives and influence both the coefficient of friction (CoF) and the wear rate.
Bejinariu et al. [16] investigated the tribological behavior of atmospheric plasma-sprayed (APS) Al2O3 coatings. They observed a rapid increase in the CoF during the initial running-in period. The CoF then gradually stabilized during steady-state sliding. Bastakys et al. [17] reported a steady-state CoF of approximately 0.50 for APS Cr2O3-based composite coatings under a normal load of 1 N. Their results also showed that the formation, fracture, and removal of oxide particles influenced the wear behavior during sliding. Wang et al. [18] studied plasma-sprayed Cr and FeCrAl coatings developed for zirconium fuel-cladding applications. Their results showed the formation of dense oxide layers and emphasized the importance of oxide phases in determining coating performance under severe operating conditions. Rakhadilov et al. [19] also showed that the tribological behavior of APS Fe–Al–Cr intermetallic coatings was strongly affected by the spraying conditions. Changes in the spray parameters altered the coating microstructure, porosity, and oxide distribution. These changes led to corresponding variations in the coefficient of friction and wear resistance. Luo et al. [20] investigated plasma-sprayed Fe-based amorphous coatings and reported that increasing the plasma power produced denser coatings with lower porosity and higher oxide content. However, the wear rate also increased. They attributed this behavior to changes in the coating microstructure and oxide content caused by the higher plasma power.
Previous studies on the post-processing of plasma-sprayed FeCrAl coatings have also highlighted the importance of phase evolution and oxide distribution. Li et al. [6] showed that post-processing of Cr/FeCrAl dual-layer coatings on Zr substrates reduced porosity, increased hardness, and improved oxidation resistance at 1200 °C. These improvements were associated with changes in the oxide distribution at the splat interfaces. Similarly, Ndumia et al. [21] reported that heat treatment of arc-sprayed FeCrAl/Al coatings promoted the formation of FeAl intermetallic phases. This resulted in improved hardness and wear resistance. Lu et al. [11] reported wear rates as low as 0.62 × 10⁻⁵ mm3/N·m for APS Fe–Cr–B–C coatings. They attributed the excellent wear resistance to hard (Fe,Cr)2(B,C) dispersoids that strengthened the α-Fe matrix without significantly increasing the coefficient of friction. This difference suggests that the type and distribution of the strengthening phases play an important role in determining the tribological behavior of plasma-sprayed Fe-based coatings. Kengesbekov et al. [22] further demonstrated that relatively small changes in the spraying conditions, particularly the arc current and working gas flow rate, can affect coating density, porosity, phase composition, and tribological behavior. Their findings highlight the importance of carefully controlling the spraying conditions when optimizing coating performance.
Previous studies [8,19] have investigated the effects of powder composition and spraying parameters on FeCrAl-containing coatings. The present work compares four as-sprayed FeCrAl coatings produced at nominal powder feed rates of 25–40 g/min. The comparison focuses on how their measured microstructural and surface characteristics relate to friction and material loss under a common room-temperature dry-sliding protocol. Particular attention is given to whether the coatings exhibit the same ranking in terms of friction coefficient and specific wear rate.
The aim of this study was to compare the microstructure, phase constitution, surface characteristics, local indentation response, and room-temperature tribological behavior of four atmospheric plasma-sprayed FeCrAl coatings produced at different powder feed rates. The measured structural and surface characteristics were considered alongside the friction coefficient and specific wear rate to assess the correspondence between the friction and wear rankings.
2. Materials and Methods
2.1. Coating Preparation
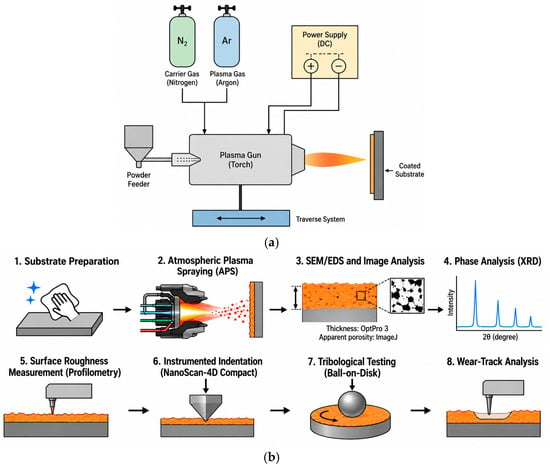
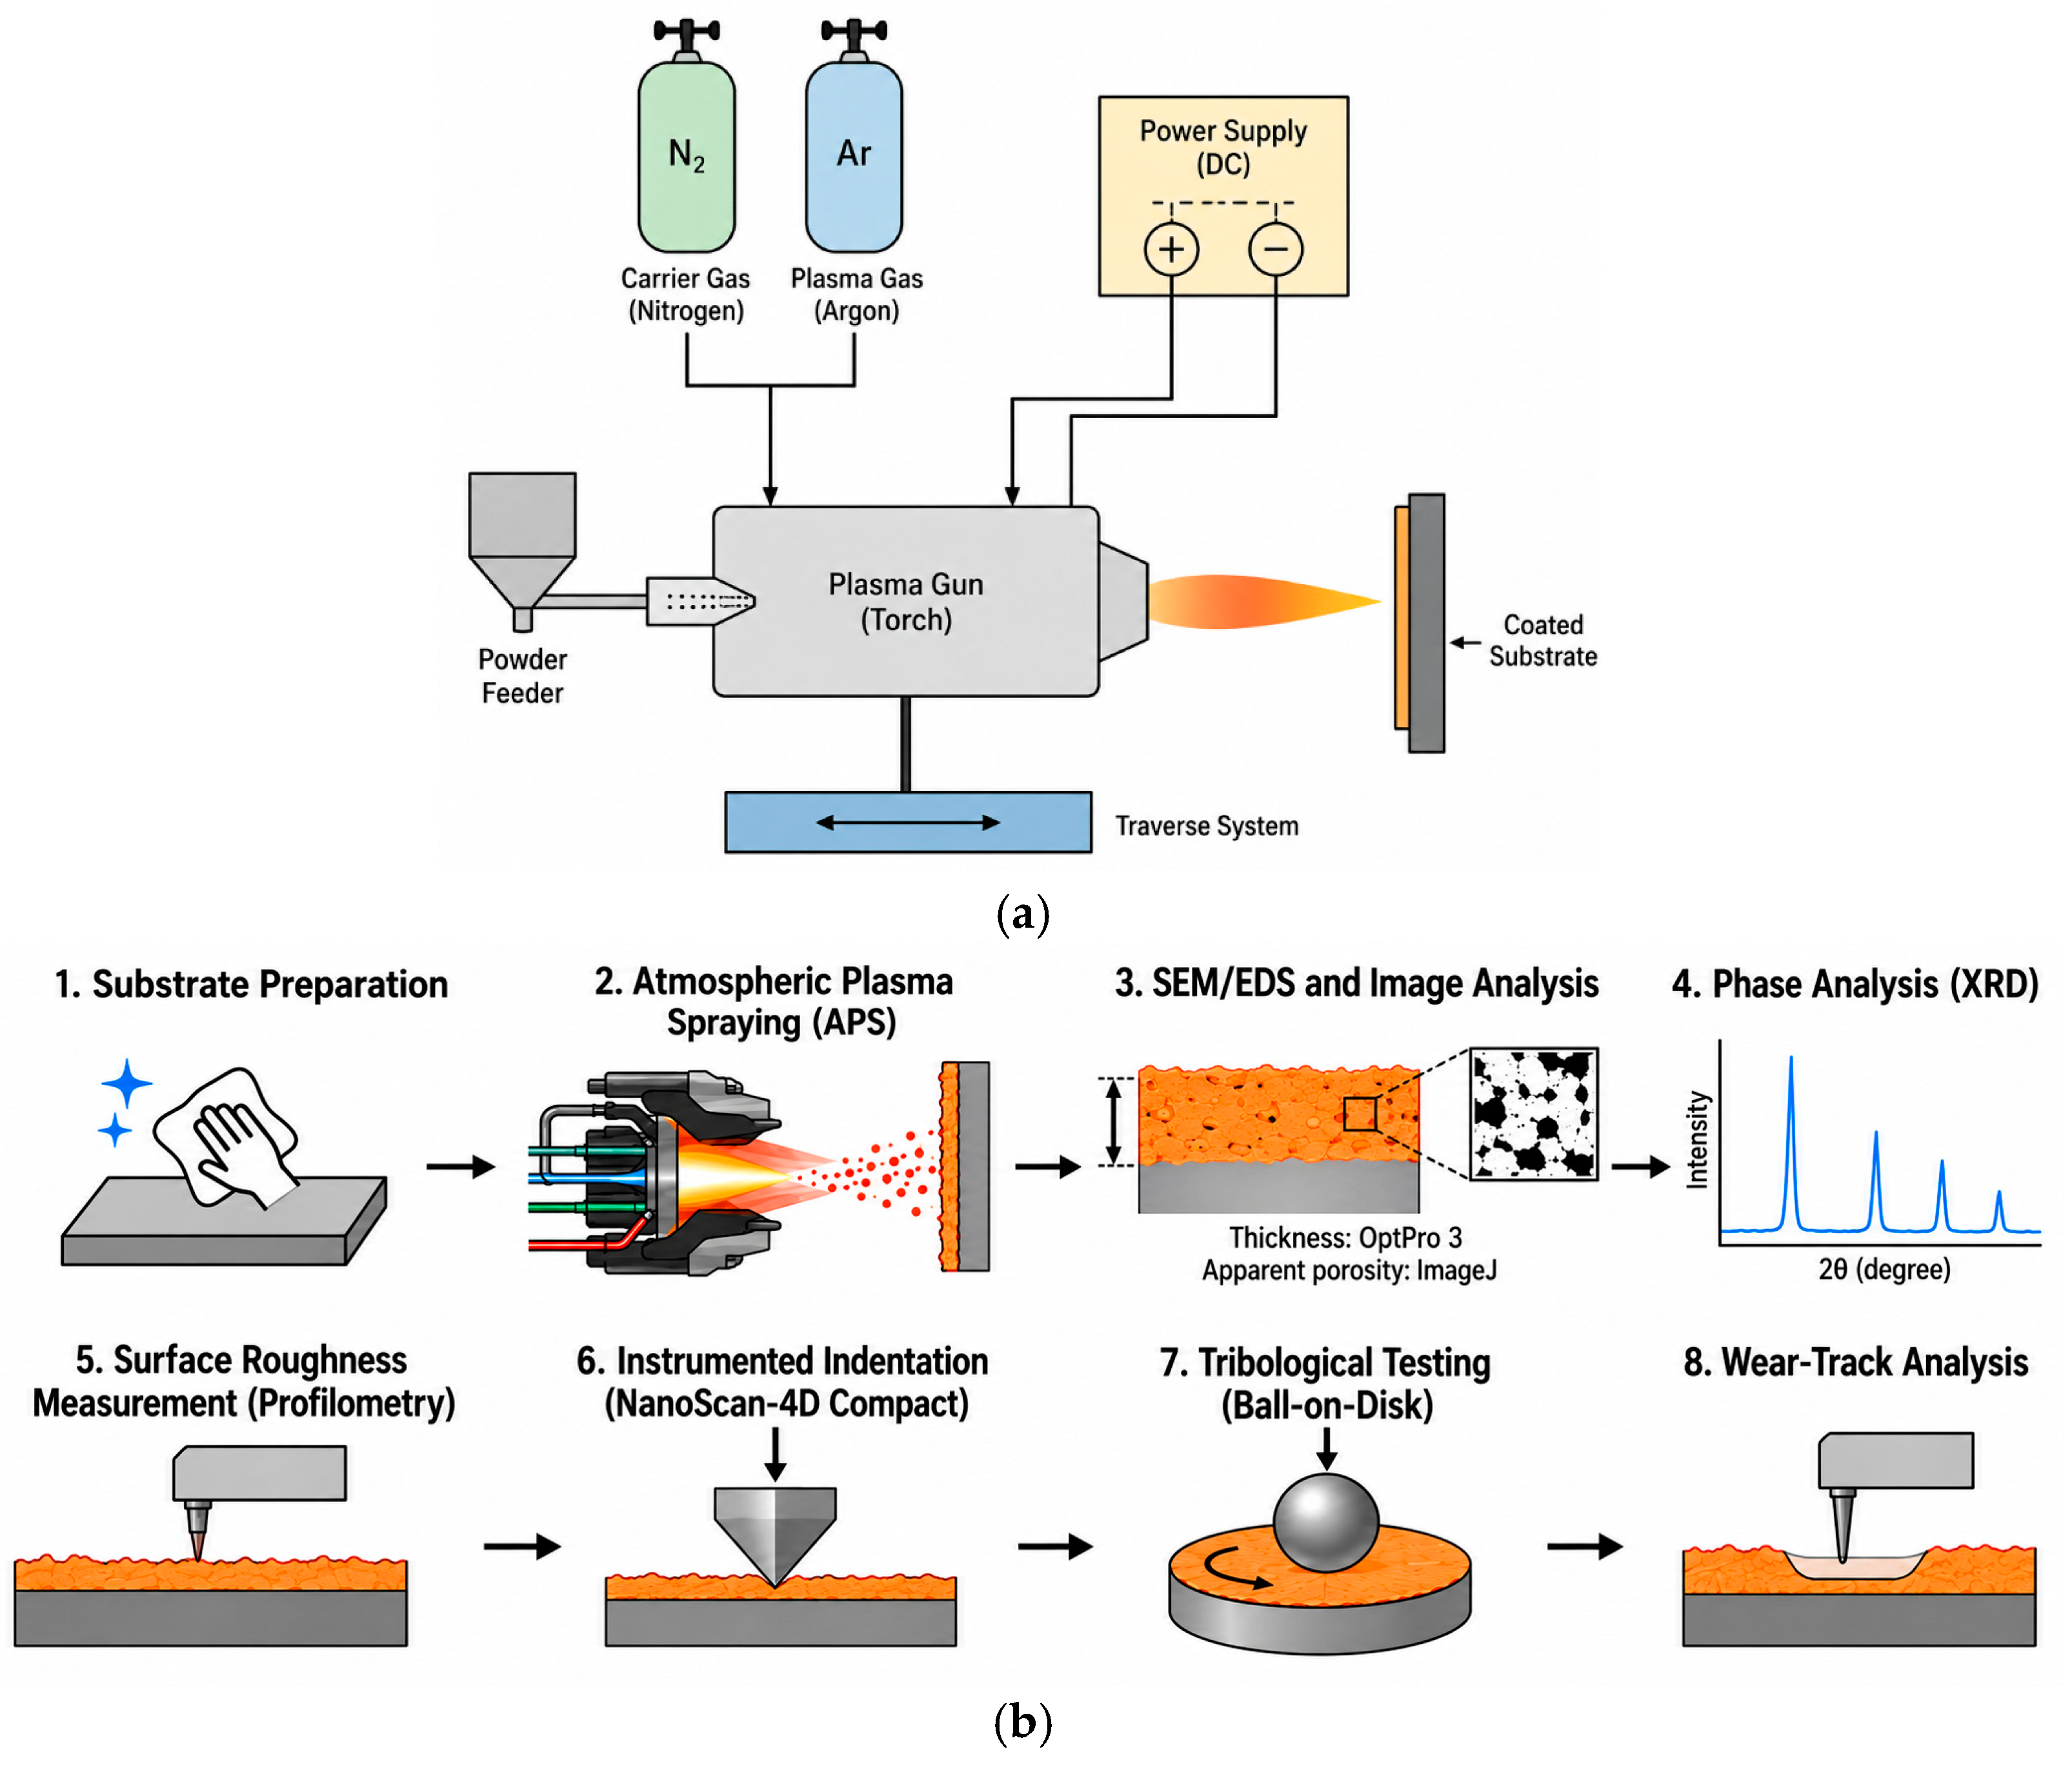
FeCrAl coatings were deposited onto carbon steel substrates measuring 40 × 40 × 4 mm by atmospheric plasma spraying (APS) using an F4-MB plasma torch (Sulzer Metco, Winterthur, Switzerland). Before deposition, the substrate surfaces were sequentially ground using abrasive papers with grit sizes ranging from 100 to 2500, degreased with acetone, and grit-blasted to promote coating adhesion. Argon was used as the primary plasma-forming gas, while nitrogen served as the powder carrier gas. The deposition parameters are summarized in Table 1. Figure 1 illustrates the APS system and the experimental workflow.
Table 1.
Atmospheric plasma spraying parameters used for deposition of all FeCrAl coating specimens.
Figure 1.
(a) Schematic illustration of the atmospheric plasma spraying (APS) system used for FeCrAl coating deposition; (b) experimental workflow including substrate preparation, APS coating deposition, SEM/EDS characterization, coating thickness measurement, apparent porosity analysis, XRD phase analysis, surface profilometry, instrumented indentation, ball-on-disk tribological testing, and wear-track analysis.
Four FeCrAl coating specimens (F1–F4) were produced in separate atmospheric plasma spraying runs. The nominal powder feed rates set during deposition were 40, 25, 35, and 30 g/min for F1, F2, F3, and F4, respectively. No automated deposition-parameter logs were generated. The stand-off distance was 150 mm for all specimens. The nominal torch current and voltage were 520 A and 65 V, respectively. Argon was used as the primary plasma-forming gas at 33 L/min, while nitrogen served as the powder carrier gas at 9 L/min. The substrate preheating temperature was 200 °C. The deposition parameters are summarized in Table 1. The resulting coatings were characterized to compare their microstructure, phase constitution, surface characteristics, and room-temperature friction and wear behavior.
The coated samples were prepared for microstructural examination using standard metallographic procedures. First, the samples were cold-mounted in epoxy resin. They were then ground and polished using a semi-automatic polishing machine under controlled force and rotational speed. The final polishing step was carried out using a MIRKA 5424105018 abrasive pad (Mirka Ltd., Jeppo, Finland). An oxide polishing suspension (OPS) containing colloidal silica was used during the final polishing stage. This procedure produced flat and scratch-free surfaces suitable for high-resolution microscopy. Proper surface preparation was essential for observing the coating surface, the coating-substrate interface, and the cross-sectional microstructure.
The nominal deposition settings are summarized in Table 1. Additional details, including deposition duration, torch traverse speed, number of passes, nozzle and powder injection geometry, spray angle, and substrate cooling conditions, were unavailable. The results are therefore interpreted as a comparison of the obtained coatings rather than an isolated assessment of the powder-feed-rate effect.
2.2. Characterization and Testing Methods
The coatings were characterized using SEM/EDS, X-ray diffraction (XRD), surface profilometry, instrumented indentation, and ball-on-disk tribometry. Cross-sectional image analysis was additionally used to measure coating thickness and estimate apparent porosity. These methods were used to compare the microstructure, elemental composition, phase constitution, surface roughness, local mechanical response, and tribological behavior of the four coatings.
The coating microstructure was examined on polished cross-sections using a TESCAN VEGA 4 scanning electron microscope (TESCAN, Brno, Czech Republic) equipped with an energy-dispersive X-ray spectroscopy (EDS) system. SEM images were acquired at an accelerating voltage of 20 kV, working distances of 14.57–15.81 mm, and nominal magnifications of 283–1010× using secondary-electron and backscattered-electron imaging. EDS was used to map Fe, Cr, Al, and O. The elemental compositions reported in Table 2 were obtained from the summed spectra of the EDS maps and are expressed in atomic percent.
Coating thickness was measured using OptPro 3 on SEM images calibrated against their scale bars. Three spatially separated measurements were taken perpendicular to the coating–substrate interface for each specimen. Results are reported as mean ± standard deviation, representing local thickness variation.
Apparent porosity was estimated in ImageJ software (version:1.54d) using grayscale threshold segmentation. One cross-sectional region restricted to the coating was analyzed per specimen, excluding the substrate and the area above the coating surface. The area fraction of dark features classified as pores was calculated from the resulting binary image. No standard deviations were calculated because only one region was analyzed per specimen. These region-specific estimates depend on image resolution and threshold selection and may include other dark features that could not be distinguished from pores.
X-ray diffraction (XRD) analysis was performed using an X’PertPro diffractometer (Philips Corporation, Amsterdam, The Netherlands) with Cu Kα radiation (λ = 1.5406 Å). The X-ray tube was operated at 40 kV and 30 mA. Diffraction patterns were recorded over a 2θ range of approximately 20–90°, with a step size of 0.02° and a counting time of 0.5 s per step. The diffraction data were processed using HighScore Plus 3.0esoftware package with the PDF-2 database (ICDD). Phase identification was performed by comparison with reference diffraction patterns from the ICDD Powder Diffraction File database. The bcc metallic reflections at approximately 2θ = 44.7°, 65.0°, and 82.3° were indexed to the (110), (200), and (211) planes, respectively, and were interpreted as an α-Fe-type bcc Fe–Cr solid solution (reference α-Fe pattern: PDF No. 06-0696). Magnetite (Fe3O4) was identified from characteristic reflections at approximately 30.1° (220), 35.5° (311), 43.0° (400), 53.4° (422), 57.1° (511), and 62.7° (440), consistent with PDF No. 19-0629. Because the Fe- and Cr-rich bcc reflections strongly overlap, separate quantitative identification of α-Fe and a distinct Fe–Cr phase was not attempted. No quantitative phase-fraction analysis or Rietveld refinement was performed.
Surface roughness was measured using a contact-type profilometer from the SSR300 series (Shenzhen Taijin Precision Instrument Co., Ltd., Shenzhen, China). Three roughness profiles were recorded at different locations on each coating specimen at a traverse speed of 2.0 mm/s. The instrument reports specified a sampling length of 8 mm and an evaluation length of 16 mm. The filter was designated as DP, with a reported transmission band of 0.025–8. The Ra values are reported as the mean ± sample standard deviation (SD) of the three measurements (n = 3). The standard deviations describe the variability between the measured locations within each specimen.
Instrumented indentation measurements were performed on polished cross-sections of the coatings using a NanoScan-4D Compact nanohardness tester (Moscow, Russia) equipped with a diamond Berkovich indenter. The nominal maximum load was approximately 100 mN. The data were processed using NanoScan Viewer v.200 to obtain hardness and elastic modulus. The HV values were calculated by the instrument software and were not obtained from separate conventional Vickers microhardness measurements. Each plotted data point represents an individual indentation, plotted against its maximum penetration depth. The measurements therefore characterize local indentation responses rather than a continuous depth profile. Independent coating replicates were not tested. The datasets contained 46, 35, 23, and 27 unique indentation records for F1, F2, F3, and F4, respectively. Duplicate export entries referring to the same measurement file were counted once. Descriptive statistics were calculated as the mean ± sample standard deviation across unique indentations, with all unique measurements retained. These statistics characterize within-specimen scatter and do not establish reproducibility between independently deposited coatings.
The tribological properties of the APS FeCrAl coatings were evaluated using a TRB3 tribometer (Anton Paar, Graz, Austria) under dry-sliding conditions in air at room temperature (25.04–26.36 °C). All tests were performed under a normal load of 6 N, at a linear sliding speed of 3 cm/s, with a wear-track radius of 1.5 mm and a total sliding distance of 100 m. A 100Cr6 steel ball with a diameter of 3 mm was used as the counterbody and cleaned with ethanol before testing. Before each subsequent test, the ball was rotated to bring a previously unused surface region into contact with the coating. The coefficient of friction was continuously recorded at a sampling rate of 10 Hz. After the sliding tests, wear-track profiles were measured using a Surtronic S128 contact profilometer (Taylor Hobson, Leicester, UK). The instrument settings displayed a measurement length of 2.50 mm, a Gaussian filter with a cutoff wavelength of 2.50 mm, and a vertical range of 400 µm. The wear volume was calculated as V = A × 2πr, where A is the wear-track cross-sectional area and r is the track radius. The specific wear rate was calculated as k = V/(F × s), where F = 6 N and s = 100 m. One test was performed for each coating specimen. Therefore, test-to-test variability could not be assessed. A common test protocol was used for all four coatings to compare friction and material loss under the same laboratory contact conditions. The coefficient of friction was recorded during each sliding test, and wear was evaluated from the resulting wear track. These tests provide a comparative assessment at room temperature and were not intended to reproduce a specific industrial operating condition. The specific wear rates are therefore reported as individual results without standard deviations, and comparisons are limited to the tested specimens.
The normal load of 6 N, sliding speed of 3 cm/s, and sliding distance of 100 m are consistent with those reported in a published study of atmospheric plasma-sprayed Fe–Al–Cr coatings [19]. However, that study used a track radius of 4 mm, whereas the present tests used a radius of 1.5 mm. The reference therefore provides context for the selected load, speed, and distance, rather than an identical contact configuration.
The experimental scope was limited to the as-sprayed coatings tested at room temperature. No sliding tests at elevated temperatures or after thermal exposure were performed. Consequently, the present measurements do not establish the effects of thermal exposure on friction and wear and cannot be directly extrapolated to high-temperature service.
For the quantitative wear calculation, the wear-track cross-sectional areas were 12,621.9, 8745.0, 6692.7, and 10,179.0 µm2 for F1, F2, F3, and F4, respectively. Using V = A × 2πr and k = V/(F × s), with r = 1.5 mm, F = 6 N, and s = 100 m, the corresponding specific wear rates were 1.982 × 10⁻⁴, 1.373 × 10⁻⁴, 1.051 × 10⁻⁴, and 1.599 × 10⁻⁴ mm3/(N·m), respectively.
Only the final cross-sectional wear-area value for each specimen was retained in the original test records; the individual profile traces and their measurement positions were not preserved. Consequently, the number and spatial distribution of the profiles used to obtain the reported area cannot be reconstructed retrospectively, and an independent uncertainty of the cross-sectional area cannot be calculated from the available records. The reported wear-rate values should therefore be interpreted as single-test quantitative measurements rather than as statistically replicated wear data.
Descriptive statistics were calculated where multiple local measurements were available. The mean coating thickness and its standard deviation describe three local measurements within one examined cross-section per specimen and do not represent independent deposition replicates. Individual hardness indentations characterize local mechanical responses and do not constitute independent coating replicates. Surface roughness statistics describe variation among three profiles recorded at different locations on each specimen. One sliding test was performed per coating; successive friction data points within that test are not independent test repeats. Therefore, the reproducibility and statistical significance of the differences among coatings could not be established.
3. Results & Discussion
3.1. Microstructural Characterization
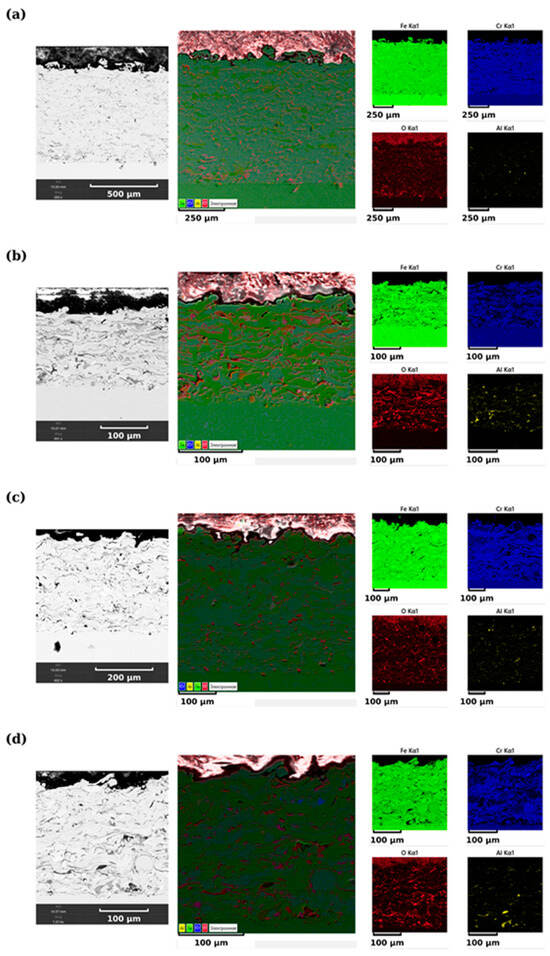
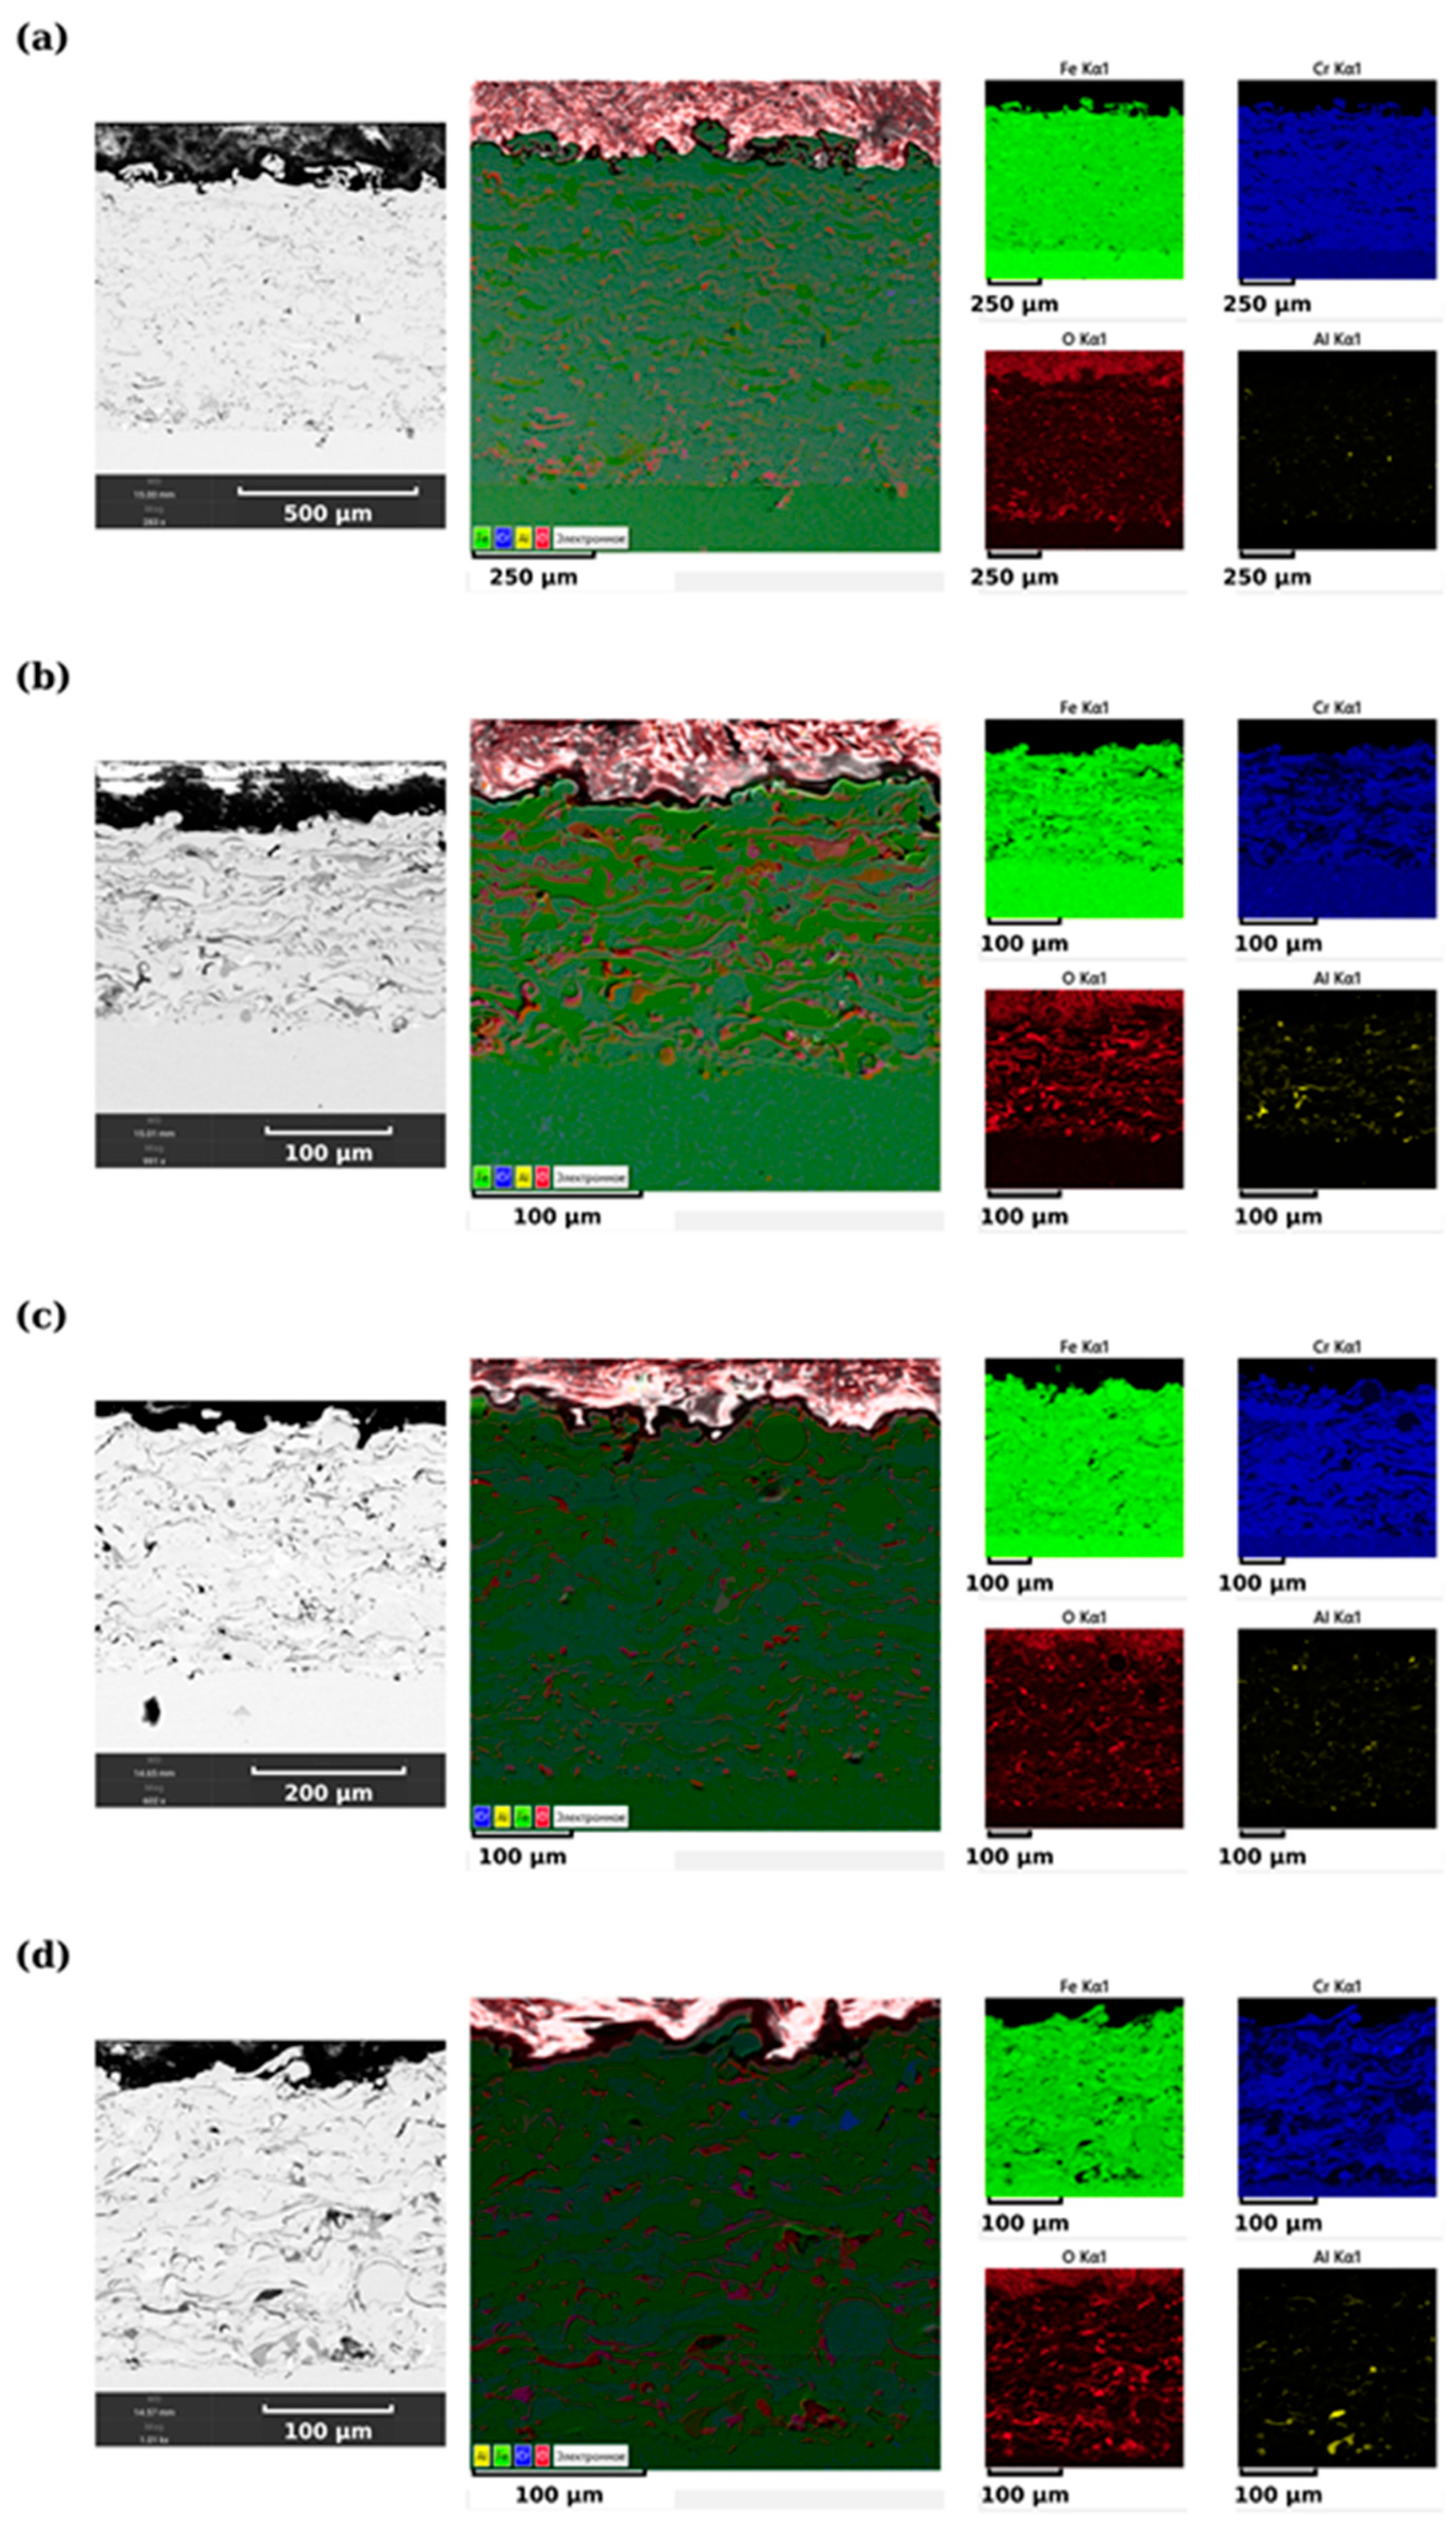
Figure 2 presents cross-sectional SEM images and corresponding EDS elemental maps of Fe, Cr, O, and Al for samples F1–F4. In all cases, the cross sections exhibit a heterogeneous layered morphology with an irregular surface profile and locally developed pores, cavities, and inclusions. The internal structure is predominantly lamellar and non-uniform, particularly in samples F2–F4.
Figure 2.
Cross-sectional SEM images and corresponding EDS elemental distribution maps of Fe, Cr, O, and Al for samples F1 (a), F2 (b), F3 (c), and F4 (d).
For sample F1 (Figure 2a), the elemental distribution appears comparatively uniform at the investigated scale. Fe and Cr form a continuous matrix, whereas O and Al are present mainly in localized regions. The cross section also shows a relatively broad heterogeneous layer beneath the irregular surface.
For sample F2 (Figure 2b), a more pronounced lamellar morphology is observed. The O and Al maps reveal elongated regions following the internal structural features, while Fe and Cr remain continuously distributed throughout the cross section.
Sample F3 (Figure 2c) exhibits a more heterogeneous cross-sectional structure with several rounded and irregular features within the matrix. Fe and Cr remain widely distributed, whereas O and Al are concentrated in localized regions. In some areas, the spatial coincidence of O and Al signals suggests an association of these elements within secondary constituents.
For sample F4 (Figure 2d), the cross section also demonstrates a pronounced heterogeneous and lamellar morphology. The Al distribution contains several relatively intense localized regions, while oxygen remains associated mainly with elongated structural features. Fe and Cr continue to form the dominant continuous matrix.
Overall, the SEM/EDS results show that samples F1–F4 possess a similar Fe–Cr-based matrix but differ in the degree of morphological heterogeneity and in the local distribution of O- and Al-containing regions. The Al and O maps show spatial variations in elemental signals within the analyzed regions; however, these maps alone do not identify the chemical nature or phase composition of the corresponding constituents. The corresponding region-specific elemental compositions are summarized in Table 2.
Table 2.
EDS elemental compositions of the analyzed regions of the FeCrAl coatings (at.%).
Values are reproduced from the EDS reports. Minor deviations from a total of 100% arise from rounding. The results characterize the analyzed regions and do not represent averages from independent coating specimens.
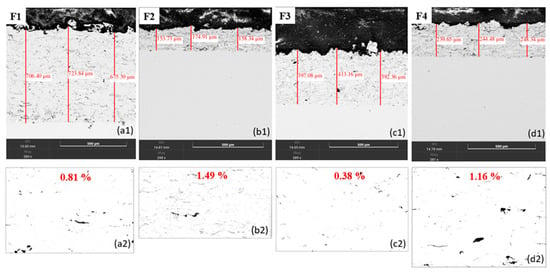
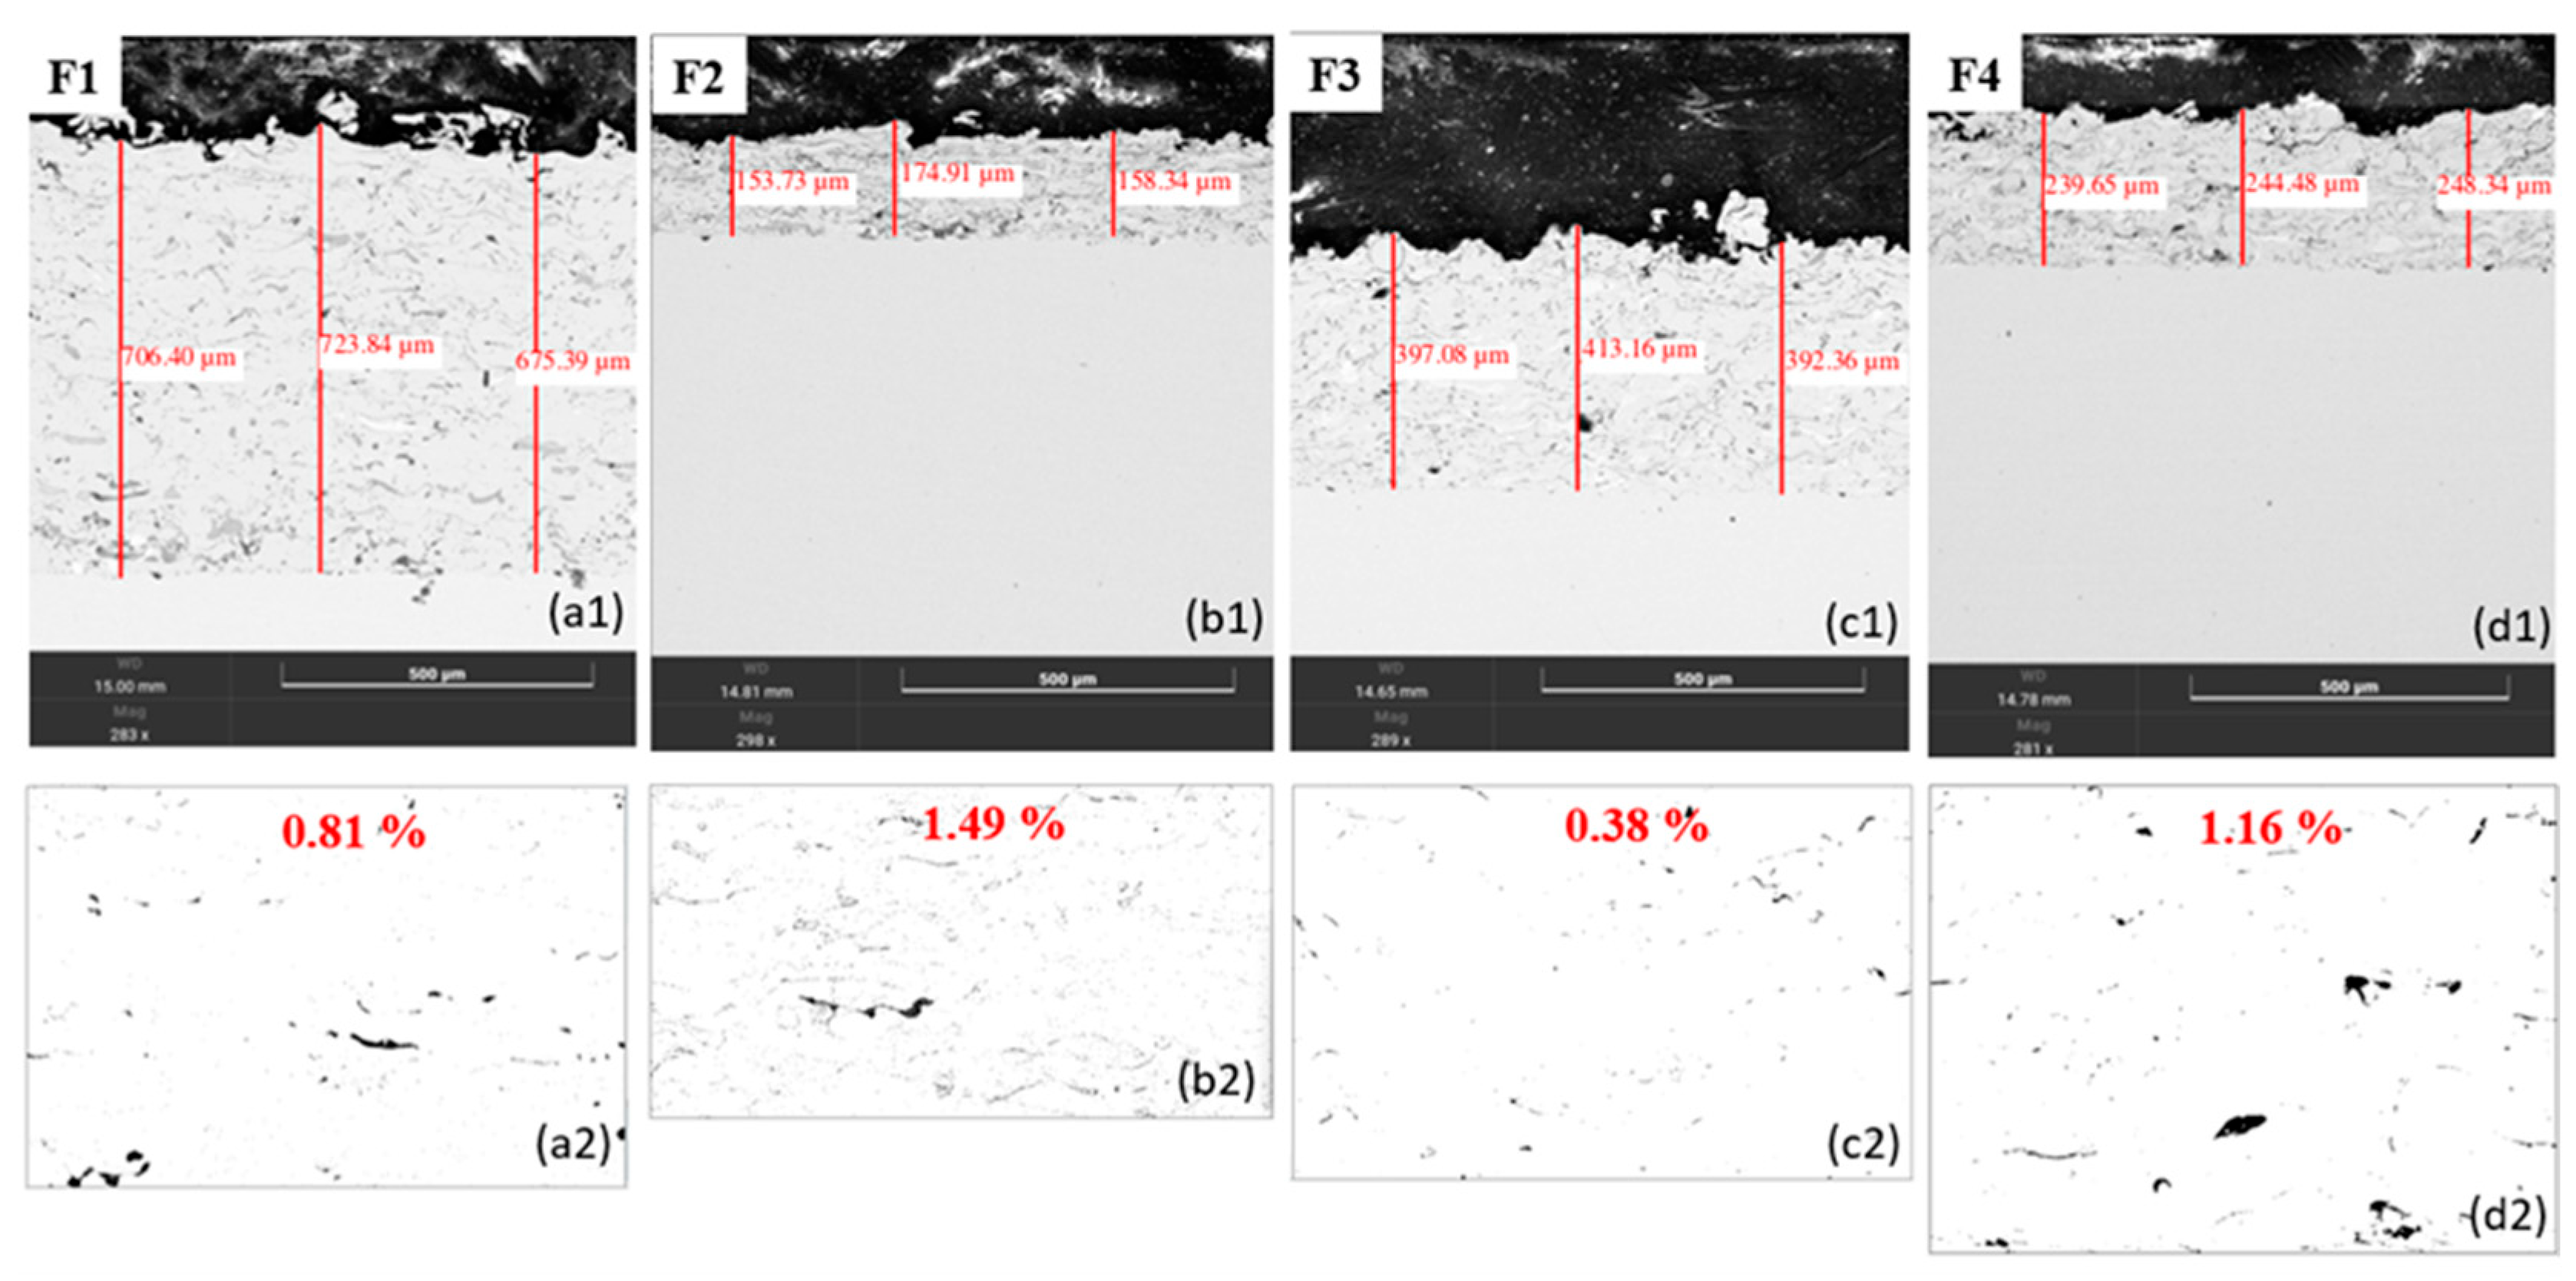
The EDS results for the analyzed regions showed Fe contents of 66.01–68.65 at.%, Cr contents of 11.18–15.14 at.%, and Al contents of 3.77–5.32 at.%. The measured oxygen content ranged from 12.78 to 19.05 at.%, with the highest value recorded for F2. These region-specific compositions do not establish whole-coating compositional variability or quantify oxide-phase fractions. Figure 3 presents the thickness measurements and binary images used for the apparent porosity estimates; Table 3 summarizes the resulting thickness and apparent porosity values.
Figure 3.
Cross-sectional SEM images showing coating thickness measurements (a1–d1) and corresponding binary images used to estimate apparent porosity (a2–d2): (a1,a2) F1; (b1,b2) F2; (c1,c2) F3; (d1,d2) F4. Red lines indicate local thickness measurements. Apparent porosity values are shown in red.
Table 3.
Coating thickness and apparent porosity of the APS FeCrAl coatings.
Thickness values represent three local measurements per specimen. Apparent porosity was estimated from one cross-sectional region per specimen.
The mean coating thickness increased across the specimens in the order F2 < F4 < F3 < F1, corresponding to powder feed rates of 25, 30, 35, and 40 g/min, respectively. The measured thicknesses were 162.33 ± 11.14 µm for F2, 244.16 ± 4.35 µm for F4, 400.87 ± 10.90 µm for F3, and 701.88 ± 24.54 µm for F1. The standard deviations describe the variation among three local thickness measurements within each examined cross-section.
The apparent porosity values were 0.81%, 1.49%, 0.38%, and 1.16% for F1–F4, respectively. F3 exhibited the lowest region-specific apparent porosity, whereas F2 exhibited the highest. Unlike thickness, apparent porosity did not vary monotonically with powder feed rate. The results therefore show that the specimen with the greatest thickness did not have the lowest measured apparent porosity. These estimates characterize the individual cross-sectional regions analyzed.
All specimens were deposited at a stand-off distance of 150 mm. Although greater thickness was observed in specimens produced at higher powder feed rates, the contributions of deposition duration, number of passes, and torch traverse speed could not be separated. The observed thickness sequence is therefore an association within this specimen set rather than an isolated powder-feed-rate effect.
3.2. Local Indentation Response
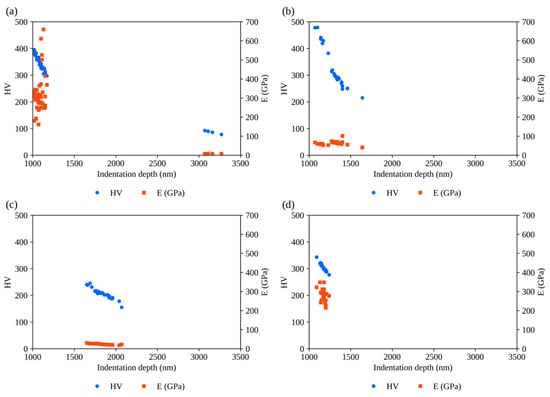
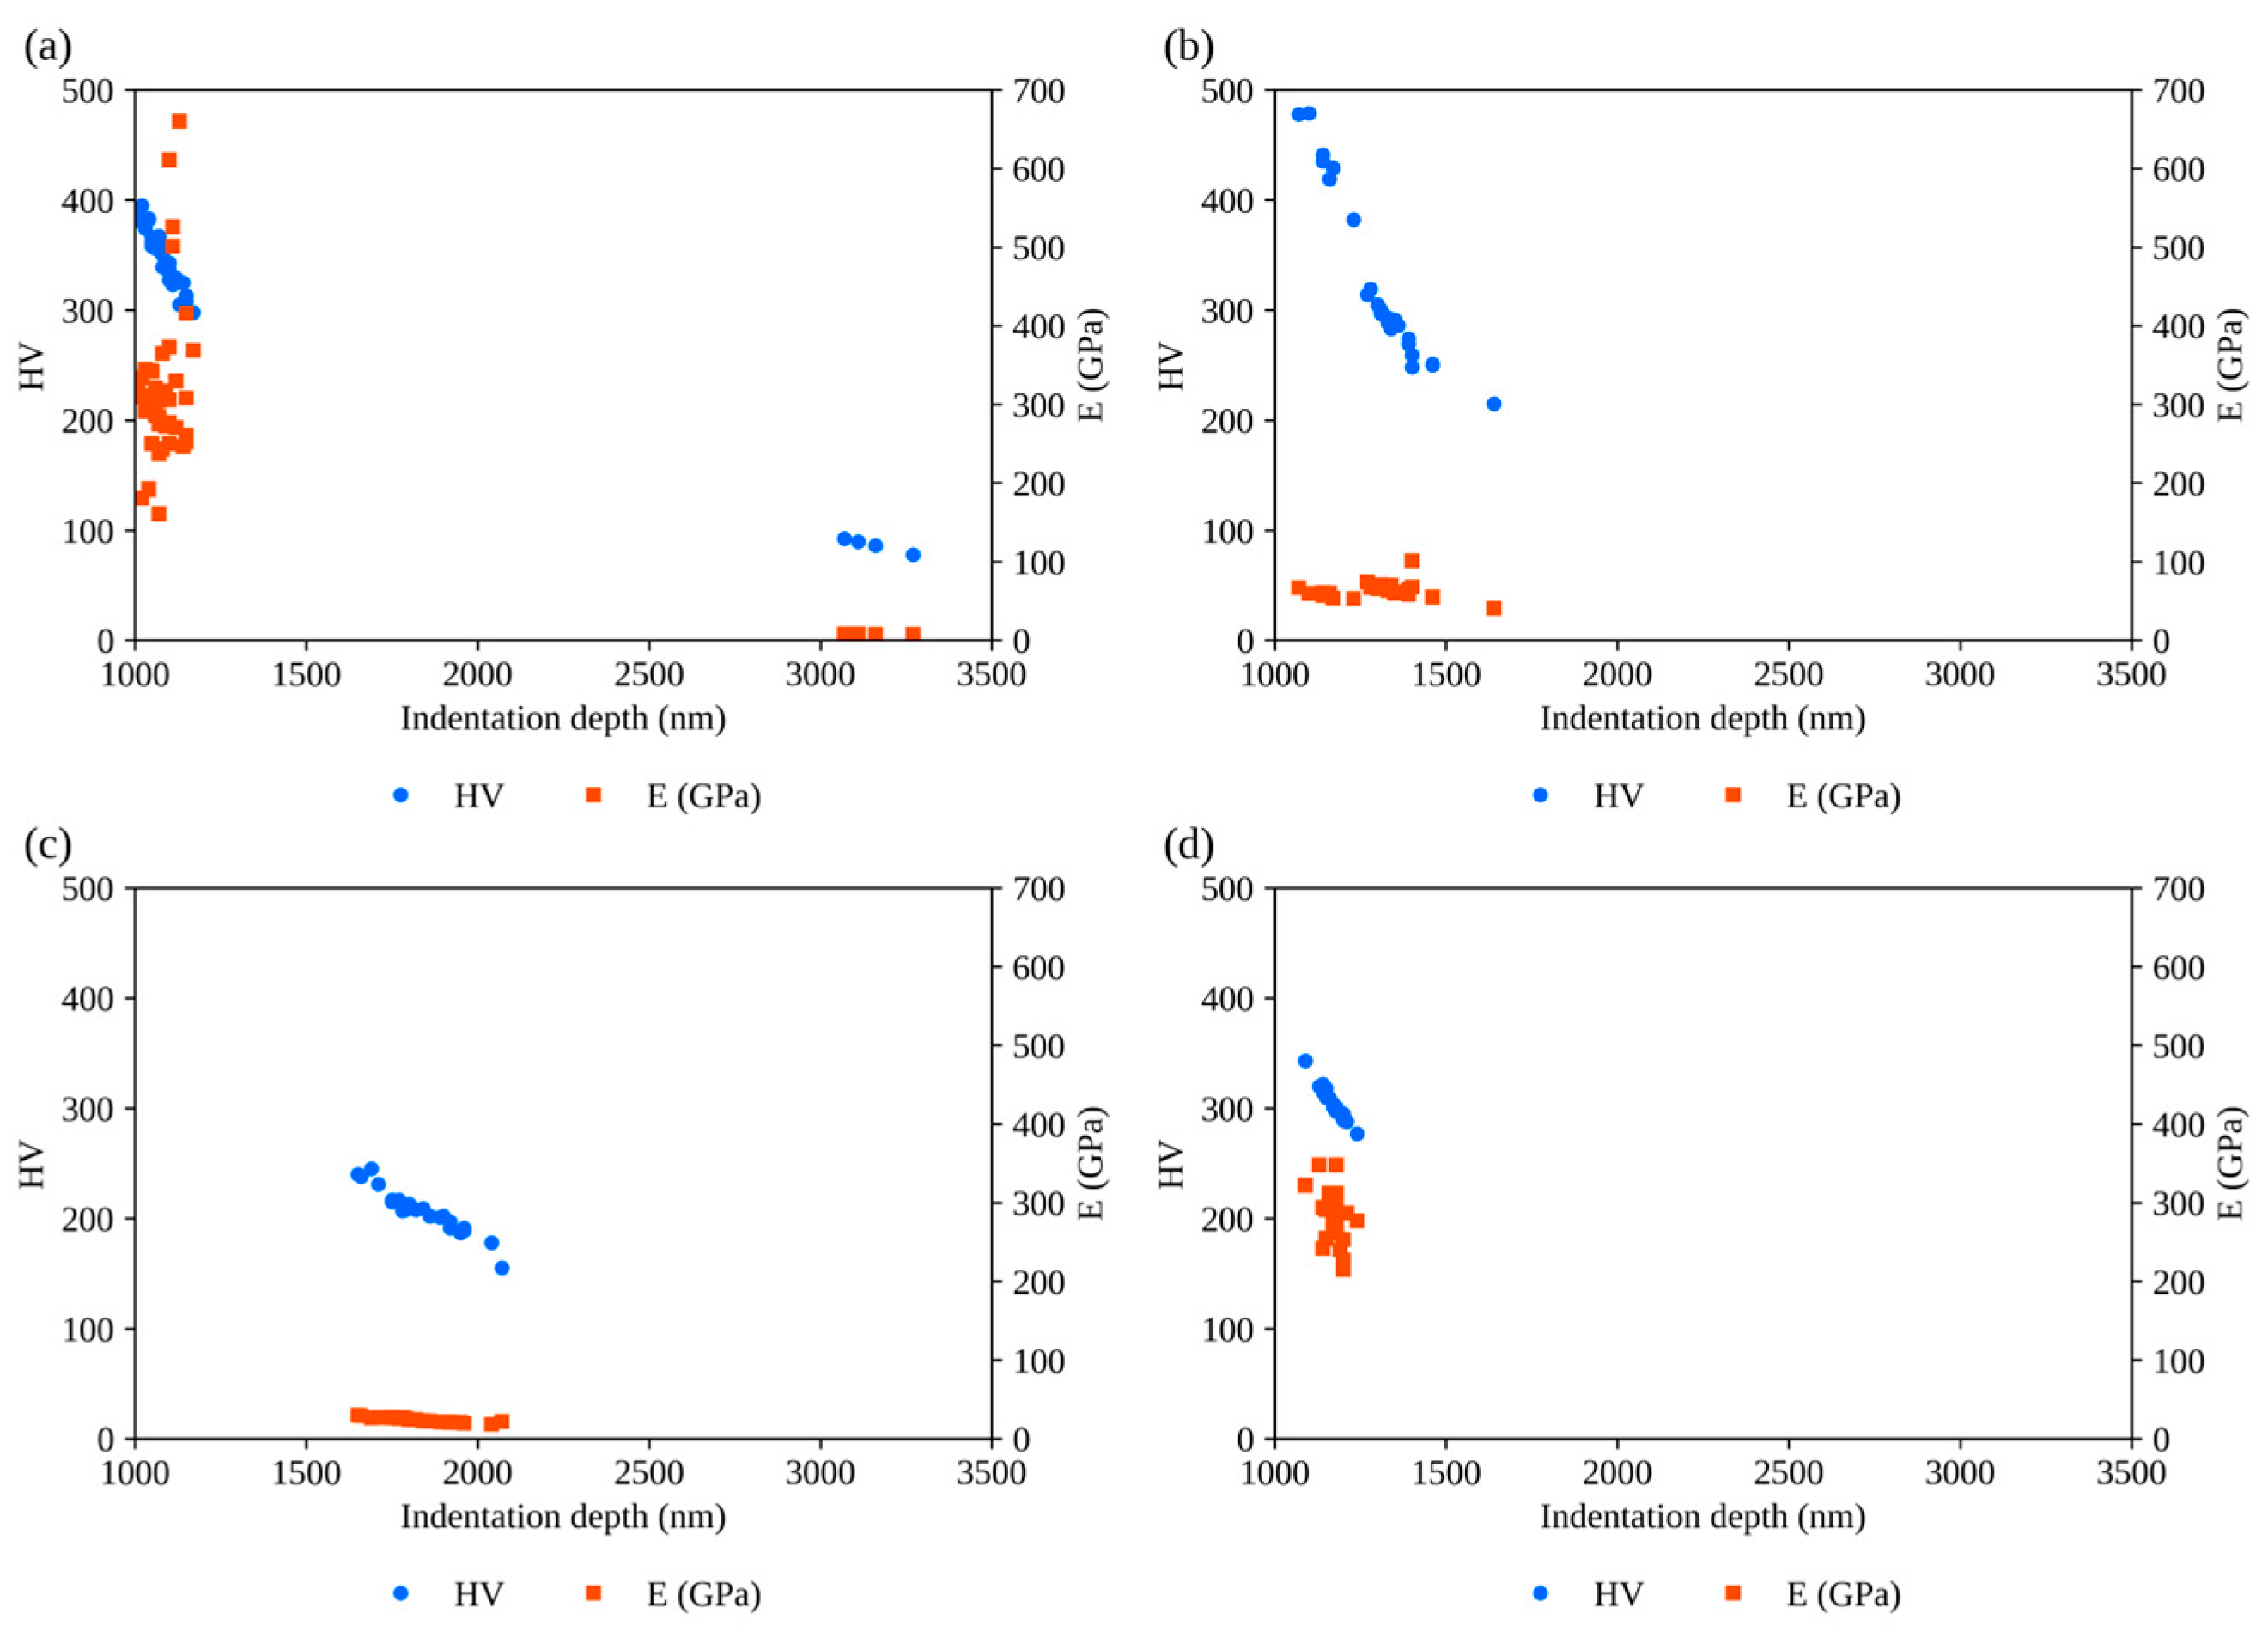
Figure 4 compares the local indentation responses of coatings F1–F4. The software-reported hardness and elastic modulus are plotted against the maximum penetration depth of each individual indentation. Each point represents a separate measurement; the plots therefore describe variation among indentations rather than a continuous property profile through the coating thickness. Table 4 summarizes the descriptive statistics of these measurements.
Figure 4.
Hardness (HV) and elastic modulus (E) plotted against the maximum indentation depth for individual measurements on coatings F1 (a), F2 (b), F3 (c), and F4 (d).
Table 4.
Descriptive statistics of software-reported hardness and elastic modulus for coatings F1–F4.
Values are presented as mean ± sample standard deviation across unique indentations. All unique measurements, including extreme values, were retained. SD describes within-specimen scatter, not reproducibility between independently deposited coatings.
The mean software-reported hardness values were 325.9 ± 78.7 HV for F1, 314.2 ± 67.2 HV for F2, 205.8 ± 20.8 HV for F3, and 303.3 ± 13.2 HV for F4. F1 exhibited the largest standard deviation in hardness, whereas F4 exhibited the smallest. Although F3 had the lowest mean hardness, the lowest individual hardness value occurred in F1. These descriptive statistics summarize the recorded indentation responses; they do not validate the extreme modulus values or establish reproducibility between independently deposited coatings.
For sample F1 (Figure 4a), the measured hardness ranged from approximately 78 to 395 HV, while the software-reported elastic modulus ranged from approximately 7.6 to 660 GPa. All recorded measurements were retained because no documented validity criterion supported their exclusion. The substantial scatter and extreme modulus values require caution: the available records do not establish whether they reflect local coating heterogeneity or measurement-related effects. These results therefore characterize the recorded indentation responses rather than a validated range of intrinsic coating properties.
For sample F2 (Figure 4b), the measured hardness ranged from approximately 215 to 479 HV, while the elastic modulus ranged from approximately 40.7 to 101 GPa. Hardness generally decreased with increasing maximum indentation depth. The elastic modulus showed a narrower range than that of F1, although scatter among individual measurements remained evident. These results describe local indentation responses rather than a continuous depth profile.
For sample F3 (Figure 4c), the measured hardness ranged from approximately 155 to 245 HV, while the elastic modulus ranged from approximately 18.5 to 30.2 GPa. Both parameters generally decreased with increasing maximum indentation depth. The scatter reflects differences among individual indentation measurements; these data do not represent a continuous depth profile obtained from a single indentation.
For sample F4 (Figure 4d), the measured hardness ranged from approximately 277 to 343 HV, while the elastic modulus ranged from approximately 215 to 348 GPa. Hardness generally decreased with increasing maximum indentation depth, whereas the elastic modulus exhibited scatter among individual measurements. These variations describe the local indentation response and do not establish a continuous depth-dependent change in coating properties.
The indentation results illustrate the recorded local mechanical responses and their scatter within each specimen. F3 generally exhibited lower hardness values than F2 and F4. The hardness ranges overlapped, and the results did not establish a monotonic relationship between powder feed rate and local hardness. The scatter and extreme software-reported modulus values prevent a reliable ranking of intrinsic elastic properties. Accordingly, these measurements are used as supplementary characterization and not as direct evidence of the mechanism controlling wear.
3.3. Surface Roughness
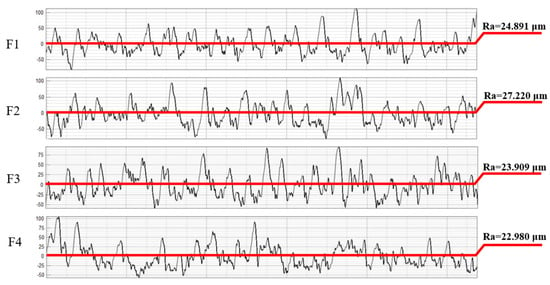
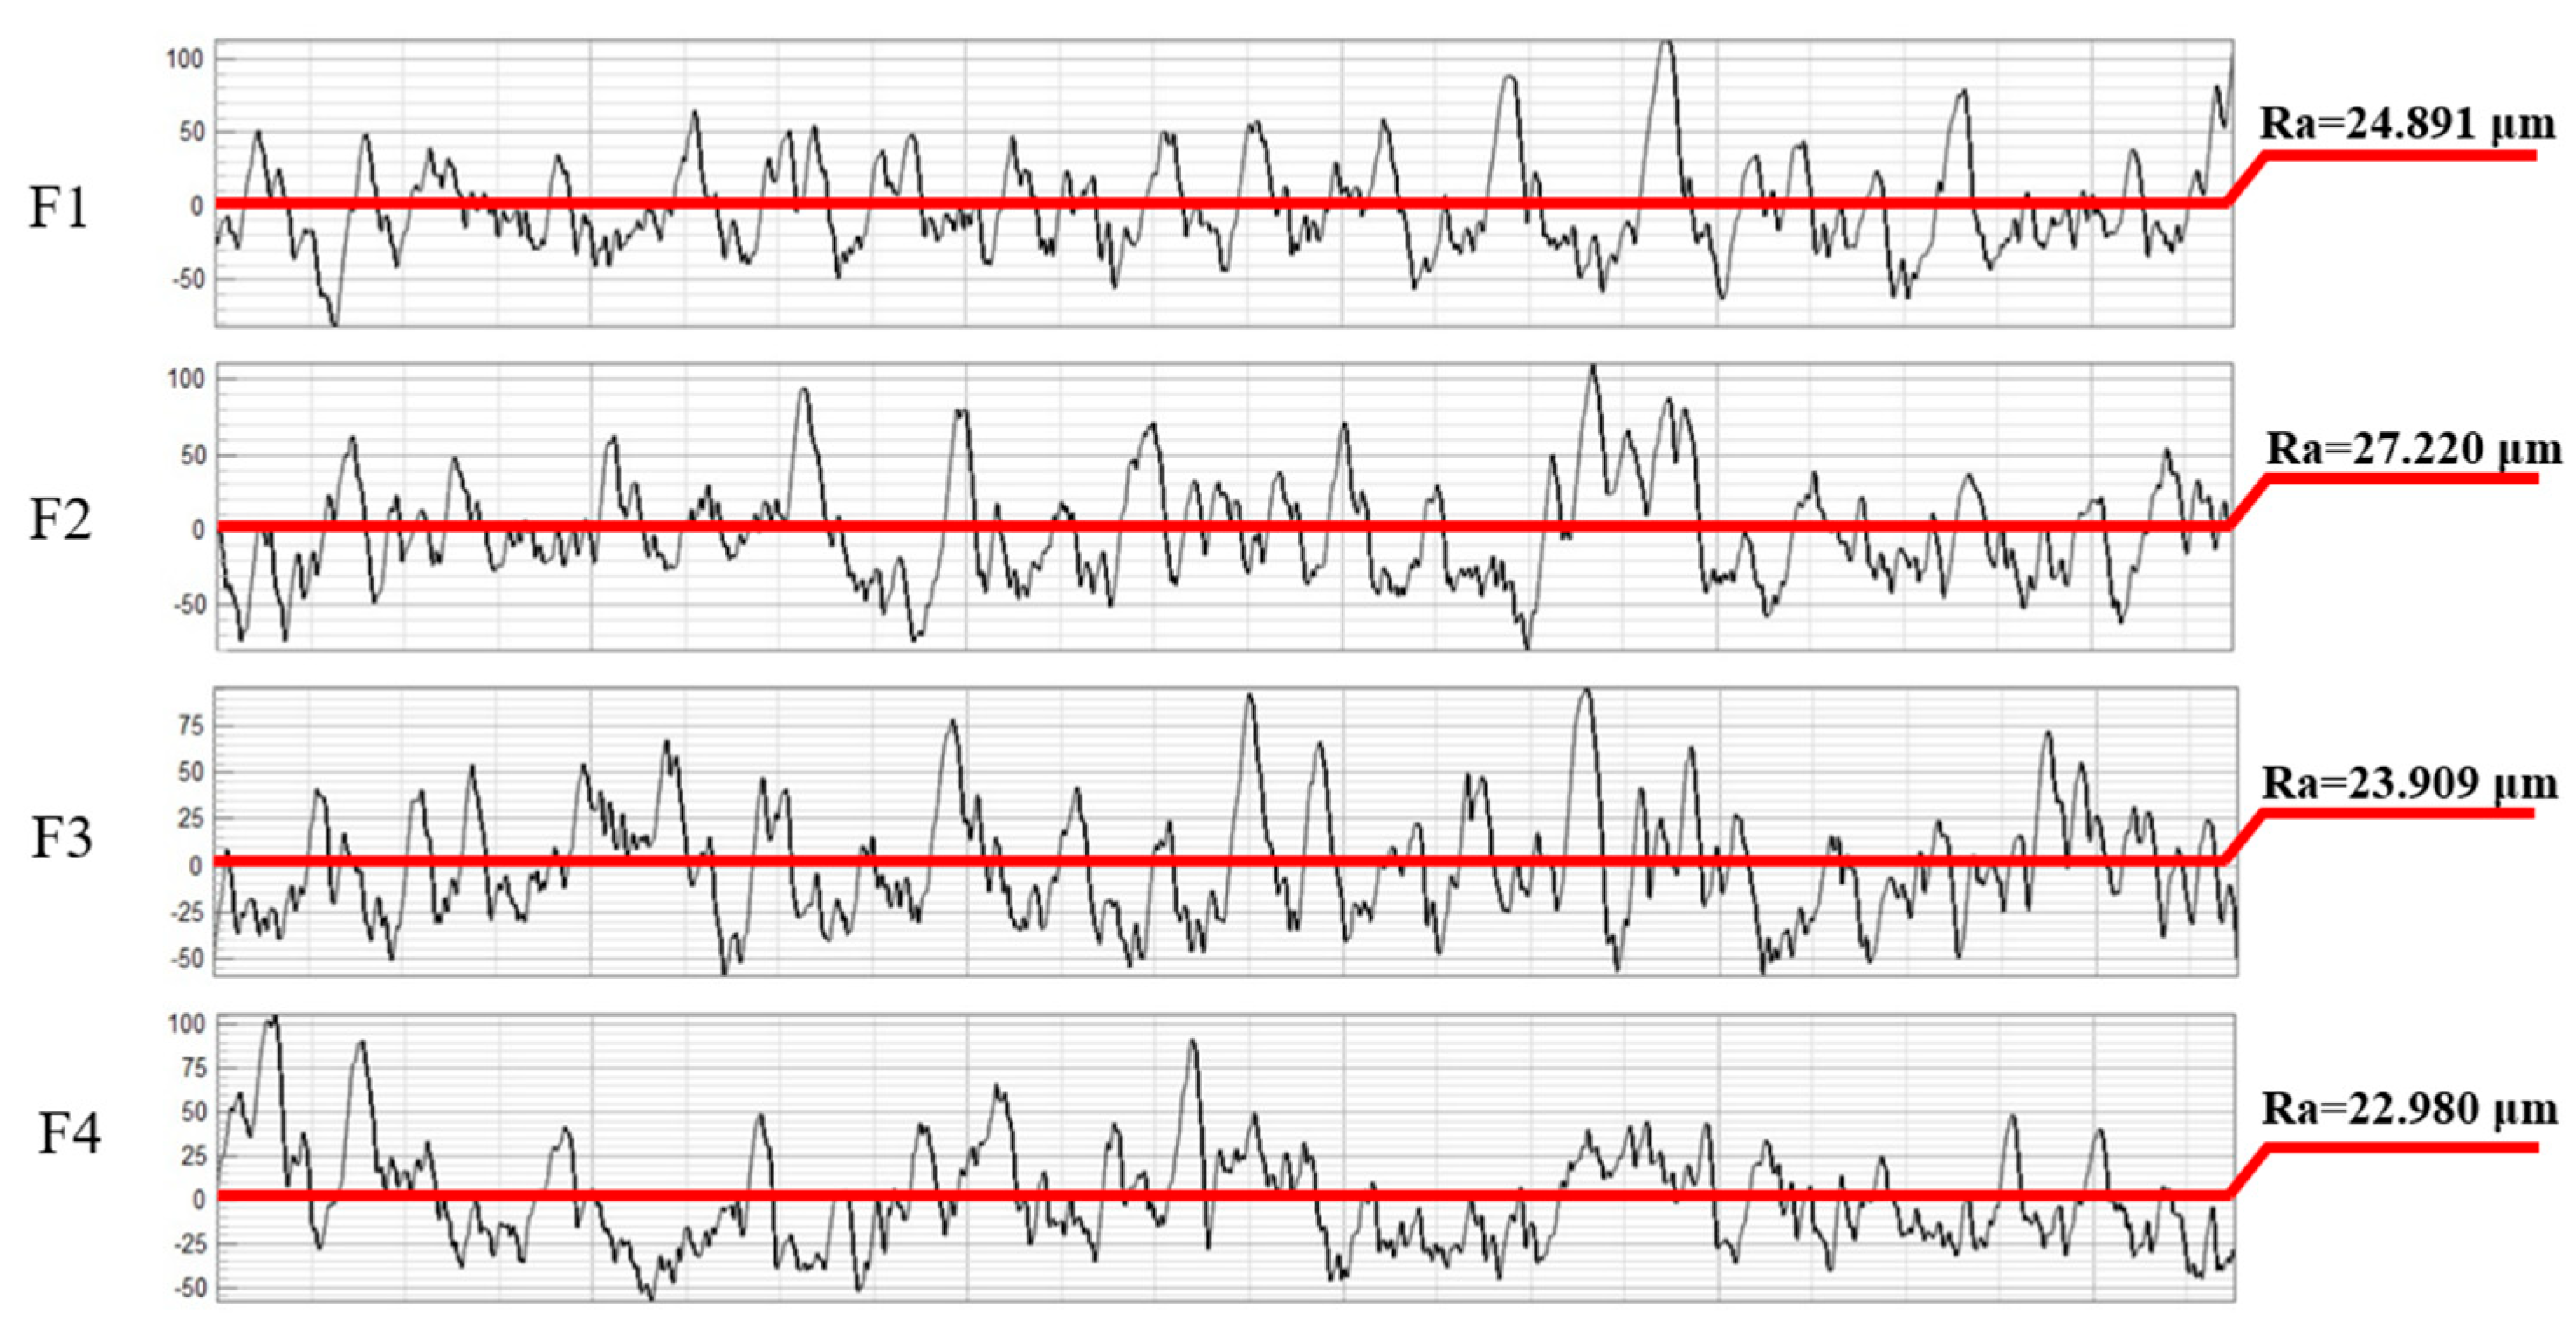
Surface roughness was evaluated using three profiles recorded at different locations on each coating. Table 5 presents the mean Ra values and their sample standard deviations (n = 3), while Figure 5 shows a representative profile for each coating.
Table 5.
Surface roughness parameters of all samples.
Figure 5.
Representative surface roughness profiles of coatings F1–F4. The indicated Ra values correspond to the individual profiles shown. Black traces show the measured surface profiles; red horizontal segments mark the zero-height reference and extend to the corresponding Ra labels.
Values are presented as mean ± standard deviation (SD) of three measurements per sample (n = 3).
The mean Ra values followed the order F2 > F1 > F3 > F4: 26.91 ± 0.36, 24.53 ± 0.33, 23.27 ± 1.04, and 22.83 ± 0.13 µm, respectively (mean ± SD, n = 3). This ranking did not follow the sequence of powder feed rates or coating thicknesses, indicating no monotonic trend in mean Ra across the examined specimens. Measurements at three different locations on each coating provided a limited assessment of spatial variability, with F3 exhibiting the largest standard deviation. These measurements do not establish reproducibility between independently deposited coatings.
3.4. Phase Constitution
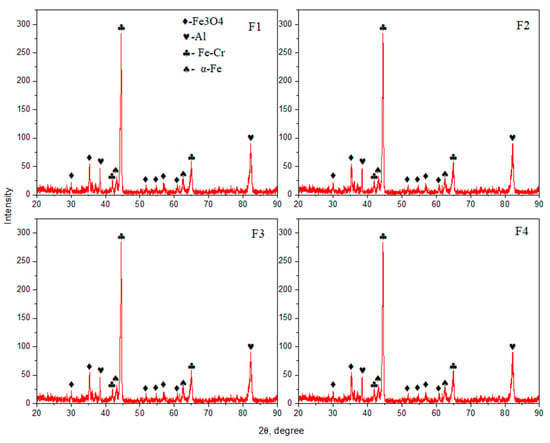
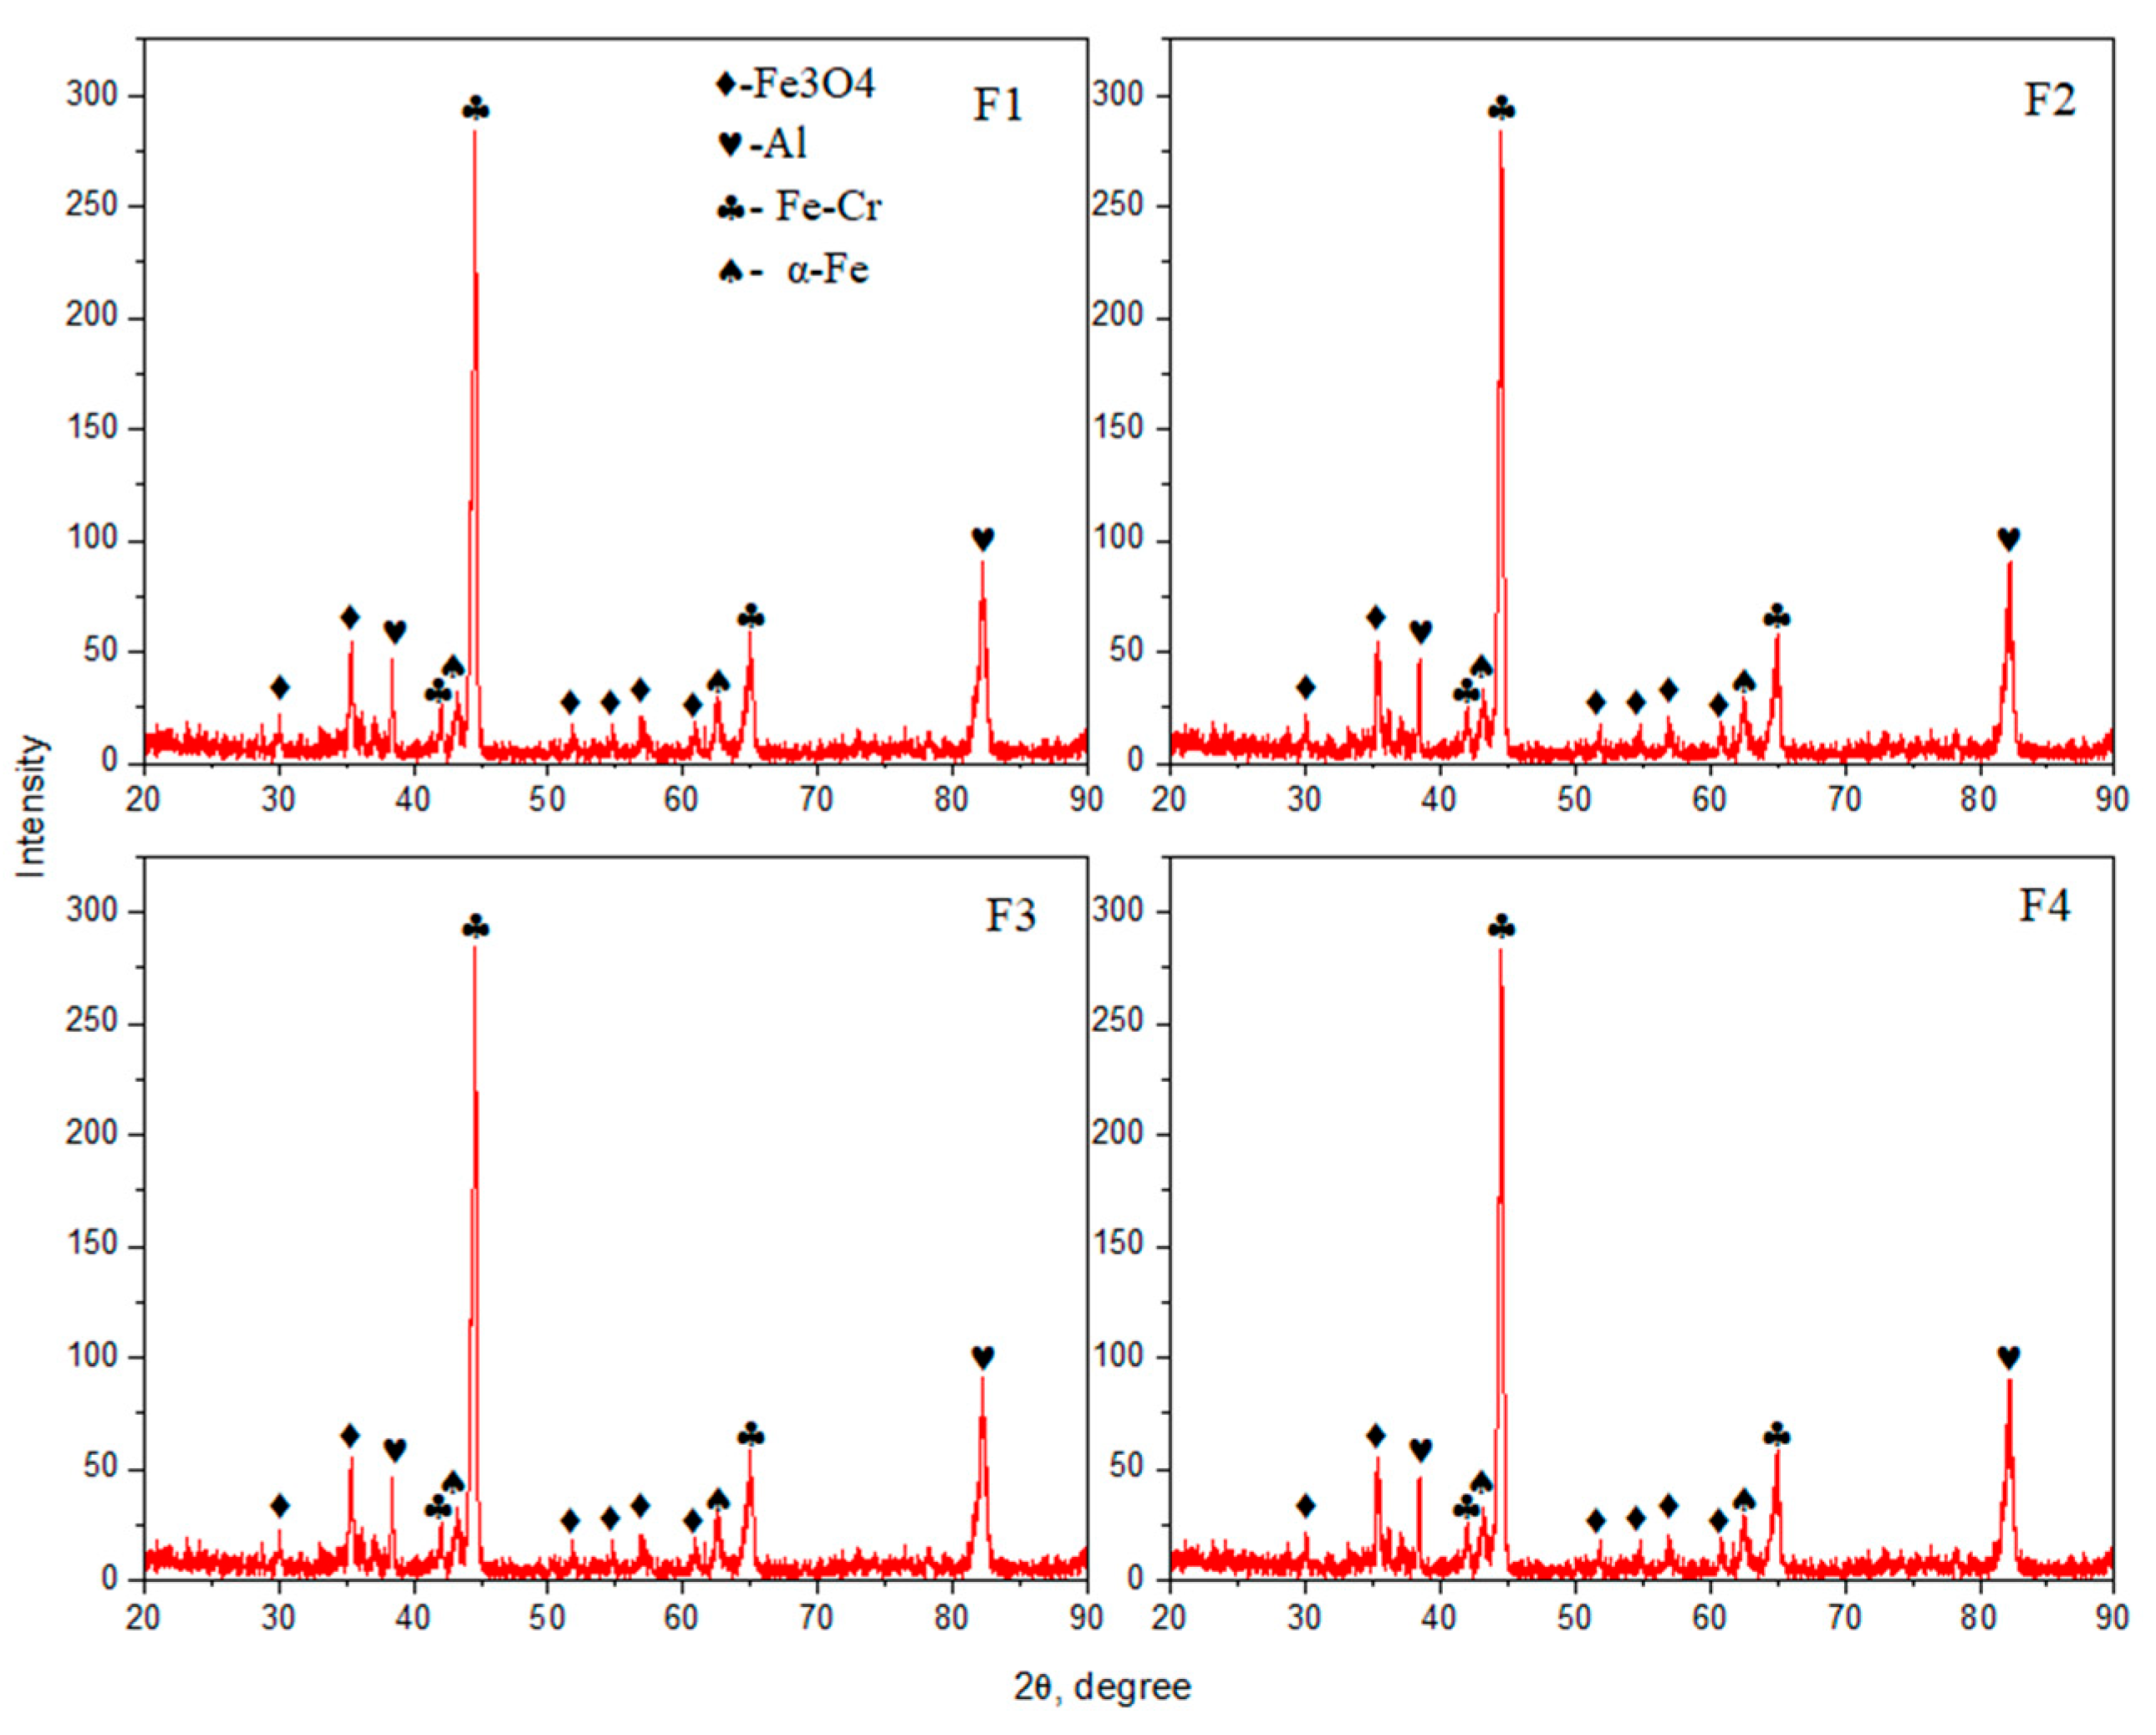
X-ray diffraction patterns of the four APS FeCrAl coatings (F1–F4) are presented in Figure 6. All specimens exhibited broadly similar diffraction features. The dominant reflections were attributed to an α-Fe-type bcc metallic matrix containing Cr. Because the reflections of α-Fe and Fe–Cr solid solutions overlap strongly, they were not interpreted as evidence of two separately resolved metallic phases. Weaker reflections were assigned to Fe3O4.
Figure 6.
XRD patterns of the APS FeCrAl coatings F1–F4. The assignment of the reflections marked as Al to metallic aluminum is tentative.
The strongest reflection occurred at approximately 2θ = 44–45°, with additional metallic-matrix reflections near 65° and 82°. Metallic Al was considered as a possible assignment using reference entry 96-431-3218 (COD 4313217). However, its presence could not be established unambiguously from the available diffraction data. This tentative assignment does not provide evidence for Al2O3.
The coatings produced at powder feed rates of 25–40 g/min exhibited broadly similar diffraction patterns, with differences in the relative intensities of individual reflections. These intensity differences alone do not establish changes in phase fractions, since preferred orientation and measurement conditions can also affect peak intensities. The qualitative XRD comparison therefore identified no clear change in the dominant crystalline phase assemblage across the investigated specimens. Consequently, the observed differences in friction and wear cannot be explained solely by the identified phase assemblages.
3.5. Tribological Performance
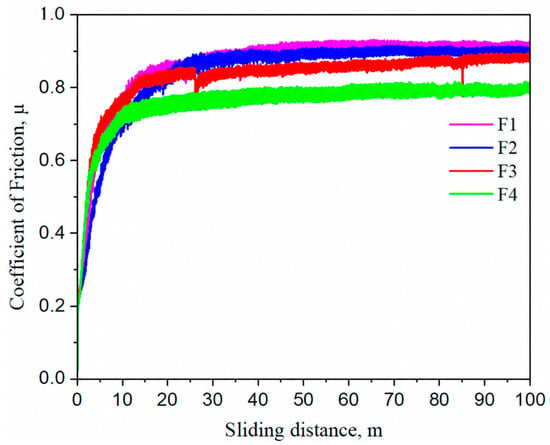
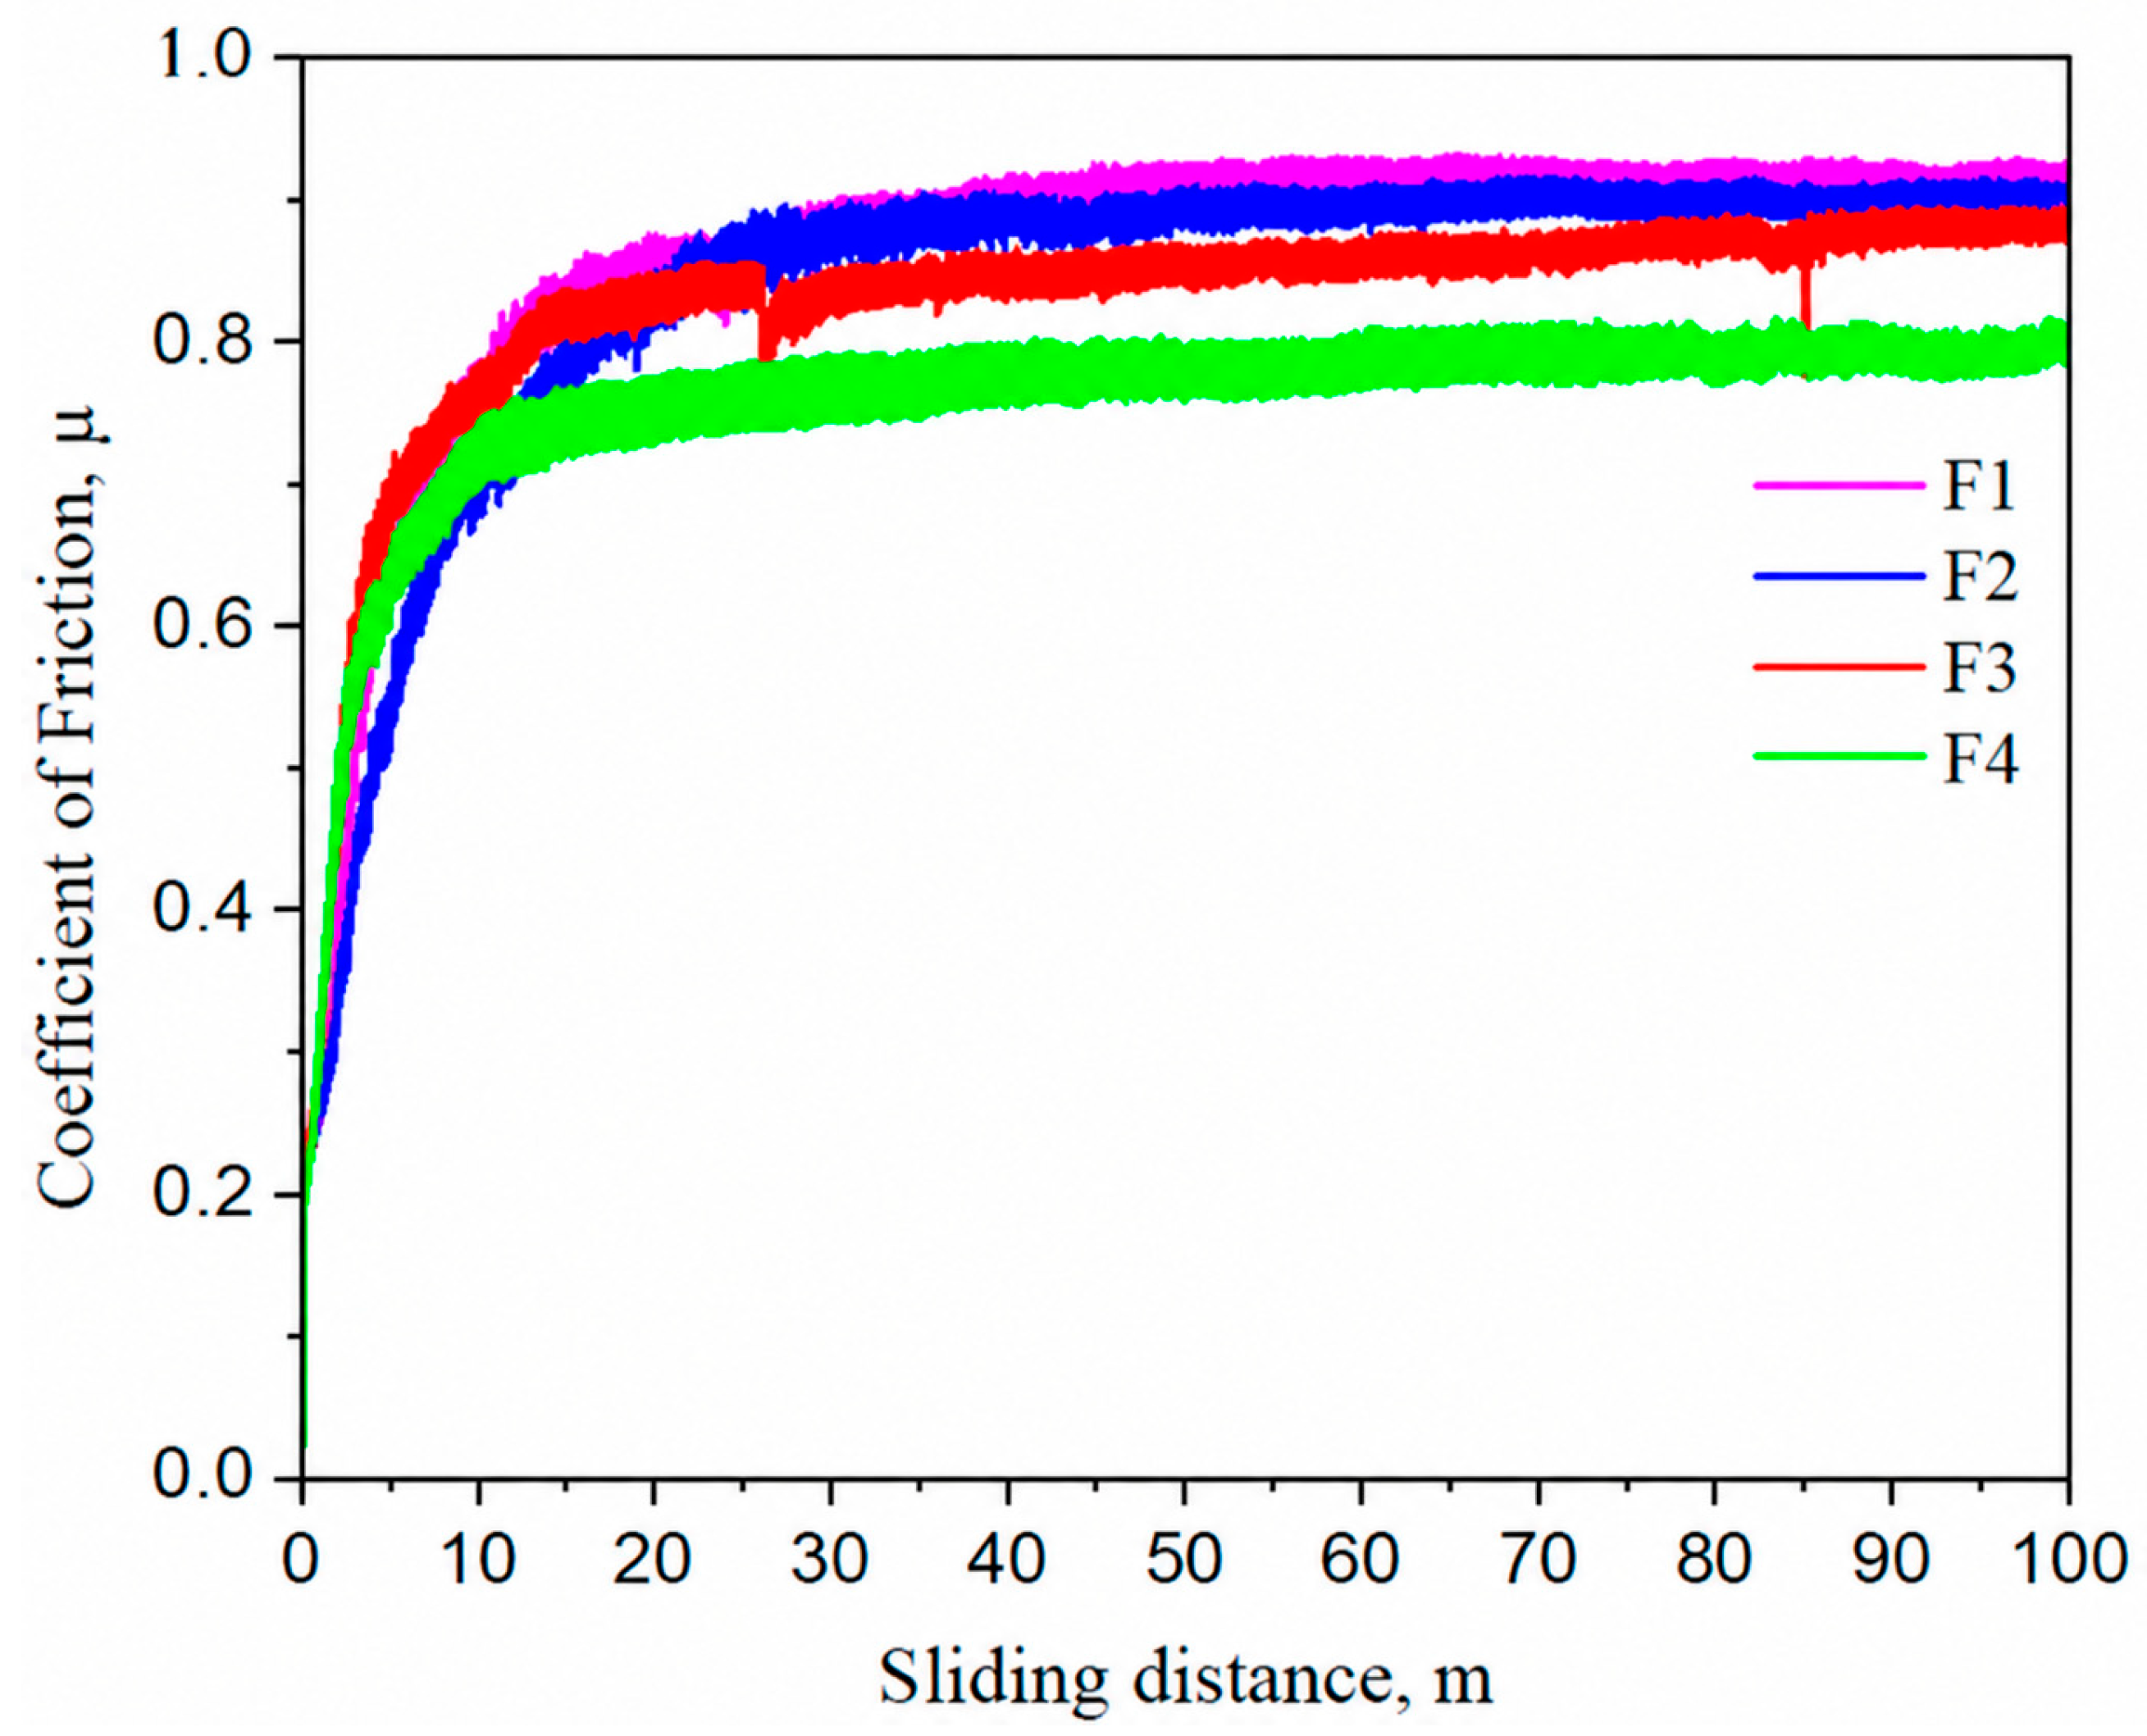
Figure 7 shows the coefficient of friction as a function of sliding distance for coatings F1–F4 under identical dry-sliding test conditions. All curves exhibited a rapid initial increase, particularly within the first 10–20 m, followed by a slower increase toward an approximately steady regime. During the later stages of sliding, the friction coefficients followed the order F1 > F2 > F3 > F4. These curves represent one test per specimen and therefore do not establish test-to-test reproducibility.
Figure 7.
Evolution of the coefficient of friction as a function of sliding distance for samples F1–F4.
The approximate post-running-in friction levels, estimated visually from Figure 7, were 0.90–0.92 for F1, 0.88–0.90 for F2, 0.85–0.88 for F3, and 0.77–0.80 for F4. These ranges indicate approximate levels in the individual curves rather than calculated means or confidence intervals.
The observed friction ranking was F4 < F3 < F2 < F1. This sequence did not follow the order of powder feed rates, indicating that the individual tests did not reveal a monotonic relationship between feed rate and friction. F4 also exhibited the lowest measured surface roughness, but this coincidence alone does not establish that roughness controlled its friction response.
One sliding test was performed per coating; therefore, the ranking describes the tested specimens, and between-test reproducibility was not assessed.
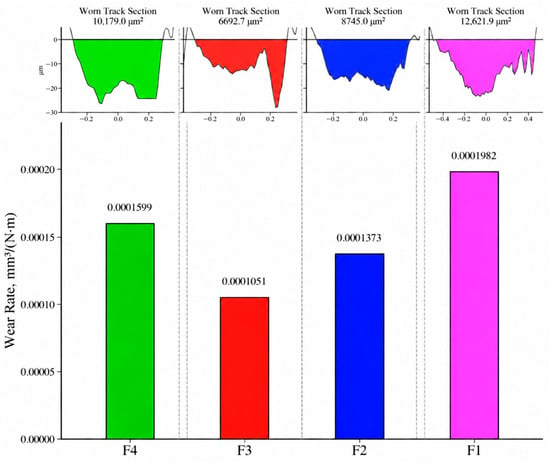
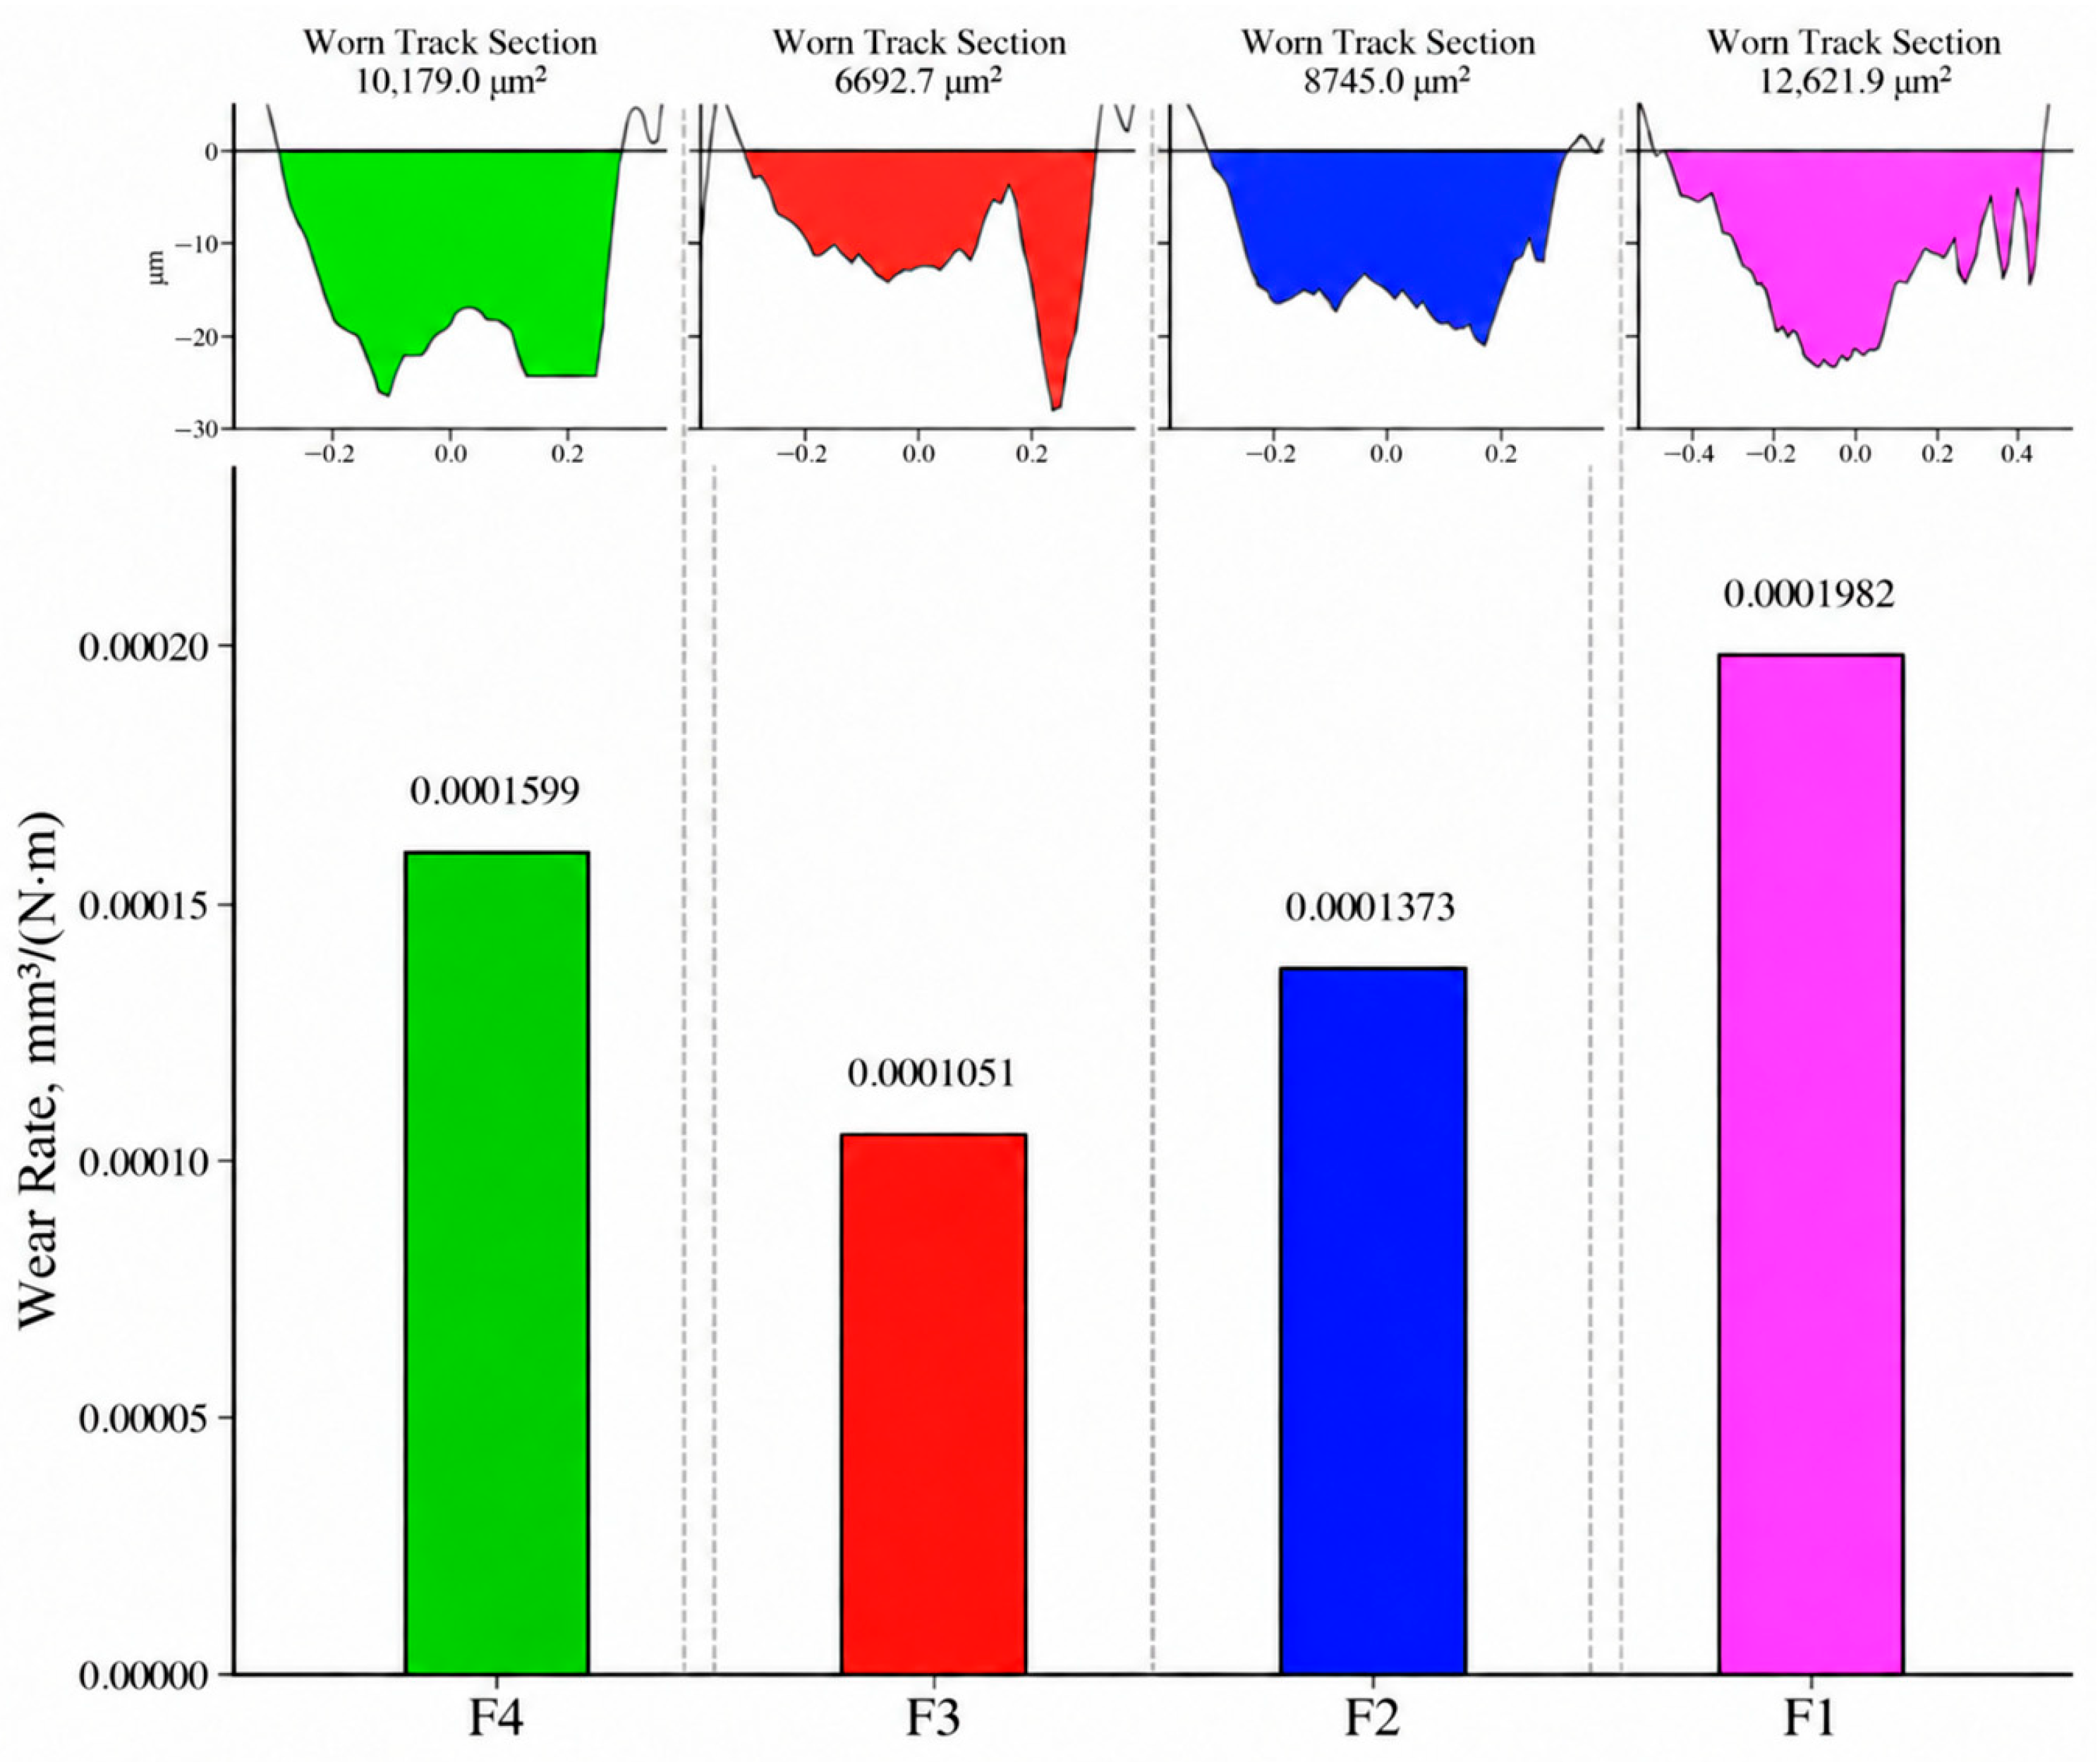
To compare friction with material loss, the wear-track cross-sectional profiles and calculated specific wear rates were examined, as shown in Figure 8.
Figure 8.
Wear-track cross-sectional profiles and specific wear rates of samples F1–F4. The green, red, blue, and magenta profiles and bars correspond to F4, F3, F2, and F1, respectively. Vertical dashed lines separate the specimen panels and do not represent fitted trends.
Figure 8 shows differences in material loss among the tested specimens. The specific wear rates were 1.982 × 10⁻⁴, 1.373 × 10⁻⁴, 1.051 × 10⁻⁴, and 1.599 × 10⁻⁴ mm3/(N·m) for F1–F4, respectively. The corresponding wear-track cross-sectional areas were 12,621.9, 8745.0, 6692.7, and 10,179.0 µm2. The measured wear rates followed the order F3 < F2 < F4 < F1. F3 exhibited the lowest value, whereas F1 exhibited the highest, approximately 1.89 times that of F3.
The wear ranking differed from the friction ranking. F4 exhibited the lowest approximate friction coefficient, whereas F3 exhibited the lowest measured specific wear rate. Thus, the friction coefficient alone was insufficient to rank resistance to material loss in these individual tests. The wear rates did not vary monotonically with powder feed rate or coating thickness.
F3 also exhibited the lowest region-specific apparent porosity, while F2 had the highest mean Ra and apparent porosity. However, these observations do not establish that porosity or roughness controlled wear. The limited sampling, lack of repeated sliding tests, and incomplete deposition records prevent identification of a single controlling factor. The wear rates and track cross-sectional areas are mathematically related and therefore do not constitute independent evidence. Each wear value represents one sliding test.
4. Conclusions
This study compared four atmospheric plasma-sprayed FeCrAl coatings produced at powder feed rates of 25–40 g/min and a common stand-off distance of 150 mm. Their microstructural, surface, and local mechanical characteristics were considered alongside room-temperature dry-sliding friction and wear. The following conclusions were drawn:
- The coatings exhibited heterogeneous lamellar microstructures and broadly similar XRD patterns dominated by an α-Fe-type bcc matrix containing Cr, with additional reflections assigned to Fe3O4. The qualitative phase analysis did not establish a clear change in the dominant crystalline phase assemblage among the specimens.
- Mean coating thickness increased across the specimen series from 162.33 µm at 25 g/min to 701.88 µm at 40 g/min. Region-specific apparent porosity ranged from 0.38% to 1.49%, and mean Ra ranged from 22.83 ± 0.13 to 26.91 ± 0.36 µm (mean ± SD, n = 3). Neither apparent porosity nor mean roughness varied monotonically with powder feed rate.
- The measured specific wear rates followed the order F3 < F2 < F4 < F1. F3 exhibited the lowest value of 1.051 × 10⁻⁴ mm3/(N·m), whereas F1 exhibited the highest value of 1.982 × 10⁻⁴ mm3/(N·m), approximately 1.89 times that of F3.
- The friction and wear rankings did not coincide. F4 showed the lowest approximate post-running-in friction coefficient of 0.77–0.80, whereas F3 exhibited the lowest measured specific wear rate. The available roughness and region-specific apparent porosity data did not establish a single factor controlling wear. Accordingly, both friction and material loss were considered when comparing the tested specimens.
These conclusions apply to the investigated specimens and test conditions. Incomplete deposition records prevent attribution of the differences exclusively to powder feed rate, while one sliding test per coating does not establish between-test reproducibility. The indentation scatter limits interpretation of intrinsic mechanical properties, and high-temperature service performance was not evaluated.
Author Contributions
Conceptualization, B.R. and A.K.; methodology, M.N. and S.A.; software, M.N.; validation, U.I., M.N. and E.A.; formal analysis, U.I.; investigation, U.I.; resources, B.R.; data curation, E.A.; writing—original draft preparation, S.A.; writing—review and editing, S.A. and U.I.; visualization, S.A.; supervision, U.I.; project administration, A.K.; funding acquisition, A.K. All authors have read and agreed to the published version of the manuscript.
Funding
This research has been funded by the Committee of Science of the Ministry of Science and Higher Education of the Republic of Kazakhstan (Grant No. AP23490818).
Institutional Review Board Statement
Not applicable.
Informed Consent Statement
Not applicable.
Data Availability Statement
The data supporting the findings of this study are available from the corresponding author upon reasonable request.
Conflicts of Interest
Author Bauyrzhan Rakhadilov was employed by the PlasmaScience LLP. The remaining authors declare that the research was conducted in the absence of any commercial or financial relationships that could be construed as a potential conflict of interest.
References
- Babu, N.; Balasubramaniam, R.; Ghosh, A. High-temperature oxidation of Fe3Al-based iron aluminides in oxygen. Corros. Sci. 2001, 43, 2239–2254. [Google Scholar] [CrossRef] [Scilit]
- Luo, B.; Wang, W.; Lin, S.; Wu, Y.; Lu, K.; Yang, H.; Huang, H. A study of Fe-Al coating as transition layer on FeCrAl substrate by pack aluminizing. Fusion Eng. Des. 2024, 201, 114266. [Google Scholar] [CrossRef] [Scilit]
- Zhou, L.; Zhou, W.; Su, J.; Luo, F.; Zhu, D.; Dong, Y. Plasma sprayed Al2O3/FeCrAl composite coatings for electromagnetic wave absorption application. Appl. Surf. Sci. 2012, 258, 2691–2696. [Google Scholar] [CrossRef] [Scilit]
- Jiang, G.; Xu, D.; Guo, S.; Liu, L.; Hao, B.; Wang, M. Corrosion behavior and mechanisms of Al2O3 and Mo coated Zircaloy-4 in high-temperature lithiated water. Corros. Sci. 2022, 201, 110270. [Google Scholar] [CrossRef] [Scilit]
- Lakshmi, D.V.; Babu, P.S.; Krishna, L.R.; Vijay, R.; Rao, D.S.; Padmanabham, G. Corrosion and erosion behavior of iron aluminide (FeAl(Cr)) coating deposited by detonation spray technique. Adv. Powder Technol. 2021, 32, 2192–2201. [Google Scholar] [CrossRef] [Scilit]
- Li, N.; Chen, L.-Y.; Chai, L.; Xuan, H.-N.; Wang, Z.; Zhang, L.; Dubovyy, O.; Zhang, J.; Lu, S. A novel plasma-sprayed Cr/FeCrAl dual-layer coating on Zr alloy for potential high-temperature applications. J. Mater. Res. Technol. 2024, 30, 5569–5581. [Google Scholar] [CrossRef] [Scilit]
- Fauchais, P.; Heberlein, J.; Boulos, M.I. Thermal Spray Fundamentals: From Powder to Part; Springer: New York, NY, USA, 2014. [Google Scholar]
- Kengesbekov, A.; Buitkenov, D.; Erdogan, G.; Nabioldina, A.; Komekov, S. The Influence of Powder Composition and Hydrogen Consumption on the Structural, Corrosion and Tribological Characteristics of Fe-Cr-Al Coatings Obtained by Air Plasma Spraying. Materials 2025, 18, 5395. [Google Scholar] [CrossRef] [Scilit] [PubMed]
- Zhu, T.; Becker, M.M.; Baeva, M. Bidirectional coupling of jet plume and particles in a plasma spraying process. Plasma Phys. Technol. 2025, 12, 186. [Google Scholar] [CrossRef] [Scilit]
- Saifutdinov, A.; Timerkaev, B. Simulation of Arc Discharge in an Argon/Methane Mixture, Taking into Account the Evaporation of Anode Material in Problems Related to the Synthesis of Functional Nanostructures. Nanomaterials 2025, 15, 54. [Google Scholar] [CrossRef] [Scilit] [PubMed]
- Lu, J.; He, J.; Chen, D.; Sun, C.; Li, Y.; Luo, F. Preparation and properties of a plasma-sprayed Fe-Cr-B-C coating. Coatings 2022, 12, 1716. [Google Scholar] [CrossRef] [Scilit]
- Mehmood, K.; Umer, M.A.; Munawar, A.U.; Imran, M.; Shahid, M.; Ilyas, M.; Firdous, R.; Kousar, H.; Usman, M. Microstructure and corrosion behavior of atmospheric plasma sprayed NiCoCrAlFe high entropy alloy coating. Materials 2022, 15, 1486. [Google Scholar] [CrossRef] [Scilit] [PubMed]
- Brundle, C.R.; Chuang, T.J.; Wandelt, K. Core and valence level photoemission studies of iron oxide surfaces and the oxidation of iron. Surf. Sci. 1977, 68, 459–468. [Google Scholar] [CrossRef] [Scilit]
- Yamashita, T.; Hayes, P. Analysis of XPS spectra of Fe2+ and Fe3+ ions in oxide materials. Appl. Surf. Sci. 2008, 254, 2441–2449. [Google Scholar] [CrossRef] [Scilit]
- Zhong, J.; Hou, B.; Zhang, W.; Zhang, S.; Zhao, Y.; Zhao, C.; Li, W. High hardness, excellent hydrophobicity, and favorable corrosion resistance of plasma-sprayed FeCrMoSi amorphous coatings on 304 stainless steel. Molecules 2023, 28, 6718. [Google Scholar] [CrossRef] [Scilit] [PubMed]
- Bejinariu, C.; Paleu, V.; Stamate, C.V.; Cimpoeșu, R.; Coteață, M.; Bădărău, G.; Axinte, M.; Istrate, B.; Vasilescu, G.D.; Cimpoeșu, N. Microstructural, corrosion resistance, and tribological properties of Al2O3 coatings prepared by atmospheric plasma spraying. Materials 2022, 15, 9013. [Google Scholar] [CrossRef] [Scilit] [PubMed]
- Bastakys, L.; Marcinauskas, L.; Milieška, M.; Kalin, M.; Kėželis, R. Tribological properties of Cr2O3, Cr2O3–SiO2-TiO2 and Cr2O3–SiO2-TiO2-graphite coatings deposited by atmospheric plasma spraying. Coatings 2023, 13, 408. [Google Scholar]
- Wang, Y.; Zhou, W.; Wen, Q.; Ruan, X.; Luo, F.; Bai, G.; Qing, Y.; Zhu, D.; Huang, Z.; Zhang, Y.; et al. Behavior of plasma sprayed Cr coatings and FeCrAl coatings on Zr fuel cladding under loss-of-coolant accident conditions. Surf. Coat. Technol. 2018, 344, 141–148. [Google Scholar] [CrossRef] [Scilit]
- Rakhadilov, B.; Bayatanova, L.; Kengesbekov, A.; Magazov, N.; Toleukhanova, Z.; Yeskermessov, D. Study of the influence of air plasma spraying parameters on the structure, corrosion resistance, and tribological characteristics of Fe–Al–Cr intermetallic coatings. Coatings 2025, 15, 790. [Google Scholar] [CrossRef] [Scilit]
- Luo, J.H.; Shi, N.; Xing, Y.Z.; Jiang, C.P.; Chen, Y.N. Effect of arc power on the wear and high-temperature oxidation resistance of plasma-sprayed Fe-based amorphous coatings. High Temp. Mater. Process. 2019, 38, 639–646. [Google Scholar] [CrossRef] [Scilit]
- Ndumia, J.N.; Kang, M.; Lin, J.; Liu, J.; Li, H. Influence of heat treatment on the microstructure and wear properties of arc-sprayed FeCrAl/Al coating. Coatings 2022, 12, 374. [Google Scholar] [CrossRef] [Scilit]
- Kengesbekov, A. Influence of plasma arc current and gas flow on the structural and tribological properties of TiN coatings obtained by plasma spraying. Coatings 2024, 14, 1404. [Google Scholar] [CrossRef] [Scilit]

Disclaimer/Publisher’s Note: The statements, opinions and data contained in all publications are solely those of the individual author(s) and contributor(s) and not of MDPI and/or the editor(s). MDPI and/or the editor(s) disclaim responsibility for any injury to people or property resulting from any ideas, methods, instructions or products referred to in the content. |
© 2026 by the authors. Licensee MDPI, Basel, Switzerland. This article is an open access article distributed under the terms and conditions of the Creative Commons Attribution (CC BY) license.