


Highlights
What are the main findings?
- •
- Impression roller displacement influenced the morphology and sheet resistance of printed layers.
- •
- Smaller displacements produced halo effects and viscous fingering but lower sheet resistance.
- •
- Higher displacements improved the dimensional fidelity of printed features.
What are the implications of the main findings?
- •
- Print quality alone does not necessarily predict electrical conductivity.
- •
- Displacement selection requires a balance between print fidelity and electrical performance.
- •
- Impression roller displacement is an important parameter for optimizing printed electrodes.
Abstract
Owing to its distinctive advantages, roll-to-roll flexographic printing has been widely used for food packaging, newspapers, and magazine production. In recent decades, this mass-production technique has also been utilized for printing electrodes on different substrates for biosensors, transistors, batteries, supercapacitors, and solar cells. The printing process relies on several parameters to achieve well-defined printed features, including printing speed, separation between the printing plate and the substrate, and the rheological properties of the ink. Herein, we investigated the effect of impression roller displacement on the physical and electrical properties of printed graphite/carbon dot layers. Relative impression displacement (RID) describes the displacement of the impression roller from a reference position. It influences the distance between the printing plate cylinder and the impression roller but does not directly represent the distance between them. Interestingly, deteriorated print quality did not necessarily result in poorer electrical conductivity. At small impression displacement (i.e., 48 μm), printing defects such as halo effects, viscous fingering, and ink accumulation in unwanted regions were pronounced, with an average sheet resistance of 168 ± 62 Ω/sq. As the impression displacement increased to 500 μm, the definition and morphological uniformity of the printed layers improved. However, the average sheet resistance increased to 596 ± 116 Ω/sq. This study establishes the relationships between impression displacement, coating morphology, and electrical performance, highlighting the trade-off between improved feature definition and electrical conductivity in flexographically printed conductive layers on paper substrates.
1. Introduction
Flexographic printing is a technique that combines continuous operation at high speed and roll-to-roll (R2R) processing [1]. While flexographic printing has been widely used in the food packaging industry as well as in newspaper and magazine production, it has expanded to other applications utilizing functional inks such as PEDOT:PSS [2,3], silver [4], and dielectric materials to fabricate a range of electronic devices, including solar cells [5,6] and Organic Thin-Film Transistors (OTFTs) [7,8]. Beyond electronic applications, flexography has been used for drug delivery applications, allowing fast deposition of active ingredients on rapidly dissolving oral film and reduced active pharmaceutical ingredient (API) crystallization [9].
Compared to other printing approaches, for example, screen and inkjet printing, flexography allows large-scale manufacturing across a wide range of flexible substrates, supports constant web handling, and maintains relatively low cost per unit at industrial scale [10,11,12]. The technique enables controlled ink deposition over a large area with a single printing pass and reduced pre- or post-processing steps compared to conventional microfabrication approaches [13].
The working principle of flexographic printing is based on transferring a controlled volume of ink immediately from the reservoir to engraved cells on the anilox roller. Subsequently, the ink deposits only onto raised features of a flexible photopolymer or elastomeric printing plate. Upon contact with the substrate on the impression roller, the ink is finally transferred to the substrate, resulting in transfer of patterned ink to the substrate surface [14,15].
Different printing parameters affect the physical and electrical properties of the printed layers in flexography printing, including the printing speed [16], distance between the printing plate on the printing plate cylinder and the substrate on the impression roller [17], anilox roller volume [18] and ink rheology [19]. Despite the ability to control different parameters in flexography printing, geometrical fidelity in flexographic printing remains challenging [20]. Several phenomena have been reported either separately or in combination that limit the quality of the printed patterns. For example, halo effects were reported in the past for flexographically printed layers. They are characterized by an accumulation of excess ink surrounding the printed pattern [21]. The reasons behind this phenomenon are linked to excessive pressure at the plate–impression cylinder nip [22], uneven pressure distribution within the plate–impression cylinder induced by deformation of the printing plate or mounting tape [23], and irregular ink transfer at the plate–substrate interface [24]. The relation between impression pressure and print fidelity is non-linear [25]. Initially, increasing the nip pressure enhances plate–substrate contact and facilitates efficient ink transfer [26], leading to considerable alterations of printing feature dimensions [27]. However, impression pressure exceeding the minimum required for optimal contact can promote halo formation, ink-edge accumulation, and dot or feature widening [28]. Ink flow beyond the feature boundaries provides an additional concept of dimensional distortion. A study assessed the role of different substrate properties using coated and uncoated paper and oriented polypropylene (OPP). Significant dimensional alteration was observed on the OPP substrate due to lateral ink spreading [29]. A further class of instability developed subsequently due to separation of the elastic printing plate from the substrate, known as viscous fingering and attributed to Saffman–Taylor instability [30]. This mechanism occurs when the less viscous air penetrates and displaces the more viscous ink, forming finger-like features [31]. Moreover, ink rheology can modify the features of viscous fingering. The morphology of viscous fingering was disrupted by increasing ink fluid elasticities with similar shear viscosity [32]. Ink rheology enhanced not only the viscous fingering formation but also the printing plate elasticity [33], anilox dip volume, and printing velocity [34]. Overall, these phenomena represent distinct flexographic printing defects that may affect ink distribution, resulting in geometrical fidelity and uniformity of printed features.
The impression applied between the printing plate and impression rollers is a key factor dominating the flexographic dimensional print quality. A study investigated the effect of several flexographic parameters including anilox volume, anilox force, and printing force on printed line width using two conductive silver inks, silver-flake ink (LS-441 AW) and silver particle ink (HPS-021LV), on 125 µm polyethylene terephthalate (PET) substrate, aiming to achieve a printed line finer than 45–100 µm. The findings revealed that, within a printing force range of 50 to 400 N, the printing plate exhibited elastic deformation; however, when the printing force exceeded 400 N, irreversible plastic deformation resulted [35]. Furthermore, Bould et al. quantified the effect of plate–substrate engagement, different anilox roll specifications and dot pitch using a UV-curable cyan ink on Oriented Polypropylene (OPP) film. Increasing the plate–substrate impression improved ink-film uniformity, leading to higher solid density and tone gain; the optimal solid density was most noticeable at engagements of 25–50 µm [36]. Thus, despite intensive studies on the quality of conventional flexographic print parameters, the effect of impression roller displacement, which governs the spacing between the printing plate cylinder and the impression roller, on the physical and electrical properties of printed graphite/carbon dot electrodes on paper substrates has received particularly little attention.
Herein, we provide further insight into the effect of relative impression displacement (RID) in flexographic printing. Specifically, we investigated the RK FlexiProof 100/UV, supplied by [RK PrintCoat Instruments Ltd. (UK)], in which the impression setting controls the displacement of the impression roller relative to a reference position. This displacement influences the distance between the printing plate cylinder and the impression roller; however, it does not directly represent the distance between them. The geometrical fidelity was investigated with different distances between the plate and the paper substrate. Furthermore, the formation of printing defects such as halo effects, ink accumulation in unwanted regions and viscous fingering was looked at with different impression displacements. In addition, surface profile scans were undertaken to examine the effect of RID on the printed layer as well as the underlying paper substrate. Finally, sheet resistance measurements were carried out. This work provides insight into the influence of impression roller displacement on the print quality and electrical performance of flexographically printed conductive layers, which may be useful for the development of printed electronics.
2. Experimental Details
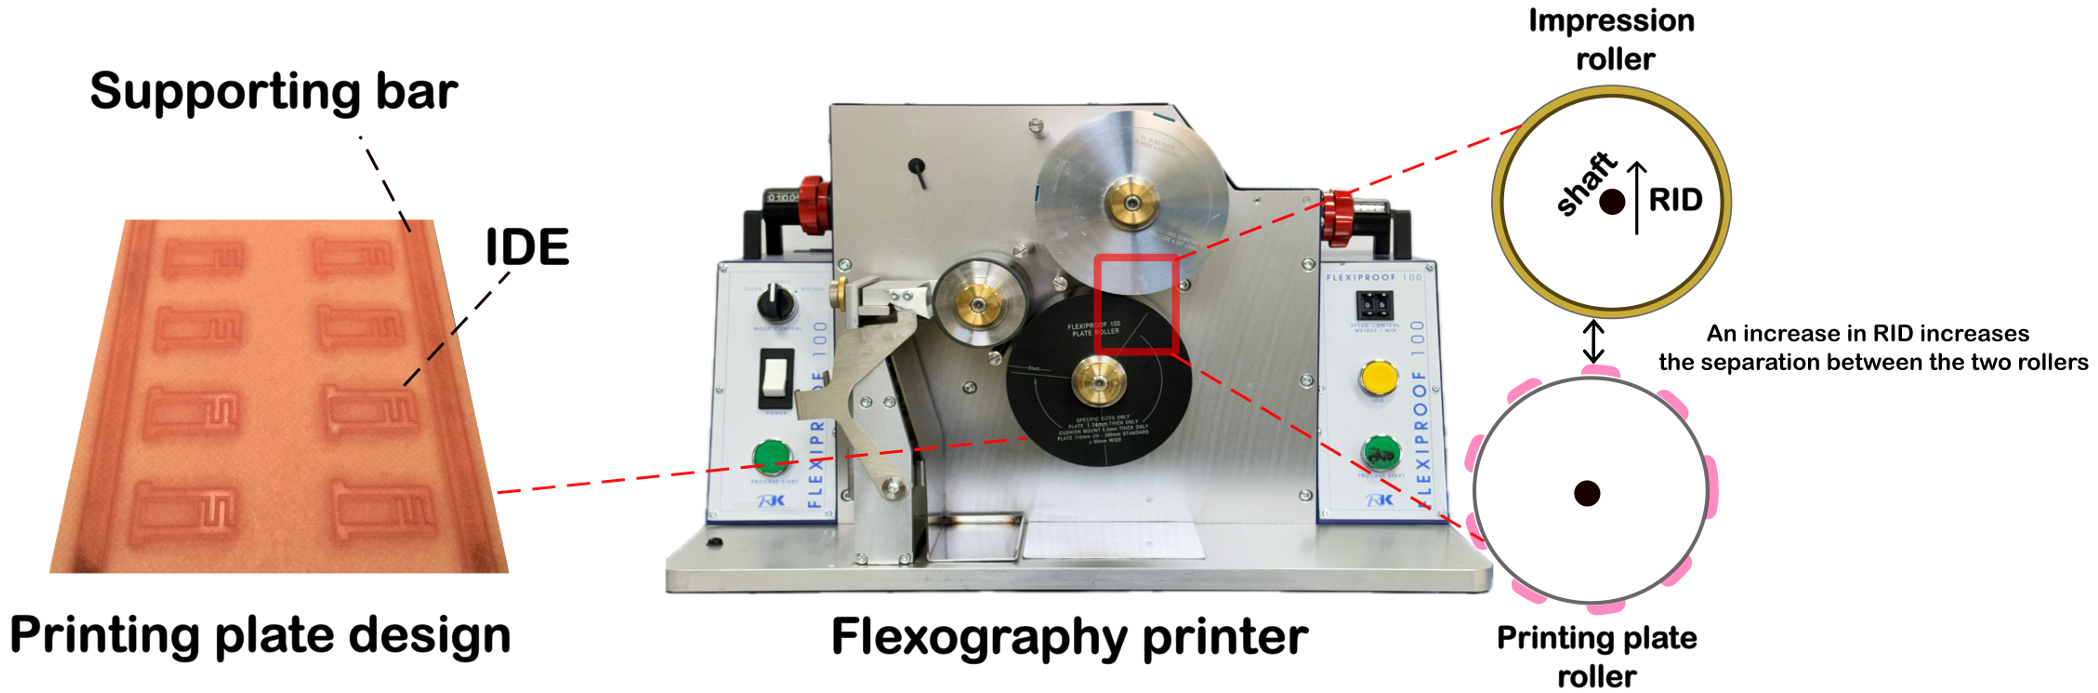
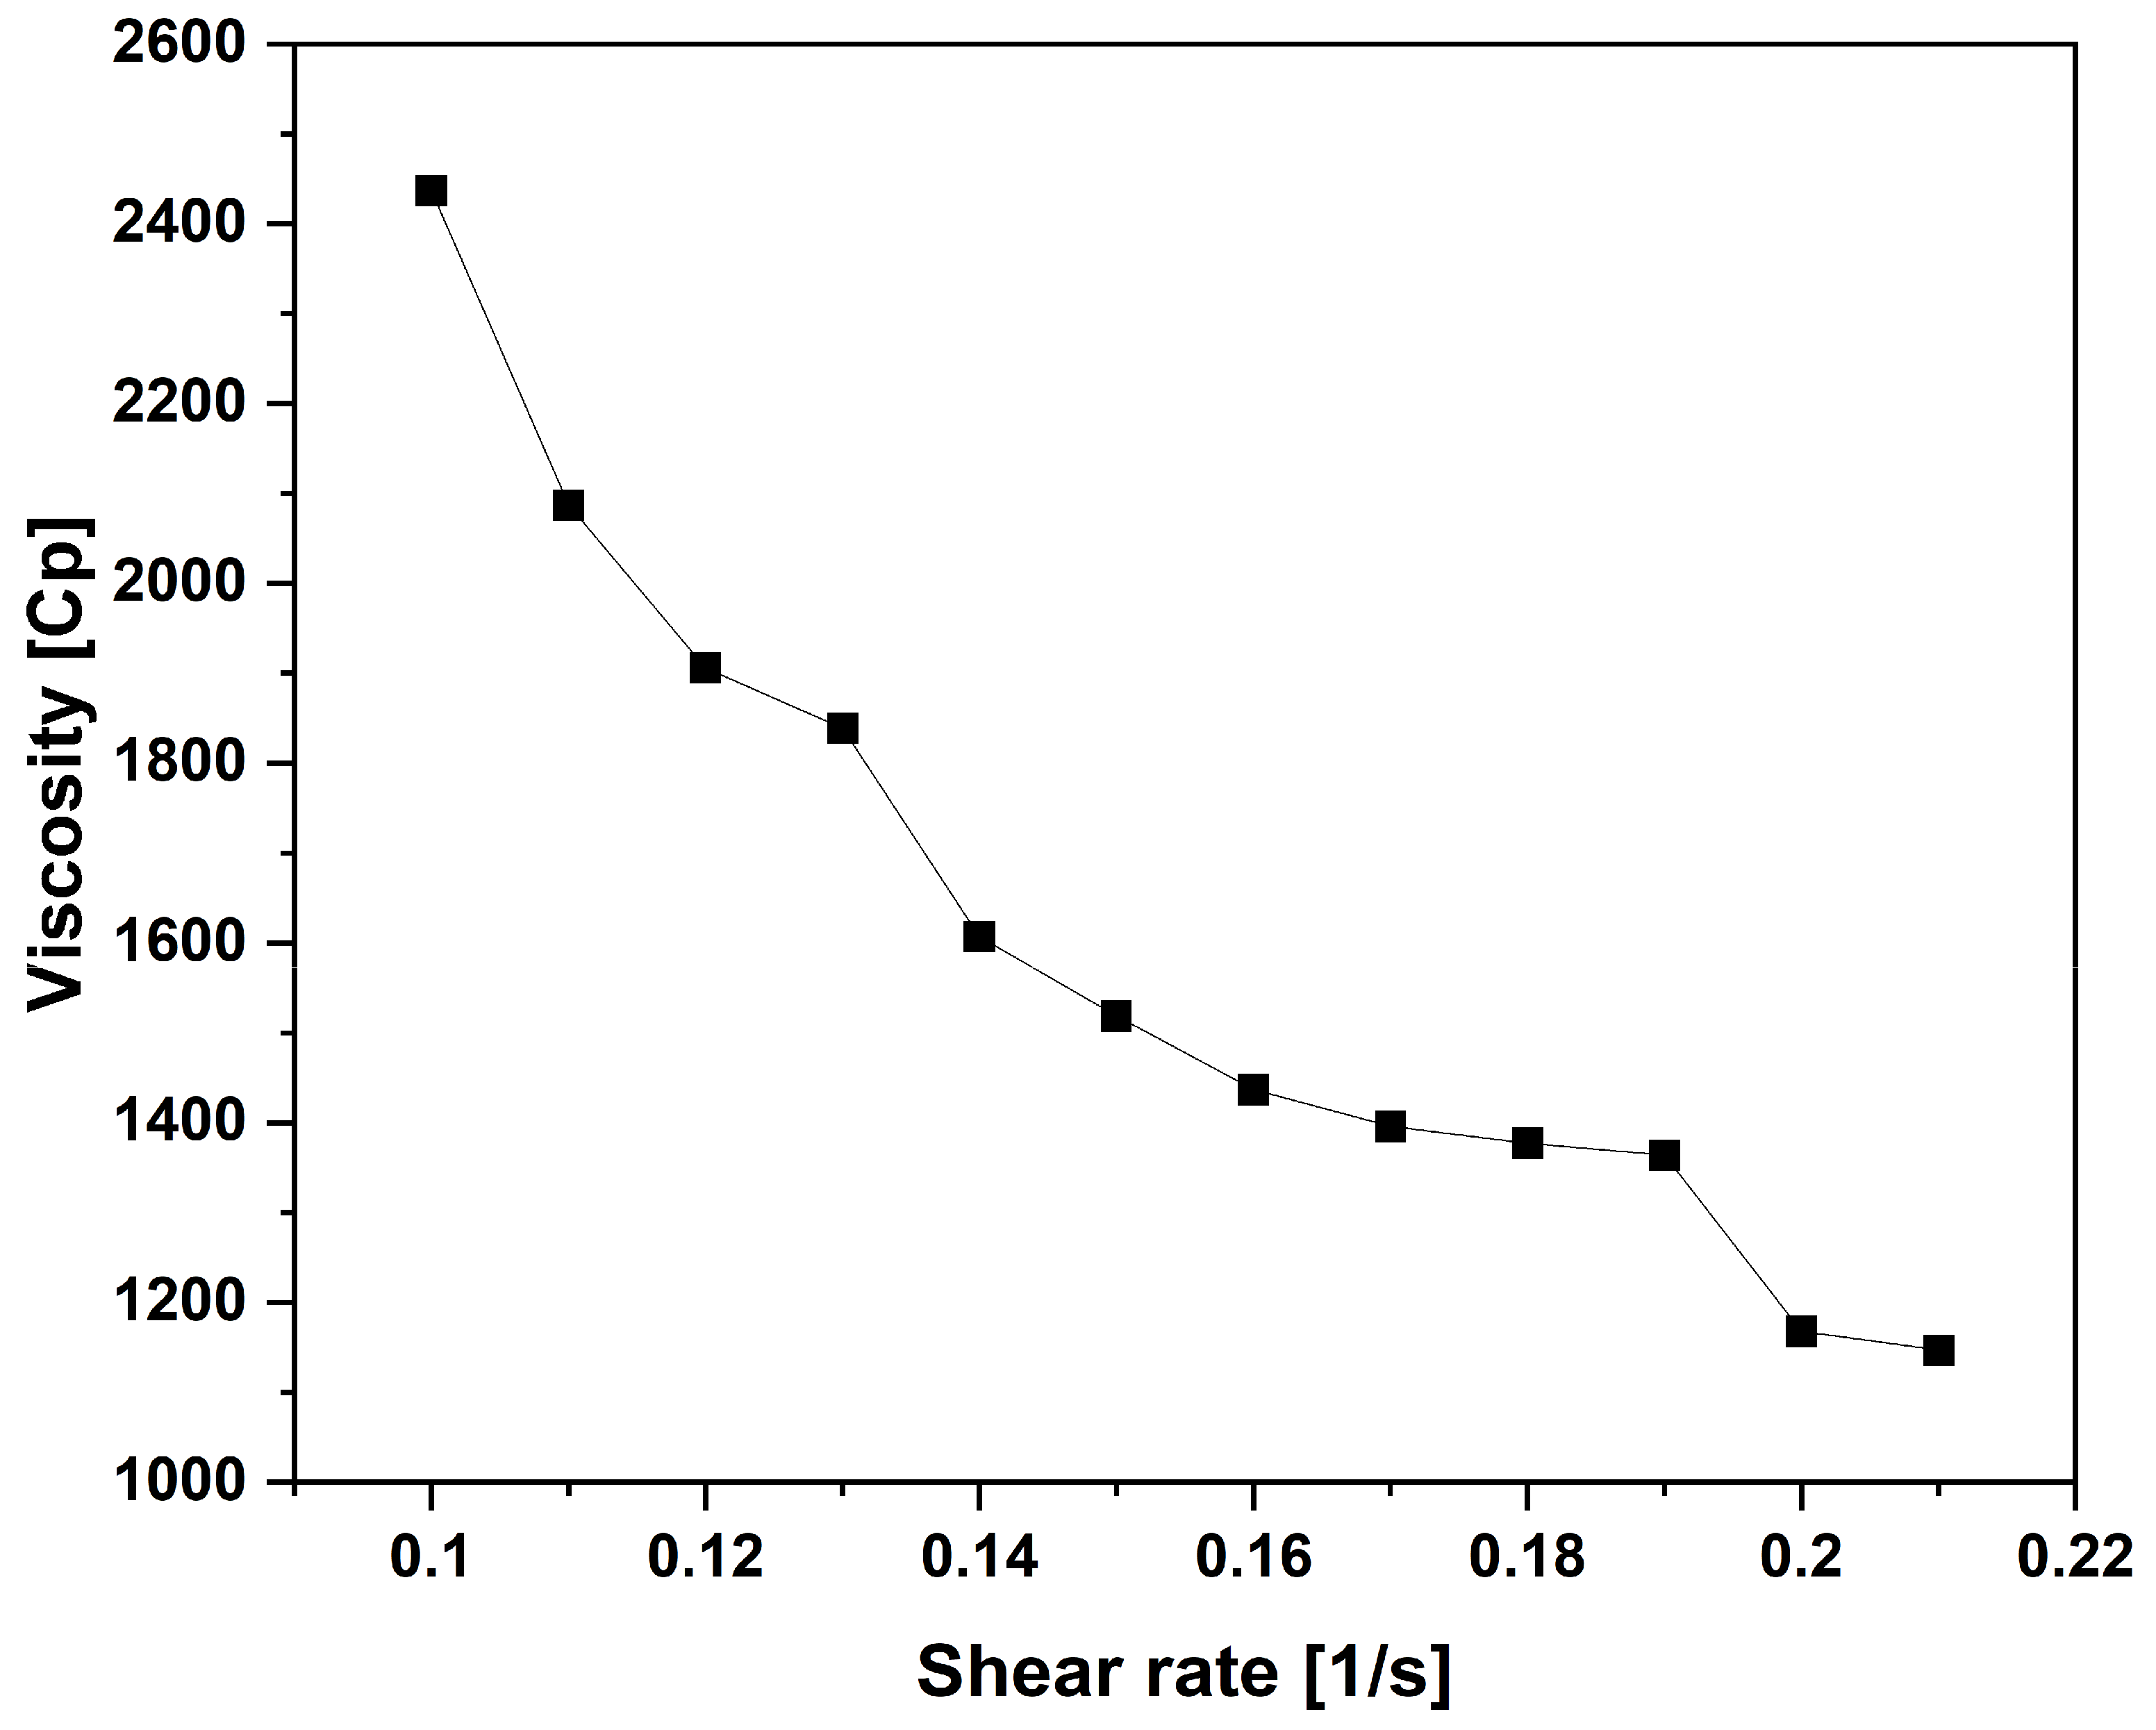
For this work, SunTronic conductive graphite/carbon dot ink (GFT4600) for flexographic printing was supplied by Sigma Aldrich, St. Louis, MO, USA. The graphite/carbon dot ink used in this study was specifically formulated for flexographic printing. It consists of 89.5 ± 8.2 nm carbon dots [37]. According to the manufacturer, the ink has a nominal viscosity of 1300–1700 cP, measured using a Brookfield viscometer under low-shear conditions. To further investigate its rheological behavior, viscosity measurements were performed using a Brookfield viscometer (Model DV3TLVCJ0), Middelborough, MA, USA. at a temperature of 25 °C over a shear rate range of 0.10–0.21 s−1. The measured viscosity was plotted against shear rate to obtain a basic flow curve and evaluate the flow behavior of the ink. Printing was performed using an RK Flexiproof 100/UV manufactured by RK PrintCoat Instruments Ltd., Royston, UK. Printing was carried out on standard matte/gloss proofing paper supplied by RK PrintCoat Instruments Ltd., Royston, UK. In this work, the printing speed was set at 20 m/min, and an anilox roller consisting of a line count of 55 L/cm and volume of 18 cm3/m2 was used. The relative impression displacement (RID) was adjusted using the impression setting on the RK FlexiProof 100/UV, RK PrintCoat Instruments Ltd., Royston, UK. Each division corresponds to 4 µm displacement of the impression roller shaft/roller relative to the factory reference position (0000). The printing plate roller remains fixed. Increasing the setting moves the impression roller away from the printing plate roller. RID therefore represents displacement from the reference position rather than the actual gap between the printing plate and the substrate or nip engagement. The settings used were 0012, 0025, 0050, 0075, 0100, 0125, 0150 and 0175, corresponding to RID values of 48, 100, 200, 300, 400, 500, 600 and 700 µm, respectively. The anilox setting was kept constant at 0100, corresponding to 400 µm displacement from its reference position, as recommended by the manufacturer. The nominal adjustment resolution was 4 µm.
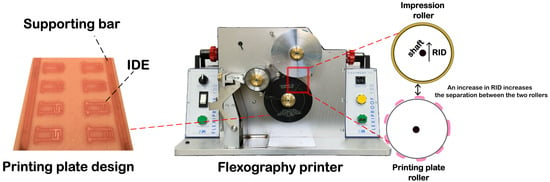
The printing plate used for the experiments consisted of interdigitated electrodes (IDEs) with a width and gap of 1 mm. The printing plate also consisted of supporting bars at each side to assist in mounting the printing plate on the printing plate cylinder. Figure 1 illustrates a photograph of the flexography printer and the printing plate used for this study. All printed papers were left at room temperature to dry.
Figure 1.
Photographs of the flexography printer and printing plate used in this work.
After printing, photographs were taken of the IDEs to assess their morphological definition. Furthermore, an optical microscope connected to a digital MC-170 HD camera, Leica Microsystems GmbH, Wetzlar, Germany, was used to explore the printing defects induced on the interdigitated electrodes with different RID values. The use of an optical microscope to examine geometrical fidelity in printed layers is well-known in the literature [38]. The finger width and gap were measured using ImageJ software, version 1.54g, with the optical microscope scale bar as the reference. Twenty measurements at different positions were taken for each parameter, and error bars represent the standard deviation. The gap was measured between the edges of adjacent printed fingers. Surface profiles were collected for the printed supporting bars on the paper substrate. Surface profiles were measured using a contact stylus profilometer (Dektak 150, Veeco Instruments Inc., Plainview, NY, USA), which detects vertical stylus movements due to surface height variations and converts them into a digital height–distance profile [39]. Measurements were performed at a stylus force of 4 mg, with a horizontal sampling interval of 0.400 μm/sample and a nominal vertical resolution of 8 nm in the selected 524 μm measurement range. The recorded data were plotted using OriginLab software, Origin 2023b (OriginLab Corporation, Northampton, MA, USA). Finally, sheet resistance was measured using a Jandel four-point probe system (Model: RM3-AR) (Jandel Engineering Ltd., Leighton Buzzard, Bedfordshire, UK). Sheet resistance was measured at five different positions on three independently printed samples. Results are presented as the mean ± standard deviation.
3. Results and Discussion
3.1. Influence of Relative Impression Displacement on Print Quality
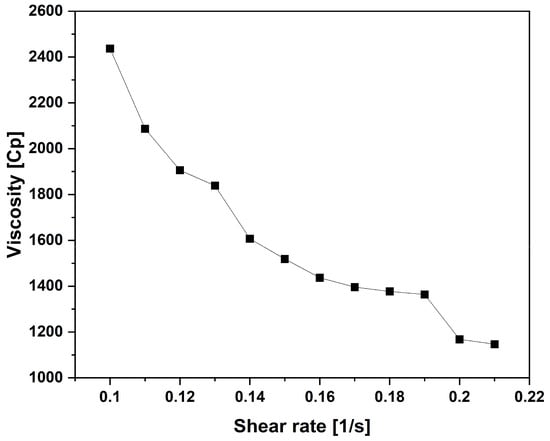
Figure 2 illustrates the variation in viscosity of the graphite/carbon dot ink with increasing shear rate. The viscosity decreased from approximately 2440 to 1150 cP as the shear rate increased from 0.10 to 0.21 s−1, representing a reduction of approximately 52.9%. This indicates that the ink exhibits shear-thinning (non-Newtonian) behavior [40], where its apparent viscosity decreases with increasing shear rate. Such behavior suggests reduced resistance to flow, which may facilitate ink transfer and spreading during flexographic printing and influence the formation of printing defects, including viscous fingering.
Figure 2.
Variation in the viscosity of the graphite/carbon dot ink as a function of shear rate (0.10–0.21 s−1), demonstrating shear-thinning behavior.
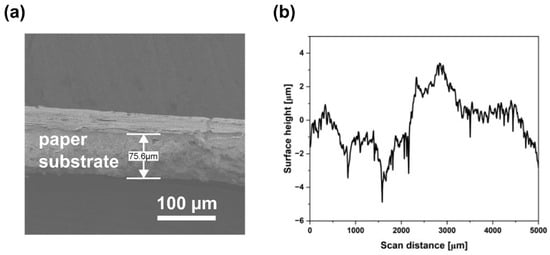
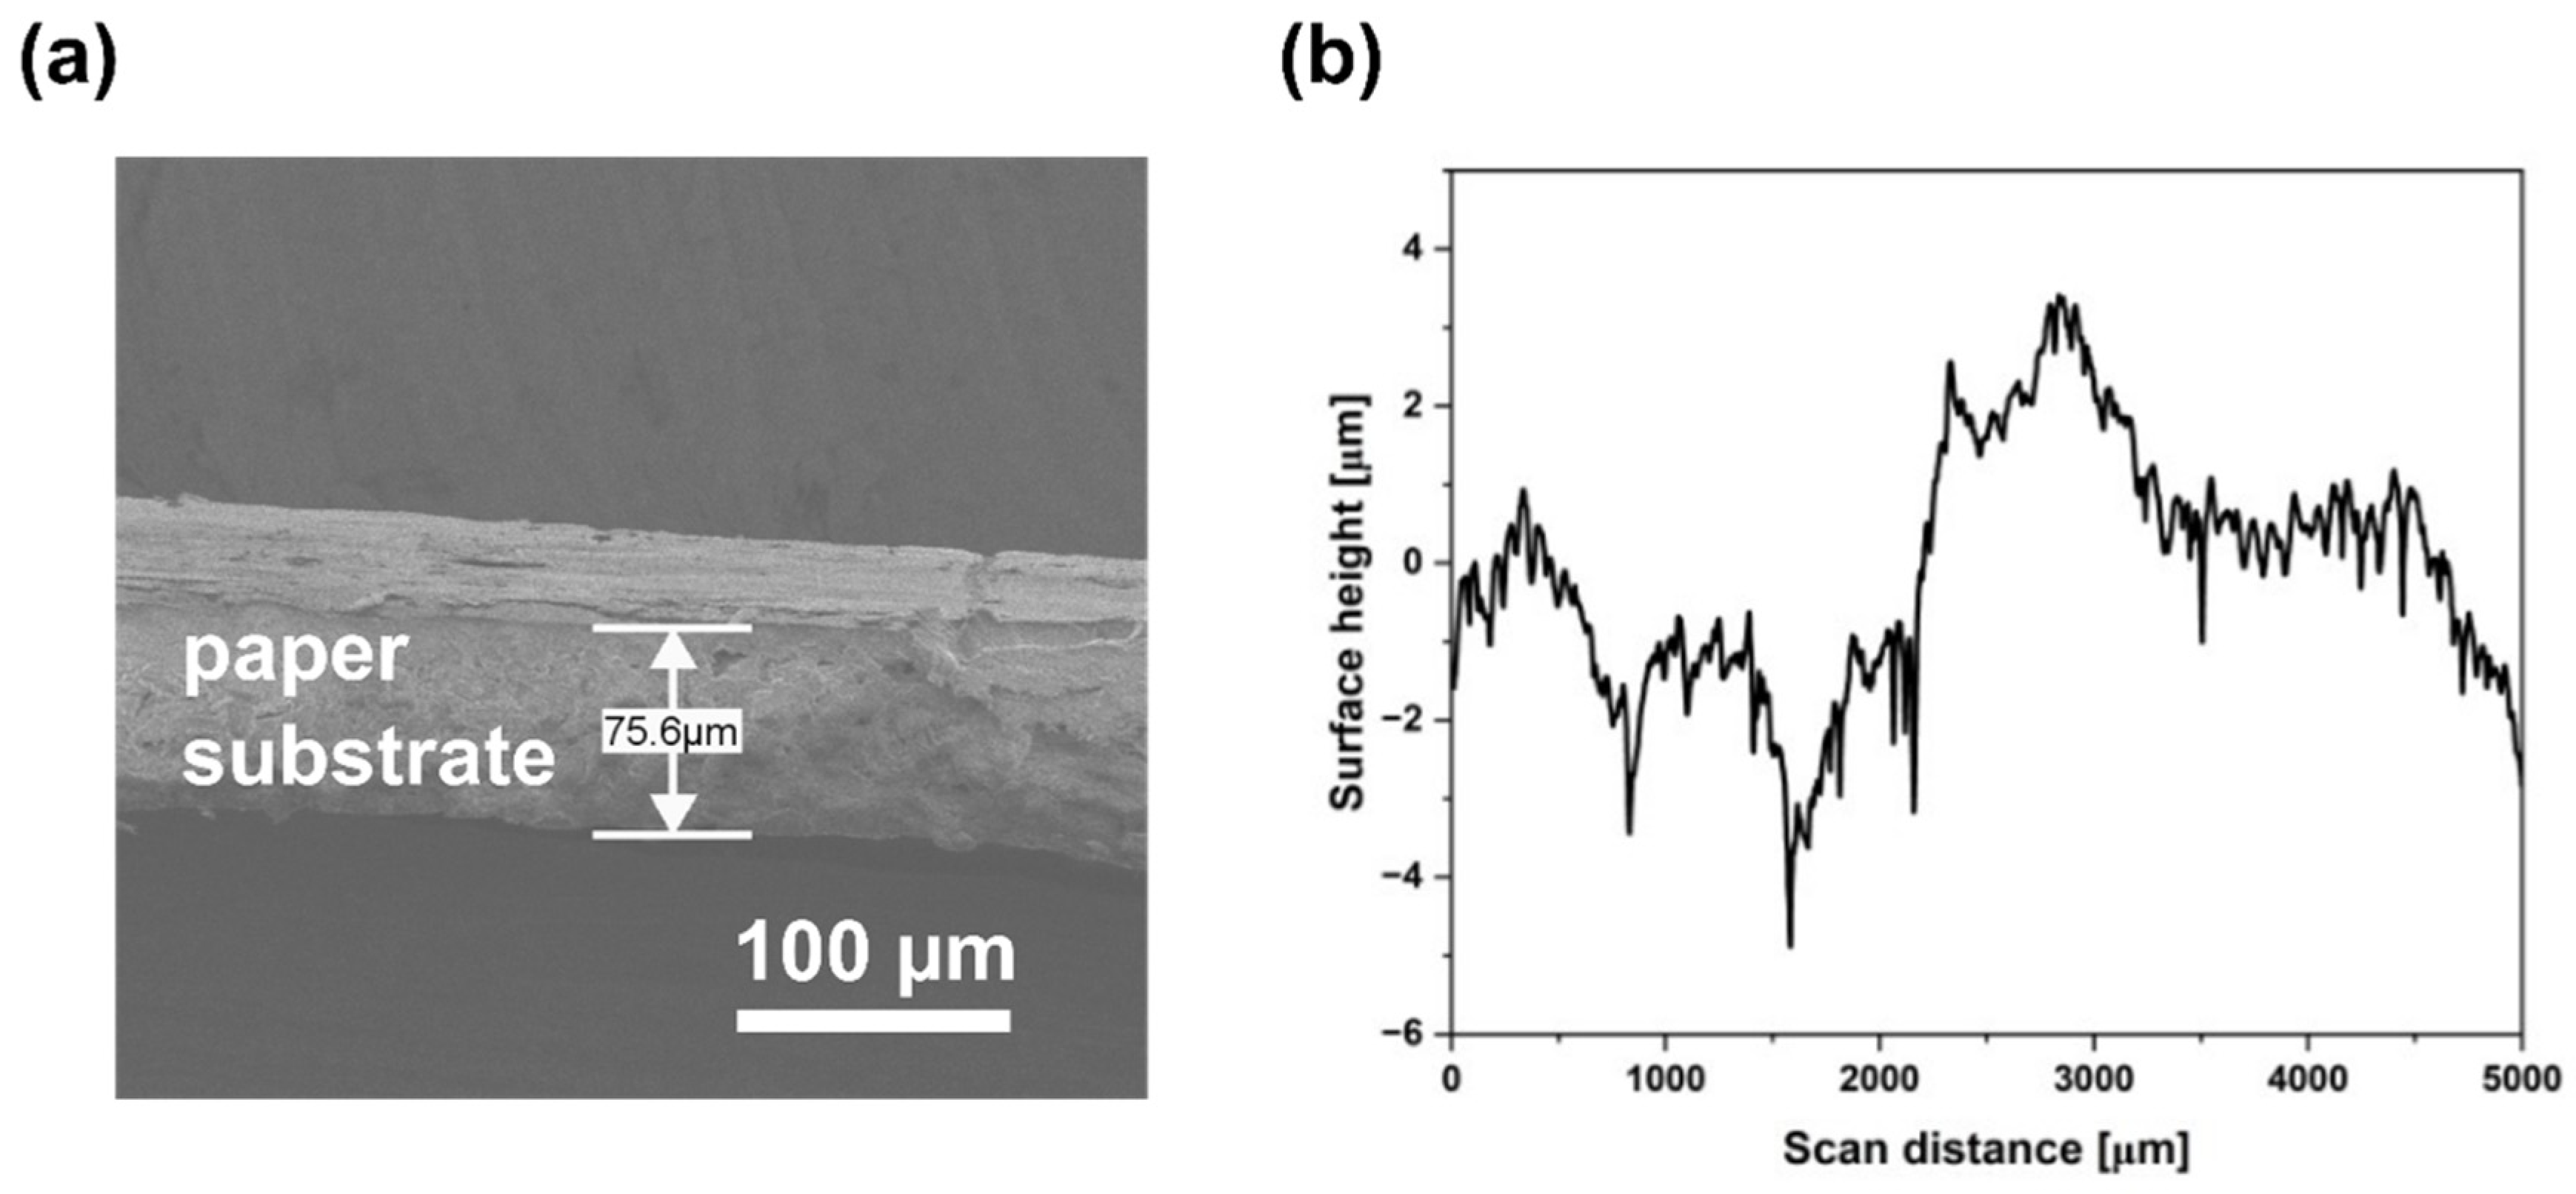
Figure 3 shows a cross-sectional SEM image and surface profile of the unprinted paper substrate. The average substrate thickness was 78 ± 3.2 μm. The surface profile exhibited an irregular topography with local peaks and valleys. The printed side of the paper had a glossy finish, whereas the opposite side was matte, suggesting the possible presence of a surface coating. Although absorbency was not measured directly, the printed layers remained intact without visible swelling or deformation over time.
Figure 3.
Characterization of the unprinted paper substrate: (a) a cross-sectional SEM image showing the substrate thickness and (b) a surface profile obtained using stylus profilometry.
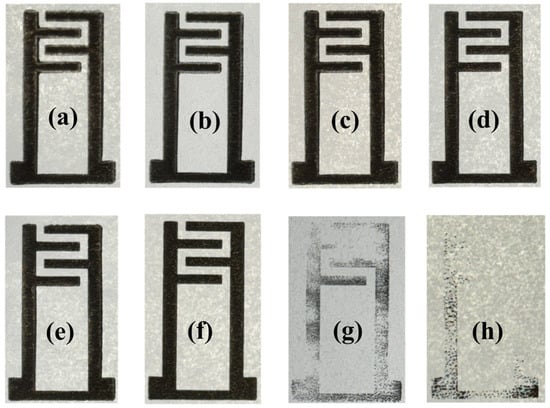
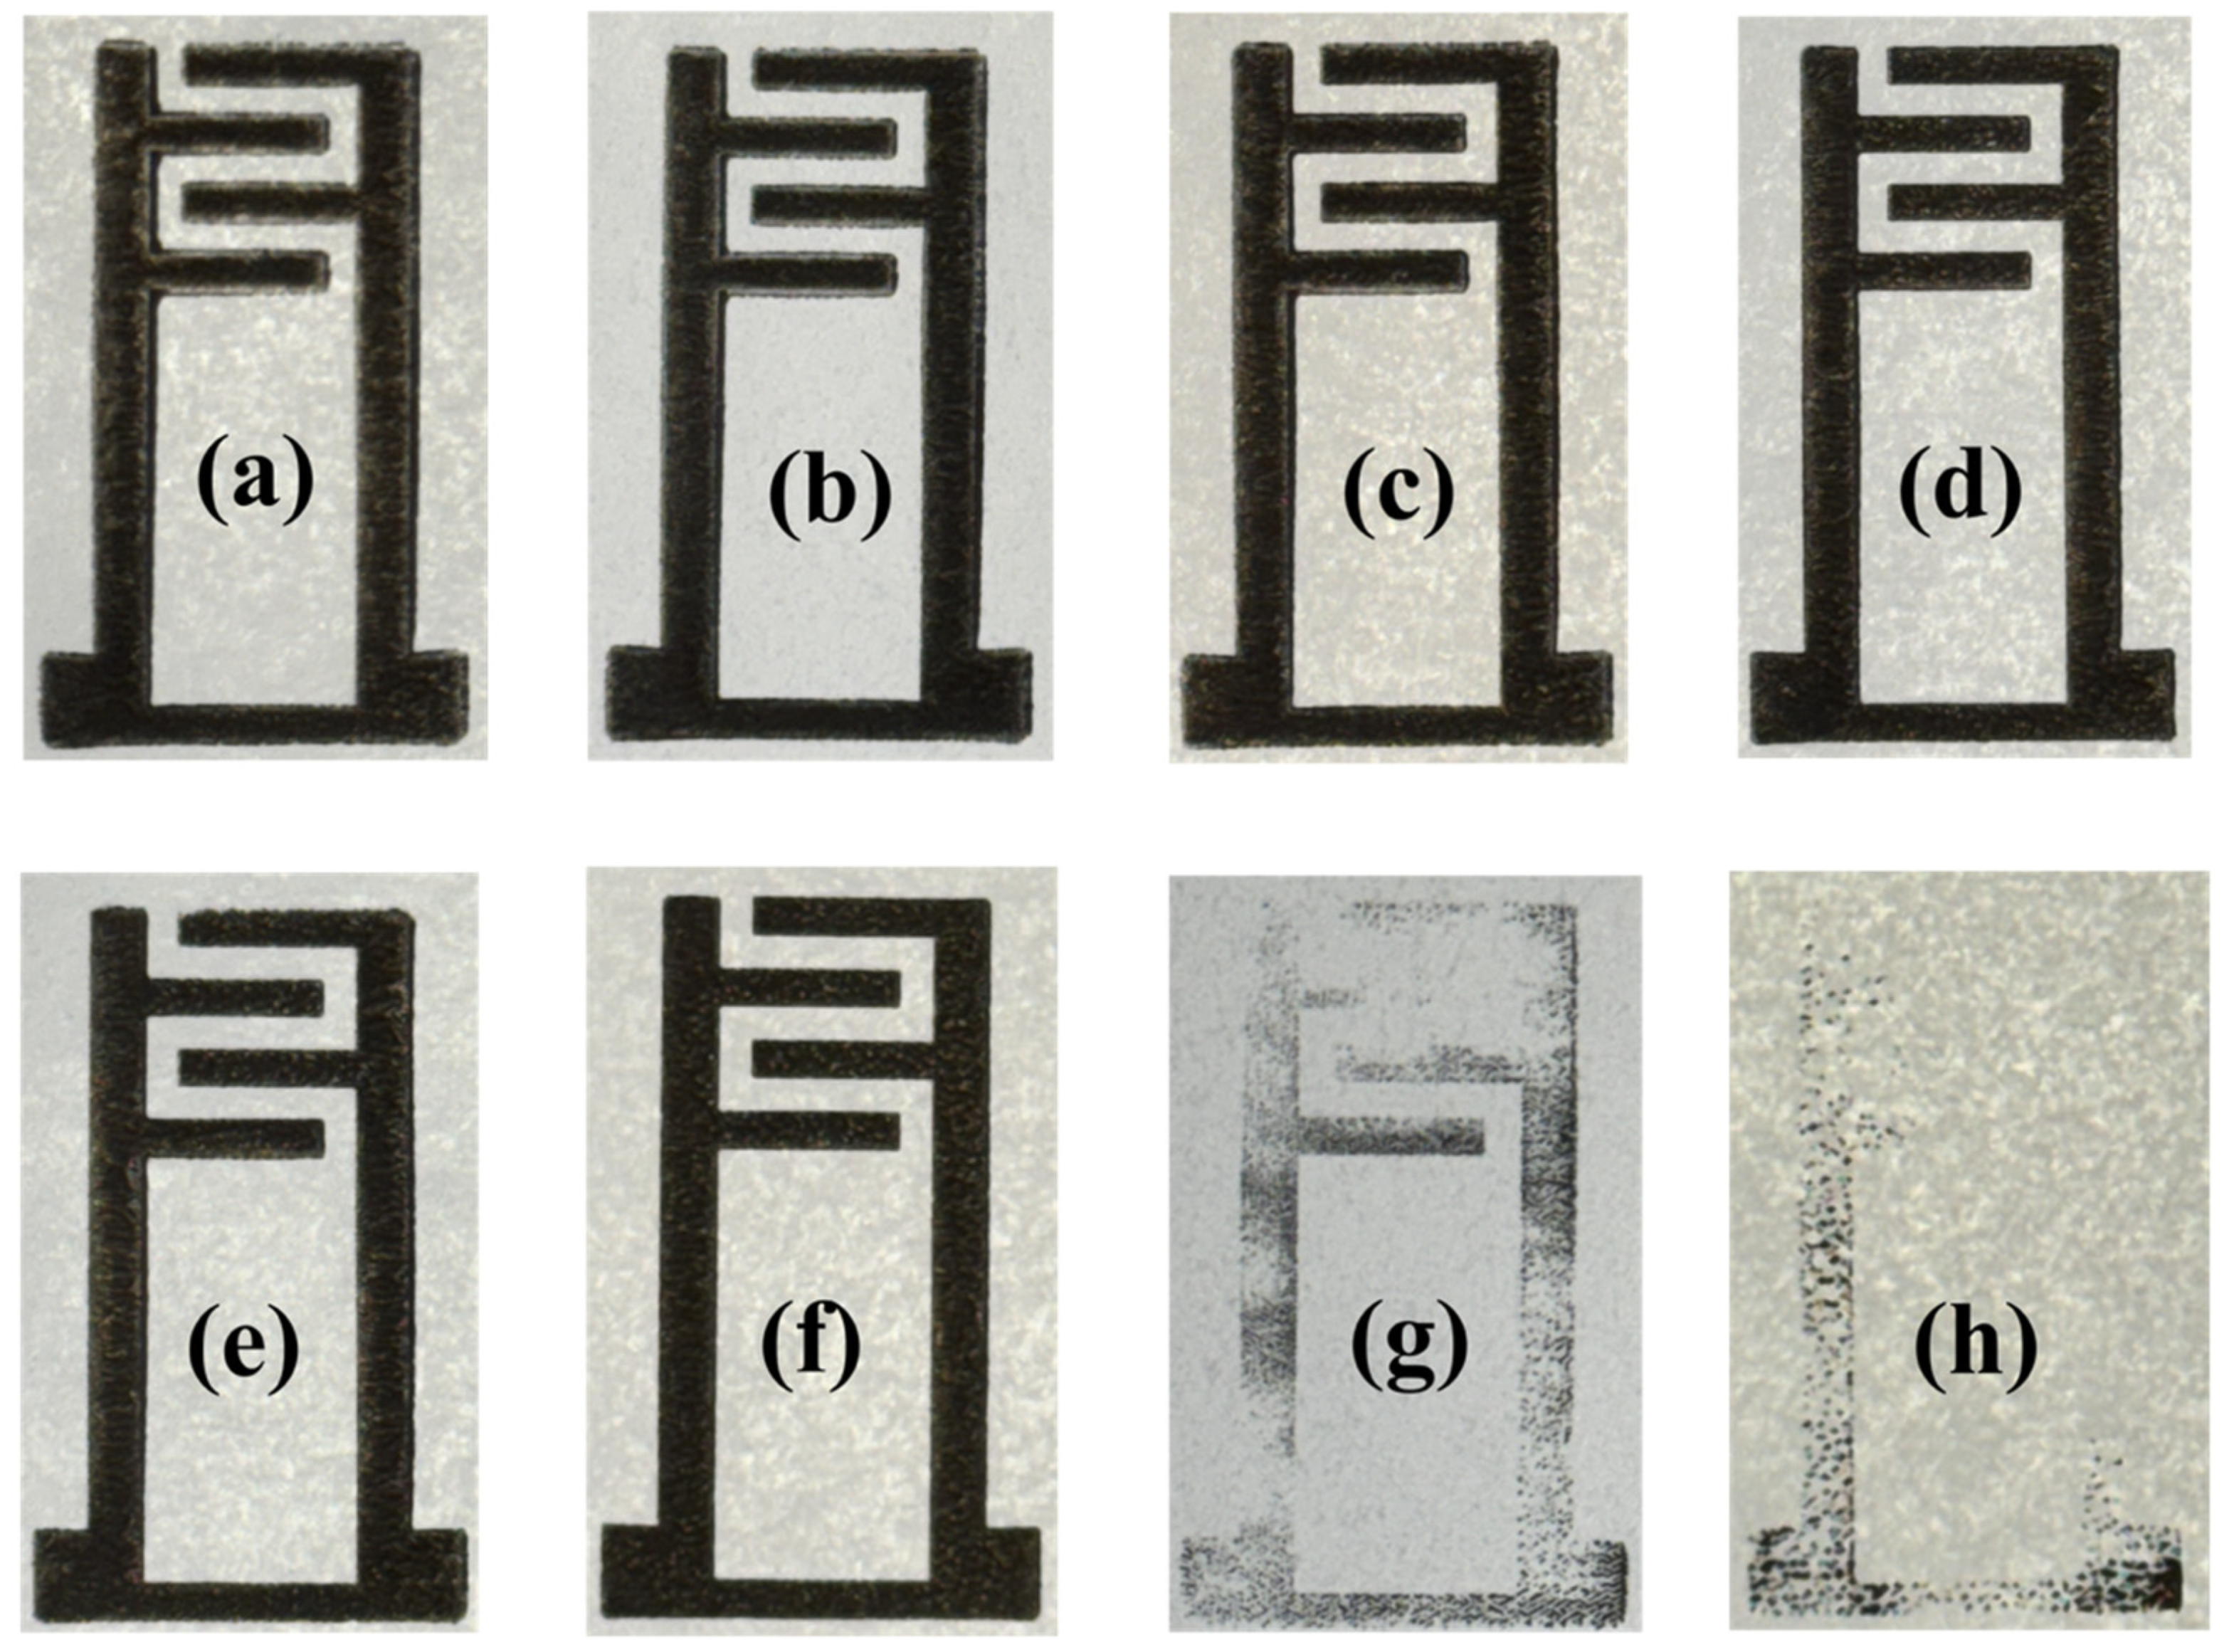
Figure 4 shows the printed G/CD IDEs at different RIDs. The printed layers remained intact without swelling over time, suggesting satisfactory adhesion between the ink and the paper substrate. Figure 4a–h correspond to RID values of 48, 100, 200, 300, 400, 500, 600 and 700 μm, respectively. When RID = 48 μm, the print quality looked poor, especially at the edges where broadness was observed with poor edge definition. Ink accumulated around the feature boundaries, resulting in irregular finger ends rather than well-defined rectangular profiles. As the RID increased to 100 and 200 μm, similar print quality and edge broadening existed. However, a very slight improvement in edge sharpness was noticed as the RID increased from 48 to 200 μm. The poor print quality and edge irregularities achieved for RID = 48 to 200 μm are attributed to the excessive impression induced by the small RID, causing the ink to be laterally displaced. Figure 5a–f show the ends of fingers on the IDEs when RID = 48, 100, 200, 300, 400 and 500 μm, respectively. Figure 5a–c clearly illustrate the printing defects discussed above.
Figure 4.
Photographs of the flexographically printed G/CD IDEs at different RIDs: (a) 48, (b) 100, (c) 200, (d) 300, (e) 400, (f) 500, (g) 600, and (h) 700 μm.
Figure 5.
Enlarged photographs of the printed G/CD IDE finger ends at different RIDs: (a) 48, (b) 100, (c) 200, (d) 300, (e) 400, and (f) 500 μm. The blue scale bar is 1 mm. The enlarged photographs show the enhancement in print quality with increasing RID.
As the RID increased to 300, 400 and 500 μm, the print quality and pattern definition improved. The printed fingers followed the rectangular profile of the printing plate with an improvement in edge sharpness. As the RID increased to 500 μm, ink accumulation drastically decreased around the edge boundaries, indicating reduced impression due to the increased separation between the printing plate and the substrate on the impression roller. The best print quality with sharpest edges was achieved at RID = 500 μm. The results suggest that improved print quality is achieved as the printing condition approaches the ‘kiss-print’ condition, where sufficient contact between the printing plate and the substrate is maintained for ink transfer without excessive impression. Deteriorated and incontiguous ink transfer was noticed as the RID increased to 600 and 700 μm, with large areas being unprinted. This suggests that the contact between the printing plate and the substrate was not sufficient for ink transfer, hence leading to poor ink transfer. Therefore, the printed layers at RIDs of 600 and 700 µm were excluded from the other experiments.
The photographic observations therefore demonstrate a clear dependence of the macroscopic print quality on the plate-to-impression separation. At smaller separations, excessive impression resulted in broadened and poorly defined features, while intermediate separations provided improved pattern definition with complete ink transfer. However, excessive separation ultimately resulted in incomplete printing due to insufficient contact between the printing plate and the substrate.
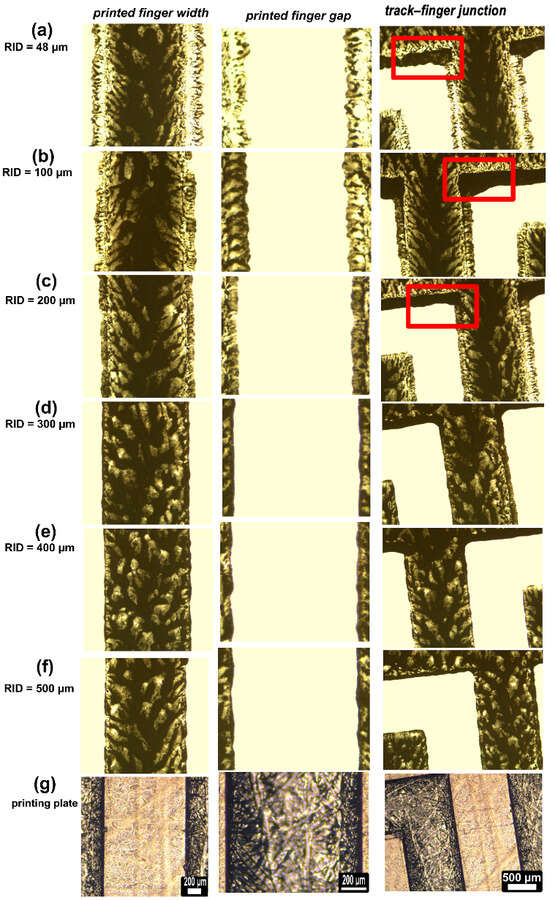
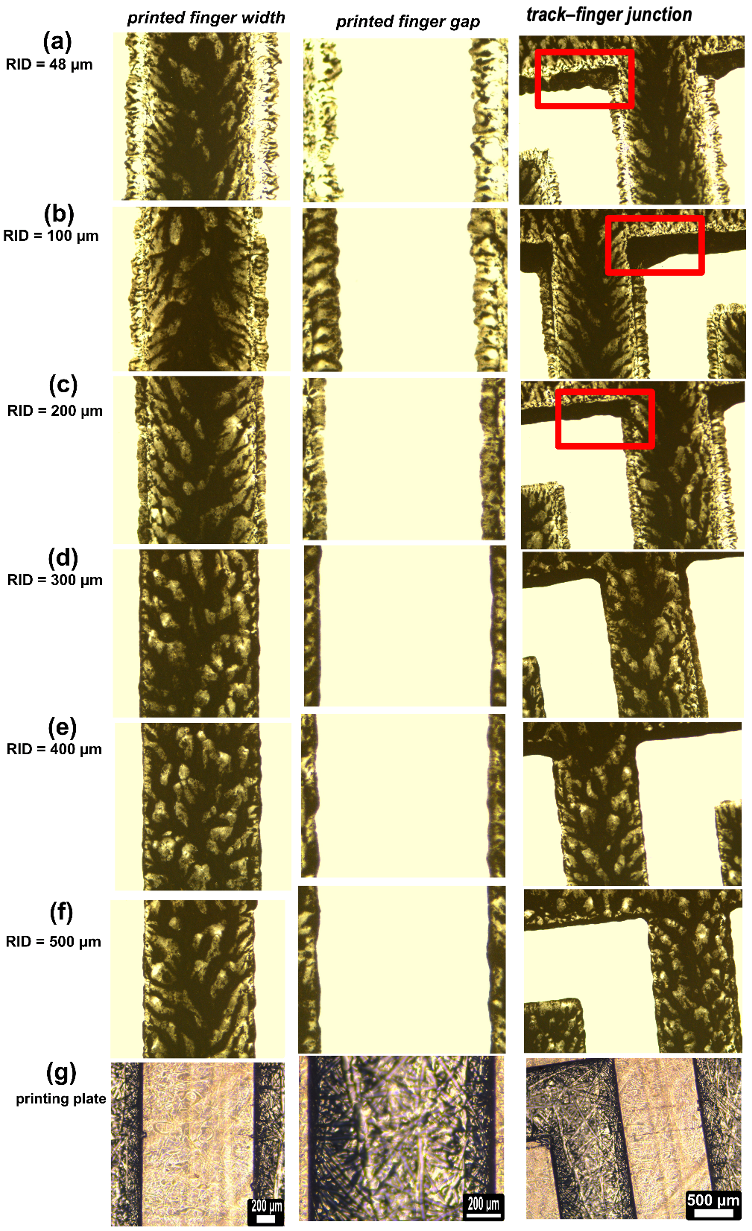
The effect of different RID settings was further investigated with an optical microscope. Figure 6 illustrates the printed G/CDs under the different RID values. The printed finger width and gap are shown (Figure 6a–f) as well as the width and gap of the fingers on the printing plate (Figure 6g). As can be seen, with the smallest relative impression displacement (RID = 48 μm), ink tended to flow laterally with the induced load from printing. This led to a halo-effect-like defect and was most pronounced at this RID value. As the RID increased, the halo effects started to diminish to almost no halo effect in the RID range of 300–500 μm. The halo effects reduced the gap between adjacent fingers, but the gap increased as the RID values increased. Additionally, as the RID increased, the definition of the edges improved. With small RID values, the edges appeared to be rough.
Figure 6.
Optical images of printed finger width and gap values and optical images of track–finger junctions under different RID values, with the corresponding printing plate images. The scale bars are 200 μm except in the images showing the track–finger junctions, where they represent 500 μm. Printing defects decreased with increasing RID. Red squares represent ink accumulation at the junction.
It is also worth noting that ink accumulated at the junction between the printed track and the fingers as displayed in the red squares in Figure 6. This is most likely attributed to the excessive load induced between the printing plate and the substrate. During printing at small RID values (i.e., 48–200 μm), an excessive amount of ink moved laterally away from the printing regions beyond the edges, and this was mostly evident at the track–finger junction. However, as the RID value was increased to 300 μm, this phenomenon started to vanish. Therefore, small values of RID will lead to unwanted printing defects such as halo effects and accumulation of ink at the junctions between the printed lines.
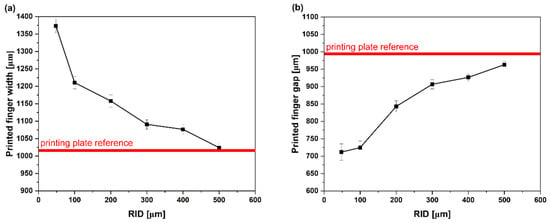
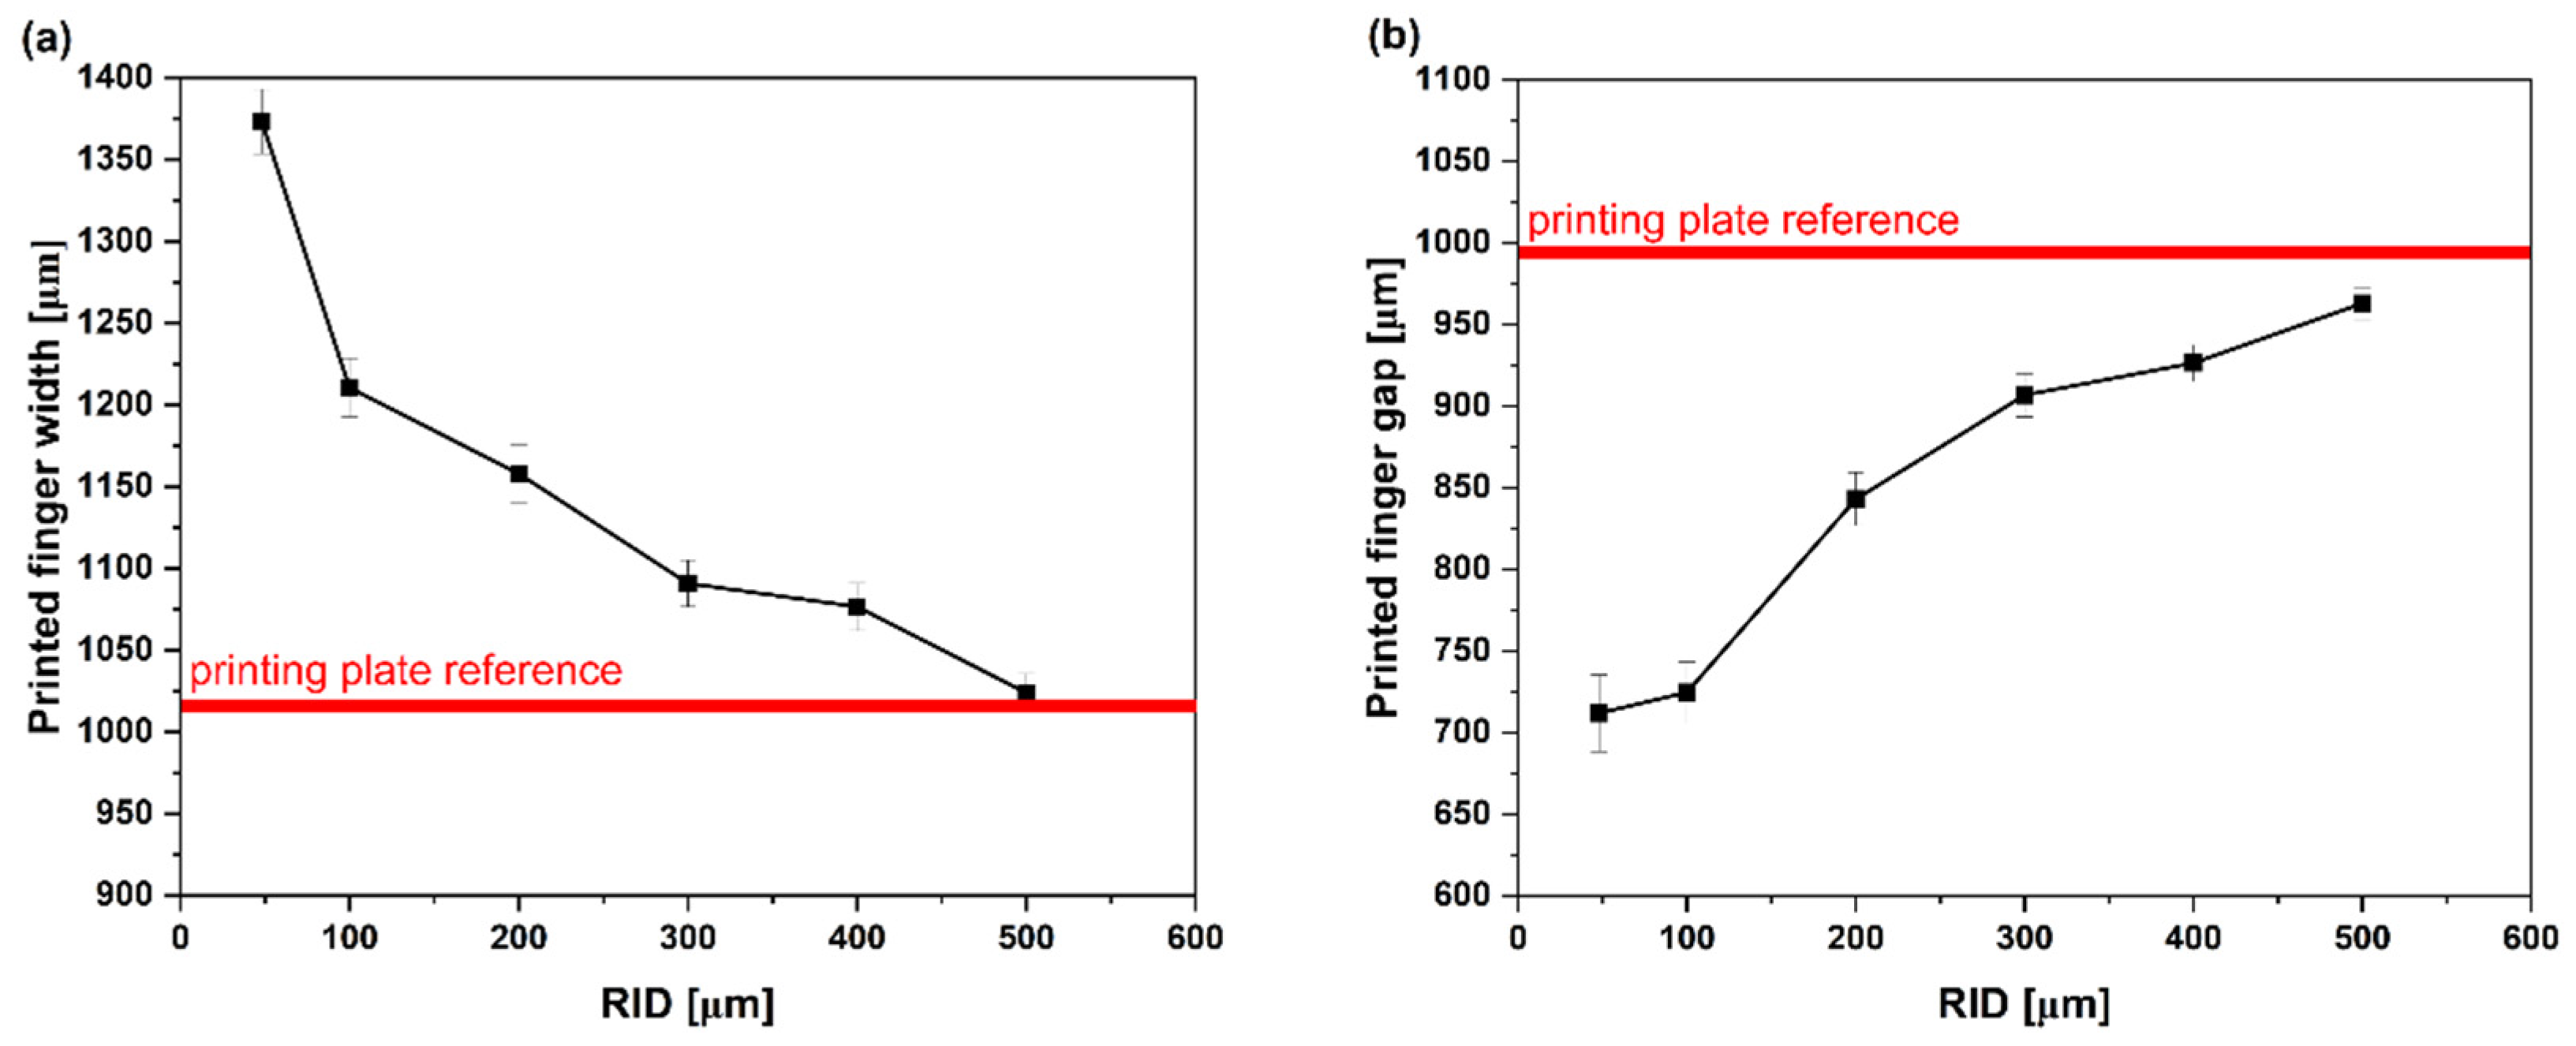
The mean width and mean gap of the printed fingers were measured and compared to those of the printing plate. Figure 7a,b illustrate the measured finger width and finger gap with different RID values relative to the printing plate (shown as red bands in the two line charts). As can be seen, as the RID increased from 48 to 500 μm, the printed dimensions started to follow the printing plate dimensions. Furthermore, Table 1 shows the measured dimensions and the deviation as a percentage compared to the printing plate. The deviation in printed finger width and gap relative to the printing plate dimensions was calculated using
Figure 7.
(a) Printed finger width and (b) printed finger gap with different values of RID. The red band denotes the printing plate dimensions. Results are presented as the mean ± standard deviation (n = 20 measurements). As RID increases, the dimensions of the printed layers become closer to those of the corresponding features on the printing plate.
Table 1.
Percentage deviation of the printed finger width and finger gap from the corresponding printing plate dimensions at different RID settings.
The finger width and gap deviations were significant when RID = 48 μm. As the RID increased from 48 to 500 μm, the deviation decreased from +37.60% and −28.02% to +2.6% and −2.63% for the printed finger width and gap, respectively. Positive values of deviations shown in Table 1 indicate that the printed dimension was larger than the corresponding printing plate dimension, whereas negative values indicate that the printed dimension was smaller. Eventually, the printed fingers started to be close to the dimensions of the fingers seen on the printing plate. The results here demonstrate that the relative impression displacement in such a printer plays a major role in the morphology and geometrical fidelity of printed patterns.
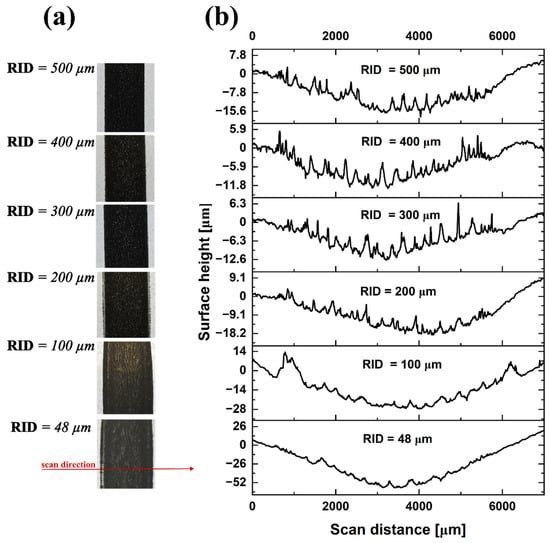
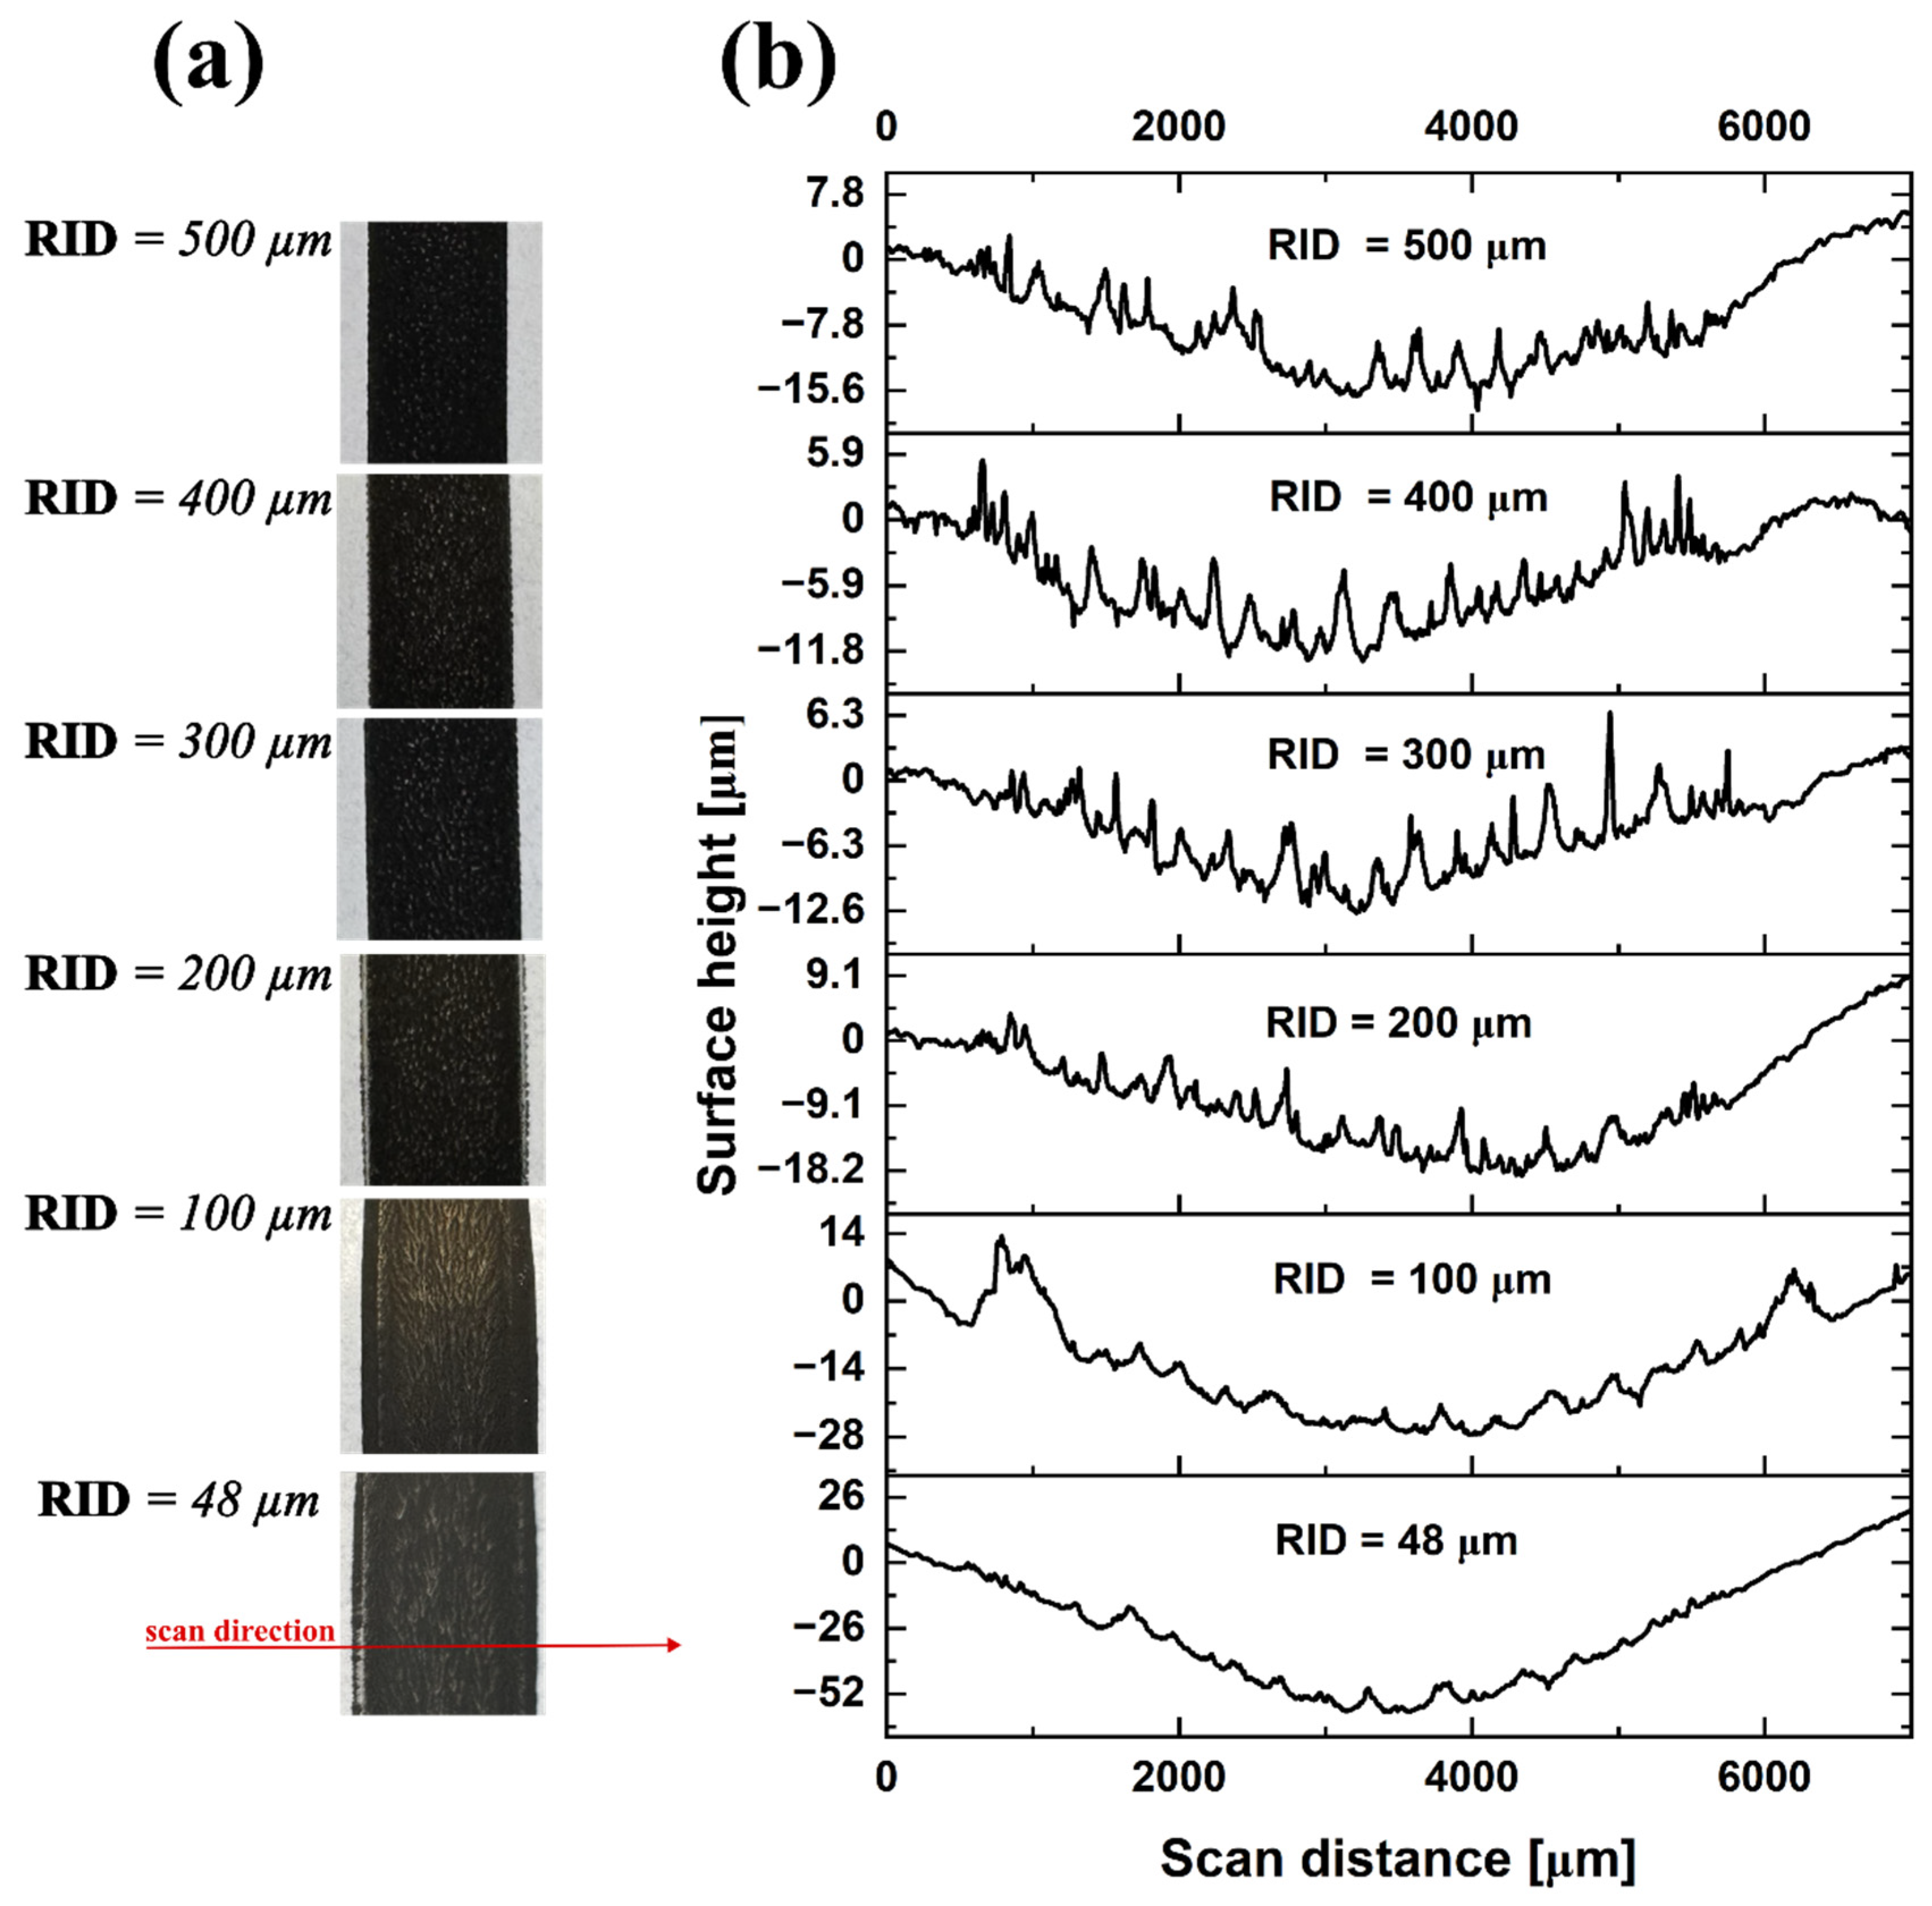
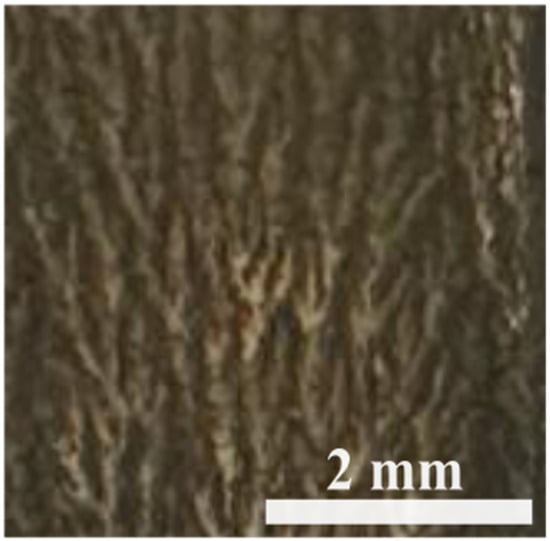
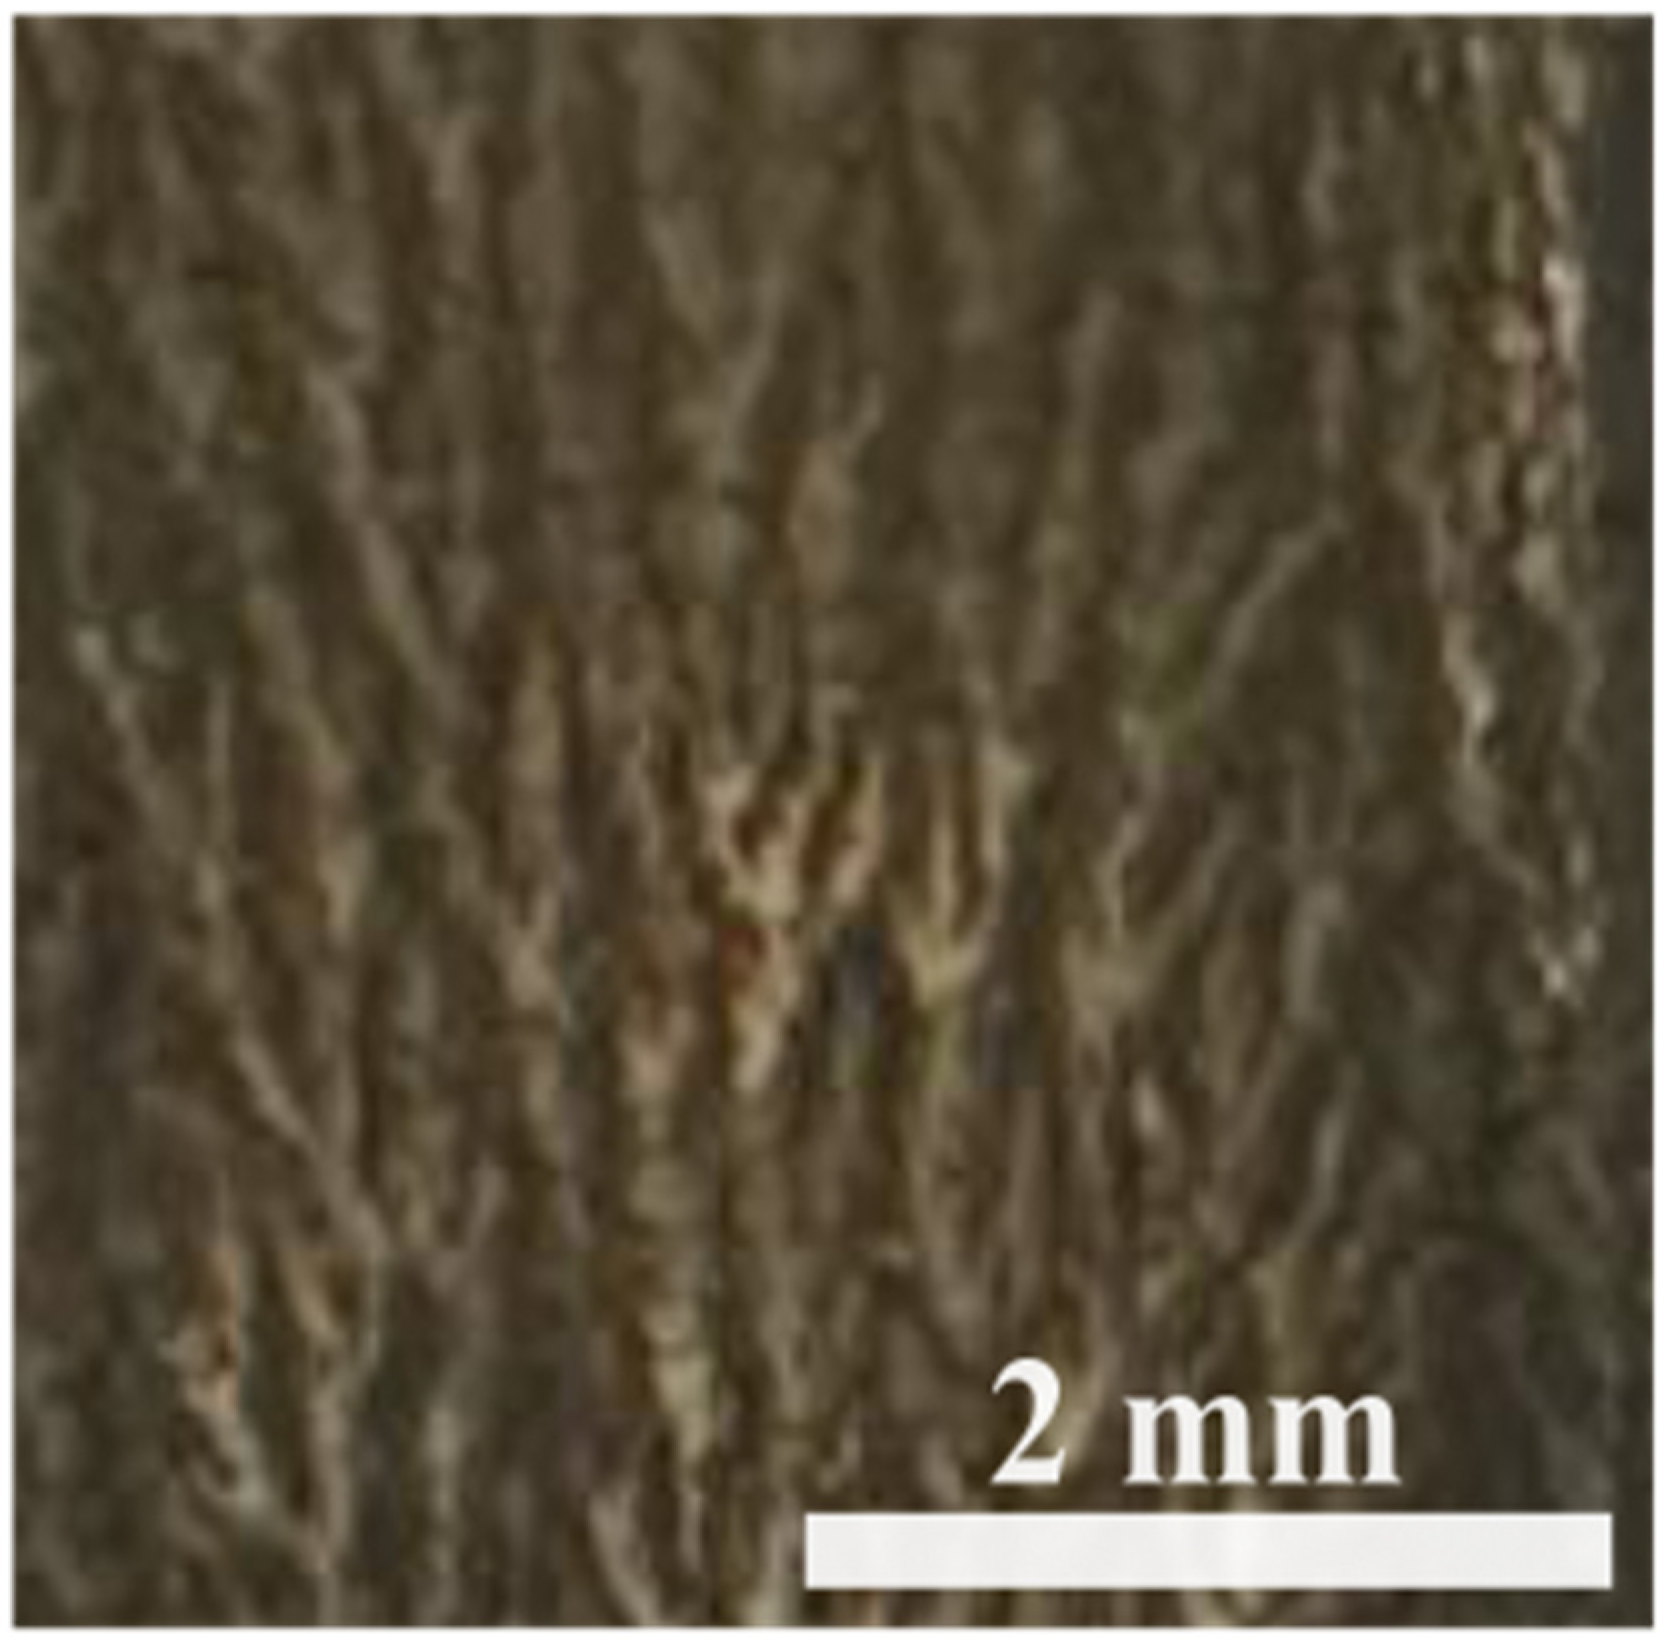
Figure 8a shows sections of the printed supporting bars with different RID values. The effect of small RID (i.e., 48–200 μm) on the printing quality is also observed on larger printed features. The supporting bars can be seen in Figure 1 on the printing plate. They were investigated with a surface profilometer since they provide larger area analysis. Viscous fingering was pronounced at RID = 48 μm and 100 μm. This is a phenomenon that is widely present in flexographically printed layers [25]. It is a spontaneous pattern formation phenomenon that occurs when fluid is transferred and usually appears in the form of finger-like structures. It is induced by the replacement of highly viscous fluid with low-viscosity fluid during printing and was classically described by Saffman and Taylor [24]. At the smallest RID (48 μm), the higher printing load caused greater lateral ink spreading and the formation of a wider ink layer between the printing plate and the substrate. During separation, the less viscous air penetrated and displaced the more viscous ink, indicating Saffman–Taylor-type interfacial instability. This divided the ink layer into liquid bridges that were subsequently stretched and ruptured, producing the observed ribbing pattern observed. As the RID increased, the printing load and lateral ink spreading decreased, limiting the formation of these liquid bridges. Consequently, the ribbing pattern gradually diminished and was almost absent within the RID range of 300–500 μm. It is also worth noting that with increased RID, the printed bars looked more defined, with increased edge uniformity at both sides [18].
Figure 8.
(a) Photographs and (b) corresponding 2D surface profiles of the printed supporting bars at different RID values. The red arrow indicates the profilometer scan direction.
Figure 8b illustrates 2D surface profiles obtained using the Dektak Veeco 150 profilometer. With RID = 48 μm, a downward bend to around −52 μm is observed that decreases with increasing RID. This is attributed to excessive induced load between the printing plate and the paper substrate that gets reduced with increased RID. This also shows that reducing the distance between the printing plate and the substrate may result in deformation of the printed layer and the underlying paper.
At RID = 100 μm, two large peaks were observed near the edges of the printed supporting bar. These peaks are likely associated with the lateral displacement and accumulation of ink at the bar edges under increased printing load. At RID = 48 μm, the greater printing load caused stronger compression and wider lateral displacement of the ink, resulting in a broad, flattened profile rather than distinct edge peaks. The pronounced curvature observed at this setting may have further reduced the visibility of localized edge features.
Small peaks were also observed across the supporting bar, which became more apparent with increasing RID. These peaks may correspond to the finger-like features observed in the optical images (see Figure 9). At smaller RID, the greater printing load compressed these features, making them less pronounced in the surface profiles. As the RID increased, the reduced load allowed the finger-like features to retain a greater local height and become more clearly detected by the profilometer. The profiles also suggest an apparent increase in the deposited ink height with increasing RID. However, this observation represents a change in the local surface profile and does not necessarily indicate an increase in the overall printed-layer thickness.
Figure 9.
Viscous fingers on the surface after printing with RID = 48 μm.
3.2. Influence of Relative Impression Displacement on Sheet Resistance
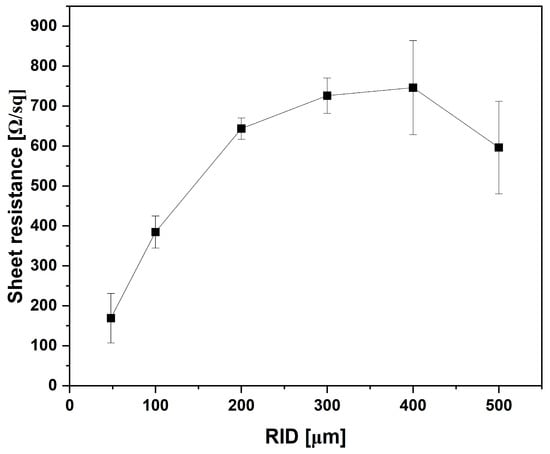
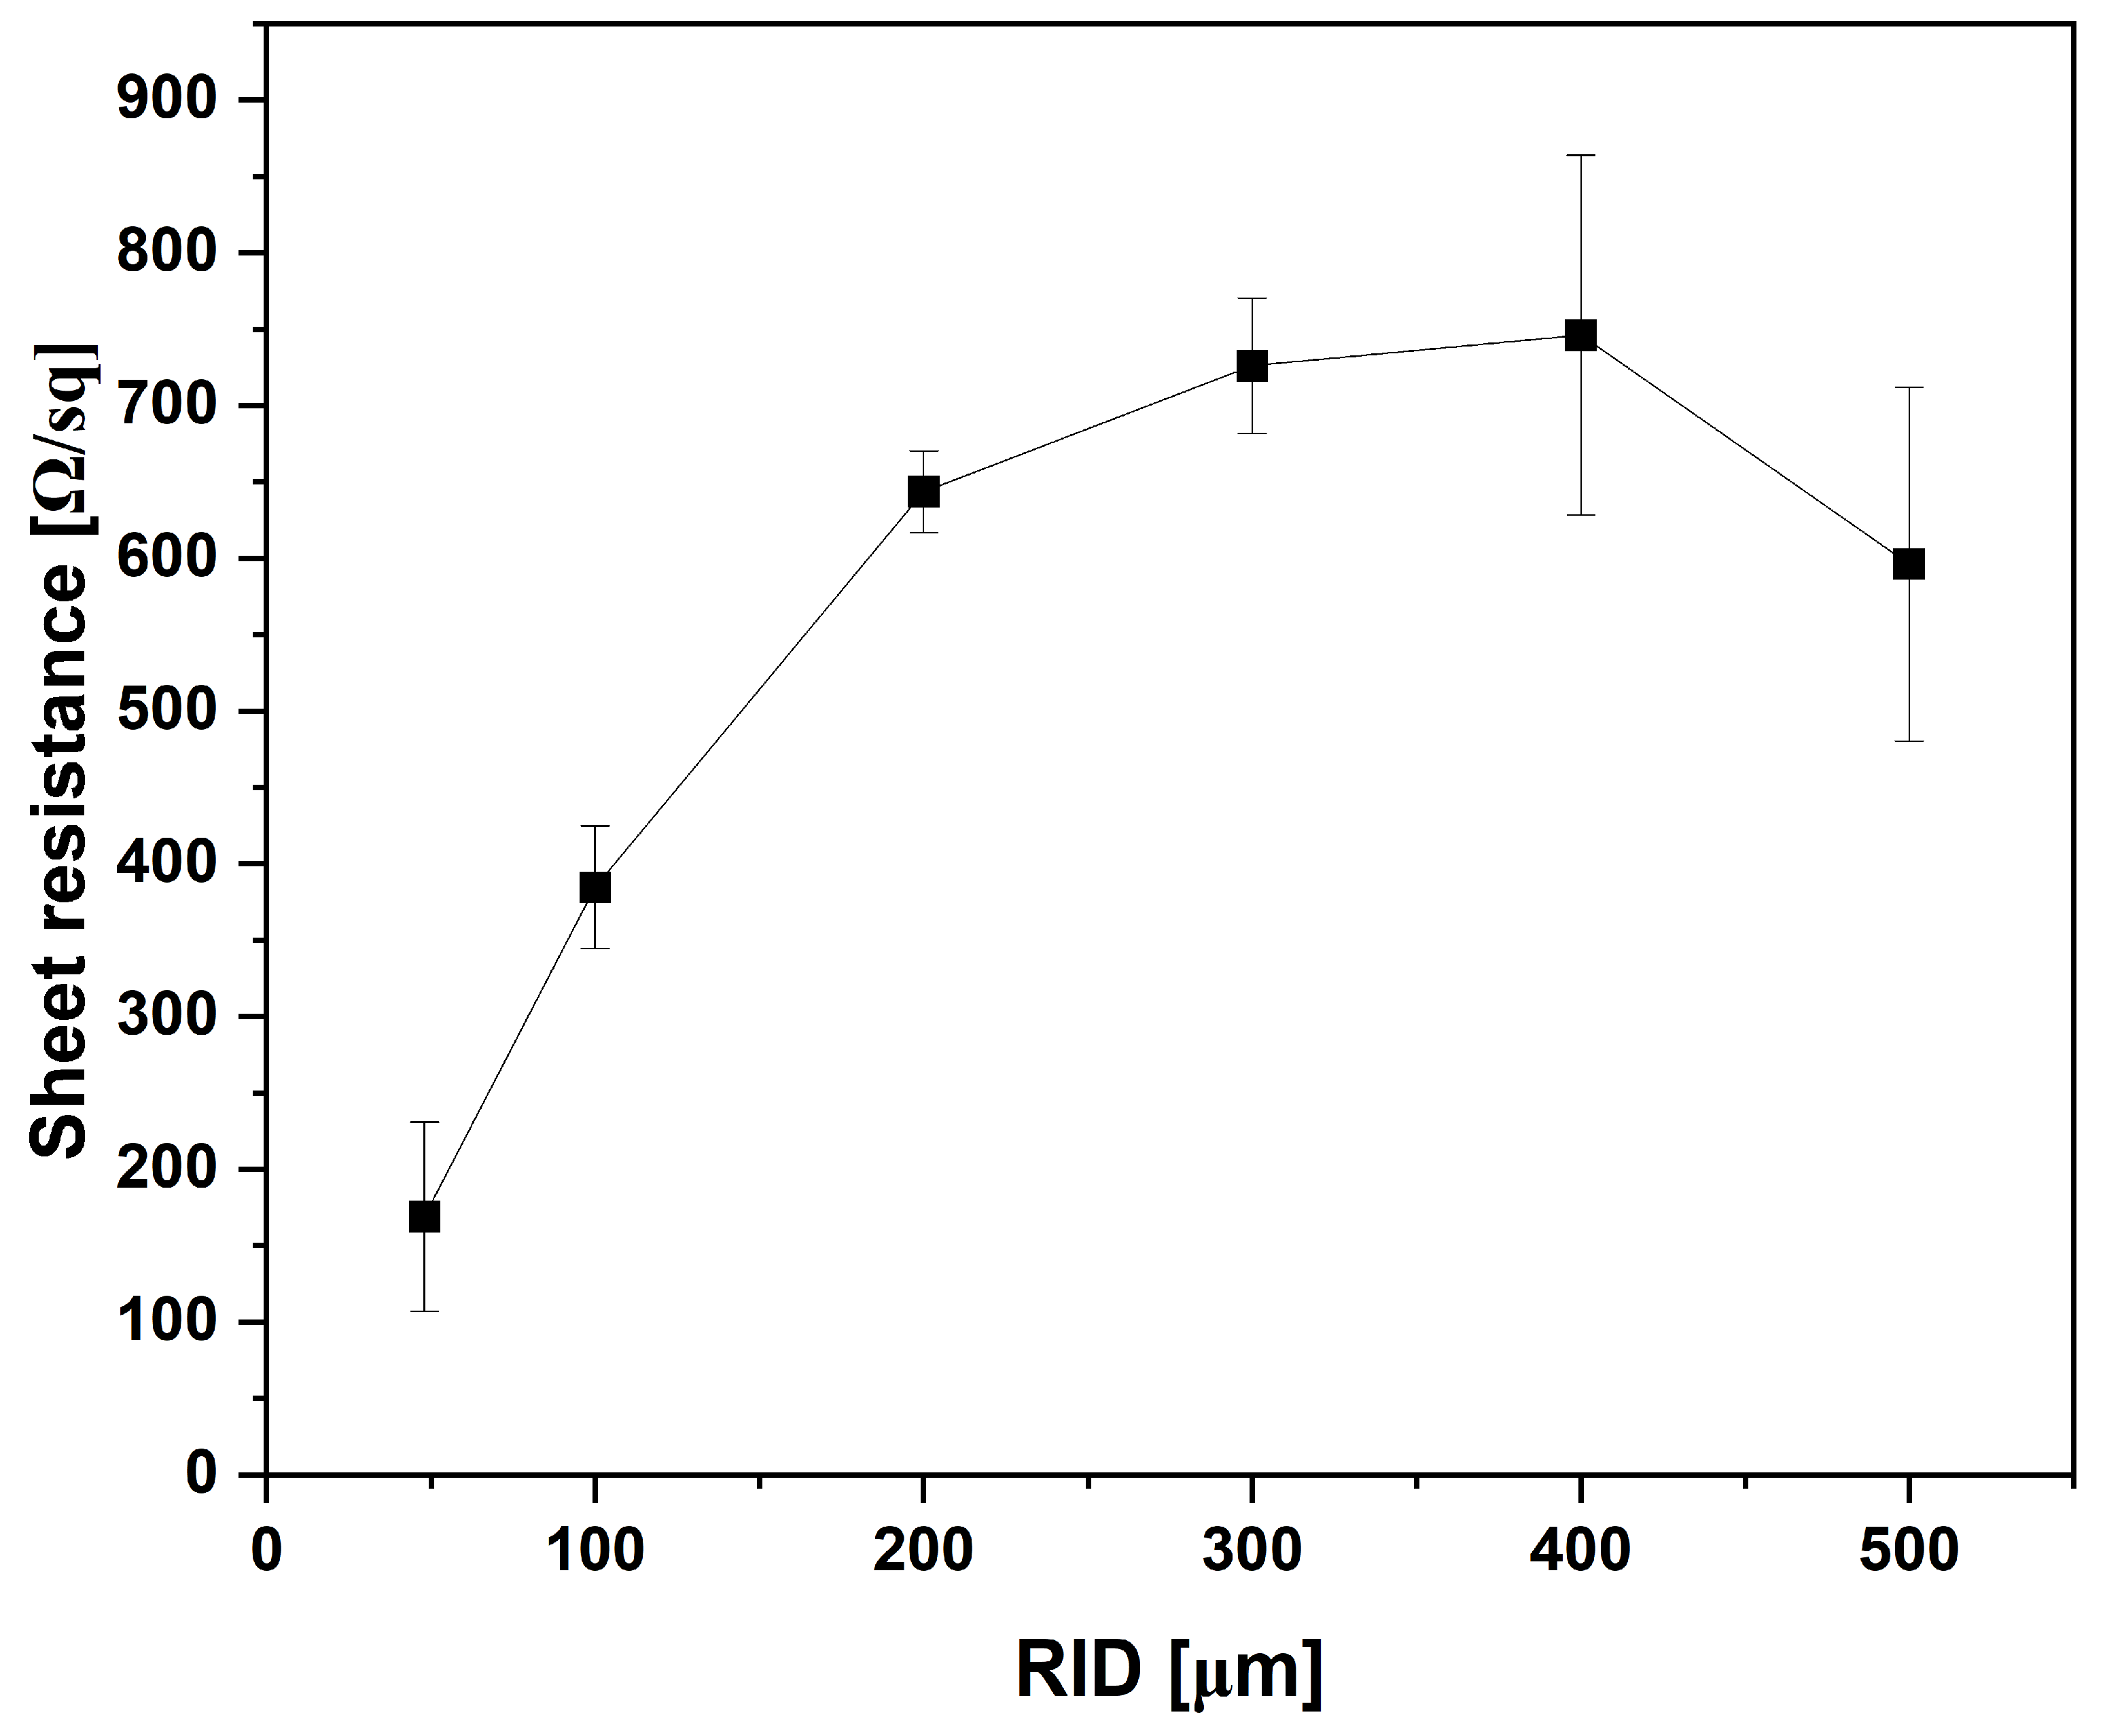
Figure 10 illustrates the measured sheet resistance with increasing RID. Interestingly, at the smallest RID (i.e., 48 μm), the average sheet resistance was at its lowest (i.e., 168 ± 62 Ω/sq). This finding may suggest a more consolidated layer and better interconnection between G/CD particles despite the defects observed in the morphology. However, increased ink transfer and a thicker film at higher nip pressure could also explain the lower sheet resistance. The surface profiles in Figure 8 show greater downward bending of the substrate at the smallest RID but do not establish the average printed-layer thickness or confirm improved particle interconnection. At the next two RID values, the average sheet resistance increased to 385 ± 40 Ω/sq and 642 ± 27 Ω/sq for RID = 100 μm and RID = 200 μm, respectively. These increases may be associated with reduced compression and changes in ink transfer, potentially affecting particle interconnection and film thickness. The average sheet resistance then reached 726 ± 45 Ω/sq, 745 ± 118 Ω/sq and 596 ± 116 Ω/sq at RID = 300 μm, RID = 400 μm and RID = 500 μm, respectively. The similar mean sheet resistances at the fourth and fifth RID values, followed by a decrease at the largest RID, may reflect variations in ink transfer and coverage. However, the overlapping standard deviations warrant caution when interpreting these differences. Although the printed layers at larger RID exhibited better printing definition and less deformation, their sheet resistances remained higher than those printed at smaller RID. Therefore, the role of relative impression roller displacement in flexography printing is significant. Printed layers’ morphological deformations in flexography with a small RID do not necessarily indicate poor conductivity. Better printing definitions and less deformation can be achieved with larger RIDs. Nevertheless, the conductivity is reduced with larger RIDs, with increased variations in the measured sheet resistance of the printed layers.
Figure 10.
Sheet resistance vs. increasing RID values.
4. Conclusions
Herein, we explored the effect of impression roller displacement on the morphology and electrical properties of flexographically printed graphite/carbon dot layers on paper. The results showed that improved print quality did not necessarily result in lower sheet resistance. At the smallest displacement of 48 µm, the printed layers exhibited the lowest sheet resistance of 168 ± 62 Ω/sq, despite the presence of halo effects and viscous fingering. At 200 µm, where the printed features showed improved edge definition, the sheet resistance increased to 642 ± 27 Ω/sq. At the largest displacement of 500 µm, the sheet resistance was 596 ± 116 Ω/sq.
These findings highlight the importance of selecting printing conditions according to the intended application. Improved dimensional fidelity may be prioritized for devices with closely spaced features, such as interdigitated electrodes, where unwanted ink spreading could affect the electrode geometry or cause bridging. In contrast, lower sheet resistance may be prioritized for conductive tracks and larger-area electrodes, provided that the observed printing defects do not compromise their intended function. These results provide useful guidance for the development of flexible, low-cost and mass-produced printed electronics on paper substrates. Other parameters such as speed are worth investigating in the future.
Author Contributions
Conceptualization, A.K.A. and N.M.A.; methodology, A.K.A. and N.M.A.; validation, A.K.A. and N.M.A.; formal analysis, A.K.A.; investigation, A.K.A. and N.M.A.; resources, A.K.A.; data curation, N.M.A.; writing—original draft preparation, A.K.A. and N.M.A.; writing—review and editing, A.K.A.; visualization, A.K.A.; supervision, A.K.A.; project administration, A.K.A.; funding acquisition, A.K.A. All authors have read and agreed to the published version of the manuscript.
Funding
Ongoing Research Funding Program (ORF-2026-1314), King Saud University, Riyadh, Saudi Arabia.
Institutional Review Board Statement
Not applicable.
Informed Consent Statement
Not applicable.
Data Availability Statement
The original contributions presented in this study are included in the article. Further inquiries can be directed to the corresponding authors.
Conflicts of Interest
The authors declare no conflicts of interest.
References
- Al-Amri, A.M. Recent Progress in Printed Photonic Devices: A Brief Review of Materials, Devices, and Applications. Polymers 2023, 15, 3234. [Google Scholar] [CrossRef] [Scilit] [PubMed]
- Zhang, W.; Liu, G.; Zhang, Z.; Jiang, X.; Zhang, W.; Liu, H.; Li, Z. Flexographically Printed PEDOT: PSS Electrodes Enabling Stable Paper-Based Self-Powered Electrochromic Devices. ACS Appl. Polym. Mater. 2026, 8, 2030–2043. [Google Scholar] [CrossRef] [Scilit]
- Hu, H.; Mo, L.; Han, Z.; Geng, M.; Zhang, H.; Han, S.; Liu, L.; Zhang, J.; Xin, Z.; Hu, K. A Universal Flexographic-Thermal Transfer Printing Synergistic Strategy for High Performance PEDOT: PSS Electrochromic Devices on Absorbent Substrates. Chem. Eng. J. 2026, 545, 179282. [Google Scholar] [CrossRef] [Scilit]
- Deganello, D.; Cherry, J.A.; Gethin, D.T.; Claypole, T.C. Impact of Metered Ink Volume on Reel-to-Reel Flexographic Printed Conductive Networks for Enhanced Thin Film Conductivity. Thin Solid Films 2012, 520, 2233–2237. [Google Scholar] [CrossRef] [Scilit]
- Hösel, M.; Søndergaard, R.R.; Angmo, D.; Krebs, F.C. Comparison of Fast Roll-to-Roll Flexographic, Inkjet, Flatbed, and Rotary Screen Printing of Metal Back Electrodes for Polymer Solar Cells. Adv. Eng. Mater. 2013, 15, 995. [Google Scholar] [CrossRef] [Scilit]
- Huddy, J.E.; Ye, Y.; Scheideler, W.J. Eliminating the Perovskite Solar Cell Manufacturing Bottleneck via High-speed Flexography. Adv. Mater. Technol. 2022, 7, 2101282. [Google Scholar] [CrossRef] [Scilit]
- Jo, J.; Yu, J.-S.; Lee, T.-M.; Kim, D.-S.; Kim, K.-Y. Fabrication of Organic Thin-Film Transistors with Roll-Printed Electrodes Using Patterned Polymer Stamp. Mol. Cryst. Liq. Cryst. 2009, 514, 81–411. [Google Scholar] [CrossRef] [Scilit]
- Søndergaard, R.R.; Hösel, M.; Krebs, F.C. Roll-to-Roll Fabrication of Large Area Functional Organic Materials. J. Polym. Sci. B Polym. Phys. 2013, 51, 16–34. [Google Scholar] [CrossRef] [Scilit]
- Janßen, E.M.; Schliephacke, R.; Breitenbach, A.; Breitkreutz, J. Drug-Printing by Flexographic Printing Technology—A New Manufacturing Process for Orodispersible Films. Int. J. Pharm. 2013, 441, 818–825. [Google Scholar] [CrossRef] [Scilit] [PubMed]
- Rao, C.H.; Avinash, K.; Varaprasad, B.; Goel, S. A Review on Printed Electronics with Digital 3D Printing: Fabrication Techniques, Materials, Challenges and Future Opportunities: CH Rao et Al. J. Electron. Mater. 2022, 51, 2747–2765. [Google Scholar]
- Wiklund, J.; Karakoç, A.; Palko, T.; Yiğitler, H.; Ruttik, K.; Jäntti, R.; Paltakari, J. A Review on Printed Electronics: Fabrication Methods, Inks, Substrates, Applications and Environmental Impacts. J. Manuf. Mater. Process. 2021, 5, 89. [Google Scholar] [CrossRef] [Scilit]
- Martins, P.; Pereira, N.; Lima, A.C.; Garcia, A.; Mendes-Filipe, C.; Policia, R.; Correia, V.; Lanceros-Mendez, S. Advances in Printing and Electronics: From Engagement to Commitment. Adv. Funct. Mater. 2023, 33, 2213744. [Google Scholar] [CrossRef] [Scilit]
- Kim, S.; Sojoudi, H.; Zhao, H.; Mariappan, D.; McKinley, G.H.; Gleason, K.K.; Hart, A.J. Ultrathin High-Resolution Flexographic Printing Using Nanoporous Stamps. Sci. Adv. 2016, 2, e1601660. [Google Scholar] [CrossRef] [Scilit] [PubMed]
- Zavanelli, N.; Kim, J.; Yeo, W.-H. Recent Advances in High-Throughput Nanomaterial Manufacturing for Hybrid Flexible Bioelectronics. Materials 2021, 14, 2973. [Google Scholar] [CrossRef] [Scilit] [PubMed]
- Abusaq, Z.; Zahoor, S.; Habib, M.S.; Rehman, M.; Mahmood, J.; Kanan, M.; Mushtaq, R.T. Improving Energy Performance in Flexographic Printing Process through Lean and AI Techniques: A Case Study. Energies 2023, 16, 1972. [Google Scholar] [CrossRef] [Scilit]
- Mogg, B.T.; Claypole, T.; Deganello, D.; Phillips, C. Flexographic Printing of Ultra-Thin Semiconductor Polymer Layers. Transl. Mater. Res. 2016, 3, 015001. [Google Scholar] [CrossRef] [Scilit]
- Rydefalk, C.; Thorman, S.; Hagman, A.; Kulachenko, A. Separating the Effects of Maximum Pressure and Printing Nip Length on Flexographic Print Quality. J. Print Media Technol. Res. 2024, 13, 199–211. [Google Scholar]
- Keawkul, P.; Pachonklaew, P.; Waleetorncheepsawat, B. Optimization of Printing Conditions to Achieve Effective Ink Transfer in Flexographic Printing. J. Print. Sci. Technol. 2022, 59, 298–302. [Google Scholar]
- Huddy, J.E.; Scheideler, W.J. Engineering Ink Rheology for Boosting Efficiency of Large-Area Flexography-Printed Perovskite Solar Cells. In Proceedings of the 2024 IEEE 52nd Photovoltaic Specialist Conference (PVSC); IEEE: Piscataway, NJ, USA, 2024; pp. 483–485. [Google Scholar]
- Zhuldybina, M.; Ropagnol, X.; Bois, C.; Zednik, R.J.; Blanchard, F. Printing Accuracy Tracking with 2D Optical Microscopy and Super-Resolution Metamaterial-Assisted 1D Terahertz Spectroscopy. npj Flex. Electron. 2020, 4, 21. [Google Scholar] [CrossRef] [Scilit]
- Zhuldybina, M.; Ropagnol, X.; Blanchard, F. Towards In-Situ Quality Control of Conductive Printable Electronics: A Review of Possible Pathways. Flex. Print. Electron. 2021, 6, 043007. [Google Scholar] [CrossRef] [Scilit]
- Valdec, D.; Hajdek, K.; Vragović, L.; Geček, R. Determining the Print Quality Due to Deformation of the Halftone Dots in Flexography. Appl. Sci. 2021, 11, 10601. [Google Scholar] [CrossRef] [Scilit]
- Valdec, D.; Majnarić, I.; Valdec, L. Printability Analysis of PLA Films Using Flexographic Solvent-Based Ink According to ISO Specifications. Teh. Glas. 2026, 20, 425–431. [Google Scholar] [CrossRef] [Scilit]
- Johnson, J.; Rättö, P.; Lestelius, M.; Blohm, E. Measuring the Dynamic Pressure in a Flexographic Central Impression Printing Press. Nord. Pulp Pap. Res. J. 2004, 19, 84–88. [Google Scholar] [CrossRef] [Scilit]
- Olsson, R.; Yang, L.; van Stam, J.; Lestelius, M. Effects on Ink Setting in Flexographic Printing: Coating Polarity and Dot Gain. Nord. Pulp Pap. Res. J. 2006, 21, 569–574. [Google Scholar] [CrossRef] [Scilit]
- Bould, D.C.; Claypole, T.C.; Bohan, M.F.J. An Investigation into Plate Deformation in Flexographic Printing. Proc. Inst. Mech. Eng. B J. Eng. Manuf. 2004, 218, 1499–1511. [Google Scholar] [CrossRef] [Scilit]
- Tomašegović, T.; Pibernik, J.; Poljaček, S.M.; Madžar, A. Optimization of Flexographic Print Properties on Ecologically Favorable Paper Substrates. J. Graph. Eng. Des. 2021, 12, 37–44. [Google Scholar] [CrossRef] [Scilit]
- Valdec, D.; Miljković, P.; Čerepinko, D. The Impact of Top Dot Shapes of the Printing Plate on Dot Formation in Flexography. Teh. Vjesn. 2018, 25, 596–602. [Google Scholar] [CrossRef] [Scilit]
- Valdec, D.; Hajdek, K.; Majnarić, I.; Čerepinko, D. Influence of Printing Substrate on Quality of Line and Text Reproduction in Flexography. Appl. Sci. 2021, 11, 7827. [Google Scholar] [CrossRef] [Scilit]
- Sauer, H.M.; Daume, D.; Dörsam, E. Lubrication Theory of Ink Hydrodynamics in the Flexographic Printing Nip. J. Print Media Technol. Res. 2015, 4, 163–172. [Google Scholar]
- Saffman, P.G.; Taylor, G.I. The Penetration of a Fluid into a Porous Medium or Hele-Shaw Cell Containing a More Viscous Liquid. Proc. R. Soc. Lond. A Math. Phys. Sci. 1958, 245, 312–329. [Google Scholar] [CrossRef] [Scilit]
- Morgan, M.L.; Holder, A.; Curtis, D.J.; Deganello, D. Formulation, Characterisation and Flexographic Printing of Novel Boger Fluids to Assess the Effects of Ink Elasticity on Print Uniformity. Rheol. Acta 2018, 57, 105–112. [Google Scholar] [CrossRef] [Scilit]
- Brumm, P.; Sauer, H.M.; Dörsam, E. Scaling Behavior of Pattern Formation in the Flexographic Ink Splitting Process. Colloids Interfaces 2019, 3, 37. [Google Scholar] [CrossRef] [Scilit]
- Brumm, P.; Fritschen, A.; Doß, L.; Dörsam, E.; Blaeser, A. Fabrication of Biomimetic Networks Using Viscous Fingering in Flexographic Printing. Biomed. Mater. 2022, 17, 045012. [Google Scholar] [CrossRef] [Scilit] [PubMed]
- Zhong, Z.W.; Ee, J.H.; Chen, S.H.; Shan, X.C. Parametric Investigation of Flexographic Printing Processes for R2R Printed Electronics. Mater. Manuf. Processes 2020, 35, 564–571. [Google Scholar] [CrossRef] [Scilit]
- Bould, D.C.; Hamblyn, S.M.; Gethin, D.T.; Claypole, T.C. Effect of Impression Pressure and Anilox Specification on Solid and Halftone Density. Proc. Inst. Mech. Eng. B J. Eng. Manuf. 2011, 225, 699–709. [Google Scholar] [CrossRef] [Scilit]
- Assaifan, A.K.; Alfadul, H.; Albuaimi, M.S.; Alrebaish, A.S.; Al-Gawati, M. Scalable Flexographic Printing of Graphite/Carbon Dot Nanobiosensors for Non-Faradaic Electrochemical Quantification of IL-8. Talanta 2025, 295, 128371. [Google Scholar] [CrossRef] [Scilit] [PubMed]
- Leppäniemi, J.; Huttunen, O.; Majumdar, H.; Alastalo, A. Flexography-printed In2O3 Semiconductor Layers for High-mobility Thin-film Transistors on Flexible Plastic Substrate. Adv. Mater. 2015, 27, 7168–7175. [Google Scholar] [CrossRef] [Scilit] [PubMed]
- Lee, D.-H.; Cho, N.-G. Assessment of Surface Profile Data Acquired by a Stylus Profilometer. Meas. Sci. Technol. 2012, 23, 105601. [Google Scholar] [CrossRef] [Scilit]
- Boumegnane, A.; Douhi, S.; Batine, A.; Dormois, T.; Cochrane, C.; Nadi, A.; Cherkaoui, O.; Tahiri, M. Rheological Properties and Inkjet Printability of a Green Silver-Based Conductive Ink for Wearable Flexible Textile Antennas. Sensors 2024, 24, 2938. [Google Scholar] [CrossRef] [Scilit] [PubMed]



Disclaimer/Publisher’s Note: The statements, opinions and data contained in all publications are solely those of the individual author(s) and contributor(s) and not of MDPI and/or the editor(s). MDPI and/or the editor(s) disclaim responsibility for any injury to people or property resulting from any ideas, methods, instructions or products referred to in the content. |
© 2026 by the authors. Licensee MDPI, Basel, Switzerland. This article is an open access article distributed under the terms and conditions of the Creative Commons Attribution (CC BY) license.