


Abstract
Bi2Te3-based thin films for micro-thermoelectric devices must carry metal contacts and withstand device processing. A roughness amplitude alone, the usual surface metric, distinguishes neither protrusions from depressions nor film from substrate features. We examined pressure-gradient-sputtered (Bi2Te3)x(Sb2Te3)1−x films at five compositions on polished alumina by stylus profilometry, white-light interferometry, electron microscopy, and instrumented indentation. Among the thinnest films, protrusions dominate only at x = 0.48 and give a positive skewness (+2.03) and the largest areal roughness (442 nm). At approximately 2 µm thickness, the film at this composition has faceted grains (0.2–0.5 µm), coarser than those at x = 0.00 and 0.24. In the other four thinnest films, sparse depressions 4–11 µm wide give a negative skewness (−3.10 to −10.42). At x = 1.00, two depressions reach below the level of the adjacent bare substrate and thus replicate its defects; elsewhere, they stay within the film thickness. Indentation separates hard Sb-rich films (x = 0.00 and 0.24; hardness 1.76–1.89 GPa; creep 5.1%–8.2%) from soft Bi-rich films (x = 0.73 and 1.00; hardness 0.80–0.99 GPa; creep 20.0%–23.4%). The film at x = 0.24 is also the smoothest (areal roughness 4.2 nm). A stylus profile across the film edge identifies depressions below the bare-substrate level as substrate-derived.
1. Introduction
Bismuth telluride-based alloys are the principal thermoelectric materials near room temperature [1,2]. Thin films of these alloys are used in micro-thermoelectric generators and coolers, including on-chip coolers for local hot spots [3,4,5,6]. The (Bi2Te3)x(Sb2Te3)1−x pseudobinary system forms a continuous solid solution, and its transport coefficients vary with composition across the whole range [7,8]. Nanostructuring lowers the lattice thermal conductivity because grain boundaries scatter phonons [9]. Films of these alloys are grown by thermal co-evaporation [10], flash evaporation [11], electrodeposition [12,13], screen printing of solution-synthesized nanoplates [14], and sputtering [15,16,17,18]. Sputtering covers large substrates, controls thickness, and is compatible with microfabrication [5,18,19,20], and sputtered nanocrystalline Bi2Te3 films reach a cross-plane thermal conductivity of approximately 0.5 W m−1 K−1 [21]. Bi2Te3 and Sb2Te3 are layered chalcogenides. At the atomic-layer scale, two-dimensional chalcogenide heterostructures are grown with controlled layer coverage, and the coverage sets their photoresponse [22]. The sputtered films studied here are polycrystalline and 0.5–4.2 µm thick, and their surfaces form through grain growth on the substrate.
A deposited film needs contacts and packaging before it works as a device. Metal contacts and heater lines are deposited on the film surface, and their contact resistance and adhesion depend on the interface they form [23,24,25]. For contacts pressed onto the film, as in bonding, the real area of contact between a rough surface and a flat body depends on the height distribution of the surface and on the hardness of the softer body [26]. Dicing, bonding, and thermal cycling then load the film mechanically [27,28,29], and flexible devices add repeated bending [30,31]. Two film properties matter at this stage: the topography under a contact and the resistance to plastic deformation. These two properties describe the interface a contact meets and the response of the film to a load; contact resistance and adhesion depend in addition on the contact metal and its deposition [23,24,25].
An amplitude parameter such as the arithmetic mean height measures how far a surface departs from a plane, but not whether it departs upward or downward [32,33]. A plane with sparse deep depressions and a surface with dense low protrusions can have the same amplitude. The skewness and the kurtosis of the height distribution separate these cases. The skewness is negative when deep valleys dominate and positive when high peaks dominate. The kurtosis exceeds 3, the value for a Gaussian height distribution, when a few extreme peaks or valleys dominate. The power spectral density (PSD), which distributes the height variance over lateral wavelengths, adds the lateral scale of the features [32,34,35,36,37]. The direction helps to trace the origin of a feature. Protrusions such as coarse grains grow with the film. Depressions in physical-vapor-deposited coatings often replicate pits and scratches in the substrate [38,39]. Polished polycrystalline alumina, for example, has scratches from grinding and polishing, as well as cavities left by grains pulled out of the surface [40,41]. Sparse features also go unseen in high-magnification micrographs when their spacing exceeds the field of view [33]. Neither an amplitude alone nor a single micrograph therefore shows whether roughness arises in the film or in the substrate.
For coatings, the resistance to plastic deformation is ranked by the hardness H, the indentation creep, and the ratios H/E and H3/E2, where E is the elastic modulus [42,43,44]. Indentation creep is the continued penetration of the indenter under a constant load. Reported indentation data for bismuth telluride-based films concern single compositions, mostly Bi2Te3 [45,46,47]. In bulk Bi2Te3, the indentation modulus also depends on the loading direction relative to the basal plane, the plane of the atomic layers in its layered crystal structure [48]. How hardness and creep change across the (Bi2Te3)x(Sb2Te3)1−x series of films has not been established.
Pressure-gradient sputtering (PGS) introduces the process gas near the target and evacuates it near the substrate, so that the gas pressure is higher at the target than at the substrate. It has produced films of AlN [49], amorphous carbon nitride [50], and Li-doped NiO [51]. Electrical and thermal transport in bismuth telluride-based alloys differs between the directions parallel and perpendicular to the atomic layers. Crystal orientation has long been a target of film growth [52,53,54,55,56]. PGS yields Bi2Te3 films with nearly complete c-axis orientation, in which the atomic layers lie parallel to the substrate [57]. PGS also yields nanocrystalline Bi0.5Sb1.5Te3 films [58]. Crystallite size and orientation have been mapped over the full (Bi2Te3)x(Sb2Te3)1−x series grown by PGS [59]. That study reported neither the height distribution nor the mechanical response of the films.
Here we ask two questions about these films. Which surface features determine the roughness at each composition, and do they arise in the film or in the substrate? How do hardness and creep change with composition? To answer them, we measured the height distribution by stylus profilometry and white-light interferometry. We imaged the surfaces by electron microscopy and tested the films by instrumented indentation. We show that protrusions dominate only at x = 0.48 among the thinnest films, that this composition forms coarser grains than x = 0.00 and 0.24 at equal thickness, and that two depressions at x = 1.00 replicate defects of the substrate. The Sb-rich films (x = 0.00 and 0.24) are approximately twice as hard as the Bi-rich films (x = 0.73 and 1.00). The film at x = 0.24 combines the smoothest surface with the high hardness of the Sb-rich films.
2. Materials and Methods
2.1. Film Deposition and Composition
To vary the composition over the whole pseudobinary system under the same nominal deposition conditions, we used five targets in one radio-frequency (RF) magnetron PGS system (Kenix, Himeji, Japan) described in ref. [59]. Argon entered between the cathode and the shield cover and left through an outlet near the substrate holder. This flow held the pressure at 1.0 Pa near the target and 0.6 Pa near the substrate, 200 mm away.
The targets were Sb40Te60, Bi8Sb31Te61, Bi16Sb22Te62, Bi24Sb13Te63, and Bi28Te72 (50 mm in diameter, 3 mm thick). Their compositions were chosen to compensate for the different sputtering yields of Bi, Sb, and Te [60]. The substrates were polished alumina plates (25 mm × 25 mm × 1 mm; AO-2525, Furuuchi Chemical, Tokyo, Japan), which were not intentionally heated. After the chamber was evacuated to 1 × 10⁻⁴ Pa, argon (>99.9%) flowed at 20 sccm, and the RF power was 30 W. Three films of different thicknesses were grown from each target by changing the deposition time under the same nominal conditions (Table 1). The deposition times, 0.75–7 h, were those of ref. [59]. The three films from the Bi16Sb22Te62 target were deposited for 3, 4, and 7 h, longer than the 0.75–2 h used for the thinnest films from the other targets, so the film analyzed at x = 0.48 (1.71 µm) is thicker than the films analyzed at the other compositions. All films were then annealed at 573 K for 1 h in 5% H2/95% Ar at atmospheric pressure, with a heating rate of 4 K min−1. All measurements in this work were made on the annealed films.
Annealing in H2/Ar changes the composition of sputtered Bi2Te3 films by Te evaporation [61]. Compositions were therefore measured after annealing by electron-probe microanalysis (EPMA-8050G, Shimadzu, Kyoto, Japan), each taken as the mean of three measurements. They deviate from stoichiometry by less than 3% and agree within this margin across the three film thicknesses from each target. The films are denoted (Bi2Te3)x(Sb2Te3)1−x, where x is the atomic ratio Bi/(Bi + Sb): x = 0.00, 0.24, 0.48, 0.73, and 1.00. The film thickness d was measured as a step height with a stylus profiler (DektakXT, Bruker, Tucson, AZ, USA; tip radius 2 µm). The thinnest films grew at 9.3, 4.8, 7.1, 12.7, and 5.7 nm min−1 in order of increasing x. The rate varied between runs from the same target. The runs for the thinnest films at x = 0.24 and 0.48 gave 4.8 and 7.1 nm min−1, against 10.1–11.5 nm min−1 for the two thicker films from the same targets. At x = 0.48, the slower 4 h run gave a film (1.71 µm) thinner than the 3 h film (1.96 µm).
Table 1.
Deposition time t, thickness d, Lotgering factor f [62], and crystallite size D from X-ray peak broadening [63] of the 15 (Bi2Te3)x(Sb2Te3)1−x films. The Lotgering factor measures the c-axis orientation from X-ray diffraction; it is 0 for random and 1 for complete orientation. Values of f and D are reproduced from ref. [59] with permission. The last column lists the measurements made on each film: S, stylus profilometry; W, white-light interferometry; E, electron microscopy; I, instrumented indentation.
2.2. Surface Topography
To capture both the amplitude and the shape of the height distribution, we combined stylus profilometry, white-light interferometry, and electron microscopy. The stylus traces a line across the surface, whereas white-light interferometry maps heights over an area. Each stylus profile was 2.0 mm long, with 3000 points at a lateral interval of 0.67 µm, and crossed the film edge. The same leveling slope was applied to both sides of the edge, so that the film and the bare substrate shared one height reference. The film segment from 1.0 to 2.0 mm (1499 points) was then detrended by a least-squares line, without further filtering, so the primary profile retains the waviness of the plate as well as the roughness. The following primary-profile parameters were evaluated on this segment according to ISO 21920-2 [64]: the arithmetic mean height Pa, the root-mean-square height Pq, the skewness Psk, and the kurtosis Pku. The bare-substrate segment (bare segment) on the other side of the edge, 0.52–0.63 mm long, was evaluated in the same way. A depression was counted where the profile fell more than 0.1 µm below the mean line, and its width was taken at half its depth (Table S1). At x = 0.48, where peaks dominate the profile, the minima between peaks were not counted. The masked Pq and Psk were evaluated after excluding a 20 µm window around each depression; the masked Pq thus measures the height variation in the primary profile between depressions. The one-dimensional PSD was computed from the Hann-windowed film segment [65]. Its slope β on log–log axes was fitted over spatial frequencies of 0.02–0.5 µm−1 (wavelengths of 2–50 µm). A bare substrate from the same lot was also profiled over 0.35 mm.
The 2 µm tip radius limits how deep the stylus reaches into a narrow depression. A spherical tip of radius R reaches a depth δ = R − (R2 − w2/4)1/2 in a depression of width w [37]. Depressions narrower than 1.25 µm therefore appear less than 0.1 µm deep and fall outside the depression count.
To test whether the stylus results hold over an area, we measured each film by white-light interferometry (WLI; BW-S507, Nikon, Tokyo, Japan) on two separate 225 µm × 225 µm fields. Each field was sampled on a 1024 × 1024 grid at a 0.22 µm interval. The arithmetic mean height Sa,WLI was evaluated on the S-F surface, from which the form and the shortest wavelengths are removed, according to ISO 25178-2 [33,66]. For x = 1.00, the areal skewness Ssk was also evaluated. A line profile extracted from the same surface gave Ra,WLI according to ISO 21920-2 [64]. The prefixes P, R, and S denote the primary profile, the roughness profile, and the areal surface, respectively. Amplitude parameters were used rather than extreme-value parameters, such as the maximum peak height, because interferometry loses the fringe signal on steep walls and produces spurious extreme heights there [67].
Surfaces were imaged by field-emission scanning electron microscopy (FE-SEM; S-4800, Hitachi, Tokyo, Japan) at ×1000 and ×10,000; all 15 films were imaged at ×10,000. Dark features in the ×1000 images were segmented by thresholding at the mean intensity minus two standard deviations, and only connected regions larger than 20 pixels were kept (Figure S1). Grain sizes were read from the ×10,000 images against the scale bar. All statistics and the segmentation were computed in Python with NumPy, SciPy, and Pillow.
2.3. Instrumented Indentation
To compare the resistance to plastic deformation across compositions, we used instrumented indentation (ENT-NEXUS, ELIONIX, Tokyo, Japan) with a Berkovich indenter, a three-sided diamond pyramid, at approximately 300 K. The load was raised linearly at approximately 0.1 mN s−1 until the indenter reached a target depth between 8% and 12% of the film thickness (Table S2), which limits the substrate contribution to the hardness [44,68,69]. The load reached at the target depth, 0.10–0.37 mN, was then held constant for 5 s, because creep depends on hold time [70,71,72]. The load was then lowered linearly at the same rate. The unloading curve was fitted over 20%–95% of the maximum load by the Oliver–Pharr method, which obtains the contact stiffness from the initial slope of the unloading curve [68,73,74]. The indentation modulus EIT, hardness HIT, creep CIT, and elastic work ratio ηIT were determined according to ISO 14577-1 [75] from five to nine indents per film (Table 2 and Figure S2). The elastic work ratio is the fraction of the total indentation work recovered on unloading. The Martens hardness HMs, which includes elastic as well as plastic deformation, was obtained from the slope of the loading curve between 50% and 90% of the maximum load [75,76]. It requires no contact-area model and is free of the creep that affects the unloading curve [70]. The depth dependence of the Martens hardness, HMs(h), was obtained from the same loading curve: the depth h was fitted against the square root of the load, F1/2, in a 10 nm window moved along the loading segment in 5 nm steps, and HMs = 1/(26.43 m2), where m is the slope [75]. This quantity depends on the slope alone and is thus independent of the zero point of the depth. We took Poisson’s ratios from refs. [57,58]: 0.264, 0.234, 0.234, and 0.240 for x = 0.00, 0.24, 0.73, and 1.00, respectively.
Indentation was applied to the four films at x = 0.00, 0.24, 0.73, and 1.00. At x = 0.48, Pa (385 nm) is 2.3 times the target depth of 171 nm, outside the range of the contact-area analysis [77,78]. The four indented films were tested on three dates between November 2023 and July 2025 under two calibration states of the instrument (Table S2). Each state covered one Sb-rich and one Bi-rich film: x = 0.00 with x = 1.00, and x = 0.24 with x = 0.73. Each Sb-rich film can thus be compared with a Bi-rich film measured under the same calibration. The frame compliance Cf, recorded with each data set (Table S2), was subtracted from the raw displacement. The contact area was obtained from the contact depth with the area function of the tip, calibrated on fused silica for each calibration state [73] (Table S2). No correction for thermal drift was applied. The compliance correction CfFmax, where Fmax is the maximum load, amounts to 0.03–0.12 nm at the loads used and is below 0.2% of the depth. The films at x = 0.24 and 0.73 were tested in one session under one calibration state, so a thermal drift common to the session adds the same displacement to both films during the hold.
Table 2.
Loads and depths of the indentation tests. Here Fmax is the maximum load, h1 the penetration at maximum load, and h2 the penetration after the 5 s hold, so that CIT = (h2 − h1)/h1 [75]; CIT is averaged over the individual indents. Uncertainties are one standard deviation over n indents.
3. Results and Discussion
3.1. Roughness Amplitude
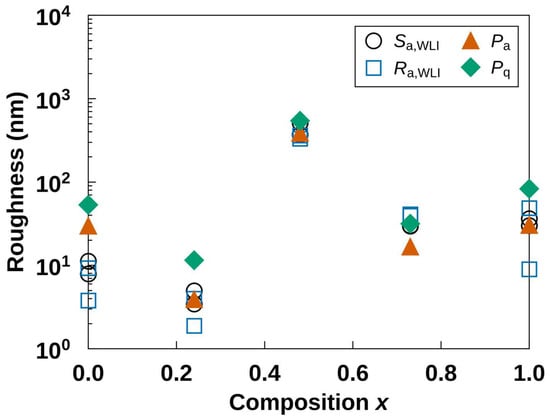
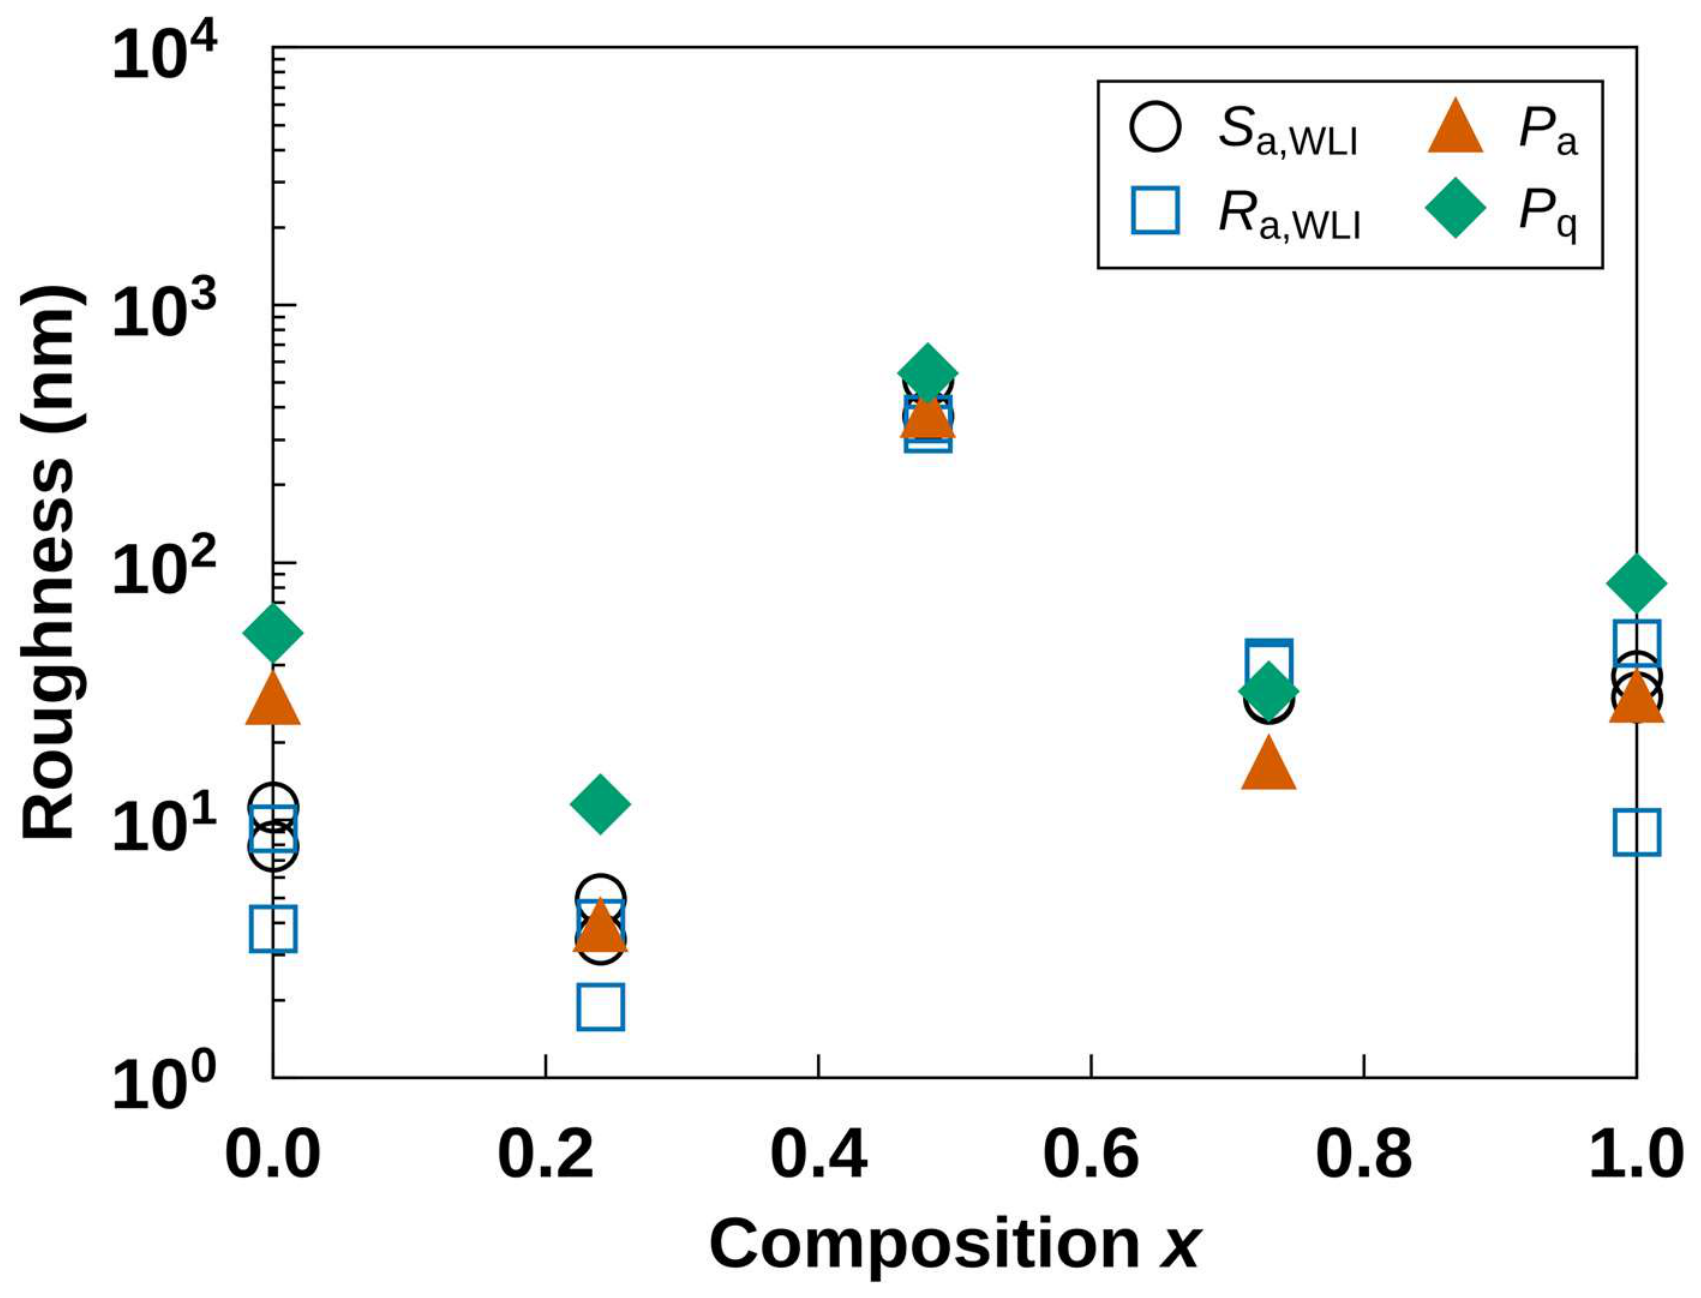
The roughness amplitude has its minimum at x = 0.24 and its maximum at x = 0.48 (Figure 1). The areal roughness Sa,WLI, averaged over the two fields, is 9.6, 4.2, 442, 29.9, and 33.2 nm in order of increasing x. The stylus amplitude Pa is 29.6, 3.9, 385, 16.7, and 30.3 nm over the same series. At x = 0.00, Pa is three times Sa,WLI. The 1.0 mm primary profile includes an undulation of the plate with a wavelength longer than the 225 µm interferometer fields (Figure S3a) and crosses nine depressions. The two interferometer fields agree within a factor of 1.5 in Sa,WLI at every composition. The line roughness Ra,WLI varies more between fields, by up to a factor of 5 at x = 1.00, because a single line crosses only a few depressions.
Figure 1.
Roughness amplitude of (Bi2Te3)x(Sb2Te3)1−x thin films against composition x. Open symbols: Sa,WLI and Ra,WLI from white-light interferometry over 225 µm × 225 µm fields, with the two fields plotted separately. Filled symbols: Pa and Pq from the 1.0 mm film segment of the stylus profile. Each point represents the thinnest film of its composition (Table 1).
The amplitude shows no monotonic relation to thickness or deposition rate among the five thinnest films. The films at x = 0.24 and 0.73 have the same thickness, 0.57 µm, yet the film at x = 0.73 is seven times rougher in Sa,WLI. The films at x = 0.24 and 1.00 grew at similar rates, 4.8 and 5.7 nm min−1, respectively, yet differ by a factor of 8 in Sa,WLI. The film at x = 0.48 is also the thickest of the five, at 1.71 µm, because its deposition time, 4 h, was the longest among the five thinnest films (Table 1). Section 3.3 compares the grains of the three compositions at nearly equal thickness. In the other four films, the number of depressions varies from plate to plate (Section 3.4). The height variation between depressions is compared using the masked Pq: 21.5, 4.8, 16.5, and 12.3 nm at x = 0.00, 0.24, 0.73, and 1.00, respectively (Table S1).
3.2. Shape of the Height Distribution
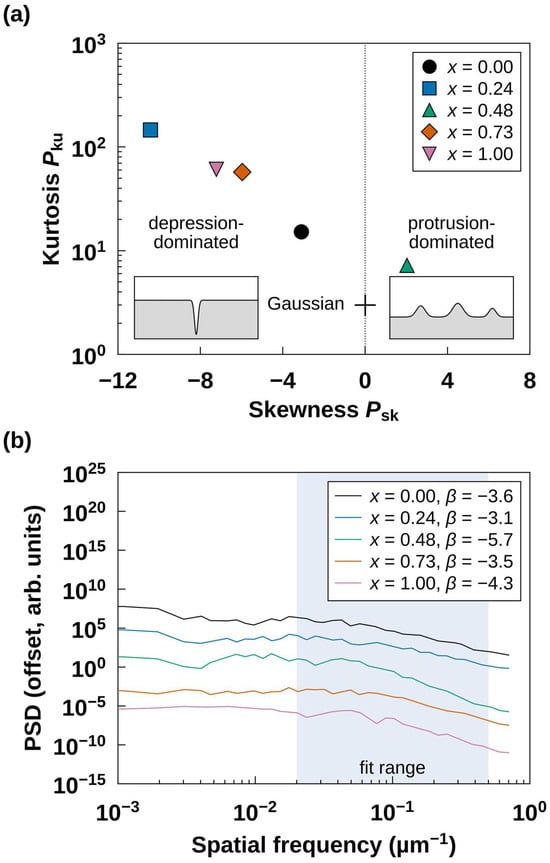
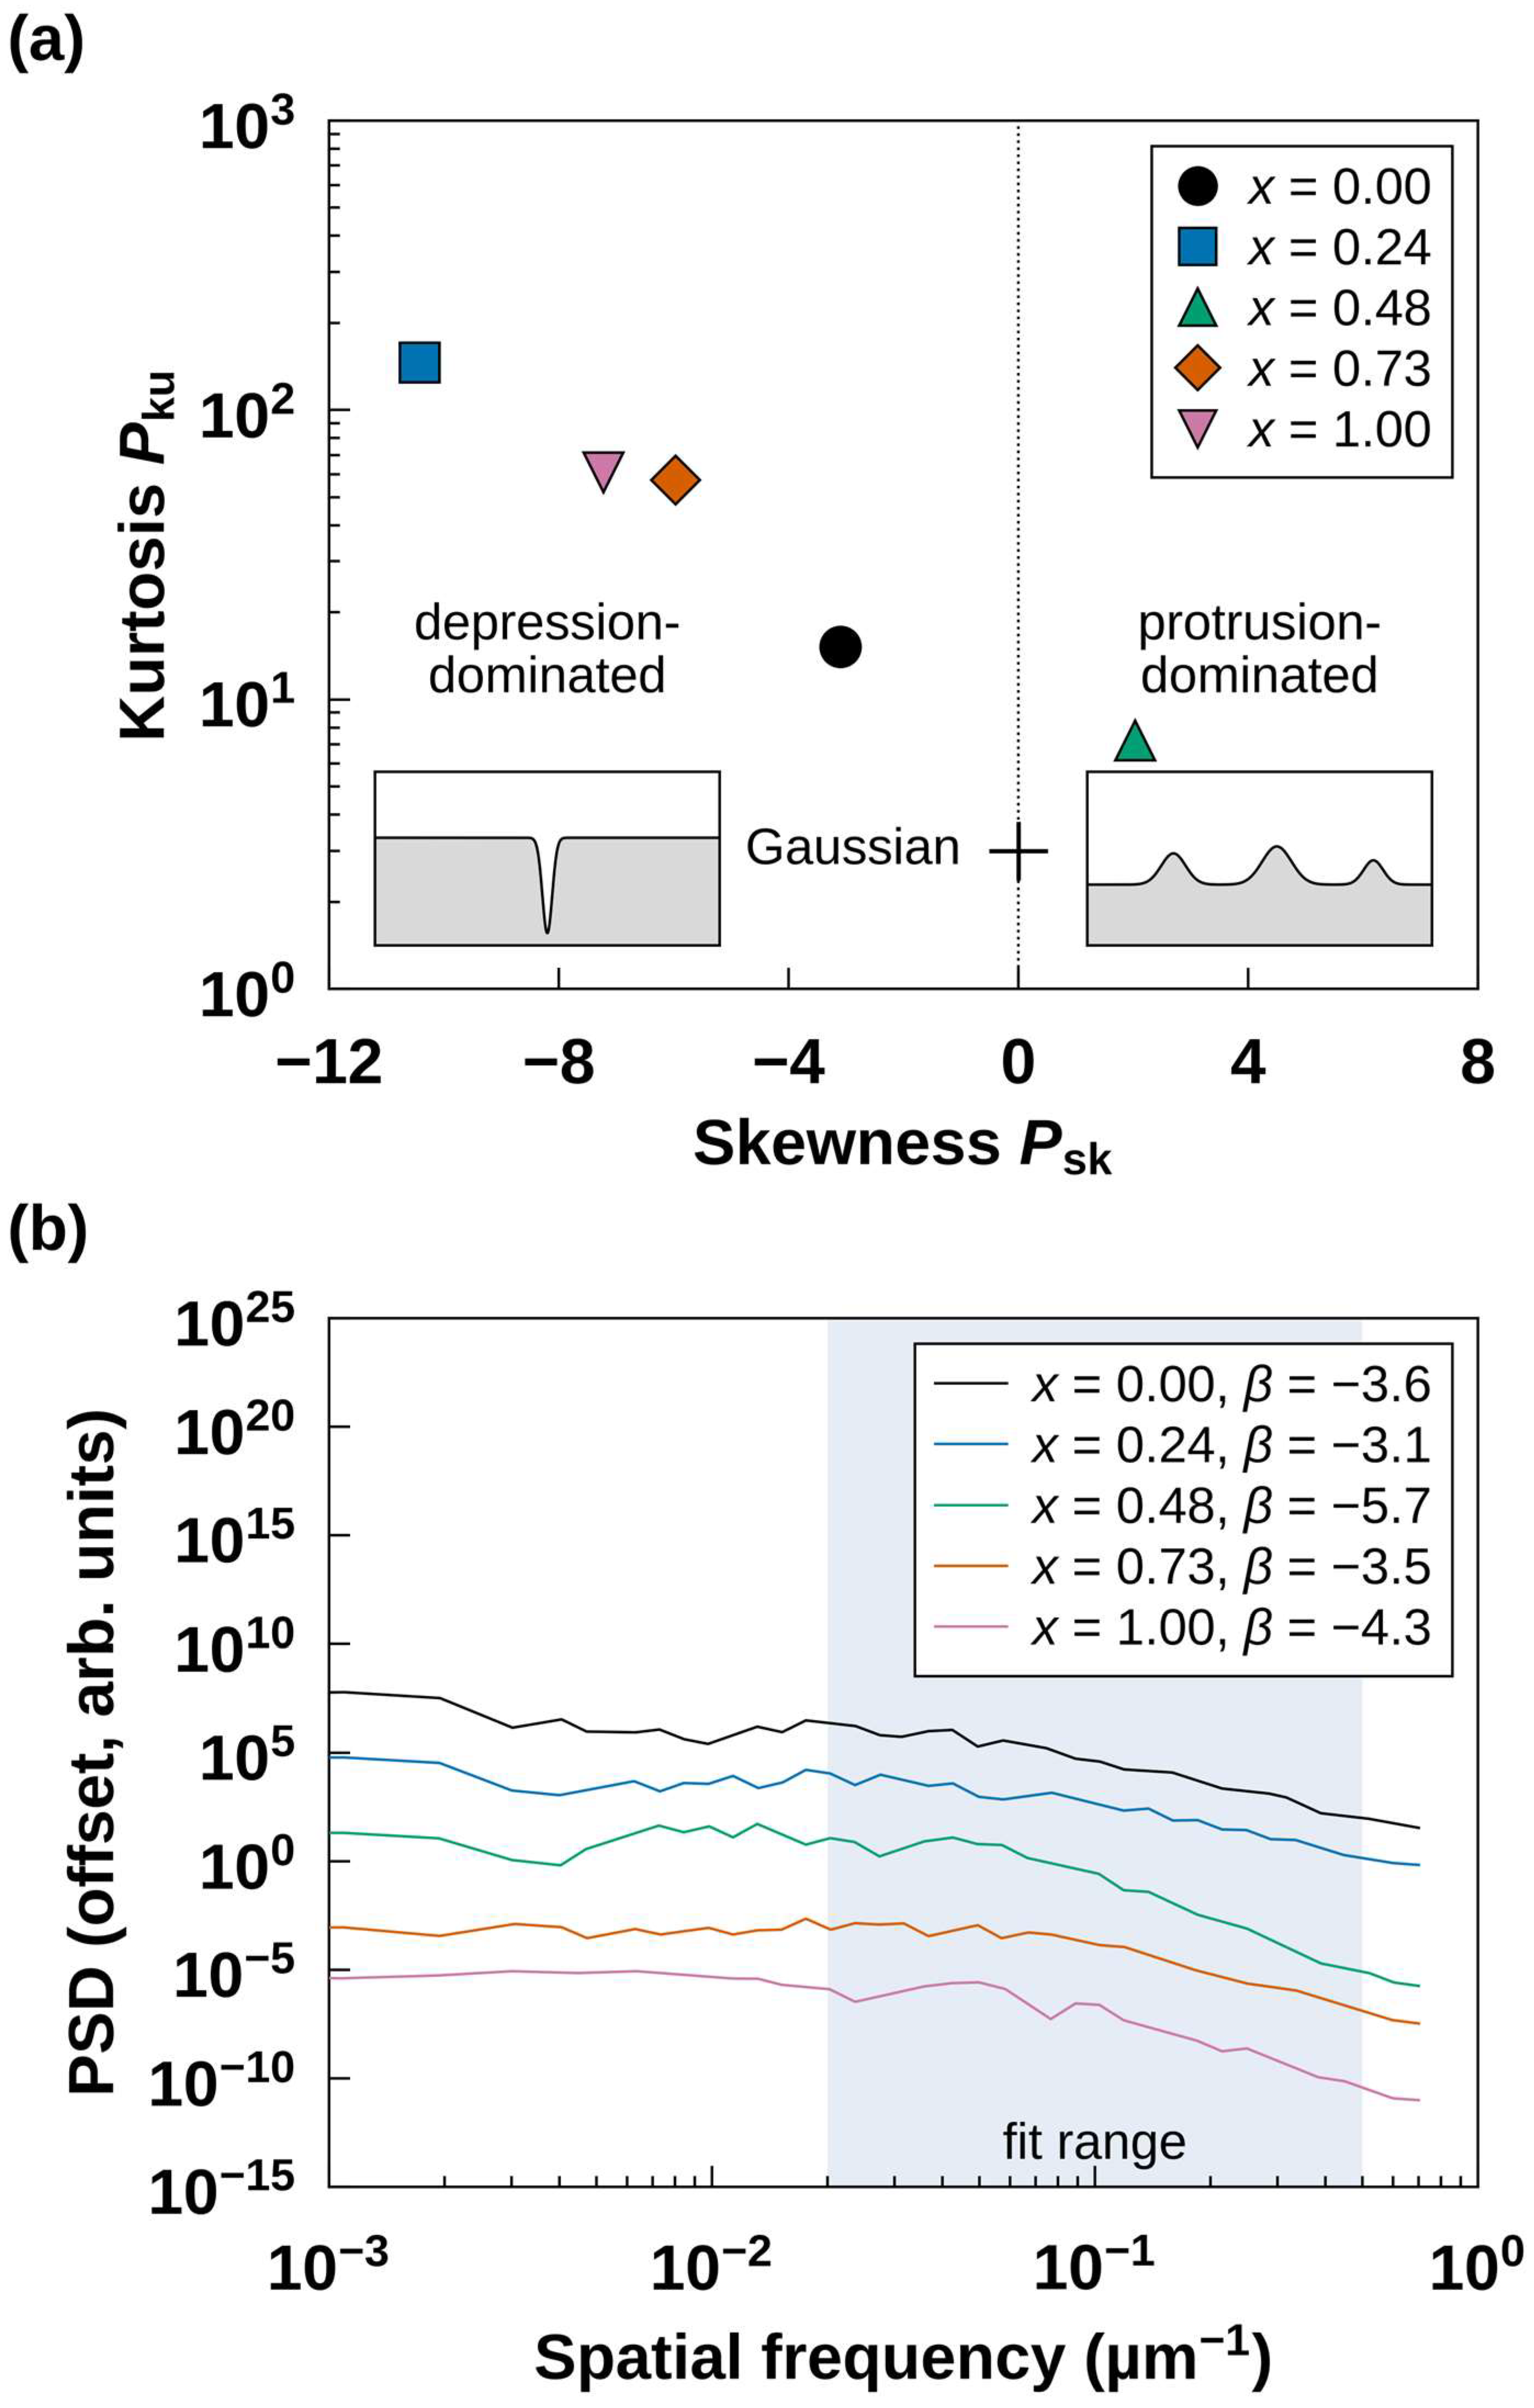
The sign of the skewness separates the film at x = 0.48 from the other four films (Figure 2a). A Gaussian height distribution has Psk = 0 and Pku = 3. At x = 0.48, Psk = +2.03 and Pku = 7.2, so the height distribution has an upward tail. The other films have Psk between −3.10 and −10.42 and Pku between 15 and 146. A negative skewness with a high kurtosis describes a plane interrupted by a few deep depressions [32,33,36].
Figure 2.
Shape and spectrum of the stylus profiles. (a) Skewness Psk and kurtosis Pku of the film segments; the cross marks the Gaussian reference (0, 3), and the insets sketch depression-dominated and protrusion-dominated profiles. (b) One-dimensional PSD of the same segments, offset vertically for clarity; β is the slope fitted over the shaded range, 0.02–0.5 µm−1.
Each of these four 1.0 mm film segments contains at least one depression deeper than 0.1 µm. Their number is nine at x = 0.00, one at 0.24, three at 0.73, and five at 1.00. They are 4–11 µm wide at half depth and reach a depth of 0.86 µm at x = 1.00 (Table S1). Masking a 20 µm window around each depression removes 2%–18% of the profile but 73%–98% of its height variance. The masked Psk is +0.23 at x = 0.00 and −1.83 to −3.13 elsewhere. The depressions therefore carry most of the height variance and make the skewness strongly negative.
Across the four films, Psk becomes more negative as the surface between depressions becomes smoother [32] (Table S1). It falls from −3.10 at a masked Pq of 21.5 nm (x = 0.00) to −10.42 at 4.8 nm (x = 0.24). Because Psk is normalized by the cube of Pq, the same depression shifts Psk more on a smoother surface. The film at x = 0.24 thus gives the most negative skewness, with a single depression 0.19 µm deep. The bare substrate from the same lot gives Pq = 1.9 nm over 0.35 mm, so the smoothest film adds only a few nanometers to the substrate finish.
The PSD decreases with spatial frequency for all films (Figure 2b). Its slope β, fitted over wavelengths of 2–50 µm, lies between −3.1 and −4.3 for the four depression-dominated films and reaches −5.7 at x = 0.48. The fitted band covers the widths of the depressions (4–11 µm), and the profile at x = 0.48 is dominated by discrete peaks (Section 3.3). In all five films, β reflects a few discrete features and is not a scaling exponent [32,65,79]. The PSD serves only to locate the height variance of the films in the band of these features.
3.3. Protrusions at x = 0.48
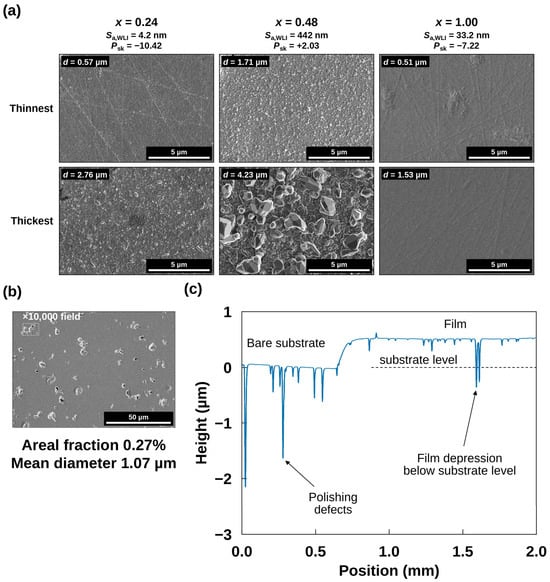
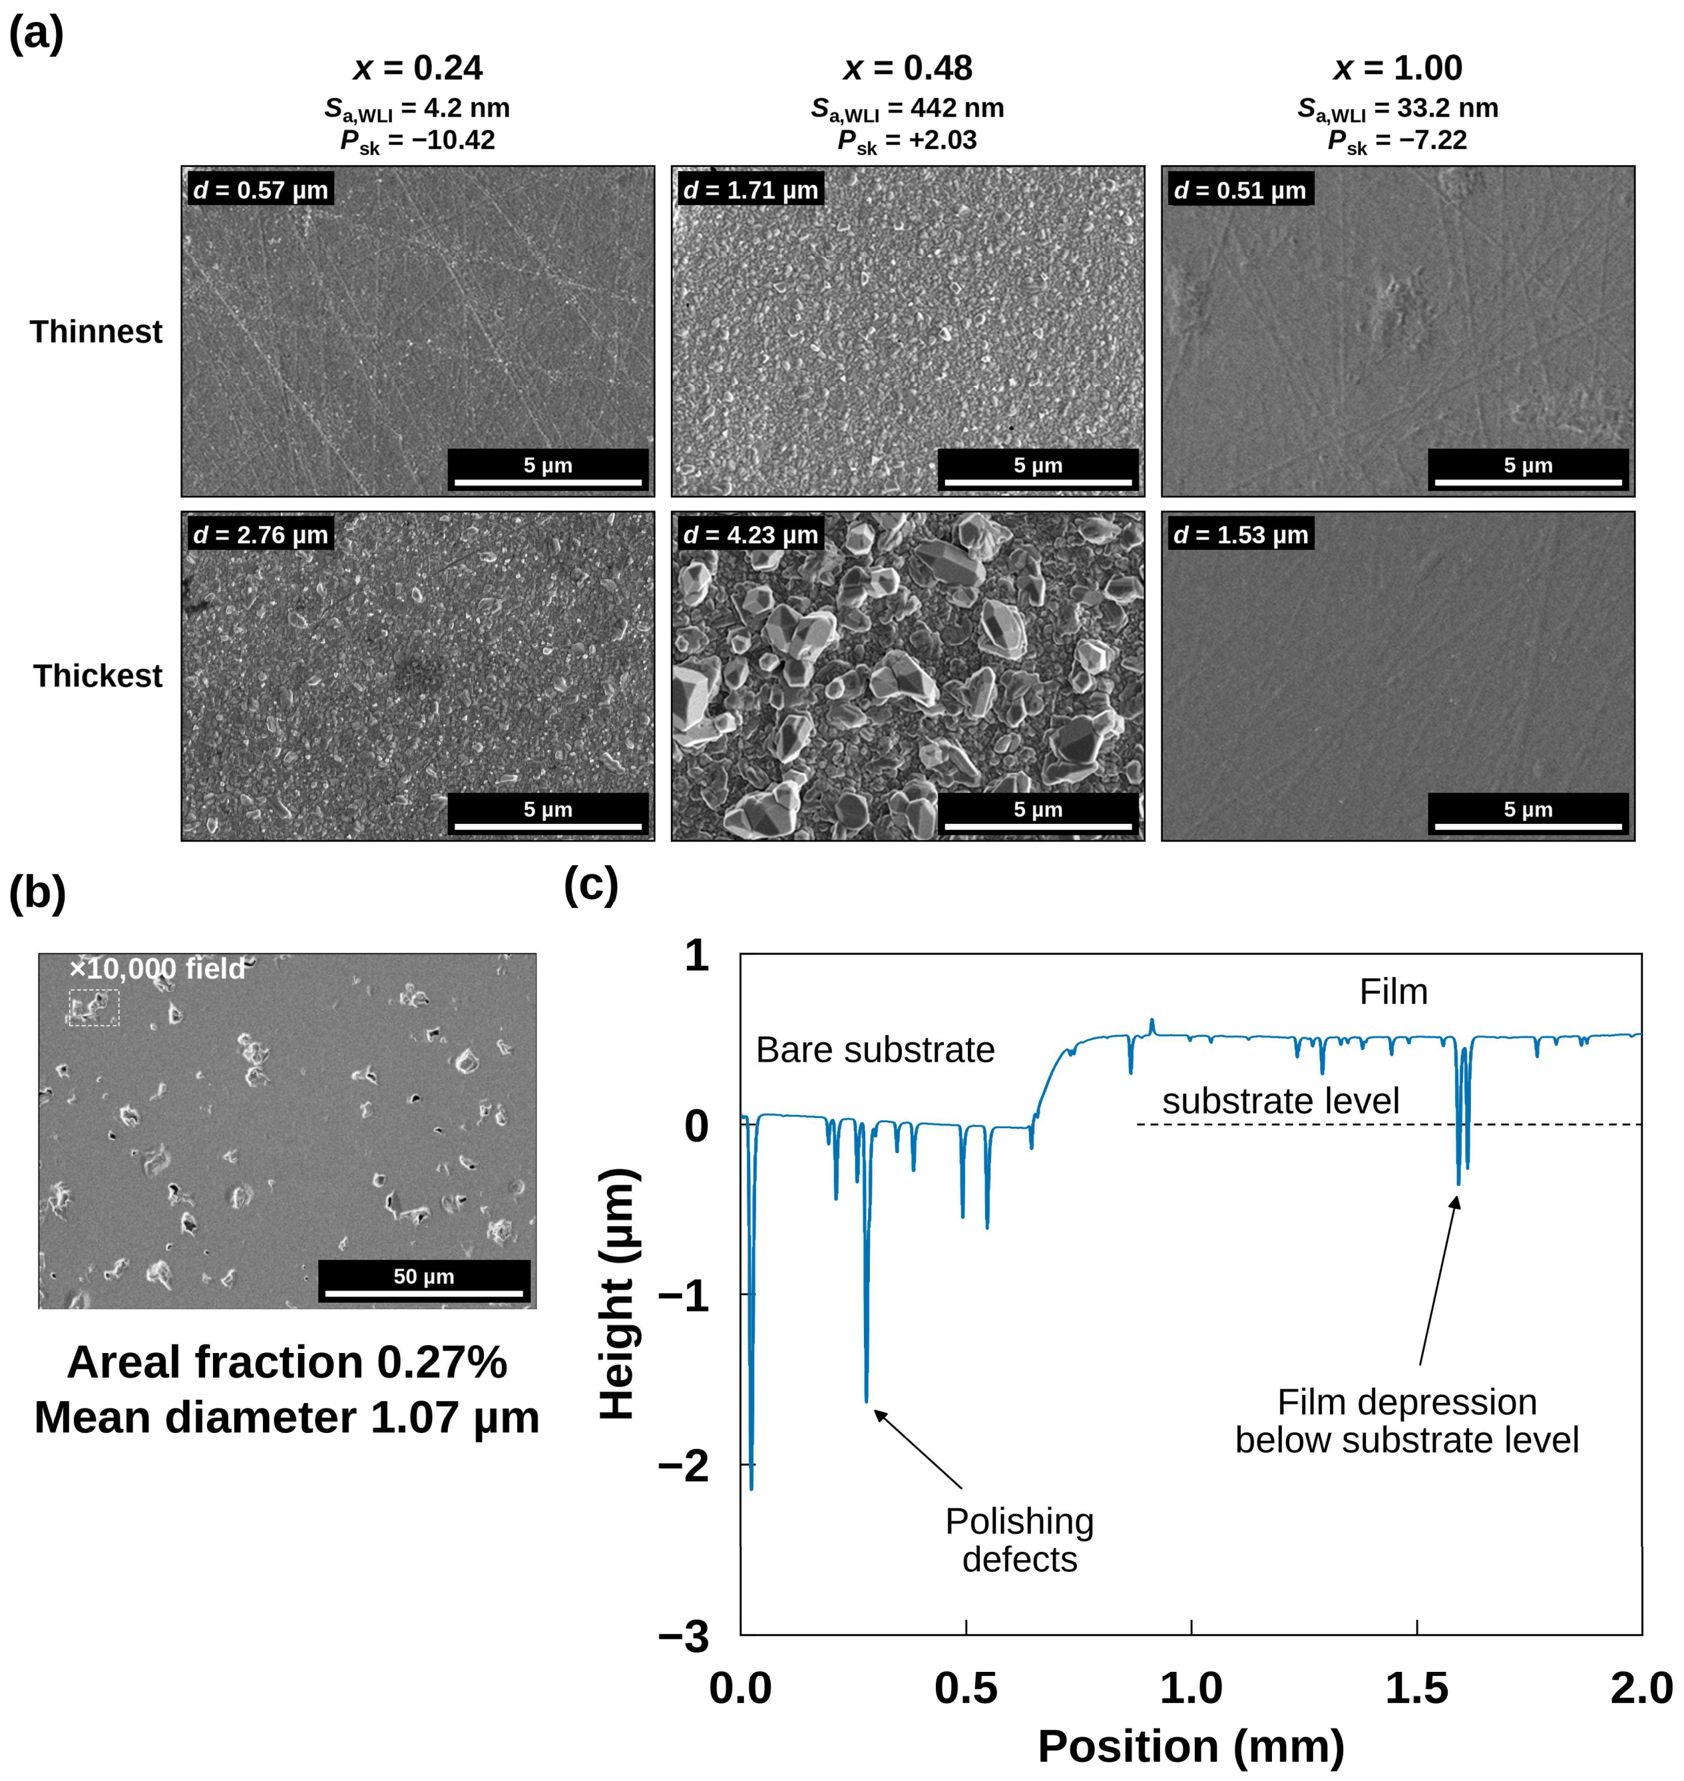
The stylus profile shows the protrusions that cause the positive skewness. The profile of the 1.71 µm film rises above its plateau in many peaks (Figure S3c). The highest peaks reach 4.2 µm above the bare-substrate level, more than twice the film thickness, and lie tens to hundreds of micrometers apart. A ×10,000 field, approximately 13 µm × 9 µm, rarely contains one of them. The ×10,000 image of this film shows closely packed grains 0.1–0.3 µm across with a few larger grains (Figure 3a). At this composition, the grains coarsen with thickness into faceted crystals up to approximately 2 µm across in the 4.23 µm film. The high peaks appear only at this composition among the five thinnest films. Coarse grains formed by coalescence were reported for this film [59], and we attribute the high peaks to such grains. The thinnest film at this composition also has the lowest Lotgering factor of the five, 0.21, and thus the weakest c-axis orientation (Table 1). No faceted crystals like those of the 4.23 µm film appear at x = 0.24 or 1.00 in Figure 3a, and the thinnest films at both compositions show straight lines.
Figure 3.
Surface features of the films. (a) FE-SEM images (×10,000) of the thinnest and thickest films at x = 0.24, 0.48, and 1.00; d is marked on each image, and the headings give Sa,WLI and Psk of the thinnest film. (b) The 0.51 µm film at x = 1.00 at ×1000; the dashed rectangle marks the ×10,000 field of view, and the numbers give the areal fraction and the mean equivalent diameter of the dark features. (c) Stylus profile of the same film across its edge; the depressions on the bare substrate are polishing defects, and the dashed line marks the level of the bare substrate.
Figure S4 shows all 15 films at ×10,000. At nearly equal thickness, 1.96, 2.03, and 2.15 µm, the film at x = 0.48 consists of faceted grains 0.2–0.5 µm across, separated by dark gaps. The film at x = 0.24 consists of closely packed grains 0.1–0.3 µm across, and the film at x = 0.00 consists of still finer grains. These three films grew at 10.9, 11.3, and 11.2 nm min−1, the usual rates of their targets, so the contrast does not arise from the slower runs of the thinnest films (Section 2.1). No film at x = 0.73 or 1.00 reaches 2 µm. The crystallite size from X-ray peak broadening, 33.7–44.5 nm in these films (Table 1), is a third to a tenth of the surface grain size, so each surface grain contains many crystallites. The films at x = 0.00 and 0.24 show no grains larger than 0.5 µm up to 2.78 µm; the 0.79 µm film at x = 0.00 carries discrete particles 0.1–0.4 µm across on a smooth matrix. At x = 0.73, the films show pits below 1 µm across, and the 1.32 µm film also shows faceted grains 0.2–0.5 µm across. The films at x = 1.00 show faint lines and streaks; their pits, approximately 20 µm apart, rarely fall in a ×10,000 field (Section 3.4). At equal thickness, the coarse faceted grains distinguish x = 0.48 from x = 0.00 and 0.24.
3.4. Depressions and Substrate Defects
The depressions on the bare substrate are polishing defects of the alumina (Figure 3c and Figure S3): scratches, like the straight lines on the films in Figure 3a, or cavities left by pulled-out grains [40,41]. The stylus crosses them as narrow troughs: eight deeper than 0.1 µm beside the x = 1.00 film, the deepest approximately 2 µm (Table S1). At x = 1.00, two film depressions, 0.86 and 0.76 µm deep, exceed the 0.51 µm film thickness, and their bottoms lie below the level of the bare substrate (Figure 3c). Between the depressions, the film surface stays 0.51 µm above the extended substrate level over 1.0 mm, equal to the step height at the film edge, so the extended level holds under the whole segment. Neither film growth nor Te loss during annealing removes substrate material, so these depressions are substrate defects covered by the film [38,39]. At x = 0.00, 0.24, and 0.73, the deepest depressions, 0.19–0.41 µm deep, stay within the film thickness. Their widths at half depth, 4.0–11.3 µm, are comparable to those of the 13 troughs crossed on the bare segments of the five plates, 3.3–9.3 µm (Table S1). The number of troughs varies strongly between plates: the bare segments, 0.52–0.63 mm long, cross 0, 1, 4, 0, and 8 of them (Table S1). The number of depressions also varies between films, from one at x = 0.24 to nine at x = 0.00. The stylus profile across the film edge identifies a depression as a substrate defect when its bottom lies below the extended substrate level.
The dark features in the ×1000 micrographs of the x = 1.00 films are pits with bright rims (Figure 3b and Figure S1). The mean equivalent diameter of their dark cores stays at 1.01–1.07 µm as d increases from 0.51 to 1.53 µm, and their areal fraction decreases from 0.27% to 0.19%. Unlike the grains at x = 0.48, they do not coarsen with film thickness.
The stylus and the micrographs record features of different widths. The stylus depressions are 4–11 µm wide at half depth, with depth-to-width ratios of at most 0.21. The 2 µm tip reaches a depth of 2 µm in a depression 4 µm wide, so it follows its full depth. Their dark cores average 1.01–1.07 µm in diameter and reach 2.2 µm at most. The 2 µm tip reaches a depth of only 0.07 µm in a feature 1.07 µm wide (Section 2.2). The stylus thus records the wide depressions, and the micrographs record the narrow ones.
Most high-magnification images miss the dark features. Their number density, (2.4–3.0) × 10−3 µm−2, gives a mean spacing of approximately 20 µm. A ×10,000 field, approximately 13 µm × 9 µm, holds 0.3 features on average, so approximately three fields in four contain none. A ×1000 field holds approximately 30. At ×10,000, the film at x = 1.00 therefore looks the smoothest of the three in Figure 3a. Its Sa,WLI, however, is eight times that at x = 0.24. Interferometry also records a depression-dominated surface at x = 1.00, with Ssk = −8.31 and −9.05 in the two fields.
3.5. Indentation Response
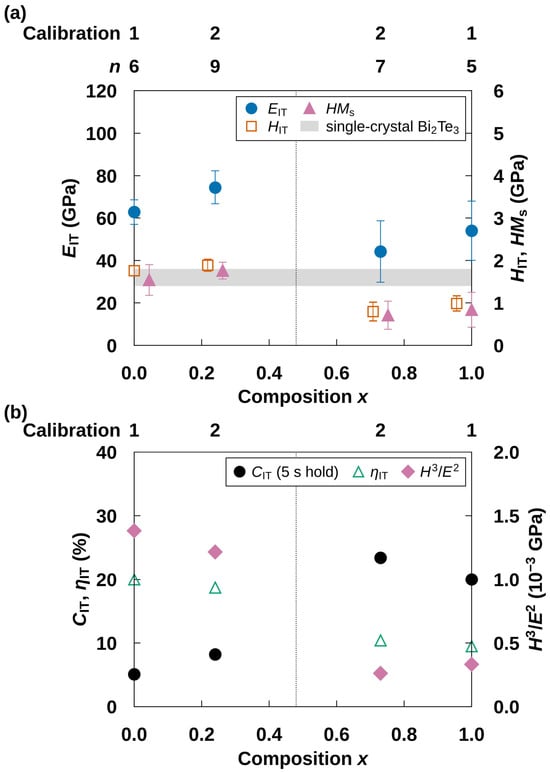
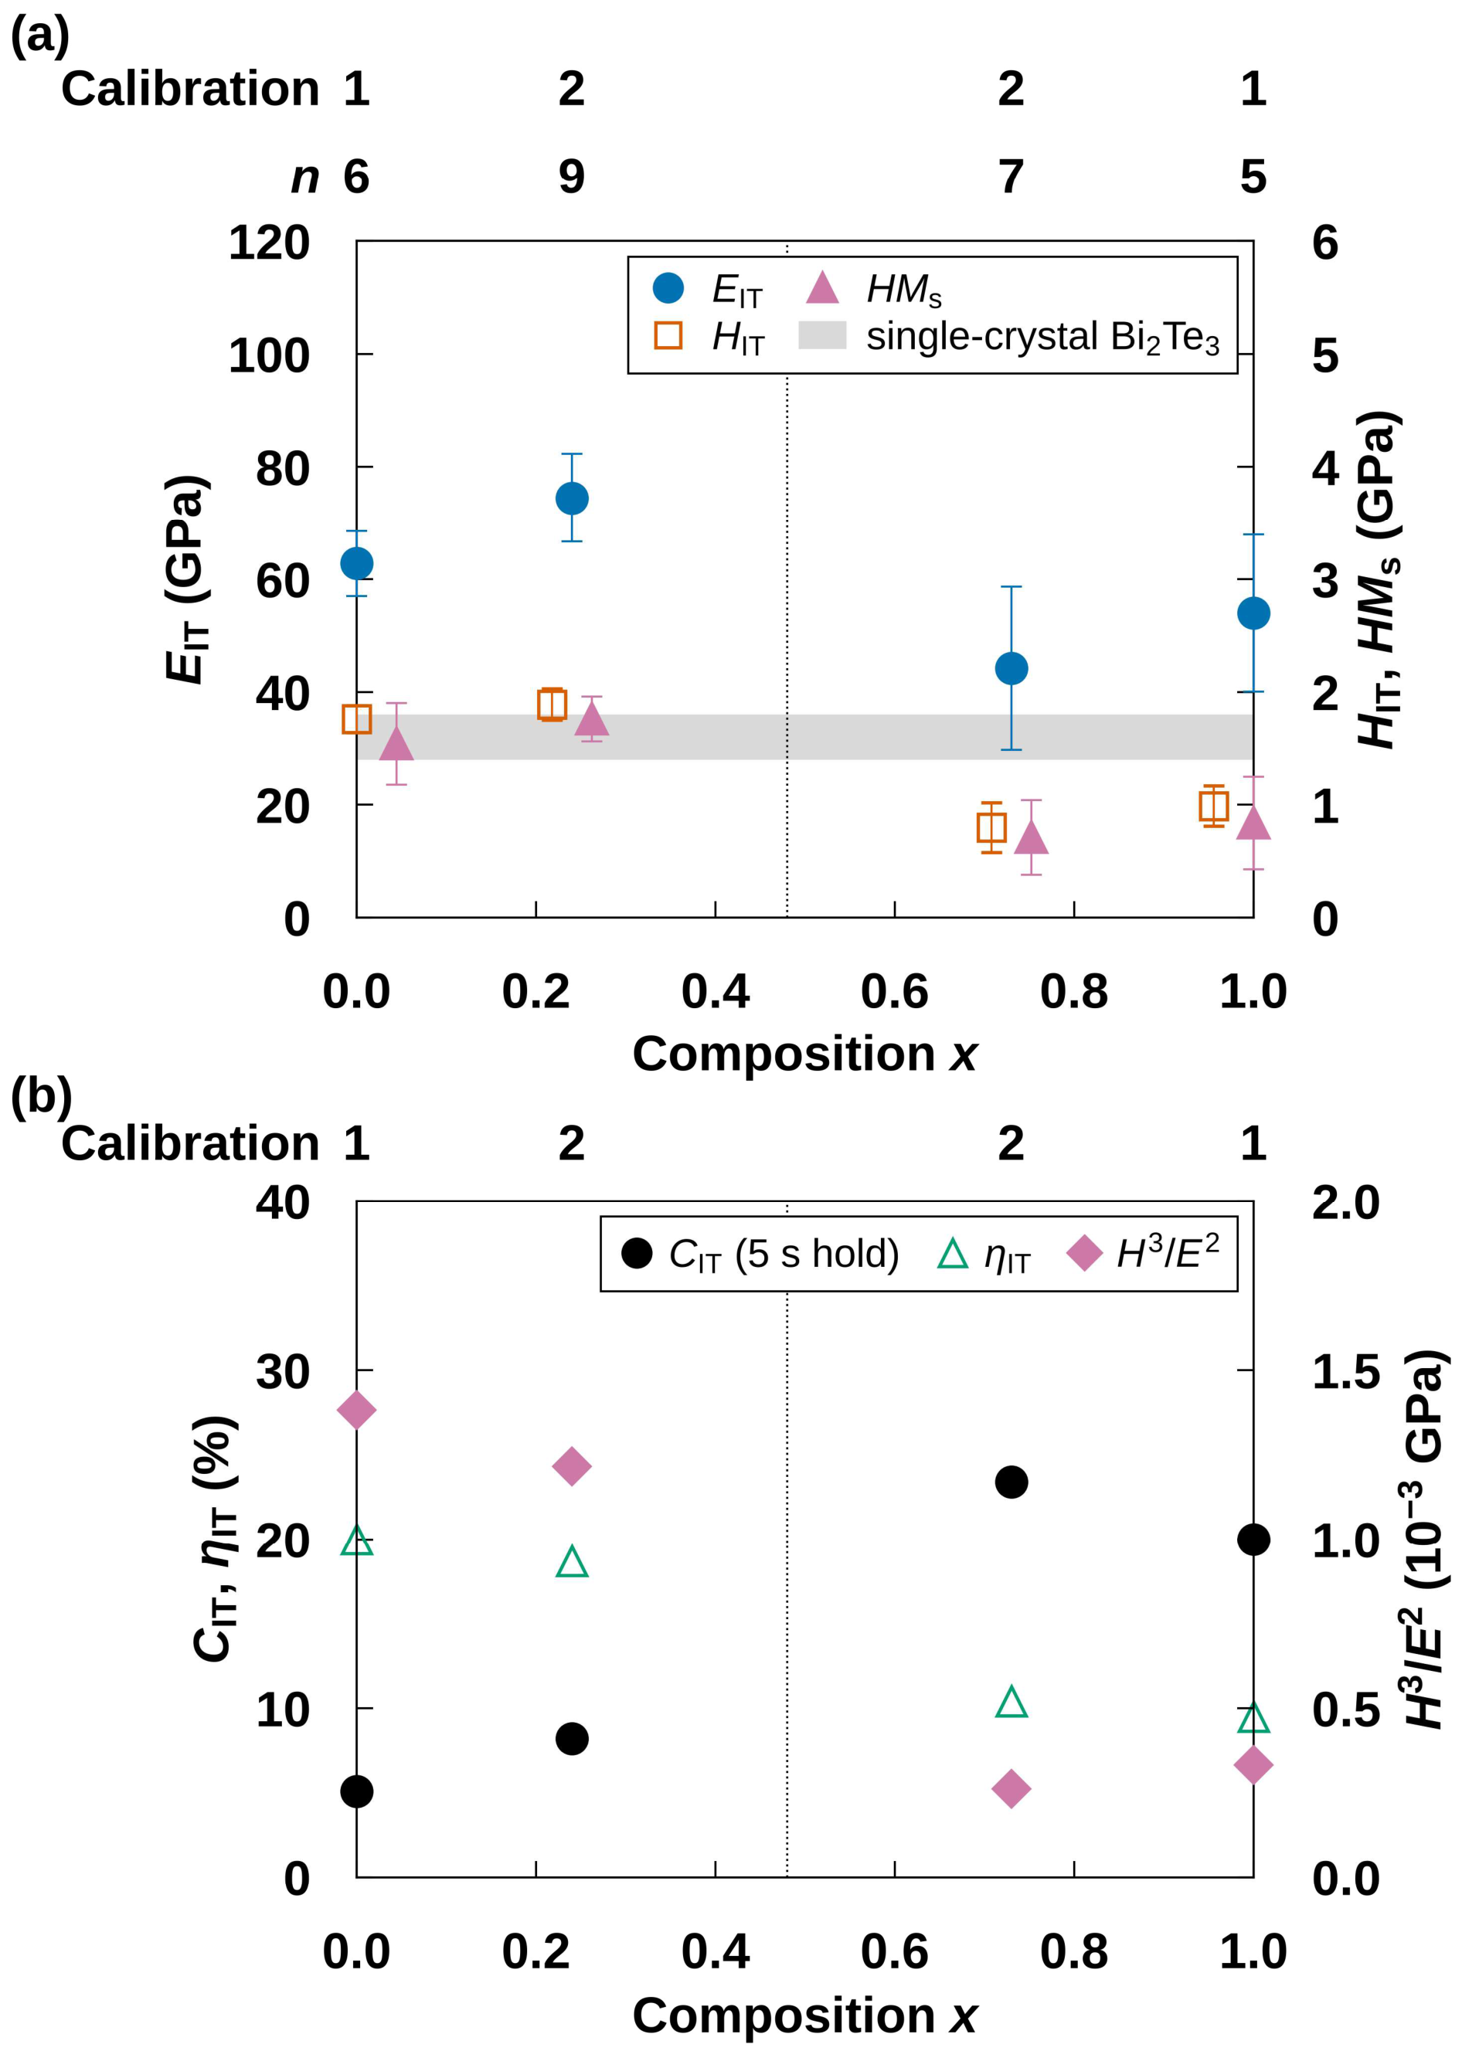
Hardness divides the four indented films into a hard Sb-rich pair and a soft Bi-rich pair (Figure 4a). The Sb-rich films give HIT = 1.76 ± 0.12 GPa at x = 0.00 and 1.89 ± 0.14 GPa at x = 0.24. The Bi-rich films give 0.80 ± 0.22 GPa at x = 0.73 and 0.99 ± 0.18 GPa at x = 1.00. In all four comparisons between an Sb-rich and a Bi-rich film, the difference is 5.1–6.1 times the pooled standard deviation (p < 0.001, Welch’s t-test). Within each pair, the difference is approximately one pooled standard deviation (p > 0.07). The Martens hardness gives the same division, at 1.54 and 1.76 GPa for the Sb-rich pair against 0.71 and 0.84 GPa for the Bi-rich pair (p ≤ 0.02).
Figure 4.
Indentation response at approximately 300 K. (a) Indentation modulus EIT (left ordinate), hardness HIT, and Martens hardness HMs (right ordinate); the gray band marks the hardness of single-crystal Bi2Te3 indented normal to the basal plane [80]. (b) Indentation creep CIT over the 5 s hold and elastic work ratio ηIT (left ordinate), and H3/E2 (right ordinate). Error bars in (a) are one standard deviation. The rows above the panels give the calibration state (Table S2) and, above (a), the number of indents n. The dotted line marks x = 0.48 (Section 2.3). Symbols at the same composition are shifted horizontally for clarity.
The following comparisons examine roughness, calibration, and the substrate as sources of this division. Roughness comparable to the indentation depth lowers the apparent hardness, most at shallow depths [77,78]. The roughness between depressions, the masked Pq, is 16.5 and 12.3 nm in the Bi-rich films and 21.5 nm at x = 0.00, whose hardness is twice as high. The film at x = 1.00, whose pits lie approximately 20 µm apart (Section 3.4), gives the same division as the film at x = 0.00 under one calibration state. The films at x = 0.24 and 0.73, tested on the same day under one calibration state, differ by a factor of 2.4 in HIT. The Martens hardness, which requires no contact-area model and is free of the contact-area error that pile-up causes, gives the same division. After the hold, the indenter reaches 10.5%–14.9% of the thickness in the Bi-rich films and 10.9%–11.5% in the Sb-rich films (Table 2). The alumina substrate is stiffer than the films, and a stiffer substrate raises the apparent modulus and hardness of a softer film [69,81,82,83,84]. A substrate contribution would raise the apparent hardness more in the softer Bi-rich films and narrow the measured hardness division. For a soft film on a hard substrate, the hardness stays close to the film value at depths below 15% of the thickness [81,82]. The Martens hardness evaluated along the loading curve, HMs(h), shows no rise toward the substrate in any film (Figure S5). From 25 nm to the maximum depth, HMs(h) of the Sb-rich films stays at 1.4–1.9 GPa. In the Bi-rich films, HMs(h) falls from 0.9–1.3 GPa at 25 nm to 0.6–0.9 GPa at 40–55 nm. At 25 nm, the calibrated contact area of the rounded tip is 2.0–2.7 times the ideal Berkovich area, and the ratio rises at smaller depths (Table S2). Because HMs(h) assumes the ideal geometry, the rounding raises it at shallow depths in every film, and the films are compared from 25 nm only. Each pair includes one film from each calibration state. The maximum loads differ between films because the target depth was set for each film (Table S2). At each depth from 25 to 40 nm, the indents of the Bi-rich pair give a lower HMs(h) than those of the Sb-rich pair (p ≤ 0.03, Welch’s t-test).
The modulus is higher on average for the Sb-rich pair, at 68.7 against 49.1 GPa. The modulus EIT is 62.8 ± 5.8 and 74.5 ± 7.8 GPa at x = 0.00 and 0.24, respectively. It is 44.2 ± 14.5 and 54.0 ± 13.9 GPa at x = 0.73 and 1.00, respectively.
The Bi-rich films creep approximately three times as much as the Sb-rich films during the 5 s hold (Figure 4b). The creep CIT averages 21.7% for the Bi-rich pair (23.4% and 20.0%) and 6.6% for the Sb-rich pair (5.1% and 8.2%). The raw curves show the same contrast (Figure S2). During the hold, the penetration advances by 11.3–12.7 nm in the Bi-rich films and by 4.4–4.7 nm in the Sb-rich films. For the films at x = 0.24 and 0.73, tested in one session, the advance differs by 6.6 nm (4.7 against 11.3 nm); a thermal drift common to the session cancels in this difference. This difference is significant (p < 0.001, Welch’s t-test). The homologous temperature, the ratio of the test temperature to the melting point, does not explain the contrast. At 300 K, it is 0.35 for Bi2Te3 (melting point 858 K) and 0.34 for Sb2Te3 (893 K) [85].
The elastic work ratio ηIT falls from 20.0% and 18.7% for the Sb-rich pair to 10.4% and 9.5% for the Bi-rich pair. Plastic work thus accounts for approximately 90% of the indentation work in the Bi-rich films. The ratio H3/E2 ranks the resistance of coatings to plastic deformation [42,43]. The Sb-rich pair has 3.7–5.3 times the H3/E2 of the Bi-rich pair. A substrate contribution also raises EIT, which enters H3/E2 squared, so the hardness gives a more direct measure of the division. Creep that continues during unloading raises the apparent contact stiffness [70]. A correction after Feng and Ngan [70], with the creep rate over the last 1 s of the hold and the unloading rate, raises HIT by 0.9%–3.6% and lowers EIT by 5.6%–18.5% (text below Table S2). The corrected hardness, 1.81 and 1.91 GPa for the Sb-rich pair against 0.81 and 1.03 GPa for the Bi-rich pair, keeps the division (p < 0.001), and the corrected H3/E2 ratio between the pairs is 2.5–6.2.
The division follows composition and texture (here, the degree of c-axis orientation), which change together in this set. It does not follow crystallite size. The Lotgering factor is 0.35 and 0.39 for the Sb-rich pair and 0.73 and 0.97 for the Bi-rich pair (Table 1). The crystallite size is 34.0 and 36.9 nm for the Sb-rich pair but 55.1 and 22.3 nm for the Bi-rich pair. The Sb-rich films lie near the hardness of single-crystal Bi2Te3 indented normal to the basal plane, approximately 1.6 GPa [80], and the Bi-rich films, including the c-axis-oriented film at x = 1.00, lie below it (Figure 4a).
4. Conclusions
Pressure-gradient-sputtered (Bi2Te3)x(Sb2Te3)1−x films on polished alumina owe their roughness to two kinds of feature. Protrusions dominate only at x = 0.48 among the thinnest films, where they give a positive skewness of +2.03 and the largest roughness; at equal thickness, this composition forms coarser grains than x = 0.00 and 0.24. At the other compositions, sparse depressions give a skewness of −3.10 to −10.42 and carry most of the height variance. At x = 1.00, two depressions reach below the level of the bare substrate and thus replicate defects of the substrate. At the other compositions, the depressions stay within the film thickness and are 4.0–11.3 µm wide.
Indentation divides the four indented films into a hard Sb-rich pair and a soft Bi-rich pair. The Sb-rich films are approximately twice as hard, at 1.76–1.89 against 0.80–0.99 GPa. They creep approximately one third as much, at 5.1%–8.2% against 20.0%–23.4%. The Martens hardness and the creep displacement in the raw curves give the same division.
The thinnest films can be ranked by the measured surface and indentation properties that bear on processing steps such as metallization, bonding, and dicing. From the most to the least favorable, the order is x = 0.24, 0.00, 0.73 and 1.00 (tied), and 0.48. The protrusions determine the last place, the hardness and the creep separate the Sb-rich pair from the Bi-rich pair, and the roughness ranks the films within each pair. The film at x = 0.48 ranks last, because its highest peaks reach 4.2 µm above the substrate level, more than twice its thickness. Within the Sb-rich pair, the film at x = 0.24 ranks first, because its areal roughness and masked Pq are less than half those of the film at x = 0.00 (4.2 against 9.6 nm and 4.8 against 21.5 nm). The films at x = 0.73 and 1.00 agree in hardness within one standard deviation, and their roughness measures rank them oppositely (Sa,WLI 29.9 and 33.2 nm; masked Pq 16.5 and 12.3 nm). The depressions vary from plate to plate and are left out of the ranking; at x = 1.00, two of them replicate substrate defects, which depend on the substrate finish.
Among the five compositions, the film at x = 0.24, close to the p-type composition Bi0.5Sb1.5Te3, combines the smoothest surface (Sa,WLI = 4.2 nm; masked Pq = 4.8 nm) with the high hardness of the Sb-rich films (1.89 GPa). A stylus profile that crosses the film edge identifies depressions that reach below the substrate level as features inherited from the substrate.
Supplementary Materials
The following supporting information can be downloaded at: https://www.mdpi.com/article/10.3390/coatings16101251/s1, Table S1: Depressions in the stylus profiles of the thinnest film at each composition; Table S2: Dates and calibration constants of the indentation tests; Figure S1: Dark features in ×1000 FE-SEM images of the x = 1.00 films, 0.51, 0.98, and 1.53 µm thick; Figure S2: Indentation load–displacement curves; Figure S3: Stylus profiles across the film edge of the thinnest film at each composition; Figure S4: FE-SEM images (×10,000) of all 15 films; Figure S5: Depth dependence of the Martens hardness from the loading curves.
Author Contributions
Conceptualization, M.T.; formal analysis, Y.S.; investigation, Y.S. and K.S.; validation, K.S.; visualization, Y.S.; writing—original draft preparation, Y.S.; writing—review and editing, M.T.; supervision, M.T.; project administration, M.T.; funding acquisition, M.T. All authors have read and agreed to the published version of the manuscript.
Funding
This study was partially supported by Japan Society for the Promotion of Science (JSPS) KAKENHI (grant number 22H04953).
Institutional Review Board Statement
Not applicable.
Informed Consent Statement
Not applicable.
Data Availability Statement
Data are contained within the article or Supplementary Materials.
Acknowledgments
The authors thank K. Yonezawa of Kenix for providing the PGS equipment, and H. Murotani, M. Morikawa, Y. Oda, T. Kaneko, and T. Takizawa of Tokai University for their experimental support. During the preparation of this manuscript, the authors used Claude (Anthropic; Opus 5 and Opus 5.5, Pro plan; accessed on 2–17 October 2026) to improve the English language and refine the structure of the manuscript. The tool was not used to generate, process, or analyze any experimental data or results. The authors have reviewed and edited the output and take full responsibility for the content of this publication.
Conflicts of Interest
The authors declare no conflicts of interest.
References
- Snyder, G.J.; Toberer, E.S. Complex thermoelectric materials. Nat. Mater. 2008, 7, 105–114. [Google Scholar] [CrossRef] [Scilit]
- Bell, L.E. Cooling, heating, generating power, and recovering waste heat with thermoelectric systems. Science 2008, 321, 1457–1461. [Google Scholar] [CrossRef] [Scilit]
- Zhang, Q.; Deng, K.; Wilkens, L.; Reith, H.; Nielsch, K. Micro-thermoelectric devices. Nat. Electron. 2022, 5, 333–347. [Google Scholar] [CrossRef] [Scilit]
- Venkatasubramanian, R.; Siivola, E.; Colpitts, T.; O’Quinn, B. Thin-film thermoelectric devices with high room-temperature figures of merit. Nature 2001, 413, 597–602. [Google Scholar] [CrossRef] [Scilit]
- Böttner, H.; Nurnus, J.; Gavrikov, A.; Kühner, G.; Jägle, M.; Künzel, C.; Eberhard, D.; Plescher, G.; Schubert, A.; Schlereth, K.-H. New thermoelectric components using microsystem technologies. J. Microelectromech. Syst. 2004, 13, 414–420. [Google Scholar] [CrossRef] [Scilit]
- Chowdhury, I.; Prasher, R.; Lofgreen, K.; Chrysler, G.; Narasimhan, S.; Mahajan, R.; Koester, D.; Alley, R.; Venkatasubramanian, R. On-chip cooling by superlattice-based thin-film thermoelectrics. Nat. Nanotechnol. 2009, 4, 235–238. [Google Scholar] [CrossRef] [Scilit]
- Jiang, J.; Chen, L.; Bai, S.; Yao, Q.; Wang, Q. Thermoelectric properties of p-type (Bi2Te3)x(Sb2Te3)1−x crystals prepared via zone melting. J. Cryst. Growth 2005, 277, 258–263. [Google Scholar] [CrossRef] [Scilit]
- Yang, J.; Aizawa, T.; Yamamoto, A.; Ohta, T. Thermoelectric properties of p-type (Bi2Te3)x(Sb2Te3)1−x prepared via bulk mechanical alloying and hot pressing. J. Alloys Compd. 2000, 309, 225–228. [Google Scholar] [CrossRef] [Scilit]
- Poudel, B.; Hao, Q.; Ma, Y.; Lan, Y.; Minnich, A.; Yu, B.; Yan, X.; Wang, D.; Muto, A.; Vashaee, D.; et al. High-thermoelectric performance of nanostructured bismuth antimony telluride bulk alloys. Science 2008, 320, 634–638. [Google Scholar] [CrossRef] [Scilit]
- Goncalves, L.M.; Couto, C.; Alpuim, P.; Rolo, A.G.; Völklein, F.; Correia, J.H. Optimization of thermoelectric properties on Bi2Te3 thin films deposited by thermal co-evaporation. Thin Solid Films 2010, 518, 2816–2821. [Google Scholar] [CrossRef] [Scilit]
- Takashiri, M.; Imai, K.; Uyama, M.; Hagino, H.; Tanaka, S.; Miyazaki, K.; Nishi, Y. Effects of homogeneous irradiation of electron beam on crystal growth and thermoelectric properties of nanocrystalline bismuth selenium telluride thin films. J. Alloys Compd. 2014, 612, 98–102. [Google Scholar] [CrossRef] [Scilit]
- Matsuoka, K.; Okuhata, M.; Takashiri, M. Dual-bath electrodeposition of n-type Bi–Te/Bi–Se multilayer thin films. J. Alloys Compd. 2015, 649, 721–725. [Google Scholar] [CrossRef] [Scilit]
- Recatala-Gomez, J.; Kumar, P.; Suwardi, A.; Abutaha, A.; Nandhakumar, I.; Hippalgaonkar, K. Direct measurement of the thermoelectric properties of electrochemically deposited Bi2Te3 thin films. Sci. Rep. 2020, 10, 17922. [Google Scholar] [CrossRef] [Scilit]
- Varghese, T.; Hollar, C.; Richardson, J.; Kempf, N.; Han, C.; Gamarachchi, P.; Estrada, D.; Mehta, R.J.; Zhang, Y. High-performance and flexible thermoelectric films by screen printing solution-processed nanoplate crystals. Sci. Rep. 2016, 6, 33135. [Google Scholar] [CrossRef] [Scilit]
- Tang, X.; Li, Z.; Liu, W.; Zhang, Q.; Uher, C. A comprehensive review on Bi2Te3-based thin films: Thermoelectrics and beyond. Interdiscip. Mater. 2022, 1, 88–115. [Google Scholar] [CrossRef] [Scilit]
- Haidar, S.A.; Gao, Y.; He, Y.; Cornett, J.E.; Chen, B.; Coburn, N.J.; Glynn, C.; Dunham, M.T.; Goodson, K.E.; Sun, N. Deposition and fabrication of sputtered bismuth telluride and antimony telluride for microscale thermoelectric energy harvesters. Thin Solid Films 2021, 717, 138444. [Google Scholar] [CrossRef] [Scilit]
- Bourgault, D.; Giroud Garampon, C.; Caillault, N.; Carbone, L.; Aymami, J.A. Thermoelectric properties of n-type Bi2Te2.7Se0.3 and p-type Bi0.5Sb1.5Te3 thin films deposited by direct current magnetron sputtering. Thin Solid Films 2008, 516, 8579–8583. [Google Scholar] [CrossRef] [Scilit]
- Geng, W.; Du, Y.; Lou, S.; Sun, H.; Zong, P. Bi2Te3-based thermoelectric films fabricated by magnetron sputtering. Materials 2026, 19, 2111. [Google Scholar] [CrossRef] [Scilit]
- Sun, X.; Yan, Y.; Kang, M.; Zhao, W.; Yan, K.; Wang, H.; Li, R.; Zhao, S.; Hua, X.; Wang, B.; et al. General strategy for developing thick-film micro-thermoelectric coolers from material fabrication to device integration. Nat. Commun. 2024, 15, 3870. [Google Scholar] [CrossRef] [Scilit]
- Zhuang, H.-L.; Cai, B.; Pan, Y.; Su, B.; Jiang, Y.; Pei, J.; Liu, F.; Hu, H.; Yu, J.; Li, J.-W.; et al. Strong and efficient bismuth telluride-based thermoelectrics for Peltier microcoolers. Natl. Sci. Rev. 2024, 11, nwae329. [Google Scholar] [CrossRef] [Scilit]
- Kudo, S.; Hagino, H.; Tanaka, S.; Miyazaki, K.; Takashiri, M. Determining the thermal conductivity of nanocrystalline bismuth telluride thin films using the differential 3ω method while accounting for thermal contact resistance. J. Electron. Mater. 2015, 44, 2021–2025. [Google Scholar] [CrossRef] [Scilit]
- Wen, L.; Hu, D.; Zhang, R.; Hu, X.; Luo, Y.; Chen, H.; Liang, Y.; Li, Y.; Wang, S. Two-dimensional SnSe2/Bi2Se3 vertically stacked heterostructures for enhanced photoresponse through tuning layer coverage. iScience 2026, 29, 115392. [Google Scholar] [CrossRef] [Scilit]
- Sasaki, Y.; Takashiri, M. Effects of Cr interlayer thickness on adhesive, structural, and thermoelectric properties of antimony telluride thin films deposited by radio-frequency magnetron sputtering. Thin Solid Films 2016, 619, 195–201. [Google Scholar] [CrossRef] [Scilit]
- Gupta, R.P.; Xiong, K.; White, J.B.; Cho, K.; Alshareef, H.N.; Gnade, B.E. Low resistance ohmic contacts to Bi2Te3 using Ni and Co metallization. J. Electrochem. Soc. 2010, 157, H666–H670. [Google Scholar] [CrossRef] [Scilit]
- Liu, W.; Bai, S. Thermoelectric interface materials: A perspective to the challenge of thermoelectric power generation module. J. Mater. 2019, 5, 321–336. [Google Scholar] [CrossRef] [Scilit]
- Greenwood, J.A.; Williamson, J.B.P. Contact of nominally flat surfaces. Proc. R. Soc. Lond. A 1966, 295, 300–319. [Google Scholar] [CrossRef] [Scilit]
- Barako, M.T.; Park, W.; Marconnet, A.M.; Asheghi, M.; Goodson, K.E. Thermal cycling, mechanical degradation, and the effective figure of merit of a thermoelectric module. J. Electron. Mater. 2013, 42, 372–381. [Google Scholar] [CrossRef] [Scilit]
- Zheng, Y.; Zhang, Q.; Su, X.; Xie, H.; Shu, S.; Chen, T.; Tan, G.; Yan, Y.; Tang, X.; Uher, C.; et al. Mechanically robust BiSbTe alloys with superior thermoelectric performance: A case study of stable hierarchical nanostructured thermoelectric materials. Adv. Energy Mater. 2015, 5, 1401391. [Google Scholar] [CrossRef] [Scilit]
- Zheng, Y.; Tan, X.Y.; Wan, X.; Cheng, X.; Liu, Z.; Yan, Q. Thermal stability and mechanical response of Bi2Te3-based materials for thermoelectric applications. ACS Appl. Energy Mater. 2020, 3, 2078–2089. [Google Scholar] [CrossRef] [Scilit]
- Chen, X.; Dai, W.; Wu, T.; Luo, W.; Yang, J.; Jiang, W.; Wang, L. Thin film thermoelectric materials: Classification, characterization, and potential for wearable applications. Coatings 2018, 8, 244. [Google Scholar] [CrossRef] [Scilit]
- Kim, S.J.; We, J.H.; Cho, B.J. A wearable thermoelectric generator fabricated on a glass fabric. Energy Environ. Sci. 2014, 7, 1959–1965. [Google Scholar] [CrossRef] [Scilit]
- Gadelmawla, E.S.; Koura, M.M.; Maksoud, T.M.A.; Elewa, I.M.; Soliman, H.H. Roughness parameters. J. Mater. Process. Technol. 2002, 123, 133–145. [Google Scholar] [CrossRef] [Scilit]
- Leach, R. (Ed.) Characterisation of Areal Surface Texture; Springer: Berlin/Heidelberg, Germany, 2013. [Google Scholar] [CrossRef] [Scilit]
- Jacobs, T.D.B.; Junge, T.; Pastewka, L. Quantitative characterization of surface topography using spectral analysis. Surf. Topogr. Metrol. Prop. 2017, 5, 013001. [Google Scholar] [CrossRef] [Scilit]
- Persson, B.N.J.; Albohr, O.; Tartaglino, U.; Volokitin, A.I.; Tosatti, E. On the nature of surface roughness with application to contact mechanics, sealing, rubber friction and adhesion. J. Phys. Condens. Matter 2005, 17, R1–R62. [Google Scholar] [CrossRef] [Scilit]
- Sedlaček, M.; Podgornik, B.; Vižintin, J. Correlation between standard roughness parameters skewness and kurtosis and tribological behaviour of contact surfaces. Tribol. Int. 2012, 48, 102–112. [Google Scholar] [CrossRef] [Scilit]
- Thomas, T.R. Rough Surfaces, 2nd ed.; Imperial College Press: London, UK, 1999. [Google Scholar] [CrossRef]
- Panjan, P.; Drnovšek, A.; Gselman, P.; Čekada, M.; Panjan, M. Review of growth defects in thin films prepared by PVD techniques. Coatings 2020, 10, 447. [Google Scholar] [CrossRef] [Scilit]
- Panjan, P.; Čekada, M.; Panjan, M.; Kek-Merl, D. Growth defects in PVD hard coatings. Vacuum 2009, 84, 209–214. [Google Scholar] [CrossRef] [Scilit]
- Kara, H.; Roberts, S.G. Polishing behavior and surface quality of alumina and alumina/silicon carbide nanocomposites. J. Am. Ceram. Soc. 2000, 83, 1219–1225. [Google Scholar] [CrossRef] [Scilit]
- Malkin, S.; Hwang, T.W. Grinding mechanisms for ceramics. CIRP Ann. 1996, 45, 569–580. [Google Scholar] [CrossRef] [Scilit]
- Leyland, A.; Matthews, A. On the significance of the H/E ratio in wear control: A nanocomposite coating approach to optimised tribological behaviour. Wear 2000, 246, 1–11. [Google Scholar] [CrossRef] [Scilit]
- Musil, J.; Jirout, M. Toughness of hard nanostructured ceramic thin films. Surf. Coat. Technol. 2007, 201, 5148–5152. [Google Scholar] [CrossRef] [Scilit]
- Fischer-Cripps, A.C. Nanoindentation, 3rd ed.; Springer: New York, NY, USA, 2011. [Google Scholar] [CrossRef] [Scilit]
- Cheng, H.-P.; Le, P.H.; Tuyen, L.T.C.; Jian, S.-R.; Chung, Y.-C.; Teng, I.-J.; Lin, C.-M.; Juang, J.-Y. Effects of substrate temperature on nanomechanical properties of pulsed laser deposited Bi2Te3 films. Coatings 2022, 12, 871. [Google Scholar] [CrossRef] [Scilit]
- Jian, S.-R.; Le, P.H.; Luo, C.-W.; Juang, J.-Y. Nanomechanical and wettability properties of Bi2Te3 thin films: Effects of post-annealing. J. Appl. Phys. 2017, 121, 175302. [Google Scholar] [CrossRef] [Scilit]
- Jian, S.-R.; Tasi, C.-H.; Huang, S.-Y.; Luo, C.-W. Nanoindentation pop-in effects of Bi2Te3 thermoelectric thin films. J. Alloys Compd. 2015, 622, 601–605. [Google Scholar] [CrossRef] [Scilit]
- Lamuta, C.; Campi, D.; Cupolillo, A.; Aliev, Z.S.; Babanly, M.B.; Chulkov, E.V.; Politano, A.; Pagnotta, L. Mechanical properties of Bi2Te3 topological insulator investigated by density functional theory and nanoindentation. Scr. Mater. 2016, 121, 50–55. [Google Scholar] [CrossRef] [Scilit]
- Terai, Y.; Haraguchi, K.; Ichinose, R.; Oota, H.; Yonezawa, K. Structural and piezoelectric properties of AlN thin films grown by pressure gradient sputtering. Jpn. J. Appl. Phys. 2023, 62, SA1003. [Google Scholar] [CrossRef] [Scilit]
- Aono, M.; Terauchi, M.; Sato, Y.K.; Morita, K.; Inoue, T.; Kanda, K.; Yonezawa, K. Deposition of amorphous carbon nitride thin films using pressure-gradient RF magnetron sputtering and their chemical bonding structures. Appl. Surf. Sci. 2023, 635, 157677. [Google Scholar] [CrossRef] [Scilit]
- Abe, Y.; Nishimura, T.; Yamada, A. Impacts of O2/(O2+Ar) flow ratio on the properties of Li-doped NiO thin films fabricated by pressure-gradient radiofrequency magnetron sputtering. Phys. Status Solidi A 2025, 222, 2400497. [Google Scholar] [CrossRef] [Scilit]
- Takashiri, M.; Tanaka, S.; Miyazaki, K. Determination of the origin of crystal orientation for nanocrystalline bismuth telluride-based thin films prepared by use of the flash evaporation method. J. Electron. Mater. 2014, 43, 1881–1889. [Google Scholar] [CrossRef] [Scilit]
- Takashiri, M.; Hamada, J. Bismuth antimony telluride thin films with unique crystal orientation by two-step method. J. Alloys Compd. 2016, 683, 276–281. [Google Scholar] [CrossRef] [Scilit]
- Morikawa, S.; Inamoto, T.; Takashiri, M. Thermoelectric properties of nanocrystalline Sb2Te3 thin films: Experimental evaluation and first-principles calculation, addressing effect of crystal grain size. Nanotechnology 2018, 29, 075701. [Google Scholar] [CrossRef] [Scilit]
- Somdock, N.; Kianwimol, S.; Harnwunggmoung, A.; Sakulkalavek, A.; Sakdanuphab, R. Simultaneous stoichiometric composition and highly (00l) orientation of flexible Bi2Te3 thin films via optimising the DC magnetron sputter-deposition process. J. Alloys Compd. 2019, 773, 78–85. [Google Scholar] [CrossRef] [Scilit]
- Zhang, J.; Xu, H.; Zheng, Z.; Wang, C.; Li, X.; Li, F.; Fan, P.; Chen, Y.-X. Effects of Si substrates with variable initial orientations on the growth and thermoelectric properties of Bi–Sb–Te thin films. Nanomaterials 2023, 13, 257. [Google Scholar] [CrossRef] [Scilit]
- Takizawa, T.; Kaneko, K.; Shinozaki, Y.; Kaneko, T.; Murotani, H.; Takashiri, M. Nearly perfect crystal orientation of nanocrystalline bismuth telluride thin films deposited by pressure-gradient sputtering and their thermal transport properties. Coatings 2025, 15, 1234. [Google Scholar] [CrossRef] [Scilit]
- Takizawa, T.; Nakazawa, Y.; Kaneko, K.; Shinozaki, Y.; Zhang, C.; Kaneko, T.; Murotani, H.; Takashiri, M. High thermoelectric performance of nanocrystalline bismuth antimony telluride thin films fabricated via pressure-gradient sputtering. Coatings 2026, 16, 35. [Google Scholar] [CrossRef] [Scilit]
- Takizawa, T.; Nakazawa, Y.; Shinozaki, Y.; Takashiri, M. Influence of film thickness and composition on structural and thermoelectric properties of (Bi2Te3)x(Sb2Te3)1−x thin films grown by pressure gradient sputtering. Vacuum 2026, 250, 115296. [Google Scholar] [CrossRef] [Scilit]
- Seah, M.P. An accurate semi-empirical equation for sputtering yields, II: For neon, argon and xenon ions. Nucl. Instrum. Methods Phys. Res. B 2005, 229, 348–358. [Google Scholar] [CrossRef] [Scilit]
- Yonezawa, S.; Tabuchi, T.; Takashiri, M. Atomic composition changes in bismuth telluride thin films by thermal annealing and estimation of their thermoelectric properties using experimental analyses and first-principles calculations. J. Alloys Compd. 2020, 841, 155697. [Google Scholar] [CrossRef] [Scilit]
- Lotgering, F.K. Topotactical reactions with ferrimagnetic oxides having hexagonal crystal structures—I. J. Inorg. Nucl. Chem. 1959, 9, 113–123. [Google Scholar] [CrossRef] [Scilit]
- He, K.; Chen, N.; Wang, C.; Wei, L.; Chen, J. Method for determining crystal grain size by X-ray diffraction. Cryst. Res. Technol. 2018, 53, 1700157. [Google Scholar] [CrossRef] [Scilit]
- ISO 21920-2:2021; Geometrical Product Specifications (GPS)—Surface Texture: Profile—Part 2: Terms, Definitions and Surface Texture Parameters. International Organization for Standardization: Geneva, Switzerland, 2021.
- Elson, J.M.; Bennett, J.M. Calculation of the power spectral density from surface profile data. Appl. Opt. 1995, 34, 201–208. [Google Scholar] [CrossRef] [Scilit]
- ISO 25178-2:2021; Geometrical Product Specifications (GPS)—Surface Texture: Areal—Part 2: Terms, Definitions and Surface Texture Parameters. International Organization for Standardization: Geneva, Switzerland, 2021.
- Gao, F.; Leach, R.K.; Petzing, J.; Coupland, J.M. Surface measurement errors using commercial scanning white light interferometers. Meas. Sci. Technol. 2008, 19, 015303. [Google Scholar] [CrossRef] [Scilit]
- Nix, W.D. Elastic and plastic properties of thin films on substrates: Nanoindentation techniques. Mater. Sci. Eng. A 1997, 234–236, 37–44. [Google Scholar] [CrossRef] [Scilit]
- Chen, X.; Vlassak, J.J. Numerical study on the measurement of thin film mechanical properties by means of nanoindentation. J. Mater. Res. 2001, 16, 2974–2982. [Google Scholar] [CrossRef] [Scilit]
- Feng, G.; Ngan, A.H.W. Effects of creep and thermal drift on modulus measurement using depth-sensing indentation. J. Mater. Res. 2002, 17, 660–668. [Google Scholar] [CrossRef] [Scilit]
- Chudoba, T.; Richter, F. Investigation of creep behaviour under load during indentation experiments and its influence on hardness and modulus results. Surf. Coat. Technol. 2001, 148, 191–198. [Google Scholar] [CrossRef] [Scilit]
- Lucas, B.N.; Oliver, W.C. Indentation power-law creep of high-purity indium. Metall. Mater. Trans. A 1999, 30, 601–610. [Google Scholar] [CrossRef] [Scilit]
- Oliver, W.C.; Pharr, G.M. An improved technique for determining hardness and elastic modulus using load and displacement sensing indentation experiments. J. Mater. Res. 1992, 7, 1564–1583. [Google Scholar] [CrossRef] [Scilit]
- Pharr, G.M.; Oliver, W.C. Measurement of thin film mechanical properties using nanoindentation. MRS Bull. 1992, 17, 28–33. [Google Scholar] [CrossRef] [Scilit]
- ISO 14577-1:2015; Metallic Materials—Instrumented Indentation Test for Hardness and Materials Parameters—Part 1: Test Method. International Organization for Standardization: Geneva, Switzerland, 2015.
- Shahdad, S.A.; McCabe, J.F.; Bull, S.; Rusby, S.; Wassell, R.W. Hardness measured with traditional Vickers and Martens hardness methods. Dent. Mater. 2007, 23, 1079–1085. [Google Scholar] [CrossRef] [Scilit]
- Bobji, M.S.; Biswas, S.K. Estimation of hardness by nanoindentation of rough surfaces. J. Mater. Res. 1998, 13, 3227–3233. [Google Scholar] [CrossRef] [Scilit]
- Kim, J.-Y.; Kang, S.-K.; Lee, J.-J.; Jang, J.-I.; Lee, Y.-H.; Kwon, D. Influence of surface-roughness on indentation size effect. Acta Mater. 2007, 55, 3555–3562. [Google Scholar] [CrossRef] [Scilit]
- Gujrati, A.; Khanal, S.R.; Pastewka, L.; Jacobs, T.D.B. Combining TEM, AFM, and profilometry for quantitative topography characterization across all scales. ACS Appl. Mater. Interfaces 2018, 10, 29169–29178. [Google Scholar] [CrossRef] [Scilit]
- Lamuta, C.; Cupolillo, A.; Politano, A.; Aliev, Z.S.; Babanly, M.B.; Chulkov, E.V.; Alfano, M.; Pagnotta, L. Nanoindentation of single-crystal Bi2Te3 topological insulators grown with the Bridgman–Stockbarger method. Phys. Status Solidi B 2016, 253, 1082–1086. [Google Scholar] [CrossRef] [Scilit]
- Saha, R.; Nix, W.D. Effects of the substrate on the determination of thin film mechanical properties by nanoindentation. Acta Mater. 2002, 50, 23–38. [Google Scholar] [CrossRef] [Scilit]
- Tsui, T.Y.; Pharr, G.M. Substrate effects on nanoindentation mechanical property measurement of soft films on hard substrates. J. Mater. Res. 1999, 14, 292–301. [Google Scholar] [CrossRef] [Scilit]
- Korsunsky, A.M.; McGurk, M.R.; Bull, S.J.; Page, T.F. On the hardness of coated systems. Surf. Coat. Technol. 1998, 99, 171–183. [Google Scholar] [CrossRef] [Scilit]
- Cheng, S.-W.; Chen, B.-S.; Jian, S.-R.; Hu, Y.-M.; Le, P.H.; Tuyen, L.T.C.; Lee, J.-W.; Juang, J.-Y. Finite element analysis of nanoindentation responses in Bi2Se3 thin films. Coatings 2022, 12, 1554. [Google Scholar] [CrossRef] [Scilit]
- Yim, W.M.; Rosi, F.D. Compound tellurides and their alloys for Peltier cooling—A review. Solid-State Electron. 1972, 15, 1121–1140. [Google Scholar] [CrossRef] [Scilit]
Disclaimer/Publisher’s Note: The statements, opinions and data contained in all publications are solely those of the individual author(s) and contributor(s) and not of MDPI and/or the editor(s). MDPI and/or the editor(s) disclaim responsibility for any injury to people or property resulting from any ideas, methods, instructions or products referred to in the content. |
© 2026 by the authors. Licensee MDPI, Basel, Switzerland. This article is an open access article distributed under the terms and conditions of the Creative Commons Attribution (CC BY) license.